
Learning from High-Dimensional and Class-Imbalanced Datasets Using Random Forests


Dipartimento di Matematica e Informatica, Università di Cagliari, Via Ospedale 72, 09124 Cagliari, Italy
Information 2021, 12(8), 286; https://0-doi-org.brum.beds.ac.uk/10.3390/info12080286
Submission received: 23 June 2021
/
Revised: 16 July 2021
/
Accepted: 17 July 2021
/
Published: 21 July 2021
(This article belongs to the Special Issue Emerging Trends and Challenges in Supervised Learning Tasks)
Abstract
:Class imbalance and high dimensionality are two major issues in several real-life applications, e.g., in the fields of bioinformatics, text mining and image classification. However, while both issues have been extensively studied in the machine learning community, they have mostly been treated separately, and little research has been thus far conducted on which approaches might be best suited to deal with datasets that are class-imbalanced and high-dimensional at the same time (i.e., with a large number of features). This work attempts to give a contribution to this challenging research area by studying the effectiveness of hybrid learning strategies that involve the integration of feature selection techniques, to reduce the data dimensionality, with proper methods that cope with the adverse effects of class imbalance (in particular, data balancing and cost-sensitive methods are considered). Extensive experiments have been carried out across datasets from different domains, leveraging a well-known classifier, the Random Forest, which has proven to be effective in high-dimensional spaces and has also been successfully applied to imbalanced tasks. Our results give evidence of the benefits of such a hybrid approach, when compared to using only feature selection or imbalance learning methods alone.
1. Introduction
The class imbalance problem has been largely recognized as an important issue in machine learning [1,2]. Indeed, in many real-world problems, the data distribution is highly imbalanced, with instances of some classes appearing much more frequently than others. This may compromise the predictive performance of machine learning algorithms, as they tend to be biased towards the majority class. At the same time, the minority class is typically the most important from a data mining perspective, as it may carry precious knowledge.
Despite more than two decades of continuous research, several open issues remain in the field of imbalance learning [3] and recent trends increasingly focus on the interaction between class imbalance and other difficulties embedded in the nature of the data [4]. Among such difficulties, the high dimensionality, i.e., the presence of a high number of data attributes (features), is a critical concern that may negatively impact the generalization ability of the induced models.
Although the problems of class imbalance and high dimensionality have both been extensively studied in the machine learning community, they have mostly been treated separately and their combined effects are yet to be fully understood. Indeed, few works have thus far presented learning strategies specifically designed to handle both problems simultaneously [5,6,7,8,9,10], and there is a lack of systematic studies that investigate the extent to which the existing methods for tackling class imbalance and reducing the data dimensionality can be successfully integrated.
This paper aims to make a contribution in this field by exploring suitable methodological approaches for dealing with datasets that are both high-dimensional and class-imbalanced. Specifically, we firstly investigate the extent to which the methods thus far devised in the field of imbalanced learning (both data-level approaches, based on resampling, and algorithm-level approaches, such as cost-sensitive learning) are still effective in high-dimensional scenarios. The impact of integrating a dimensionality reduction stage into the learning process is then explored by applying hybrid learning strategies that involve the use of feature selection techniques, to select a subset of meaningful features, combined with proper methods to deal with class imbalance.
An experimental study has been conducted on six challenging benchmarks that come from different application domains and present heterogenous characteristics, in terms of the imbalance level and instances-to-features ratio, in order to gain insight on the best strategies to use based on the specific properties of the data at hand. As a learning method for model induction, we considered the Random Forest classifier [11], which has proven to be a suitable choice across multiple domains [12,13], even in the presence of imbalanced data distributions [14] and has also shown an efficient and robust behavior in high dimensional spaces (e.g., [15]).
Although not conclusive, the results of our experiments give evidence of the benefits of using a hybrid learning strategy that can address, in a joint manner, both the class imbalance and the high dimensionality issues.
The rest of the paper is organized as follows. In Section 2, we provide background concepts on imbalance learning and feature selection, discussing some related works. Section 3 describes the methodological framework of our study, presenting possible strategies for dealing with high-dimensional and class-imbalanced data; the chosen classification method and the evaluation metrics are also described in brief. An experimental study on six challenging benchmarks is presented in Section 4, with a summary and a discussion of the most interesting results. Finally, Section 5 concludes the paper and outlines possible directions for future research.
2. Background and Related Work
The imbalance learning field deals with the challenges that arise when inducing predictive models from datasets with a skewed distribution of the target class. Traditional classification algorithms may not perform well in this scenario, primarily because they are designed to maximize the global prediction accuracy, regardless of the significance of the different classes. As a result, they may exhibit poor performance on the minority class, which is, however, the class of greatest interest in most applications.
The possible solutions discussed in the literature mainly focus on the following two levels: the data level and the algorithmic level [1,2,3,4,16]. At the data level, a number of resampling techniques have been proposed that aim at properly reducing the degree of imbalance among the different classes. In particular, under-sampling approaches discard a number of majority instances, either randomly or using some kind of informed strategy, while over-sampling approaches create new instances of the minority class [2]. Among the over-sampling approaches, the SMOTE technique (with its extensions) has proven successful in a variety of applications [17], although its effectiveness in high-dimensional scenarios is still to be investigated in depth. At the algorithmic level, the main lines of research focus on cost-sensitive techniques, which assign different misclassification costs to the different classes, and ensemble techniques, which leverage multiple models to globally achieve a better classification performance [16]. Ensembles are often hybridized with sampling and cost-sensitive learning [18], but several issues and challenges still need to be addressed in this field [3].
As recognized by the recent literature, the interaction of class imbalance and high dimensionality may further complicate the analysis and cause overlapping (i.e., non-separability) among the classes [10]. In such a scenario, feature selection can be very helpful, as it reduces the data representation space to a meaningful subset of features and may lead to a higher separability between majority and minority instances [19,20].
Based on how they interact with the algorithm used to induce the classification model, the available feature selection methods can be broadly categorized into the following three groups [21,22]: (i) filters, which perform the selection task as a pre-processing step, without interacting with the classifier; (ii) wrappers, which involve the comparison of different feature subsets and use the classifier itself to assess the merit of each candidate subset; and (iii) embedded methods, which exploit the intrinsic capacity of some classification algorithms to evaluate the degree of relevance of the features. Due to their computational efficiency, filter approaches are by far the most employed in high-dimensional spaces [23], but there is a growing tendency to incorporate them into more advanced selection strategies. Indeed, hybrid methods that exploit different approaches at different stages of the selection process are increasingly being proposed, e.g., by initially reducing the data dimensionality with a filter and then further refining the search with a wrapper [24,25,26]; combining different selectors in an ensemble way is also a promising line of research [27,28,29].
Although several studies have compared the behavior of the available selection methods from different points of view (e.g., [23,30,31,32,33]), discussing their strengths and weaknesses, little research has thus far investigated the effectiveness of feature selection methods in connection with the class imbalance problem [16].
A few selection algorithms have been recently modified to incorporate some kind of imbalance-sensitive correction, e.g., using an ad hoc loss function or a per-class feature weighting mechanism [6,7], with a main emphasis on small sample size problems. Other works (e.g., [8,9,34,35]) have recently experimented with hybrid learning strategies that combine feature selection with methods previously devised in the field of imbalance learning, such as data balancing or cost-sensitive techniques, suggesting that such a hybrid approach may have a strong potential in some scenarios. However, the available results are still limited, and partially conflicting, leaving unanswered important questions about which methods to use, and how to combine them, based on the characteristics of the data at hand (e.g., the number of the available instances, the number and type of the features, the level of imbalance).
3. Methodological Framework
Our methodological framework relies on a binary classification setting, with a minority class (denoted as positive) and a majority class (denoted as negative); however, this does not imply a loss of generality, since a multiclass problem can be always decomposed into a set of binary tasks.
To investigate suitable methodological solutions to deal with datasets that are both high-dimensional and class-imbalanced, we begin by studying how the data dimensionality impacts the methods commonly used in the imbalance learning field. Specifically, we consider both data balancing techniques, based on resampling, and cost-sensitive techniques, which incorporate misclassification costs into the learning process. Next, as a core step of our study, we consider hybrid learning strategies that integrate imbalance learning methods and feature selection methods in order alleviate, in a joint manner, the adverse effects of both class imbalance and high dimensionality.
3.1. Imbalance Learning Methods
In the context of resampling techniques, used to reduce the level of imbalance in the original data, we focus on the following two approaches:
- RUS (Random Under-Sampling), where instances of the negative class are randomly removed from the training data;
- SMOTE (Synthetic Minority Over-sampling TEchnique), where new synthetic instances of the positive class are introduced by interpolating between positive instances that are near to each other; indeed, this interpolation mechanism has turned out to be more effective than simply duplicating a number of minority instances chosen at random, as in the Random Over-Sampling approach [16,17].
Both RUS and SMOTE have been successfully employed in several application contexts, but the extent to which they may increase the risk of overfitting is yet to be extensively explored in the presence of many features. In particular, as far as we know, there are no studies that investigate which post-sampling imbalance ratio may be the most appropriate based on the data characteristics (original level of imbalance, number of training instances and data dimensionality). To gain insight on such an important aspect, as shown later in Section 4, we evaluated the performance of RUS and SMOTE for different class distribution spreads, expressed as S:1, i.e., S instances of the negative class for each instance of the positive class (e.g., S = 1 for a uniform class distribution).
While resampling methods act at the data level by directly modifying the training set, cost-sensitive approaches rely on assigning a proper penalty term to the incorrect classification of one class as another [2]. Specifically, in our binary scenario, a cost matrix is defined as that which codifies the cost C(−,+) of misclassifying a negative instance as a positive one, as well as the cost C(+,−) of misclassifying a positive instance as a negative one, as shown in Table 1. To contrast the bias towards the majority class, the cost matrix is typically set with C(+,−) > C(−,+), with no cost for the correct predictions (i.e., C(+,+) = C(−,−) = 0).
For our study, we consider the following two different implementations of cost-sensitive learning [36,37]: (i) predicting the class with the minimum expected misclassification cost, rather than the most likely class (hereafter the MinCost approach); and (ii) assigning, at the learning stage, proper weights to the instances based on the misclassification costs (hereafter the Weighting approach). For both the approaches, different cost settings have been explored, as discussed in Section 4.
3.2. Integrating Feature Selection with Imbalance Learning
The potential benefits of feature selection in high-dimensional classification tasks, e.g., in terms of predictive performance and understandability of the induced models, have been thoroughly discussed in the literature [21,22]. Indeed, feature selection can remove irrelevant and redundant information, as well as noisy factors, thus making the learning algorithm focus on a reduced subset of highly discriminative attributes.
Some research has also suggested that feature selection may be useful to combat the class imbalance problem [20], although the studies in this area are still limited. In this regard, the contribution of this paper is to comparatively evaluate, across imbalanced and high-dimensional datasets from different domains, the effectiveness of feature selection when used alone and when combined with imbalanced learning methods (both data balancing and cost-sensitive approaches).
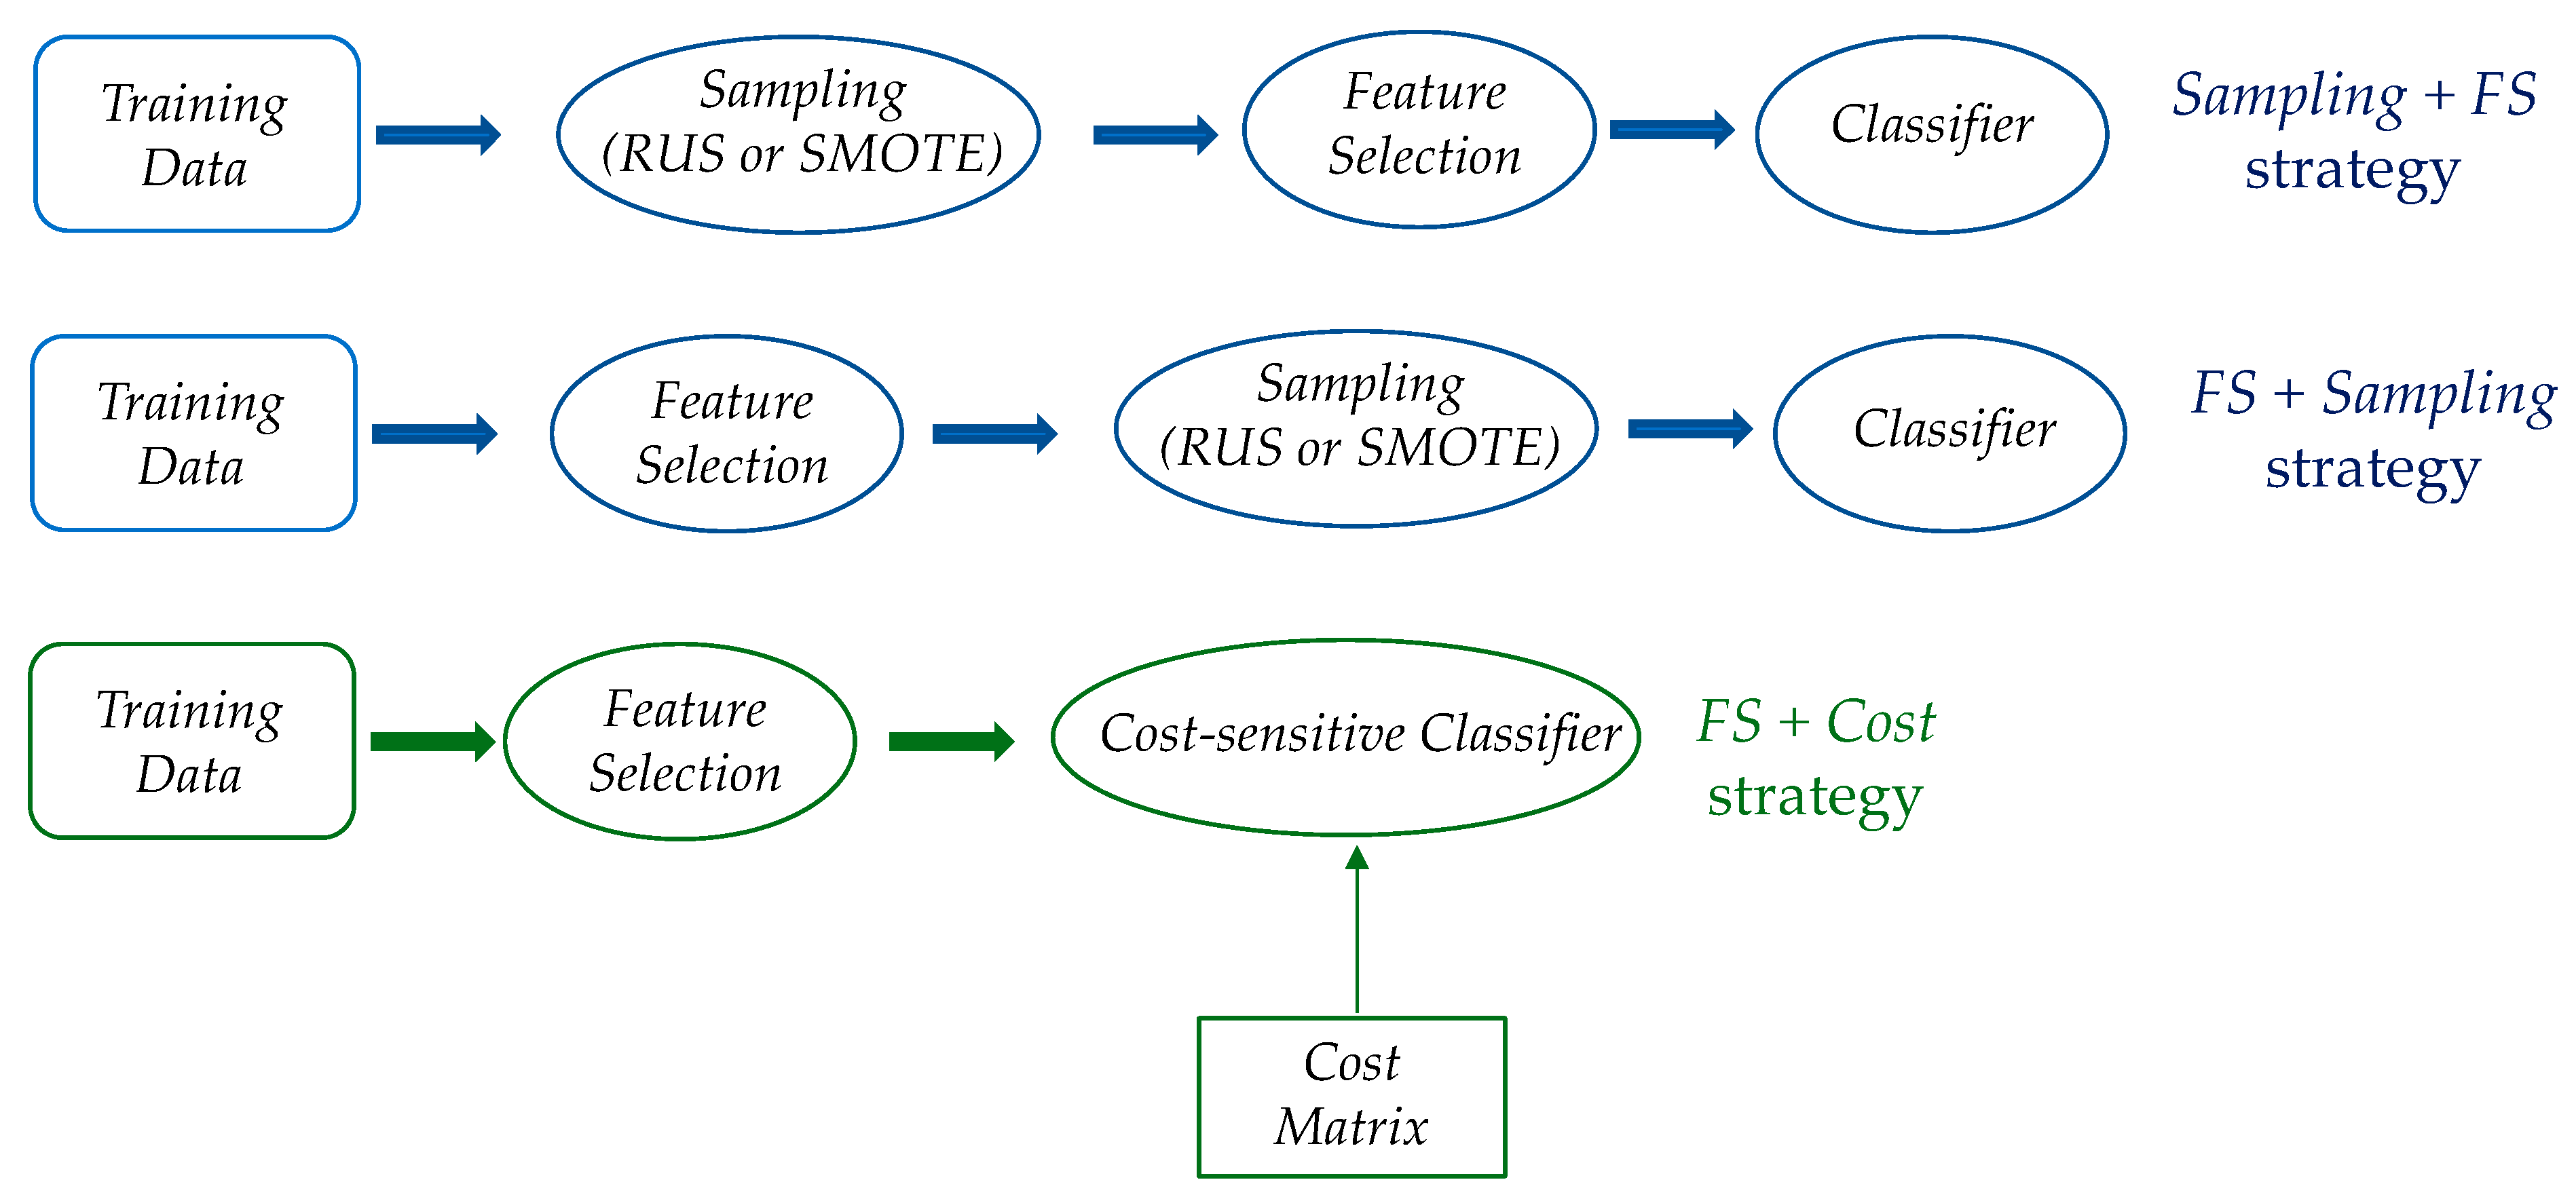
Specifically, as depicted in Figure 1, we consider different learning strategies that consist in the following:
- using feature selection (FS) before data balancing (RUS or SMOTE approach);
- using feature selection (FS) after data balancing (RUS or SMOTE approach);
- using feature selection (FS) in conjunction with cost-sensitive learning (MinCost or Weighting approach).
As regards the feature selection method to use in the above learning strategies, different choices could be made in dependence of the data characteristics. For our study, we considered two feature selection techniques falling in the category of filter methods, which are the primary choice in high-dimensional domains [23], either for selecting the final feature subsets or, if needed, for reducing the data dimensionality before applying more sophisticated selection strategies (e.g., wrapper methods). Specifically, we employed a univariate ranking-based approach [22], where each feature is evaluated independently of the others, and a multivariate correlation-based approach, which can also capture relationships among the features [21].
More in detail, the ranking-based approach leverages a proper evaluation criterion to weight each single feature based on its relevance to the target class; then, according to their weights, the features are ordered from the most important to the least important, and only a predefined number of the top-ranked features are used for classification. As an evaluation criterion for feature weighting, we chose the widely employed Information Gain (IG), grounded on the information-theoretical concept of entropy, which has proven to be both effective and stable across several domains [29,32].
On the other hand, correlation-based feature selection (CFS) still adopts an entropic evaluation criterion but looks for subsets of features that are highly correlated with the target class and uncorrelated with each other, in order to discard both irrelevant and redundant features. Furthermore, this subset-oriented approach is able to automatically find the optimal number of features for the problem at hand, while the ranking-based approach requires choosing a proper threshold to cut the list of the ranked features, as discussed in Section 4. However, the CFS method is computationally more expensive and may be a good option when the data dimensionality is not excessively high.
3.3. Classification Method and Evaluation Metrics
Although the methodology adopted here is learner-independent, we conducted our study with the Random Forest (RF) classifier [11], which is increasingly being employed in several application scenarios, even in the context of high-dimensional or imbalanced problems (e.g., [12,13,14,15,38,39]). In brief, the RF classifier can be considered as a special case of bagging, an ensemble approach that combines predictions from multiple classifiers built from different bootstrap samples of the training data. Each classifier in the ensemble is an unpruned decision tree, where the splitting attribute at each node is selected from a set of candidate attributes chosen at random. Specifically, we used a forest of 100 trees and set the number of candidate attributes for splitting as log2(n) + 1, where n is the dataset dimensionality. Indeed, these settings are widely employed and have proven to be suitable, even for imbalanced tasks [14].
As the accuracy, i.e., the overall percentage of correct predictions, is not meaningful in the presence of imbalanced class distributions, we evaluated the model performance through proper measures that can capture the ability of the model to recognize each single class. Specifically, we considered the F-measure, i.e., the harmonic mean between sensitivity and precision, and the G-mean, i.e., the geometric mean between sensitivity and specificity as follows:
where specificity and sensitivity express, respectively, the rate of true negatives and true positives (i.e., the fraction of negative/positive instances that are classified correctly), while the precision indicates the fraction of instances that are actually positive in the group the model has classified as positive. Both the F-measure and the G-mean are trade-off metrics that account for both false positive and false negative errors [4] and are widely employed in imbalanced classification tasks.
4. Experimental Study
According to the methodological framework described in Section 3, we performed a large experimental study to assess the effectiveness of imbalance learning methods, when used alone, as well as when integrated with feature selection (see Figure 1). The focus is to evaluate the extent to which the use of hybrid learning strategies may be beneficial in dependence of the specific characteristics of the data at hand, as discussed in what follows. Specifically, the datasets used for the experiments are described in Section 4.1, while Section 4.2 presents and discusses the experimental results.
4.1. Datasets and Settings
We conducted our experimental study on the following three real-world domains:
- (i)
- cancer classification from genomic data;
- (ii)
- text categorization;
- (iii)
- image classification.
As detailed in Table 2, the datasets chosen for the experiments encompass different levels of class imbalance (expressed in terms of percentage of minority instances) as well as different instances-to-features ratios.
For the genomic domain, we considered two highly imbalanced benchmarks from the GEMLeR collection [40]: the task is to discriminate uterus or omentum cancer from other cancer types, based on the expression level of over ten thousand genes. Since the available instances (i.e., the biological samples) are far fewer than the features (i.e., the genes), this kind of classification task turns out to be especially challenging, as recognized by a vast literature in the field [21,41].
In the context of text categorization, we considered the well-known Reuters-21578 collection [42], which consists of more than twelve thousand documents manually classified across multiple categories. For each category, a binary dataset can be obtained where the documents related to that category are labelled as positive, and the others as negative. In particular, the trade and interest categories, which have proven to be quite difficult to recognize [43], have been included in this study. Note that, after a preliminary pre-processing involving stop-words removal and n-gram extraction, a bag-of-words representation is here adopted with a number of features not so different from the number of instances.
Finally, as a representative testbed in the image classification domain, we chose the multi-label scene dataset [40,44], with a focus on the categories that turned out to be most difficult to predict, i.e., mountain and urban. In this case, as shown in Table 2, the dimensionality is far lower than in the previous benchmarks, with an instances-to-features ratio of about 8.
All the experiments have been implemented using the WEKA machine learning workbench [45,46], which includes functionalities for data manipulation, feature selection and classification. As an evaluation protocol, we chose an iterated 5-fold cross-validation procedure, as in similar studies (e.g., [8,14]). Specifically, for each learning strategy, the cross-validation was repeated 2 times (with a total of 10 training-testing runs) on the text datasets, where the number of the available instances is larger, and 4 times (with a total of 20 training-testing runs) on the other datasets. The values of the evaluation metrics, the F-measure and the G-mean, were then averaged across the different runs.
4.2. Results and Discussion
As a first step of the analysis, we evaluated different imbalance learning methods (detailed in Section 3.1), in conjunction with the RF classifier, comparing their effectiveness with the performance of an RF model induced without any form of data balancing or cost-sensitive correction (hereafter baseline).
Specifically, Table 3 shows the results of the experiments involving the RUS and SMOTE resampling approaches, for different post-sampling class distribution spreads (3:1, 2:1 and 1:1). As well, Table 4 shows the results obtained with the two considered cost-sensitive approaches, MinCost(C) and Weighting(C), where C represents the cost of misclassifying a positive instance as a negative one (which is the costliest error in imbalanced scenarios, while the cost of misclassifying a negative instance is set to 1 in our experiments). For C, different values have been explored, but only the results for C = 2, C = 3 and C = 4 are shown here, as higher costs did not lead to significant improvements in performance. For both the tables, we reported the average F-measure and G-mean values as well as, in brackets, the corresponding standard deviation values.
To properly compare the performance of the imbalance learning methods with the baseline classifier, we applied a corrected resampled paired t-test [47], with a significance level of 5 percent, in order to address the criticism towards the standard t-test usually employed in cross-validation experiments [45]. The performance values that were found to be significantly better than the baseline are shown in bold. As we can see from the tables, the usefulness of adequately addressing the class imbalance problem is undoubtful, although the practical adoption of both balancing and cost-sensitive methods is still quite limited in the domains here considered.
Regarding the data balancing methods (Table 3), RUS performs better than SMOTE in the text categorization domain, where the percentage of minority instances is lower (as shown in Table 2), thus making, in such a high-dimensional space, the SMOTE interpolation mechanism less effective. RUS is also slightly better than SMOTE on the genomic datasets, especially in terms of the G-mean, while the two resampling methods lead to comparable results on the image datasets, where both the imbalance level and the data dimensionality are lower. We can also observe that making the class distribution uniform (with a post-sampling spread of 1:1) is not necessarily the best option. Indeed, RUS(1:1) is less convenient in terms of the F-measure, due to the increase in the false positives (which reduce the precision). On the other hand, the setting (1:1) is better for SMOTE in most cases. Nonetheless, the SMOTE(2:1) approach, while performing slightly worse than SMOTE(1:1), may still be a good option due to the lower computational cost (as fewer synthetic instances are introduced in the training data).
Regarding the two considered cost-sensitive approaches (Table 4), MinCost performs significantly better than Weighting in the genomic and text categorization domains, where the setting C = 4 seems to be a suitable option. On the other hand, MinCost and Weighting lead to more similar results on the image datasets, which are less imbalanced and less high-dimensional (with a slight superiority, if both metrics are taken into account, of MinCost(2) and MinCost(3)). Overall, when comparing the results in Table 3 and Table 4, there is no imbalance learning approach that turns out to be consistently better across the different datasets in terms of both the F-measure and the G-mean; indeed, both the metrics reward the increase in the true positive rate (i.e., the model sensitivity) but penalize, to a different extent, the number of false positives (which have a greater impact on the F-measure).
As a further and fundamental step of our study, the impact of integrating data balancing and cost-sensitive methods with feature selection has been explored across multiple settings. Specifically, as discussed in Section 3.2, we have considered different learning strategies, namely, applying feature selection before RUS/SMOTE (FS + Sampling approach), applying feature selection after RUS/SMOTE (Sampling + FS approach) and applying feature selection in conjunction with the MinCost and Weighting cost-sensitive approaches.
As a feature selection method, the IG ranker has been used in the genomic and text categorization domains, where the number of features is in the order of ten thousand. Indeed, in such a scenario, using an efficient ranking-based approach is a common practice to select a small percentage of top-ranked features. To choose the most appropriate percentages for feature selection, we performed a series of preliminary experiments that led us to consider the following:
- (i)
- 0.25, 0.5 and 1% of the original dimensionality in the genomic domain;
- (ii)
- 1, 5 and 10% of the original dimensionality in the text categorization domain.
- (iii)
- On the other hand, the CFS filter has been used for the image datasets, as a subset-oriented approach is more appropriate where the number of features is lower.
Given the large number of experiments, only a summary of the most significant results is shown in Figure 2, Figure 3 and Figure 4 (one for each of the domains here considered), but further results are made available as supplementary material (Tables S1–S6). In particular, since the FS + Sampling and Sampling + FS approaches have led to comparable results, with a slightly higher performance, in most cases, when feature selection is applied before data balancing, we only detail here the results obtained with the FS + Sampling approach.
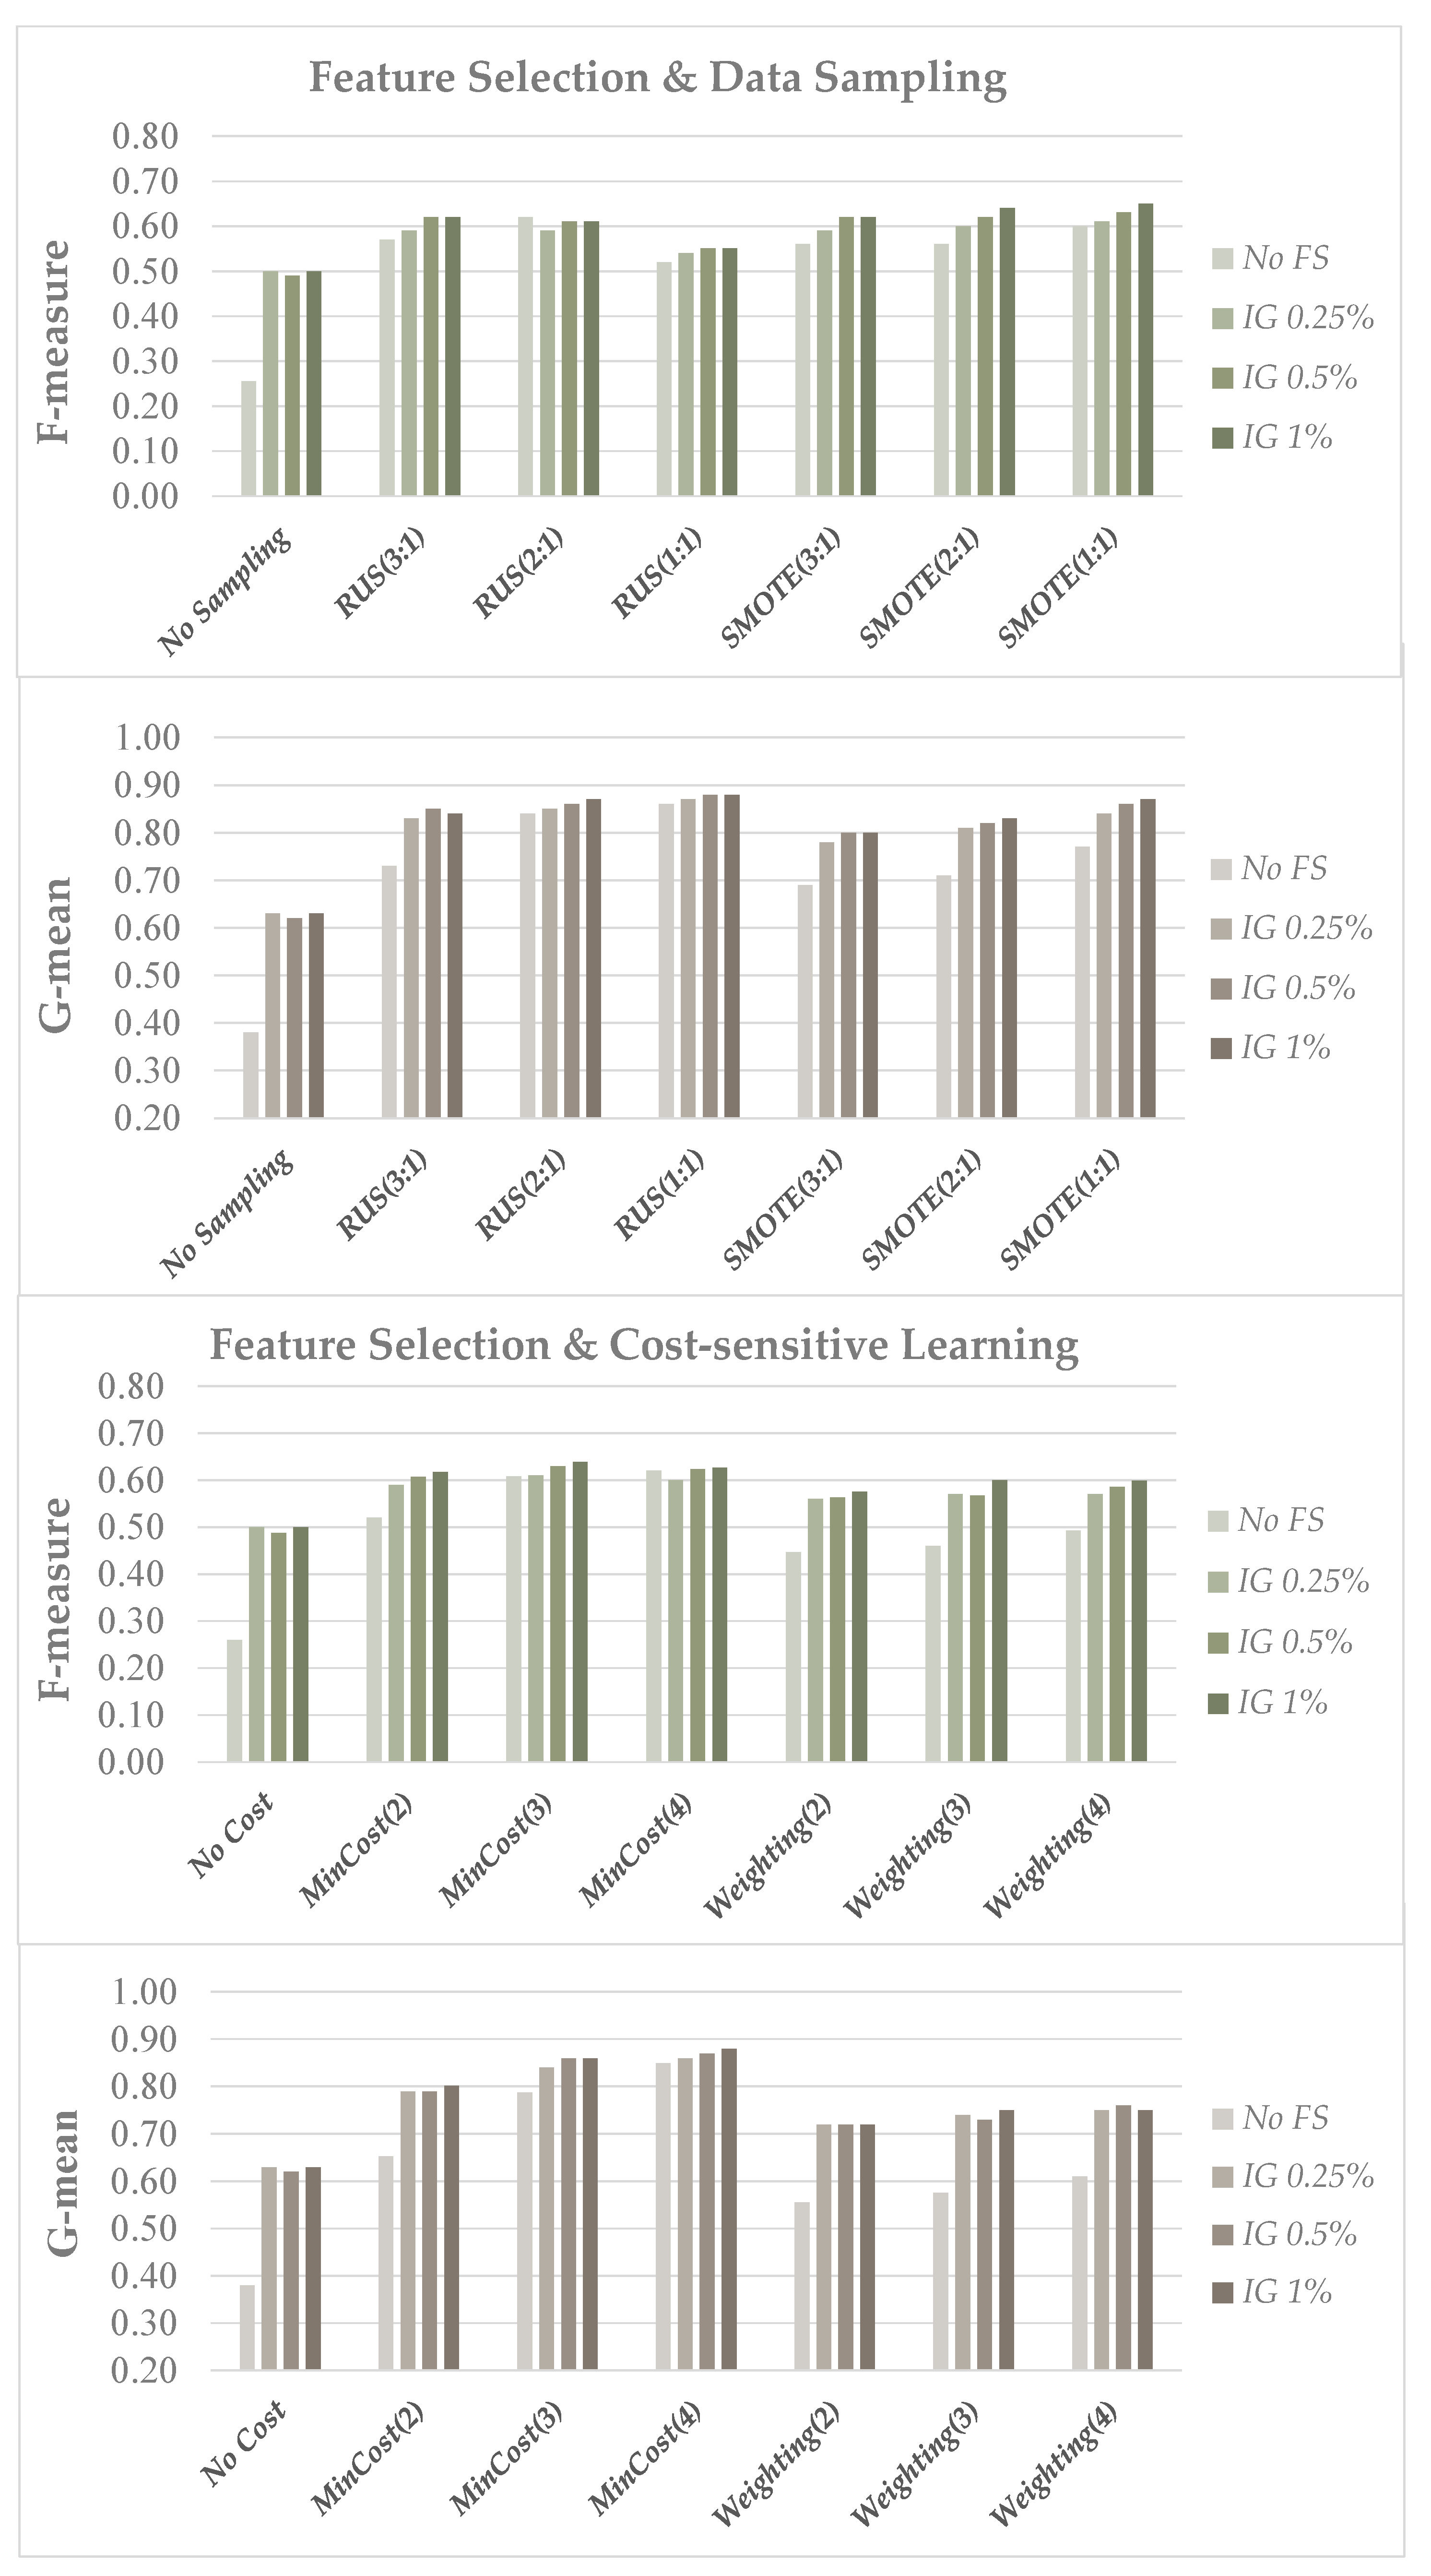
When looking at Figure 2 and Figure 3, we can observe that feature selection is able, alone, to significantly improve the performance of the baseline classifier, in terms of both the F-measure and the G-mean. This confirms that, when the original number of features is huge, a drastic reduction in the data dimensionality can also help to combat the adverse effects of class imbalance [20], besides improving efficiency and giving more understandable models. On the other hand, data balancing and cost-sensitive methods can, in turn, improve the baseline performance when used alone, as previously shown in Table 3 and Table 4, but a hybrid strategy involving the integrated use of feature selection and imbalance learning can be further beneficial.
Indeed, in the genomic domain (Figure 2), the hybrid learning approach gives results that are always superior to feature selection alone, as well as superior or comparable to data balancing or cost-sensitive learning alone, but with significant advantages in terms of computational cost and domain understanding, as only the most predictive features are used for prediction. The importance of devising learning strategies that use a reduced number of genes for cancer diagnosis, while ensuring at the same time a good predictive performance, has been widely highlighted in this domain [41,48,49,50], and the hybrid approaches here discussed seem to provide a viable solution in this respect.
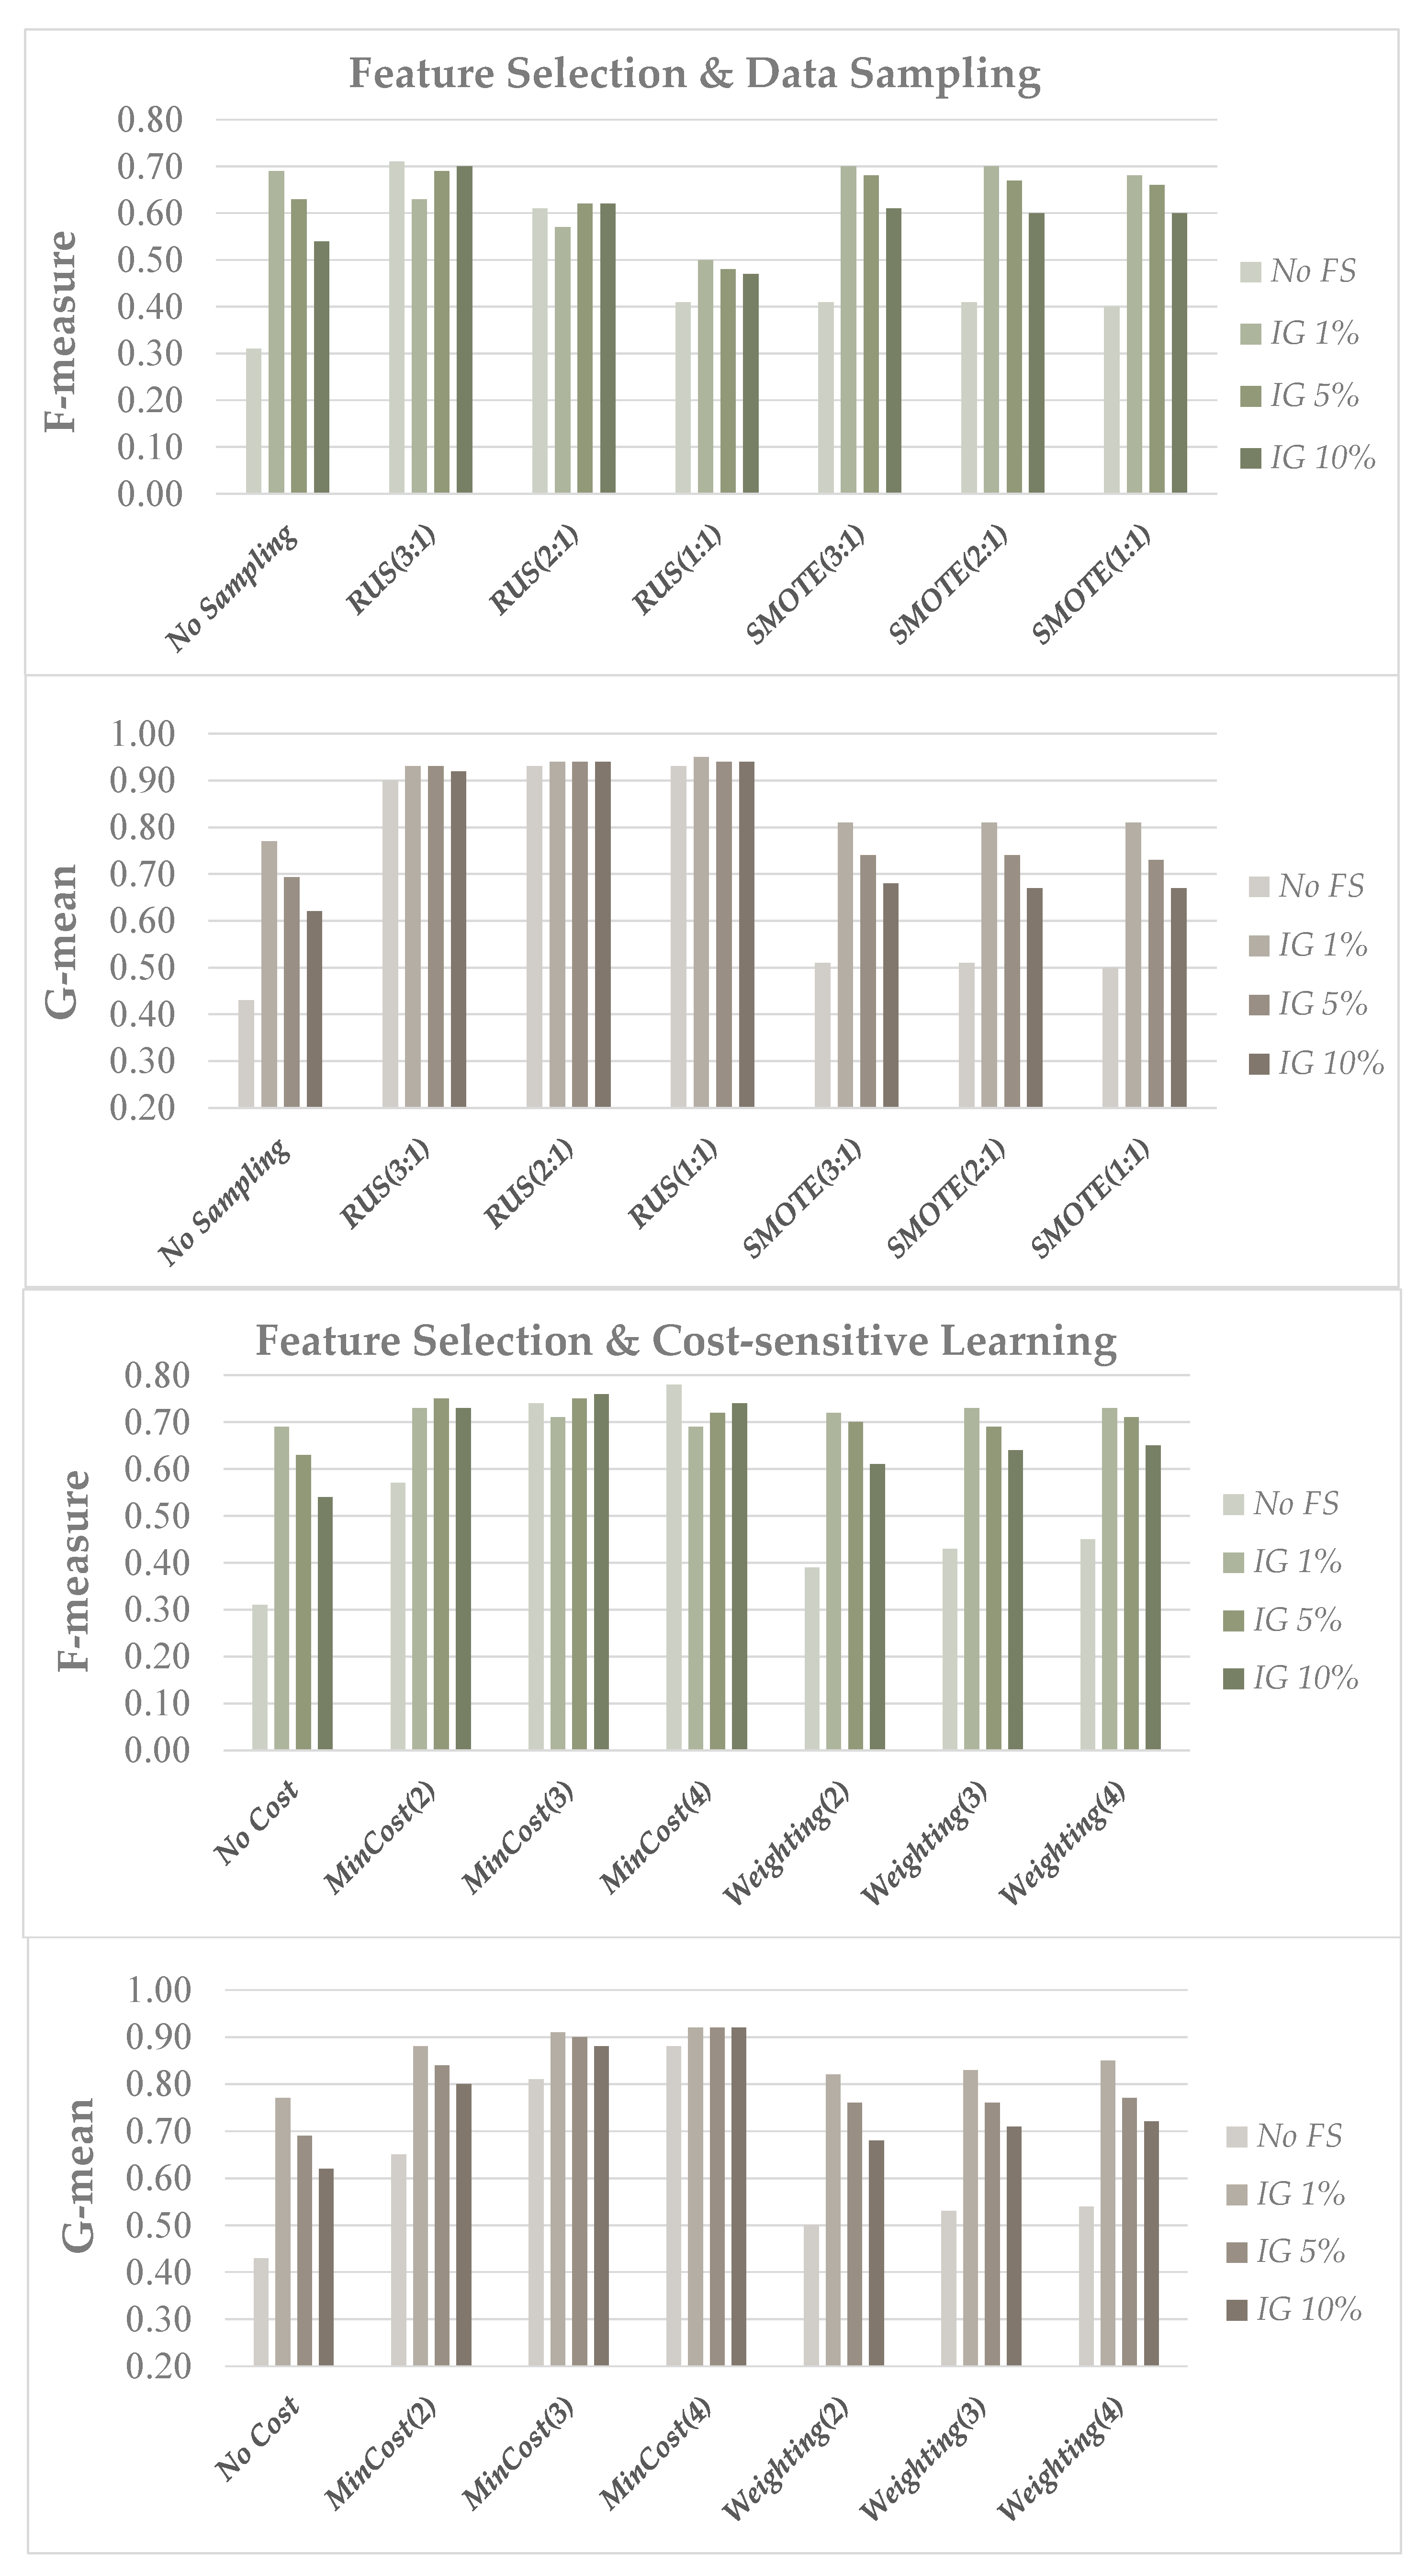
A hybrid learning strategy turns out to also be convenient in the text categorization domain (Figure 3), where the computational burden is even higher due to the higher number of instances. In this case, if the values of both the F-measure and the G-mean are considered, the best results are obtained using the RUS (with spread 3:1) and MinCost (with C = 3 or C = 4) approaches, whose performance is still very good when the number of features is drastically reduced. Again, combining imbalance learning methods with feature selection leads to predictive models that achieve a good classification performance using far fewer attributes.
As regards the most appropriate level of dimensionality reduction (in conjunction with the IG ranker considered here), we can observe in Figure 2 that a very small percentage of the selected features, i.e., 0.25% of the original dimensionality, is sufficient to obtain quite good results on the genomic domain, both using data sampling and cost-sensitive methods, although a slightly better performance can be achieved with a subset size of 1%. In the text categorization benchmarks, on the other hand, the behavior of the performance metrics is more dependent on the adopted learning strategy, as we can see in Figure 3. Indeed, increasing the percentage of selected features (5–10%) may be somewhat beneficial, in terms of the F-measure (more sensitive to the number of false positives than the G-mean), when using the RUS and MinCost approaches; however, if the SMOTE and Weighting approaches are applied, a smaller subset size turns out to be better in terms of both the F-measure and the G-mean. This may be explained by considering the higher level of imbalance in this domain (see Table 2), which can increase the risk of overfitting when over-sampling methods, such as SMOTE, are applied in the presence of many features; the Weighting approach, in turn, is conceptually similar to a form of over-sampling, as rare instances are given higher weights. Thus, both the SMOTE and Weighting approaches can benefit from a more pronounced dimensionality reduction when applied to highly skewed datasets.
Finally, despite the different characteristics in terms of the imbalance level and the instances-to-features ratio, the adoption of a hybrid learning strategy may be a suitable choice even in the image datasets (Figure 4), since it reduces the data dimensionality without degrading the gain in performance obtained with data balancing or cost-sensitive methods. Note that, in this domain, the CFS filter has allowed us to automatically determine the optimal number of features, which is about 25% of the original dimensionality (lower than in the genomic and text categorization datasets, where the effect of feature selection is more pronounced).
Overall, the results shown in this paper (as well as those provided as supplementary material) suggest that properly combining imbalance learning methods and feature selection can be an effective and efficient way to deal with datasets that are both high-dimensional and class-imbalanced. Such a hybrid approach has only been partially explored in recent years, with most research focusing on the use of feature selection alone or imbalance learning methods alone.
Compared to similar studies in the field (e.g., [8,9,34,35]), this work encompasses different application domains as well as a wider range of approaches (FS + RUS, RUS + FS, FS + SMOTE, SMOTE + FS, FS + MinCost, FS + Weighting) and learning settings (i.e., numbers of selected features, post-sampling class spreads and misclassification costs), providing interesting insight on the extent to which the adoption of such approaches and settings may impact the classification performance of the induced models.
Furthermore, this work may pave the way for wider and more exhaustive comparative studies. Indeed, we rely on a general methodological framework that is not tied to a specific induction algorithm or feature selection method. Although the adopted classifier (RF) and selectors (IG/CFS) have proved to be effective across multiple classification tasks, other implementation choices could be considered in order to evaluate the extent to which different combinations of classifiers and selection methods may benefit from the adoption of the hybrid learning strategies discussed here. Actually, limited to the biomedical domain, our previous research [35] has given some evidence that a number of classifiers may take advantage of the joint application of the feature selection and imbalance learning methods, although with results somewhat inferior to those achieved using the RF classifier. The case study presented here, encompassing heterogeneous datasets from multiple domains, as well as multiple learning settings (e.g., different levels of data reduction) has confirmed that RF is a suitable option when dealing with high-dimensional and class-imbalanced tasks, but other options deserve to be explored, including regularization techniques [51,52,53] that have an embedded capability of selecting the most relevant features. Given the high number of real-world problems where the issues of class imbalance and high dimensionality coexist, we think that larger comparative studies should, indeed, be conducted in this field.
5. Concluding Remarks and Future Work
This work has emphasized the importance of jointly addressing, in a proper way, the class imbalance and the high dimensionality issues that are increasingly being encountered in several domains. Surprisingly, despite the research efforts in the imbalance learning field, the practical adoption of data balancing and cost-sensitive methods is still limited in several application areas. Furthermore, when the data imbalance problem is coupled with a high number of features, the integration of a proper dimensionality reduction step into the learning process is of paramount importance, but limited research has been thus far conducted on the joint use of feature selection and imbalance learning methods.
The experiments we have performed across different domains, encompassing multiple levels of imbalance and data dimensionality, have shown that the SMOTE over-sampling approach and the Weighting cost-sensitive approach (which is conceptually similar to a form of over-sampling as the minority instances are given higher weights) may suffer to a greater extent in high-dimensional spaces. On the other hand, the RUS under-sampling approach and the MinCost method seem to be more robust overall across high-dimensional tasks from different domains.
In turn, feature selection, even without any data balancing or cost-sensitive correction, can be useful to better discriminate majority and minority instances, especially if the dataset is highly imbalanced. However, it is the integration of feature selection methods and imbalance learning methods that leads to the greatest benefits, in terms of predictive performance, savings of computational resources and, not least, the understandability of the induced models.
As future work, we plan to strengthen the findings of this study along several directions. Firstly, more datasets from different domains will be considered to gain a deeper insight into the best strategies to combine feature selection with data balancing and cost-sensitive methods, based on the specific properties of the data at hand. Furthermore, the effectiveness of the hybrid learning strategies discussed in this paper will be evaluated in conjunction with different feature selection techniques, both univariate and multivariate, as well as different classification techniques, representatives of different families of learners. In addition, regularization approaches that have an embedded capability of identifying relevant features will be considered for a larger and more comprehensive comparative study.
Supplementary Materials
The following are available online at https://www.mdpi.com/article/10.3390/info12080286/s1, Table S1: Uterus and Omentum datasets: F-measure and G-mean performance of the RF classifier in conjunction with data balancing (RUS/SMOTE) and feature selection (1% of the original features, as selected by the IG ranker), Table S2: Uterus and Omentum datasets: F-measure and G-mean performance of the RF classifier in conjunction with cost-sensitive methods (MinCost/Weighting) and feature selection (1% of the original features, as selected by the IG ranker), Table S3: Trade and Interest datasets: F-measure and G-mean performance of the RF classifier in conjunction with data balancing (RUS/SMOTE) and feature selection (5% of the original features, as selected by the IG ranker), Table S4: Trade and Interest datasets: F-measure and G-mean performance of the RF classifier in conjunction with cost-sensitive methods (MinCost/Weighting) and feature selection (5% of the original features, as selected by the IG ranker), Table S5: Mountain and Urban datasets: F-measure and G-mean performance of the RF classifier in conjunction with data balancing (RUS/SMOTE) and feature selection (CFS filter), Table S6: Mountain and Urban datasets: F-measure and G-mean performance of the RF classifier in conjunction with cost-sensitive methods (MinCost/Weighting) and feature selection (CFS filter).
Funding
This research was funded by the ADAM project (Fondazione di Sardegna, L.R. 7 agosto 2007, n°7, annualità 2018, CUP: F74I19000900007).
Data Availability Statement
As explained in the paper (Section 4.1), the datasets used in the experiments are publicly available at the following links: https://www.openml.org/search?type=data (accessed on 30 June 2021) (genomic datasets, i.e., Uterus and Omentum, and Scene datasets, i.e., Mountain and Urban), https://archive.ics.uci.edu/ml/index.php (accessed on 30 June 2021) (Reuters-21578 text categorization collection).
Acknowledgments
This research was partially supported by the HOPE project (MIUR, PRIN 2017).
Conflicts of Interest
The author declares no conflict of interest. The funders had no role in the design of the study; in the collection, analyses, or interpretation of data; in the writing of the manuscript; or in the decision to publish the results.
References
- Japkowicz, N.; Stephen, S. The class imbalance problem: A systematic study. Intell. Data Anal. 2002, 6, 429–449. [Google Scholar] [CrossRef]
- He, H.; Garcia, E. Learning from imbalanced data. IEEE Trans. Knowl. Data Eng. 2009, 21, 1263–1284. [Google Scholar]
- Krawczyk, B. Learning from imbalanced data: Open challenges and future directions. Prog. Artif. Intell. 2016, 5, 221–232. [Google Scholar] [CrossRef] [Green Version]
- Branco, P.; Torgo, L.; Ribeiro, R.P. A Survey of Predictive Modeling on Imbalanced Domains. ACM Comput. Surv. 2016, 49, 31. [Google Scholar] [CrossRef]
- Blagus, R.; Lusa, L. Class prediction for high-dimensional class-imbalanced data. BMC Bioinform. 2010, 11, 523. [Google Scholar] [CrossRef] [PubMed] [Green Version]
- Maldonado, S.; Weber, R.; Famili, F. Feature selection for high-dimensional class-imbalanced data sets using Support Vector Machines. Inf. Sci. 2014, 286, 228–246. [Google Scholar] [CrossRef]
- Moayedikia, A.; Ong, K.L.; Boo, Y.L.; Yeoh, W.G.S.; Jensen, R. Feature selection for high dimensional imbalanced class data using harmony search. Eng. Appl. Artif. Intell. 2017, 57, 38–49. [Google Scholar] [CrossRef] [Green Version]
- Shanab, A.A.; Khoshgoftaar, T.M. Is Gene Selection Enough for Imbalanced Bioinformatics Data? In Proceedings of the 2018 IEEE International Conference on Information Reuse and Integration for Data Science, Salt Lake City, UT, USA, 6–9 July 2018; pp. 346–355. [Google Scholar]
- Zhang, C.; Zhou, Y.; Guo, J.; Wang, G.; Wang, X. Research on classification method of high-dimensional class-imbalanced datasets based on SVM. Int. J. Mach. Learn. Cybern. 2019, 10, 1765–1778. [Google Scholar] [CrossRef]
- Fu, G.H.; Wu, Y.J.; Zong, M.J.; Pan, J. Hellinger distance-based stable sparse feature selection for high-dimensional class-imbalanced data. BMC Bioinform. 2020, 21, 121. [Google Scholar] [CrossRef] [Green Version]
- Breiman, L. Random forests. Mach. Learn. 2001, 45, 5–32. [Google Scholar] [CrossRef] [Green Version]
- Fawagreh, K.; Gaber, M.M.; Elyan, E. Random forests: From early developments to recent advancements. Syst. Sci. Control Eng. 2014, 2, 602–609. [Google Scholar] [CrossRef] [Green Version]
- Rokach, L. Decision forest: Twenty years of research. Inf. Fusion 2016, 27, 111–125. [Google Scholar] [CrossRef]
- Khoshgoftaar, T.M.; Golawala, M.; Van Hulse, J. An Empirical Study of Learning from Imbalanced Data Using Random Forest. In Proceedings of the 19th IEEE International Conference on Tools with Artificial Intelligence, Patras, Greece, 29–31 October 2007; pp. 310–317. [Google Scholar]
- Chen, X.; Ishwaran, H. Random forests for genomic data analysis. Genomics 2012, 99, 323–329. [Google Scholar] [CrossRef] [Green Version]
- Haixiang, G.; Yijing, L.; Shang, J.; Mingyun, G.; Yuanyue, H.; Bing, G. Learning from class-imbalanced data. Expert Syst. Appl. 2017, 73, 220–239. [Google Scholar] [CrossRef]
- Fernandez, A.; Garcia, S.; Herrera, F.; Chawla, N.V. SMOTE for Learning from Imbalanced Data: Progress and Challenges, Marking the 15-year Anniversary. J. Artif. Intell. Res. 2018, 61, 863–905. [Google Scholar] [CrossRef]
- Galar, M.; Fernandez, A.; Barrenechea, E.; Bustince, H.; Herrera, F. A review on ensembles for the class imbalance problem: Bagging-, boosting-, and hybrid-based approaches. IEEE Trans. Syst. Man Cybern. Part C Appl. Rev. 2012, 42, 463–484. [Google Scholar] [CrossRef]
- Zheng, Z.; Wu, X.; Srihari, R. Feature selection for text categorization on imbalanced data. ACM Sigkdd Explor. Newsl. 2004, 6, 80–89. [Google Scholar] [CrossRef]
- Wasikowski, M.; Chen, X. Combating the small sample class imbalance problem using feature selection. IEEE Trans. Knowl. Data Eng. 2010, 22, 1388–1400. [Google Scholar] [CrossRef]
- Bolón-Canedo, V.; Sánchez-Maroño, N.; Alonso-Betanzos, A. Feature Selection for High-Dimensional Data, Artificial Intelligence: Foundations, Theory, and Algorithms; Springer: Berlin/Heidelberg, Germany, 2015. [Google Scholar]
- Dessì, N.; Pes, B. Similarity of feature selection methods: An empirical study across data intensive classification tasks. Expert Syst. Appl. 2015, 42, 4632–4642. [Google Scholar] [CrossRef]
- Bommert, A.; Sun, X.; Bischl, B.; Rahnenführer, J.; Lang, M. Benchmark for filter methods for feature selection in high-dimensional classification data. Comput. Stat. Data Anal. 2020, 143, 106839. [Google Scholar] [CrossRef]
- Cannas, L.M.; Dessì, N.; Pes, B. A Filter-based Evolutionary Approach for Selecting Features in High-Dimensional Micro-array Data. In Proceedings of the 6th International Conference on Intelligent Information Processing, Manchester, UK, 13–16 October 2010; pp. 297–307. [Google Scholar]
- Ahmed, N.; Rafiq, J.I.; Islam, M.D.R. Enhanced Human Activity Recognition Based on Smartphone Sensor Data Using Hybrid Feature Selection Model. Sensors 2020, 20, 317. [Google Scholar] [CrossRef] [Green Version]
- Almugren, N.; Alshamlan, H. A Survey on Hybrid Feature Selection Methods in Microarray Gene Expression Data for Cancer Classification. IEEE Access 2019, 7, 78533–78548. [Google Scholar] [CrossRef]
- Dessì, N.; Pes, B. Stability in Biomarker Discovery: Does Ensemble Feature Selection Really Help? In Current Approaches in Applied Artificial Intelligence, Proceedings of the 28th International Conference on Industrial, Engineering and Other Applications of Applied Intelligent Systems, IEA/AIE 2015, Seoul, Korea, 10–12 June 2015; LNCS 9101; Springer: Cham, Switzerland, 2015; pp. 191–200. [Google Scholar]
- Bolón-Canedo, V.; Alonso-Betanzos, A. Ensembles for feature selection: A review and future trends. Inf. Fusion 2019, 52, 1–12. [Google Scholar] [CrossRef]
- Pes, B. Ensemble feature selection for high-dimensional data: A stability analysis across multiple domains. Neural Comput. Appl. 2020, 32, 5951–5973. [Google Scholar] [CrossRef] [Green Version]
- Haury, A.C.; Gestraud, P.; Vert, J.P. The Influence of Feature Selection Methods on Accuracy, Stability and Interpretability of Molecular Signatures. PLoS ONE 2011, 6, e28210. [Google Scholar] [CrossRef] [PubMed]
- Drotár, P.; Gazda, J.; Smékal, Z. An Experimental Comparison of Feature Selection Methods on Two-Class Biomedical Datasets. Comput. Biol. Med. 2015, 66, 1–10. [Google Scholar] [CrossRef]
- Pes, B. Feature Selection for High-Dimensional Data: The Issue of Stability. In Proceedings of the 2017 IEEE 26th International Conference on Enabling Technologies: Infrastructure for Collaborative Enterprises (WETICE), Poznan, Poland, 21–23 June 2017; pp. 170–175. [Google Scholar]
- Bolón-Canedo, V.; Rego-Fernández, D.; Peteiro-Barral, D.; Alonso-Betanzos, A.; Guijarro-Berdiñas, B.; Sánchez-Maroño, N. On the scalability of feature selection methods on high-dimensional data. Knowl. Inf. Syst. 2018, 56, 395–442. [Google Scholar] [CrossRef]
- Blagus, R.; Lusa, L. SMOTE for high-dimensional class-imbalanced data. BMC Bioinform. 2013, 14, 106. [Google Scholar] [CrossRef] [Green Version]
- Pes, B. Learning From High-Dimensional Biomedical Datasets: The Issue of Class Imbalance. IEEE Access 2020, 8, 13527–13540. [Google Scholar] [CrossRef]
- Ling, C.X.; Sheng, V.S. Cost-Sensitive Learning. In Encyclopedia of Machine Learning; Sammut, C., Webb, G.I., Eds.; Springer: Berlin/Heidelberg, Germany, 2010; pp. 231–235. [Google Scholar]
- López, V.; Fernández, A.; García, S.; Palade, V.; Herrera, F. An insight into classification with imbalanced data: Empirical results and current trends on using data intrinsic characteristics. Inf. Sci. 2013, 250, 113–141. [Google Scholar] [CrossRef]
- Chen, Y.; Zheng, W.; Li, W.; Huang, Y. Large group activity security risk assessment and risk early warning based on random forest algorithm. Pattern Recognit. Lett. 2021, 144, 1–5. [Google Scholar] [CrossRef]
- Figueroa, A.; Peralta, B.; Nicolis, O. Coming to Grips with Age Prediction on Imbalanced Multimodal Community Question Answering Data. Information 2021, 12, 48. [Google Scholar] [CrossRef]
- OpenML Datasets. Available online: https://www.openml.org/search?type=data (accessed on 30 June 2021).
- Hambali, M.A.; Oladele, T.O.; Adewole, K.S. Microarray cancer feature selection: Review, challenges and research directions. Int. J. Cogn. Comput. Eng. 2020, 1, 78–97. [Google Scholar] [CrossRef]
- UCI Machine Learning Repository. Available online: https://archive.ics.uci.edu/ml/index.php (accessed on 30 June 2021).
- Rullo, P.; Policicchio, V.L.; Cumbo, C.; Iiritano, S. Olex: Effective Rule Learning for Text Categorization. IEEE Trans. Knowl. Data Eng. 2009, 21, 1118–1132. [Google Scholar] [CrossRef]
- Boutell, M.R.; Luo, J.; Shen, X.; Brown, C.M. Learning multi-label scene classification. Pattern Recognit. 2004, 37, 1757–1771. [Google Scholar] [CrossRef] [Green Version]
- Witten, I.H.; Frank, E.; Hall, M.A.; Pal, C.J. Data Mining: Practical Machine Learning Tools and Techniques; Morgan Kaufmann: San Mateo, CA, USA, 2016. [Google Scholar]
- Weka: Data Mining Software in Java. Available online: https://www.cs.waikato.ac.nz/ml/weka/ (accessed on 30 June 2021).
- Nadeau, C.; Bengio, Y. Inference for the Generalization Error. Mach. Learn. 2003, 52, 239–281. [Google Scholar] [CrossRef] [Green Version]
- Alonso-Betanzos, A.; Bolón-Canedo, V.; Morán-Fernández, L.; Seijo-Pardo, B. Feature Selection Applied to Microarray Data. In Microarray Bioinformatics; Methods in Molecular Biology; Bolón-Canedo, V., Alonso-Betanzos, A., Eds.; Humana: New York, NY, USA, 2019; Volume 1986, pp. 123–152. [Google Scholar]
- Dessì, N.; Milia, G.; Pes, B. Enhancing Random Forests Performance in Microarray Data Classification. In Artificial Intelligence in Medicine, Proceedings of the 14th Conference on Artificial Intelligence in Medicine, AIME 2013, Murcia, Spain, 29 May–1 June 2013; LNCS 7885; Springer: Berlin/Heidelberg, Germany, 2013; pp. 99–103. [Google Scholar]
- Cilia, N.D.; De Stefano, C.; Fontanella, F.; Raimondo, S.; Scotto di Freca, A. An Experimental Comparison of Feature-Selection and Classification Methods for Microarray Datasets. Information 2019, 10, 109. [Google Scholar] [CrossRef] [Green Version]
- Sirimongkolkasem, T.; Drikvandi, R. On Regularisation Methods for Analysis of High Dimensional Data. Ann. Data. Sci. 2019, 6, 737–763. [Google Scholar] [CrossRef] [Green Version]
- Wu, S.; Jiang, H.; Shen, H.; Yang, Z. Gene Selection in Cancer Classification Using Sparse Logistic Regression with L1/2 Regularization. Appl. Sci. 2018, 8, 1569. [Google Scholar] [CrossRef] [Green Version]
- Marafino, B.J.; Boscardin, W.J.; Dudley, R.A. Efficient and sparse feature selection for biomedical text classification via the elastic net: Application to ICU risk stratification from nursing notes. J. Biomed. Inform. 2015, 54, 114–120. [Google Scholar] [CrossRef] [PubMed] [Green Version]
Figure 1.
Hybrid learning strategies that combine feature selection with imbalance learning methods.
Figure 1.
Hybrid learning strategies that combine feature selection with imbalance learning methods.

Figure 2.
Uterus dataset: F-measure and G-mean performance of the RF classifier in conjunction with feature selection (IG ranker) and imbalance learning methods (data sampling and cost-sensitive learning), for different percentages of selected features (0.25, 0.5 and 1% of the original data dimensionality).

Figure 3.
Trade dataset: F-measure and G-mean performance of the RF classifier in conjunction with feature selection (IG ranker) and imbalance learning methods (data sampling and cost-sensitive learning), for different percentages of selected features (1, 5 and 10% of the original data dimensionality).

Figure 4.
Mountain dataset: F-measure and G-mean performance of the RF classifier in conjunction with feature selection (CFS filter) and imbalance learning methods (data sampling and cost-sensitive learning).
Figure 4.
Mountain dataset: F-measure and G-mean performance of the RF classifier in conjunction with feature selection (CFS filter) and imbalance learning methods (data sampling and cost-sensitive learning).


Table 1.
Cost matrix for a binary classification problem.
| Predicted Class | |||
|---|---|---|---|
| + | − | ||
| actual class | + | C(+,+) | C(+,−) |
| − | C(−,+) | C(−,−) | |
Table 2.
Datasets used in the experimental study.
| Domain | Dataset | Number of Instances | Number of Features | Instances-to-Features Ratio | % of Minority Instances |
|---|---|---|---|---|---|
| Genomic data | Uterus | 1545 | 10,935 | 0.14 | 8.0% |
| Omentum | 1545 | 10,935 | 0.14 | 5.0% | |
| Text categorization | Trade | 12,897 | 7599 | 1.70 | 3.8% |
| Interest | 12,897 | 10,457 | 1.23 | 3.7% | |
| Image classification | Mountain | 2407 | 294 | 8.19 | 22.1% |
| Urban | 2407 | 294 | 8.19 | 17.9% |
Table 3.
F-measure and G-mean performance of the RF classifier, with and without data balancing.
| Dataset | Performance Measure | Baseline | RUS (3:1) | RUS (2:1) | RUS (1:1) | SMOTE (3:1) | SMOTE (2:1) | SMOTE (1:1) |
|---|---|---|---|---|---|---|---|---|
| Uterus | F-measure | 0.26 (0.09) | 0.57 (0.06) | 0.62 (0.07) | 0.52 (0.05) | 0.56 (0.07) | 0.56 (0.07) | 0.60 (0.07) |
| G-mean | 0.38 (0.08) | 0.73 (0.05) | 0.84 (0.05) | 0.86 (0.03) | 0.69 (0.05) | 0.71 (0.05) | 0.77 (0.05) | |
| Omentum | F-measure | 0.00 (0.00) | 0.48 (0.10) | 0.48 (0.07) | 0.38 (0.06) | 0.41 (0.12) | 0.46 (0.10) | 0.52 (0.08) |
| G-mean | 0.00 (0.00) | 0.69 (0.09) | 0.80 (0.08) | 0.85 (0.05) | 0.60 (0.10) | 0.64 (0.10) | 0.72 (0.08) | |
| Trade | F-measure | 0.31 (0.07) | 0.71 (0.03) | 0.61 (0.02) | 0.41 (0.02) | 0.41 (0.08) | 0.41 (0.07) | 0.40 (0.07) |
| G-mean | 0.43 (0.06) | 0.90 (0.03) | 0.93 (0.02) | 0.93 (0.01) | 0.51 (0.06) | 0.51 (0.05) | 0.50 (0.05) | |
| Interest | F-measure | 0.53 (0.03) | 0.72 (0.04) | 0.69 (0.03) | 0.50 (0.03) | 0.58 (0.03) | 0.58 (0.03) | 0.59 (0.03) |
| G-mean | 0.62 (0.02) | 0.88 (0.03) | 0.92 (0.02) | 0.95 (0.01) | 0.67 (0.03) | 0.67 (0.02) | 0.68 (0.02) | |
| Mountain | F-measure | 0.51 (0.04) | 0.56 (0.06) | 0.63 (0.04) | 0.61 (0.02) | 0.54 (0.04) | 0.61 (0.04) | 0.64 (0.04) |
| G-mean | 0.60 (0.03) | 0.64 (0.04) | 0.74 (0.04) | 0.79 (0.02) | 0.63 (0.03) | 0.71 (0.04) | 0.77 (0.03) | |
| Urban | F-measure | 0.56 (0.05) | 0.65 (0.05) | 0.68 (0.04) | 0.61 (0.02) | 0.64 (0.04) | 0.67 (0.04) | 0.68 (0.03) |
| G-mean | 0.64 (0.04) | 0.75 (0.04) | 0.81 (0.02) | 0.83 (0.02) | 0.72 (0.03) | 0.77 (0.03) | 0.81 (0.02) |
Table 4.
F-measure and G-mean performance of the RF classifier, with and without cost-sensitive corrections.
Table 4.
F-measure and G-mean performance of the RF classifier, with and without cost-sensitive corrections.
| Dataset | Performance Measure | Baseline | MinCost (2) | MinCost (3) | MinCost (4) | Weighting (2) | Weighting (3) | Weighting (4) |
|---|---|---|---|---|---|---|---|---|
| Uterus | F-measure | 0.26 (0.09) | 0.52 (0.08) | 0.61 (0.06) | 0.62 (0.06) | 0.45 (0.08) | 0.46 (0.09) | 0.49 (0.08) |
| G-mean | 0.38 (0.08) | 0.65 (0.06) | 0.79 (0.04) | 0.85 (0.03) | 0.56 (0.06) | 0.58 (0.07) | 0.61 (0.06) | |
| Omentum | F-measure | 0.00 (0.00) | 0.14 (0.11) | 0.42 (0.13) | 0.50 (0.10) | 0.05 (0.06) | 0.09 (0.10) | 0.11 (0.09) |
| G-mean | 0.00 (0.00) | 0.24 (0.17) | 0.58 (0.12) | 0.72 (0.09) | 0.10 (0.13) | 0.16 (0.16) | 0.21 (0.15) | |
| Trade | F-measure | 0.31 (0.07) | 0.57 (0.05) | 0.74 (0.04) | 0.78 (0.02) | 0.39 (0.07) | 0.43 (0.08) | 0.45 (0.06) |
| G-mean | 0.43 (0.06) | 0.65 (0.03) | 0.81 (0.03) | 0.88 (0.02) | 0.50 (0.06) | 0.53 (0.06) | 0.54 (0.05) | |
| Interest | F-measure | 0.53 (0.03) | 0.65 (0.03) | 0.72 (0.02) | 0.75 (0.02) | 0.59 (0.03) | 0.60 (0.03) | 0.61 (0.02) |
| G-mean | 0.62 (0.02) | 0.73 (0.02) | 0.82 (0.02) | 0.88 (0.01) | 0.68 (0.02) | 0.69 (0.02) | 0.70 (0.02) | |
| Mountain | F-measure | 0.51 (0.04) | 0.65 (0.03) | 0.61 (0.03) | 0.57 (0.02) | 0.61 (0.04) | 0.64 (0.04) | 0.65 (0.03) |
| G-mean | 0.60 (0.03) | 0.78 (0.02) | 0.79 (0.02) | 0.76 (0.02) | 0.70 (0.04) | 0.74 (0.04) | 0.77 (0.03) | |
| Urban | F-measure | 0.56 (0.05) | 0.69 (0.04) | 0.66 (0.02) | 0.61 (0.03) | 0.65 (0.04) | 0.68 (0.04) | 0.69 (0.03) |
| G-mean | 0.64 (0.04) | 0.81 (0.03) | 0.85 (0.01) | 0.83 (0.02) | 0.74 (0.03) | 0.78 (0.03) | 0.79 (0.02) |
Publisher’s Note: MDPI stays neutral with regard to jurisdictional claims in published maps and institutional affiliations. |
© 2021 by the author. Licensee MDPI, Basel, Switzerland. This article is an open access article distributed under the terms and conditions of the Creative Commons Attribution (CC BY) license (https://creativecommons.org/licenses/by/4.0/).
Share and Cite
MDPI and ACS Style
Pes, B. Learning from High-Dimensional and Class-Imbalanced Datasets Using Random Forests. Information 2021, 12, 286. https://0-doi-org.brum.beds.ac.uk/10.3390/info12080286
AMA Style
Pes B. Learning from High-Dimensional and Class-Imbalanced Datasets Using Random Forests. Information. 2021; 12(8):286. https://0-doi-org.brum.beds.ac.uk/10.3390/info12080286
Chicago/Turabian StylePes, Barbara. 2021. "Learning from High-Dimensional and Class-Imbalanced Datasets Using Random Forests" Information 12, no. 8: 286. https://0-doi-org.brum.beds.ac.uk/10.3390/info12080286
Note that from the first issue of 2016, this journal uses article numbers instead of page numbers. See further details here.