1. Introduction
The incidence of type 2 diabetes (T2D) has reached epidemic proportions globally, with an average of one person dying of diabetes every 8 s in the world [
1]. In South-East Asia regions, T2D has been estimated to have increased by 74% from 2019 to 2045, resulting in a great economic impact [
1,
2]. Inappropriate T2D care and management have directly caused permanent morbidities, including cardiovascular disease (CVD), kidney disease, blindness, lower-limb amputations, and mortality. It has been estimated that T2D substantially contributed to approximately 32% of all CVD [
3], 56% of new end-stage renal disease [
4], and 1.6 million deaths in 2016 [
5]. Hence, seeking optimal solutions to control T2D-associated complications is critical to relieve the burden of T2D.
Diabetes ranks fifth in the top ten causes of death among Taiwanese people, with diabetic patients frequently experiencing hypertension and hyperlipidaemia, which dramatically increase the risk of neuropathy, as well as microvascular and macrovascular complications [
6]. Diabetes Health Education advises the treatment goals of glycated-heme control to be below 7%, blood pressure below 130/80 mmHg, and low-density cholesterol less than 100 mg/dL, to reduce the associated CVD burden. In Taiwan, there are approximately 2 million diabetic patients clinically at risk of diabetic complications. Thus, the Taiwan Diabetes Health Education Association has targeted nearly 6000 diabetes patients with glycosylated haemoglobin A1c (HbA1c) and blood pressure and cholesterol, the so-called ABC, to investigate indicators of complications of diabetes. Since 2002, patients who have met the treated target of ABC have shown a continuous growth trend [
7]. The survey found that the total compliance rate in Taiwan patients with diabetes was 12.9% in 2016. Compared with the total compliance rate in 2011, it increased by nearly 60%. The above-mentioned information combing detailed prescription and diagnosis data. The National Health Insurance Research Database (NHIRD) is appropriately used to build a risk assessment model for T2D patients.
Previous studies have explored several algorithms in assisting diabetes prevention and management. Zou et al. analysed data from 68,994 healthy people and patients with diabetes, and the present healthcare recommendation system using machine learning helped to predict the risk of diabetes. [
8]. Simon et al. presented a survey for predictive models built to leverage big data analytics to estimate the possibility of developing complications in patients with diabetes [
9]. Yap et al. [
10] introduced mobile apps collecting images of diabetic patients’ feet for data training and the development of diabetic foot ulcers. Ellahham [
11] argued that since intelligent technical reforms have produced better glycaemic control with reductions in fasting and postprandial glucose levels, glucose excursions, and glycosylated haemoglobin, AI will introduce a paradigm shift in diabetes care from conventional management strategies to building targeted data-driven precision care.
Since the publication of the first United Kingdom Prospective Diabetes Study (UKPDS) Outcomes Model [
12], the use of simulation modelling in diabetes has increased. For example, a total of 39,043 person-years of data where the median follow-up time for patients in the ACCORD trial was 3.7 years supports the model fitting process for developing the BRAVO risk engine [
13], with which the Atorvastatin Study for Prevention of Coronary Heart Disease Endpoints in Non-Insulin-Dependent Diabetes Mellitus (ASPEN) trial, the Action in Diabetes and Vascular Disease: Preterax and Diamicron Modified Release Controlled Evaluation (ADVANCE) trial, and the Collaborative Atorvastatin Diabetes Study (CARDS) trial were compared. In summary, we present the external validation by simulation with comparable outcomes versus some reports excerpted from the Mount Hood Challenges [
14,
15]. Compared to previous models constructed based on western clinical trials or epidemiological studies, such as the Framingham and the UKPDS studies [
12], developing the first model using long-term clinical care data collected from the Asian population would provide a more reliable estimate to help clinicians make better decisions regarding the treatment of diabetic patients.
We present a new version of the Taiwan Type 2 Diabetes Mellitus Holistic Care Model (T2DHoc), which could provide a well-elucidated estimation of the occurrence and time point of major diabetes-related complications over a patient’s lifetime. The developed data-driven model could simulate the occurrence of competing diabetes-associated complications and all-cause death for T2D over a patient’s lifetime. Since the participants had representative data, the model was also compared to other available prediction models and subject data from clinical trials. The internal validation of the T2DHoc over the 5-year follow-up was assessed by sensitivity analysis, and predictions from the original and new models using a contemporary patient-level input dataset. The data-driven approach for the predictive model is presented by the revealing management of prevalent short and long-term complications in diabetes, where long-term is defined as at least 15 years follow-up.
Diabetes is one of the top priorities in medical science and health care management, and an abundance of data and information is available on these patients. Whether data stem from statistical models or complex pattern recognition models, they may be fused into predictive models that combine patient information and prognostic outcome results. Almost any statistical regression model can be used as a predictive model, but due to their transparent functionality, multiple logistic or similar linear regressions are often used for prediction model development [
16]. However, a prediction model should take into account all important complication risks as a whole. To capture the whole disease as a system has been discussed in Tappenden et al. [
17] and Esensoy and Carter [
18].
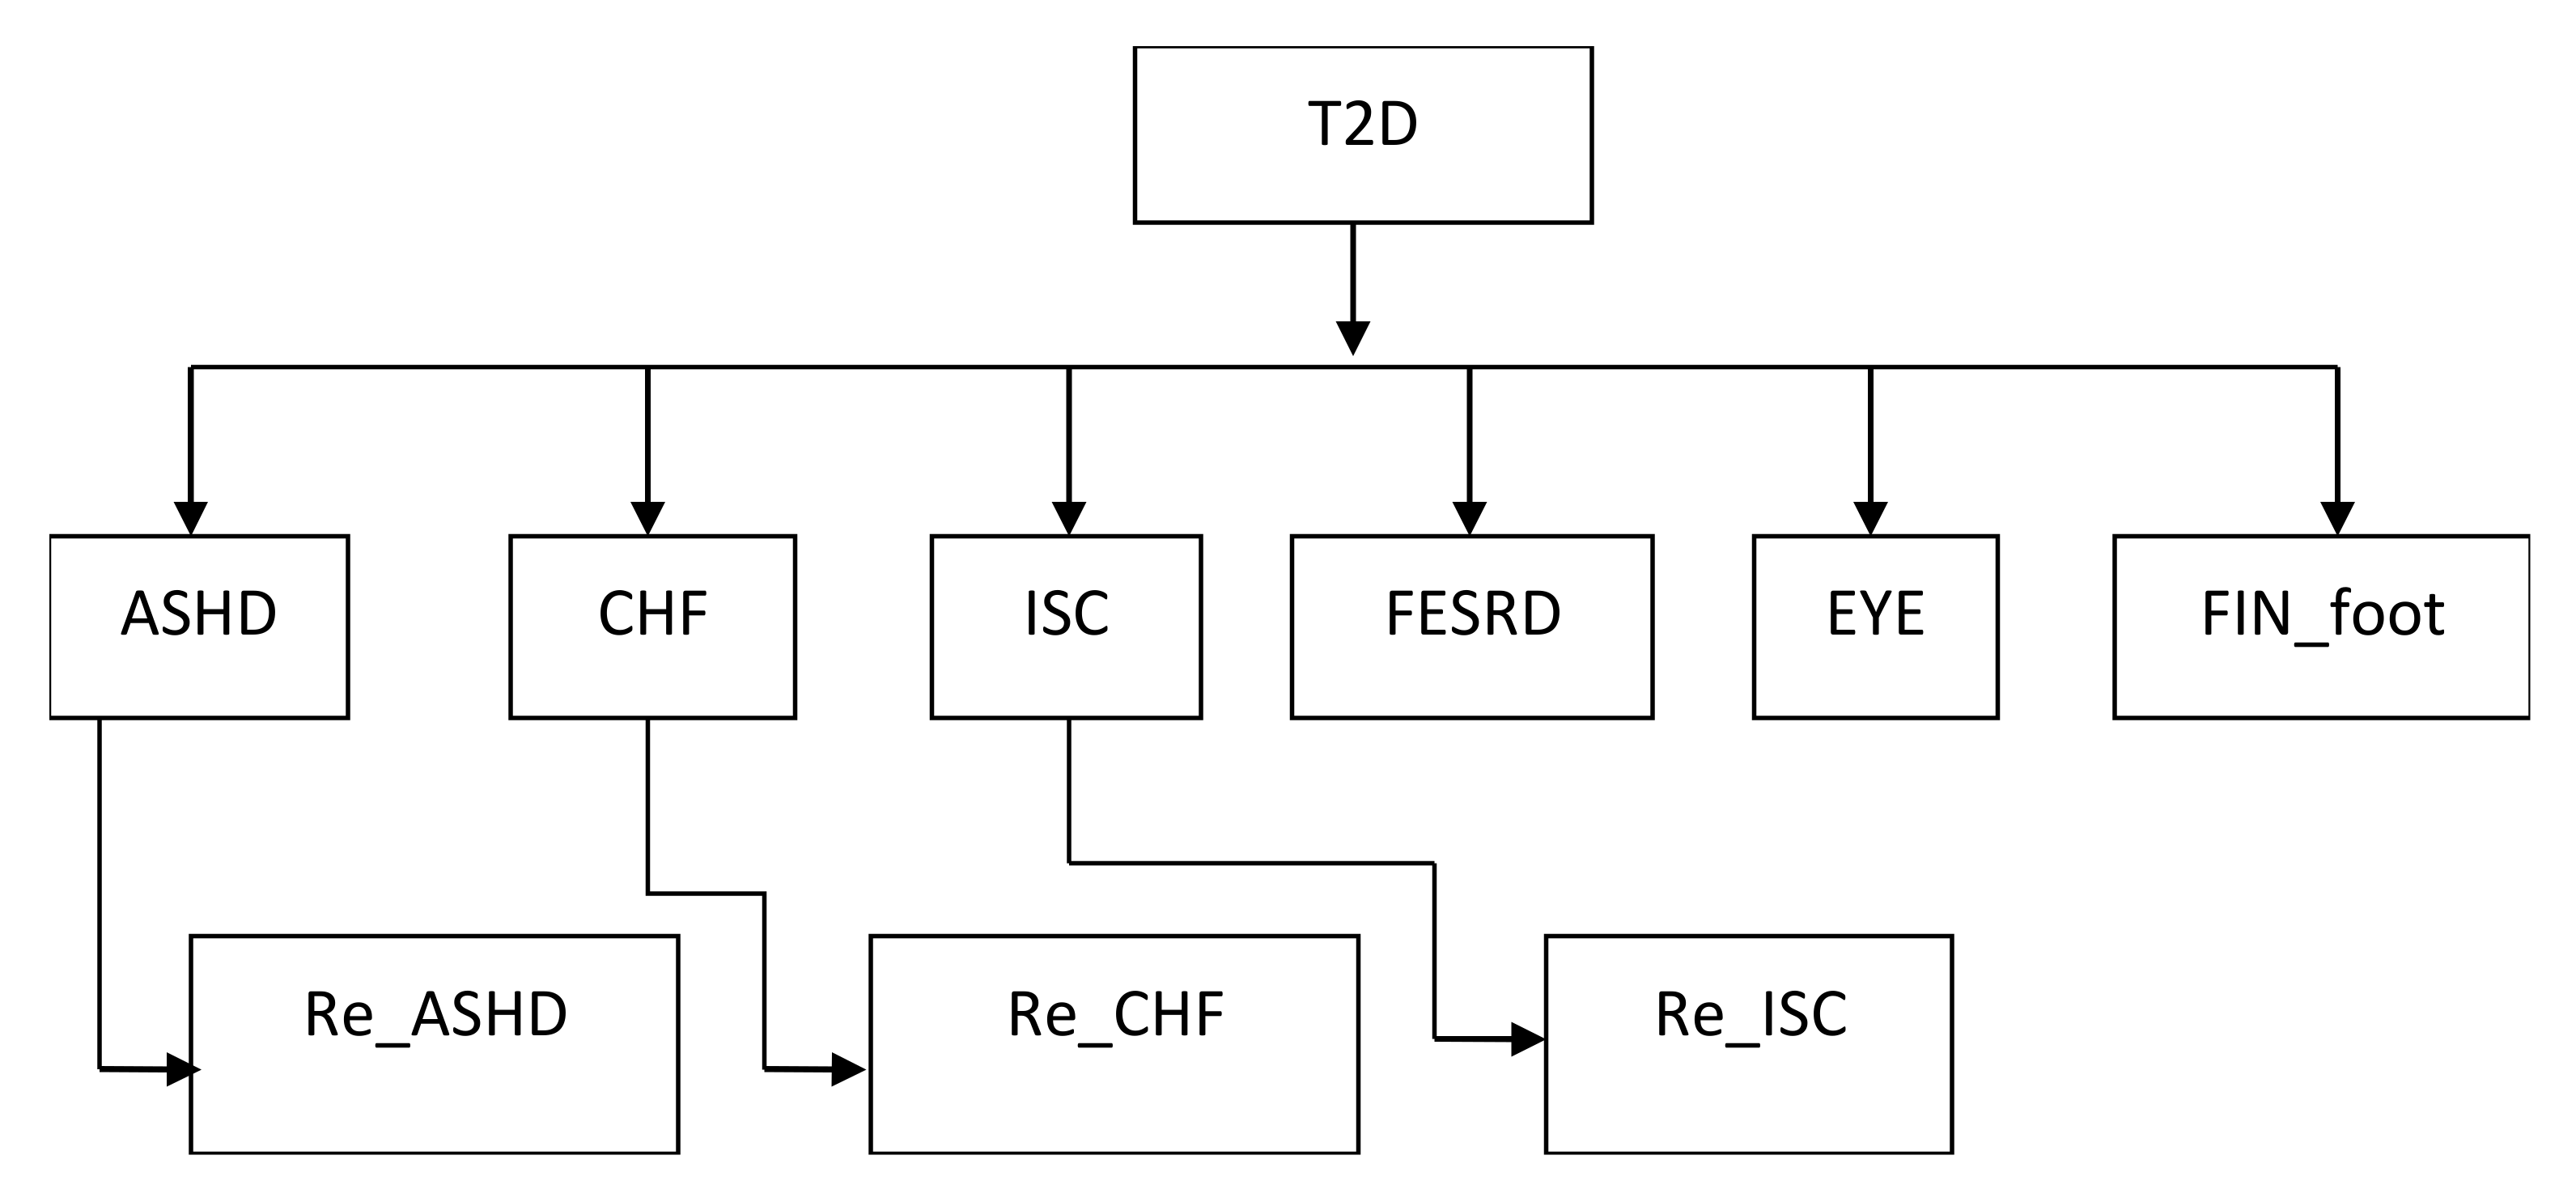
Such knowledge could be used in clinical decision support, disease surveillance, and public health management to improve patient care. Predictive models often include multiple predictors (covariates) to estimate the probability, risk of a certain outcome or to classify that a certain outcome is present/absent (diagnostic prediction model) or will happen within a specific timeframe (prognostic prediction model) in an individual. Although extensive effort has been made with building these prediction models, there is a remarkable scarcity of impact studies due to data limitations. In Taiwan, the national diabetic care registry was established in 2001, so it is possible to collect enough information for long-term prediction with important covariates to appraise high risk events. Regarding the risk of diabetic complications, the primary events of this study were arteriosclerotic heart disease (ASHD), ischaemic heart disease (IHD), chronic heart failure (CHF), ischemic stroke (ISC), first-time renal failure (FESRD), retinopathy (EYE), amputation (Fin Foot), and death. The T2DHoc model was built upon the occurrence of complication risks after a diagnosis of diabetes.
Figure 1 presents the logic structure with two layers, where the first layer after T2D demonstrates the first occurrence of complications and the second layer indicates the second complication. Therefore, the study aims to describe construction details of the T2DHoc model through estimating the probability of diabetes-related complications and the time-to-occurrence from a population-based database. In addition, we also validate this model against the results from Japan, Korean clinical studies, and the UKPDS Outcomes Model.
4. Discussion
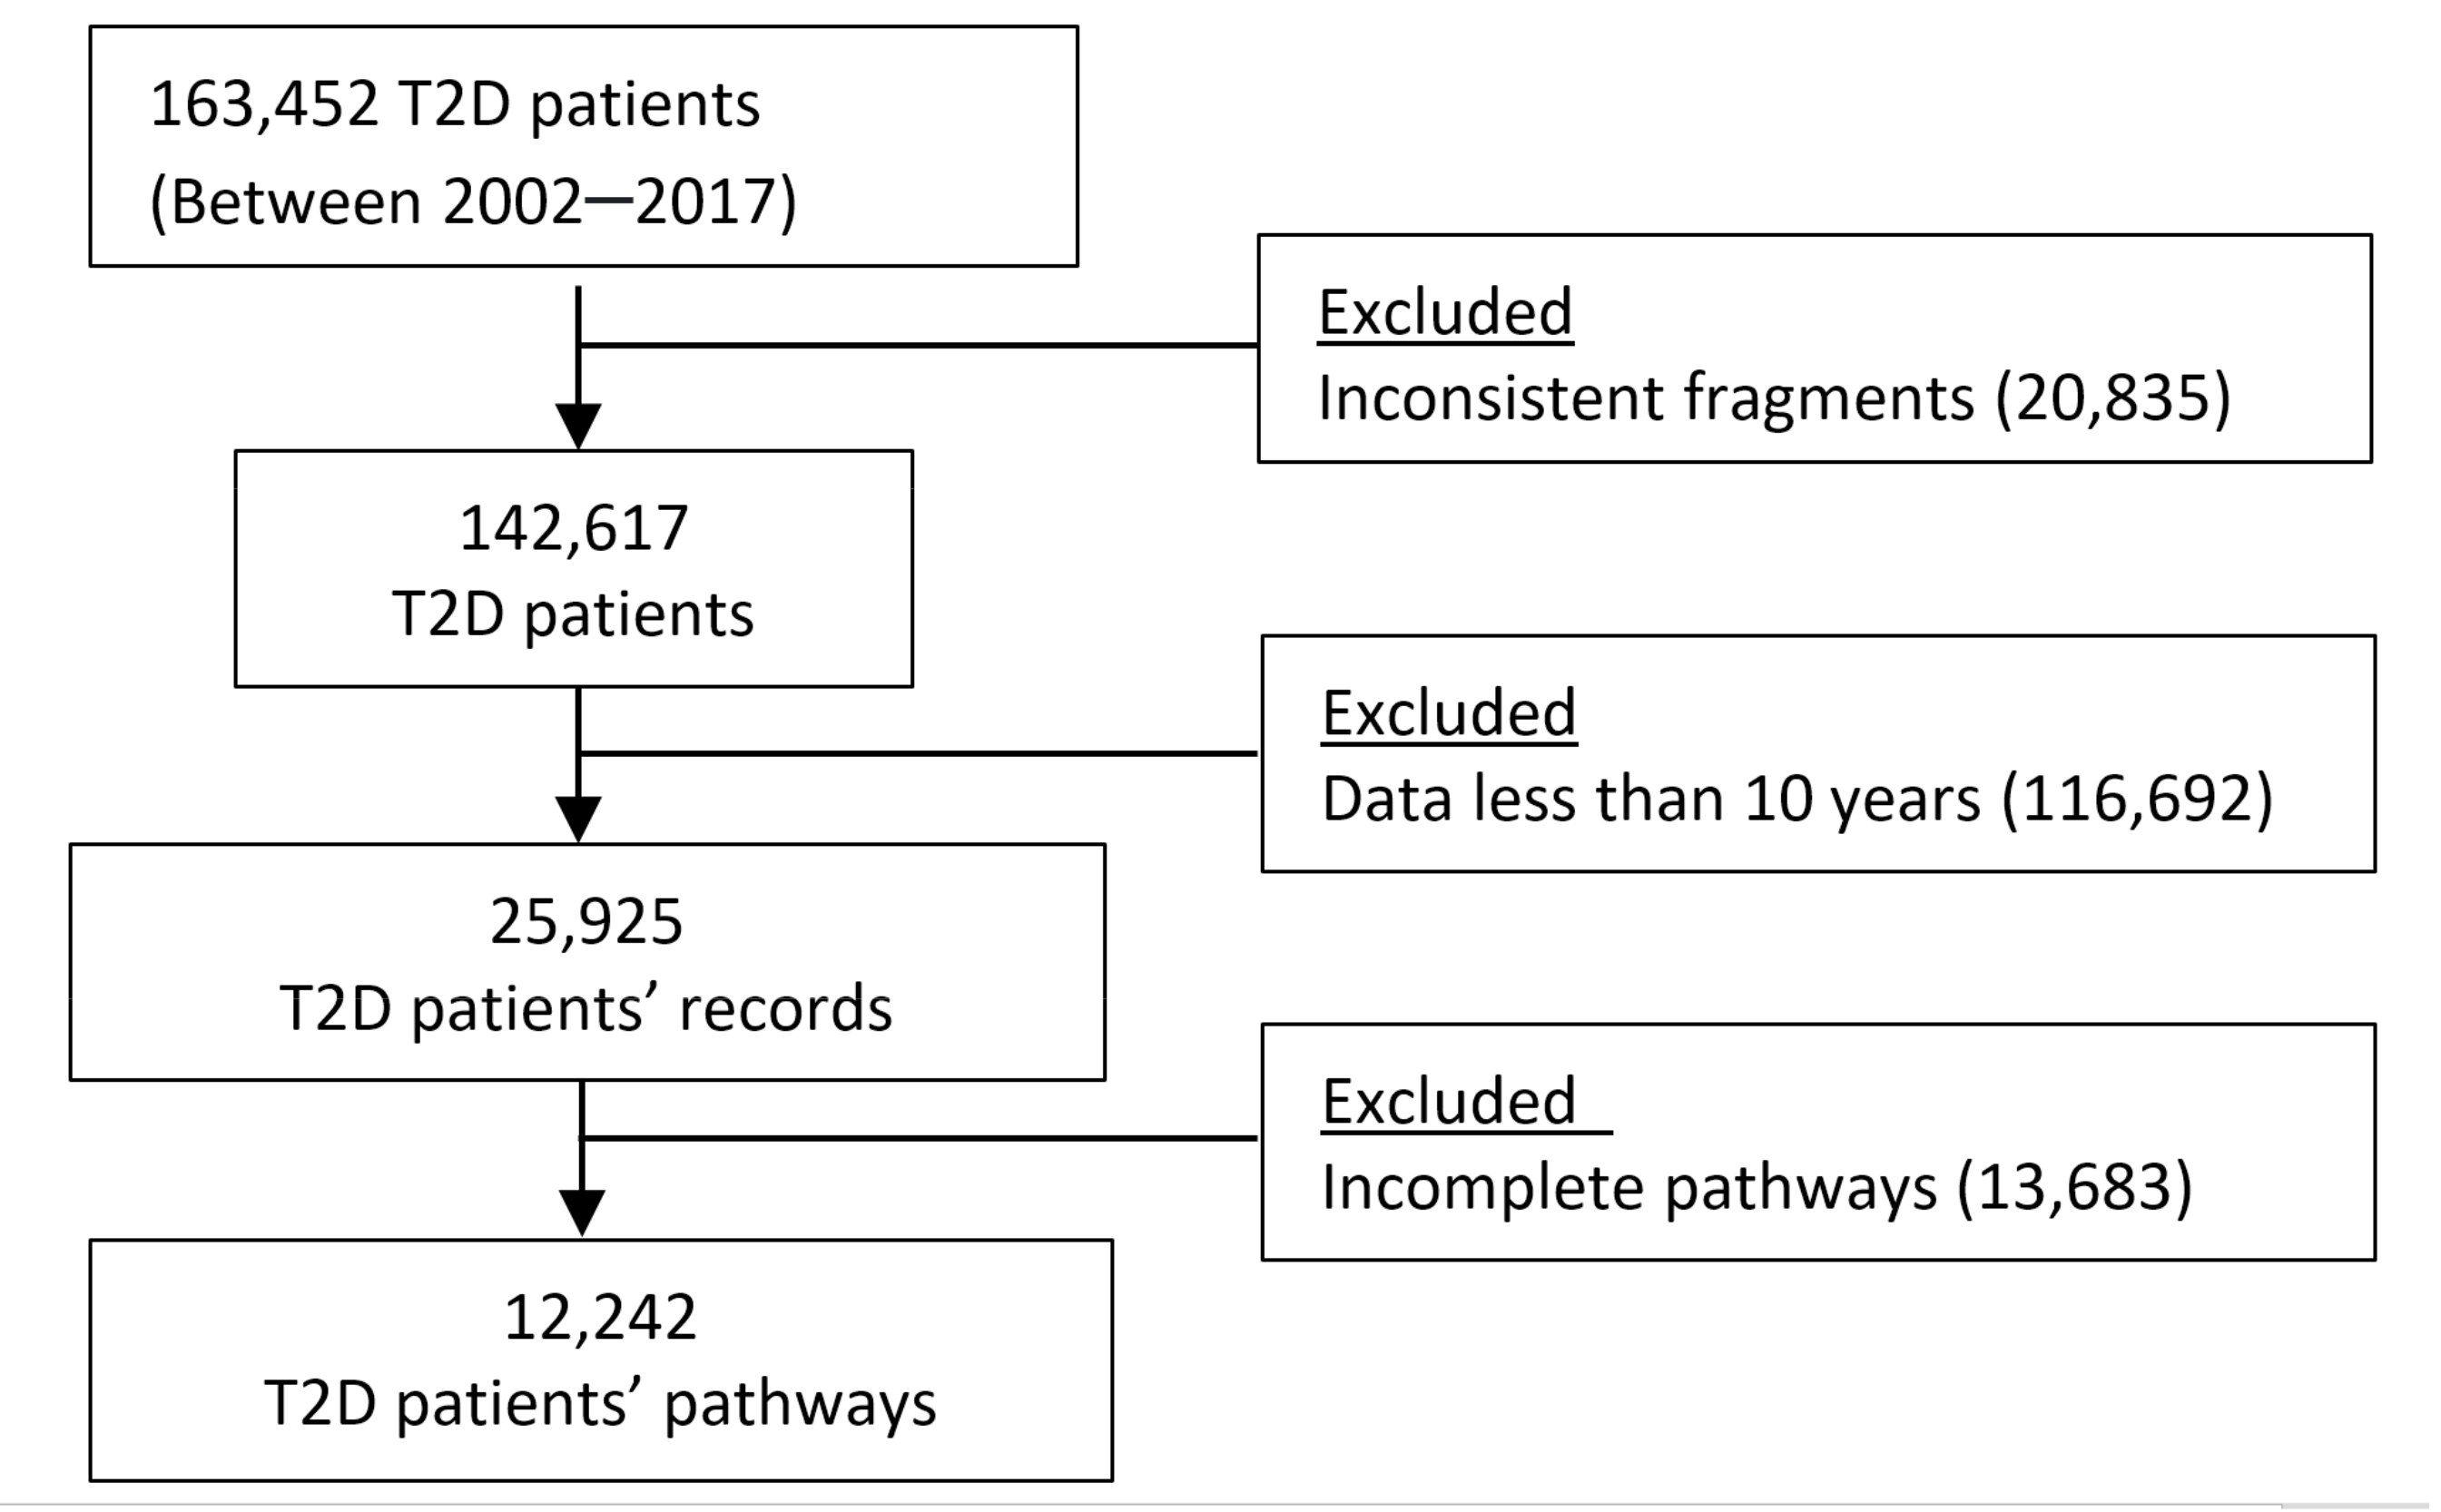
The study successfully extracted information from a long-lasting trial, with more than 163 thousands participants following up 16 years. A good predicted complication and mortality rates were approved against the setting observed numbers of complications or death in the original cohort. In addition, better and optimal predictabilities were further confirmed when compared to the UKPDS Outcomes model and applied the model to other Asian populations, respectively.
The T2DHoc is based on more comprehensive follow-up data as it captures more outcomes has significant advantages over existing models, and more comprehensively captures the progression of diabetes. It permits detailed and reliable lifetime simulations of key health outcomes in people with T2D, especially for Asian societies. The predicted event rates for complications by the T2DHoc model are slightly lower than most existing models, despite estimated rates in those models often being overshot. The results suggest that applying recently developed models to clinical practice should pay some attention to their intrinsic variations such as data source, operational definitions, time-span, complexity, and feasibility. Undoubtedly, our model derived from practical data shows a large promise to shrinkage the abovementioned gaps. However, more research on methods in selecting models by clinically usefulness index is needed.
Previous studies have pointed out that T2D models mainly developed using Western patients do not appropriately reflect the risks of CVD and renal disease in the Asian population [
34,
35]. It is reasonable to suspect that ethnicity, genes (ALDH2 deficiency), environmental factors (birth cohort effects: World Wars, PM 2.5 pollutants, food habitats), as well as healthcare systems are highly involved in the accuracy of a prediction model [
36]. Although the definitions of selected complications are different, the T2DHoc model shows better performances than the UKPDS Outcomes model or Framingham risk score when applying them to the Asian T2D population. Further studies to compare performances of current models developed in the Western population and ours in more Asian ethnicities such as Australian T2D patients are required.
The T2DHoc model has several advantages. First, it simultaneously takes many major complications, absorbed status (death), and their dynamic time relationship within a single analytic framework. Thus, information on complications is collected more comprehensively. Then, the dynamic relationships between age and HbA1c levels were established and incorporated into the model structure, allowing more flexibility for practical applications. Finally, the follow-up time in the current study is obviously longer than for other models developed from data collecting by clinical trials. The accuracy for complications that need more time to be observed, such as renal failure, should be largely improved.
Some limitations of the study should be recognized. The study mainly takes laboratory data at baseline rather than consequent medication change for the model development, which makes us not able to understand the influences of medication use on the probabilities of health state change. For example, patients who used cardiovascular prevention drugs (such as antiplatelet drugs, renin-angiotensin-aldosterone blockade, and beta-blocker) may change the probability of experiencing the first ASHD (heath state j) from baseline (health state i). Although adding information on medication usage may enhance the current model’s performance, medication use changes over time and is modified depending on the patient’s conditions, making our model more difficult to understand and practically apply. In addition, due to a long observed time, we could not rule out and quantify the influences of the T2D care improvements (new drugs) over time on our results.
Author Contributions
Conceptualization, M.-Y.L., Y.-W.C. and S.-J.H.; methodology, M.-Y.L., P.-H.W. and H.L.; validation, M.-Y.L., P.-H.W., Y.-W.C. and S.-J.H.; formal analysis, J.-S.L. and T.-Y.H.; resources, M.-Y.L., C.-C.H. and H.L.; data curation, J.-S.L., P.-H.W. and T.-Y.H.; writing—original draft preparation, M.-Y.L.; writing—review and editing, P.-H.W., C.-C.H. and H.L.; visualization, M.-Y.L., T.-Y.H. and Y.K.; supervision, S.-J.H., Y.K., C.-C.H. and H.L.; project administration, M.-Y.L. and H.L.; funding acquisition, H.L. All authors have read and agreed to the published version of the manuscript.
Funding
This study was partly supported by the Taiwan Ministry of Science and Technology (most: 105-2314-b-037-065-, 106-2314-b-002-253-, 107-2314-b-037-122- and 108-2314-b-037-110-), Kaohsiung Medical University Hospital (kmuh: 105-5r17 and 106-6r21), and Center for Big Data Research, Taiwan National Health Research Institutes (nhri-ex107 -10717pi and nhri-ex108-10505pi).
Institutional Review Board Statement
This study was approved by the institutional review boards of Kaohsiung Medical University Hospital (kmuhirb-e(i)-20160070), National Chengchi University (nccu-rec-201603-i005) and National Health Research Institutes (ec1050505-e). All study procedures were conducted by following the declaration of the Helsinki principle.
Informed Consent Statement
The ethical review boards waived patient consent because all data used in the study have been de-identified.
Data Availability Statement
The data used in our study were limited to research purposes only and cannot be made publicly available under the regulation of the personal information protection act in Taiwan. The raw data were obtained from the national health insurance administration, ministry of health and welfare
https://www.nhi.gov.tw/content_list.aspx?N=2d2faf5214807829&topn=787128dad5f71b1a) (accessed on 21 May 2021) and can be made available to qualified researchers upon request.
Acknowledgments
We would like to thank the team members, Ming-Huan Chan, Shyi-Jang Shin, Jer-Chia Tsai, Kun Der Lin, Yi-Ting Lin, Meng-Chuan Huang, Hui-Min Hsieh, Yi-Hsin Yang, Li-Jen Cheng, Sheng-Tai Huang, Teng-Hui Huang, and Shu-An Yang for providing their valuable opinions and devoting their efforts on our model development.
Conflicts of Interest
The authors declare no conflict of interest.
References
- International Diabetes Federation (IDF). In IDF Diabetes Atlas, 9th ed.; International Diabetes Federation: Brussels, Belgium, 2019.
- Hsieh, C.Y.; Su, C.C.; Shao, S.C.; Sung, S.F.; Lin, S.J.; Yang, Y.H.K.; Lai, E.C. Taiwan’s National Health Insurance Research Database: Past and future. Clin. Epidemiol. 2019, 11, 349–358. [Google Scholar] [CrossRef] [PubMed] [Green Version]
- Lin, L.Y.; Warren-Gash, C.; Smeeth, L.; Chen, P.C. Data resource profile: The National Health Insurance Research Database (NHIRD). Epidemiol. Health 2018, 40, e2018062. [Google Scholar] [CrossRef]
- Lee, P. 2017–2018 National Health Insurance Annual Report; National Health Insurance Administration, Ministry of Health and Welfare: Taipei, Taiwan, 2017. [Google Scholar]
- Lee, T.T.; Cheng, S.H.; Chen, C.C.; Lai, M.S. A pay-for-performance program for diabetes care in Taiwan: A preliminary assessment. Am. J. Manag. Care 2010, 16, 65–69. [Google Scholar]
- Zheng, Y.; Ley, S.H.; Hu, F.B. Global aetiology and epidemiology of type 2 diabetes mellitus and its complications. Nat. Rev. Endocrinol. 2018, 14, 88–98. [Google Scholar] [CrossRef]
- Wang, C.Y.; Tu, S.T.; Sheu, W.H.; Chen, I.C.; Chuang, L.M.; Wu, M.S.; Yu, C.J. National survey of ABC (A1C, blood pressure, cholesterol) of Diabetes Health Promotion Institutes in Taiwan: 2002–2018. J. Formos. Med. Assoc. 2018, 117, 952–954. [Google Scholar] [CrossRef] [PubMed]
- Zou, Q.; Qu, K.; Luo, Y.; Yin, D.; Ju, Y.; Tang, H. Predicting Diabetes Mellitus With Machine Learning Techniques. Front. Genet. 2018, 9, 515. [Google Scholar] [CrossRef] [PubMed]
- Cichosz, S.L.; Johansen, M.D.; Hejlesen, O. Toward Big Data Analytics: Review of Predictive Models in Management of Diabetes and Its Complications. J. Diabetes Sci. Technol. 2015, 10, 27–34. [Google Scholar] [CrossRef]
- Yap, M.H.; Chatwin, K.E.; Ng, C.C.; Abbott, C.A.; Bowling, F.L.; Rajbhandari, S.; Boulton, A.J.M.; Reeves, N.D. A New Mobile Application for Standardizing Diabetic Foot Images. J. Diabetes Sci. Technol. 2018, 12, 169–173. [Google Scholar] [CrossRef] [PubMed] [Green Version]
- Ellahham, S. Artificial Intelligence: The Future for Diabetes Care. Am. J. Med. 2020, 133, 895–900. [Google Scholar] [CrossRef] [PubMed]
- Clarke, P.M.; Gray, A.M.; Briggs, A.; Farmer, A.J.; Fenn, P.; Stevens, R.J.; Matthews, D.R.; Stratton, I.M.; Holman, R.R.; UK Prospective Diabetes Study (UKPDS) Group. A model to estimate the lifetime health outcomes of patients with type 2 diabetes: The United Kingdom Prospective Diabetes Study (UKPDS) Outcomes Model (UKPDS no. 68). Diabetologia 2004, 47, 1747–1759. [Google Scholar] [CrossRef] [Green Version]
- Shao, H.; Fonseca, V.; Stoecker, C.; Liu, S.; Shi, L. Novel Risk Engine for Diabetes Progression and Mortality in USA: Building, Relating, Assessing, and Validating Outcomes (BRAVO). Pharmacoeconomics 2018, 36, 1125–1134. [Google Scholar] [CrossRef] [PubMed]
- Mount Hood 4 Modeling Group. Computer modeling of diabetes and its complications: A report on the Fourth Mount Hood Challenge Meeting. Diabetes Care 2007, 30, 1638–1646. [Google Scholar] [CrossRef] [PubMed] [Green Version]
- Mt Hood Diabetes Challenge in Asia 2019, Seoul, Korea, 30 November–1 December 2019. Available online: https://www.mthooddiabeteschallenge.com/asiameeting (accessed on 10 January 2021).
- American Diabetes Association Consensus Panel. Guidelines for computer modeling of diabetes and its complications. Diabetes Care 2004, 27, 2262–2265. [Google Scholar] [CrossRef] [PubMed] [Green Version]
- Tappenden, P.; Chilcott, J.; Brennan, A.; Squires, H.; Stevenson, M. Whole disease modeling to inform resource allocation decisions in cancer: A methodological framework. Value Health 2012, 15, 1127–1136. [Google Scholar] [CrossRef] [PubMed] [Green Version]
- Esensoy, A.V.; Carter, M.W. Health system modelling for policy development and evaluation: Using qualitative methods to capture the whole-system perspective. Oper. Res. Health Care 2015, 4, 15–26. [Google Scholar] [CrossRef]
- Lind, M.; Oden, A.; Fahlen, M.; Eliasson, B. The true value of HbA1c as a predictor of diabetic complications: Simulations of HbA1c variables. PLoS ONE 2009, 4, e4412. [Google Scholar] [CrossRef]
- Coyle, D.; Lee, K.M.; O’Brien, B.J. The role of models within economic analysis: Focus on type 2 diabetes mellitus. Pharmacoeconomics 2002, 20 (Suppl. 1), 11–19. [Google Scholar] [CrossRef] [PubMed]
- Allalou, A.; Nalla, A.; Prentice, K.J.; Liu, Y.; Zhang, M.; Dai, F.F.; Ning, X.; Osborne, L.R.; Cox, B.J.; Gunderson, E.P.; et al. A Predictive Metabolic Signature for the Transition From Gestational Diabetes Mellitus to Type 2 Diabetes. Diabetes 2016, 65, 2529–2539. [Google Scholar] [CrossRef] [Green Version]
- Tarride, J.E.; Hopkins, R.; Blackhouse, G.; Bowen, J.M.; Bischof, M.; Von Keyserlingk, C.; O’Reilly, D.; Xie, F.; Goeree, R. A review of methods used in long-term cost-effectiveness models of diabetes mellitus treatment. Pharmacoeconomics 2010, 28, 255–277. [Google Scholar] [CrossRef]
- Yi, Y.; Philips, Z.; Bergman, G.; Burslem, K. Economic models in type 2 diabetes. Curr. Med. Res. Opin. 2010, 26, 2105–2118. [Google Scholar] [CrossRef]
- CDC Diabetes Cost-effectiveness Group. Cost-effectiveness of intensive glycemic control, intensified hypertension control, and serum cholesterol level reduction for type 2 diabetes. JAMA 2002, 287, 2542–2551. [Google Scholar] [CrossRef] [Green Version]
- Wolbers, M.; Koller, M.T.; Witteman, J.C.; Steyerberg, E.W. Prognostic models with competing risks: Methods and application to coronary risk prediction. Epidemiology 2009, 20, 555–561. [Google Scholar] [CrossRef]
- Soikkeli, F.; Hashim, M.; Ouwens, M.; Postma, M.; Heeg, B. Extrapolating Survival Data Using Historical Trial-Based a Priori Distributions. Value Health 2019, 22, 1012–1017. [Google Scholar] [CrossRef] [Green Version]
- Grossetti, F.; Ieva, F.; Paganoni, A.M. A multi-state approach to patients affected by chronic heart failure: The value added by administrative data. Health Care Manag. Sci. 2018, 21, 281–291. [Google Scholar] [CrossRef]
- Schafer, J.L. Multiple imputation: A primer. Stat. Methods Med. Res. 1999, 8, 3–15. [Google Scholar] [CrossRef] [PubMed]
- Marshall, D.A.; Burgos-Liz, L.; IJzerman, M.J.; Crown, W.; Padula, W.V.; Wong, P.K.; Pasupathy, K.S.; Higashi, M.K.; Osgood, N.D.; the ISPOR Emerging Good Practices Task Force. Selecting a dynamic simulation modeling method for health care delivery research-part 2: Report of the ISPOR Dynamic Simulation Modeling Emerging Good Practices Task Force. Value Health 2015, 18, 147–160. [Google Scholar] [CrossRef] [Green Version]
- Karnon, J.; Stahl, J.; Brennan, A.; Caro, J.J.; Mar, J.; Moller, J. Modeling using discrete event simulation: A report of the ISPOR-SMDM Modeling Good Research Practices Task Force-4. Med. Decis. Mak. 2012, 32, 701–711. [Google Scholar] [CrossRef] [Green Version]
- Tanaka, S.; Tanaka, S.; Iimuro, S.; Yamashita, H.; Katayama, S.; Akanuma, Y.; Yamada, N.; Araki, A.; Ito, H.; Sone, H.; et al. Predicting macro- and microvascular complications in type 2 diabetes: The Japan Diabetes Complications Study/the Japanese Elderly Diabetes Intervention Trial risk engine. Diabetes Care 2013, 36, 1193–1199. [Google Scholar] [CrossRef] [PubMed] [Green Version]
- Koo, B.K.; Oh, S.; Kim, Y.J.; Moon, M.K. Prediction of coronary heart disease risk in Korean patients with diabetes mellitus. J. Lipid Atheroscler. 2018, 7, 110. [Google Scholar] [CrossRef]
- Hong Kong Diabetes Registry; Yang, X.; So, W.Y.; Tong, P.C.; Ma, R.C.; Kong, A.P.; Lam, C.W.; Ho, C.S.; Cockram, C.S.; Ko, G.T.; et al. Development and validation of an all-cause mortality risk score in type 2 diabetes. Arch. Intern. Med. 2008, 168, 451–457. [Google Scholar] [CrossRef] [PubMed] [Green Version]
- Yang, X.; So, W.-Y.; Kong, A.P.; Ma, R.C.; Ko, G.T.; Ho, C.-S.; Lam, C.W.; Cockram, C.S.; Chan, J.C.; Tong, P.C. Development and validation of a total coronary heart disease risk score in type 2 diabetes mellitus. Am. J. Cardiol. 2008, 101, 596–601. [Google Scholar] [CrossRef] [PubMed]
- Yang, X.; So, W.; Kong, A.; Clarke, P.; Ho, C.; Lam, C.; Ng, M.; Lyu, R.; Yin, D.; Chow, C. End-stage renal disease risk equations for Hong Kong Chinese patients with type 2 diabetes: Hong Kong Diabetes Registry. Diabetologia 2006, 49, 2299–2308. [Google Scholar] [CrossRef] [PubMed] [Green Version]
- Ma, R.C.; Chan, J.C. Type 2 diabetes in East Asians: Similarities and differences with populations in Europe and the United States. Ann. N. Y. Acad. Sci. 2013, 1281, 64. [Google Scholar] [CrossRef] [PubMed] [Green Version]
Figure 1.
Logic structure of a prediction model. Abbreviation: T2D, type 2 diabetes; ASHD, arteriosclerotic heart disease; CHF, chronic heart failure; EYE, retinopathy; FESRD, first-time renal failure; FIN_FOOT, amputation; ISC, ischemic stroke.
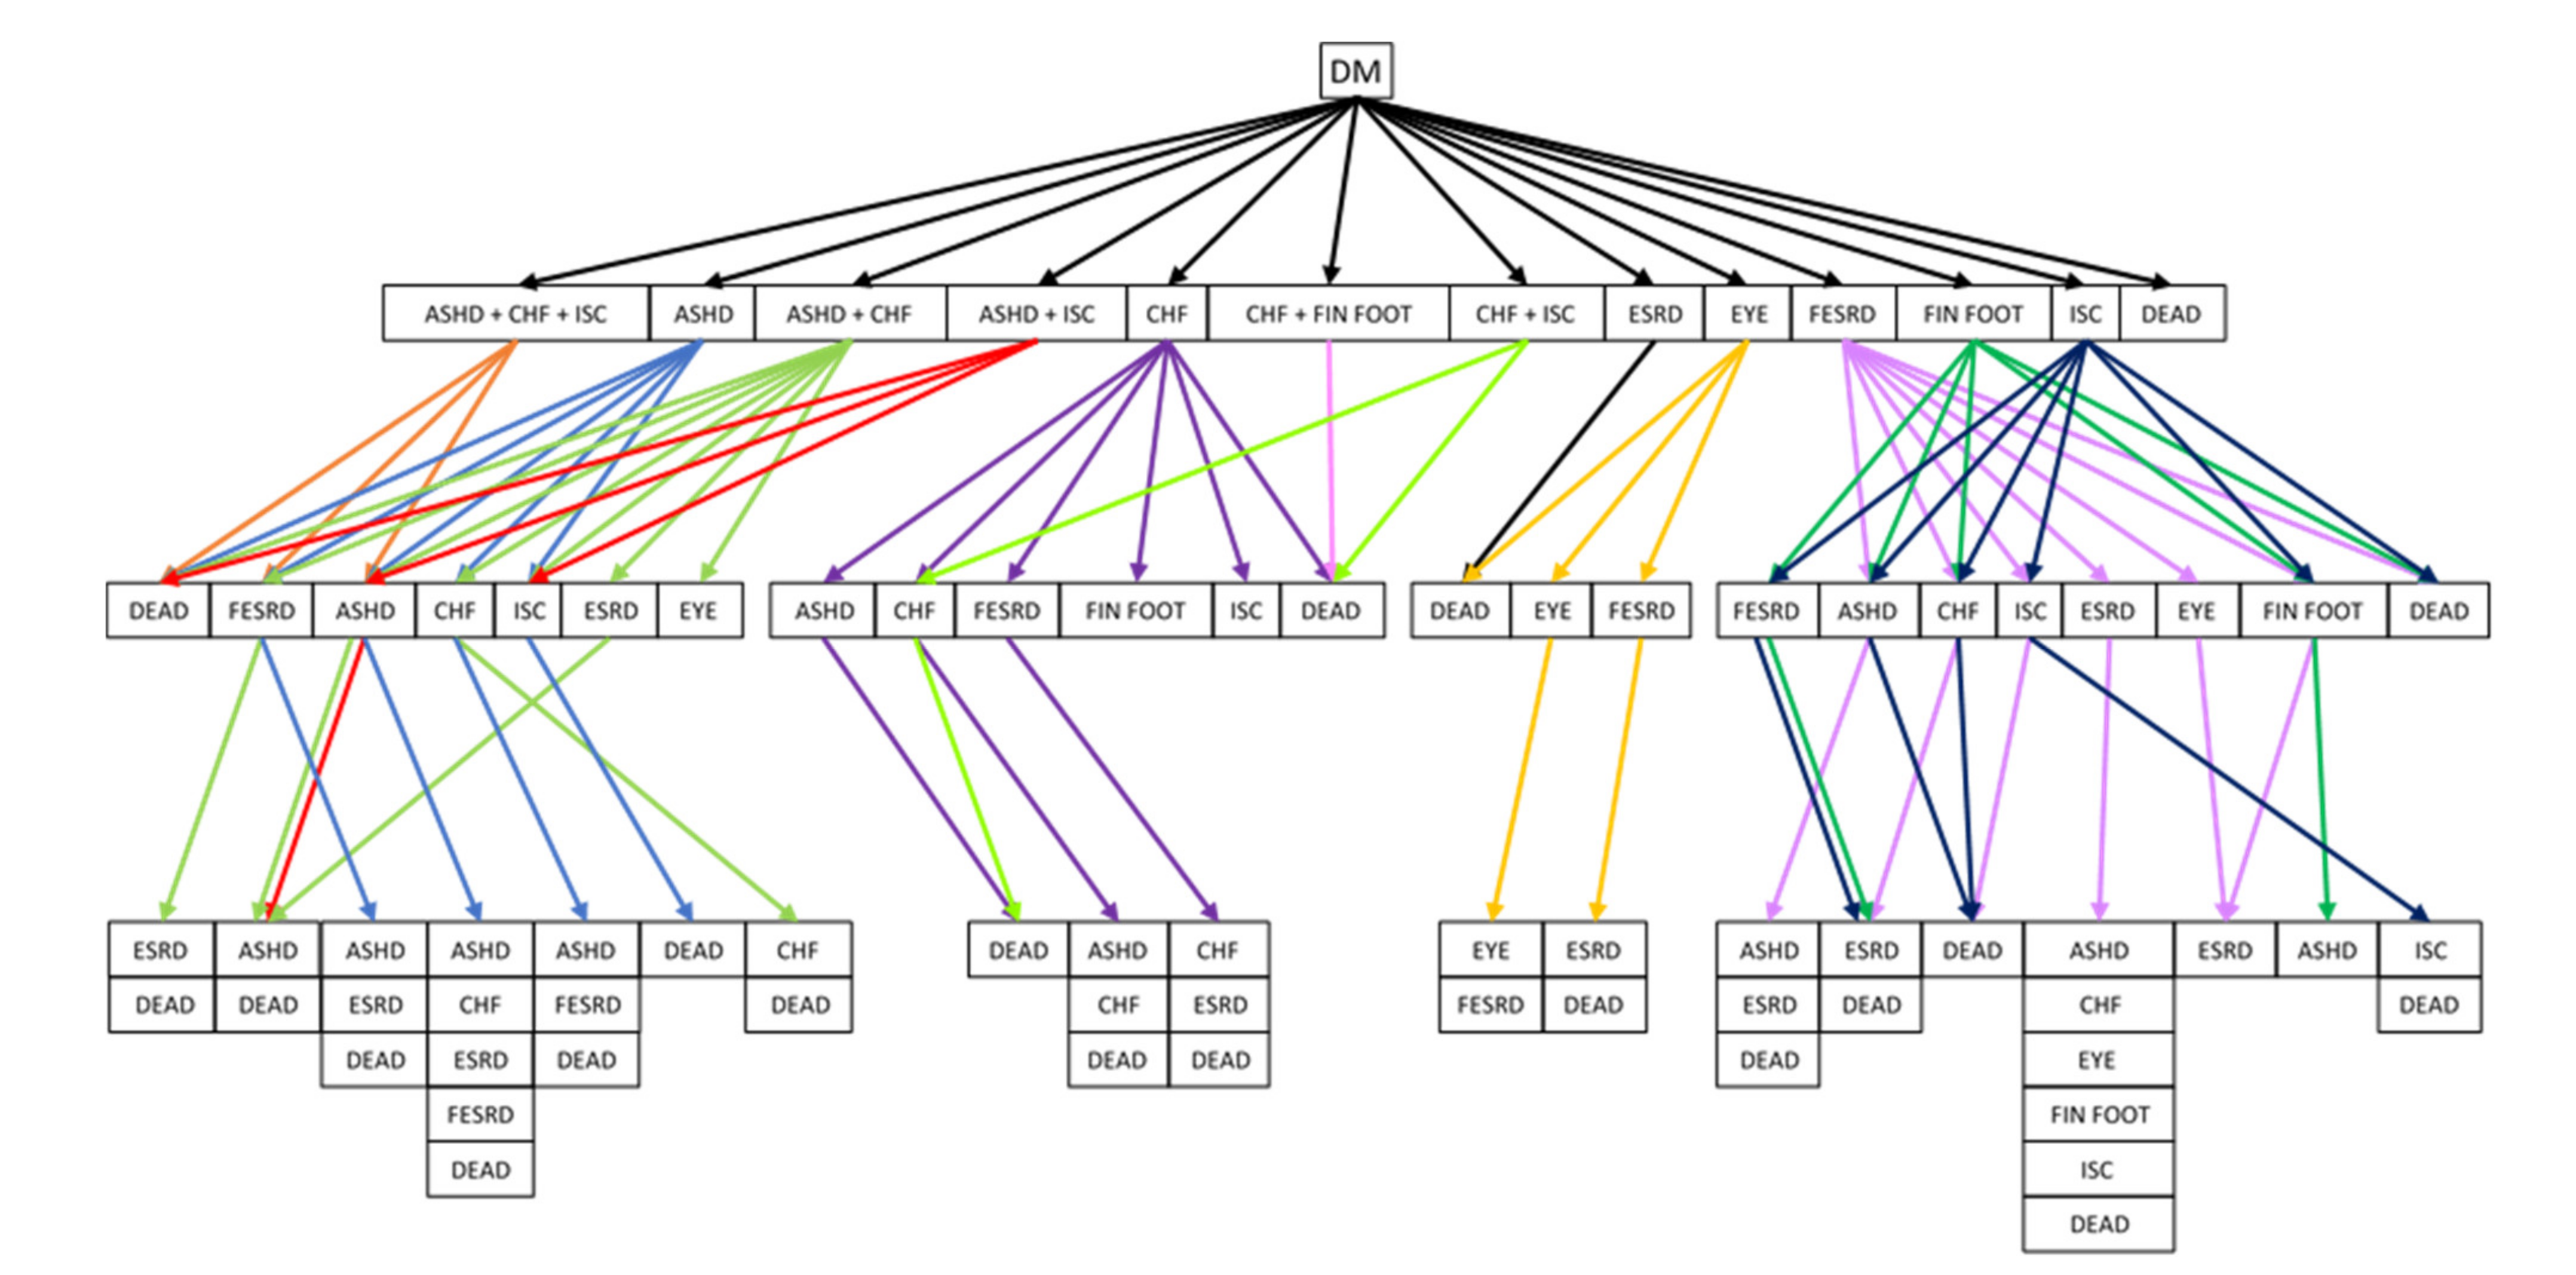
Figure 2.
A tree structure of diabetes mellitus complications. Abbreviation: DM, diabetes mellitus; ASHD, arteriosclerotic heart disease; CHF, chronic heart failure; EYE, retinopathy; FESRD, first-time renal failure; FIN_FOOT, amputation; ISC, ischemic stroke.
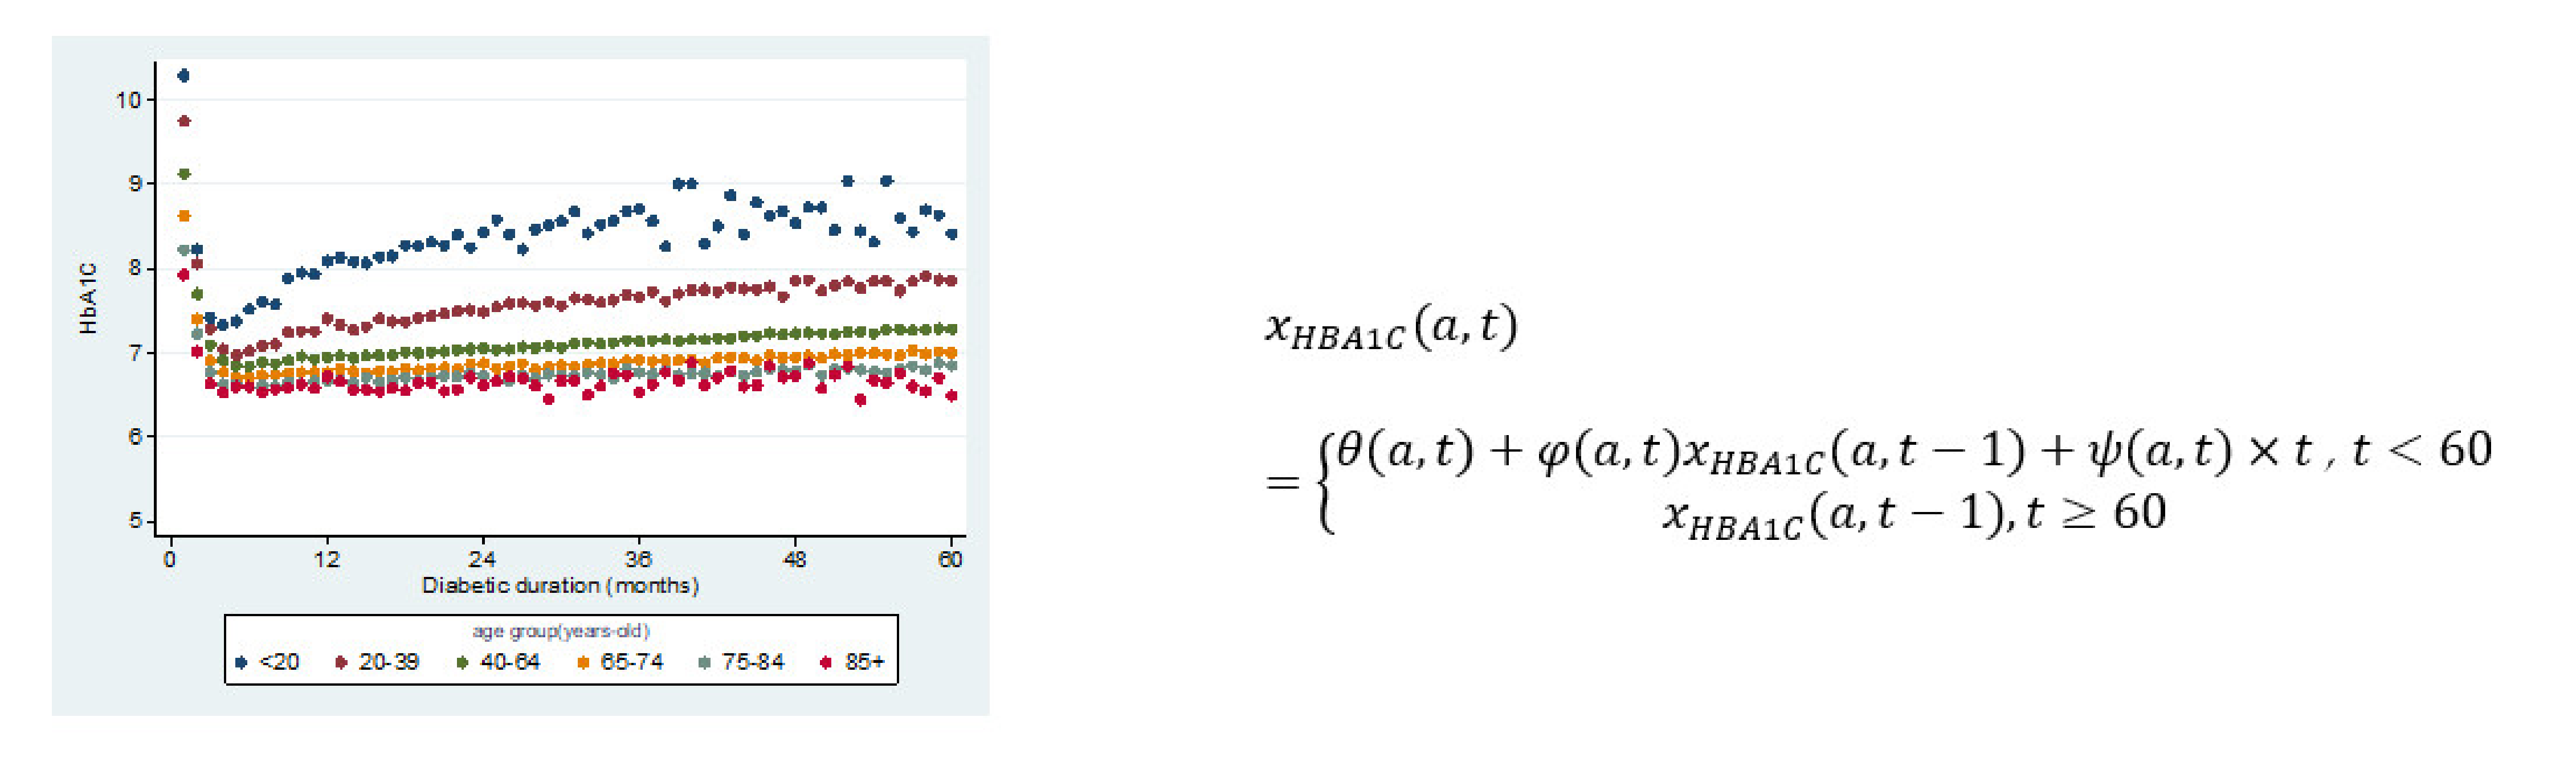
Figure 3.
HbA1c values change with respect to time at different ages where the HbA1c value is a function of age ‘a’ and duration ‘t’, where are coefficients of this regression function.
Figure 4.
Flowchart of nonhomogeneous Markovian simulation for diabetes mellitus complications.
Figure 5.
Process of identifying eligible patients’ pathways in analysis. Abbreviation: T2D, type 2 diabetes mellitus.
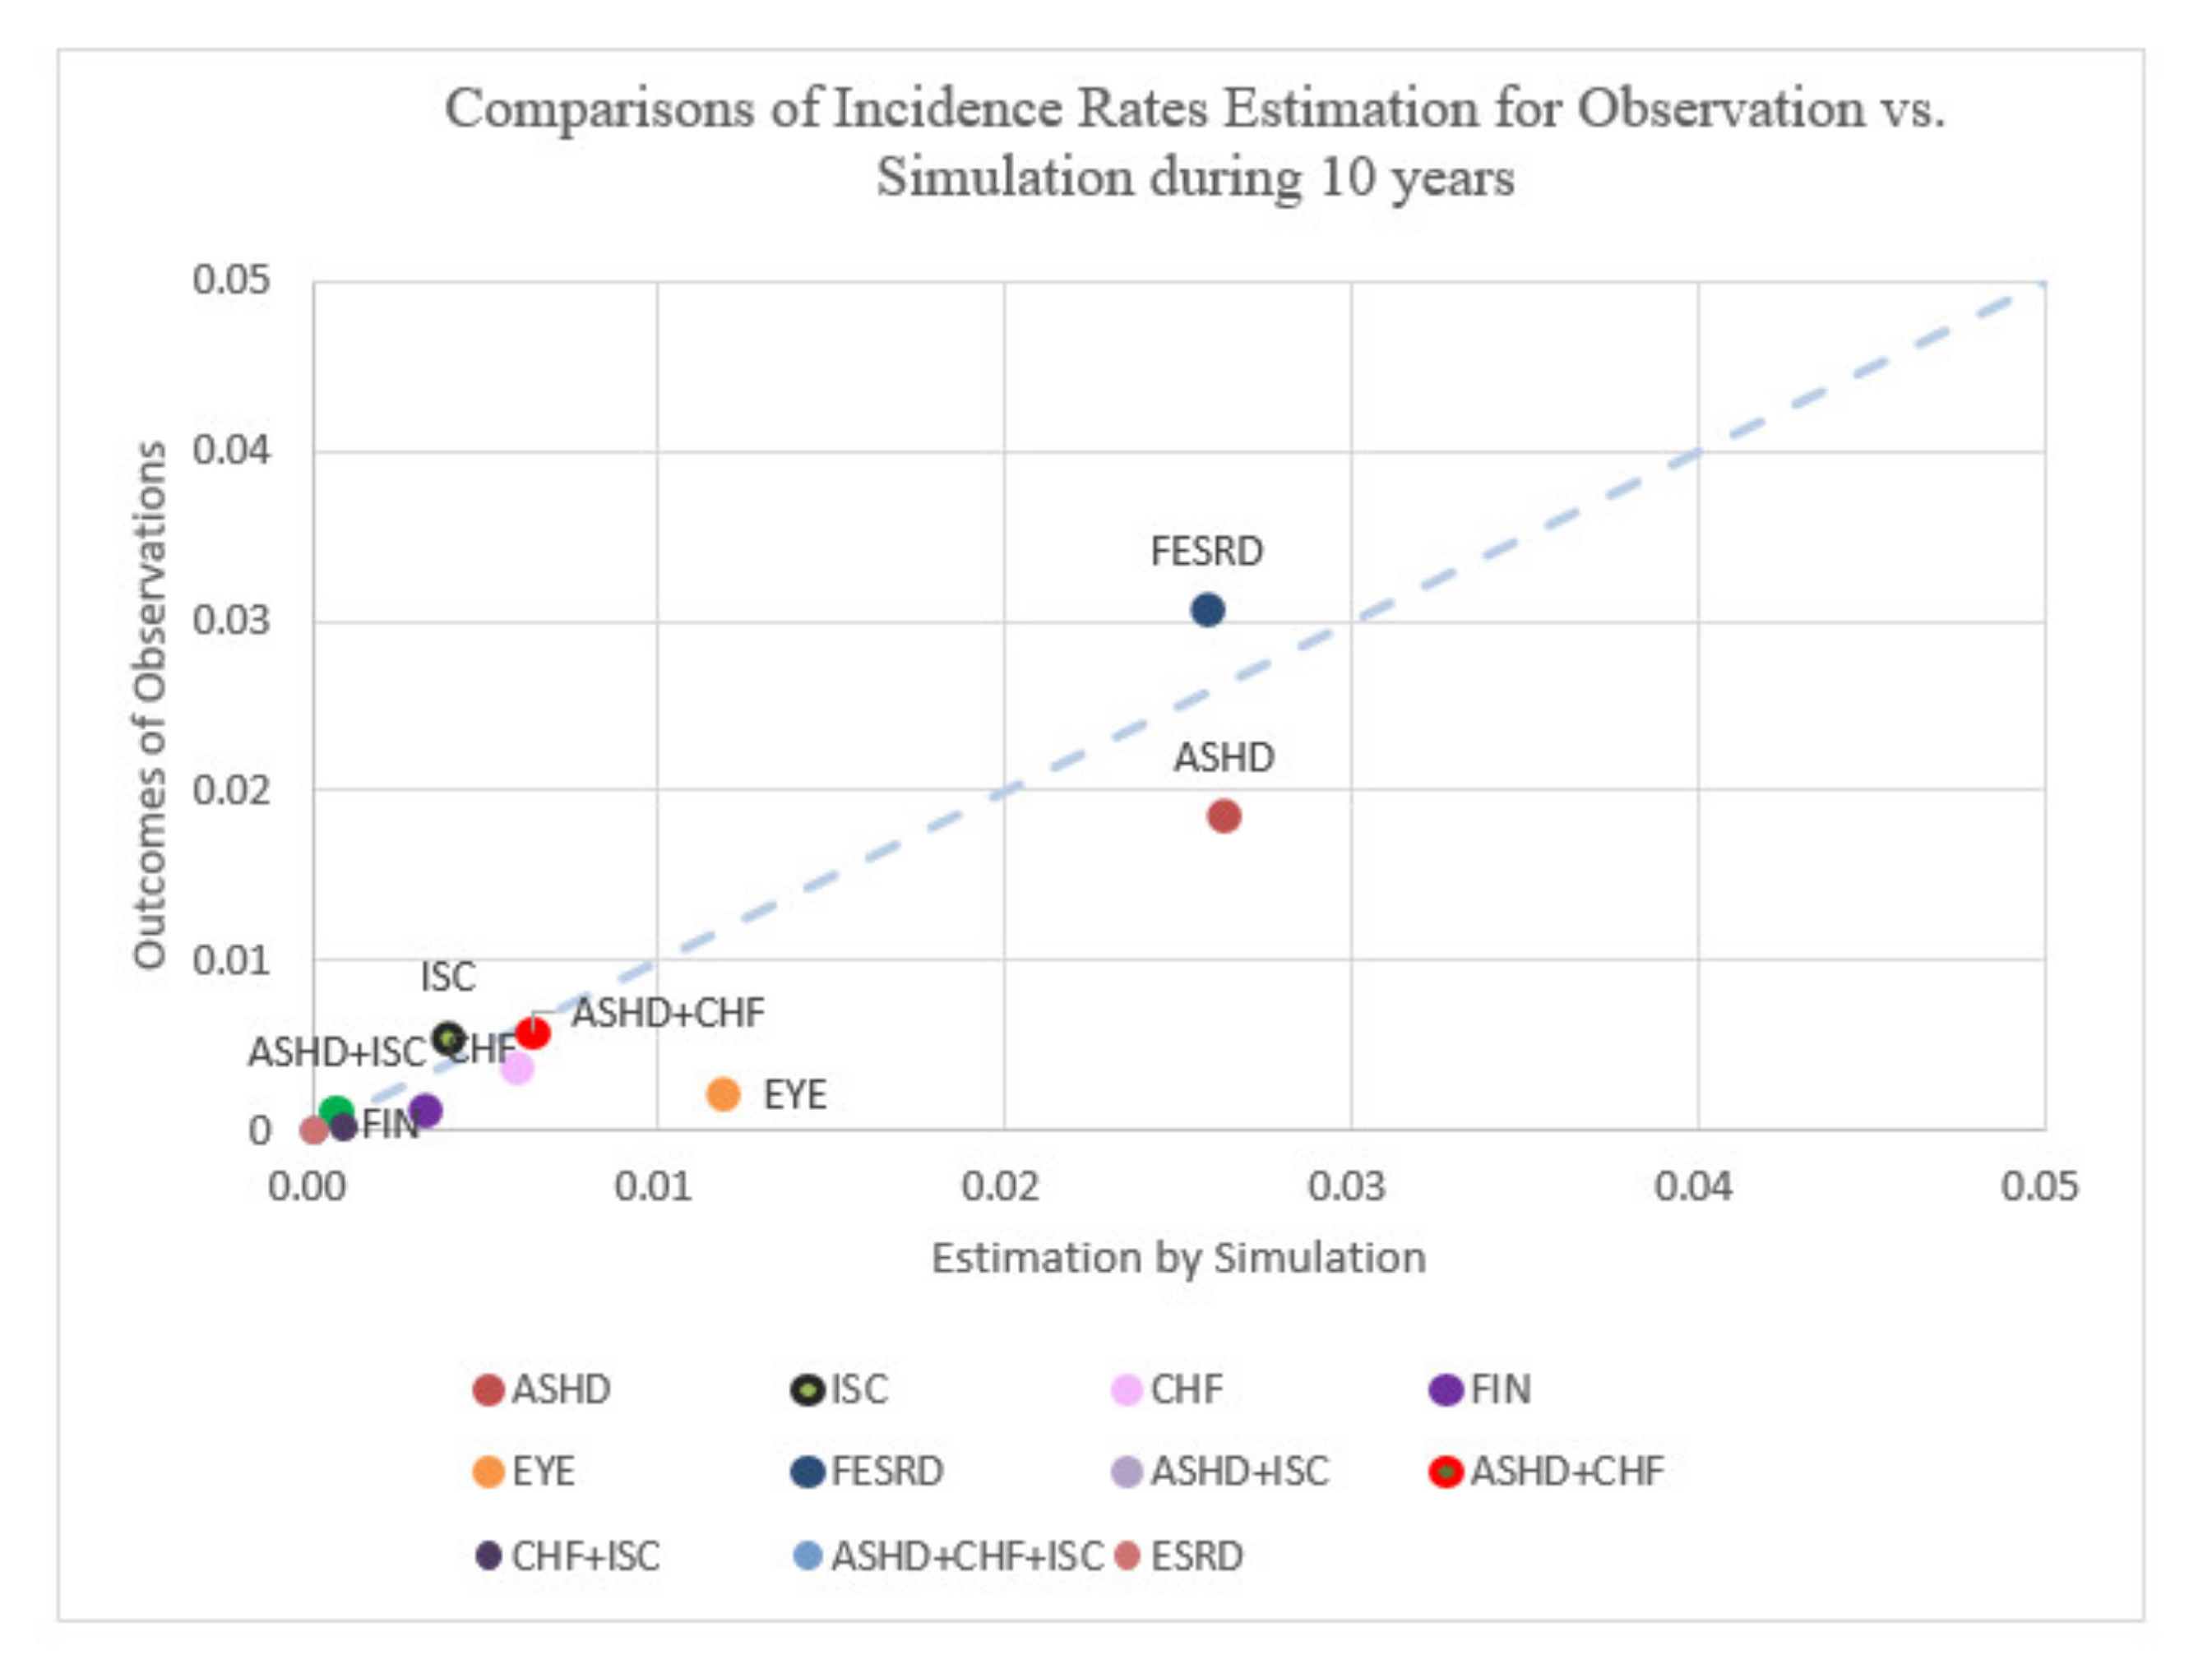
Figure 6.
Comparisons of incidence rates estimation for observation vs. simulation over the course of 10 years.
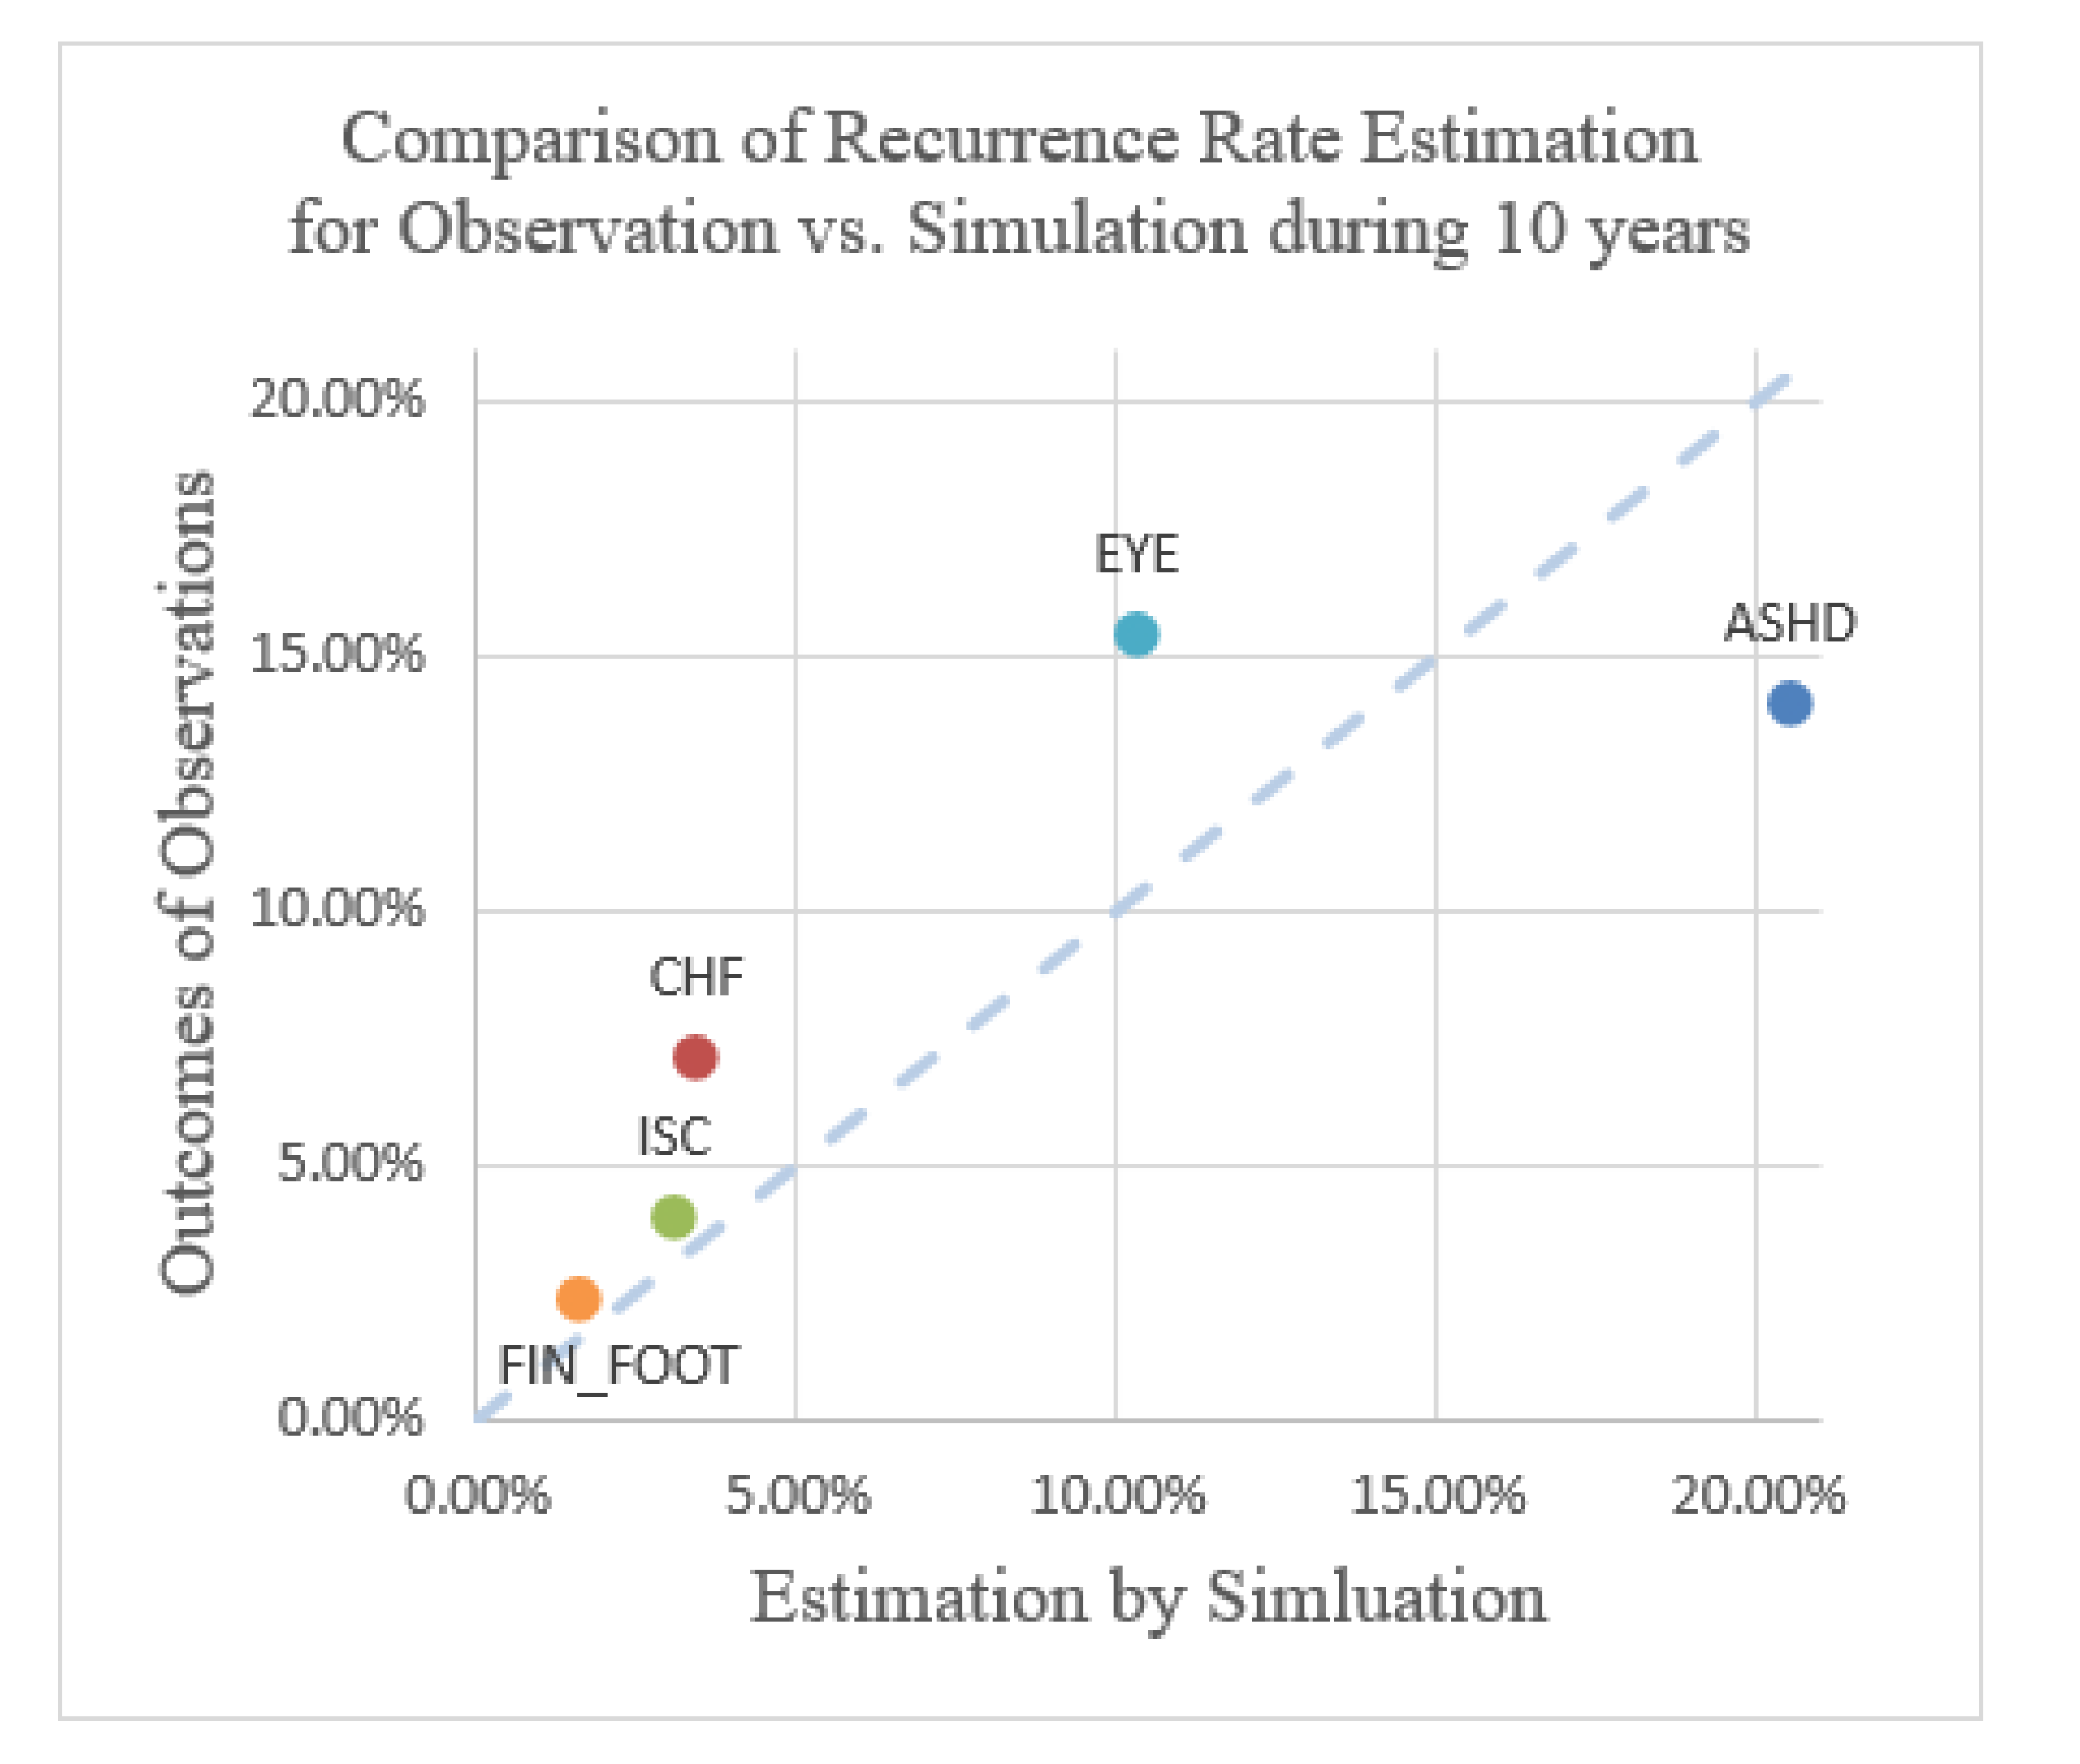
Figure 7.
Comparison of recurrence rate estimation for observation vs. simulation over the course of 10 years.
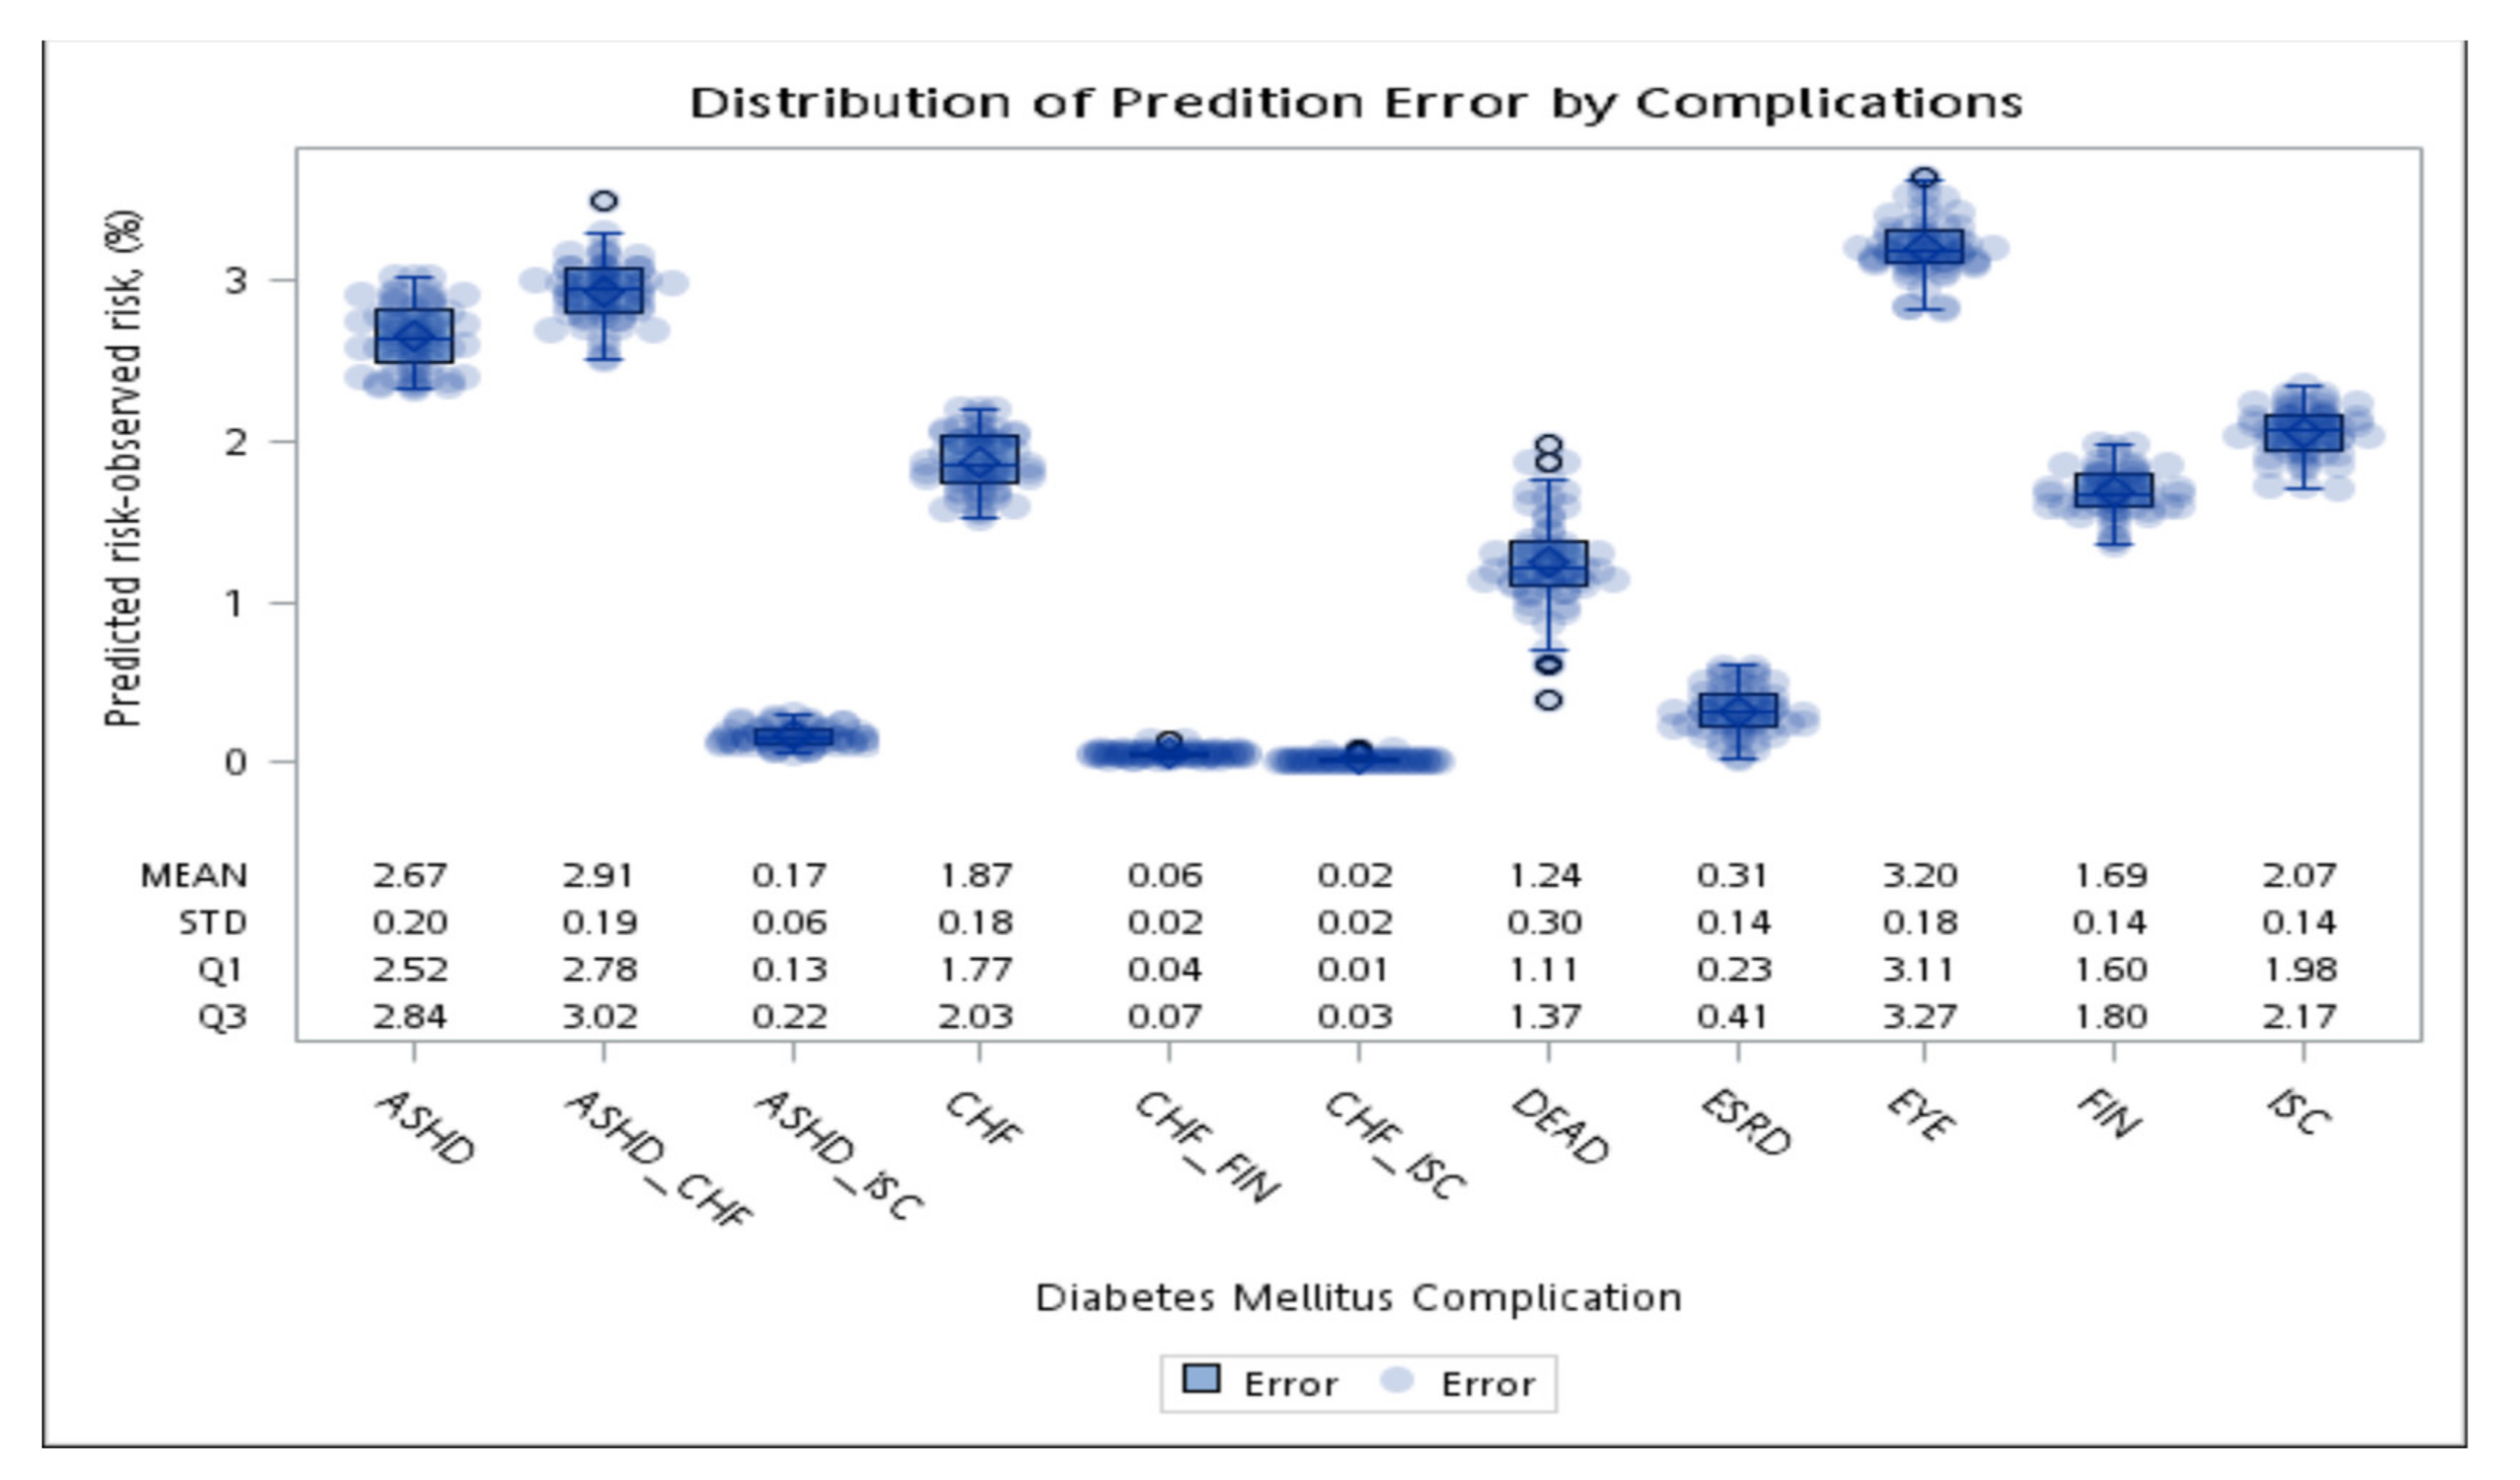
Figure 8.
The average absolute error of the first event (complication or death) after diabetes diagnosis between the simulation and observations in 10 years.
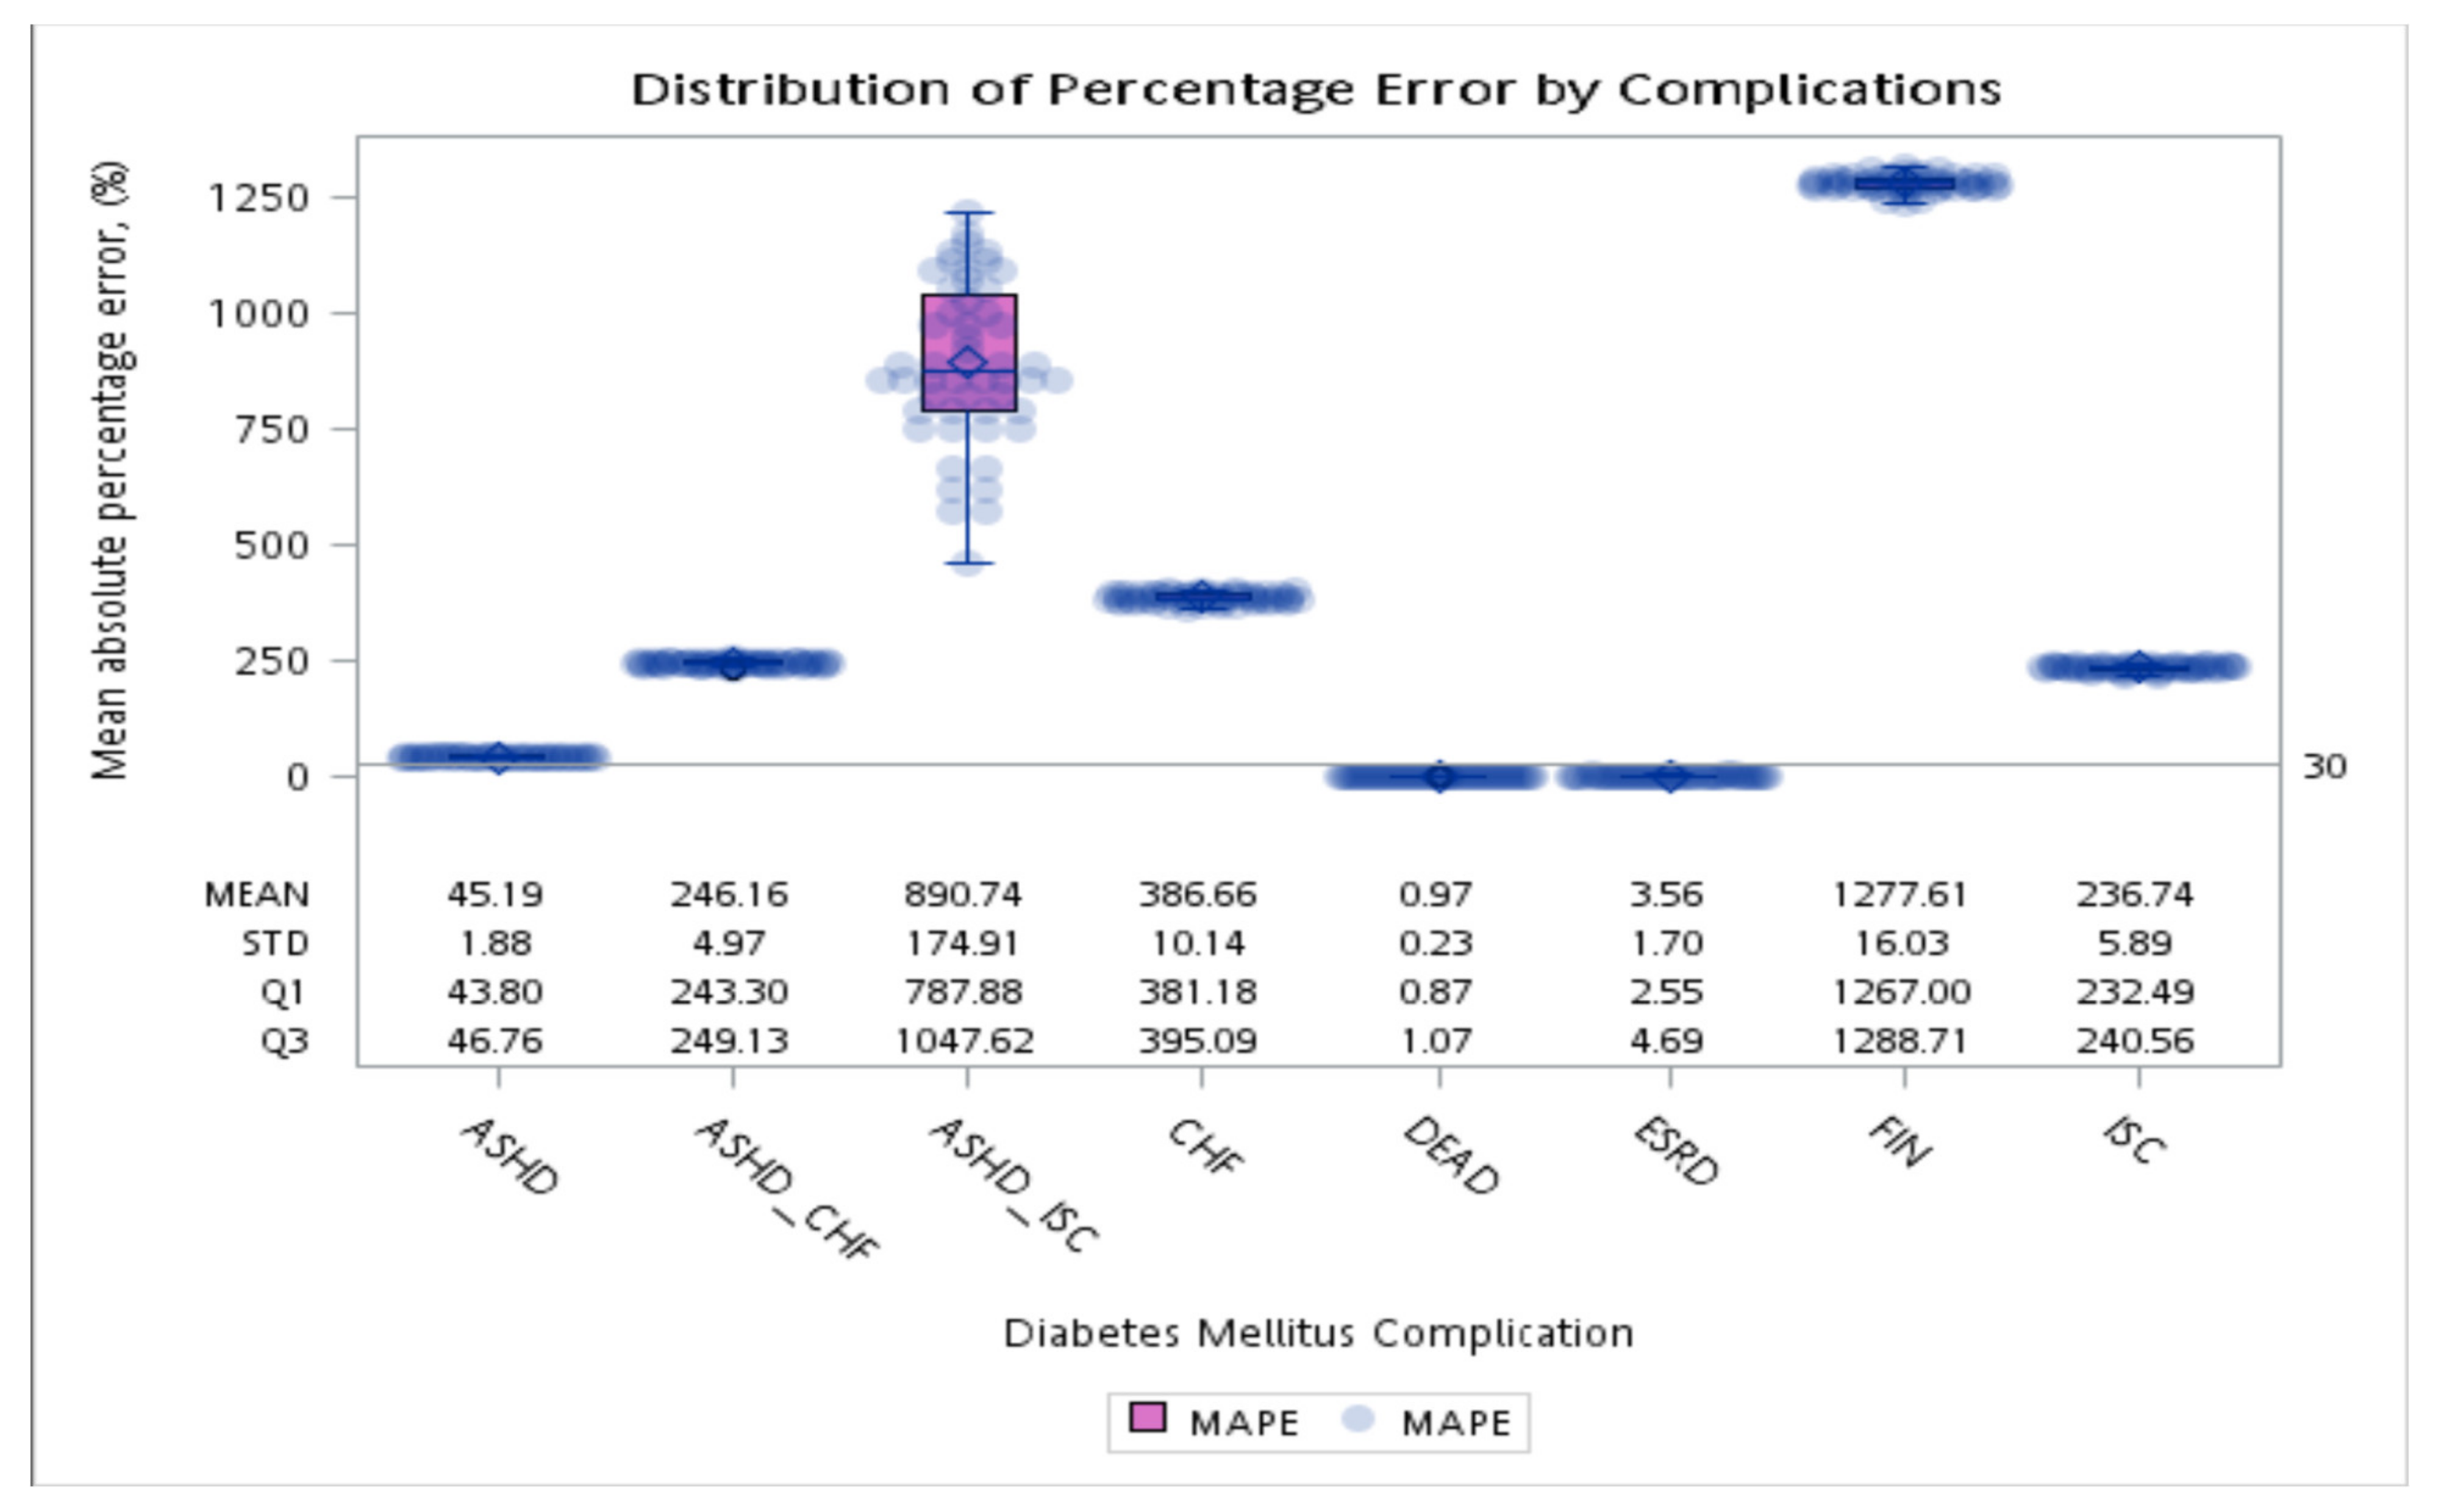
Figure 9.
Average absolute percentage error of the first event (complication or death) after diabetes diagnosis between the simulation and observations in 10 years.
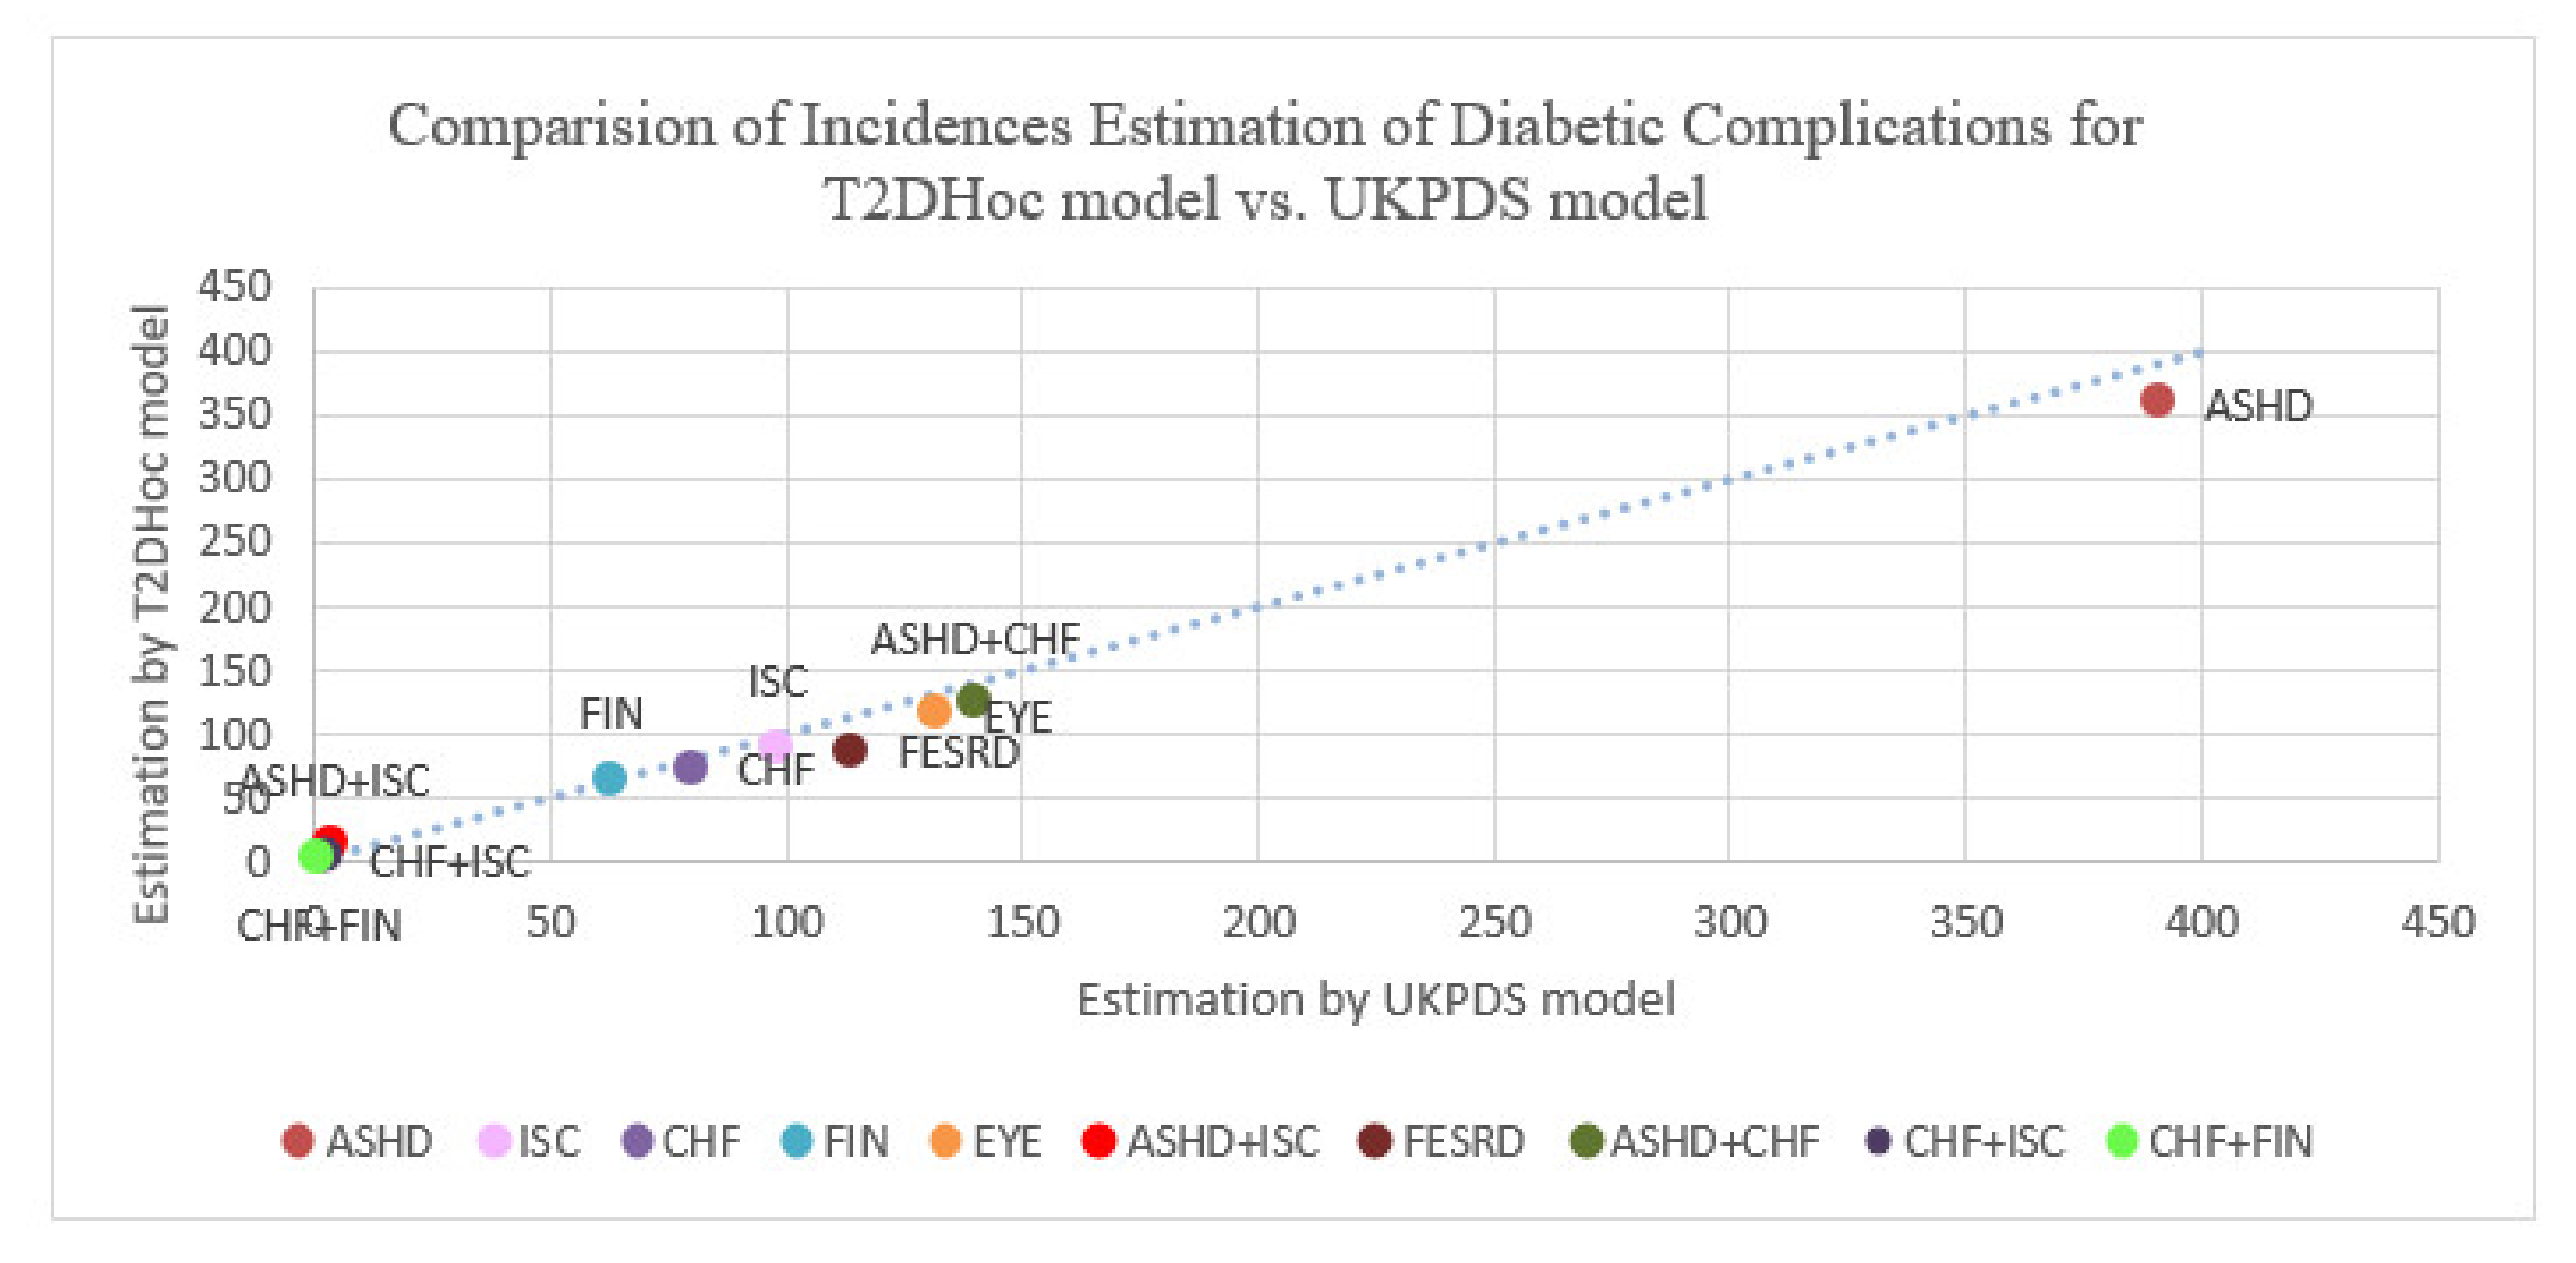
Figure 10.
Comparison of incidence rates estimation of diabetic complications for UKPDS vs. T2DHoc models with 3867 hypothetical patients in 10 years. Abbreviation: ASHD, arteriosclerotic heart disease; CHF, chronic heart failure; T2D, type 2 diabetes mellitus; EYE, retinopathy; FESRD, first-time renal failure; FIN_FOOT, amputation; ISC, ischemic stroke.
Table 1.
The baseline of the new diagnosis of diabetic subjects in the program of diabetic pay for performance in 2002–2016. Data represented as mean and SD, and count and proportion for continuous and categorical variables, respectively.
| Cohort | 2002–2007 | 2008–2010 | 2011–2014 | 2015–2016 | p Value |
|---|
| n | 48,026 | 18,369 | 54,250 | 42,807 | <0.001 |
| Age, mean (sd) | 55.3 (13.1) | 54.9 (13.3) | 55 (13.6) | 54.9 (13.6) | <0.001 |
| 00–19, n (%) | 375 (0.8) | 206 (1.1) | 707 (1.3) | 471 (1.1) | 0.02 |
| 20–39, n (%) | 4587 (9.6) | 1892 (10.3) | 5978 (11.0) | 5109 (11.9) | 0.03 |
| 40–64, n (%) | 31,003 (64.6) | 12,209 (66.5) | 35,359 (65.2) | 27,164 (63.5) | 0.019 |
| 65–74, n (%) | 8441 (17.6) | 2730 (14.9) | 8162 (15.0) | 7036 (16.4) | 0.03 |
| 75+, n (%) | 3573 (7.4) | 1315 (7.2) | 4008 (7.4) | 2988 (7.0) | 0.007 |
| Male, n (%) | 26,469 (55.1) | 10,027 (54.6) | 30,111 (55.5) | 24,127 (56.4) | 0.012 |
| Female, n (%) | 21,510 (44.8) | 8325 (45.3) | 24,103 (44.4) | 18,641 (43.5) | 0.012 |
| HbA1c % | 8.0 (20) | 7.8 (1.9) | 7.8 (2.0) | 7.7 (1.9) | <0.001 |
| SBP mmHg | 132.1 (19.1) | 130.8 (17.7) | 130.6 (17.1) | 131.1 (17.1) | <0.001 |
| DBP mmHg | 80.7 (13.1) | 79.6 (13.3) | 79.5 (15) | 79.3 (13.9) | <0.001 |
| Height, cm | 161.2 (8.8) | 161.8 (9.1) | 162.3 (9.3) | 162.5 (9.5) | <0.001 |
| Weight, Kg | 68.3 (13.5) | 69.4 (14.3) | 70.2 (15.4) | 70.5 (15.6) | <0.001 |
| BMI | 26.2 (4.3) | 26.4 (4.4) | 26.5 (4.7) | 26.5 (4.6) | <0.001 |
| Pulse (time) | 79.9 (14.8) | 80.5 (12.2) | 81.1 (12.4) | 81.8 (12.8) | <0.001 |
| Laboratory data | | | | | |
| LDL, mg/dL | 121.7 (98.8) | 115 (36.6) | 114.3 (37.5) | 113.8 (38.5) | <0.001 |
| BUN, mg/dL | 20.7 (24.8) | 14.9 (4.6) | 16.1 (6.6) | 14.4 (5.1) | <0.001 |
| HDL, mg/dL | 45.7 (12.8) | 46.8 (12.5) | 45.7 (12.1) | 44.9 (11.7) | 0.02 |
| Urine acid, mg/dL | 5.8 (1.8) | 5.8 (1.7) | 5.7 (1.6) | 5.6 (1.8) | <0.001 |
| Creatinine, mg/dL | 1.0 (0.5) | 0.9 (0.4) | 0.9 (0.4) | 0.9 (0.4) | <0.001 |
| Albumin, g/dL | 3.8 (1.6) | 4.4 (0.6) | 4.5 (4.9) | 5.1 (5.3) | <0.001 |
| Total cholesterol, mg/dL | 198.8 (48.2) | 188.1 (43.2) | 186.3 (45.5) | 186.6 (47.1) | <0.001 |
| Triglyceride, mg/dL | 178 (140.3) | 166.3 (126.7) | 171.4 (138) | 174.8 (143.3) | 0.009 |
| Urine | | | | | |
| microalbumin, mg/dL | 53.1 (216.2) | 48.2 (208.8) | 55.1 (234.3) | 59.4 (245.5) | <0.001 |
| >30, n (%) | 3205 (6.7) | 1623 (8.8) | 6845 (12.6) | 6990 (16.3) | 0.12 |
| >300 n (%), | 462 (1.0) | 240 (1.3) | 1021 (1.9) | 1093 (2.6) | 0.047 |
| >3000, n (%) | 15 (0.0) | 5 (0.0) | 42 (0.1) | 46 (0.1) | 0.012 |
| Urine protein, >0.05 g/24 h, | 6313 (13.1) | 2362 (12.9) | 7129 (13.1) | 1196 (2.8) | 0.15 |
| Urine protein >1 g/24 h, n (%) | 802 (1.7) | 505 (2.7) | 1908 (3.5) | 155 (0.4) | 0.09 |
| Urine protein >10 g/24 h, | 354 (0.7) | 131 (0.7) | 711 (1.3) | 75 (0.2) | 0.05 |
| Urine protein in g/24 h, mean (sd) | 34.7 (89.8) | 22.2 (107.3) | 37.9 (256.8) | 20.2 (63.8) | 0.014 |
Table 2.
General characteristics of T2D patients in NHIRD of Taiwan.
| Regression Model Coefficients | Mean | Standard Deviation | Definitions/Values |
|---|
| AGE | 55.05 | 13.4 | Age in years at diagnosis of diabetes |
| Male | (1,0) | X | 1 for male; 0 for female |
| e_ht | (1,0) | X | 1 for history of Hypertension; 0 otherwise |
| e_cva | (1,0) | X | 1 for a history of Stroke; 0 otherwise |
| e_chf | (1,0) | X | 1 for a history of Congestive Heart Failure; 0 otherwise |
| e_ashd | (1,0) | X | 1 for a history of Arteriosclerotic Heart Disease; 0 otherwise |
| HBA1C | 7.84 | 1.99 | HbA1c (%), 5-year moving average of monthly values |
| Base_SBP | 126.1 | 31.1 | Systolic blood pressure at diabetes diagnosis (mm Hg) |
| BMI | 26.4 | 4.4 | Body mass index at diabetes diagnosis (m/kg2) |
| BLDL | 116 | 36.9 | Low-density lipoprotein at diabetes diagnosis (mg/dL) |
| BHDL | 44.8 | 13.87 | High-density lipoprotein at diabetes diagnosis (mg/dL) |
| BCHOL_T | 191 | 53 | Total cholesterol at diabetes diagnosis (mg/dL) |
| BTG | 174 | 139 | Triglycerides at diabetes diagnosis (mg/dL) |
| BCREAT | 0.9 | 0.46 | Serum creatinine at diabetes diagnosis (mg/dL) |
| UMICRO | 50.1 | 377 | Urine microalbumin diabetes diagnosis (mg/dL). |
Table 3.
Incidence proportion of study complications in the patients with type 2 diabetes mellitus within 15 years.
| ASHD | FESRD | CHF | ISC | EYE | FIN_FOOT |
|---|
| 16.5% | 18.1% | 6.8% | 4.5% | 2.0% | 1.0% |
Table 4.
The recurrence proportion of study complications in type 2 diabetes mellitus within 15 years.
| RE_ASHD | RE_CHF | RE_ISC |
|---|
| 14.1% | 7.1% | 4.0% |
Table 5.
Incidences of first layer complications or death in type 2 diabetes mellitus over 5 years.
| First Layer after DM | | | | |
|---|
| Complication | ASHD | CHF | ISC | FESRD | EYE |
| Observations | 1363 | 308 | 415 | 2073 | 218 |
| Complication | FIN_FOOT | ASHD + CHF | ASHD + ISC | CHF + ISC | ASHD + CHF + ISC |
| Observations | 96 | 410 | 69 | 20 | 14 |
| Complication | FESRD | CHF + FIN | DEATH | Observations: 12,242 |
| Observations | 9 | 3 | 7241 | | |
Table 6.
Re-occurrences of study complications or death in type 2 diabetes mellitus over 5 years.
| Second Layer after DM | | | | |
|---|
| Complication | ASHD | CHF | ISC | FESRD | EYE |
| Observations | 315 | 100 | 41 | 131 | 46 |
| Complication | FIN_FOOT | FESRD | DEATH | Observations: 2821 |
| Observations | 14 | 1036 | 1128 |
Table 7.
Simulation results versus observations for study complication in type 2 diabetes mellitus over 5 years.
| Complication | ASHD | CHF | ISC | FESRD | EYE | DM + Unclassified |
|---|
| Estimation by Simulation | 1940 | 391 | 364 | 1199 | 646 | 60 |
| Observation | 1363 | 308 | 415 | 2073 | 218 | 118 |
| Complication | FIN_FOOT | ASHD+CHF | DEATH | | | |
| Estimation by Simulation | 109 | 491 | 7033 | 12,233 hypothetic patients in a 5-year simulation |
| Observation | 96 | 410 | 7241 | 12,242 patients in observation in 5 years |
| Publisher’s Note: MDPI stays neutral with regard to jurisdictional claims in published maps and institutional affiliations. |
© 2021 by the authors. Licensee MDPI, Basel, Switzerland. This article is an open access article distributed under the terms and conditions of the Creative Commons Attribution (CC BY) license (https://creativecommons.org/licenses/by/4.0/).


 ,
, 


