
Detecting Cyber Attacks in Smart Grids Using Semi-Supervised Anomaly Detection and Deep Representation Learning


1
Department of Computer Science and Engineering, New Mexico Institute of Mining and Technology, Socorro, NM 87801, USA
2
Department of Computer Science, Prairie A&M University, Prairie, TX 77446, USA
*
Author to whom correspondence should be addressed.
Information 2021, 12(8), 328; https://0-doi-org.brum.beds.ac.uk/10.3390/info12080328
Submission received: 25 June 2021
/
Revised: 3 August 2021
/
Accepted: 13 August 2021
/
Published: 15 August 2021
(This article belongs to the Special Issue Information Technology: New Generations (ITNG 2020 & 2021))
Abstract
:Smart grids integrate advanced information and communication technologies (ICTs) into traditional power grids for more efficient and resilient power delivery and management, but also introduce new security vulnerabilities that can be exploited by adversaries to launch cyber attacks, causing severe consequences such as massive blackout and infrastructure damages. Existing machine learning-based methods for detecting cyber attacks in smart grids are mostly based on supervised learning, which need the instances of both normal and attack events for training. In addition, supervised learning requires that the training dataset includes representative instances of various types of attack events to train a good model, which is sometimes hard if not impossible. This paper presents a new method for detecting cyber attacks in smart grids using PMU data, which is based on semi-supervised anomaly detection and deep representation learning. Semi-supervised anomaly detection only employs the instances of normal events to train detection models, making it suitable for finding unknown attack events. A number of popular semi-supervised anomaly detection algorithms were investigated in our study using publicly available power system cyber attack datasets to identify the best-performing ones. The performance comparison with popular supervised algorithms demonstrates that semi-supervised algorithms are more capable of finding attack events than supervised algorithms. Our results also show that the performance of semi-supervised anomaly detection algorithms can be further improved by augmenting with deep representation learning.
1. Introduction
There are a number of existing problems in traditional power grids such as a lack of automated analysis and situational awareness, poor visibility, and slow response time, which make them unable to meet the greatly increased demand for and consumption of electricity in the 21st century [1]. With the help of modern information and communication technologies (ICTs), smart grids provide a bidirectional flow of electricity and information which enables the more efficient and resilient delivery of power and better demand-side management [2,3]. There are four main components in a smart grid: generation, transmission, distribution, and consumption, as shown in Figure 1 [2], which are connected through a three-tier hierarchical structured communication network [4]. The first level of the communication network is the home area network (HAN) which is responsible for the communication of the consumption stage to connect smart appliances in consumers’ homes to the smart grid through smart meters for more efficient energy management and demand response. The second level of the communication network, the neighborhood area network (NAN), is responsible for the communication of the distribution stage, which collects data from smart meters and sends back control commands for advanced metering applications. At the top level, the wide area network (WAN) links NANs to utility control centers to form the backbone of the smart grid for the communication needs of power generation and transmission stages.
Although the integration of advanced ICTs into traditional power grids brings significant benefits for power delivery and management, it also introduces new security vulnerabilities into the grids [5]. Cyber attacks can target any of the four components of a smart grid from smart home gateways in HAN to control rooms in WAN [6]. Aurora attack [7] and Stuxnet worm [8] are two typical examples of how cyber attacks can cause damages to physical power systems. Recently, a cyber attack caused hours of power outages in Ukraine that affected more than 200,000 consumers [9]. All these examples show the necessity of enhancing the security of smart grids against cyber attacks. In this work, we aimed to use measurements from phasor measurement units (PMUs) for detecting cyber attacks. PMU is a sensing device deployed in the WAN level of the smart grid network which provides the real-time measurements of power system states for wide area monitoring, protection and control [10,11]. In a wide area monitoring system (WAMS), a number of PMUs are connected to a phasor data concentrator (PDC). The central authority of WAMS then collects the information from PDCs. PMU measurements bridge both the physical and cyber domains, making them an appropriate choice for detecting cyber attacks targeting the physical domain of the smart grid, such as false data injection (FDI) attacks and malicious tripping attacks.
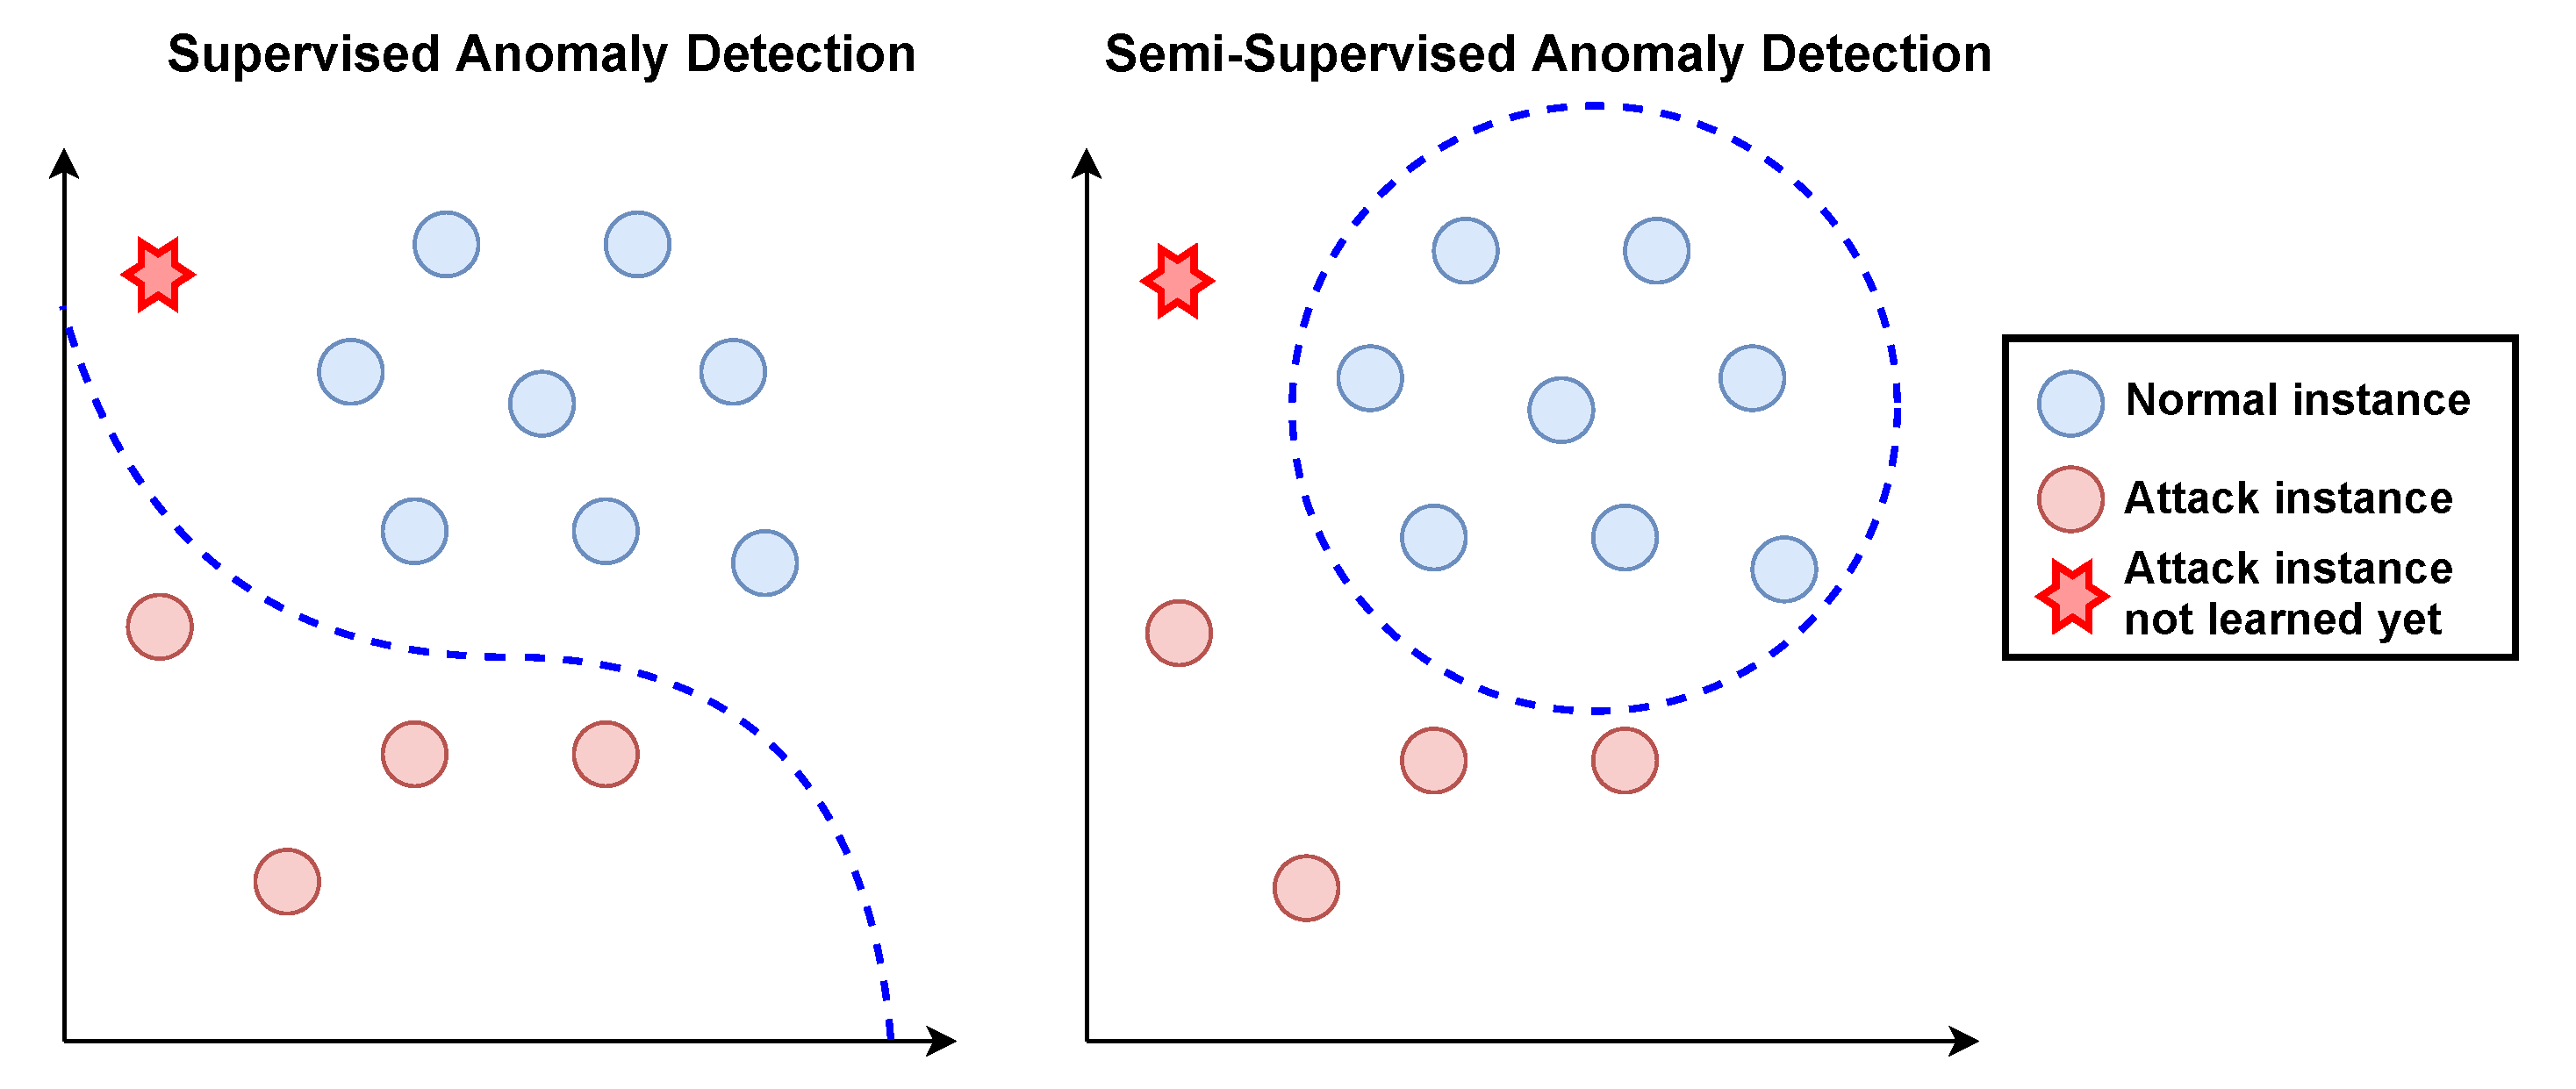
The majority of existing works built models for detecting cyber attacks in smart grids by using supervised learning algorithms. The training of supervised algorithms needs both normal and attack data. However, collecting representative instances of various attack events is usually a difficult task if not impossible, which could result in a model with bad performance in detecting certain attacks, especially attack types not represented in training data. In this paper, we proposed a scheme for detecting cyber attacks in smart grids with semi-supervised anomaly detection. Unlike supervised algorithms, semi-supervised anomaly detection algorithms only employ the data of normal events to train the detection model which is capable of detecting unknown attack types. Figure 2 shows the difference between supervised and semi-supervised anomaly detection algorithms. We investigated a number of representative semi-supervised anomaly detection algorithms and identified the best-performing ones for detecting cyber attacks in smart grids. The performances of semi-supervised algorithms were compared with those of popular supervised algorithms to show their superiority in finding attack events. We also augmented semi-supervised anomaly detection with deep representation learning for extracting discriminant features to further improve the attack detection performance.
The rest of this paper is organized as follows. Section 2 introduces the related work on detecting cyber attacks in smart grids using PMU data. The power system framework and cyber attack datasets generated from the framework are described in Section 3. The details of the proposed method are presented in Section 4. Section 5 shows the performance evaluation experiments and results. Finally, we conclude this paper and outline our future work in Section 6.
2. Related Work
Traditional approaches employ PMU measurements to estimate the state of the power system and compare the difference between the observed and the estimated measurements with a threshold for cyber attack detection [12,13]. A lightweight scheme was proposed in [14], which explores the spatial-temporal correlations between state estimations of the grid and applies a trust-voting to detect abnormal state estimations in smart grids caused by FDI attacks in real time. Chi-square detector and cosine similarity matching approaches were investigated in [15] for detecting cyber attacks in smart grids. Huang et al. [16] proposed an adaptive cumulative sum (CUSUM) algorithm for the real-time detection of FDI attacks in smart grids.
Recently, machine learning has been widely used for detecting cyber attacks in smart grids where the majority of proposed approaches are based on supervised learning algorithms. A number of supervised learning algorithms were explored in [6] to discriminate power system disturbances and cyber attacks. Ozay et al. [17] applied several popular supervised algorithms including perceptron, k-nearest neighbor (KNN), support vector machines (SVMs) and sparse logistic regression (SLR) with ensemble learning and feature-level fusion for predicting FDI attacks. Their experimental results demonstrate that machine learning algorithms outperform state estimation-based algorithms. Yan et al. [18] compared SVM, KNN, and extended nearest neighbor (ENN) for detecting both a direct and stealth FDI attack in smart grids. Singh et al. [19] proposed a decision tree-based anomaly detection approach based on PMU measurements to distinguish the normal tripping from power line faults and malicious attacks tripping the physical relays. An Adaboost-based classification model using the random forest as the base classifier using individual PMU data was developed in [20] for detecting power system disturbances and cyber attacks. They applied feature construction engineering to create new features from PMU measurements and combined classification models with weight voting for final detection.
To improve the detection performance and reduce computational complexity, feature engineering approaches such as feature selection and feature extraction were investigated in the literature. Sakhnini et al. [21] investigated three heuristic feature selection methods including genetic algorithm (GA), binary cuckoo search (BCS), and particle swarm optimization (PSO), for improving the performance of supervised learning algorithms on detecting FDI attacks in smart grids. As a popular feature extraction method, principal component analysis (PCA) was used in [22,23] to reduce the dimensionality of feature space for a lower computational complexity of attack detection.
Compared with a large number of methods based on supervised learning algorithms, there were only limited studies on using semi-supervised anomaly detection algorithms for attack detection in smart grids. One-class SVM (OCSVM) was employed in [24] to build an intrusion detection module for detecting malicious attacks in the supervisory control and data acquisition (SCADA)) system using network traces. They further combined OCSVM with K-means recursive clustering for real-time intrusion detection in SCADA systems [25]. To the best of our knowledge, our work is the first one that applies semi-supervised anomaly detection algorithms for detecting cyber attacks in smart grids using PMU data.
3. Power System Framework and Cyber Attack Datasets
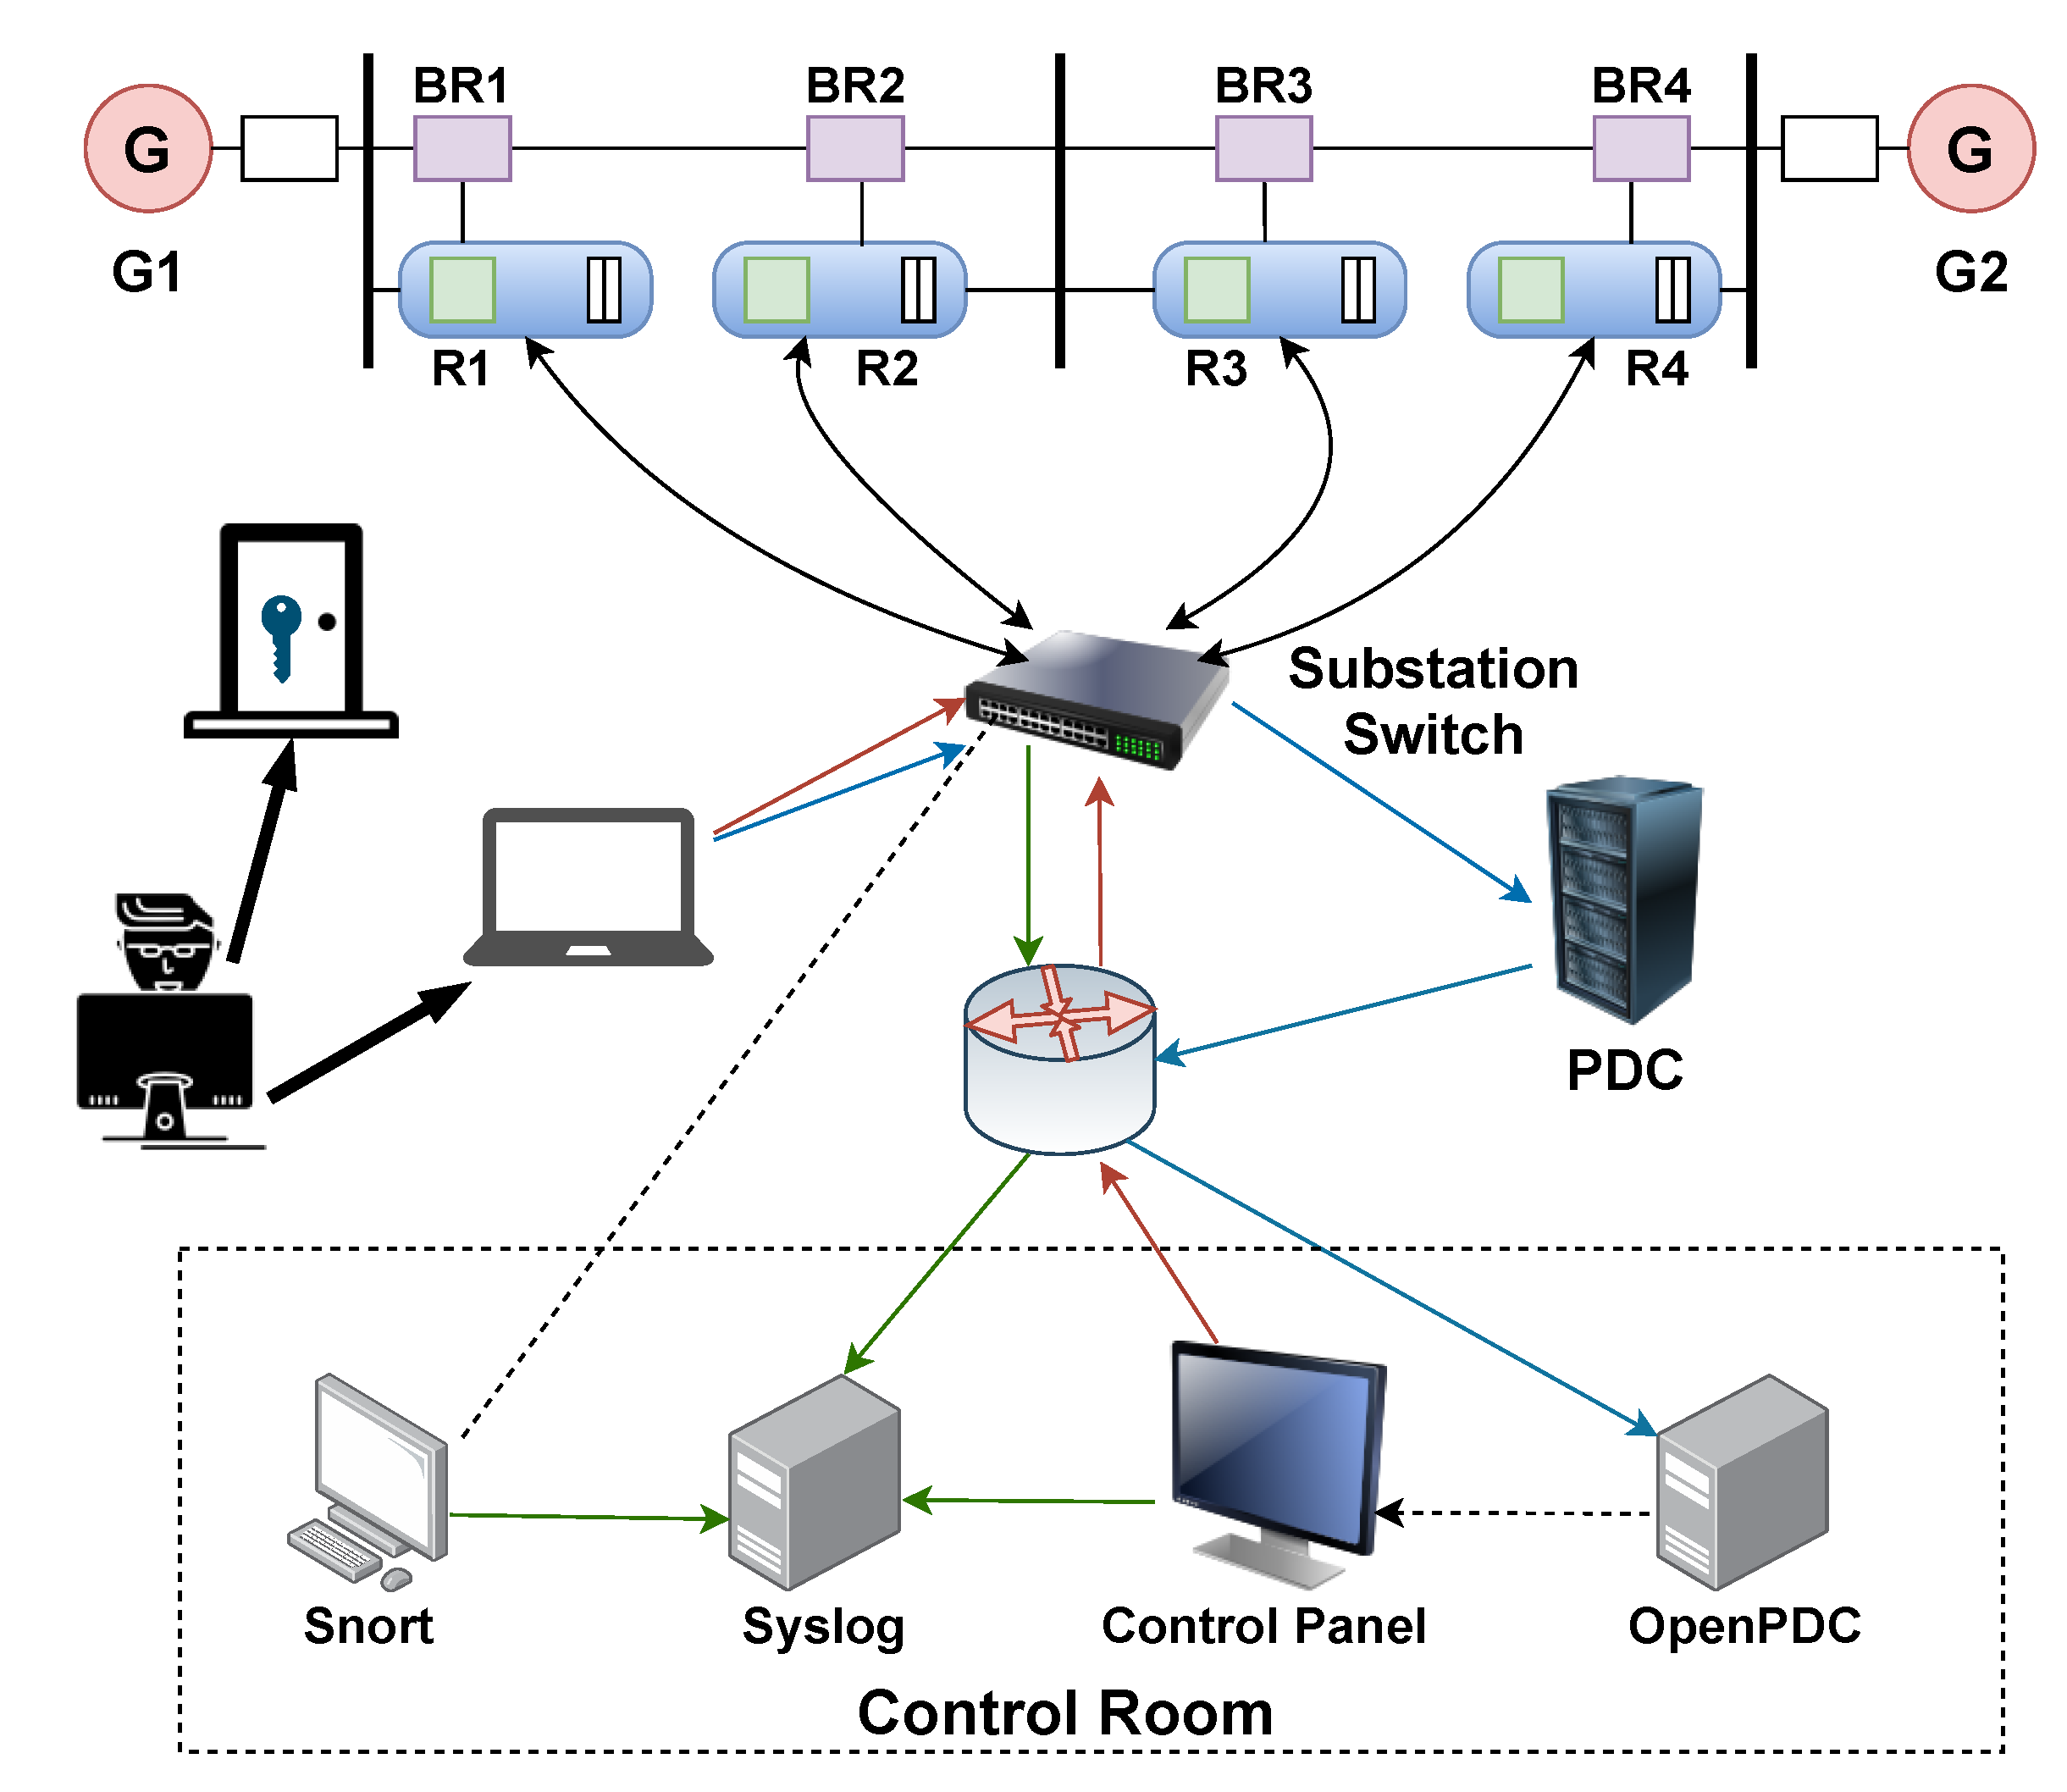
The datasets adopted in our study (which are publicly available at https://sites.google.com/a/uah.edu/tommy-morris-uah/ics-data-sets, accessed on 25 June 2021) were generated from a power system framework [6] consisting of smart electronic devices, supervisory control systems, and network monitoring devices, as shown in Figure 3. There are two power generators, G1 and G2, in the system to provide the power. R1–R4 are four intelligent electronic devices (IEDs), which can be toggled to switch four breakers, BR1–BR4, on or off, respectively. Two transmission lines, L1 and L2, connect BR1 to BR2 and BR3 to BR4, respectively. The IEDs employ a distance protection scheme such that breakers can be automatically toggled wherever a fault occurred. Since there is no internal validation in the IEDs, breakers will be toggled regardless of whether the fault is a natural anomaly or an attack. Operators can manually toggle the IEDs to perform the maintenance of the power system and/or system components.
The power system framework can simulate multiple operational scenarios to generate data corresponding to three types of events: no event, natural events, and attack events. Table 1 summarizes the 37 simulated operational scenarios and their corresponding event types for generating the datasets. The six types of events are described as follows:
- No event: Normal readings.
- Short-circuit fault: A single line-to-ground fault occurred and can specifically be found by reading the percentage range in data.
- Line maintenance: Operators toggle one or more IEDs to perform maintenance on certain parts of the power system and its components.
- Remote tripping command injection attack: Attackers can send commands that toggle IEDs to switch breakers when they can penetrate to the system.
- Relay setting change attack: Attackers change settings, such as disabling primary functions of the settings, causing the IEDs not to toggle the breakers whenever a valid fault or command occurs.
- Data injection attack: Attackers change the PMU measurements such as voltage, current and sequence components to mimic a valid fault causing the breakers to be switched off.
There are four PMUs integrated with relays in the system where each PMU measures 29 features which are shown in Table 2. In total, 116 features are obtained from the four PMUs. As the focus of our study is to use PMU data to detect cyber attacks, additional cyber-domain features collected by the system from the log information of the control room were not included. Depending on how to group the scenarios in Table 1, three groups of datasets—binary, three-class and multi-class—were created from the data generated from the framework. Since the aim of our study was to differentiate attack events from other types of events, we adopted the binary group of datasets where no event and natural events are treated as normal events.
4. Methodology
4.1. Overview of the Proposed Method
The proposed method is illustrated in Figure 4, which contains two main components: deep representation learning and semi-supervised anomaly detection. The first step of the proposed method is to prepare the training dataset which only contains instances of normal events. The dimensionality of feature space is then reduced through deep representation learning where a low-dimensional latent representation is learned from the input by a deep autoencoder (DAE). Finally, a semi-supervised anomaly detection algorithm is applied to train the detection model by using the learned feature representation. In the detection stage, a latent representation is first produced from an unknown input instance by the code layer of the DAE, which is then fed into the trained detection model to classify the instance as a normal event or an attack event.
4.2. Feature Extraction
It has been shown that the performance of learning algorithms and their computational efficiency can be improved by reducing the dimensionality of feature space [26]. In our study, deep representation learning is used for feature extraction which employs a DAE to learn robust low-dimensional representations from high-dimensional inputs [27]. PCA, a popular feature extraction method [26], was used as the reference method for comparison.
4.2.1. Deep Representation Learning with DAE
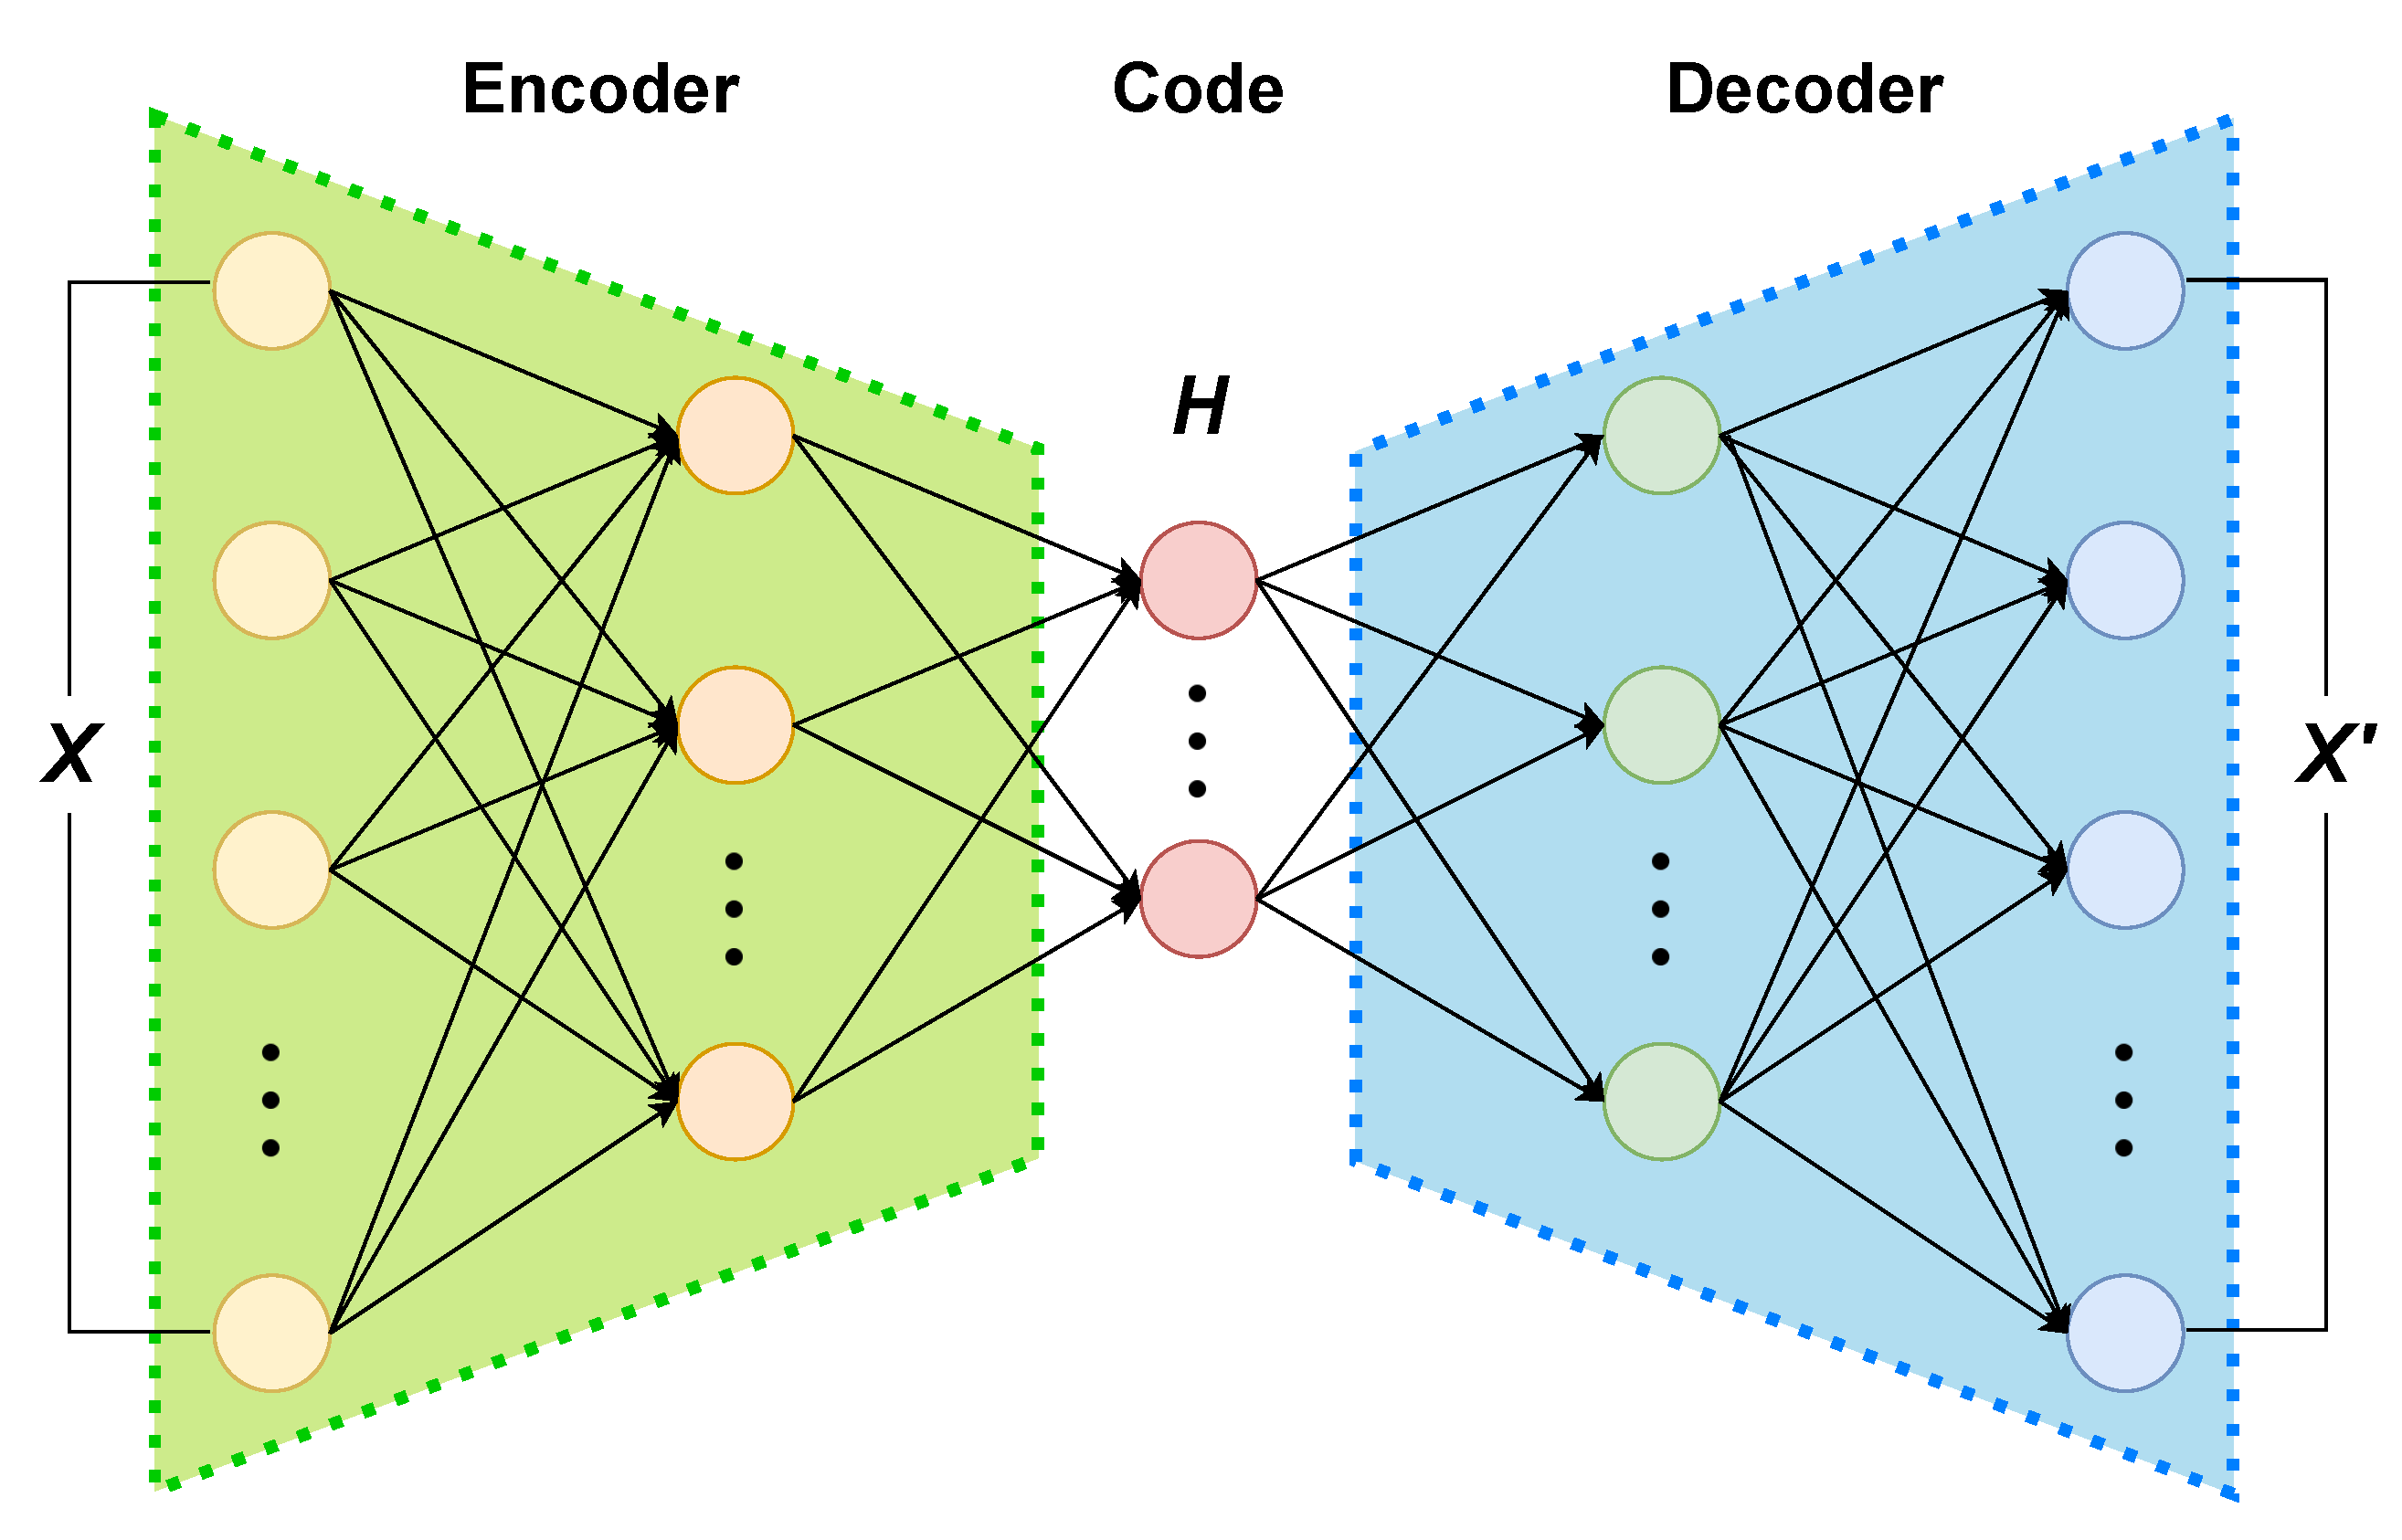
The DAE is a multi-layer neural network with three components—an encoder, a code layer, and a decoder—as shown in Figure 5. The input data are mapped by the encoder into the latent representation of the code layer, which is a low-dimensional representation of the input data:
The latent representation is then reconstructed by the decoder as . The training of the DAE aims to minimize the error between the input and the reconstructed :
After a DAE trained with the training dataset, the encoder and code layer are retained for feature extraction while the decoder was removed from the network. The latent representation of the code layer will be used as the input of the semi-supervised anomaly detection algorithm.
Figure 5.
The structure of a DAE.

4.2.2. PCA
PCA is a widely used feature extraction method for feature dimension reduction. PCA linearly transforms the data into a low-dimensional subspace while maximizing the variance of the data. Given the data matrix ∈ where n is the number of instances and m is the number of features, the covariance matrix of X, S, can be decomposed as
where W ∈ is the utility matrix and ∈ is the diagonal matrix of eigenvalues. The columns of matrix are the eigenvectors. The feature dimension reduction in a data vector can then be done through the following transformation:
where is the new data vector with the reduced p features and is the first p eigenvectors of .
4.3. Semi-Supervised Anomaly Detection Algorithms
A total of eight popular semi-supervised anomaly detection algorithms were investigated in our study, which can be divided into three categories: liner models, proximity-based methods, and ensembles [28].
4.3.1. Linear Models
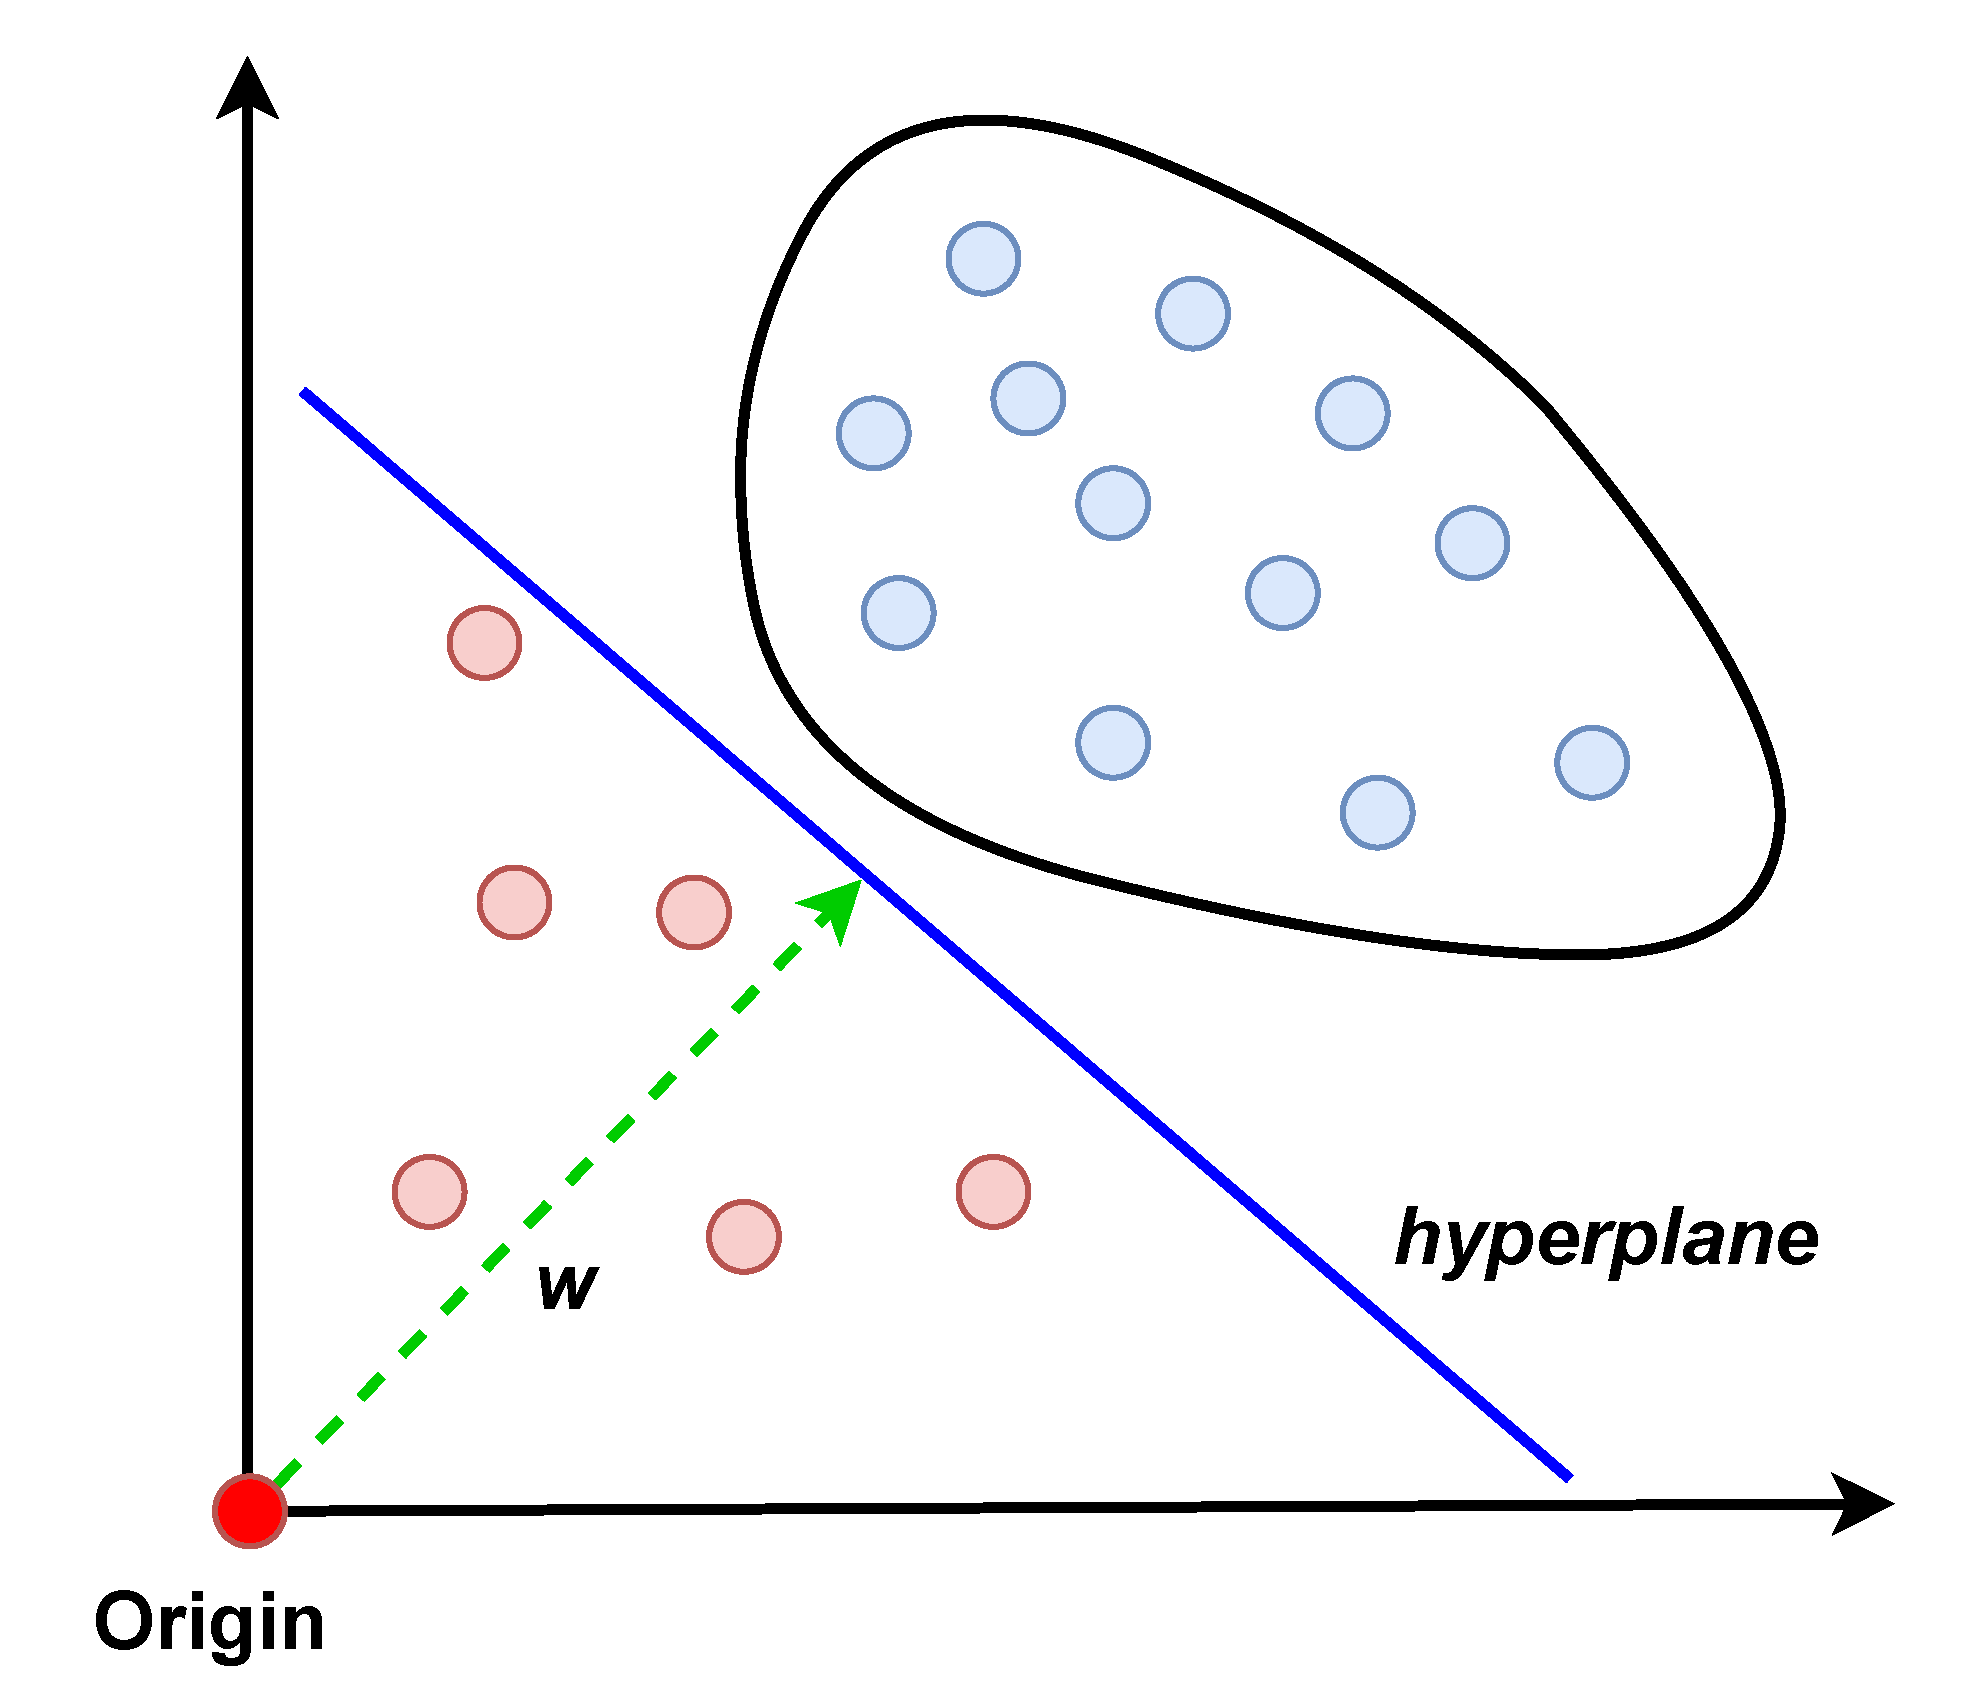
- One-class SVM (OCSVM): OCSVM was proposed in [29] as a semi-supervised version of the popular supervised learning algorithm, SVM. SVM finds a hyperplane to separate the data of two classes with the maximum margin. OCSVM needs to find the hyperplane with only normal data. In [29], the data are mapped into a high-dimensional space first. A hyperplane is then constructed to separate all normal instances from the origin with the maximum margin, which serves as the boundary to separate normal and abnormal instances. The working principle of OCSVM is illustrated in Figure 6. OCSVM solves a quadratic minimization problem to find the hyperplane, which is shown in Equation (5), where w is the normal vector of the hyperplane, is the distance from the hyperplane to the origin, are the separation errors for penalization, is the mapping function to map an instance into a high-dimensional space, and . is an important parameter for OCSVM which controls the number of training instances to be used as support vectors and the fraction of anomalies:
4.3.2. Proximity-Based Methods
- Histogram-based outlier score (HBOS): In [30], HBOS was proposed as a fast outlier detection method with a computational complexity of , which has been applied for problems involving a large amount of data such as network anomaly detection [31]. For each feature of the dataset, HBOS constructs a univariate histogram first. The frequency of occurrence of the values is used by HBOS for a categorical feature. Numerical features can be dealt with by two different methods:
- −
- The static method, which separates the range of feature values into k equal-width intervals—he number of instances falling in the interval is the height of the corresponding bin;
- −
- The dynamic method, which sorts the instances based on the feature values, where a fixed amount of successive values is then grouped into a bin—the width of the bin is determined by the feature values of the instances.
The constructed histogram is then normalized such that the maximum bin height is one. Finally, the HBOS of an instance p is calculated as shown in Equation (7):
where n is the number of features and is the density estimation of the i-th feature of p. A higher HBOS indicates that the instance is more abnormal.
- Local outlier factor (LOF): LOF is a popular density-based outlier detection algorithm which estimates the abnormality of an instance according to its deviation with respect to its local neighbors [32]. The algorithm first defines the local locality of an instance p as its K nearest neighbors, , and the K- of p as the distance between p and its K-th nearest neighbor. The reachability distance between p and any other instance q is then calculated as the distance between p and q but at least K-. Figure 7 shows an example for determining the reachability distance where K equals 3. In Figure 7, the reachability distances of instances a to c are the same which equal to K-, i.e., . Since the instance d is not one of p’s K nearest neighbors, its reachability distance equals the real distance between p and d:
The local reachability density (LRD) of p can then be calculated as the inverse of the average reachability distance of p from its K nearest neighbors, as shown in Equation (9):
Finally, we can obtain the LOF score of p using the LRDs of p and its neighbors:
when the LOF score of p is less than or equal to 1, it is identified as normal as it is in a denser area than its neighbors or has a density similar to its neighbors. When p has a LOF score significantly larger than 1 showing that its nearest neighbors are far away from it, it should be identified as an anomaly.
- Clustering-based local outlier factor (CBLOF): the LOF algorithm has a high computational complexity of . CBLOF was proposed by He et al. [33] as an efficient method with a computational complexity of . CBLOF first applies the Squeezer algorithm [34] to partition the input data into clusters, which are then divided into two groups of large cluster (LC) and small cluster (SC) based on a parameter b. Supposing that the clusters are ordered based on their sizes as , b separates the clusters as and , which is determined by satisfying the conditions in Equations (11) and (12) where and are two numeric parameters and is the size of the dataset. Equation (11) is derived based on the fact that a large portion of instances are normal so that they should be in the LC group, while Equation (12) means that clusters in the LC and SC groups should have significant differences in cluster size:The CBLOF score of p is defined as
Equation (13) shows that the CBLOF score of p depends on the type of cluster it belongs to. The CBLOF score is calculated as the product of the size of the cluster and the distance to its closest LC if p is in a SC. If p is in a LC, the CBLOF score is the product of the size of the cluster and the distance to its own cluster.
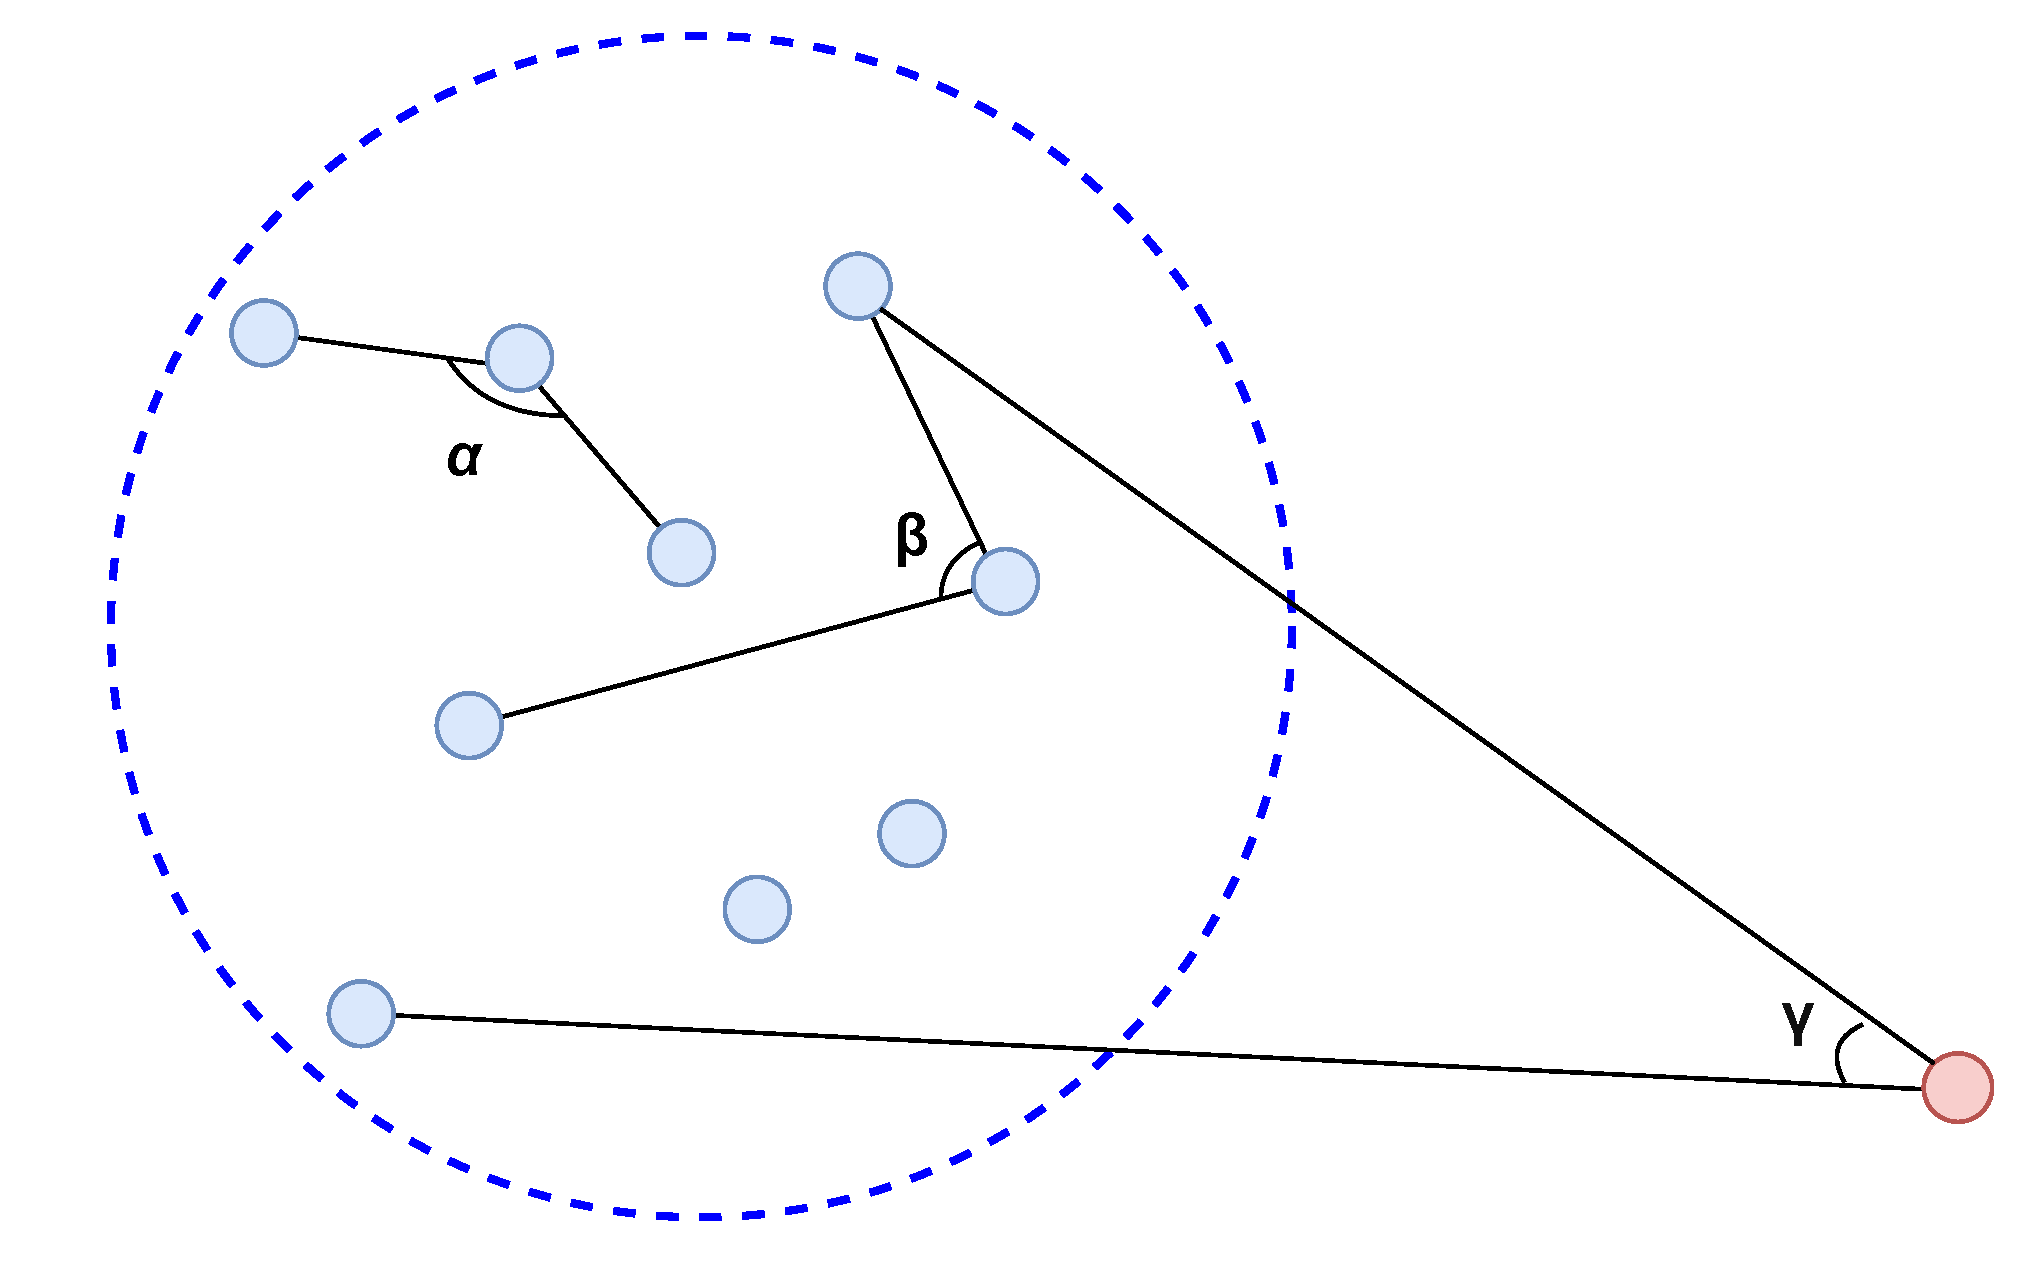
- Angle-based outlier detector (ABOD): ABOD was proposed in [35] as a proximity-based method to detect outliers in high-dimension data, which primarily relies on the angle between a pair of distance vectors instead of the distance. This is due to the fact that the distances may be quantitatively meaningless in high-dimensional space [36,37]. Figure 8 shows the working principle of ABOD. As a normal instance is generally located within a dense cluster with other normal instances, the variance of angles between its distance vectors is large as the angles vary in a wide range. On the other hand, an anomaly is generally located far from the cluster so that most of the angles between its distance vectors are small, leading to a low variance of angles. Since the computation of all angles for an instance has high complexity, an approximate method was proposed in [35] called FastABOD, which only calculates the angles of pairs within an instance’s K nearest neighbors.
- K-nearest-neighbor outlier detection (KNNOD): KNNOD was proposed in [38] as a simple but efficient proximity-based method for outlier detection. The information of an unknown instance’s K nearest neighbors is used by KNNOD to evaluate its abnormality. The anomaly score of the unknown instance is calculated as the distance of the instance to its K-th nearest neighbor, where the distance can be calculated based on any norm such as Euclidean distance ( norm) or Manhattan distance ( norm). A larger distance indicates a higher abnormality unknown instance. The average distance or the median distance to an unknown instance’s K nearest neighbors can also be used as the anomaly score, as proposed in [39].
4.3.3. Ensembles
- Feature bagging: Lazarevic and Kumar proposed feature bagging in [40] as an ensemble-based approach for outlier detection in high-dimensional and noisy data. Multiple-base outlier detection algorithms are combined in feature bagging and a randomly selected feature subset is used to train each base algorithm. The anomaly score of an unknown instance is determined by calculating the combination of the outputs of all base algorithms. LOF was used as the base outlier detection algorithm in [40].
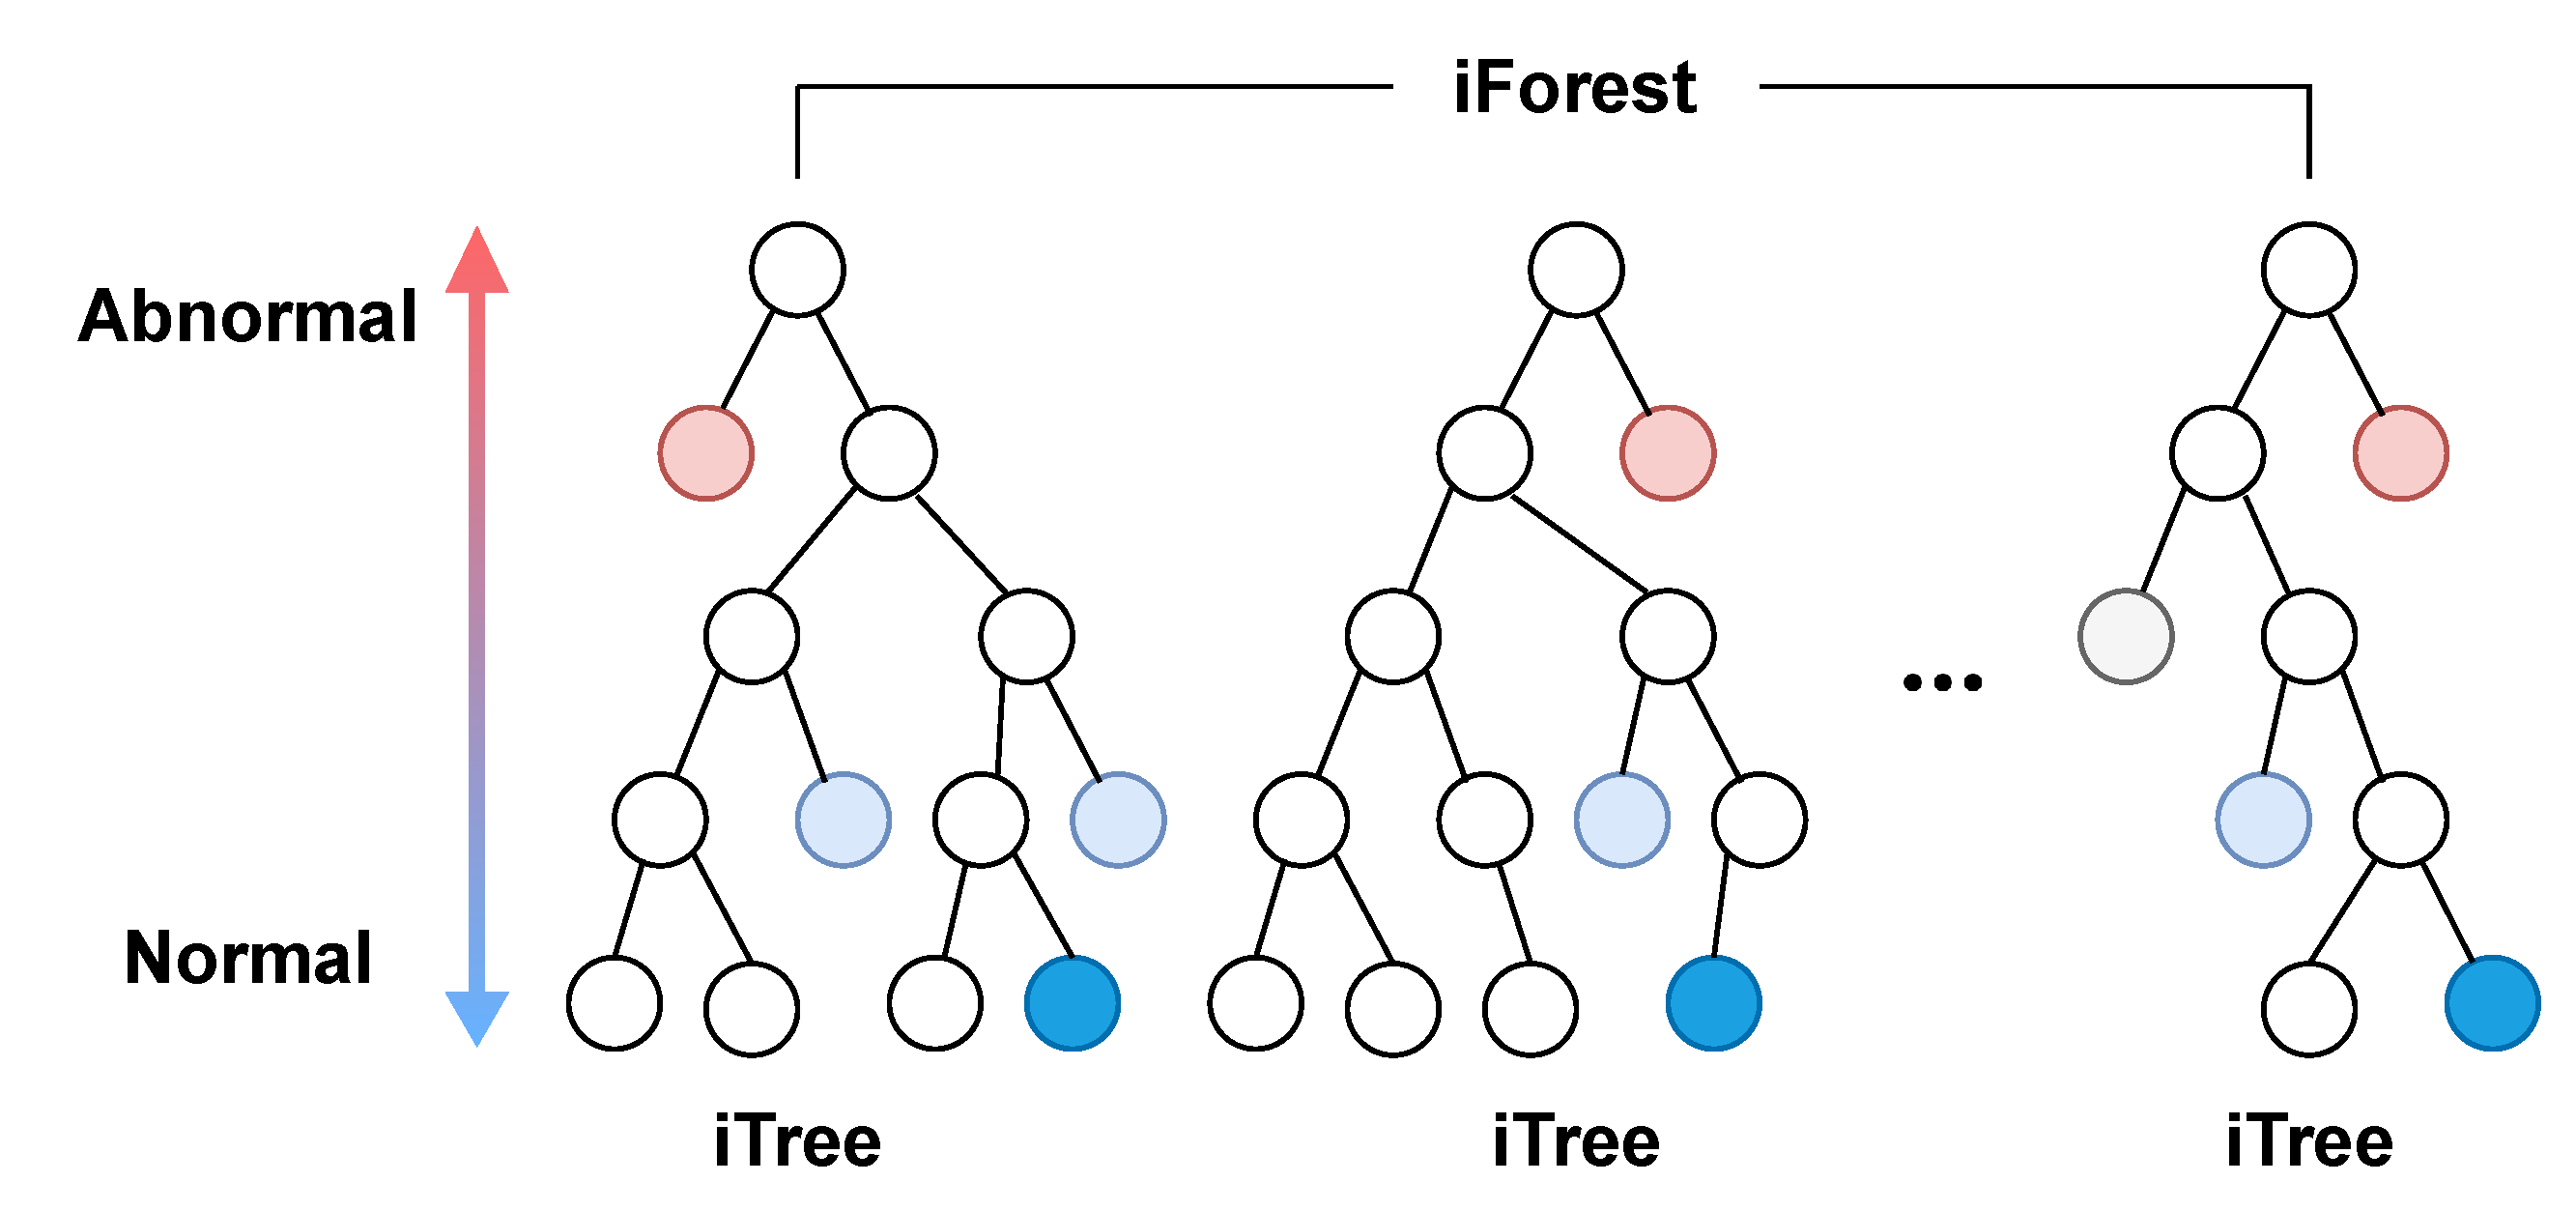
- Isolation forest (iForest): iForest was proposed by Liu et al. [41] for anomaly detection, which is an ensemble of binary search trees (BSTs) called isolation trees (iTrees). iTrees are built by randomly selected data subsets, features and split values. There are two types of nodes in an iTree: internal nodes with two children and leaf nodes without children. The rationale behind iForest is that abnormal instances are more likely to be isolated from other instances in early tree partitioning. Thus, the abnormality of an instance, p, is corresponding to the path length, , from the root node to the leaf node including p, which is illustrated in Figure 9. The average path length of all leaf node terminations can be estimated as the unsuccessful searches in BST, as shown in Equation (14):
The anomaly score of p, , is then estimated as
where is the average obtained from all iTrees in the iForest. A smaller value of results in a larger anomaly score. The abnormality of p can be assessed based on : (i) p is abnormal if is very close to 1; (ii) p is likely to be normal if is smaller than 0.5; (iii) it is safe to assume that p is not abnormal if is approximately 0.5.
5. Performance Evaluation and Results
5.1. Experiments and Performance Metrics
The binary group of the power system attack datasets [6] adopted in our study contains 15 datasets covering the 37 scenarios shown in Table 1. We used the min–max normalization to normalize the data. The method was implemented using Python and PyOD [42], a Python toolbox for anomaly detection. The parameters used by the algorithms investigated in our study are listed in Table 3.
Two metrics were used in our study for performance evaluation: area under the ROC curve (AUC) and score. The ROC curve plots the relationship between true positive rate (TPR) and false positive rate (FPR) by varying the detection threshold. Equations (16) and (17) define TPR and FPR, where TPs, TNs, FPs and FNs are true positives, true negatives, false positives, and false negatives, respectively:
AUC measures the area under the ROC curve to indicate the performance of the model on distinguishing normal and attack events. A higher AUC value means that the model has a better capability to distinguish normal and attack events.
score is defined as the harmonic mean of the precision and recall:
To calculate the score of a detection algorithm, an optimal threshold needs to be determined based on the ROC curve. We adopted the distance to corner (d) [43,44] as the criterion which is defined in Equation (21), which determines the optimal threshold as the point on the ROC curve closest to the corner point (0, 1):
5.2. Performance of Semi-Supervised Anomaly Detection Algorithms
The performances of eight semi-supervised outlier detection algorithms described in Section 4.3 using all 116 PMU features were investigated first. Among the normal instances of a dataset, 50% were randomly selected to train a detection algorithm. The other 50% of normal instances and all attack instances were then used for testing. The process was repeated 10 times for each dataset.
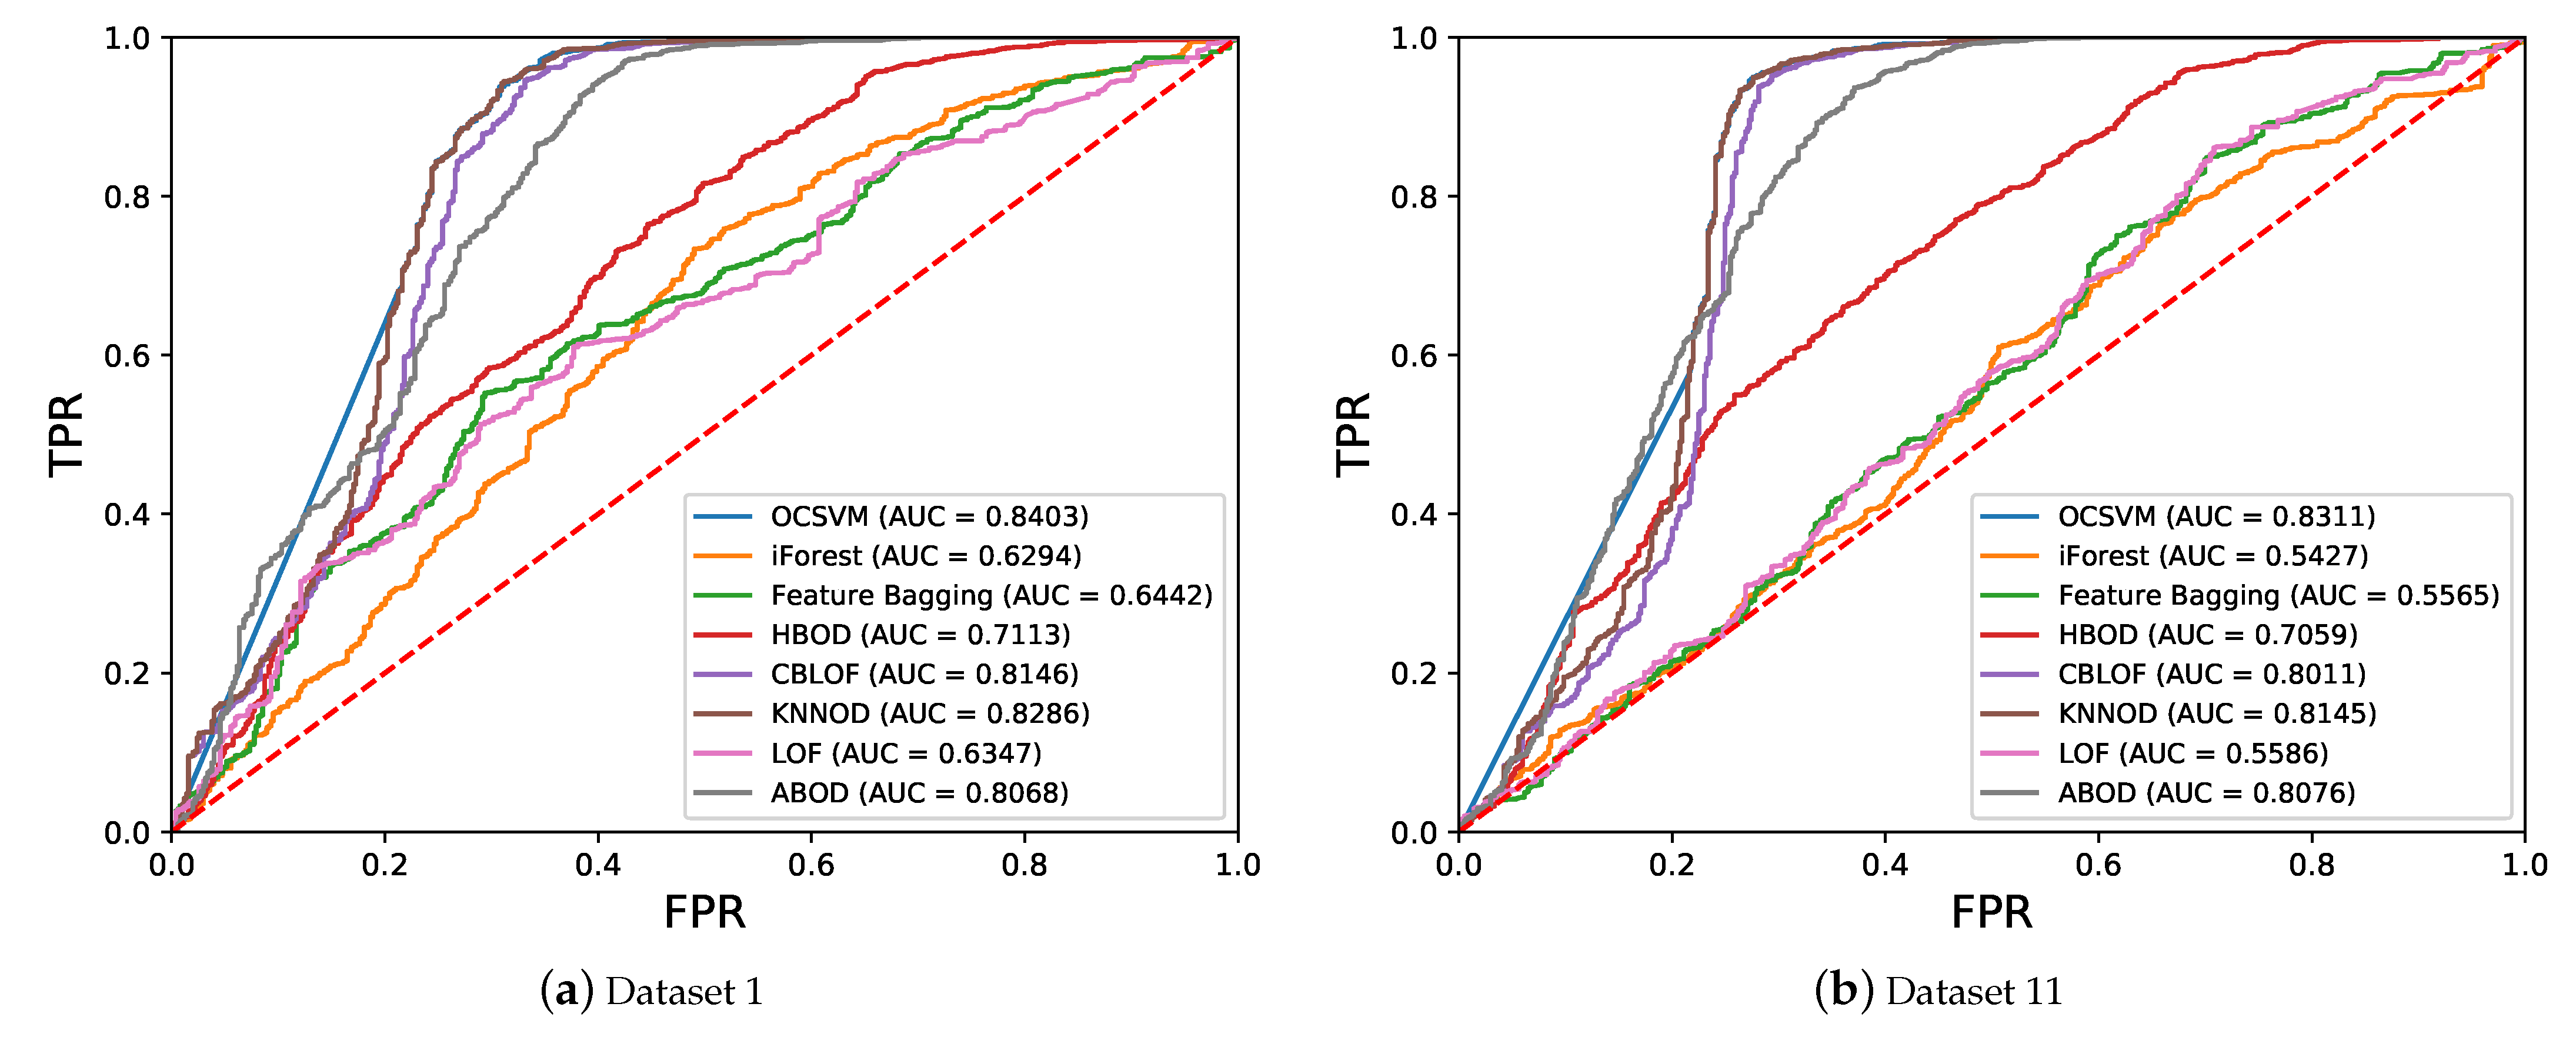
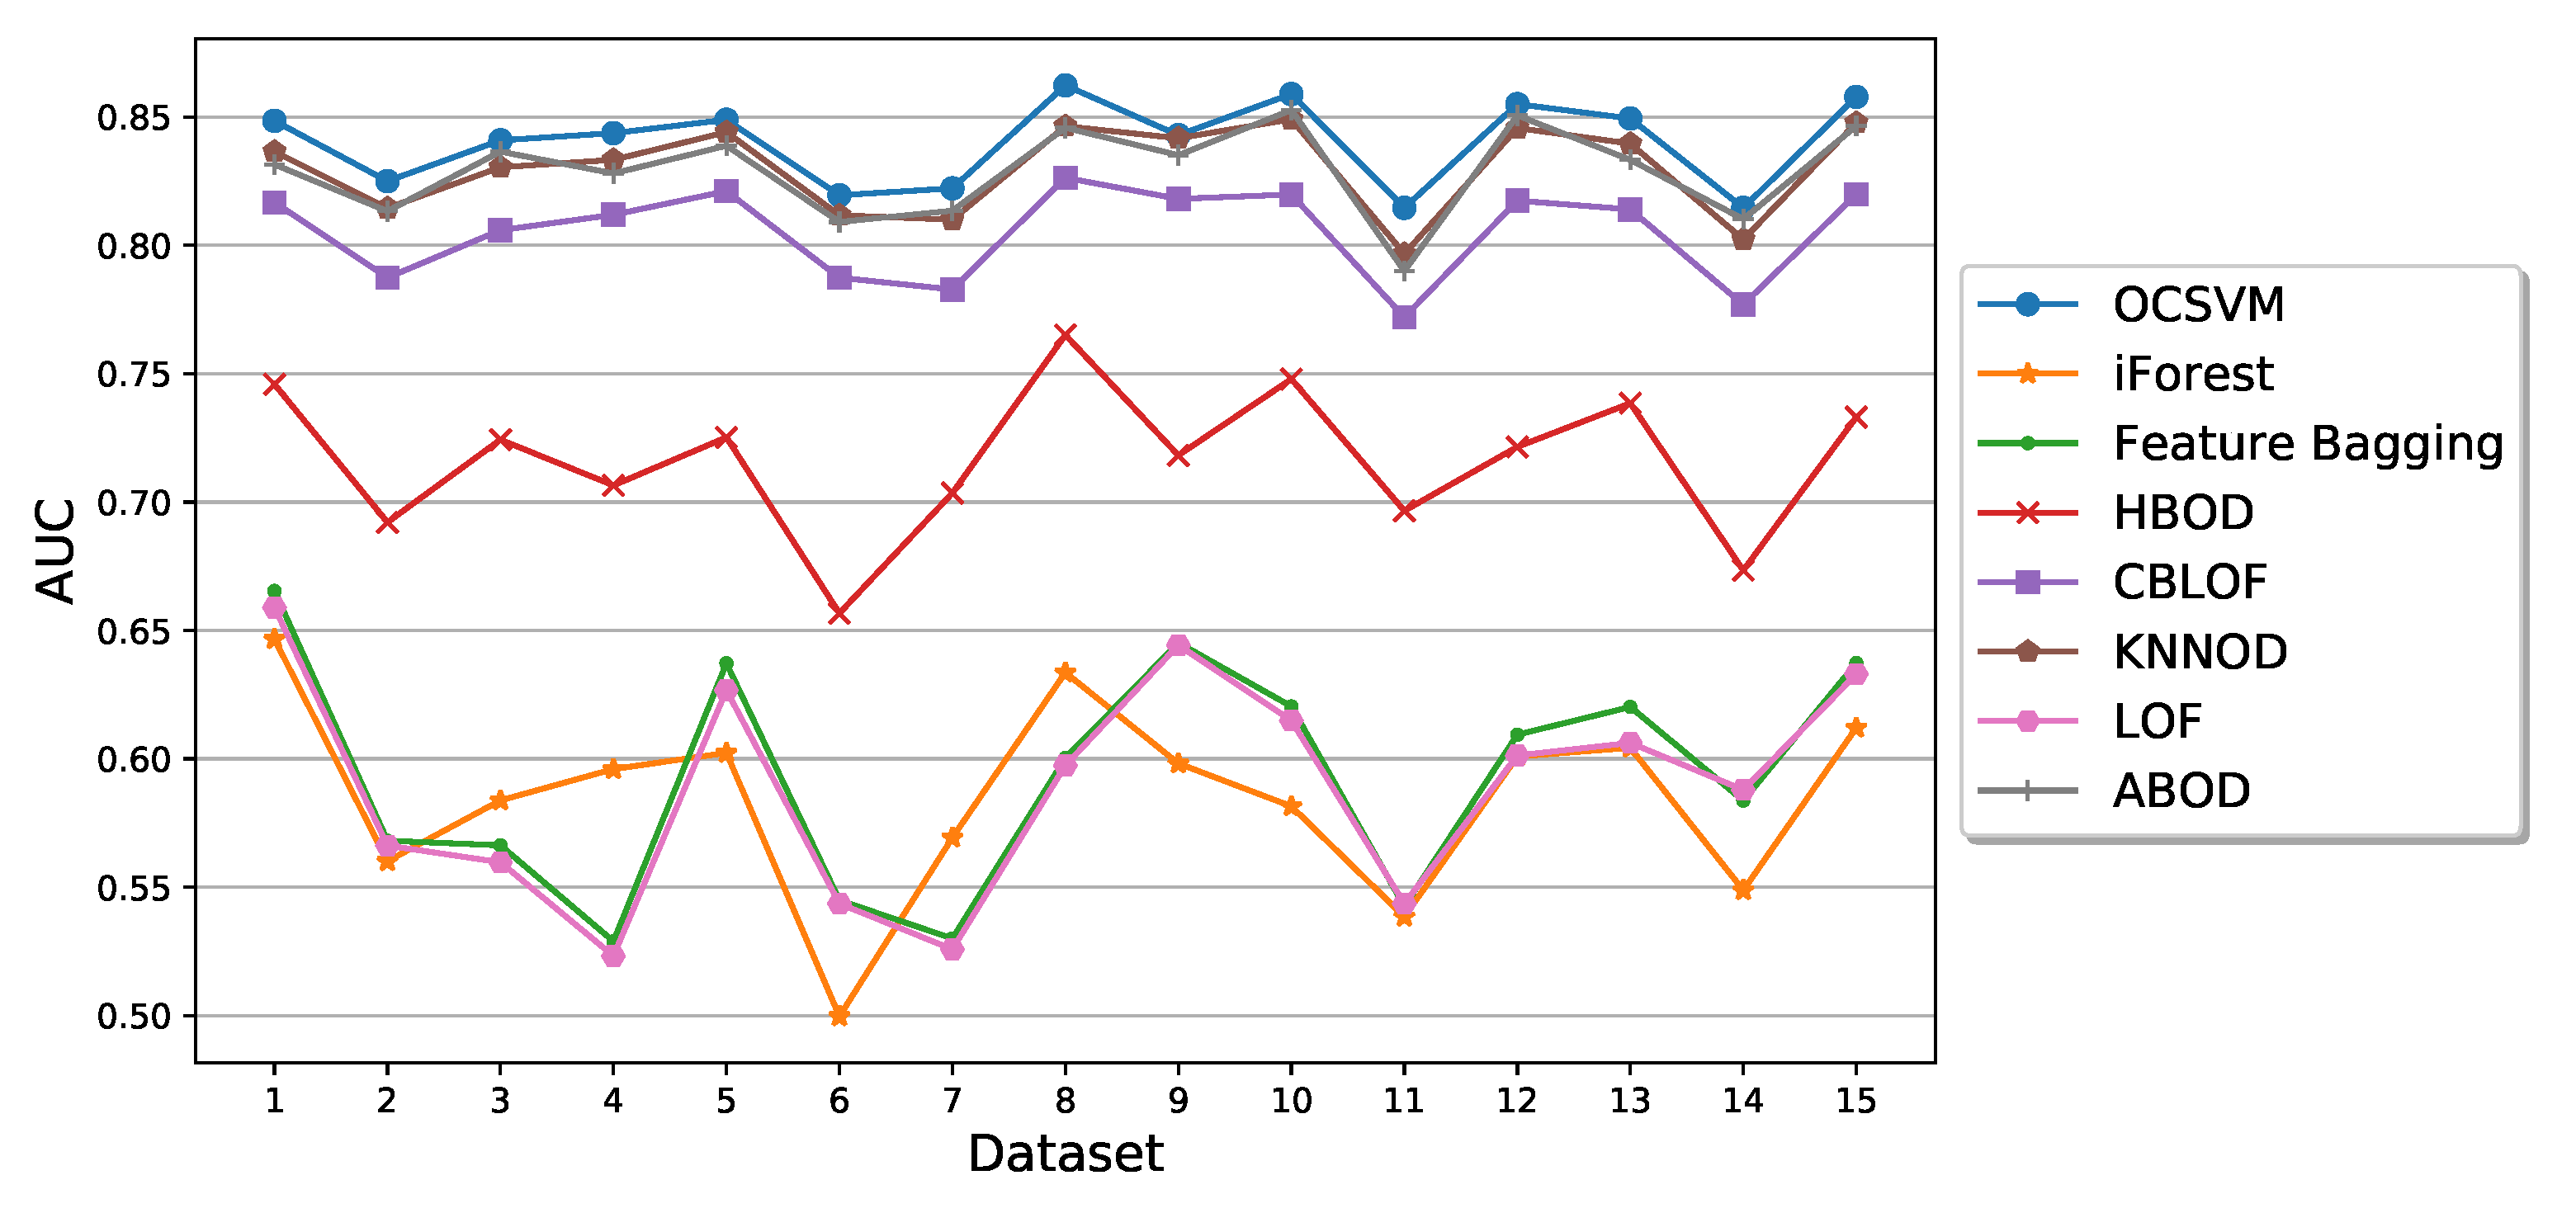
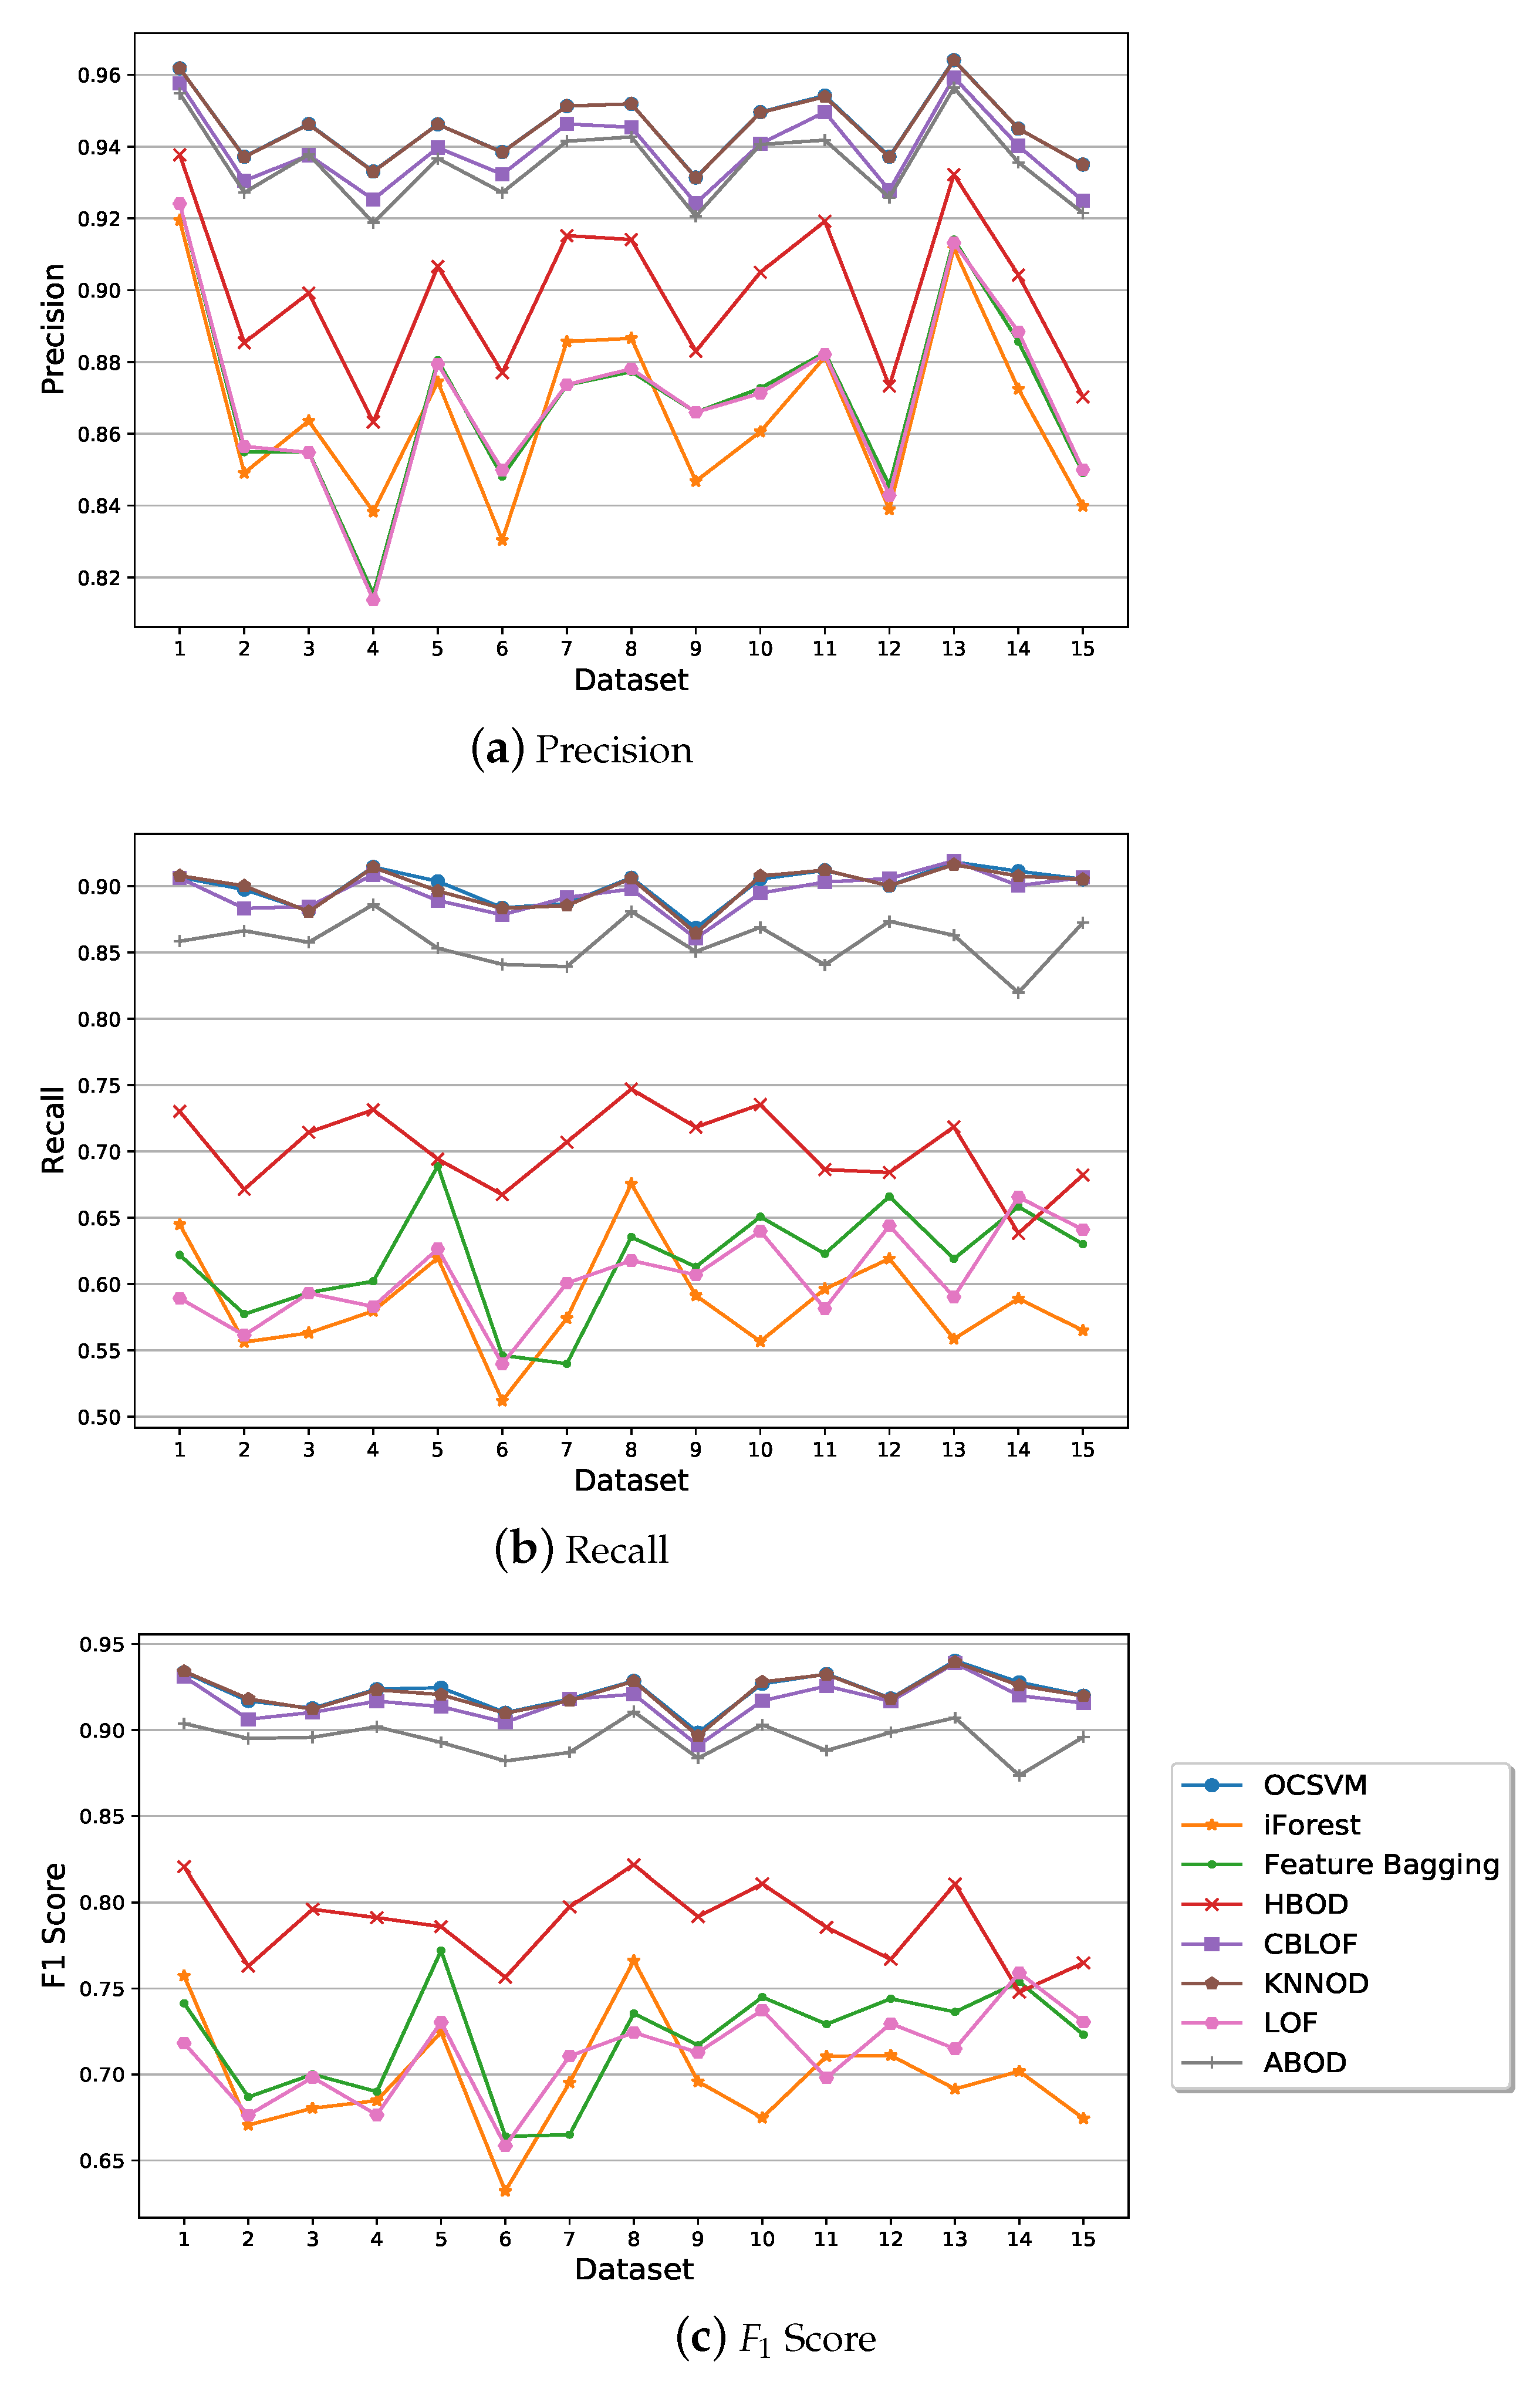
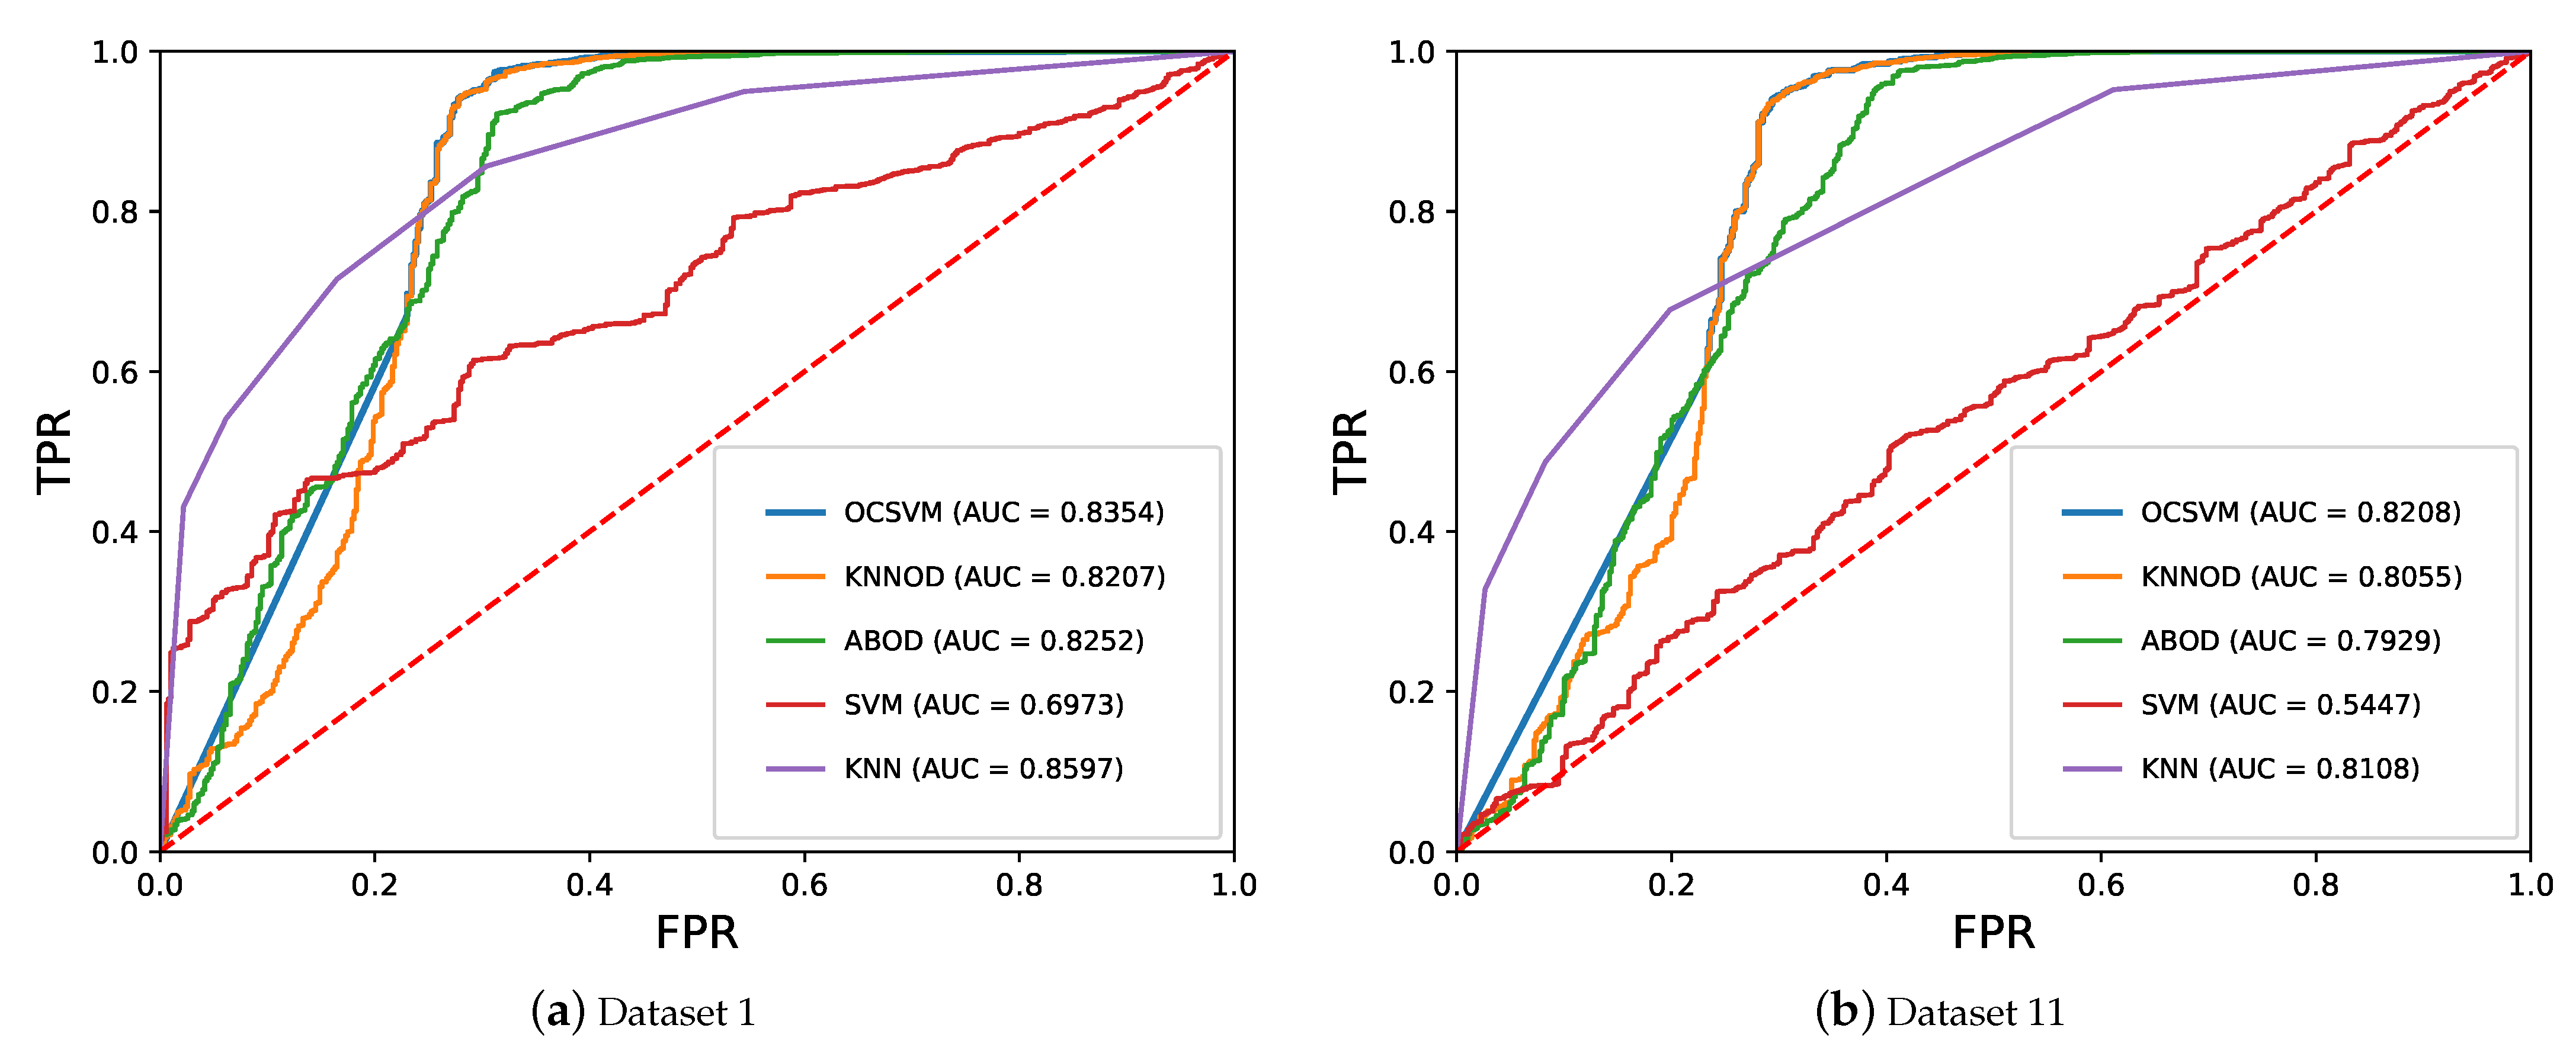
Examples of ROC curves obtained by the eight algorithms on datasets 1 and 11 in one run of the experiment are shown in Figure 10. The average AUCs of the algorithms calculated from the 10 runs for each of the 15 datasets are shown in Figure 11. It can be observed from Figure 11 that the three best-performing algorithms in terms of average AUC are OCSVM, KNNOD, and ABOD followed by CBLOF. Those four algorithms show significantly better performance than other four algorithms. We then used the distance to the corner d to determine the detection threshold of an algorithm to obtain the precision, recall, and score. The top three algorithms in terms of average score are OCSVM, KNNOD, and CBLOF followed by ABOD as shown in Figure 12:
5.3. Performance Comparison of Semi-Supervised and Supervised Algorithms
We then compared the three best-performing semi-supervised algorithms in terms of average AUC (OCSVM, KNNOD, ABOD) with two popular supervised algorithms—KNN and SVM—that have been used for detecting cyber attacks in smart grids [6,17]. For each of the 15 datasets, the training dataset for the semi-supervised algorithms was formed by randomly selecting 50% of normal instances. These normal instances were combined with the same number of randomly selected attack instances to form the training dataset for the supervised algorithms. The remaining 50% of normal instances and attack instances were used to form the testing dataset for both the semi-supervised and supervised algorithms. Similarly to Section 5.2, the experiment was repeated 10 times for each dataset.
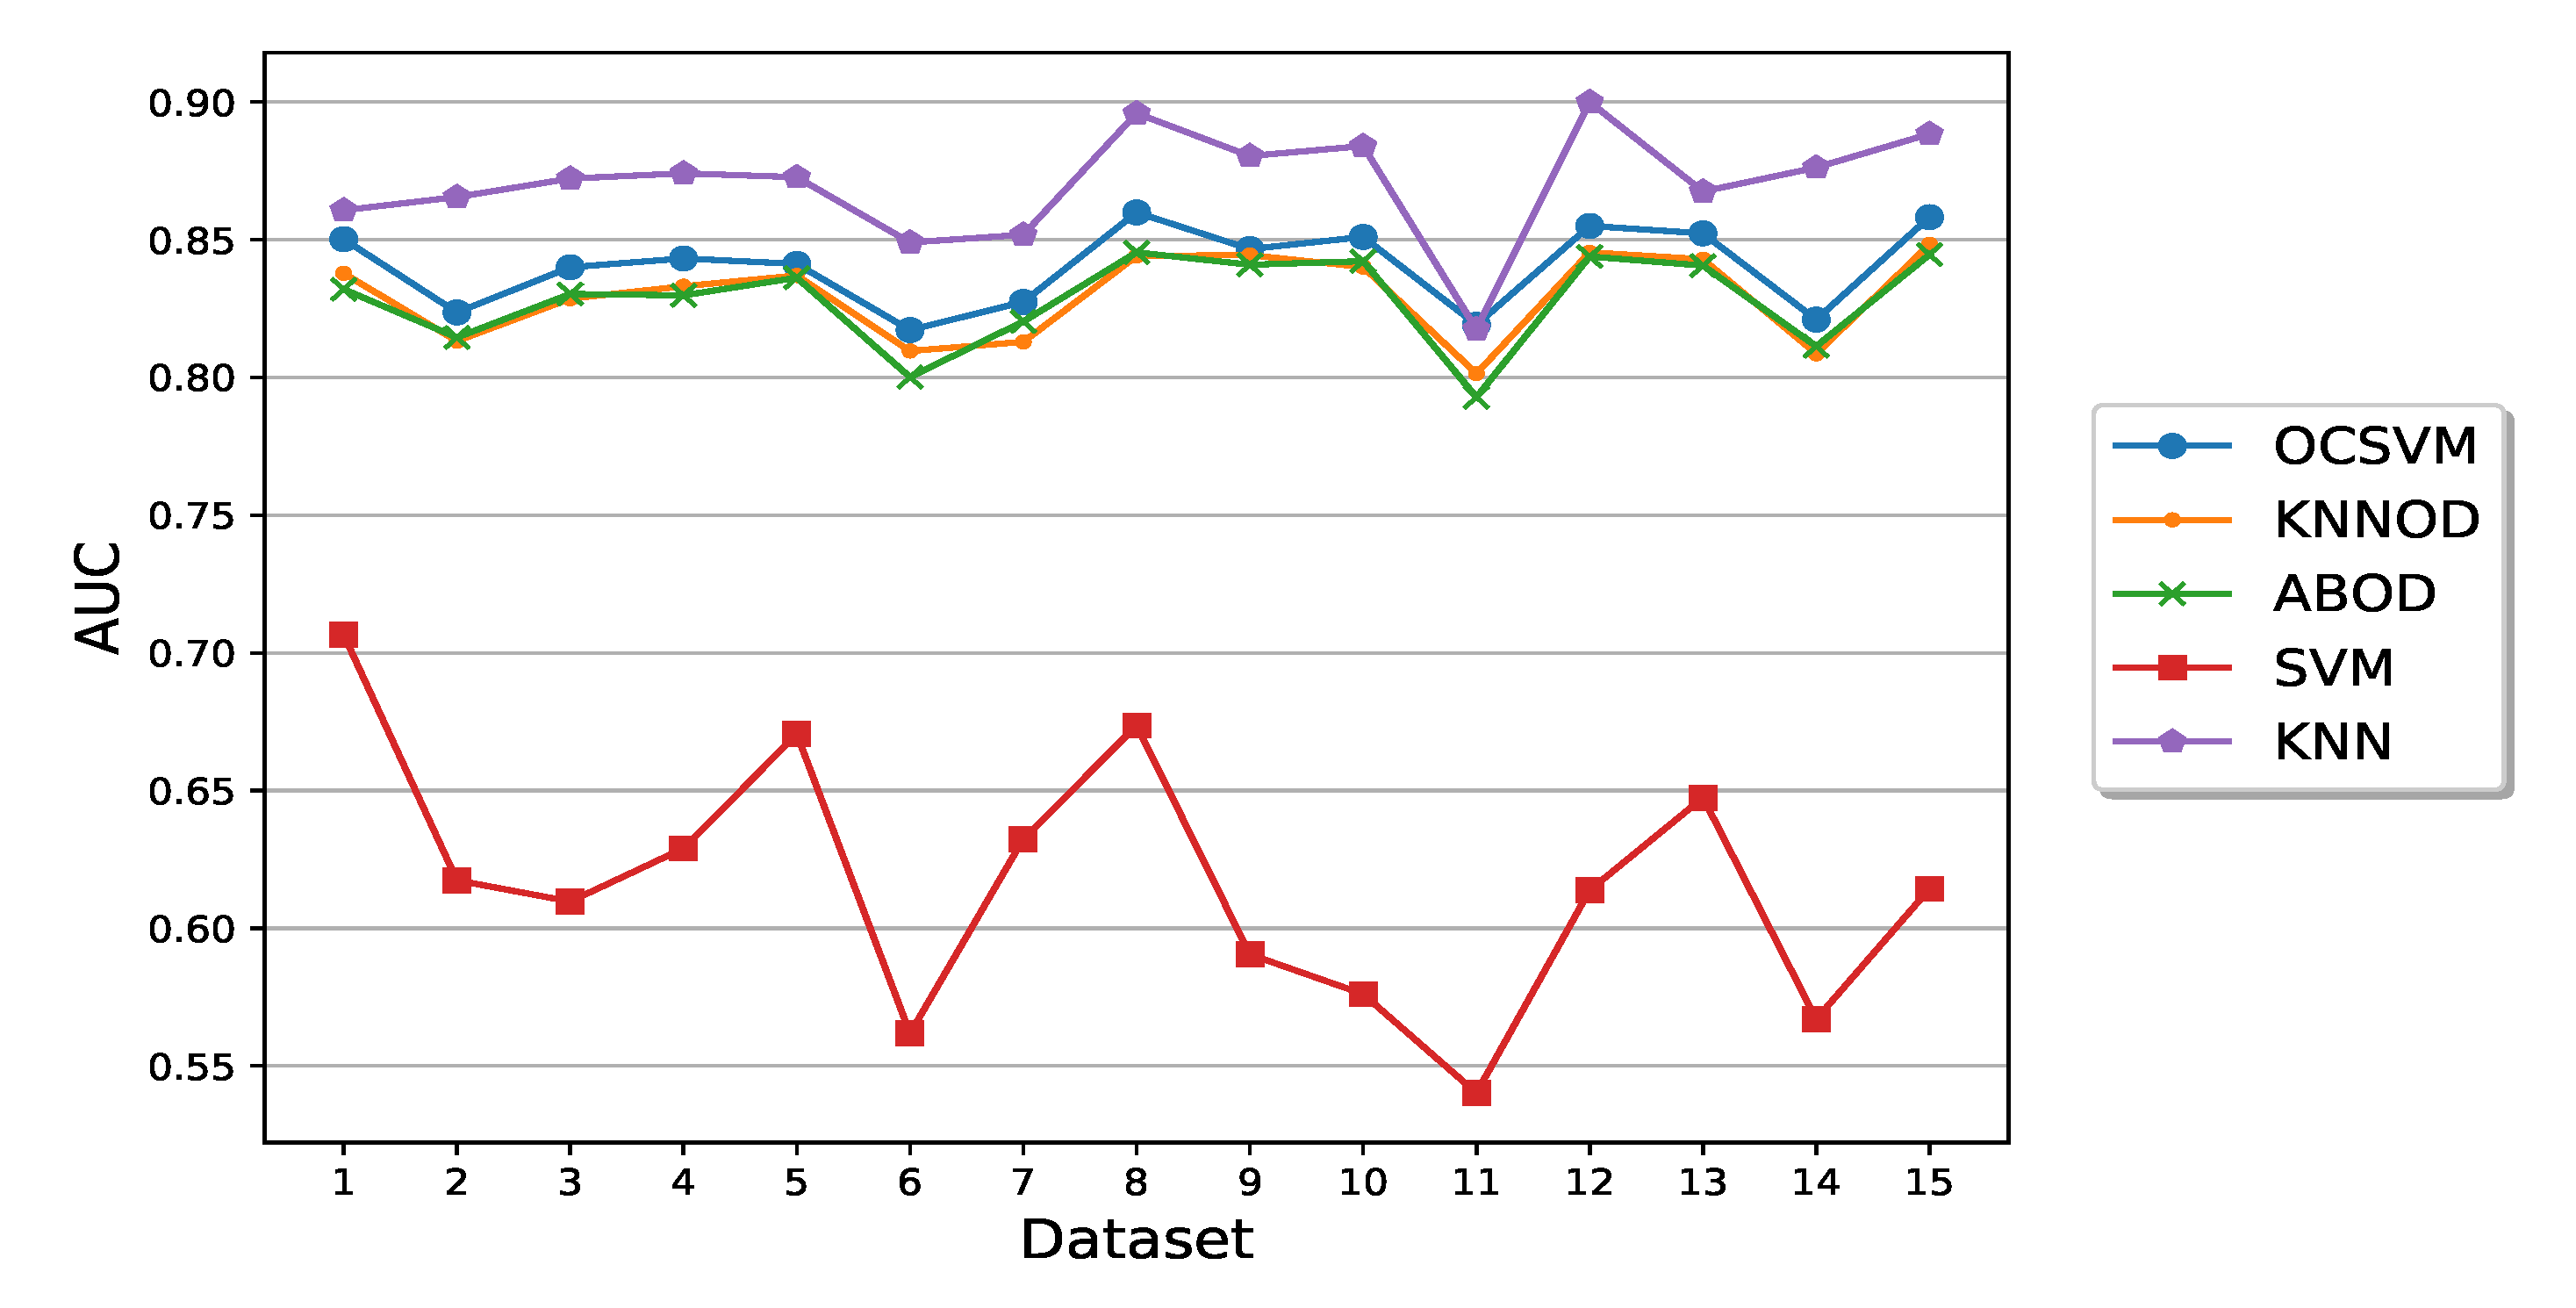
Examples of ROC curves are shown in Figure 13 which were obtained by the five semi-supervised and supervised algorithms on datasets 1 and 11 in one run. The performance of the algorithms in terms of average AUC on the 15 datasets are shown in Figure 14. Among all the algorithms, SVM had the worst performance while supervised KNN algorithm has significantly better average AUCs on 14 out of 15 datasets than other algorithms, as can be seen in Figure 14. The good performance of supervised KNN algorithm in terms of AUC is due to its significantly better TPR compared with the three semi-supervised algorithms when FPR is low as demonstrated by the ROC curves of Figure 13. On the other hand, one can also observe from Figure 13 that as FPR increases, the three semi-supervised algorithms can approach high TPR much quicker than an supervised KNN algorithm.
Similarly to Section 5.2, the detection threshold of a detection algorithm was obtained by using the distance to corner d to calculate the precision, recall, and score. It can be observed from Figure 15a that the three semi-supervised algorithms have slightly worse precision than the supervised KNN algorithm due to their higher FPRs. On the other hand, the two supervised algorithms have much worse recall than the three semi-supervised algorithms, as shown in Figure 15b. This indicates that semi-supervised algorithms have a better capability than supervised algorithms in finding attack events. Figure 15c shows that the overall performance of the three semi-supervised algorithms in terms of score are significantly better than those of the two supervised algorithms.
5.4. Performance Improvement with Deep Representation Learning
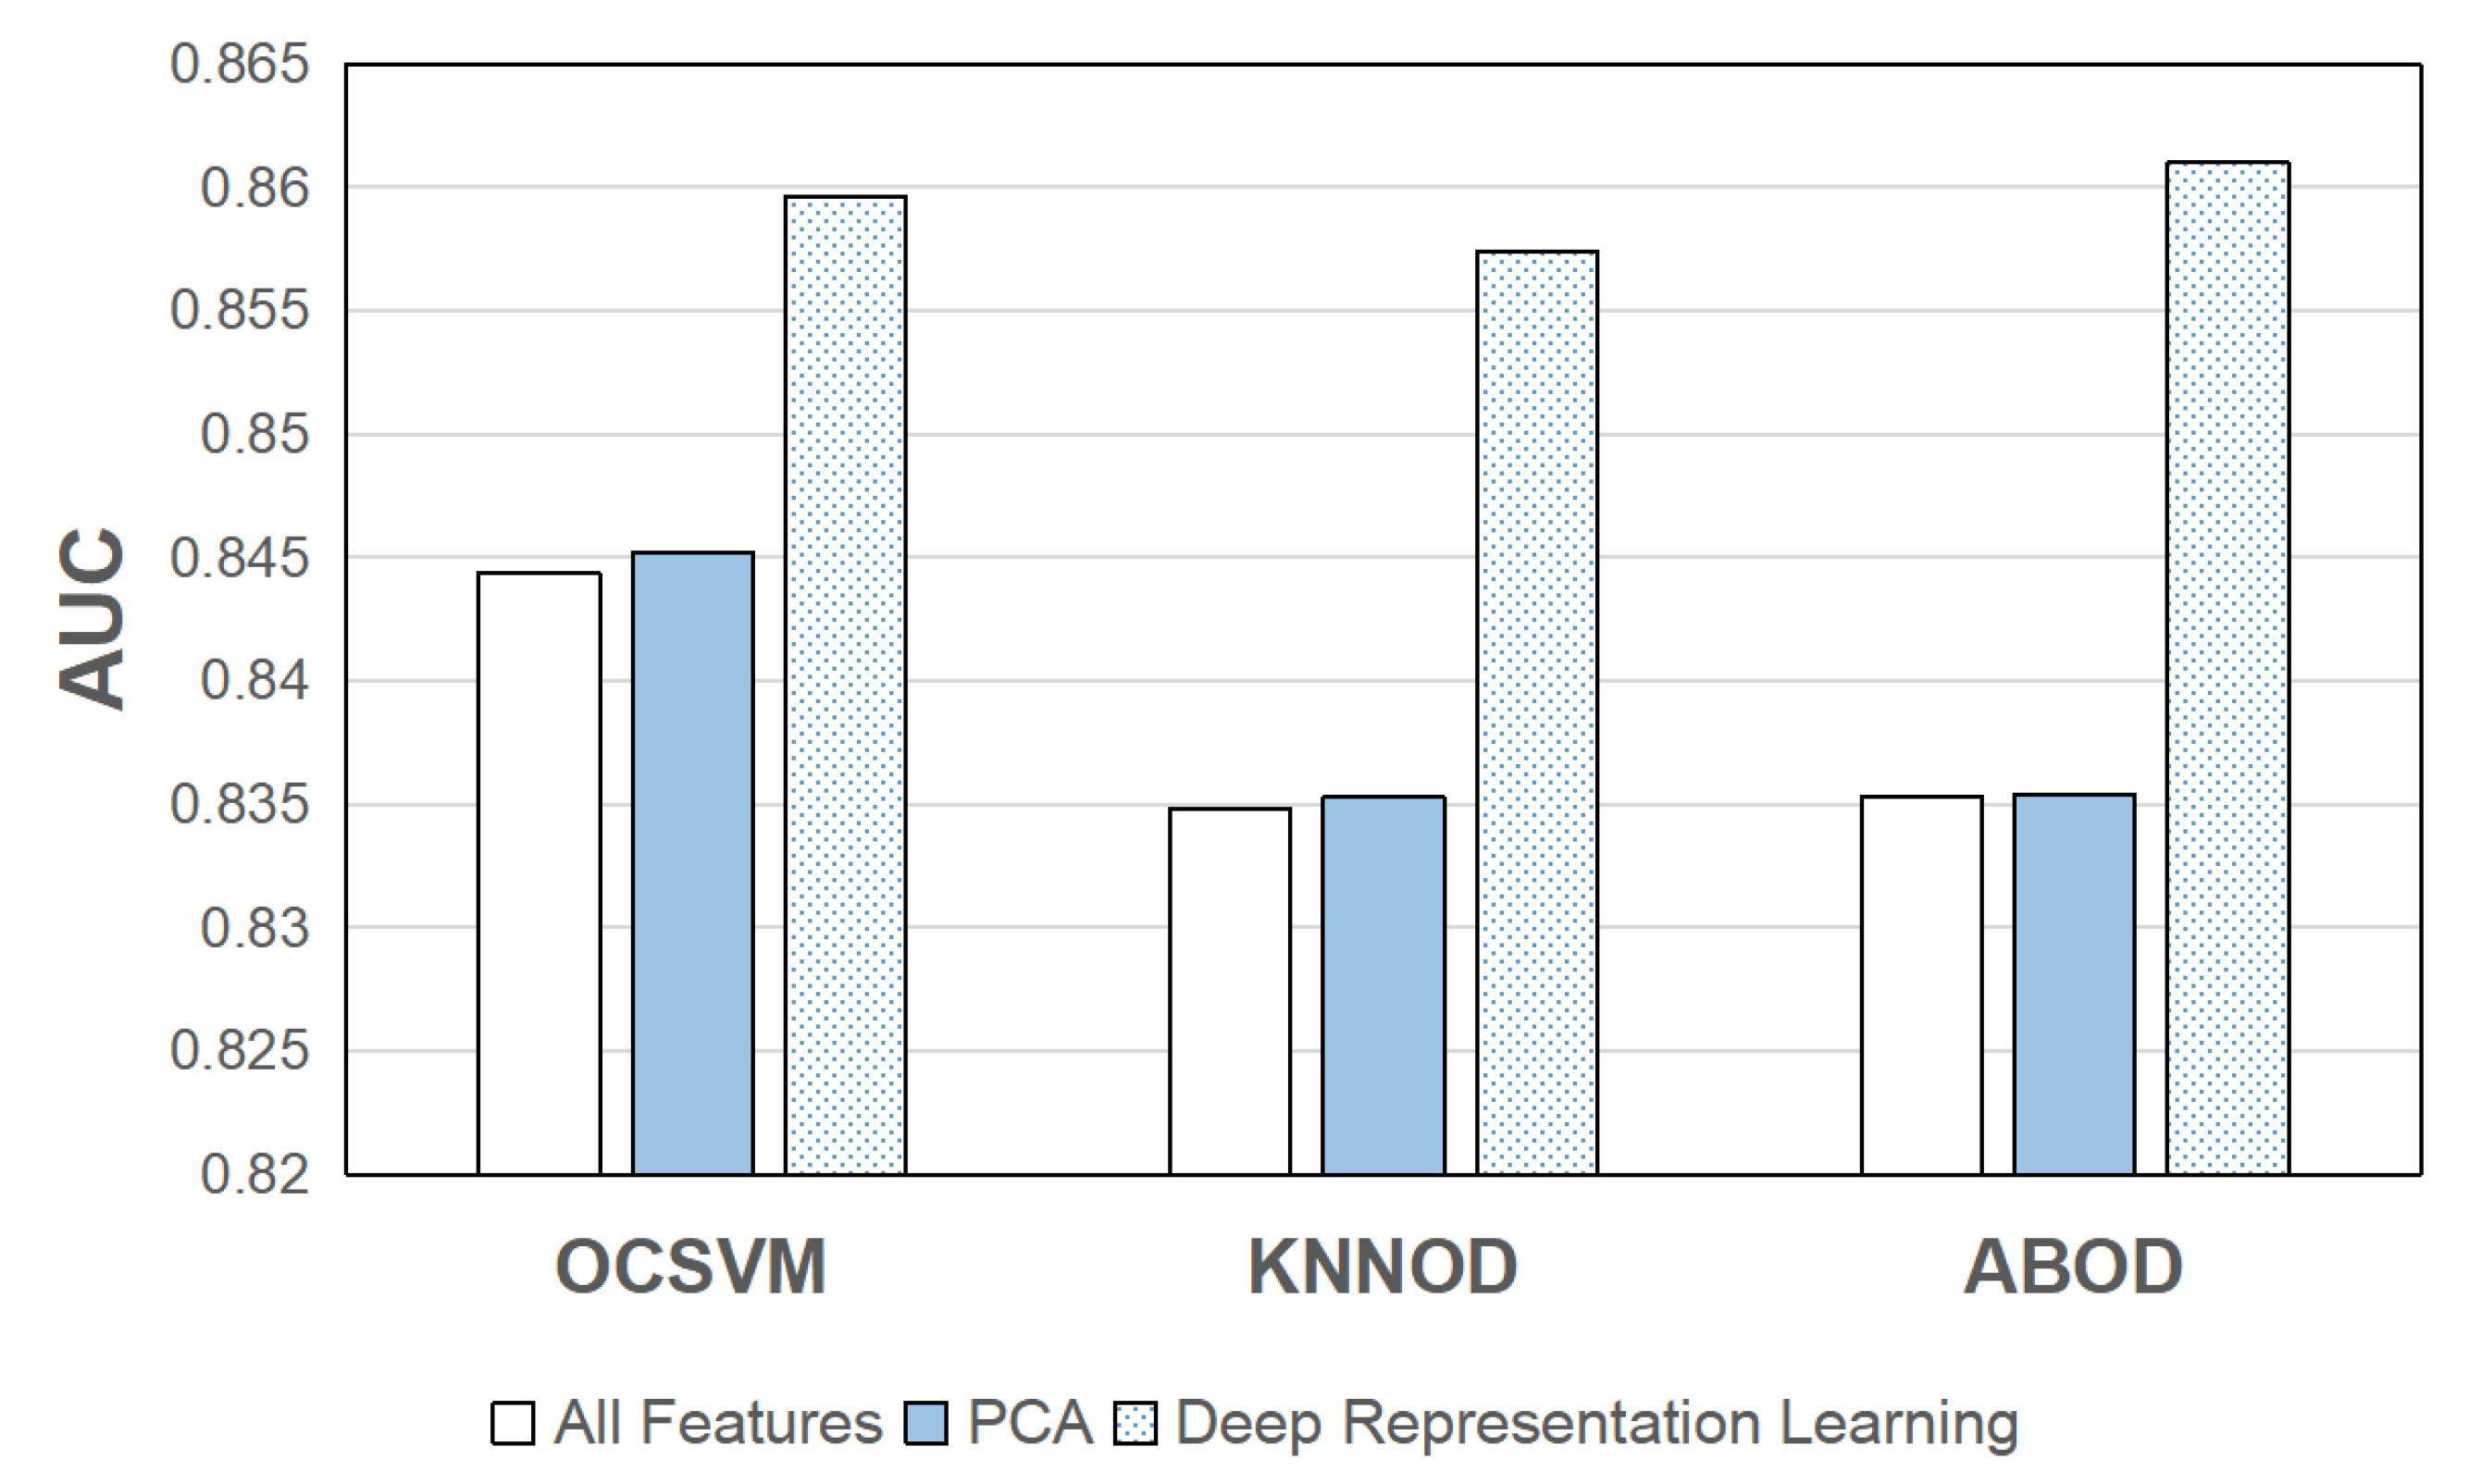
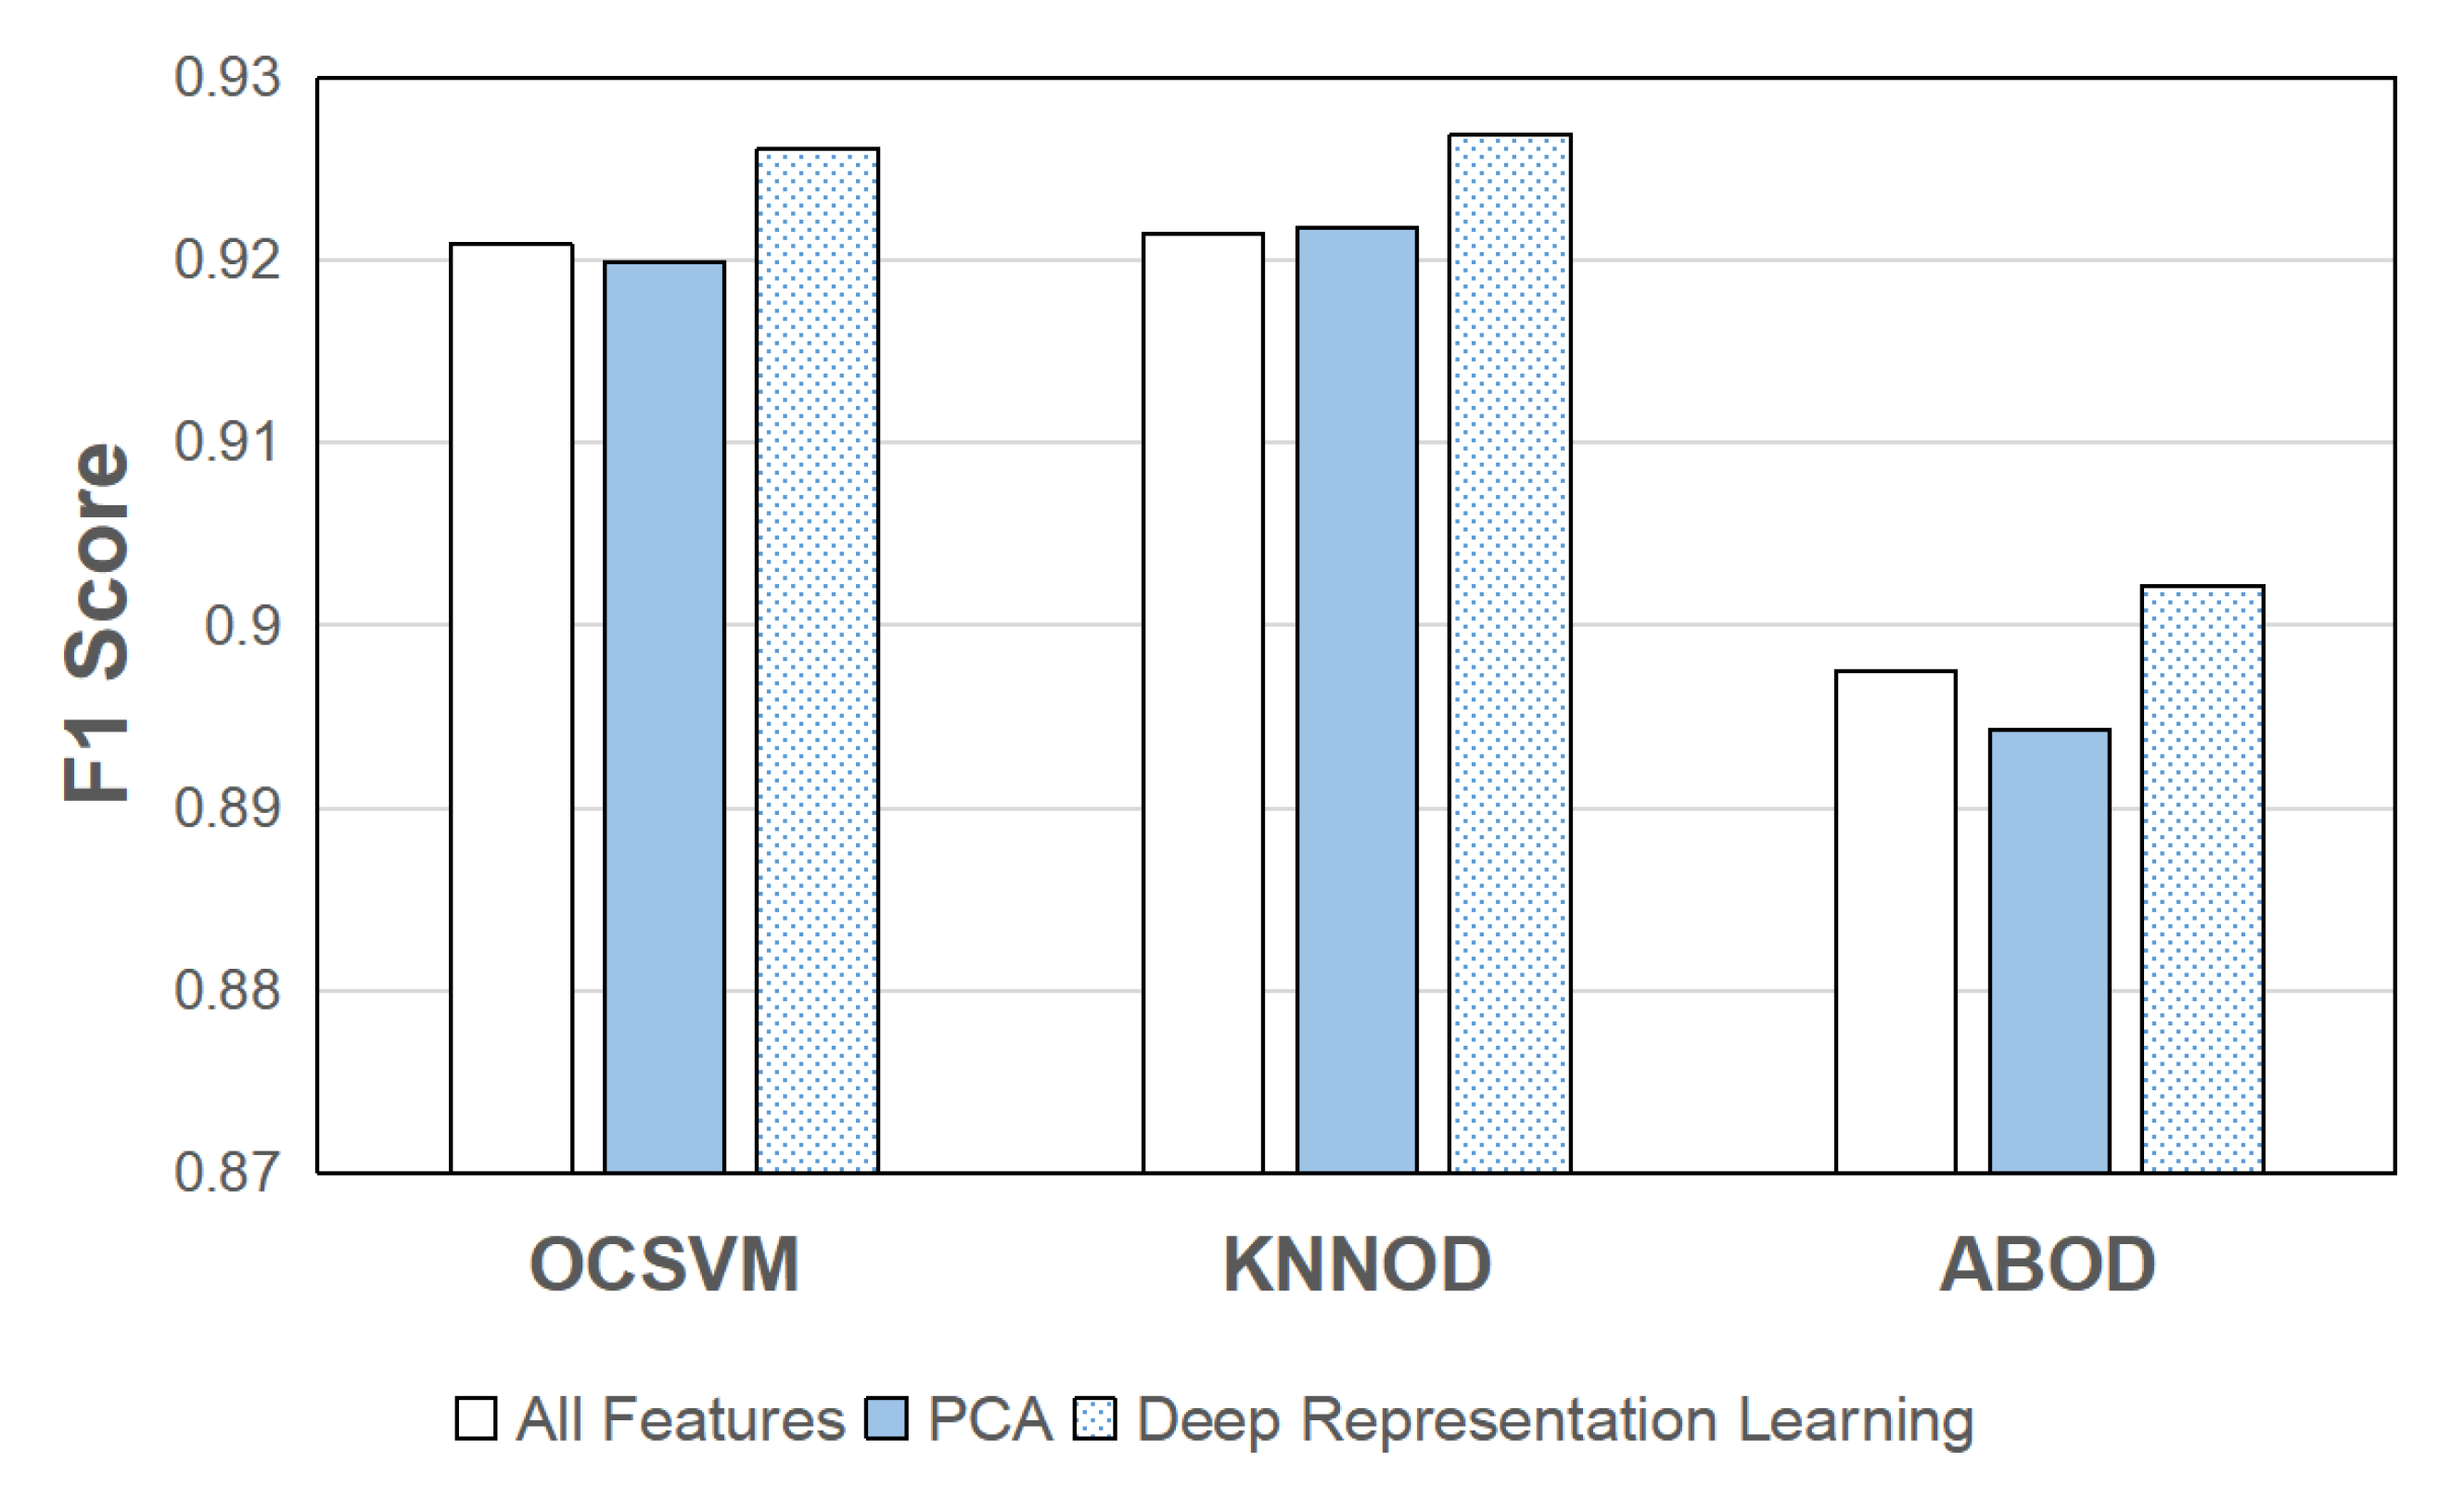
Finally, the impact of DAE-based deep representation learning on the performance of semi-supervised anomaly detection algorithms for detecting cyber attacks in smart grids was investigated. As mentioned in Section 4.2, PCA was adopted as the reference method for comparison. We set the number of extracted features as 30 for both DAE and PCA. The input and hidden layers of the encoder in the DAE have 116 and 60 nodes, respectively. The three best-performing semi-supervised algorithms in terms of average AUC, OCSVM, KNNOD, and ABOD, were included in this study. The results in terms of average AUC and average score are shown in Figure 16 to Figure 17, respectively, which were obtained by averaging the results of all runs of all 15 datasets. It can be observed from the figures that DAE can further improve the performance of the three semi-supervised algorithms in terms of both performance metrics. Statistical tests (two-sample paired t-test, ) show that the AUCs obtained by the three semi-supervised algorithms with deep representation learning are significantly higher than using all features (). The F1 scores obtained by OCSVM and KNNOD with deep representation learning are also significantly higher than using all features ( for both OCSVM and KNNOD). The p-value for ABOD is slightly higher than the significance level (). On the other hand, PCA does not perform well in improving the performance of the three semi-supervised algorithms. The p-values obtained by the three semi-supervised algorithms with PCA compared with using all features are all higher than 0.1. This shows that deep representation learning methods such as DAE are more powerful than linear feature extraction methods such as PCA in extracting discriminant features to improve the performance of semi-supervised anomaly detection algorithms for detecting cyber attacks in smart grids.
6. Conclusions and Future Work
Smart grids provide efficient power delivery and management by integrating advanced ICTs into traditional power grids. On the other hand, new security vulnerabilities introduced in the cyber domain could be exploited by potential adversaries to launch cyber attacks leading to devastating damages. By utilizing PMU measurements which bridge the physical and cyber domains, we developed a scheme based on semi-supervised anomaly detection and deep representation learning to detect cyber attacks in smart grids. Unlike supervised algorithms, semi-supervised anomaly detection algorithms only employ instances of normal events to train detection models, which makes them capable of detecting events of unknown attack types. The best-performing semi-supervised algorithms were identified in our experiments by using publicly available power system attack datasets. The performance comparison with popular supervised algorithms shows that semi-supervised algorithms have a better capability of finding attack events. In addition, our results show that the detection performance of semi-supervised algorithms can be further enhanced with DAE-based deep representation learning.
Although semi-supervised anomaly detection algorithms have shown good performance in finding attack events, our experiment results also show that they have a relatively high FPR compared with supervised algorithms. In the future, we aim to further improve the detection performance of semi-supervised algorithms by reducing the FPR. To achieve this goal, we will explore advanced techniques such as ensemble learning [45] and deep anomaly detection [46,47].
Author Contributions
Conceptualization, R.Q. and J.Z.; methodology, R.Q. and C.R.; software, R.Q. and C.R.; validation, R.Q., C.R. and R.L.; data curation, R.Q. and C.R.; writing—original draft preparation, R.Q., C.R., J.Z. and R.L.; writing—review and editing, R.Q. and J.Z.; visualization, R.Q. and J.Z.; supervision, J.Z.; project administration, J.Z.; funding acquisition, J.Z. All authors have read and agreed to the published version of the manuscript.
Funding
This research was supported by the National Science Foundation under grant CNS-1757945 and EPSCoR Cooperative Agreement OIA-1757207, and the Institute for Complex Additive Systems Analysis (ICASA) of New Mexico Institute of Mining and Technology.
Institutional Review Board Statement
Not applicable.
Informed Consent Statement
Not applicable.
Data Availability Statement
The power system cyber attack datasets are publicly available at https://sites.google.com/a/uah.edu/tommy-morris-uah/ics-data-sets (accessed on 25 June 2021).
Conflicts of Interest
The authors declare no conflict of interest. The funders had no role in the design of the study; in the collection, analyses, or interpretation of data; in the writing of the manuscript, or in the decision to publish the results.
References
- Gungor, V.C.; Sahin, D.; Kocak, T.; Ergut, S.; Buccella, C.; Cecati, C.; Hancke, G.P. Smart grid technologies: Communication technologies and standards. IEEE Trans. Ind. Inform. 2011, 7, 529–539. [Google Scholar] [CrossRef] [Green Version]
- Fang, X.; Misra, S.; Xue, G.; Yang, D. Smart grid—The new and improved power grid: A survey. IEEE Commun. Surv. Tutor. 2011, 14, 944–980. [Google Scholar] [CrossRef]
- Dileep, G. A survey on smart grid technologies and applications. Renew. Energy 2020, 146, 2589–2625. [Google Scholar] [CrossRef]
- Yu, R.; Zhang, Y.; Gjessing, S.; Yuen, C.; Xie, S.; Guizani, M. Cognitive radio based hierarchical communications infrastructure for smart grid. IEEE Netw. 2011, 25, 6–14. [Google Scholar] [CrossRef]
- Flick, T.; Morehouse, J. Securing the Smart Grid: Next Generation Power Grid Security; Elsevier: Amsterdam, The Netherlands, 2010. [Google Scholar]
- Hink, R.C.B.; Beaver, J.M.; Buckner, M.A.; Morris, T.; Adhikari, U.; Pan, S. Machine learning for power system disturbance and cyber-attack discrimination. In Proceedings of the 2014 7th International Symposium on Resilient Control Systems (ISRCS), Denver, CO, USA, 19–21 August 2014; pp. 1–8. [Google Scholar]
- Salmon, D.; Zeller, M.; Guzmán, A.; Mynam, V.; Donolo, M. Mitigating the aurora vulnerability with existing technology. In Proceedings of the 36th Annual Western Protection Relay Conference, Spokane, WA, USA, 20–22 October 2009. [Google Scholar]
- Karnouskos, S. Stuxnet worm impact on industrial cyber-physical system security. In Proceedings of the IECON 2011-37th Annual Conference of the IEEE Industrial Electronics Society, Melbourne, VIC, Australia, 7–10 November 2011; pp. 4490–4494. [Google Scholar]
- Alert, I.C. Cyber-Attack against Ukrainian Critical Infrastructure; Tech. Rep. ICS Alert (IR-ALERT-H-16-056-01); The Cybersecurity and Infrastructure Security Agency: Washington, DC, USA, 2016.
- Ashok, A.; Govindarasu, M.; Wang, J. Cyber-physical attack-resilient wide-area monitoring, protection, and control for the power grid. Proc. IEEE 2017, 105, 1389–1407. [Google Scholar] [CrossRef]
- Blair, S.; Burt, G.; Gordon, N.; Orr, P. Wide area protection and fault location: Review and evaluation of PMU-based methods. In Proceedings of the 14th International Conference on Developments in Power System Protection, Belfast, UK, 12–15 March 2018. [Google Scholar]
- Kim, T.T.; Poor, H.V. Strategic protection against data injection attacks on power grids. IEEE Trans. Smart Grid 2011, 2, 326–333. [Google Scholar] [CrossRef]
- Ozay, M.; Esnaola, I.; Vural, F.T.Y.; Kulkarni, S.R.; Poor, H.V. Sparse attack construction and state estimation in the smart grid: Centralized and distributed models. IEEE J. Sel. Areas Commun. 2013, 31, 1306–1318. [Google Scholar] [CrossRef] [Green Version]
- Chen, P.Y.; Yang, S.; McCann, J.A.; Lin, J.; Yang, X. Detection of false data injection attacks in smart-grid systems. IEEE Commun. Mag. 2015, 53, 206–213. [Google Scholar] [CrossRef] [Green Version]
- Rawat, D.B.; Bajracharya, C. Detection of false data injection attacks in smart grid communication systems. IEEE Signal Process. Lett. 2015, 22, 1652–1656. [Google Scholar] [CrossRef]
- Huang, Y.; Tang, J.; Cheng, Y.; Li, H.; Campbell, K.A.; Han, Z. Real-time detection of false data injection in smart grid networks: An adaptive CUSUM method and analysis. IEEE Syst. J. 2016, 10, 532–543. [Google Scholar] [CrossRef] [Green Version]
- Ozay, M.; Esnaola, I.; Vural, F.T.Y.; Kulkarni, S.R.; Poor, H.V. Machine learning methods for attack detection in the smart grid. IEEE Trans. Neural Netw. Learn. Syst. 2015, 27, 1773–1786. [Google Scholar] [CrossRef] [Green Version]
- Yan, J.; Tang, B.; He, H. Detection of false data attacks in smart grid with supervised learning. In Proceedings of the 2016 International Joint Conference on Neural Networks (IJCNN), Vancouver, BC, Canada, 24–29 July 2016; pp. 1395–1402. [Google Scholar]
- Singh, V.K.; Govindarasu, M. Decision tree based anomaly detection for remedial action scheme in smart grid using pmu data. In Proceedings of the 2018 IEEE Power & Energy Society General Meeting (PESGM), Portland, OR, USA, 5–10 August 2018; pp. 1–5. [Google Scholar]
- Wang, D.; Wang, X.; Zhang, Y.; Jin, L. Detection of power grid disturbances and cyber-attacks based on machine learning. J. Inf. Secur. Appl. 2019, 46, 42–52. [Google Scholar] [CrossRef]
- Sakhnini, J.; Karimipour, H.; Dehghantanha, A. Smart grid cyber attacks detection using supervised learning and heuristic feature selection. In Proceedings of the 2019 IEEE 7th International Conference on Smart Energy Grid Engineering (SEGE), Oshawa, ON, Canada, 12–14 August 2019; pp. 108–112. [Google Scholar]
- Esmalifalak, M.; Liu, L.; Nguyen, N.; Zheng, R.; Han, Z. Detecting stealthy false data injection using machine learning in smart grid. IEEE Syst. J. 2014, 11, 1644–1652. [Google Scholar] [CrossRef]
- Ahmed, S.; Lee, Y.; Hyun, S.H.; Koo, I. Unsupervised machine learning-based detection of covert data integrity assault in smart grid networks utilizing isolation forest. IEEE Trans. Inf. Forensics Secur. 2019, 14, 2765–2777. [Google Scholar] [CrossRef]
- Maglaras, L.A.; Jiang, J. Intrusion detection in SCADA systems using machine learning techniques. In Proceedings of the 2014 Science and Information Conference, London, UK, 27–29 August 2014; pp. 626–631. [Google Scholar]
- Maglaras, L.A.; Jiang, J. Ocsvm model combined with k-means recursive clustering for intrusion detection in scada systems. In Proceedings of the 10th International Conference on Heterogeneous Networking for Quality, Reliability, Security and Robustness, Rhodes, Greece, 18–20 August 2014; pp. 133–134. [Google Scholar]
- Song, F.; Guo, Z.; Mei, D. Feature selection using principal component analysis. In Proceedings of the 2010 International Conference on System Science, Engineering Design and Manufacturing Informatization, Yichang, China, 12–14 November 2010; Volume 1, pp. 27–30. [Google Scholar]
- Oh, M.; Zhang, L. DeepMicro: Deep representation learning for disease prediction based on microbiome data. Sci. Rep. 2020, 10, 6026. [Google Scholar]
- Aggarwal, C.C. An introduction to outlier analysis. In Outlier Analysis; Springer: Berlin/Heidelberg, Germany, 2017; pp. 1–34. [Google Scholar]
- Schölkopf, B.; Williamson, R.C.; Smola, A.J.; Shawe-Taylor, J.; Platt, J.C. Support vector method for novelty detection. NIPS 1999, 12, 582–588. [Google Scholar]
- Goldstein, M.; Dengel, A. Histogram-based outlier score (hbos): A fast unsupervised anomaly detection algorithm. In Proceedings of the 35th Annual German Conference on Artificial Intelligence, Saarbrücken, Germany, 24–27 September 2012; pp. 59–63. [Google Scholar]
- Paulauskas, N.; Baskys, A. Application of Histogram-Based Outlier Scores to Detect Computer Network Anomalies. Electronics 2019, 8, 1251. [Google Scholar] [CrossRef] [Green Version]
- Breunig, M.M.; Kriegel, H.P.; Ng, R.T.; Sander, J. LOF: Identifying density-based local outliers. In Proceedings of the 2000 ACM SIGMOD International Conference on Management of Data, Dallas, TX, USA, 15–18 May 2000; pp. 93–104. [Google Scholar]
- He, Z.; Xu, X.; Deng, S. Discovering cluster-based local outliers. Pattern Recognit. Lett. 2003, 24, 1641–1650. [Google Scholar] [CrossRef]
- He, Z.; Xu, X.; Deng, S. Squeezer: An efficient algorithm for clustering categorical data. J. Comput. Sci. Technol. 2002, 17, 611–624. [Google Scholar] [CrossRef]
- Kriegel, H.P.; Schubert, M.; Zimek, A. Angle-based outlier detection in high-dimensional data. In Proceedings of the 14th ACM SIGKDD International Conference on Knowledge Discovery and Data Mining, Las Vegas, NV, USA, 24–27 August 2008; pp. 444–452. [Google Scholar]
- Hinneburg, A.; Aggarwal, C.C.; Keim, D.A. What is the nearest neighbor in high dimensional spaces? In Proceedings of the 26th International Conference on Very Large Databases, Cairo, Egypt, 10–14 September 2000; pp. 506–515. [Google Scholar]
- Aggarwal, C.C.; Hinneburg, A.; Keim, D.A. On the surprising behavior of distance metrics in high dimensional space. In Proceedings of the International Conference on Database Theory (ICDT), London, UK, 4–6 January 2001; pp. 420–434. [Google Scholar]
- Ramaswamy, S.; Rastogi, R.; Shim, K. Efficient algorithms for mining outliers from large data sets. In Proceedings of the 2000 ACM SIGMOD International Conference on Management of Data, Dallas, TX, USA, 15–18 May 2000; pp. 427–438. [Google Scholar]
- Angiulli, F.; Pizzuti, C. Fast outlier detection in high dimensional spaces. In Proceedings of the European Conference on Principles of Data Mining and Knowledge Discovery (PKDD), Helsinki, Finland, 19–23 August 2002; pp. 15–27. [Google Scholar]
- Lazarevic, A.; Kumar, V. Feature bagging for outlier detection. In Proceedings of the Eleventh ACM SIGKDD International Conference on Knowledge Discovery in Data Mining, Chicago, IL, USA, 22–24 August 2005; pp. 157–166. [Google Scholar]
- Liu, F.T.; Ting, K.M.; Zhou, Z.H. Isolation forest. In Proceedings of the 2008 Eighth IEEE International Conference on Data Mining, Pisa, Italy, 15–19 December 2008; pp. 413–422. [Google Scholar]
- Zhao, Y.; Nasrullah, Z.; Li, Z. Pyod: A python toolbox for scalable outlier detection. arXiv 2019, arXiv:1901.01588. [Google Scholar]
- Coffin, M.; Sukhatme, S. Receiver operating characteristic studies and measurement errors. Biometrics 1997, 53, 823–837. [Google Scholar] [CrossRef] [PubMed]
- Perkins, N.J.; Schisterman, E.F. The inconsistency of “optimal” cutpoints obtained using two criteria based on the receiver operating characteristic curve. Am. J. Epidemiol. 2006, 163, 670–675. [Google Scholar] [CrossRef] [Green Version]
- Wang, B.; Mao, Z. A dynamic ensemble outlier detection model based on an adaptive k-nearest neighbor rule. Inf. Fusion 2020, 63, 30–40. [Google Scholar] [CrossRef]
- Akcay, S.; Atapour-Abarghouei, A.; Breckon, T.P. Ganomaly: Semi-supervised anomaly detection via adversarial training. In Proceedings of the Asian Conference on Computer Vision (ACCV), Perth, Australia, 2–6 December 2018; pp. 622–637. [Google Scholar]
- Pang, G.; Shen, C.; Cao, L.; Hengel, A.V.D. Deep learning for anomaly detection: A review. ACM Comput. Surv. (CSUR) 2021, 54, 1–38. [Google Scholar] [CrossRef]
Figure 1.
The architecture of a smart grid.

Figure 2.
Supervised anomaly detection vs. semi-supervised anomaly detection.

Figure 3.
Power system framework [6].
Figure 3.
Power system framework [6].

Figure 4.
Proposed method to detect cyber attacks in smart grids with semi-supervised anomaly detection and deep representation learning.
Figure 4.
Proposed method to detect cyber attacks in smart grids with semi-supervised anomaly detection and deep representation learning.

Figure 6.
An illustration of OCSVM.

Figure 7.
An illustration of reachability distance.

Figure 8.
An illustration of ABOD.

Figure 9.
An illustration of iForest.

Figure 10.
Examples of ROC curves obtained from semi-supervised anomaly detection algorithms using all features on datasets 1 and 11 in one run of the experiment.
Figure 10.
Examples of ROC curves obtained from semi-supervised anomaly detection algorithms using all features on datasets 1 and 11 in one run of the experiment.

Figure 11.
Performance of semi-supervised anomaly detection algorithms using all features in terms of average AUC.
Figure 11.
Performance of semi-supervised anomaly detection algorithms using all features in terms of average AUC.

Figure 12.
Performances of semi-supervised anomaly detection algorithms using all features in terms of average precision, recall, and score.
Figure 12.
Performances of semi-supervised anomaly detection algorithms using all features in terms of average precision, recall, and score.

Figure 13.
Examples of ROC curves obtained by semi-supervised and supervised algorithms using all features on datasets 1 and 11 in one run of the experiment.
Figure 13.
Examples of ROC curves obtained by semi-supervised and supervised algorithms using all features on datasets 1 and 11 in one run of the experiment.

Figure 14.
Performance comparison of semi-supervised and supervised algorithms in terms of average AUC.
Figure 14.
Performance comparison of semi-supervised and supervised algorithms in terms of average AUC.

Figure 15.
Performance comparison of the semi-supervised algorithms with supervised algorithms in terms of average precision, recall, and score.
Figure 15.
Performance comparison of the semi-supervised algorithms with supervised algorithms in terms of average precision, recall, and score.

Figure 16.
Performance of semi-supervised algorithms with and without feature extraction in terms of average AUC.
Figure 16.
Performance of semi-supervised algorithms with and without feature extraction in terms of average AUC.

Figure 17.
Performance of semi-supervised algorithms with and without feature extraction in terms of average score.
Figure 17.
Performance of semi-supervised algorithms with and without feature extraction in terms of average score.


Table 1.
Summary of operational scenarios and events.
| Scenario No. | Description of Event | Event Type |
|---|---|---|
| 1–6 | Short-circuit fault | Natural |
| 13, 14 | Line maintenance | Natural |
| 7–12 | Data injection | Attack |
| 15–20 | Remote tripping command injection | Attack |
| 21–30, 35–40 | Relay setting change | Attack |
| 41 | Normal readings | No Event |
Table 2.
Description of features measured by a PMU.
| Features (No.) | Description |
|---|---|
| PA1:VH-PA3:VH (1–3) | Phase A–Phase C Voltage Phase Angle |
| PM1:V-PM3:V (4–6) | Phase A–Phase C Voltage Magnitude |
| PA4:IH-PA6:IH (7–9) | Phase A–Phase C Current Phase Angle |
| PM4:I-PM6:I (10–12) | Phase A–Phase C Current Magnitude |
| PA7:VH-PA9:VH (13–15) | Pos.–Neg.–Zero Voltage Phase Angle |
| PM7:V-PM9:V (16–18) | Pos.–Neg.–Zero Voltage Magnitude |
| PA10:VH-PA12:VH (19–21) | Pos.–Neg.–Zero Current Phase Angle |
| PM10:V-PM12:V (21–24) | Pos.–Neg.–Zero Current Magnitude |
| F (25) | Frequency for Relays |
| DF (26) | Frequency Delta (dF/dt) for Relays |
| PA:Z (27) | Appearance Impedance for Relays |
| PA:ZH (28) | Appearance Impedance Angle for Relays |
| S (29) | Status Flag for Relays |
Table 3.
Parameters used by the semi-supervised and supervised algorithms investigated in our study.
Table 3.
Parameters used by the semi-supervised and supervised algorithms investigated in our study.
| Algorithm | Parameters |
|---|---|
| OCSVM | RBF kernel, degree = 3, |
| HBOS | # of Bins = 50 |
| LOF | |
| CBLOF | # of Clusters = 50, , |
| ABOD | |
| KNNOD | |
| Feature bagging | # of base learners = 10, base learner = LOF |
| iForest | # of iTrees = 100 |
| KNN | |
| SVM | RBF kernel, degree = 3, |
Publisher’s Note: MDPI stays neutral with regard to jurisdictional claims in published maps and institutional affiliations. |
© 2021 by the authors. Licensee MDPI, Basel, Switzerland. This article is an open access article distributed under the terms and conditions of the Creative Commons Attribution (CC BY) license (https://creativecommons.org/licenses/by/4.0/).
Share and Cite
MDPI and ACS Style
Qi, R.; Rasband, C.; Zheng, J.; Longoria, R. Detecting Cyber Attacks in Smart Grids Using Semi-Supervised Anomaly Detection and Deep Representation Learning. Information 2021, 12, 328. https://0-doi-org.brum.beds.ac.uk/10.3390/info12080328
AMA Style
Qi R, Rasband C, Zheng J, Longoria R. Detecting Cyber Attacks in Smart Grids Using Semi-Supervised Anomaly Detection and Deep Representation Learning. Information. 2021; 12(8):328. https://0-doi-org.brum.beds.ac.uk/10.3390/info12080328
Chicago/Turabian StyleQi, Ruobin, Craig Rasband, Jun Zheng, and Raul Longoria. 2021. "Detecting Cyber Attacks in Smart Grids Using Semi-Supervised Anomaly Detection and Deep Representation Learning" Information 12, no. 8: 328. https://0-doi-org.brum.beds.ac.uk/10.3390/info12080328
Note that from the first issue of 2016, this journal uses article numbers instead of page numbers. See further details here.