
Studying and Clustering Cities Based on Their Non-Emergency Service Requests


Department of Information Sciences and Technology, George Mason University, Fairfax, VA 22030, USA
Information 2021, 12(8), 332; https://0-doi-org.brum.beds.ac.uk/10.3390/info12080332
Submission received: 26 July 2021
/
Revised: 11 August 2021
/
Accepted: 16 August 2021
/
Published: 19 August 2021
Abstract
:This study offers a new perspective in analyzing 311 service requests (SRs) across the country by representing cities based on the types of their SRs. This not only uncovers temporal patterns of SRs in each city over the years but also detects cities with the most or least similarity to other cities based on their SR types. The first challenge is to gather 311 SRs for different cities and standardize their types since they differ in various cities. Implementing our analyses on close to 42 million SR records in 20 cities from 2006 to 2019 is the second challenge. Representing clusters of cities and outliers effectively, and providing justifications for them, is the last challenge. Our attempt resulted in 79 standardized SR types. We applied the principal component analysis to depict cities on a two-dimensional canvas based on their standardized SR types. Among our main findings are the following: many cities are observing a fall in requests regarding the condition of roads and sidewalks but a rise in requests concerning transportation and traffic; requests regarding garbage, cleaning, rodents, and complaints have also been rising in some cities; new types of requests have emerged and soared in recent years, such as requests for information and regarding shared mobility devices; requests about parking meters, information, sidewalks, curbs, graffities, and missed garbage pick up have the highest variance in their rates across different cities, i.e., they have a large rate in some cities while a low rate in others; the most consistent outliers, in terms of SR types, are Washington DC, Baltimore, Las Vegas, Philadelphia, Chicago, and Baton Rouge.
1. Introduction
The 311 services offer a centralized platform for residents to report non-emergency problems, request municipal services, and obtain information about the city services. Examples of non-emergency issues include tree debris, graffities, potholes, and sanitation complaints. The 311 number was reserved in the United States in February 1997 for reporting non-emergency problems by the U.S. Federal Communication Commission [1]. Its pilot program was initiated in Baltimore in October 1996 [2,3] and then expanded to other American, Canadian, and West European countries, such as Germany, Finland, Sweden, and the United Kingdom. In addition to phone calls, requests can be submitted by text message, email, walk-ins, mobile applications, web forms, and social media [4].
It was originally intended to allow citizens to voluntarily police their community for non-emergency municipal problems and identify areas of needed service. It was created in response to the 911 number being overwhelmed by both emergency and non-emergency calls. With many cities keeping track of 311 SRs and accumulating them over the years, a valuable and large set of these reports, with spatial and temporal tags, is created. Opening this dataset to the public has incentivized researchers to mine different patterns and relationships among SRs, some of which are reviewed in Section 2.
Unfortunately, cities across the United States apply different coding conventions in recording their 311 SRs and are inconsistent in their SR types. This lack of data standardization is a major hurdle in performing machine-learning analyses on cities collectively and has limited the spatial extent of many studies in the literature to one city. Section 3 provides further details about these inconsistencies and how they are overcome in this study.
Our collection and standardization of 42 million geocoded SR events has the potential to reveal important information about the distribution of government-provided services and physical conditions across the country. This study provides visualizations of these distributions, their temporal development over the years, and their variations across cities. This would potentially provide insight into the underlying causes and pave the way to more coordinated, comprehensive, and informed responses to municipal problems. This work is distinguished from its predecessors not only in its purpose but also in the data size, the novelty of the analysis, and findings. Section 4 explains our methodology for clustering cities and Section 5 presents and discusses the results. Section 6 concludes this study with some future research venues.
2. Related Work
Chatfield and Reddick [5] highlighted the lack of 311 data analytics usage in critical processes by municipalities to enable them in sensing and responding to citizens’ needs in an agile, adaptive, and coordinated way and to create public values. For instance, 311 data analytics could be used in monitoring emerging trends, budget allocations [6], to gain a better understanding of citizens’ satisfaction with government services performance [7], and to move towards the ultimate goal of smarter cities [8].
Kernel density estimation (KDE) in spatial analysis converts a set of points or events into a cell-based density surface. In other words, a grid is laid over the points and the density of points in each cell is estimated and smoothed using a kernel, such as the Gaussian kernel. This density reflects the likelihood of an event happening in that cell. The spatial–temporal KDE, proposed by Brunsdon et al. [9], estimates the likelihood of an event occurring at location s and time t through the following equation, where (si, ti) is the i-th observed event, n is the total number of observed events, Ks and Kt are spatial and temporal kernels (an example of which is the Gaussian kernel), and hs and ht are those kernels’ bandwidths.
Arguing that the above KDE approach models space and time independently, Xu et al. [3] proposed the following equation to estimate the likelihood of an event occurring at location s and time t:
In this equation, the temporal kernel (Kt) is replaced with a temporal weight (w). The temporal weight is multiplied by the output of the spatial kernel. The temporal weight is determined based on a temporal autocorrelation model that considers the trend and weekly seasonality. Based on the time difference between t and ti, the temporal autocorrelation model assigns a weight to the i-th event that will be multiplied by Ks(s − si). The temporal autocorrelation model is separately developed for each spatial–temporal window (S, T). Only events falling in (S, T) would participate in developing the autocorrelation model for this window. Additionally, only events falling in the (S, T) window that contain s would participate in calculating p(s,t) in Equation (2). The subscript in indicates this condition. Xu et al. used this model to forecast the daily number of sanitation SRs (e.g., garbage cart problems and general cleaning) in Chicago from 2011 to 2016. They considered four weeks as their temporal window (T) and community areas or neighborhoods as their spatial window (S), of which there are 77 in Chicago. Their model resulted in almost the same root mean square error (RMSE) as the Brunsdon et al. [9] model in Equation (1).
Wang et al. [10] applied k-means clustering to census tracts in Chicago, Boston, and New York City (NYC), from 2012 to 2015, based on their relative frequency of SR types. They showed that these clusters are homogeneous in terms of income, racial decomposition, employment, and education. They also showed a correlation between house prices and SR types at the zip code level. Minkoff [11] showed that, in NYC from 2007 to 2012, government-sponsored services, such as repairing streets and sidewalks and general cleaning, are over reported in census tracts with higher rates of income, children under 18, and homeownership, and lower rates of minorities, and older houses. Noise and graffiti related problems are under reported in the same census tracts. Clark et al. [12] showed that the Hispanic population in Boston underuses the 311 service. Kontokosta et al. [13] showed that neighborhoods with higher educational attainment, higher proportions of female, elderly, non-Hispanic White, and Asian residents, along with neighborhoods with higher incomes and rents in NYC, over report no heat or no hot water in the building via the 311 service. They further showed that neighborhoods with non-English speakers, higher unemployment rates, and higher proportions of minority populations, male residents, and unmarried adults under report these problems. O’Brien [14] showed that most 311 services in Boston are requested by people who live within two blocks of the location where the service is requested and three quarters of the 311 services are requested by homeowners.
White and Trump [15] showed that lower voter turnout and higher campaign donations are observed in NYC neighborhoods with higher volumes of 311 SRs. Wheeler [16] used linear regression to show that the number of non-emergency reports regarding detritus and infrastructure problems has only a small correlation with the rate of serious crimes, such as robbery and homicide, in Washington DC. Lu and Johnson [17] showed that in Edmonton, Canada from 2013 to 2015, there has been a shift from phone calls to internet-based channels for requesting 311 services. They also showed that younger people with a college degree and non-citizens prefer internet-based channels, while older people without a college degree and citizens prefer phone calls for requesting 311 services.
Our work is not only different from previous works in its purpose but it also takes a large step forward in terms of the data size and the novelty of the analysis. We have collected 311 SR records for 20 cities across the United States for their available history. We standardized the attribute names and SR types across the cities and years. This allowed us to compare SR type distributions over the years and among the cities and to find cities with similar or dissimilar types of SRs in each year. This study’s findings provide insight into the temporal and spatial patterns of SR types, providing municipalities and local governments with a picture of where their city used to stand, where it stands right now, where it is headed in the future, and how it compares with other cities.
3. Data Description
A comprehensive effort has been made to collect the 311 SR records for all cities in the United States, as long as they are open to the public. One of the largest centers providing municipal data about cities in the United States is the US City Open Data Census (USCODC). This center provides the link to 311 SR records in any US city, if it is open to the public. The first issue was that not all links were operational at the time. After careful sweeping of those links on 29 June 2020, the 311 SRs were downloaded for 20 cities, for all the years that the data were available. For each city, only years for which the SRs are available for the entire year (i.e., from 1 January to 31 December) are preserved in our collection. This prevents underestimating the number of SRs for that year in that city. Our collection contains a total of 42 million SRs for 20 cities from 2006 to 2019, although not all cities have their data available for all these years. Table 1 lists the number of SRs per city and year in our dataset.
SR records published by different cities across the United States do not follow the same standard, if any. This has resulted in inconsistencies in the number, title, content, style, separator, and order of attributes in different datasets. Additionally, and more importantly to this study, SR types have inconsistent names in different cities. We manually standardized the aforementioned items in our dataset. More details about this standardization are provided in Section 4.1.
4. Methodology for Clustering Cities
We intend to find US cities that receive similar types of SRs with similar proportions. In other words, we want to find out what US cities face mostly similar or significantly different types of municipal problems. To this aim, we need to standardize SR types and create a feature vector for each city. Each standardized SR type is a feature. A feature vector refers to a vector containing the frequency of each standardized SR type. Section 4.1 discusses how the feature vector for each city is constructed and Section 4.2 explains our clustering method.
4.1. Feature Vectors
As mentioned before, the names of SR types are not standardized across different cities. Therefore, features do not overlap in different cities, which results in long and sparse feature vectors, which in turn results in every city having a zero similarity to any other city. This undermines the clustering results. We need cities to have standard names for their SR types. In other words, if two features represent the same concept in two different cities, they should have the same name in both cities. We used the description of each SR, metadata, and manuals describing the SR types for each city to understand and unify the names of SR types. Before standardizing SR types, there were a total of 6227 different SR types in the entire dataset. After standardization, this number reduced to 79. These 79 standardized SR types cover 95% of SR records in the entire dataset. Table 2 lists the standardized SR types, grouped in 12 general categories.
SR types with instances only in one city, as well as unspecific SR types, such as “Other”, “Request for service”, or “General” are omitted. Those omitted records represent 5% of the entire dataset, their type is referred to as “Other” in the rest of this paper, and their SR types are not reported in Table 2 because of their large number. Not only is the SR type “Other” ineffective in clustering, but also this consideration remarkably reduces the number of standardized SR types. In other words, clustering the cities will happen only based on the 79 standardized SR types, because the SR type “Other” does not represent the same SR type in different cities. However, SRs with the type “Other” will be considered when the relative frequency of each standardized SR type is calculated, in order to assure that the relative frequencies reflect each city’s dataset in its entirety.
The data are available for multiple years at each city. To fairly cluster the cities, we do not mix SRs from different years into one set. Rather, we offer a different clustering of cities for each single year. Therefore, each city will have a different feature vector for each year. Each year, only cities which have data available for that year will participate in the clustering.
Larger cities naturally receive more SRs than smaller cities. If the absolute numbers of SRs are used for clustering, large cities will form one cluster and small cities another, solely because of the large gap between their number of SRs. The solution is to use the relative frequency of each SR type rather than its absolute number. If two cities have similar proportions of the same SR types they will be considered similar, regardless of how large or small their absolute numbers of SRs are. Using the relative frequency instead of the absolute frequency has another advantage as well. It standardizes the values of all features to range between 0 and 1. Therefore, no further standardization is required for the feature values before clustering.
4.2. Clusters and Outliers in a Two-Dimensional Visualization of Cities
Presenting only the results of clustering is not as effective as providing visualizations of clusters; visualization not only makes it easier to observe the clusters and outliers, but also reveals details about the compactness or spread of clusters and how far each outlier is from the cluster.
The 79 SR types mean there are 79 features or dimensions. While cities can be represented in a 79-dimensional space, they cannot be visualized in that space. A simple visualization is restricted to two dimensions. Therefore, we need to reduce the dimensionality from 79 to 2, in order to depict the distribution of cities and clusters therein. Samples cannot be as spread in a lower dimensional space after projection as they were in a higher dimensional space before projection. In other words, when data are projected from a higher dimensional space to a lower dimensional space, the distribution of samples will be more restricted; more restriction in the lower dimensional space means that samples cannot be spread with the same variance as in the higher dimensional space. Therefore, dimensionality reduction, in order to solve real-world problems, is always associated with variance loss. An ideal dimensionality-reduction method would minimize this variance loss. One of the most effective methods in doing so is principal component analysis (PCA) [18]. This method first looks for the direction of the highest variance in the original space that is the direction along which samples are stretched most. This direction does not necessarily need to align with any of the original features. This direction is called the first principal direction. Then, this method finds the direction with the second highest variance in the original space, with the only constraint that the second direction must be orthogonal to the first. This direction is called the second principal direction. The next principal directions could be found the same way. If samples are to be projected on a two-dimensional space, this method stops after finding the second principal direction and projects the samples on the first and second principal directions. The result of this projection is the transformation we had in mind to visualize the cities.
Since principal directions after the second principal direction are dismissed in the projection, the variance associated with those principal directions is also lost. The higher the percentage of variance preserved by the first two principal directions, the more reliable the two-dimensional visualization. We will report what percentage of the variance is preserved, after the dimensionality is reduced to two, for each of our visualizations in the next section.
In addition to PCA, we apply factor analysis (FA) to reduce dimensionality too, and compare their results. FA is a linear model that performs a maximum likelihood estimate of the so-called loading matrix, which is the transformation of the latent variables to the observed ones, using an SVD based approach. It assumes that observations are caused by a linear transformation of lower dimensional latent variables and added Gaussian noise. Factors are distributed according to a Gaussian distribution with zero mean and unit covariance, and noise is distributed with a zero mean and an arbitrary diagonal covariance matrix. While the PCA component is a linear combination of the observed variable, in FA, the observed variables are linear combinations of the generated variables. While the PCA components are fully orthogonal to each other, FA components are not required to be orthogonal. While the PCA components explain the maximum amount of variance, FA explains the covariance in the data.
5. Results and Discussion
5.1. Changes in SR Types over the Years
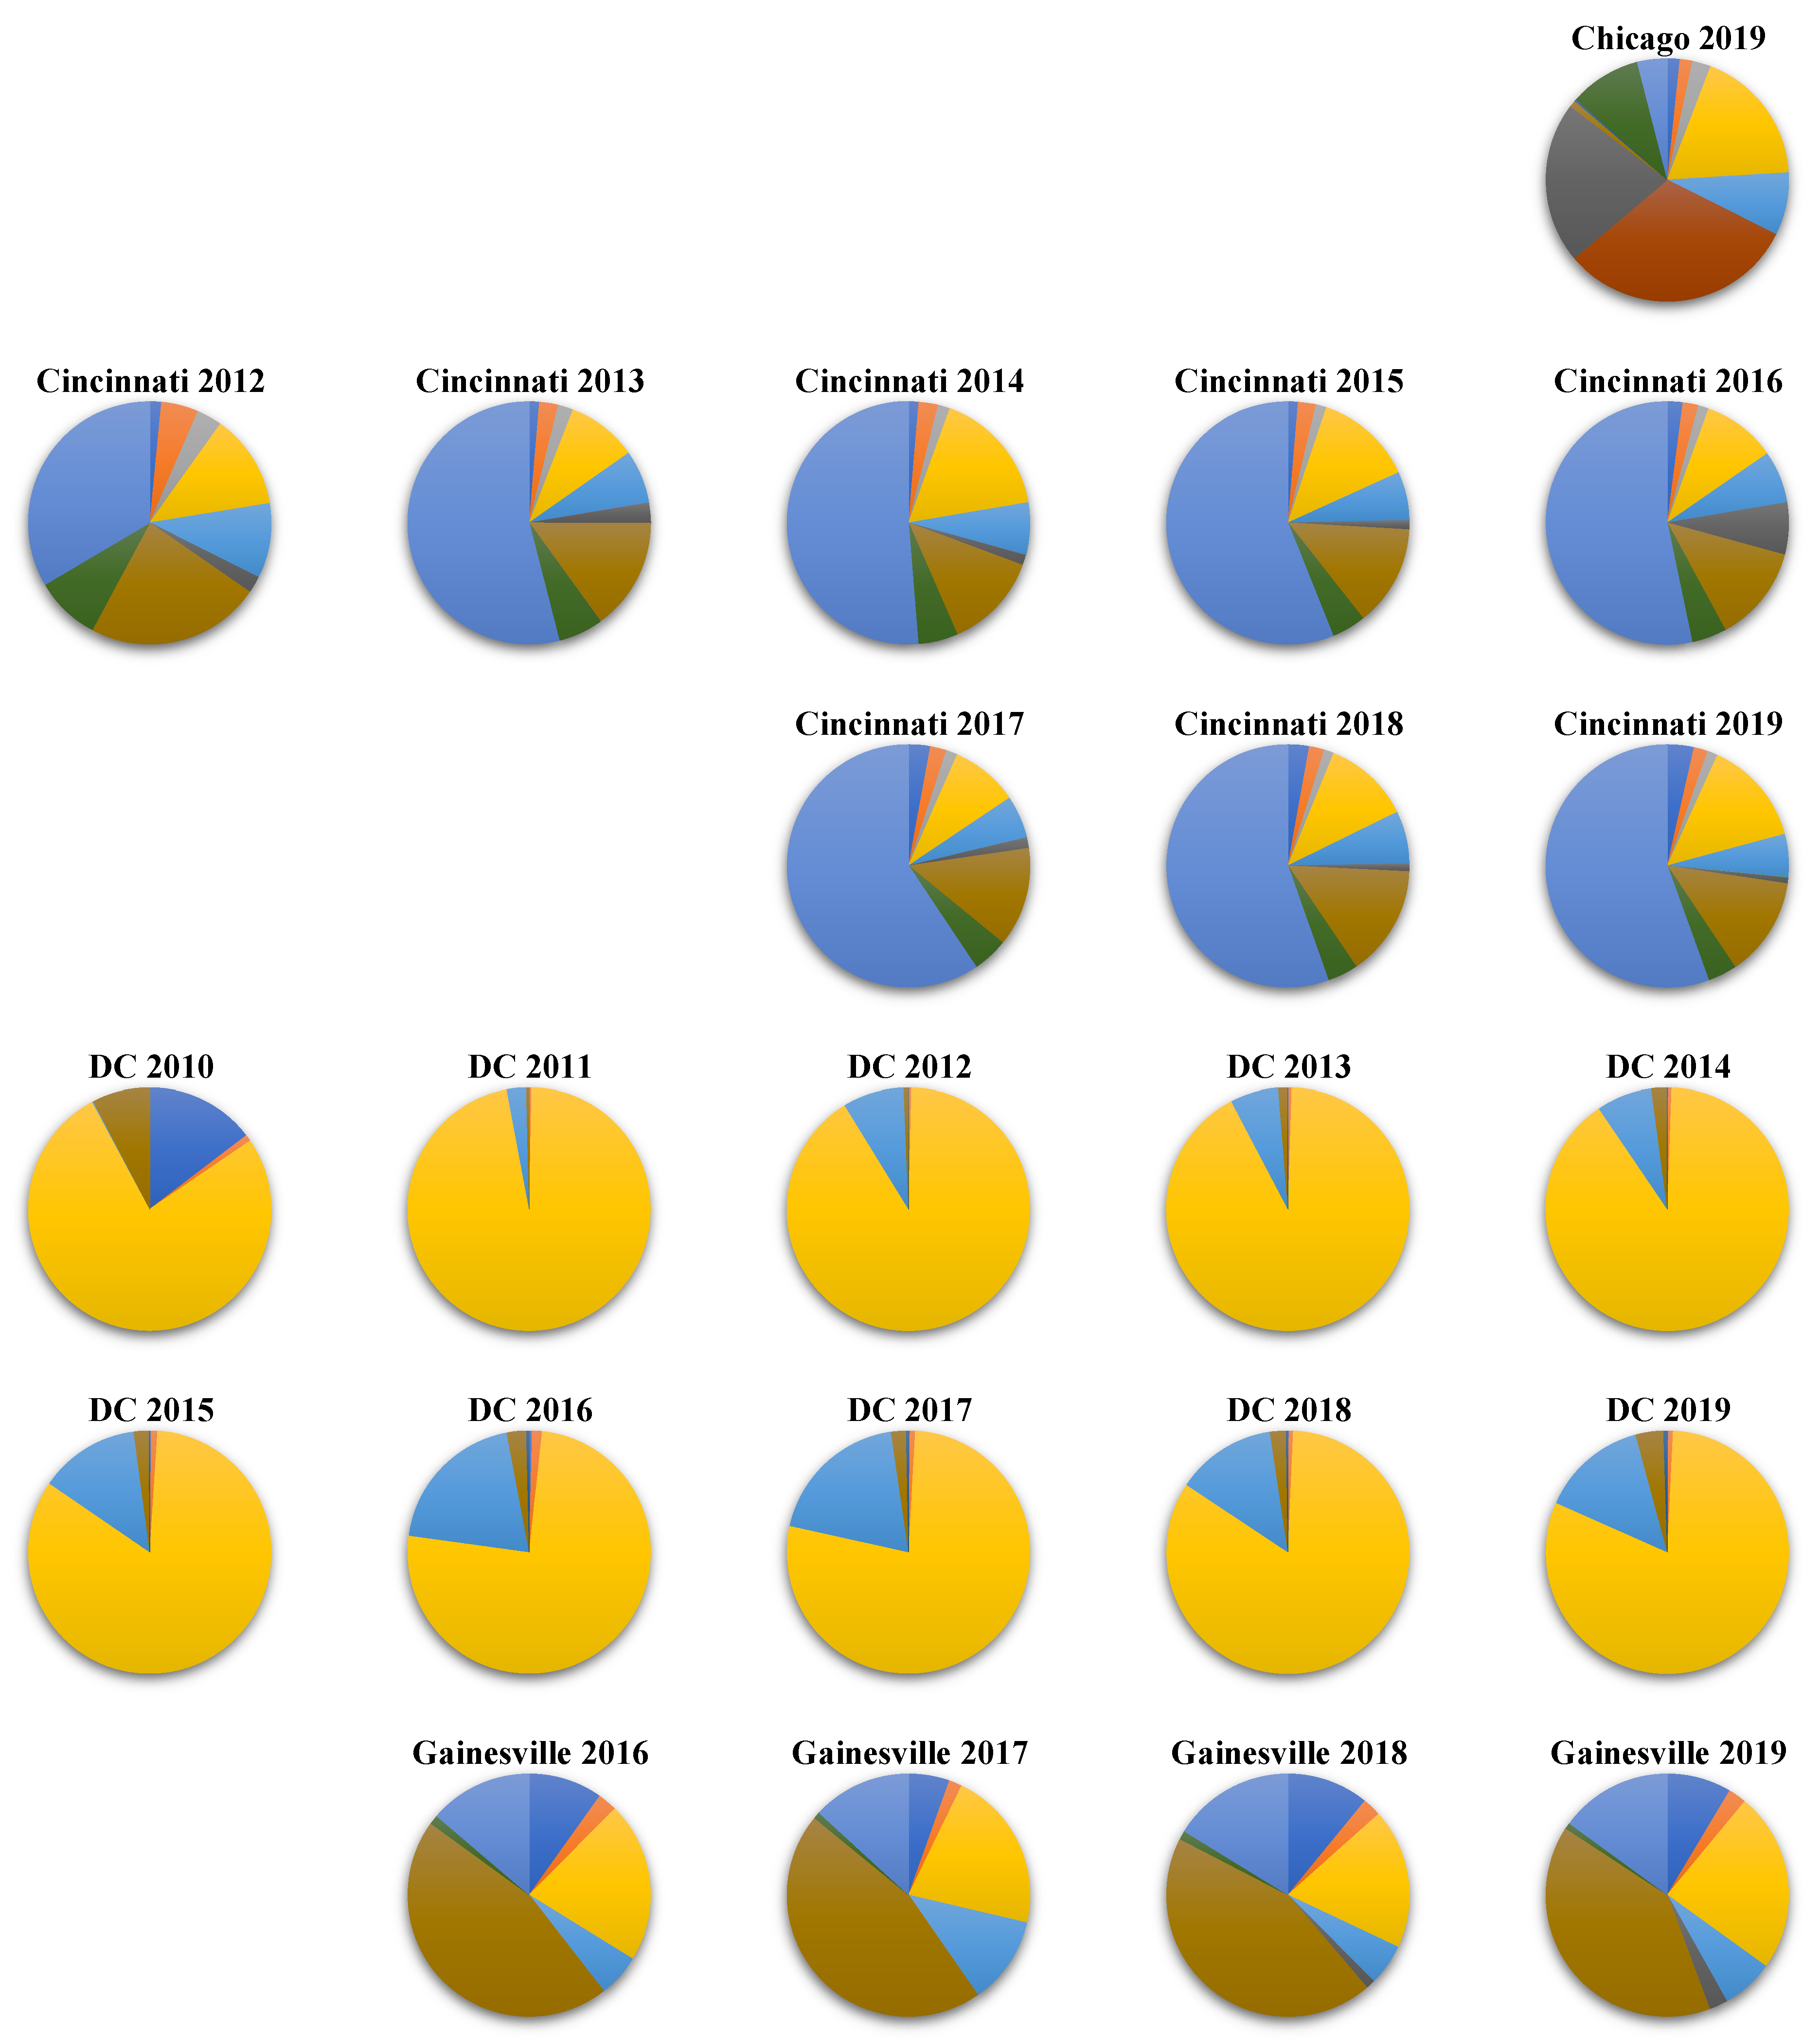
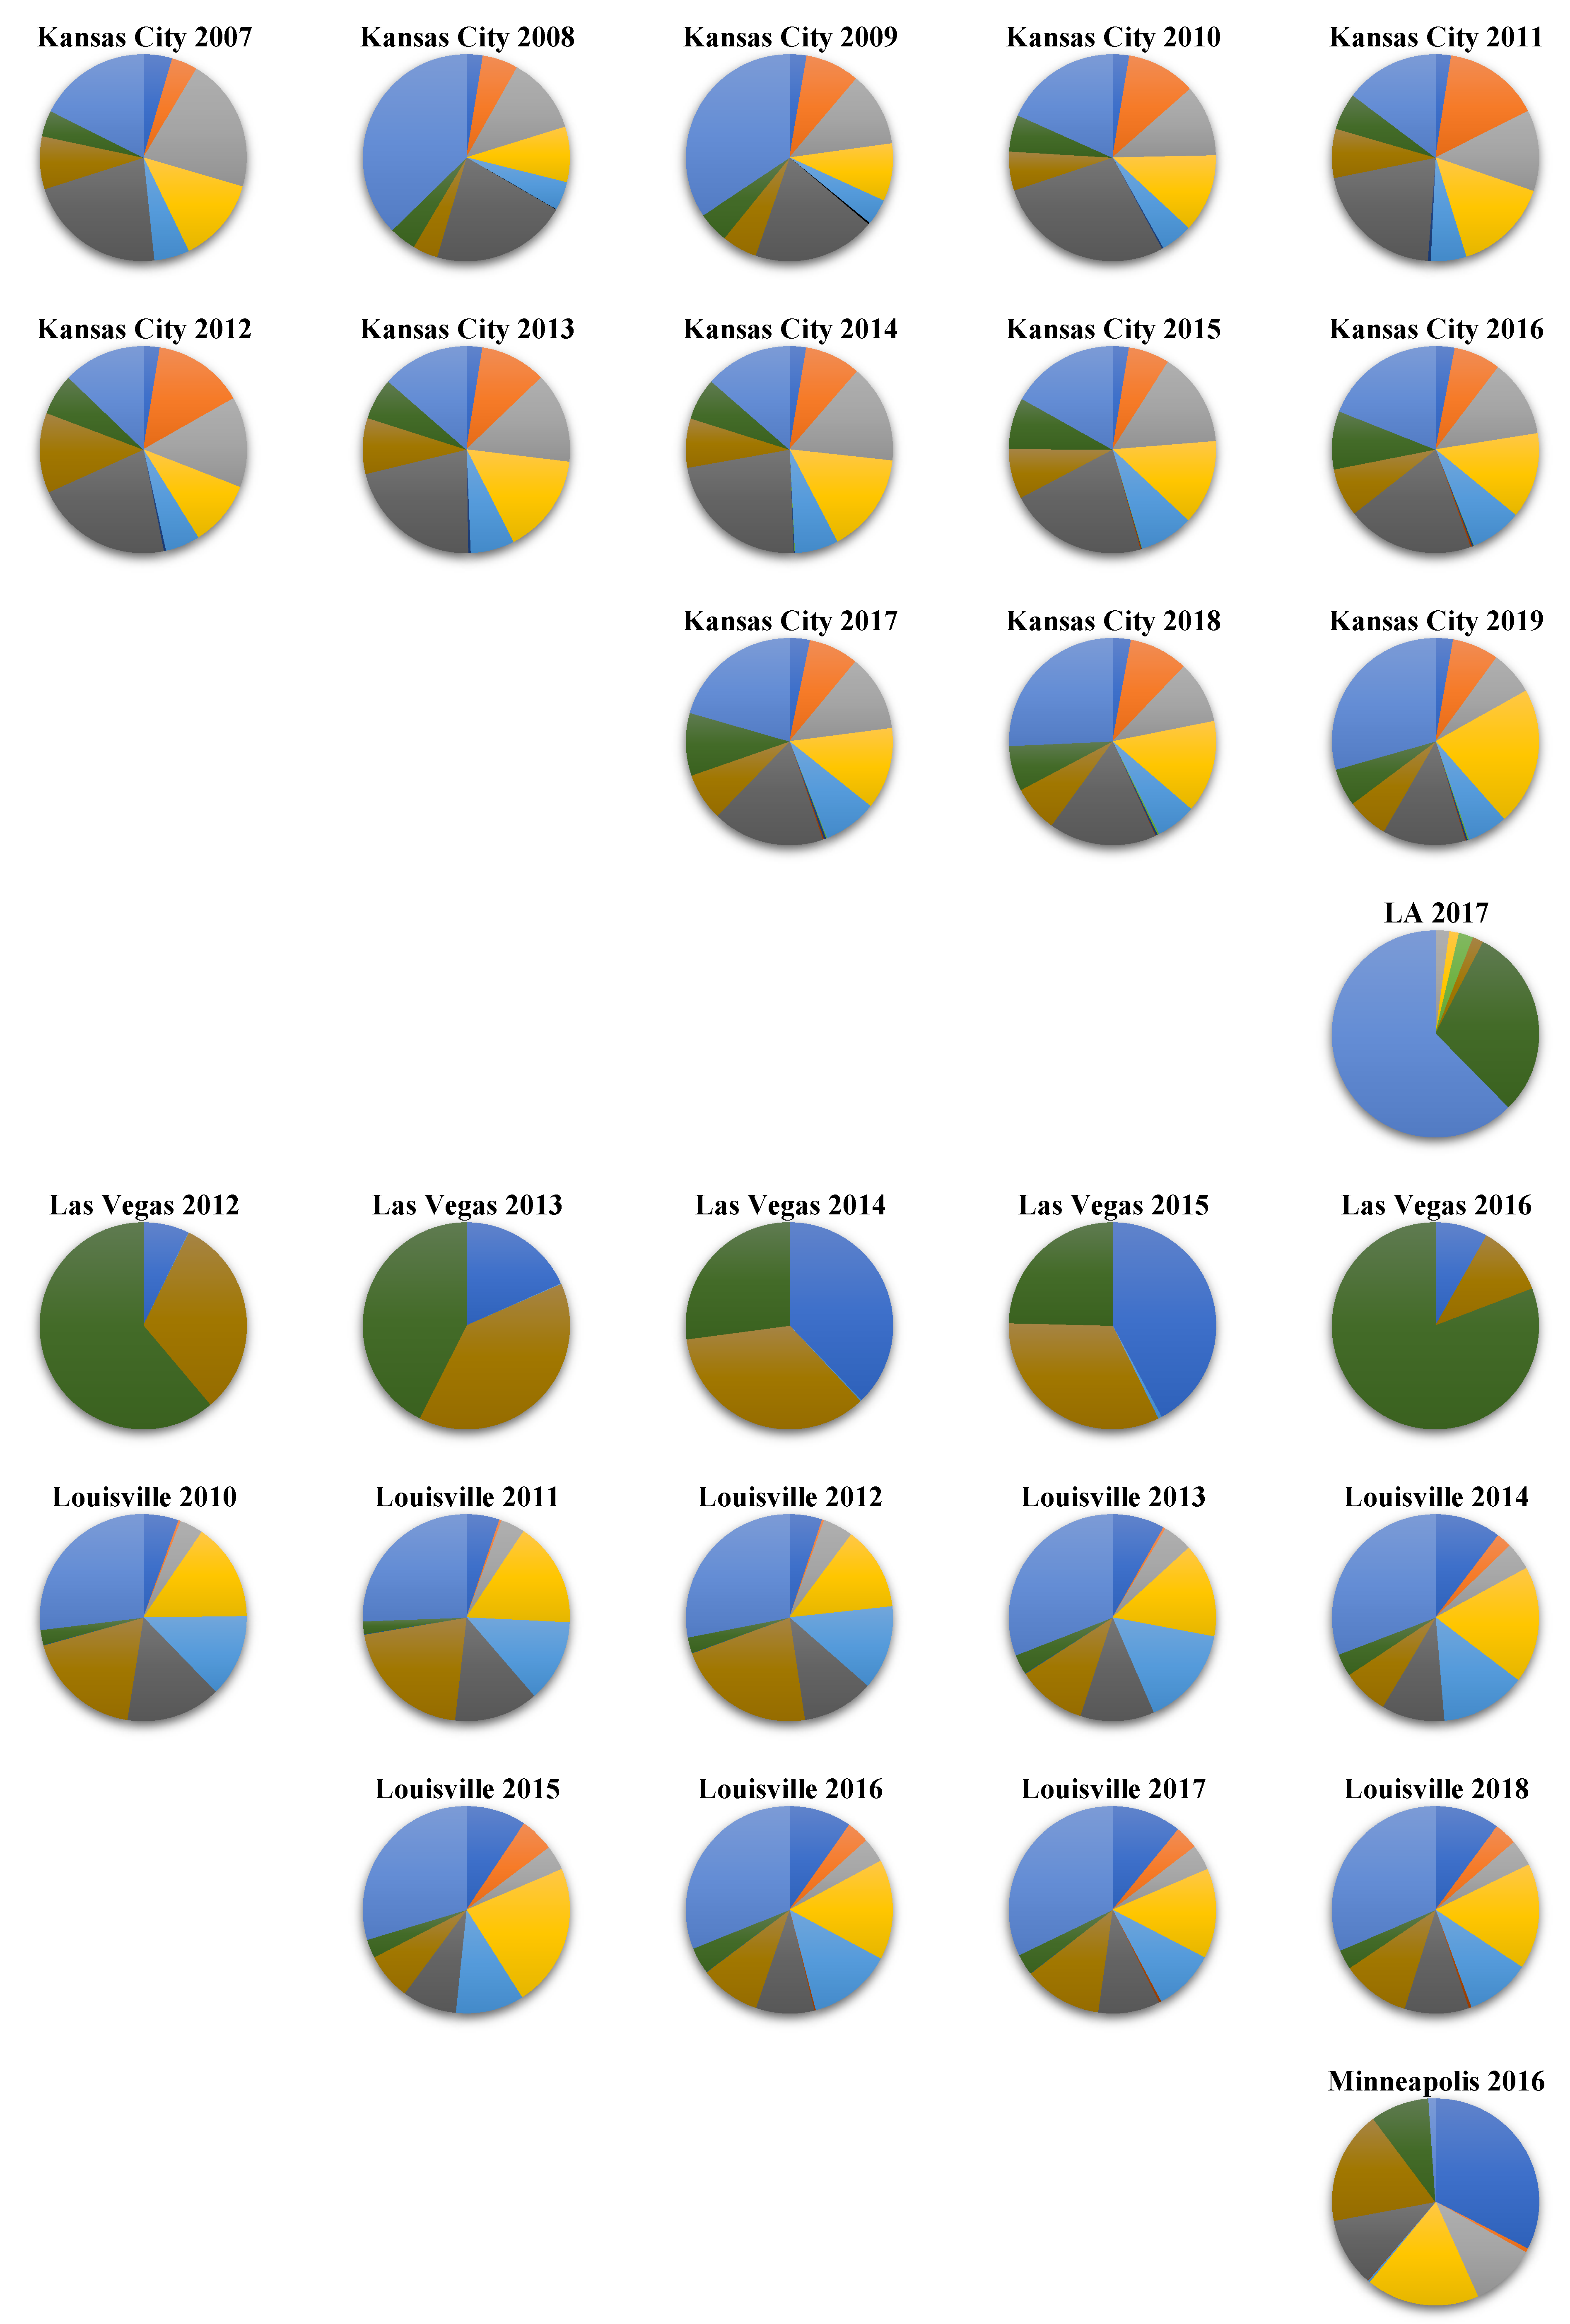
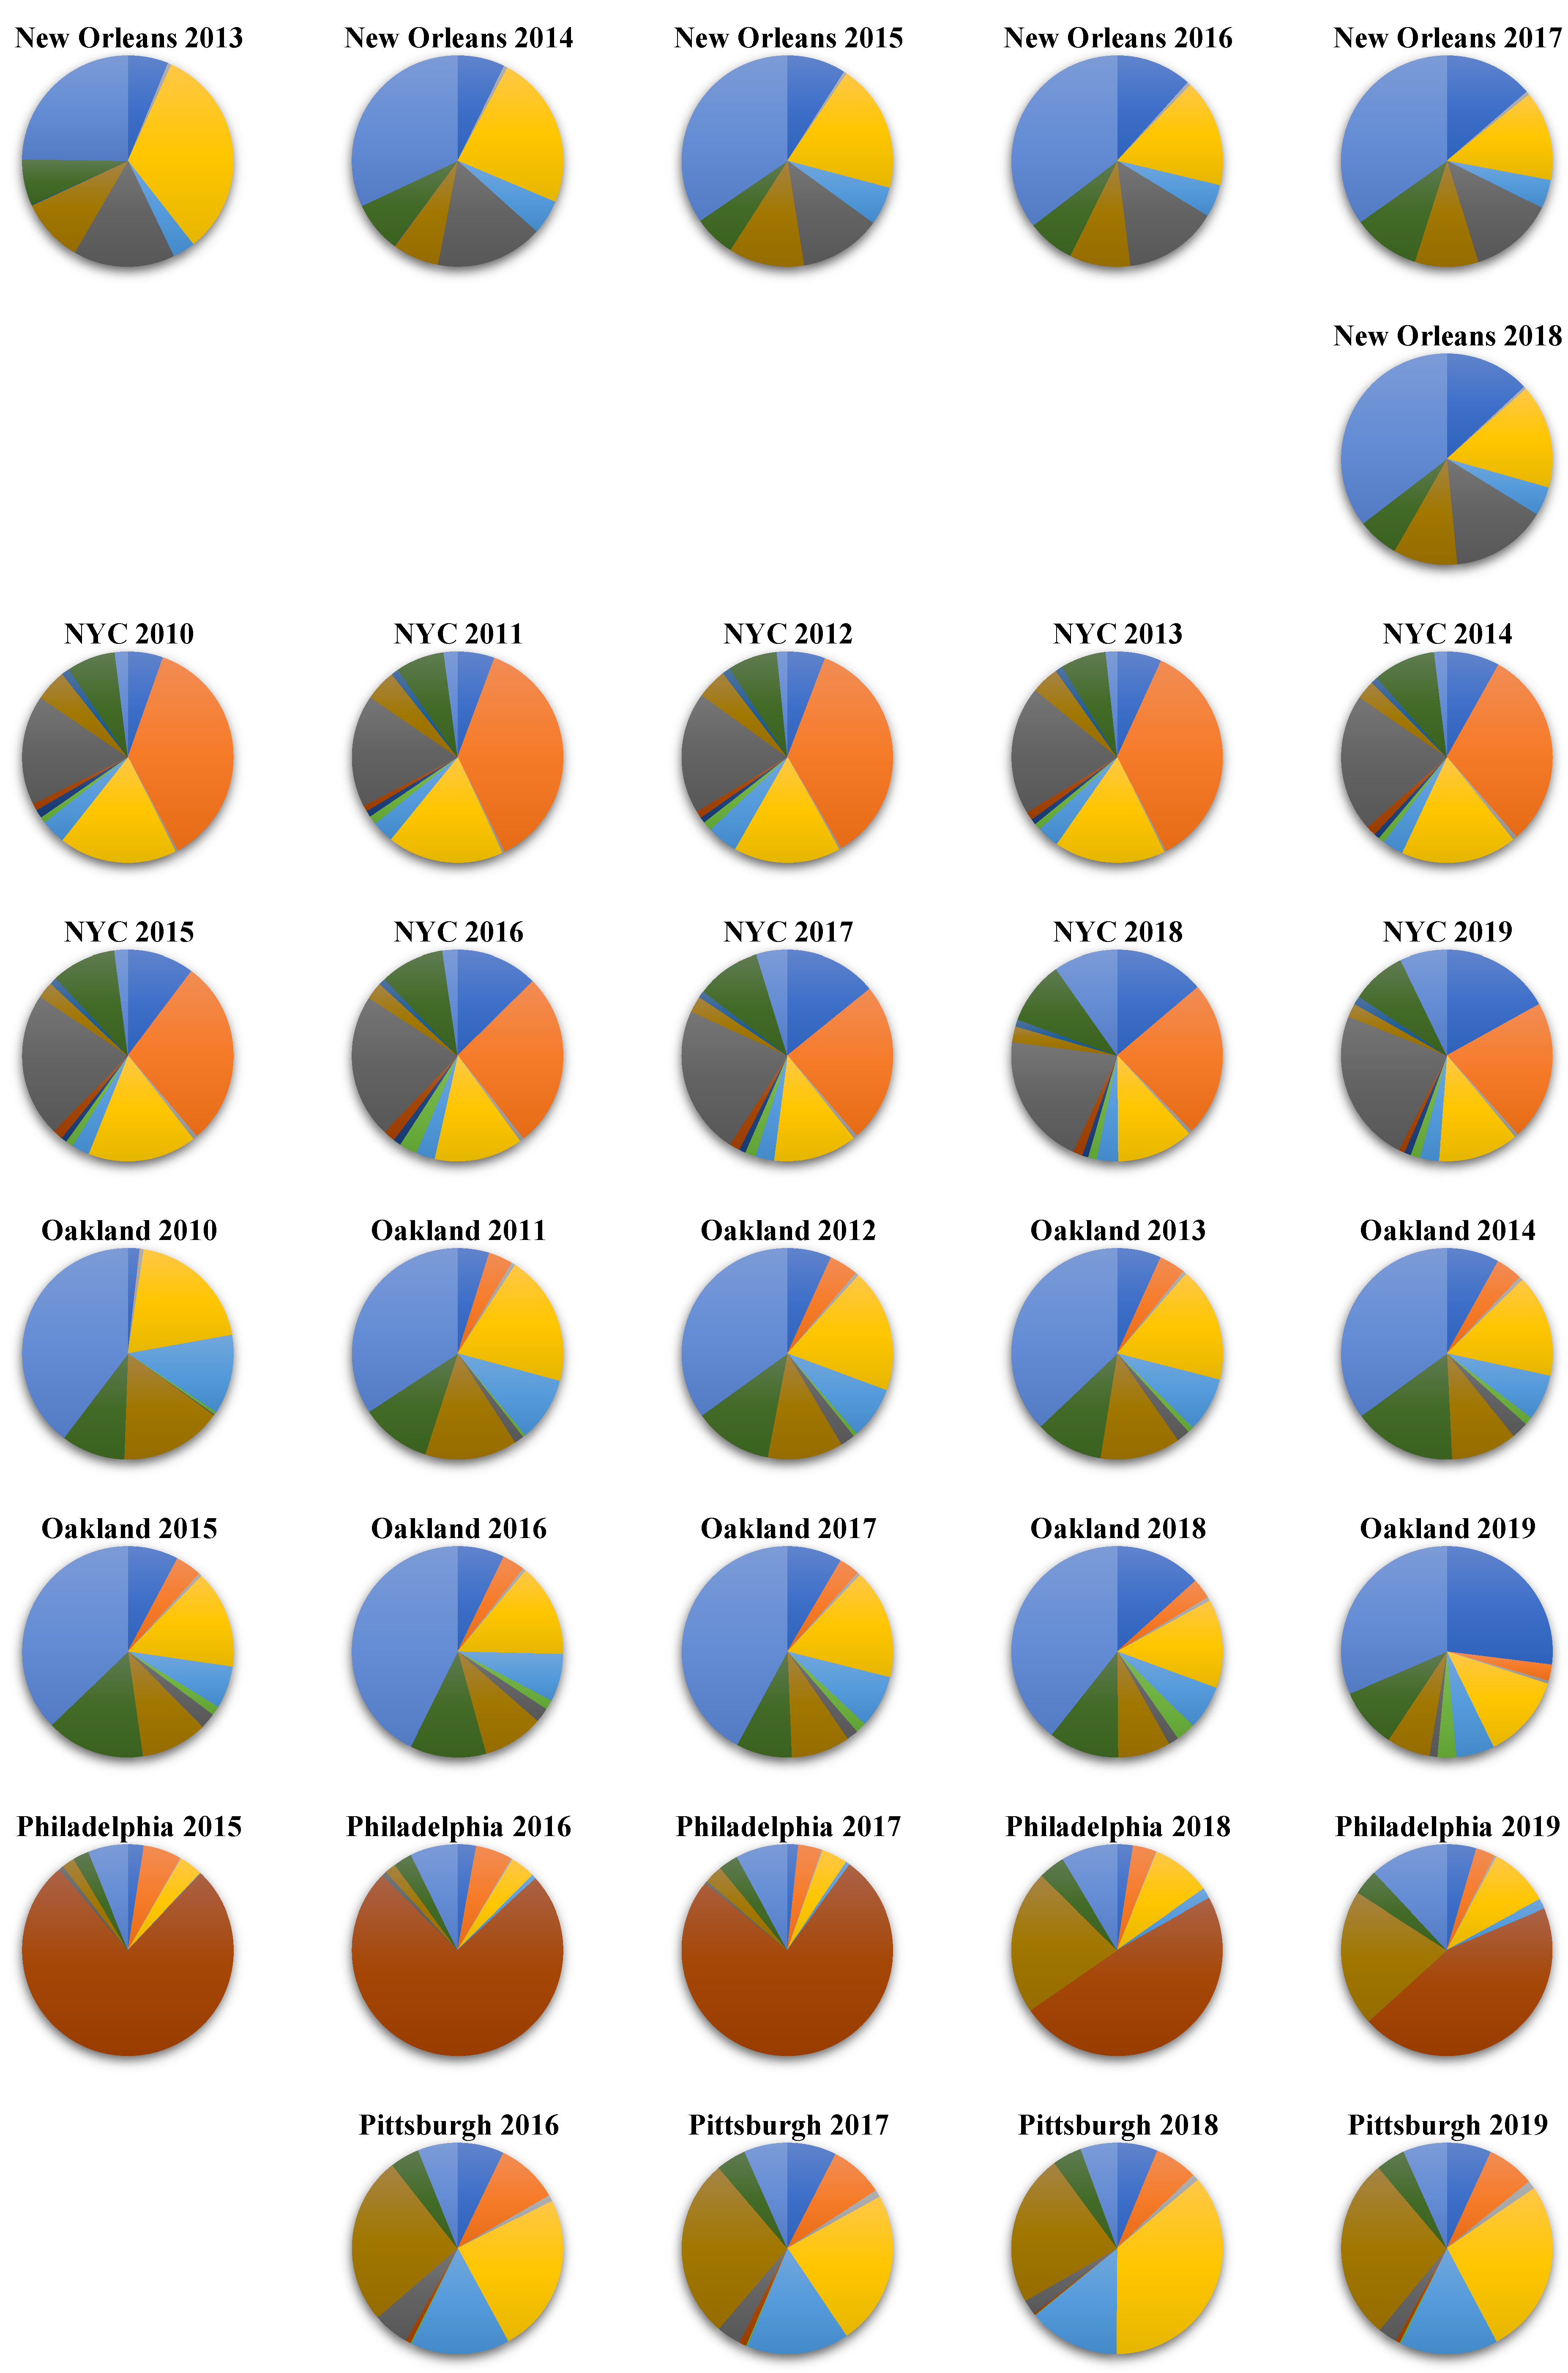
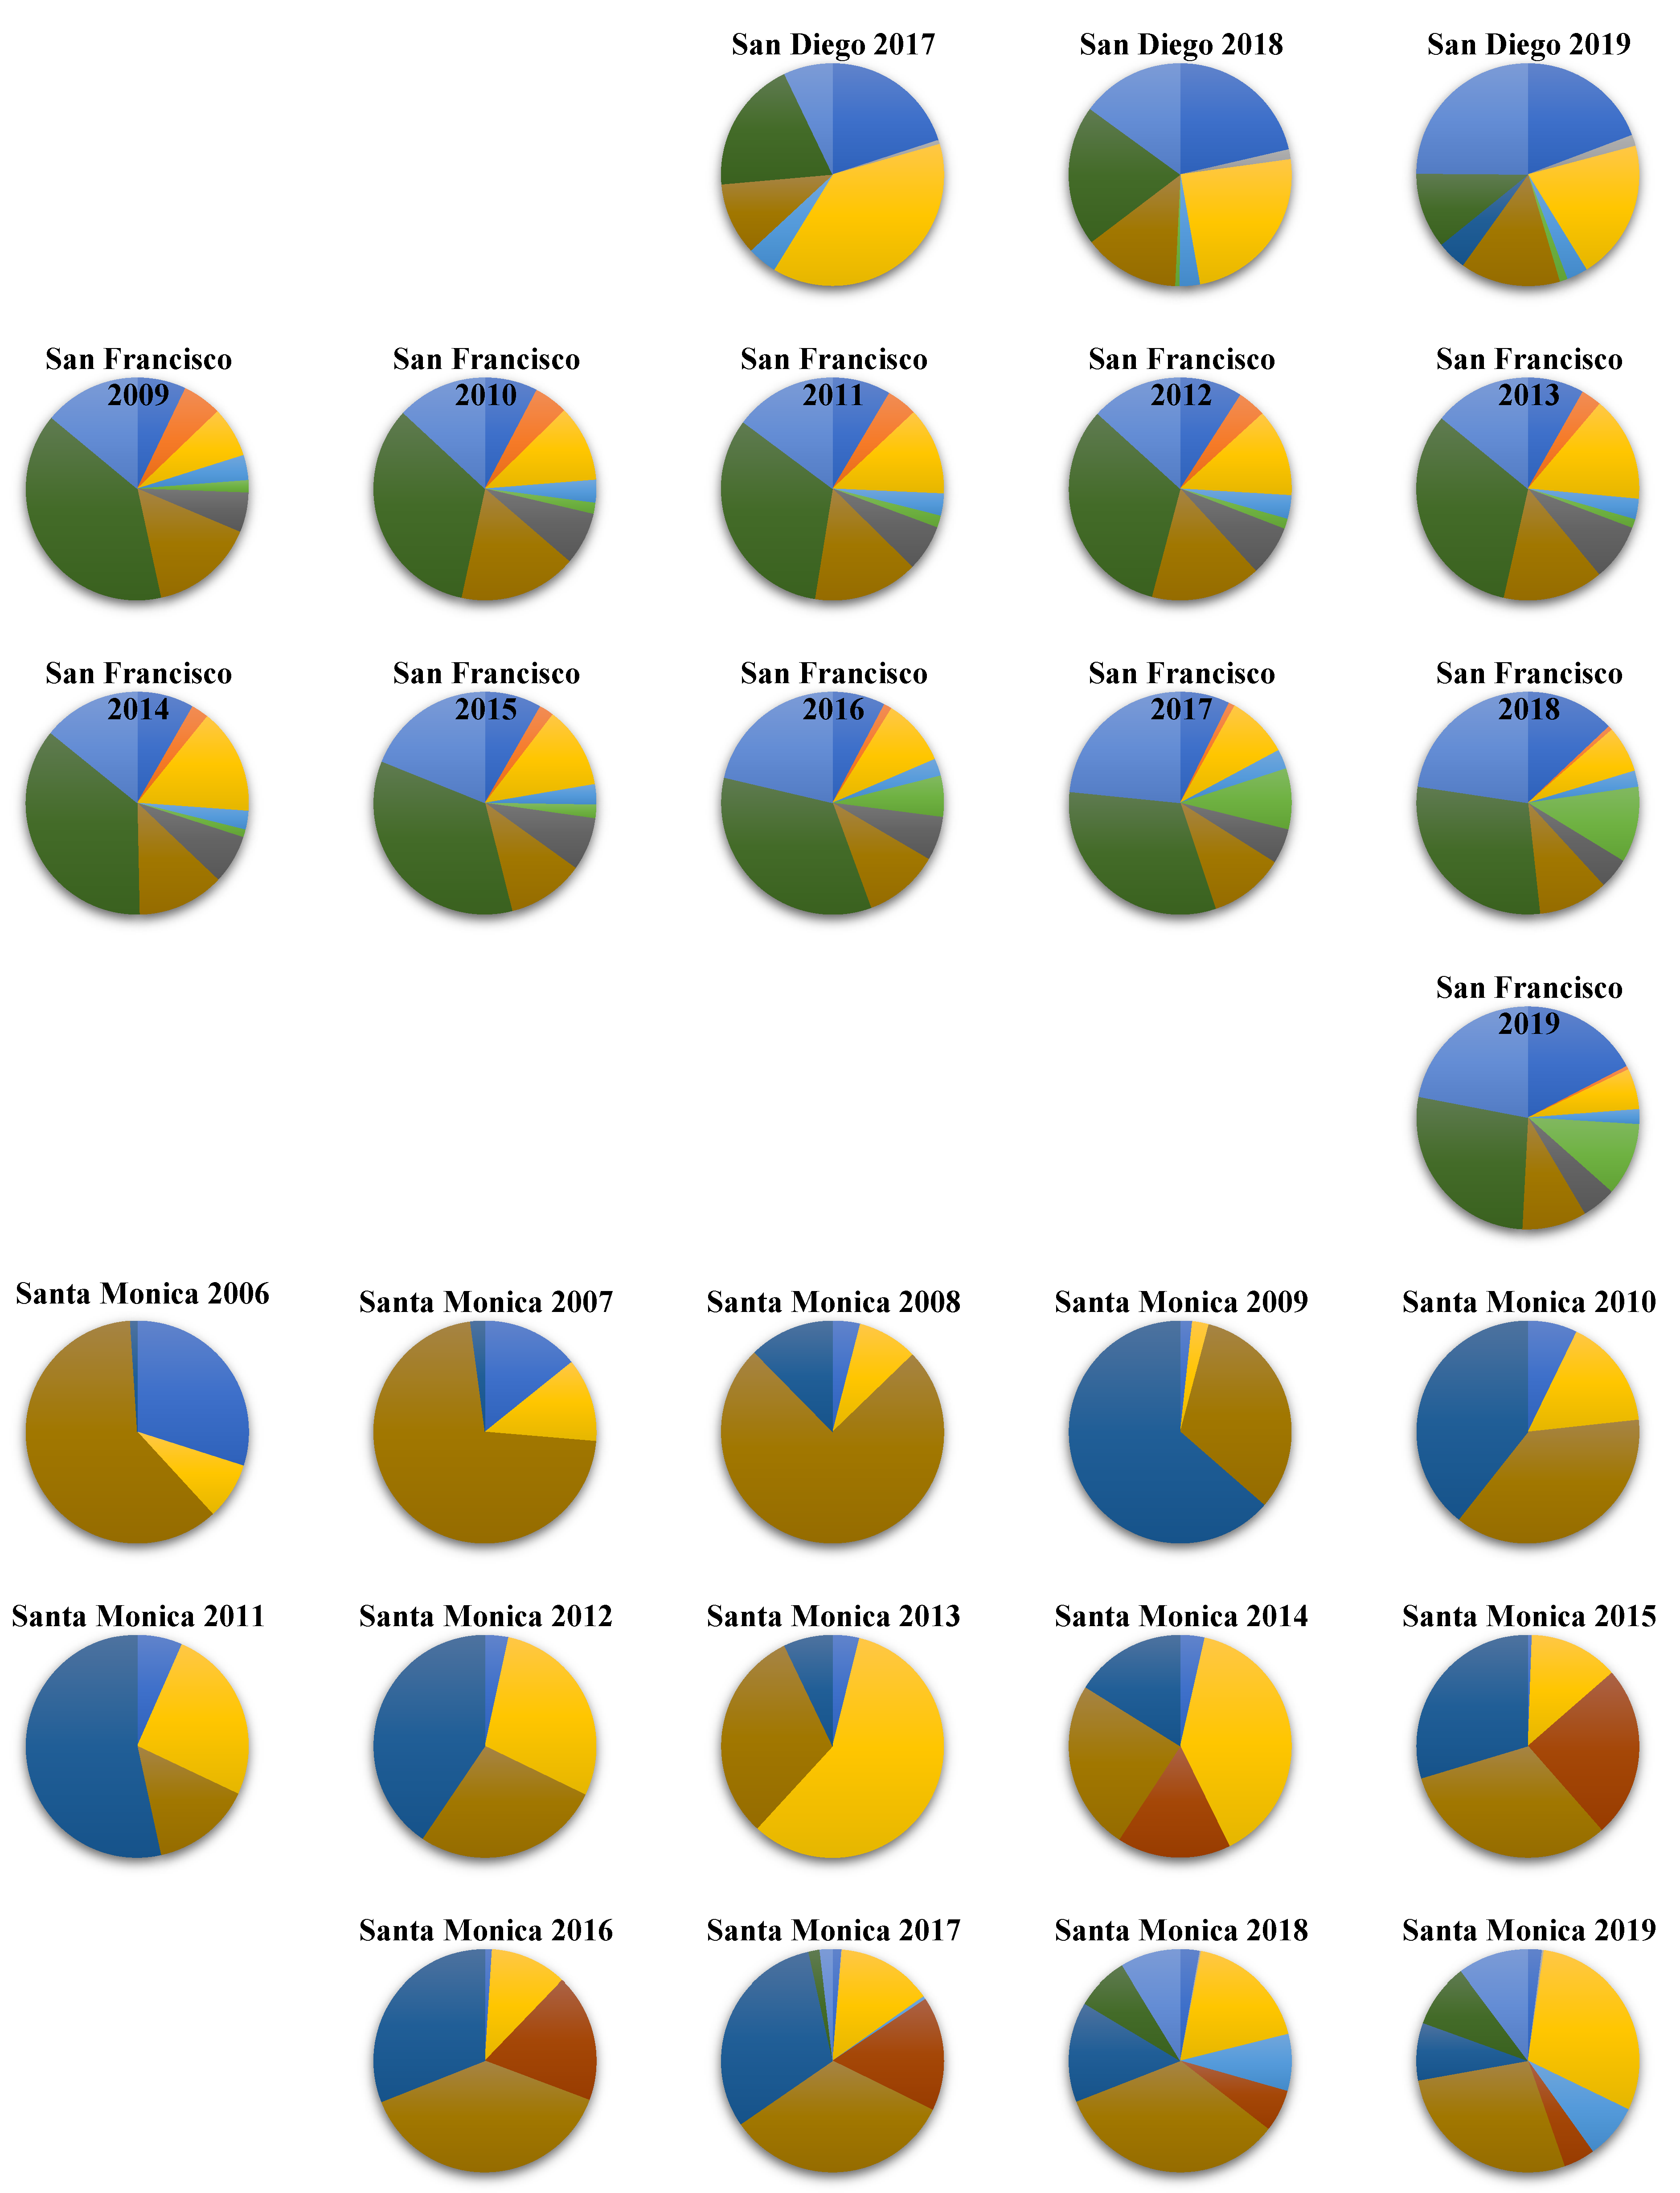
Figure 1 portrays the rate of different SR categories in different cities and years. These categories are explained in Table 2.
According to Figure 1, the patterns of general request categories have not changed much in Austin, over the years. Throughout the years, requests regarding streets and sidewalks and animals have formed almost half of all the requests, with complaints being the third major category.
In Baltimore, almost all the requests were concerning streets and sidewalks in 2010. This category’s rate suddenly dropped to 14% in 2014 and decreased to 10% gradually by 2019. In 2014, requests regarding cleaning and rodents not only appeared as a new major category but also became the most frequent category, forming almost half of all the requests. This remained the most frequent category in the following years. Requests concerning streets and sidewalks became the second most frequent category in 2014. However, it gradually shrank in rate, giving their second place to the growing category of requests regarding transportation. In 2019, requests for information rose to become a major category as well.
In Baton Rouge and Cincinnati, requests regarding garbage and recycling have consistently formed more than half of all the requests, with their rates rising gradually every year in Baton Rouge.
In Chicago, almost one third of requests were for information in 2019, the only year for which data are available for Chicago. Complaints and requests regarding streets and sidewalks form the second and third most frequent categories in this city.
In DC, almost all the requests have consistently been about streets and sidewalks. Transportation was the second most frequent category, only in 2010. Since 2011, parks and trees have been the second major category, which gradually rose in rate every year.
Gainesville has a diverse set of request categories, none of which significantly dominate the others. Requests concerning streets and sidewalks, garbage and recycling, parks and trees, and transportation have consistently been more frequent throughout the years.
In Kansas City, complaints were the most frequent category up until 2016, when they started to gradually shrink in rate and give their first place to garbage and recycling as the most frequent category. Requests regarding animals, streets and sidewalks, maintenance, and parks and trees have also been major categories over the years.
In LA, requests regarding garbage and recycling formed almost two thirds of all the requests in 2017, with the remaining requests being mostly about cleaning and rodents. Data for LA are only available in 2017.
In Las Vegas, almost two third of all the requests were concerning cleaning and rodents in 2012. This rate gradually fell, reaching only a quarter of all the requests in 2015. In 2016, however, this category’s rate soared to 80%. The second major category in Las Vegas has consistently been transportation.
Louisville has had a diverse set of request categories throughout the years. Garbage and recycling has consistently been the most frequent category, taking almost one third of all the requests every year. The other major categories have consistently been streets and sidewalks, parks and trees, and complaints. Requests about transportation have been gradually growing in this city, becoming one of the major categories in 2018.
Data for Minneapolis are only available in 2016, when the transportation category formed one third of all the requests. Other major categories were streets and sidewalks, animals, and cleaning and rodents.
In New Orleans, requests concerning garbage and recycling have consistently formed about one third of all the requests. Requests regarding streets and sidewalks have been the second major category with their share gradually falling over the years and giving their place to requests about transportation. Complaints and requests concerning cleaning and rodents have been other major categories in New Orleans.
In NYC, the vast majority of requests have always been about maintenance and streets and sidewalks. Despite consistently being major categories over the years, these two categories have been gradually shrinking in rate, giving their place to the rising categories of complaints, transportation, garbage and recycling, and cleaning and rodents.
In Oakland, requests concerning garbage and recycling have consistently formed at least one third of all the requests. The second major category was streets and sidewalks in 2010, but its rate gradually decreased until it gave its second place to the rising category of transportation in 2019.
In Philadelphia, more than three quarters of requests were for information in 2015. However, this category’s rate gradually fell over the years, reaching less than half of all the requests in 2019. On the other hand, requests concerning streets and sidewalks and garbage and recycling have been gradually increasing in rate over the years.
In Pittsburgh, a growing number of requests are about streets and sidewalks, transportation, and cleaning and rodents. On the other hand, requests regarding parks and trees and maintenance have been falling in rate over the years.
San Diego’s most frequent category up until 2018 was streets and sidewalks, but it gave its place to garbage and recycling in 2019. Requests regarding transportation and cleaning and rodents have been the next major categories.
In San Francisco, almost 40% of requests were regarding cleaning and rodents in 2009, but this category’s share gradually fell to 27% by 2019. The fastest growing categories in this city have been garbage and recycling and transportation. Requests regarding streets and sidewalks had a rising rate from 2009 to 2013, but a falling rate afterwards. Requests regarding maintenance also had a shrinking rate, falling from 6% in 2009 to less than 1% in 2019.
In Santa Monica, requests regarding transportation had the highest rate in 2006, but their rate gradually dropped to close to 0 in 2015 and gradually rose to 2% in 2019. Requests regarding streets and sidewalks, forming only 8% of all the requests in 2006, grew to 58% by 2013, fell to 11% by 2016, and rose again to 30% by 2019. Public mobility services appeared as a new category of requests with a 12% rate in 2008. Their rate soared to 64% in 2009. It remained a major category until 2017, but its rate dropped to 15% in 2018 and 8% in 2019. Requests for information appeared as a major category, with a 16% share, in 2014. This share reached 25% in the following year but started to fall afterwards, reaching only 5% by 2019. Requests concerning garbage and recycling, cleaning and rodents, and parks and trees started to rise and become major categories in Santa Monica since 2018.
5.2. Visual Clustering of Cities Based on SR Type Rates
Table 3 shows features with more than 1% contribution in the PCA transformation. These features played a bigger role in creating the two-dimensional visualizations. These contributions are calculated based on the coefficients of features in the PCA linear transformation. Features with higher contributions are those whose values have higher variances across cities.
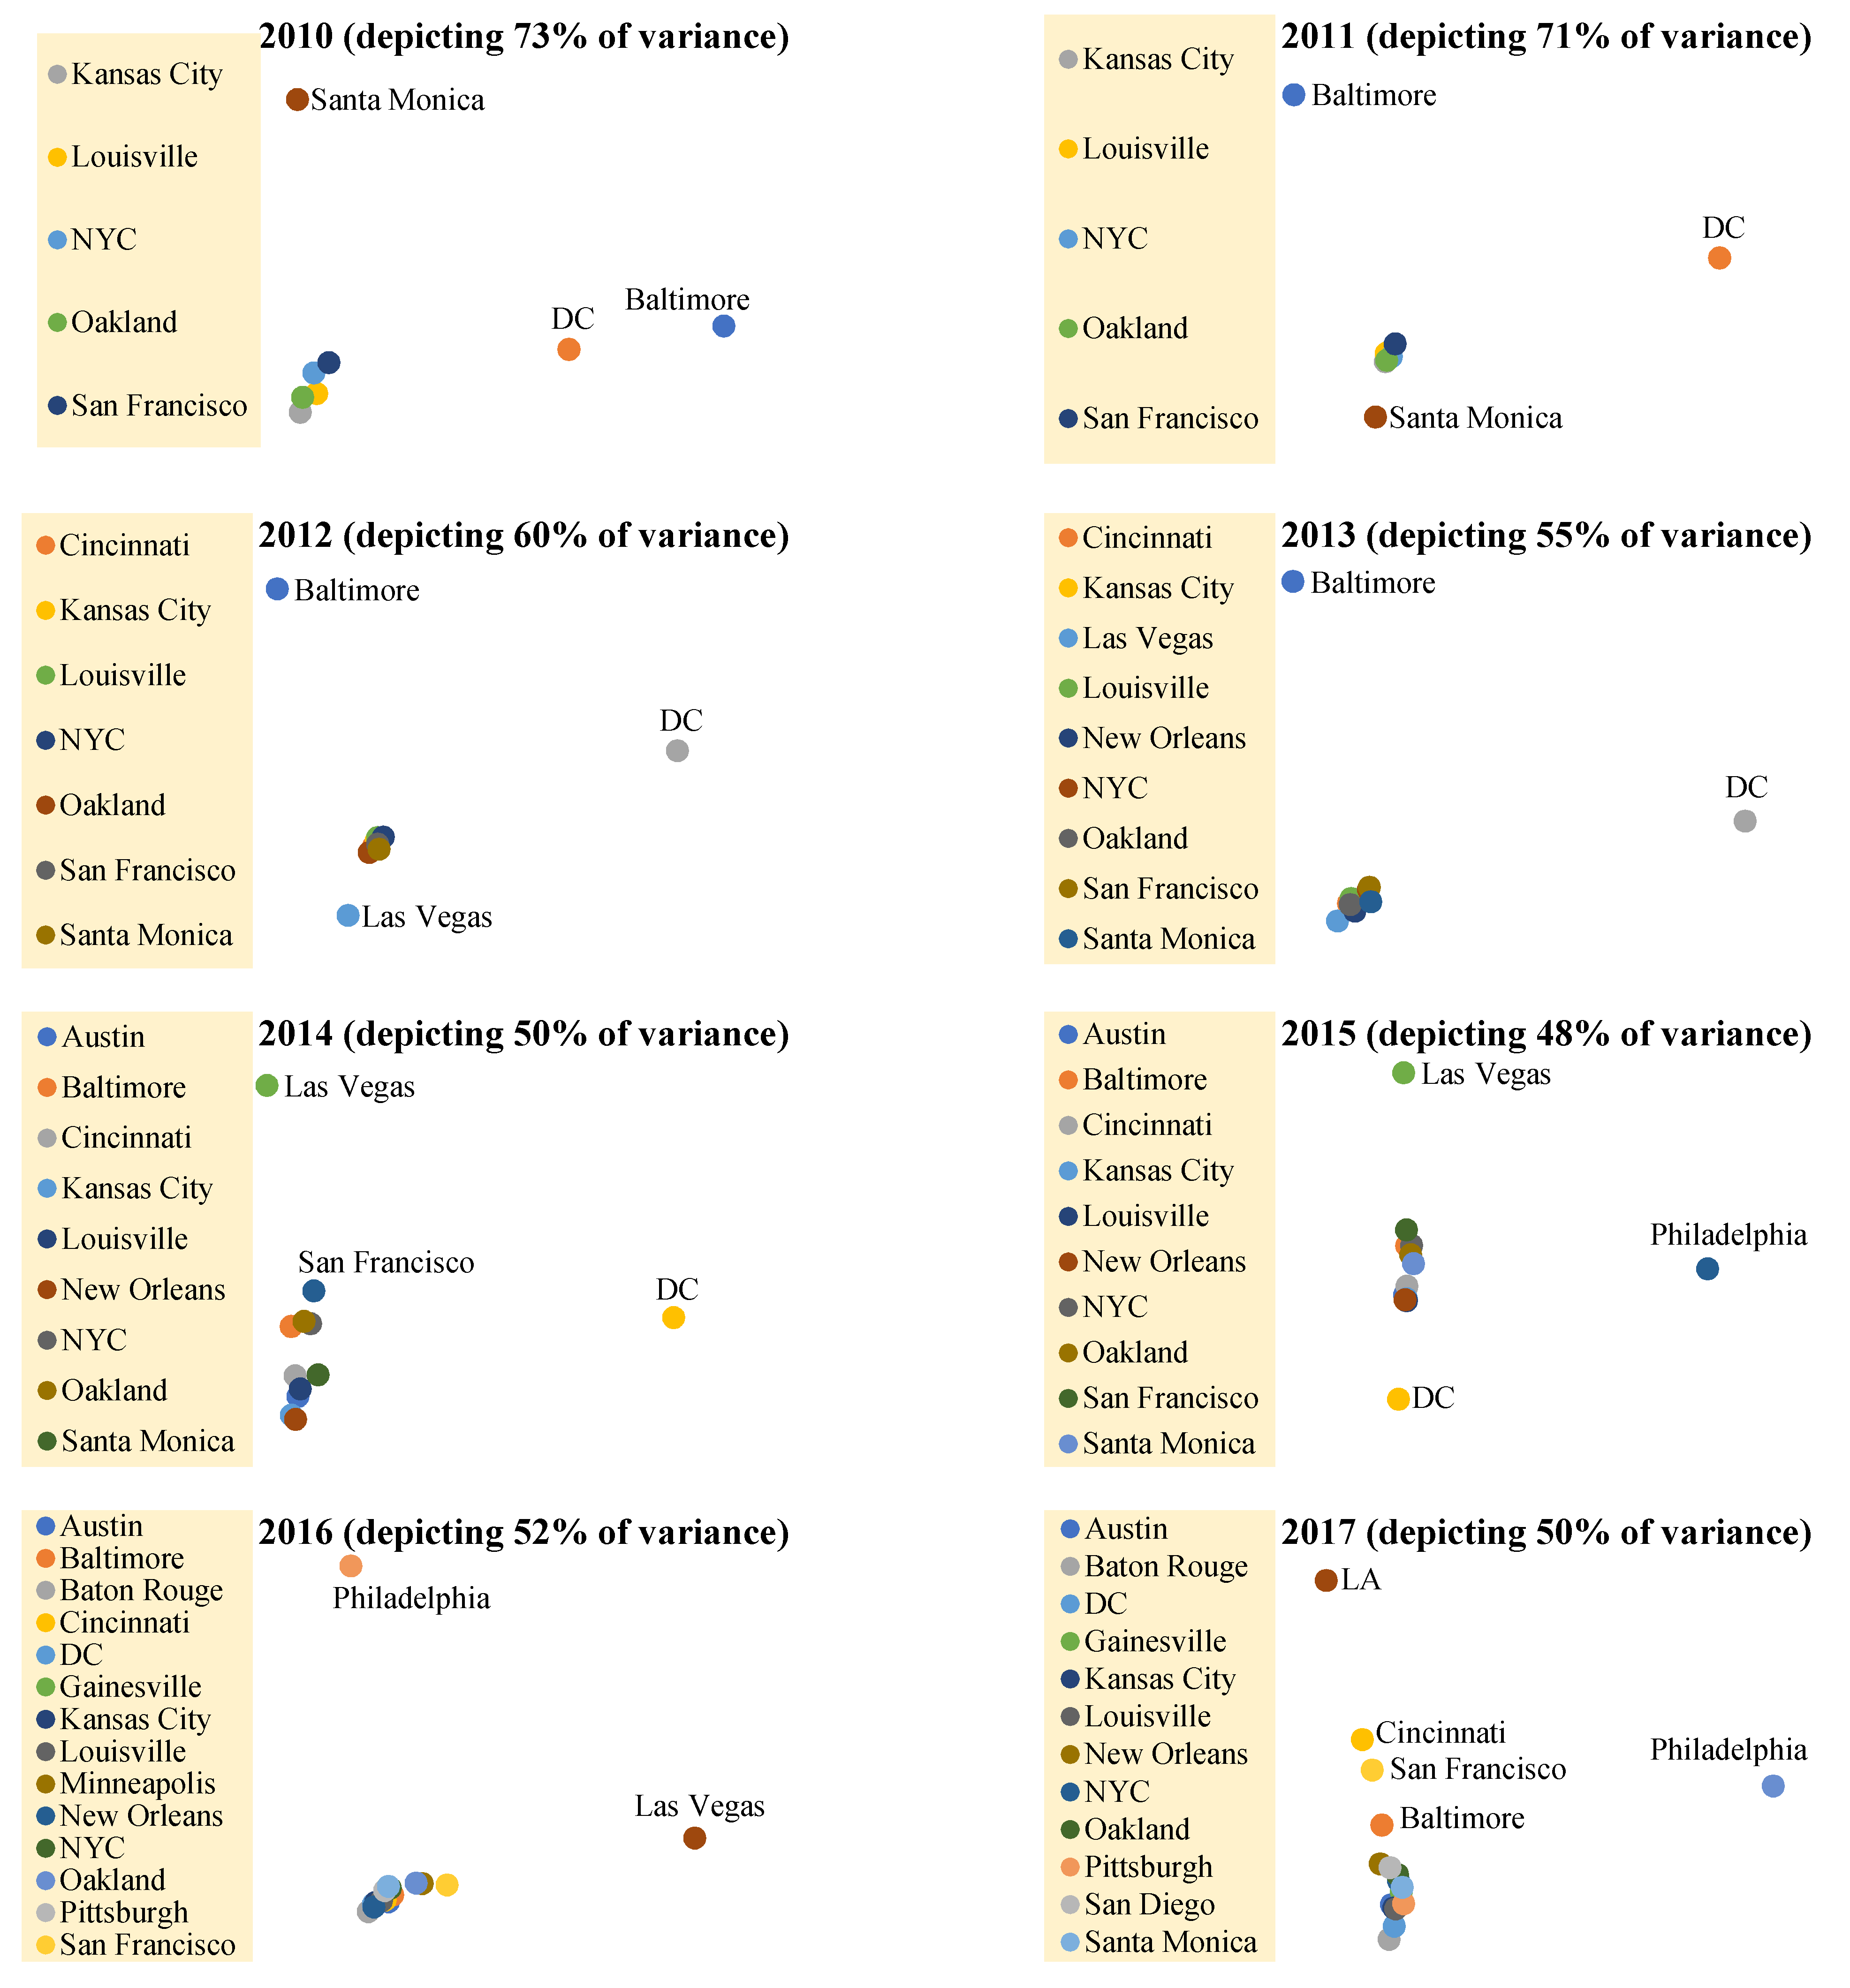
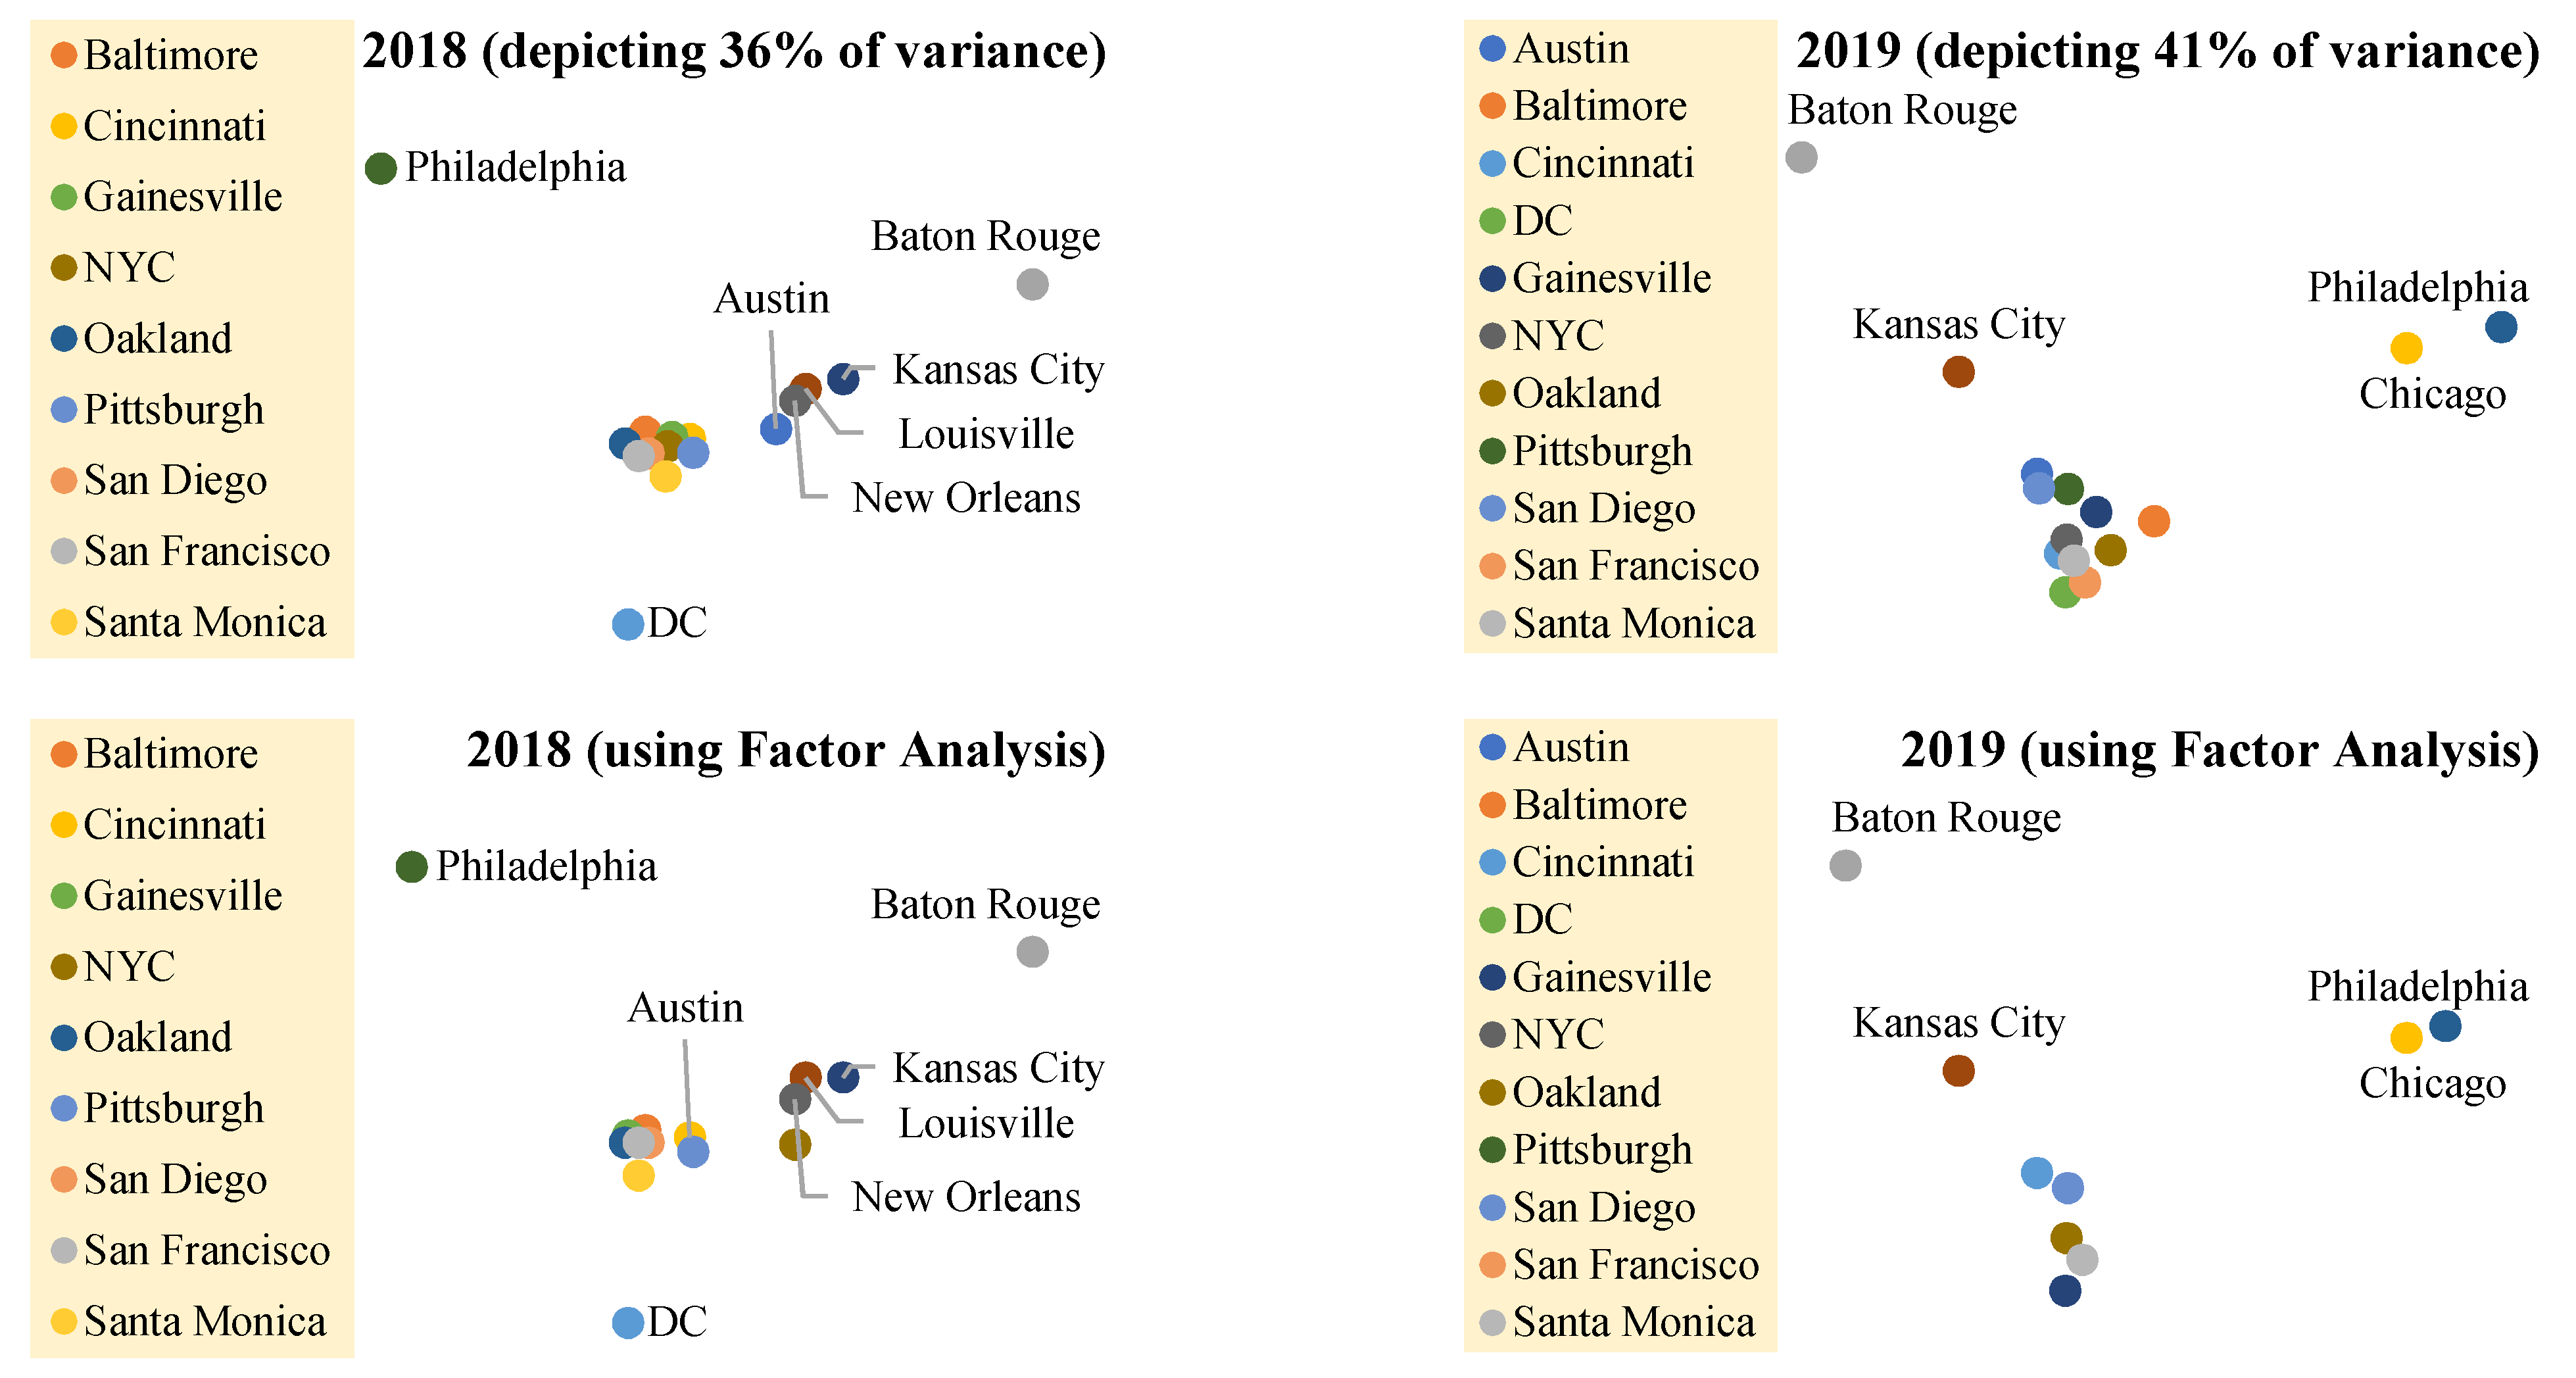
Figure 2 displays cities as points on a two-dimensional canvas based on the similarity among their SR types. In other words, cities closer to each other on this canvas have similar rates of the same SR types. These visualizations were developed based on the methodology in Section 4, separately for each year. As mentioned in Section 4.2, reducing the dimensionality (number of SR types) from 79 to 2, using the PCA transformation, comes with a cost in the form of lost variance. At the top of each visualization, the percentage of the variance preserved after dimensionality reduction is mentioned inside the parentheses; the higher the percentage, the more reliable the visualization. At the bottom of this figure the results of dimensionality reduction, using the FA approach, for 2018 and 2019 are depicted, which are similar to that of the PCA.
PCA takes advantage of all the original features and linearly combines them to best preserve the distance between the samples after projection to the two-dimensional space. This comes with the disadvantage that it is not possible to explain the distribution of samples in the two-dimensional space based on the original features. However, we attempt to provide such explanations heuristically. Due to the large number of features (79), offering even heuristic justifications of clusters and outliers could be complex, difficult, and inaccurate. In the following, we attempt to provide such explanations based on the 12 main categories of requests in Table 2, rather than the original 79 features.
In 2010, among cities whose data are available for this year, Santa Monica was farthest from other cities. The main reason is that almost 40% of SRs in Santa Monica were from the public mobility services category, which was not a common category in other cities. Baltimore and DC were two other outliers because of their large category of streets and sidewalks, which has much lower rates in other cities.
In 2011, Baltimore and DC were outliers for the same reason; more than 96% of their requests were concerning streets and sidewalks while this percentage was between 13% and 25% in other cities. These two cities were also not next to each other because the type of their remaining 4% of requests was different. Santa Monica was closer to the dense cluster of most cities in 2011 than the previous year because as its rate of cleaning and rodents category slightly shrank, that of other cities slightly rose, moving them closer to each other.
In 2012 and 2013, Baltimore and DC remained outliers for the same reason. In 2012, Las Vegas was slightly outside of the dense cluster of most cities because 61% of its requests fell in the cleaning and rodents category. This percentage was much smaller in other cities. Additionally, Las Vegas did not have as large a rate as other cities in categories such as streets and sidewalks, parks and trees, and complaints.
In 2014, DC remained an outlier for the same reason. However, Baltimore was no longer an outlier, because its rate of requests regarding streets and sidewalks sharply dropped to a rate closer to that of other cities. Las Vegas remained an outlier this year as well, because majority of its requests were about cleaning and rodents and transportation, with not many requests from other categories.
In 2015, DC and Las Vegas remained outliers for the same reason. This year, Philadelphia was an outlier too, because 77% of its requests were for information, which was much higher than other cities.
In 2016, Las Vegas and Philadelphia remained outliers for the same reason. However, DC got much closer to other cities, because of two reasons: first, its share of requests from the streets and sidewalks category slightly decreased while other cities had a slight growth in this category; second, other cities received a higher rate of requests regarding parks and trees, which was a major category in DC.
In 2017, Philadelphia remained an outlier for the same reason. LA was an outlier because 62% of its requests were from the garbage and recycling category, which was much higher than other cities.
In 2018, data were available for 16 cities, the highest of all years. Philadelphia remained an outlier for the same reason. DC became an outlier once again because the rate of its requests regarding streets and sidewalks soared to 84%, while other cities observed a decrease in this category’s rate. Baton Rouge was an outlier this year because of its 69% share of requests regarding garbage and recycling, which was much higher than other cities.
In 2019, Philadelphia and Baton Rouge remained outliers for the same reason. Chicago was an outlier as well. Chicago formed a couple with Philadelphia because they both had a large category of requests for information. Other categories also shared similar rates in these two cities, except for the category of complaints, with a 21% rate in Chicago and less than 1% in Philadelphia. Kansas City also stepped slightly outside of the dense cluster of most cities, towards Baton Rouge, because of the increase in its requests regarding garbage and recycling.
6. Conclusions and Future Directions
An interesting pattern in many cities, such as Baltimore, Louisville, New Orleans, NYC, Oakland, and San Francisco, is the decrease in SRs regarding streets and sidewalks and the increase in requests about transportation, in the past decade. This pattern is the result of the dramatic rise in the number of vehicles on the streets. It shows that the slow boost in quality and capacity of roads does not meet the dramatic rise in transportation demand, resulting in a shift in request types from streets and sidewalks to transportation. Requests regarding garbage, cleaning, rodents, and complaints have also been rising in some cities, reflecting the insufficiency of those cities’ infrastructure to keep up with the population growth. New types of requests have emerged and soared in recent years, such as requests for information and regarding shared mobility devices, reflecting the popularity of shared mobility devices, despite being a new service, and their unexpected problems and complaints.
The most consistent outliers, in terms of SR types are: Washington DC and Baltimore because of their much higher rate of requests concerning the condition of streets and sidewalks; Las Vegas because of its much higher rate of requests regarding graffities, cleaning, and rodents; Philadelphia and Chicago because of their much higher rate of requests for information; and Baton Rouge because of its much higher rate of requests regarding garbage collection.
One future direction is to expand this study to other countries, where the 311 service is available, and to compare cities worldwide. This will allow us to find cities with similar problems across the world and compare their policies, outcomes, and experiences. Another future direction is to fuse the knowledge obtained from 311 SRs in this study with knowledge about road and pedestrian networks and online social media, to gain a deeper understanding and wider picture of problems, circumstances, causes, and possibly solutions.
Funding
This research received no external funding.
Data Availability Statement
The raw data used in this study are available at US City Open Data Census (USCODC) website.
Conflicts of Interest
The author declares no conflict of interest.
References
- Federal Communications Commission. First Report and Order and Further Notice of Proposed Rulemaking; Federal Communications Commission: Washington, DC, USA, 1997. Available online: https://transition.fcc.gov/Bureaus/Common_Carrier/Orders/1997/fcc97051.pdf (accessed on 20 December 2020).
- Schwester, R.W.; Carrizales, T.; Holzer, M. An examination of the municipal 311 system. Int. J. Organ. Theory Behav. 2009, 12, 218–236. [Google Scholar] [CrossRef]
- Xu, L.; Kwan, M.-P.; McLafferty, S.; Wang, S. Predicting demand for 311 non-emergency municipal services: An adaptive space-time kernel approach. Appl. Geogr. 2017, 89, 133–141. [Google Scholar] [CrossRef]
- DeMeritt, M.; Writer, E. Simplifying citizen reporting. ArcUser Mag. ESRI Softw. User 2011, 14, 26–27. [Google Scholar]
- Chatfield, A.; Reddick, C.G. Customer agility and responsiveness through big data analytics for public value creation: A case study of Houston 311 on-demand services. Gov. Inf. Q. 2018, 35, 336–347. [Google Scholar] [CrossRef]
- Clark, B.Y.; Guzman, T.S. Does Technologically Enabled Citizen Participation Lead to Budget Adjustments? An Investigation of Boston, MA, and San Francisco, CA. Am. Rev. Public Adm. 2016, 47, 945–961. [Google Scholar] [CrossRef]
- Hartmann, S.; Mainka, A.; Stock, W.G. Citizen relationship management in local governments: The Potential of 311 for public service delivery. In Beyond Bureaucracy; Springer: Cham, Switzerland, 2017; pp. 337–353. [Google Scholar]
- Nam, T.; Pardo, T.A. The changing face of a city government: A case study of Philly311. Gov. Inf. Q. 2014, 31, S1–S9. [Google Scholar] [CrossRef]
- Brunsdon, C.; Corcoran, J.; Higgs, G. Visualising space and time in crime patterns: A comparison of methods. Comput. Environ. Urban Syst. 2007, 31, 52–75. [Google Scholar] [CrossRef]
- Wang, L.; Qian, C.; Kats, P.; Kontokosta, C.; Sobolevsky, S. Structure of 311 service requests as a signature of urban location. PLoS ONE 2017, 12, e0186314. [Google Scholar] [CrossRef] [PubMed] [Green Version]
- Minkoff, S.L. NYC 311: A tract-level analysis of citizen–government contacting in New York City. Urban Aff. Rev. 2016, 52, 211–246. [Google Scholar] [CrossRef]
- Clark, B.Y.; Brudney, J.; Jang, S.-G. Coproduction of Government Services and the New Information Technology: Investigating the Distributional Biases. Public Adm. Rev. 2013, 73, 687–701. [Google Scholar] [CrossRef]
- Kontokosta, C.; Hong, B.; Korsberg, K. Equity in 311 reporting: Understanding socio-spatial differentials in the propensity to complain. arXiv 2017, arXiv:1710.02452. [Google Scholar]
- O’Brien, D.T. 311 hotlines, territoriality, and the collaborative maintenance of the urban commons: Examining the intersection of a coproduction policy and evolved human behavior. Evol. Behav. Sci. 2016, 10, 123–141. [Google Scholar] [CrossRef]
- White, A.; Trump, K.-S. The Promises and Pitfalls of 311 Data. Urban Aff. Rev. 2018, 54, 794–823. [Google Scholar] [CrossRef]
- Wheeler, A.P. The Effect of 311 Calls for Service on Crime in D.C. at Microplaces. Crime Delinq. 2018, 64, 1882–1903. [Google Scholar] [CrossRef] [Green Version]
- Lu, Q.; Johnson, P. Characterizing New Channels of Communication: A Case Study of Municipal 311 Requests in Edmonton, Canada. Urban Plan. 2016, 1, 18–31. [Google Scholar] [CrossRef]
- Jolliffe, I.T. Principal Component Analysis; Springer: New York, NY, USA, 1986. [Google Scholar]
Figure 1.
SR type frequencies per city and per year.


Figure 2.
Visual clustering of cities based on non-emergency SR type rates in different years.


Table 1.
Number of SRs per year and in each city.
| 2006 | 2007 | 2008 | 2009 | 2010 | 2011 | 2012 | 2013 | 2014 | 2015 | 2016 | 2017 | 2018 | 2019 | |
|---|---|---|---|---|---|---|---|---|---|---|---|---|---|---|
| Santa Monica | 97 | 190 | 251 | 703 | 877 | 728 | 647 | 466 | 814 | 4162 | 4486 | 5641 | 14,681 | 19,830 |
| Kansas City | 83,075 | 137,894 | 119,269 | 110,276 | 96,113 | 90,199 | 90,462 | 89,329 | 96,941 | 103,955 | 109,811 | 124,280 | 166,018 | |
| San Francisco | 172,912 | 185,920 | 194,907 | 205,750 | 258,801 | 307,204 | 345,177 | 450,233 | 510,244 | 599,330 | 660,522 | |||
| NYC | 2,031,815 | 1,961,600 | 1,796,175 | 1,839,975 | 2,114,002 | 2,300,763 | 2,391,428 | 2,491,971 | 2,747,952 | 2,456,827 | ||||
| Baltimore | 772 | 1060 | 1363 | 2033 | 611,908 | 672,096 | 700,337 | 671,087 | 780,424 | 768,429 | ||||
| D.C. | 601 | 56,149 | 197,873 | 145,001 | 145,707 | 102,416 | 65,277 | 76,059 | 98,180 | 103,840 | ||||
| Oakland | 33,647 | 37,995 | 47,294 | 56,888 | 61,826 | 66,889 | 75,932 | 80,740 | 77,851 | 110,928 | ||||
| Louisville | 106,380 | 106,296 | 105,503 | 96,335 | 94,605 | 104,145 | 102,039 | 102,135 | 124,741 | |||||
| Cincinnati | 54,987 | 91,390 | 97,314 | 107,931 | 111,857 | 106,897 | 115,872 | 107,406 | ||||||
| Las Vegas | 18,818 | 3443 | 2281 | 2830 | 6449 | |||||||||
| New Orleans | 41,316 | 41,230 | 42,151 | 47,976 | 50,134 | 52,881 | ||||||||
| Austin | 127,761 | 136,875 | 129,874 | 132,409 | 151,025 | 178,172 | ||||||||
| Philadelphia | 406,650 | 453,055 | 154,402 | 9662 | 1471 | |||||||||
| Baton Rouge | 78,690 | 80,102 | 98,083 | 112,100 | ||||||||||
| Gainesville | 1396 | 2413 | 2288 | 2392 | ||||||||||
| Pittsburgh | 78,047 | 79,852 | 100,459 | 94,955 | ||||||||||
| Minneapolis | 51,764 | |||||||||||||
| San Diego | 144,404 | 182,781 | 309,202 | |||||||||||
| Los Angeles | 1,131,781 | |||||||||||||
| Chicago | 1,826,465 |
Table 2.
Standardized SR types under twelve general categories.
| Streets/Sidewalks | Transportation | Maintenance | Garbage and Recycling | Complaint | Information | Public Mobility Services | Parks and Trees | Cleaning and Rodents | Animal | Air and Water Quality | Poverty |
|---|---|---|---|---|---|---|---|---|---|---|---|
| Street/Road Repair | Parking Violation | Construction and Plumbing | Missed Garbage/Recycling Pick-up | Residential/Street Noise | Information Request | Bus Operator/Late/Safety Complaint | Tree Care/Removal/Debris and Tall Grass/Weed | Missing/Damaged Catch Basin/Manhole Cover | Animal Control/Care | Water Quality Complaint | Low-Income Senior Housing |
| Sidewalk/Curb Repair | Parking Permit | Electrical | Garbage/Recycling Collection | Aircraft/Helicopter Noise | Lost and Found | Taxi Complaint | New Tree Request | Cleaning and Sanitation | Dead Animal | Air Quality Complaint | Homeless Encampment |
| Street Light Repair/Add | Parking Ticket Contest | No Heat and Hot Water | Bulky Items | Nuisance Complaint | Online/Phone Payment Problem | Shared Mobility Device Complaint | Park Maintenance | Rat and Rodent | Animal Bite | Asbestos Complaint | Panhandling |
| Street/Road Sign Repair/Replacement/New | Abandoned Vehicle | No Water | Illegal Dumping | Illegal Posting/Signs | Billing Address/Name Incorrect | Park Lighting | Graffiti Removal | ||||
| Traffic/Pedestrian Signal Repair | Driving Violations | Vacant Property | Garbage/Recycling Cart Repair/Replacement/New Service | Property Violations | Benefit Card Replacement | Sewage/Storm Water | |||||
| Street/Sidewalk Sweeping | Street/Road/Sidewalk Obstruction | Water Turn Off Request | Remove Unwanted Garbage/Recycling Cart | Tenant and Landlord Dispute | Business License Application | Mold | |||||
| Snow Removal and Icy Condition | Bus Stop Request | Elevator | Hazardous Waste | Drug Activity | FCCS Refund Request | ||||||
| Parking Meter Repair/Request | Oversized Vehicle Complaint | Smoke Detector Repair/Installation | Abandoned Toters/Cans/Containers | Drinking | |||||||
| Bus Stop Shelter Repair | Derelict Bicycle | Boilers Inspection | Recycling Enforcement | Report Litterer | |||||||
| Speed Bump Request | Fire Hydrant Repair/Request | Smoking | |||||||||
| Vending Machine Repair | Consumer Complaint about a Purchase |
Table 3.
Features with more than 1% contribution in the PCA transformation.
| Feature | Contribution | Feature | Contribution |
|---|---|---|---|
| Parking Meter Repair/Request | 9.88% | Street/Road Sign Repair/Replacement/New | 2.72% |
| Information Request | 9.36% | Tree Care/Removal/Debris and Tall Grass/Weed | 2.71% |
| Sidewalk/Curb Repair | 8.03% | Cleaning and Sanitation | 2.44% |
| Graffiti Removal | 7.48% | Animal Control/Care | 2.38% |
| Missed Garbage/Recycling Pick-up | 6.05% | Street/Road Repair | 2.38% |
| Bus Operator/Late/Safety Complaint | 5.58% | Nuisance Complaint | 2.00% |
| Bulky Items | 5.31% | Illegal Dumping | 1.95% |
| Street Light Repair/Add | 4.19% | Garbage/Recycling Collection | 1.75% |
| Garbage/Recycling Cart Repair/Replacement/New Service | 3.86% | Construction and Plumbing | 1.67% |
| Parking Violation | 3.68% | Sewage/Storm Water | 1.52% |
| Property Violations | 3.66% | Abandoned Vehicle | 1.40% |
Publisher’s Note: MDPI stays neutral with regard to jurisdictional claims in published maps and institutional affiliations. |
© 2021 by the author. Licensee MDPI, Basel, Switzerland. This article is an open access article distributed under the terms and conditions of the Creative Commons Attribution (CC BY) license (https://creativecommons.org/licenses/by/4.0/).
Share and Cite
MDPI and ACS Style
Hashemi, M. Studying and Clustering Cities Based on Their Non-Emergency Service Requests. Information 2021, 12, 332. https://0-doi-org.brum.beds.ac.uk/10.3390/info12080332
AMA Style
Hashemi M. Studying and Clustering Cities Based on Their Non-Emergency Service Requests. Information. 2021; 12(8):332. https://0-doi-org.brum.beds.ac.uk/10.3390/info12080332
Chicago/Turabian StyleHashemi, Mahdi. 2021. "Studying and Clustering Cities Based on Their Non-Emergency Service Requests" Information 12, no. 8: 332. https://0-doi-org.brum.beds.ac.uk/10.3390/info12080332
Note that from the first issue of 2016, this journal uses article numbers instead of page numbers. See further details here.