
A Review of Tabular Data Synthesis Using GANs on an IDS Dataset
by
 , , and
Stavroula Bourou
* ,
,
Andreas El Saer
,
Terpsichori-Helen Velivassaki
,
Artemis Voulkidis
and
Theodore Zahariadis
Synelixis Solutions S.A., 34100 Chalkida, Greece
*
Author to whom correspondence should be addressed.
Information 2021, 12(9), 375; https://0-doi-org.brum.beds.ac.uk/10.3390/info12090375
Submission received: 8 August 2021
/
Revised: 10 September 2021
/
Accepted: 11 September 2021
/
Published: 14 September 2021
(This article belongs to the Special Issue Novel Approaches for Information Security in Complex Cyber-Physical Systems)
Abstract
:Recent technological innovations along with the vast amount of available data worldwide have led to the rise of cyberattacks against network systems. Intrusion Detection Systems (IDS) play a crucial role as a defense mechanism in networks against adversarial attackers. Machine Learning methods provide various cybersecurity tools. However, these methods require plenty of data to be trained efficiently, which may be hard to collect or to use due to privacy reasons. One of the most notable Machine Learning tools is the Generative Adversarial Network (GAN), and it has great potential for tabular data synthesis. In this work, we start by briefly presenting the most popular GAN architectures, VanillaGAN, WGAN, and WGAN-GP. Focusing on tabular data generation, CTGAN, CopulaGAN, and TableGAN models are used for the creation of synthetic IDS data. Specifically, the models are trained and evaluated on an NSL-KDD dataset, considering the limitations and requirements that this procedure needs. Finally, based on certain quantitative and qualitative methods, we argue and evaluate the most prominent GANs for tabular network data synthesis.
1. Introduction
Most of the network systems preserve high-quality security characteristics; however, there can be a lot of different adversarial cyberattacks, which due to recent technological innovations change drastically over time. Hence, there is a great need for sophisticated, robust, and adaptive security systems. The Intrusion Detection System (IDS) is a valuable and essential defense mechanism introduced by Anderson in 1980 [1], which is responsible for inspecting network traffic for suspicious and/or malicious activities. The goal of an IDS is to distinguish the malicious network traffic from the normal one. In particular, the IDS monitors the network for harmful activities, raising an alert when suspicious traffic is identified. With the spread of Artificial Intelligence, in the past few years, Machine Learning methods have been applied in Intrusion Detection Systems as a robust and accurate defense mechanism, demonstrating remarkable performance. Specifically, various Machine Learning classifiers, such as Decision Trees Support [2], Artificial Neural Networks (Machine Learning, Deep Learning), such as Convolutional Neural Networks [3], Support Vector Machines (SVMs) [4], and Bayesian Networks [5], have been widely employed in IDSs, because, contrary to conventional methods, they can detect suspicious traffic or discover unseen patterns and abnormalities in the data.
However, these learnable methods require plenty of data to be trained correctly. Data acquisition is often a difficult procedure, since most data are private with strict privacy policies. Therefore, the generation of synthetic tabular data is an important task, which has been thrilling researchers for many years. Relevant past work treats each column of a table differently, creating a joint multivariate probability distribution and then sampling from that distribution, employing Bayesian networks [6,7,8,9] as well as classification and regression trees [10,11]. In the last few years, GAN models have been examined in the generation of synthetic tabular data.
Generative Adversarial Networks (GANs) are a type of Neural Network architecture for generative modeling. GANs were first introduced by Goodfellow et al. [12] in 2014. GAN models are used for unsupervised learning, based on a two-player game theoretical scenario to learn the distribution and the patterns of the training data, in such a way that the model can generate new data that preserve the characteristics of the training data. Later developments in GANs improved speed and training performance. Arjovsky et al. introduced the Wasserstein model [13], which is an improved GAN model that leverages the Wasserstein-1 metric to define a more sophisticated loss function with Gulrajani et al. introducing gradient penalty on Wasserstein GAN [14] to address the side effects of weight clipping during training. In various applications, mainly focusing on generating images [15,16,17,18], GANs have shown remarkable results. Regarding the generation of adversarial malicious examples, GANs have been tried out in some methods. In [19,20], the authors generate malicious traffic records using GANs, while those type of models are used in [21] to synthesize malware examples.
With respect to modeling tabular data, several algorithms such as TGAN [22] and CTGAN [23] proved that GANs outperform classical methods for tabular data synthetic generation. Several GAN models have been used to handle tabular data. Kunar et al. introduced CTAB-GAN [24], which is a conditional table GAN that can model diverse data types with complex distributions. In [25], Passenger Name Records (PNRs) data are synthesized utilizing a Cramer GAN, categorical feature embedding, and a Cross-Net architecture. The authors in [26] use GANs to generate continuous time series on Electronic Health Records (EHR) data, while in [27], MedGAN, which combines an autoencoder with a GAN, is proposed to generate high-dimensional discrete variables from EHR data. TableGAN [28] consists of a convolutional Discriminator and a de-convolutional Generator and a Classifier to increase the semantic integrity of the synthetic data. In [23], CTGAN is proposed, which uses a conditional generator to synthesize tabular data. CopulaGAN [29] is a variation of the CTGAN model that utilizes Cumulative Distribution Function (CDF)-based transformation to facilitate the CTGAN model training.
In this research paper, we perform a systematic analysis of three popular GAN models, CTGAN, CopulaGAN, and TableGAN to generate synthetic tabular dataset for intrusion detection domain. For our research, the open-source SDV library [30], with initial paper work [31], is used, providing GAN models. The models are trained and evaluated in the NSL-KDD dataset [32]. The generated data can be further used for different tasks related to the cybersecurity of network systems, such as Intrusion Detection [33], Network Forensics [34], privacy-preserving techniques [35], etc. Moreover, the synthetic IDS data may be combined with other pioneering techniques, such as blockchain-based solutions [36], Federated Learning process combined with a private blockchain network [37], etc., in order to generate robust and secure next-generation networks.
2. GAN Models
The GAN architecture was first introduced by Goodfellow [12], and it is a Neural Network algorithm for generative modelling. A GAN model consists of two independent sub-models, the Generator G and its adversary, the Discriminator D. The generative model G understands the data distribution p(g) of the real data space x. Then, taking into account an input noise variable, the Generator G generates new adversarial examples G(z) that have the same distribution of x. The Generator G is trained to maximize the probability that the Discriminator D could correctly predict generated samples as real samples, while the Discriminator D is trained to distinguish if the given sample is real or generated by the Generator G.
The mathematical expression of the Vanilla GAN derives from the cross-entropy between the real and generated distributions, and it is the following:
A proof of the above equation is out of the scope of this research material, though a brief description will be referenced here, shortly.
In Equation (1), discriminator tries to maximize the quantity for any given generator , while is the generator’s output when given . and correspond to expected values over all real data instances and over all generated fake instances, respectively. The global optimum for this task is when , and this corresponds to the global minimum of the training criterion.
In order to avoid overfitting when training finite datasets, the Discriminator D must be optimized simultaneously with the Generator G. During the start of the learning process, the Discriminator D may reject the high confidence samples created by the Generator G, because they are different from the training data. To address that, Generator G can be trained to maximize instead of minimizing .
2.1. Wasserstein GAN (WGAN)
The Wasserstein GAN (WGAN) [13] is a modification of the Vanilla GAN, which aims to train the Generator and the Discriminator to better approximate the distribution of the real data. The WGAN introduces some changes over the traditional GAN model, which improve the training process.
Initially, a meaningful loss function, namely Wasserstein-1 distance, is applied, which correlates with the quality of the generated samples. The Wasserstein-1 distance measures the distance between probability distributions.
Moreover, the Discriminator of WGAN does not contain a sigmoid activation at the last layer, resulting to logits. The Wasserstein-1 distance, as it is described in Equation (2), is applied directly to logits, forcing the logit distributions to be similar. The output of the discriminator loss is a score, which indicates the realness or fakeness of the generated sample. The Lipschitz function is used to constrain the optimization problem by clipping the weights of the discriminator function. Lastly, the RMSProp optimizer is used.
The Wasserstein-1 metric, also called Earth Mover’s distance, is defined as follows:
where is the cost function, are the probability distributions, and denotes the set of all joint distributions . The infinite number of joint distributions in makes the Wasserstein-1 distance intractable. Thus, the authors in [13] apply Kantorovich-Rubinstein duality. Hence, Wasserstein-1 distance takes the following form:
where the supremum corresponds to all the 1-Lipschitz functions . Merging this function with a GAN, the result is as follows:
where the functions are K-Lipschitz.
The WGAN model performs a more stable training process that is less sensitive to the architecture of the model and the selection of hyperparameters. Moreover, the mode collapse phenomenon that typically occurs in GAN is reduced. The most significant benefit of WGAN is the continuously estimation of Wasserstein-1 distance, by training the Discriminator until optimality. In contrast, weight clipping is not a good way to enforce Lipschitz constraint. If the clipping parameter is large, then the time needed for the weights to reach their limit increase. If the clipping is small, this may result in vanishing gradients. That is the reason why the authors in [14] proposed the use of gradient penalty instead of weight clipping.
2.2. WGAN-GP
Wasserstein GAN with Gradient Penalty (WGAN-GP) [14] was introduced shortly after the WGAN algorithm. The improvement of this work lies on the gradient penalty that is used to enforce Lipschitz constraint, instead of the weight clipping of the WGAN. Particularly, the WGAN-GP penalizes the model when the gradient norm moves away from the target norm value of 1. The application of gradient penalty requires one more modification in the architecture. Specifically, the batch normalization is not used in the Discriminator, since the batch normalization introduces a correlation between the samples of the same batch. However, the gradient penalty is calculated for each individual sample and not for the entire batch, making the batch normalization not a suitable technique. Other normalization techniques that do not correlate the samples can be used, such as layer normalization. The WGAN-GP demonstrates strong performance as well as stability in different applications.
The loss function with Wasserstein distance and gradient penalty applied is defined by the equation:
where λ is the penalty coefficient.
3. GAN Models and Evaluation Metrics for Tabular Data Generation
3.1. GANs for Synthesizing Tabular Data
GAN models have shown great possibilities in the generation of synthetic images and text. Over the past few years, potential uses of GANs have been explored for tabular data generation, since they offer great flexibility to model data distributions in contrast with traditional statistical techniques.
Giving the table Treal with real data, the task of synthetic data generation results in a synthetic table Tsyn. The T is partitioned into training set Ttrain and test set Ttest. A GAN model is trained at Ttrain. The data generator G learns the data distribution of each column in a table T, and then, it is used to generate the synthetic data of the table Tsyn. A successful data generator G for tabular data should be able to address the challenges associated with the nature of real-world tabular data.
It is common for T to contain mixed data types of numerical and categorical columns. The numerical columns of table can have either discrete or continues values. Thus, the Generator G should be trained to simultaneously learn and generate a mix of data types. Additionally, the shape distribution of each column may differ, following usually non-Gaussian and multimodal distributions, where the min–max transformation causes vanishing gradient problems. In categorical columns of real-world tabular data, the imbalance problem often occurs, since some classes have more instances than others. Imbalanced data lead to mode collapse as well as to inadequate training of the minor classes. Furthermore, sparse one-hot-encoded vectors can cause issues at the training procedure of the Discriminator D, since it learns to distinguish real from fake data from the distribution’s rareness rather to the realness of the value.
Different GAN models have been created in order to solve some or all of the above-mentioned issues. TGAN [22] is constructed to work on any tabular dataset. MedGAN [27] tries to generate simultaneously discrete and continuous samples. In this work, the most promising GAN models for tabular data generation are analyzed, which are TableGAN [28], CTGAN [23], and CopulaGAN [29].
3.1.1. TableGAN
TableGAN [28] is a GAN-based architecture that synthesizes fake tabular data with similar statistical properties to the original table. Privacy concerns motivate the authors to develop this model in order to prevent information leakage. The discriminator D and the generator G of the TableGAN are convolutional neural networks (CNN). The architecture of TableGAN is based on the deep convolutional GAN (DCGAN) [15], which is one of the most popular models for image synthesis.
Another architectural component of TableGAN is the classifier C, which is involved in the training process and aims to increase the semantic integrity of generated records. The classifier C has the same architecture as the discriminator D, while it is trained based on the ground-truth labels of the real table. C learns the correlation between true labels and the features of the table and predicts the labels of the synthetic data. Thus, C educates the generator G if the generated record is semantically correct.
3.1.2. CTGAN
Conditional Tabular GAN (CTGAN) [23] is a GAN-based architecture that is designed to synthesize tabular data. The key improvements of CTGAN try to overcome the challenges of modeling tabular data using GAN architecture. In particular, the architecture of CTGAN deals with non-Gaussian and multimodal distribution by exploiting a mode-specific normalization, which converts continuous values of arbitrary distribution into a bounded vector, which is a representation suitable for neural networks. Previous models, such as TableGAN [28], normalize continuous values to [−1, 1] using min–max normalization techniques. In CTGAN, the variational Gaussian mixture model (VGM) [38] is used for each continuous column independently.
Additionally, a conditional generator and training-by-sampling is implemented to overcome the data imbalance challenge of discrete columns. The data are sampled in a way that all the categories of discrete columns evenly occurred during the training procedure. A cond vector allows the conditioning on a value of a specific column via one-hot encoding. The conditional generator G takes as inputs random noise as well as the cond vector, while it is forced to mimic the desired condition. The training of the model is done using the WGAN loss with gradient penalty [14]. The output of conditional generator is evaluated by the critic, computing the distance between the learned and real conditional distribution.
3.1.3. CopulaGAN
The CopulaGAN model [29] is a variation of the CTGAN, which is introduced in the SDV opensource library. It exploits the Cumulative Distribution Function (CDF)-based transformation, which is applied via GaussianCopula. Particularly, CopulaGAN uses those alternatives of CTGAN in order to learn the data more easily. Based on probability theory, copulas are used to describe the intercorrelation between random variables.
During the training procedure, CopulaGAN tries to learn the data types and the format of the training data. The non-numerical and null data are transformed using a Reversible Data Transformation (RDT). Due to this transformation, a fully numerical representation is occurred from which the model can learn the probability distributions of each table column. Additionally, the CopulaGAN attempts to learn the correlation between the columns of the table.
3.2. Evaluation Metrics
Recent advances of generative modelling identified the need for suitable quantitative and qualitative methods to evaluate trainable models. Reliable evaluation metrics are important not only to rate GAN models but also to identify possible errors in the generated data. Specifically in cases where people face difficulties distinguishing the quality of synthetic data, such as medical images, the requirement for trusted metrics is essential [39].
Evaluating a GAN model is not a straightforward procedure, since various metrics can lead to different outcomes. Specifically, a good performance in one evaluation metric cannot guarantee good performance in another metric [40]. Additionally, the metrics should be chosen with respect to the application that are going to be used for. Inception Score [41], Fréchet Inception Distance [42] and Perceptual Path Length [43] are some metrics that are introduced for the evaluation of general GAN models.
The synthetic data would be evaluated against a sufficient number of metrics that are suitable for the task of tabular data generation. A combination of those methods can express a complete picture about the performance of the generator G of different GAN models. The evaluation is performed on the table of real data Treal as well as on the table of synthetic data Tsyn, which are generated from the trained generator G. Metrics can be categorized into three subcategories: Visual, Statistical, and Machine Learning based.
3.2.1. Visual Evaluation
Visual representation of the generated data is a powerful method to evaluate the performance of the generator G, by analyzing if G is able to maintain the properties of the real data. Based on this, humans can easily verify results and recognize similar patterns between real and synthetic data. Additionally, the visual analysis of results provides information that cannot be covered from the quantitative metrics. The visual evaluation can be based on Distribution, Cumulative Sums, and Column Correlation.
The Distribution plot of each column for real and synthetic data can be a quick sanity check, although it does not reveal any hidden relation. This representation can point out if the statistical properties of the generated and real data are similar to each other.
The Cumulative Sum of each column for real and generated data can be visualized to indicate the similarity between the distributions per column. This visualization can present a useful understanding for both categorical and continuous columns. However, this representation cannot provide any insight about the relations between columns.
Another evaluation method can be based on the Correlation table, which shows the association between each column of the table. Comparing the correlation matrix of the real and synthetic data can indicate if the generator manages to appropriately model the relationship between the columns of the table.
3.2.2. Statistical Metrics
Different types of statistical tests can be applied on real and generated tables. Particularly, these metrics compare individual columns of the real table with the corresponding column from the generated data and produce a result of this analysis. Two statistical tests are used for the evaluation of the GAN models, which are trained with an intrusion detection dataset: KSTest and CSTest.
The KSTest compares the distributions for the continuous features between the real and the generated table by using the two-sample Kolmogorov–Smirnov test and the empirical Cumulative Distributed Function (CDF). The result of each column comparison is 1 minus the Test D, expressing the maximum distance between the observed and expected CDF values.
For discrete values, the CSTest metric exploits the Chi-squared test in order to compare the distributions of columns between real and synthesized data. The comparison is performed column by column, and the result is the CSTest p-value, the probability that values from the two columns have been sampled from the same distribution.
3.2.3. Machine Learning-Based Metrics
This family of metrics exploits Machine Learning algorithms to evaluate the quality of the generated data. They are able to provide insight knowledge about the relations that Treal and Tsyn have. Particularly, GANs the for tabular data generation task are evaluated by the detection metrics as well as Machine Learning efficacy metrics.
The Detection Metrics evaluate how difficult is to differentiate the generated from the real data. Specifically, those metrics are based on Machine Learning models, which predict if the input data is synthetic or real. For this reason, a flag is associated to each data record, indicating if it is real or generated. Afterwards, the data with the flags are shuffled and the Machine Learning models are cross-validated, attempting to predict the flag. Finally, the result of those metrics equal to 1 minus the average ROC AUC score of all cross-validation splits. The Machine Learning models that can be used in those metrics are Logistic Regression or SVD classifier.
The Machine Learning Efficacy Metrics indicate if it is possible to replace the real with generated data to solve problems using Machine Learning models. In particular, a model is trained on Tsyn, and then, it is tested on Treal. In case of classification problems, Decision Tree, AdaBoost, or MLP classifier can be used, while the performance of those models is evaluated based on accuracy and F1 score. For regression tasks, Linear Regression or MLP regression may be utilized as machine learning models, and the evaluation is performed by R2. The average performance of different models can be used as metric for the evaluation of G.
As it is mentioned above, those metrics are occurred by solving Machine Learning problems. Therefore, they can only be applied on datasets that contain a target column, which should be predicted based on the rest of the data. The target column could contain true labels or ground truth values for the classification and regression task, respectively.
4. NSL-KDD Dataset
The NSL-KDD [32] is an Intrusion Detection System dataset, which is an improved version of its predecessor, the KDD’99 [44] dataset, which suffers from a large number of duplicate records. Specifically, the NSL-KDD dataset does not contain redundant records in the train and test sets. Therefore, classifiers that would be trained and tested at those datasets would not be biased based on the most frequent records. Another advantage of NSL-KDD over the KDD’99 is the reasonable amount of data in the train and test sets, providing the opportunity to perform experiments on the complete sets. The NSL-KDD is one of the most well-known publicly available datasets, since it is used by many researchers to develop efficient and accurate Intrusion Detection Systems. Studies have been performed to analyze the properties of the NSL-KDD dataset [45,46,47].
The NSL-KDD dataset contains 148,514 traffic records of normal activities and attacks. The dataset includes the train set KDDTrain+ and the test set KDDTest+. The train and the test datasets do not have the same distribution, while the test dataset contains some attacks that are not included in the train dataset. The labeled attacks of the NSL-KDD dataset can be grouped in four main types, which are Denial of Service (DoS), Probe, User to Root (U2R), and Remote to Local (R2L).
DoS [48] is a type of attack in which the malicious actor makes the network or the device unavailable for the users. This is achieved by flooding the computing or memory resources of the targeted machine until normal traffic cannot be processed; therefore, the user access to the machine is denied. DoS attack is one of the most frequently occurred cases in network intrusion. Probe is another type of attack, in which the hacker scans a machine or a device and gathers network information to identify vulnerabilities or weak points that can be used to harm the system [49]. Remote to User (R2L) is a type of attack, in which a remote user sends packets to a machine or a device through the internet, in which she/he does not have access [50]. The attacker aims to reveal the network vulnerabilities and take advantages of the privileges that a local user would have. The User to Root (U2R) type refers to an attack in which the attacker imitates a normal user, while he/she attempts to gain root access and super user privileges to the system [51]. Table 1 illustrates the type and the labeled attacks of the NSL-KDD dataset.
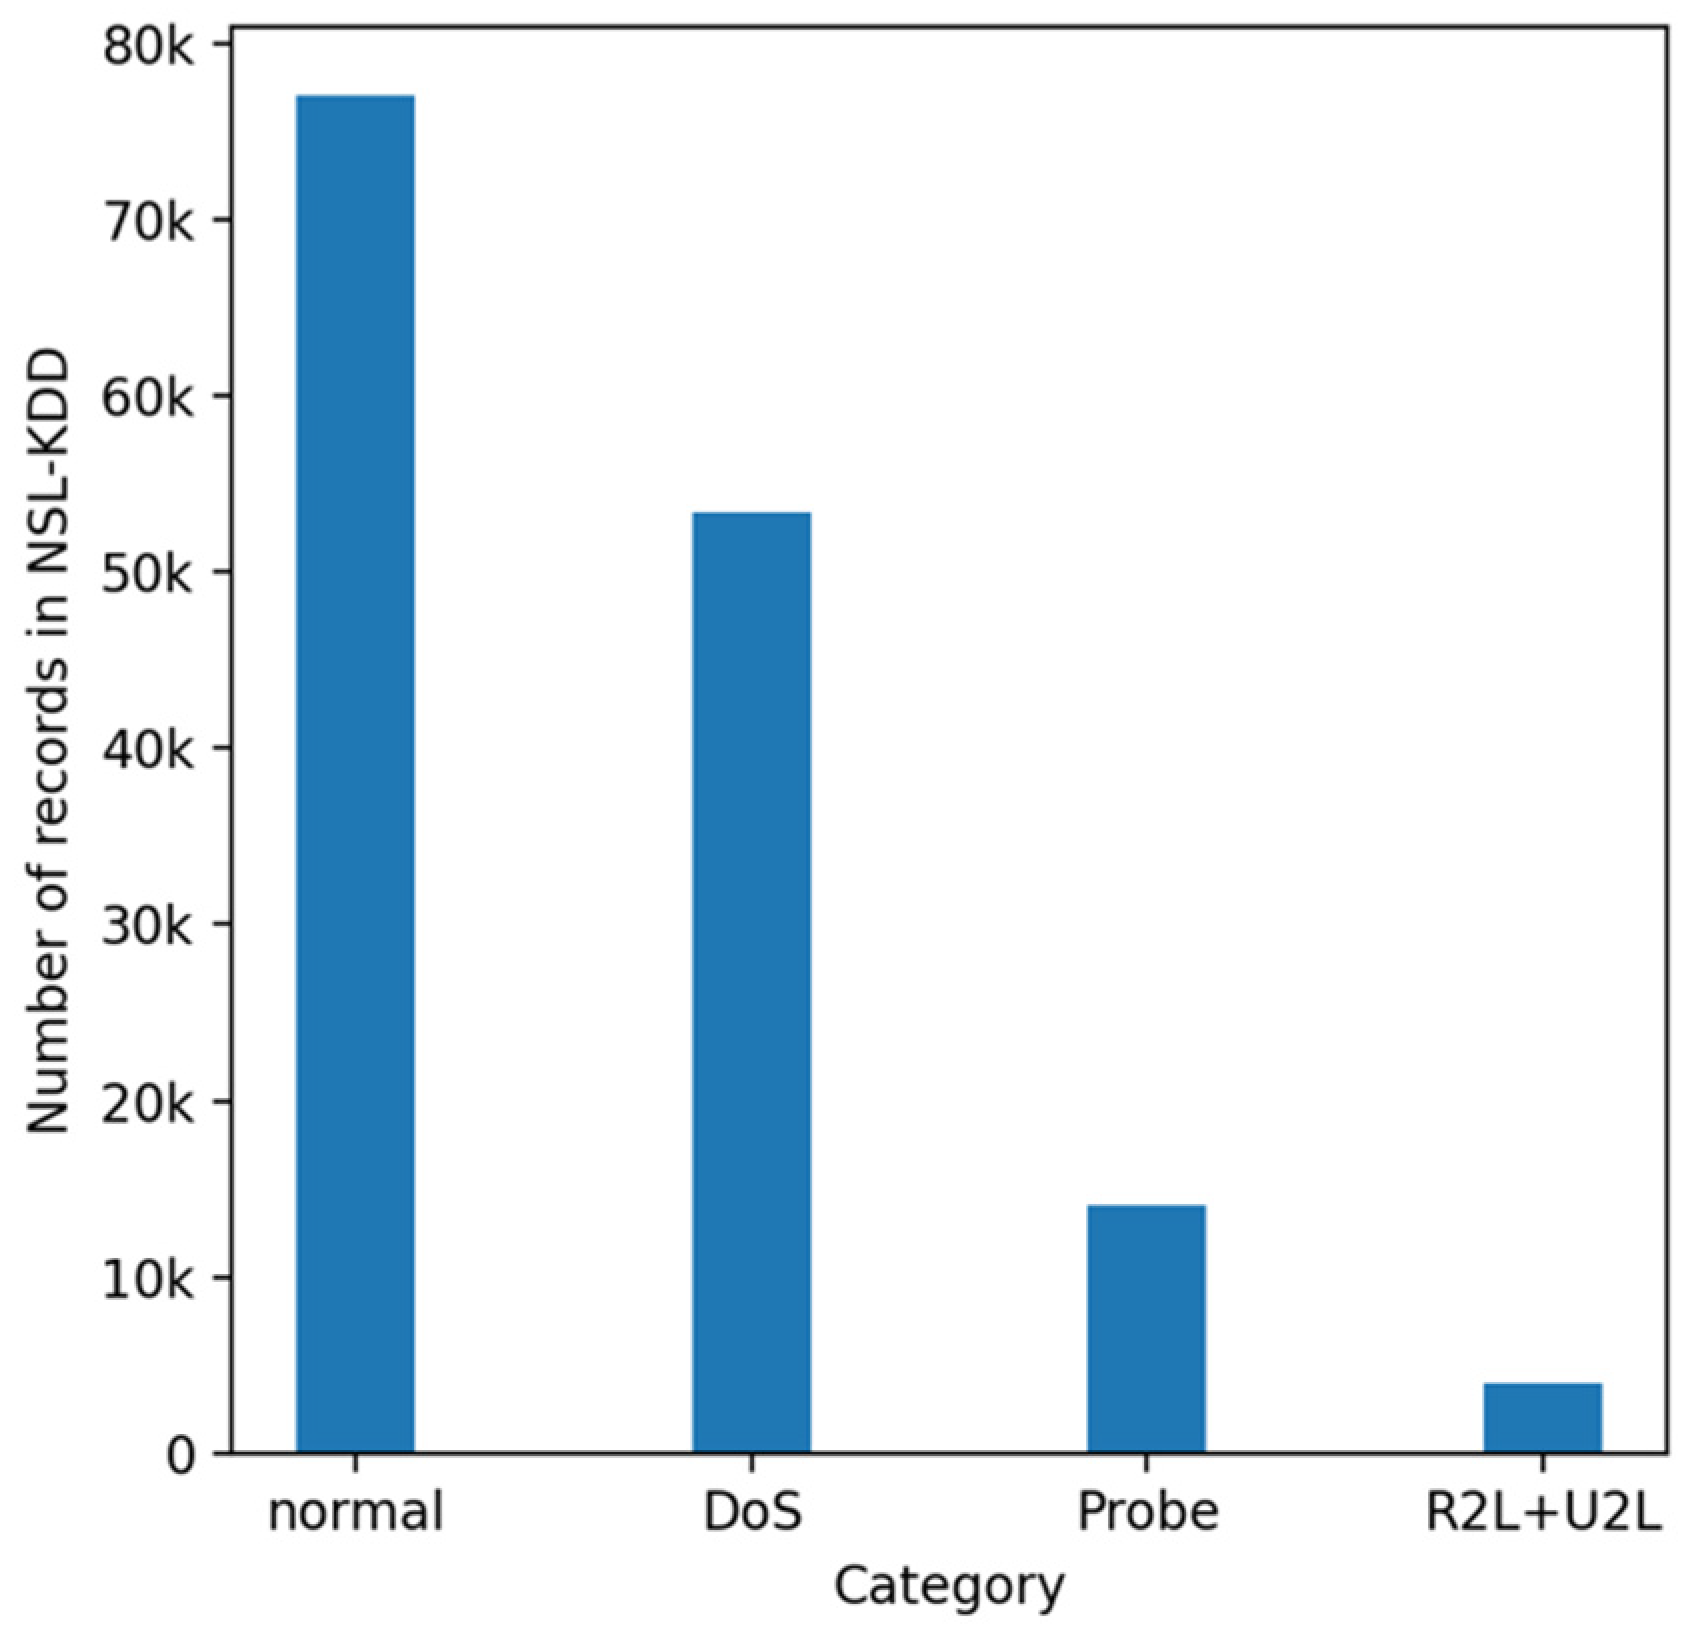
From the statistical analysis of the NSL-KDD dataset, it is observed that there are 77,052 normal traffics, which is more than half of the total records. Regarding the attack records, DoS type is the most frequent with 53,386 instances, Probe type has 14,077 instances, while there are a few traffic records for R2L and U2R attacks, 3880 and 119 instances, respectively. Figure 1 illustrates the distribution of records, normal and attack types, in the NSL-KDD dataset.
DoS is one of the most common types of attack, and it frequently occurs in everyday life. This characteristic of DoS attacks is reflected in the NSL-KDD dataset, in which this category contains the majority of attack records. Additionally, the detection of DoS attacks is a crucial challenge that needs thorough investigation. Considering all those reasons, the present work is focused on the application of different GAN models for the generation of synthetic DoS attacks. Thus, the traffic records of the NSL-KDD dataset are divided into normal and attack classes based on the ‘class’ column, while the attacks are separated to four categories: DoS, Probe, R2L, and U2R. The records of DoS attack are selected for the training and evaluation GANs.
Each traffic record of the NSL-KDD dataset has 41 features, three of them have categorical values, five consists of binary values, one feature encloses three unique values, while the rest of the features are in discrete or in continuous values. The categorical, binary, and triplet features of NSL-KDD are mentioned in Table 2. According to the type and property of the features, they can be broken down into four categories, which are Intrinsic, Content, Time-based and Host-based.
- Intrinsic features (9): includes necessary information of the record, such as protocol, service, and duration.
- Content features (13): comprise information about the content, such as the login activities. Those features demonstrate if there are behaviors related to attacks.
- Time-based features (9): contains the number of connections to the same destination host or service as the current connection in the past two seconds.
- Host-based features (10): checks the 100 past connections, which have the same destination host or service with the current connection.
4.1. Constraints for the Generating Adversarial Examples
The generated tabular data should represent attacks that have evading IDS as their purpose; however, in order to achieve this, the generation process should take account and maintain the functional characteristic of each attack category [19]. Based on attack principles, each category of attacks has its functional and nonfunctional features. The functional features describe the basic function of the attack, while the nonfunctional represent the secondary characteristics of the attack. The attack properties remain undistributed when the functional features do not change, and only the nonfunctional features are modified. Thus, to achieve reliable and valid generated attack records, the functional features should be unchanged, while the nonfunctional features can be modified. Therefore, the GAN models should be trained and then generate only the nonfunctional features, taking into account the examined attack category. Table 3 illustrates the functional features of each attack category of the NSL-KDD dataset, as it is discussed in [52]. Considering the aforementioned, the features of each DoS record of NSL-KDD are split into functional and nonfunctional, the functional ones remain unmodified, while the nonfunctional are used as the training set of GAN models. Consequently, the trained GAN models will be able to generate the nonfunctional features and coupled with the functional ones will create meaningful DoS records.
5. Experiments and Results
5.1. Experimental Setup
Experiments are designed to investigate the general properties and performance of the different GAN models for the task of generation of synthetic IDS data. In particular, the CTGAN [23], CopulaGAN [29], and TableGAN [28] are trained at the NSL-KDD dataset, taking into account the restrictions in the generation of DoS attack records, as described in Section 4.1. For our experiments, we use the GAN models, which are provided by the open-source synthetic data generation ecosystem SDV–The Synthetic Data Vault [30]. Each model is trained with a batch size of 500 and for 100 epochs. The learning rates for the generator and discriminator of all models are both 0.0002. Additionally, the discriminator steps of CTGAN and CopulaGAN are set to 5.
Then, the synthetic datasets that occurred from the trained GAN models are evaluated using the metrics, which are described in Section 3.2 of this work. The Distribution and Cumulative Sum plots are created using the Table Evaluator [53] library, while the Statistical and Machine Learning-based metrics are calculated based on the Single Table Metrics of the SDV library [54].
5.2. Results
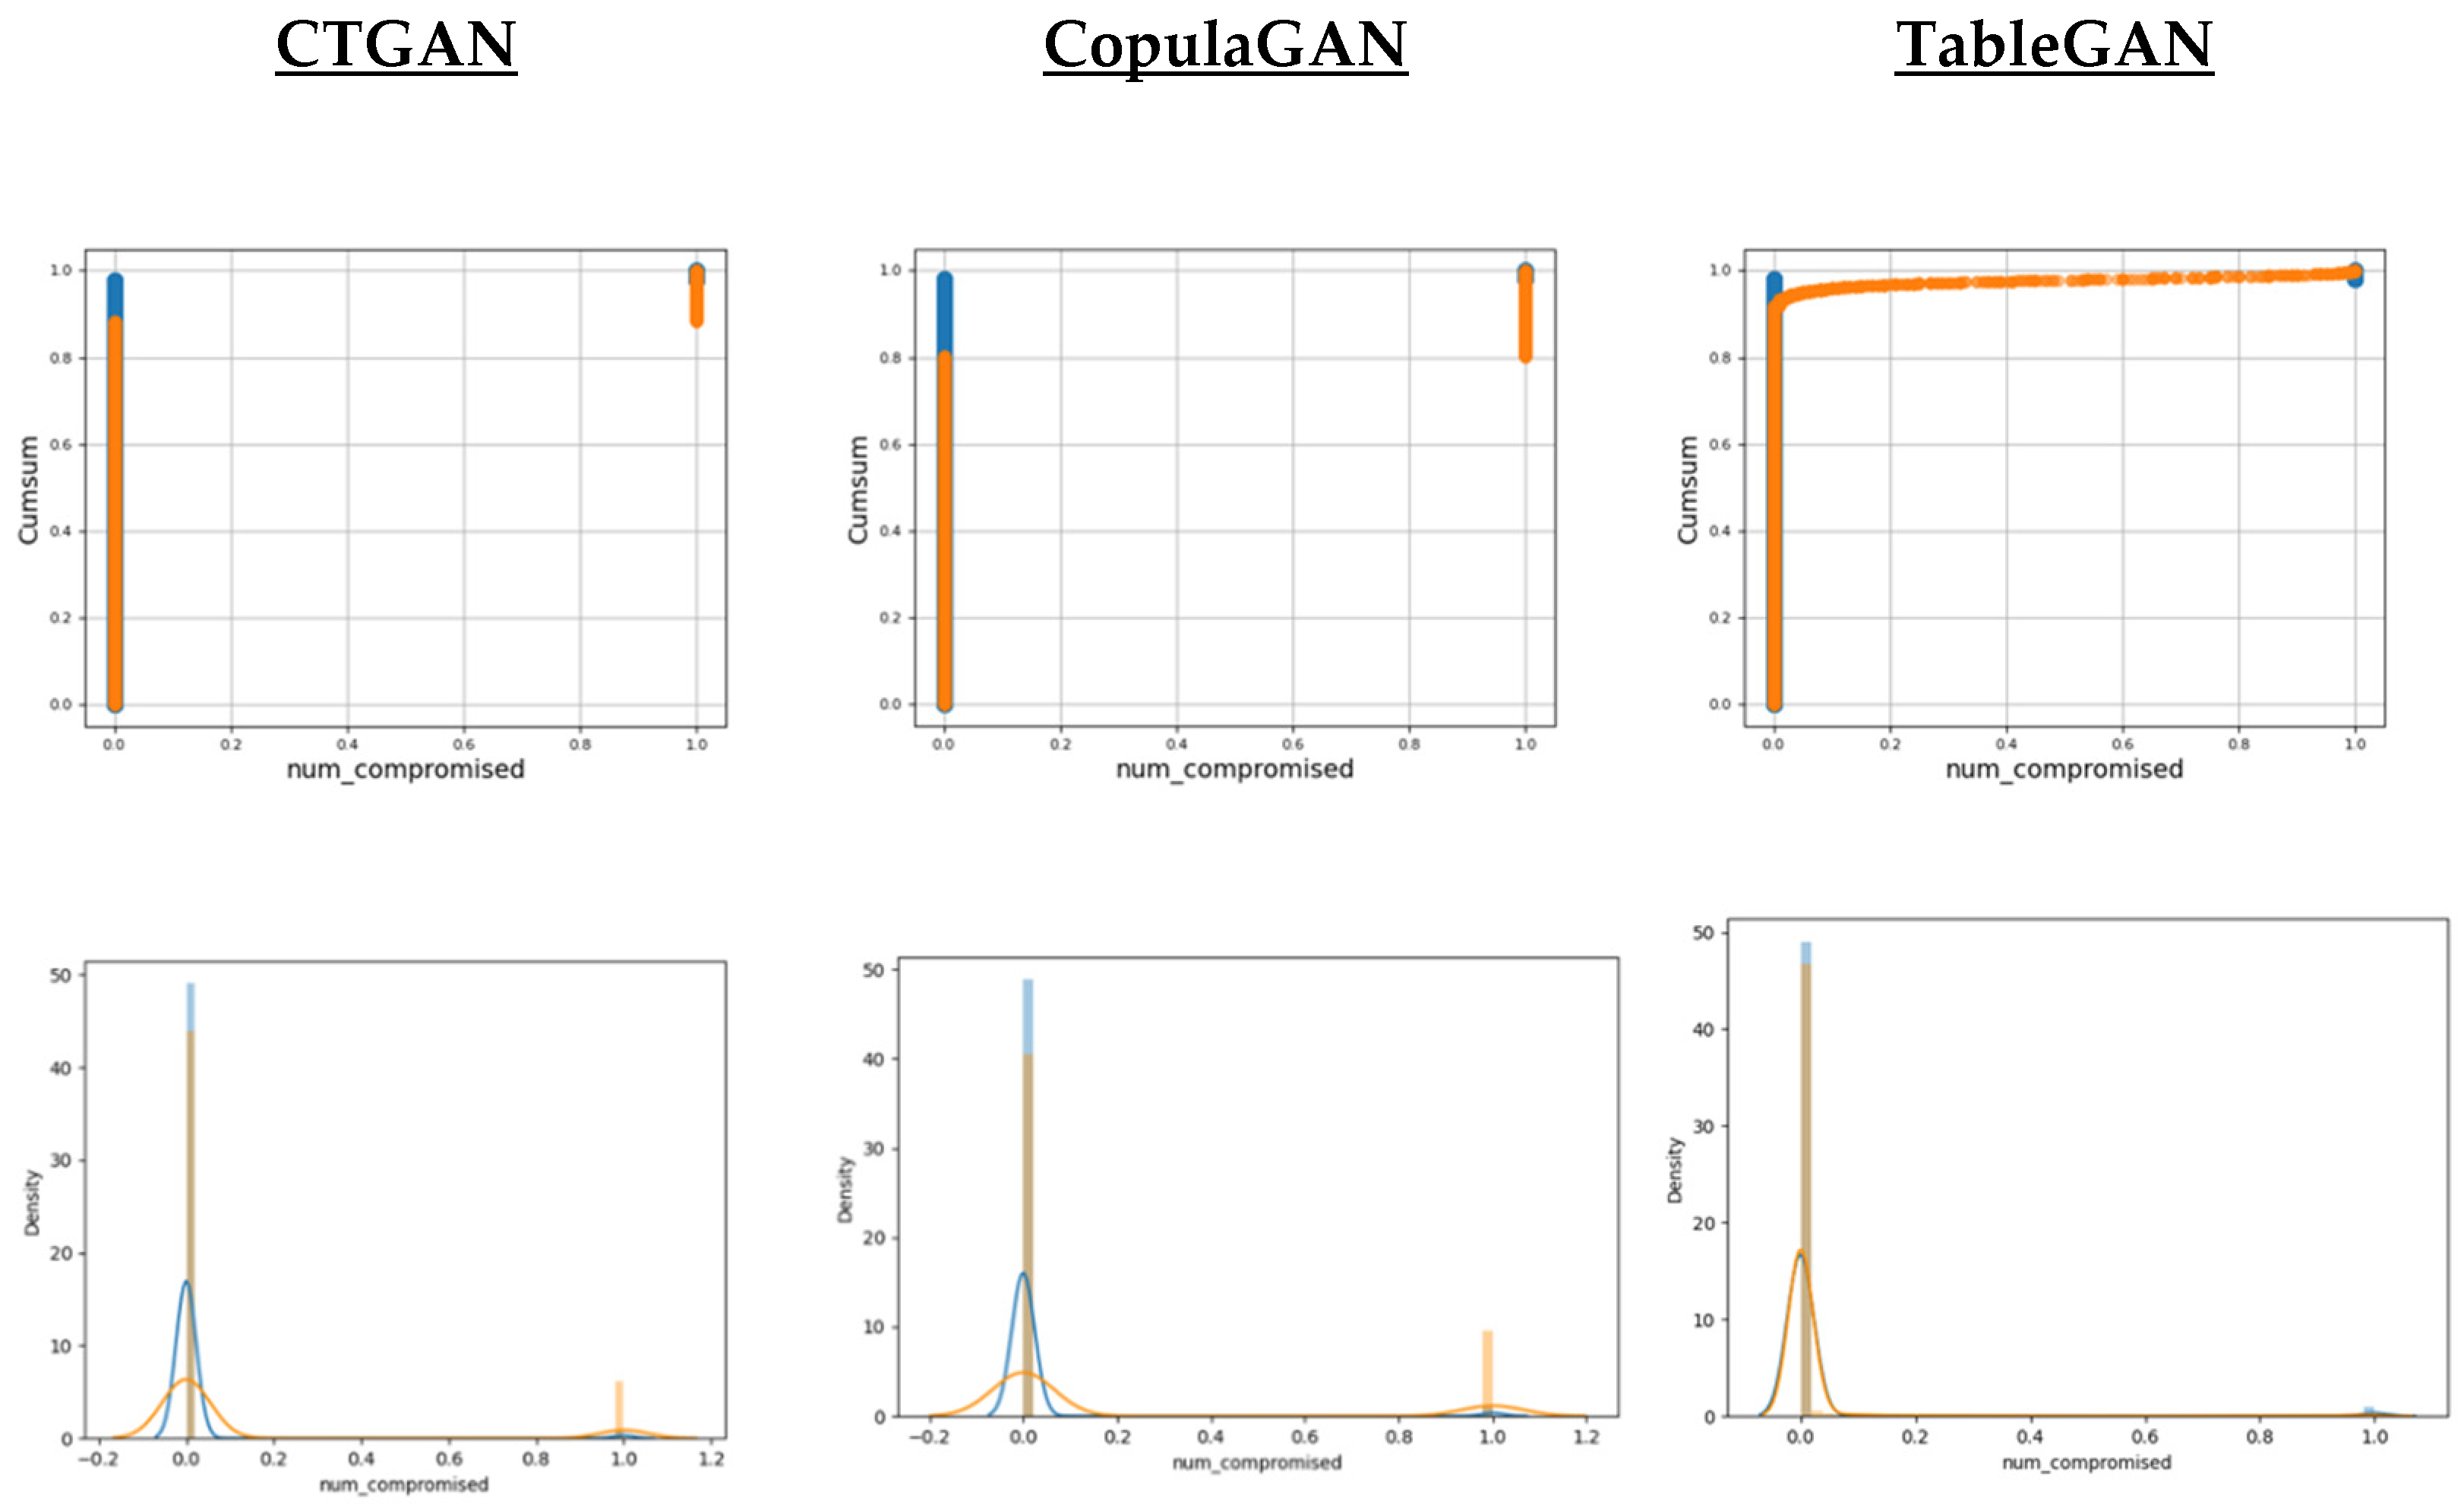
To visually demonstrate the performance of GAN models for the generation of DoS attack records, some indicative features are chosen. Specifically, one discrete and two continuous features can be used to summarize the behavior of synthetic data. Figure 2 shows the cumulative sum and distribution plots of discrete features, namely “num_compromised”. It is observed that both CTGAN and CopulaGAN outperform TableGAN in the case of discrete values.
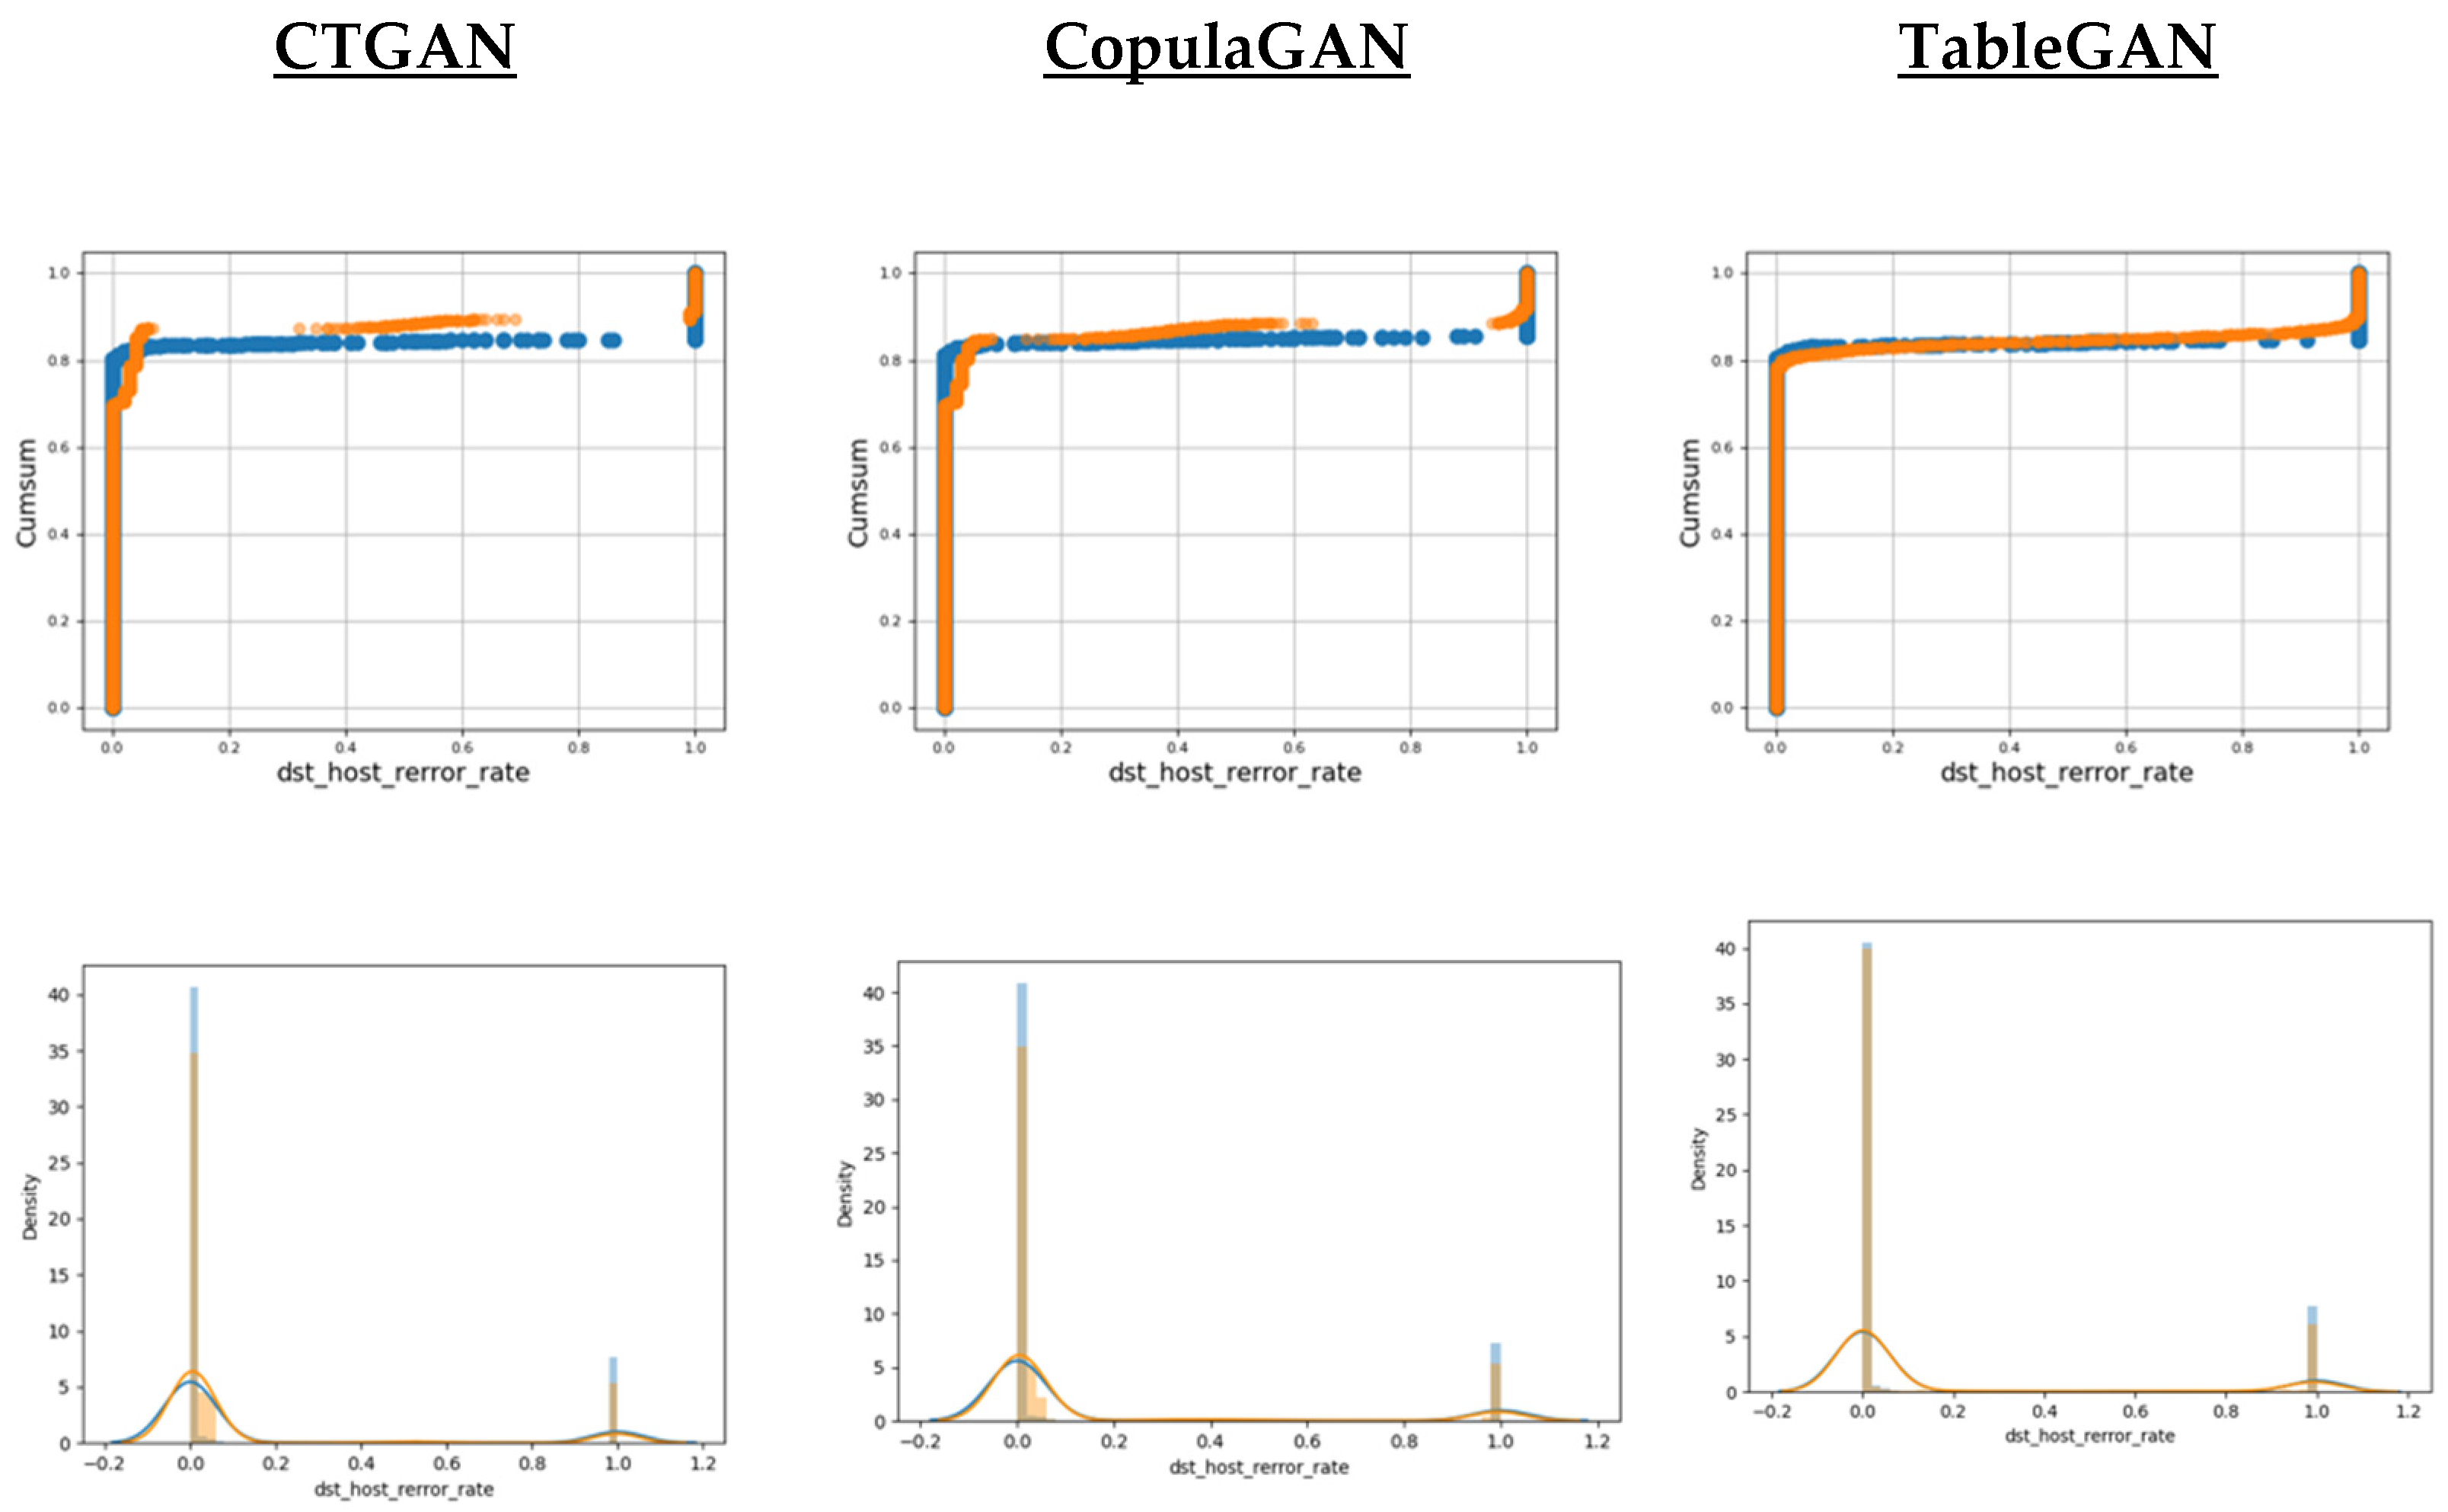
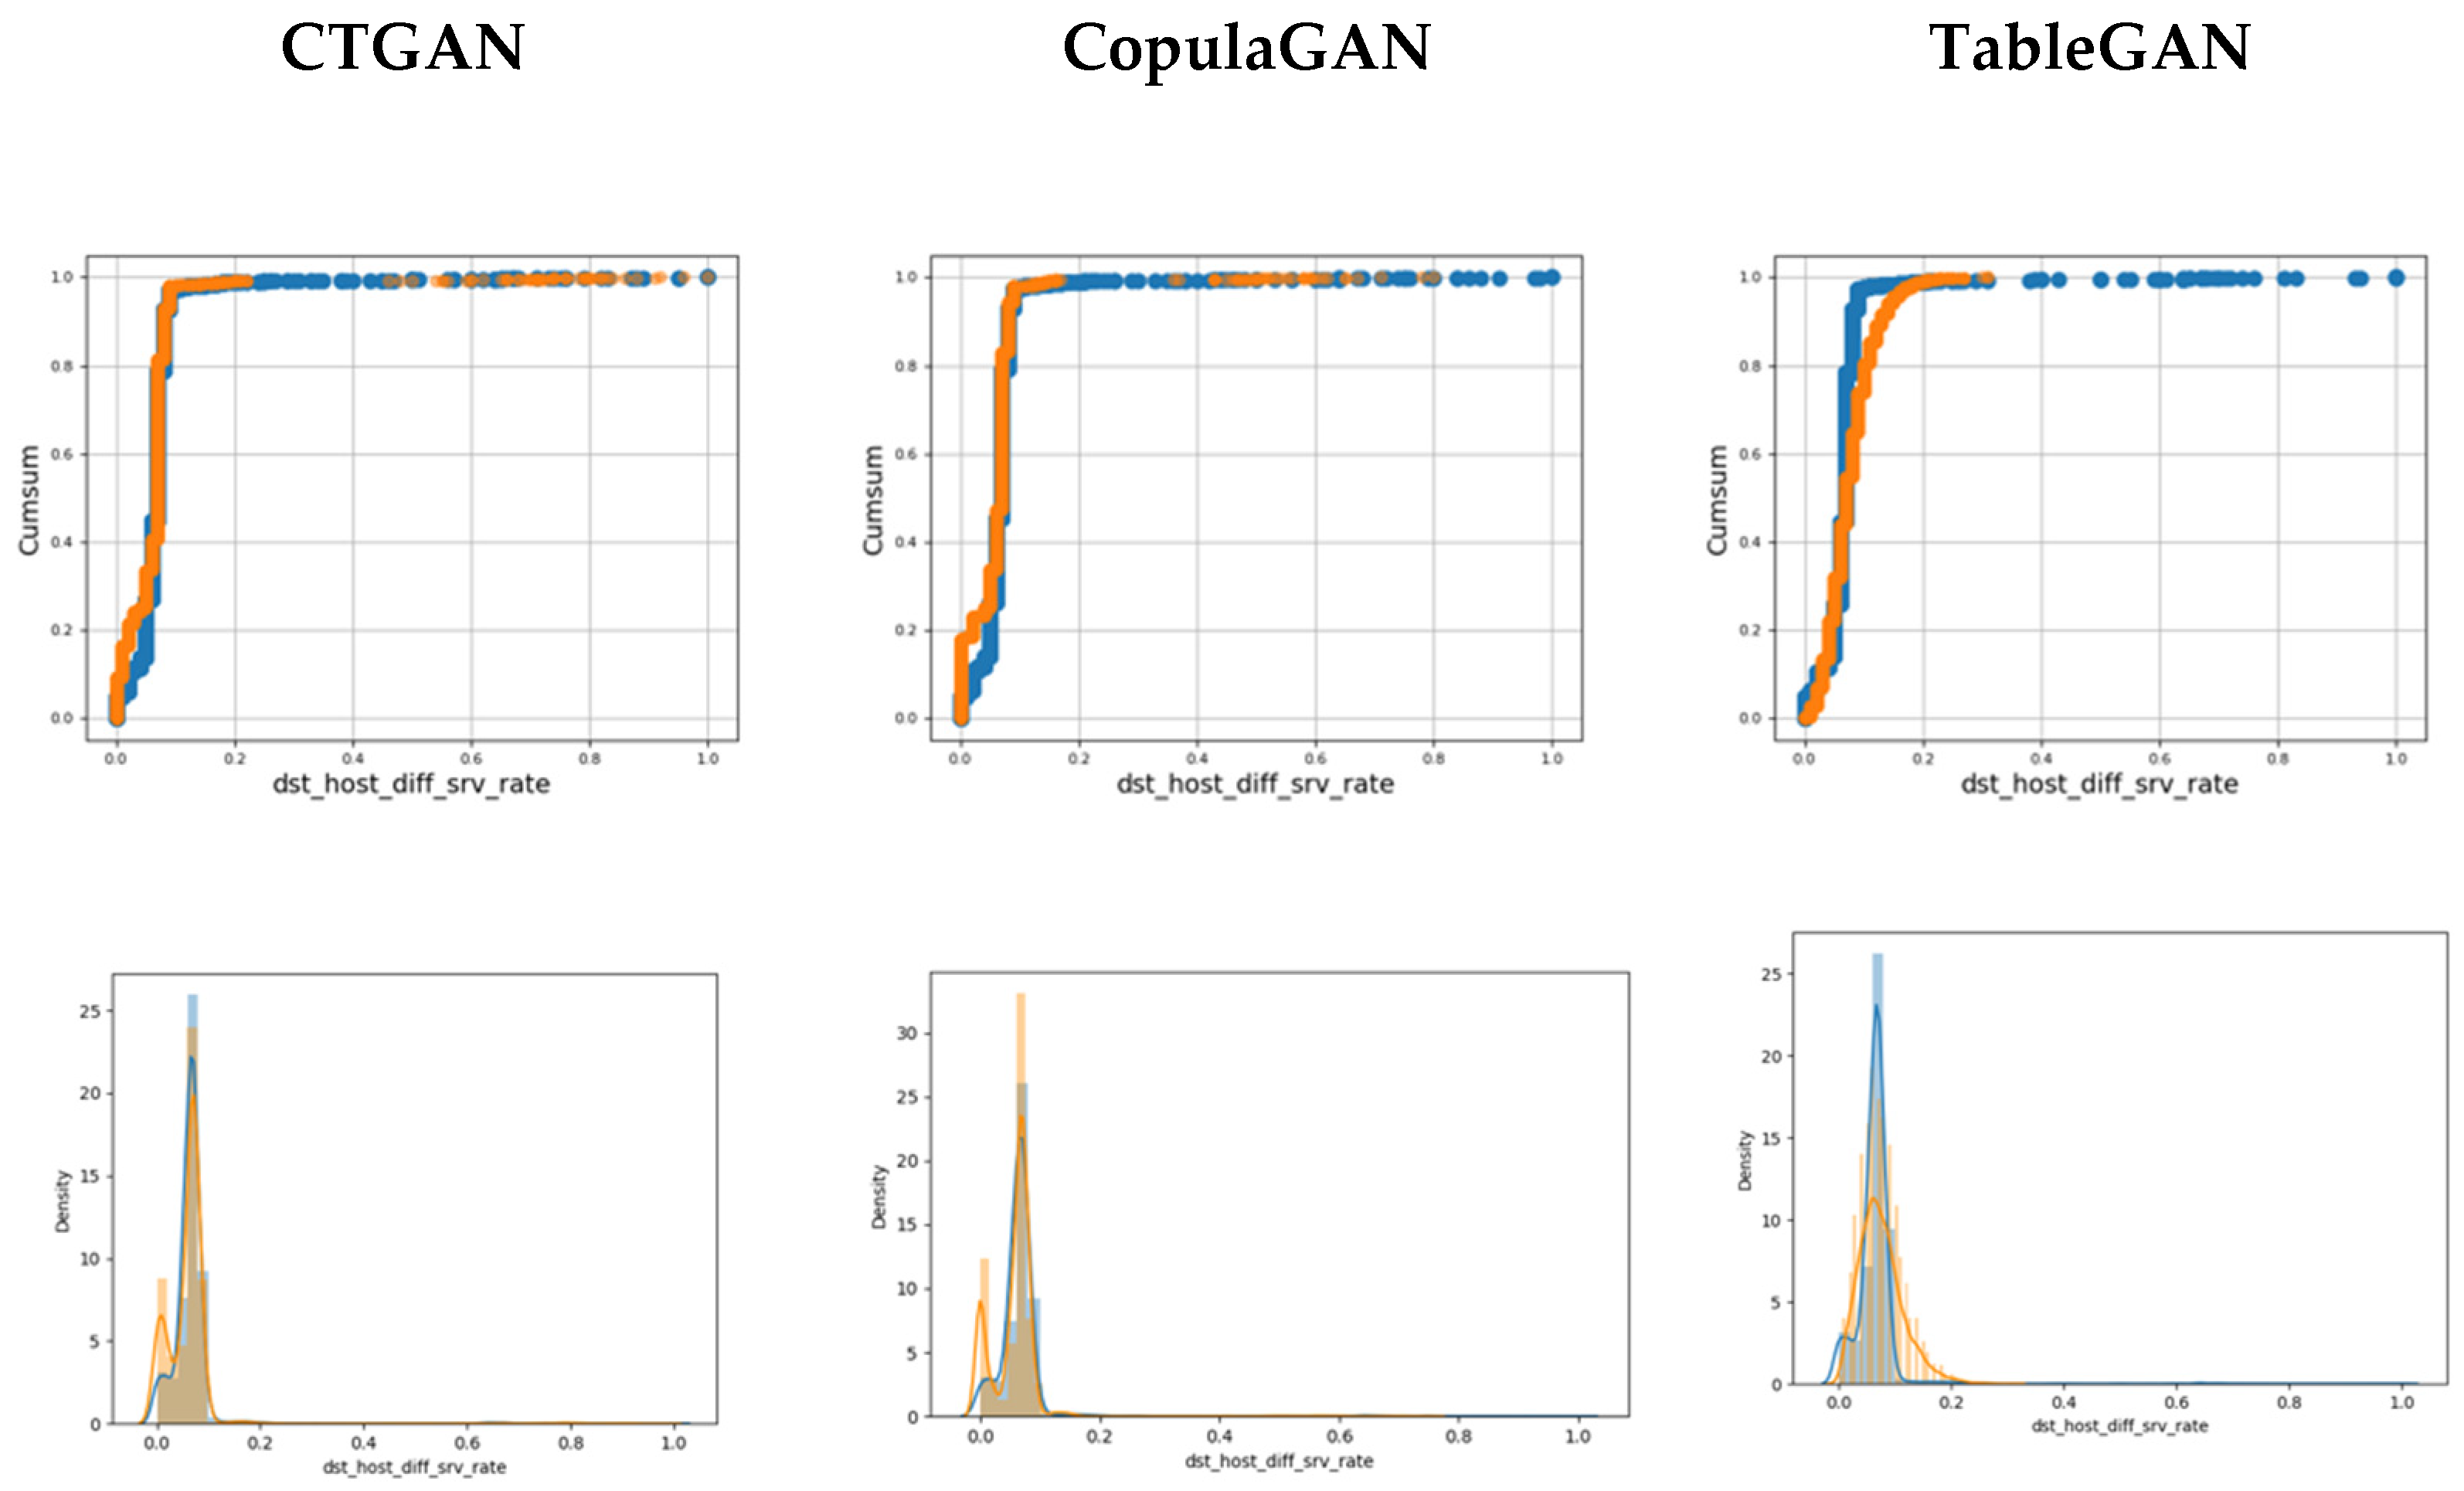
Figure 3 and Figure 4 illustrate the corresponding diagrams for continuous features. In those cases, the TableGAN achieves slightly better performance than CTAGN and CopulaGAN. However, as it is depicted in Figure 4, all GAN methods suffer when modeling continuous features with sparse data.
Figure 5 illustrates the column wise correlation of real data as well as the generated one from CTGAN, CopulaGAN, and TableGAN. The columns with features that contain zero values are eliminated from this representation. The correlation matrix of generated data is compared to the correlations of real data. Generally, all the models are able to adequately capture the correlations between features. Although, as it is observed, TableGAN faces difficulties in capturing some of the correlations.
Table 4 shows the Statistical Metrics as well as the Detection Metrics. Considering the CSTest and KSTEst values, it is concluded that CTGAN and CopulaGAN can better model the discrete features rather than the continuous values of the real data. On the other hand, it seems that TableGAN more easily models the discrete features and struggles with the continuous ones. For all the models, the Detection Metric indicates that the Logistic Regression Classifier finds it moderately difficult to distinguish the real from the generated data. Therefore, the real and the generated data are distinguishable to one degree.
Finally, the Machine Learning Metrics are visualized in Table 5. All the models indicate similar performance, showing that it is possible to replace the real with synthetic data to solve Machine Learning problems.
6. Conclusions
In this work, we review the most popular GAN-based models for tabular IDS data synthesis. More specifically, CTGAN, TableGAN, and CopulaGAN are employed on the well-known NSL-KDD dataset to generate synthesized IDS samples. Based on visual representation and statistical metrics, it is observed that TableGAN works sufficiently for continuous data; however, it suffers in situations of discrete values. Additionally, CTGAN and CopulaGAN work fairly well for both continuous and discrete values. From our experiments, all the models can adequately capture the correlations between features. From the Machine Learning efficacy metrics, it is observed that it is possible to replace the real data with synthetic ones to solve data issues for Machine Learning tasks. However, from detection metrics, the classifiers’ accuracy in distinguishing the real from synthetic generated data is moderated. Considering all these, we can conclude that the generated IDS dataset from CTGAN, CopulaGAN, and TableGAN can be used as learning data for various Machine Learning tasks.
Author Contributions
Conceptualization: S.B., A.E.S., T.-H.V., A.V.; Methodology: S.B., A.E.S., T.-H.V., A.V., T.Z.; Software: S.B., A.E.S.; Validation: S.B., A.E.S., T.-H.V.; Writing—original draft preparation: S.B., A.E.S., T.-H.V.; Writing—review and editing: T.Z.; Supervision: A.V., T.Z.; Project administration: T.Z., A.V.; Funding acquisition: T.Z., A.V. All authors have read and agreed to the published version of the manuscript.
Funding
This work was partially funded by the H2020 IoT-NGIN project, contract no. 957246, within the H2020 Framework Program of the European Commission.
Institutional Review Board Statement
Not applicable.
Informed Consent Statement
Not applicable.
Data Availability Statement
NLS-KDD dataset: https://www.unb.ca/cic/datasets/index.html (accessed on 11 May 2021).
Conflicts of Interest
The authors declare no conflict of interest.
References
- Anderson, J.P. Computer security threat monitoring and surveillance. In Technical Report; James, P., Ed.; Anderson Company, Fort: Washington, PA, USA, Technical Report 98-17; April 1980. [Google Scholar]
- Rai, K.; Devi, M.S.; Guleria, A. Decision tree based algorithm for intrusion detection. Int. J. Adv. Netw. Appl. 2016, 7, 2828. [Google Scholar]
- Li, Z.; Qin, Z.; Huang, K.; Yang, X.; Ye, S. Intrusion detection using convolutional neural networks for representation learning. In Proceedings of the International Conference on Neural Information Processing, Guangzhou, China, 14–18 November 2017; Springer: Cham, Switzerland, 2017; pp. 858–866. [Google Scholar]
- Teng, S.; Wu, N.; Zhu, H.; Teng, L.; Zhang, W. SVM-DT-based adaptive and collaborative intrusion detection. IEEE/CAA J. Autom. Sin. 2018, 5, 108–118. [Google Scholar] [CrossRef]
- Bringas, P.G.; Grueiro, I.S. Bayesian Networks for Network Intrusion Detection. 2010. Available online: https://intechopen.com/books/bayesian-network/bayesian-networks-for-network-intrusion-detection (accessed on 10 September 2021).
- Zhang, J.; Cormode, G.; Procopiuc, C.M.; Srivastava, D.; Xiao, X. PrivBayes: Private data release via bayesian networks. Acm Trans. Database Syst. 2014, 42, 1423–1434. [Google Scholar]
- Aviñó, L.; Ruffini, M.; Gavaldà, R. Generating Synthetic but Plausible Healthcare Record Datasets. arXiv 2018, arXiv:1807.01514. [Google Scholar]
- Dong, Q.; Elliott, M.R.; Raghunathan, T.E. A nonparametric method to generate synthetic populations to adjust for complex sampling design features. Surv. Methodol. 2014, 40, 29. [Google Scholar]
- Oliva, J.B.; Dubey, A.; Wilson, A.G.; Póczos, B.; Schneider, J.; Xing, E.P. Bayesian nonparametric kernel-learning. In Proceedings of the Artificial Intelligence and Statistics, Cadiz, Spain, 9–11 May 2016; pp. 1078–1086. [Google Scholar]
- Nowok, B.; Raab, G.M.; Dibben, C. synthpop: Bespoke creation of synthetic data in R. J. Stat. Softw. 2016, 74, 1–26. [Google Scholar] [CrossRef] [Green Version]
- Reiter, J.P. Using CART to generate partially synthetic public use microdata. J. Off. Stat. 2005, 21, 441. [Google Scholar]
- Goodfellow, I.; Pouget-Abadie, J.; Mirza, M.; Xu, B.; Warde-Farley, D.; Ozair, S.; Courville, A.; Bengio, Y. Generative Adversarial Nets. 2014. Available online: https://papers.nips.cc/paper/5423-generative-adversarial-nets.pdf (accessed on 10 September 2021).
- Arjovsky, M.; Chintala, S.; Bottou, L. Wasserstein generative adversarial networks. In Proceedings of the International conference on machine learning, Sydney, Australia, 6–11 August 2017; pp. 214–223. [Google Scholar]
- Gulrajani, I.; Ahmed, F.; Arjovsky, M.; Dumoulin, V.; Courville, A. Improved training of wasserstein GANs. 2017. Available online: http://papers.nips.cc/paper/7159-improved-training-of-wasserstein-gans.pdf (accessed on 10 September 2021).
- Radford, A.; Metz, L.; Chintala, S. Unsupervised representation learning with deep convolutional generative adversarial networks. arXiv 2015, arXiv:1511.06434. [Google Scholar]
- Denton, E.; Chintala, S.; Szlam, A.; Fergus, R. Deep generative image models using a Laplacian pyramid of adversarial networks. arXiv 2015, arXiv:1506.05751. [Google Scholar]
- Karras, T.; Aila, T.; Laine, S.; Lehtinen, J. Progressive growing of gans for improved quality, stability, and variation. arXiv 2017, arXiv:1710.10196. [Google Scholar]
- Liu, S.; Wang, T.; Bau, D.; Zhu, J.-Y.; Torralba, A. Diverse image generation via self-conditioned gans. In Proceedings of the IEEE/CVF Conference on Computer Vision and Pattern Recognition, Seattle, WA, USA, 13–19 June 2020; pp. 14286–14295. [Google Scholar]
- Lin, Z.; Shi, Y.; Xue, Z. Idsgan: Generative adversarial networks for attack generation against intrusion detection. arXiv 2018, arXiv:1809.02077. [Google Scholar]
- Charlier, J.; Singh, A.; Ormazabal, G.; State, R.; Schulzrinne, H. SynGAN: Towards generating synthetic network attacks using GANs. arXiv 2019, arXiv:1908.09899. [Google Scholar]
- Hu, W.; Tan, Y. Generating adversarial malware examples for black-box attacks based on GAN. arXiv 2017, arXiv:1702.05983. [Google Scholar]
- Xu, L.; Veeramachaneni, K. Synthesizing Tabular Data using Generative Adversarial Networks. arXiv 2018, arXiv:1811.11264. [Google Scholar]
- Xu, L.; Skoularidou, M.; Infante, A.C.; Veeramachaneni, K. Modeling Tabular Data Using Conditional GAN. 2019. Available online: https://nips.cc/conferences/2019/acceptedpapersinitial (accessed on 10 September 2021).
- Zhao, Z.; Kunar, A.; van der Scheer, H.; Birke, R.; Chen, L.Y. CTAB-GAN: Effective Table Data Synthesizing. arXiv 2021, arXiv:2102.08369. [Google Scholar]
- Mottini, A.; Lheritier, A.; Acuna-Agost, R. Airline passenger name record generation using generative adversarial networks. arXiv 2018, arXiv:1807.06657. [Google Scholar]
- Yahi, A.; Vanguri, R.; Elhadad, N.; Tatonetti, N.P. Generative adversarial networks for electronic health records: A framework for exploring and evaluating methods for predicting drug-induced laboratory test trajectories. arXiv 2017, arXiv:1712.00164. [Google Scholar]
- Choi, E.; Biswal, S.; Malin, B.; Duke, J.; Stewart, W.F.; Sun, J. Generating multi-label discrete patient records using generative adversarial networks. In Proceedings of the Machine Learning for Healthcare Conference, Boston, MA, USA, 18–19 August 2017; pp. 286–305. [Google Scholar]
- Park, N.; Mohammadi, M.; Gorde, K.; Jajodia, S.; Park, H.; Kim, Y. Data synthesis based on generative adversarial networks. arXiv 2018, arXiv:1806.03384. [Google Scholar] [CrossRef] [Green Version]
- CopulaGAN Model. Available online: https://sdv.dev/SDV/user_guides/single_table/copulagan.html (accessed on 15 July 2021).
- SDV—The Synthetic Data Vault. Available online: https://sdv.dev/SDV/user_guides/benchmarking/synthesizers.html (accessed on 15 July 2021).
- Patki, N. The Synthetic Data Vault: Generative Modeling for Relational Databases. 2016. Available online: https://dspace.mit.edu/handle/1721.1/109616 (accessed on 10 September 2021).
- NSL-KDD Dataset. Available online: https://www.unb.ca/cic/datasets/index.html (accessed on 15 July 2021).
- Su, T.; Sun, H.; Zhu, J.; Wang, S.; Li, Y. BAT: Deep learning methods on network intrusion detection using NSL-KDD dataset. IEEE Access 2020, 8, 29575–29585. [Google Scholar] [CrossRef]
- Moustafa, N.; Slay, J. A network forensic scheme using correntropy-variation for attack detection. In Proceedings of the IFIP International Conference on Digital Forensics, New Delhi, India, 3–5 January 2018; Springer: Cham, Switzerland, 2018; pp. 225–239. [Google Scholar]
- Zhang, T.; Zhu, Q. Distributed privacy-preserving collaborative intrusion detection systems for VANETs. IEEE Trans. Signal Inf. Process. Netw. 2018, 4, 148–161. [Google Scholar] [CrossRef]
- Xevgenis, M.; Kogias, D.G.; Karkazis, P.; Leligou, H.C.; Patrikakis, C. Application of Blockchain Technology in Dynamic Resource Management of Next Generation Networks. Information 2020, 11, 570. [Google Scholar] [CrossRef]
- Short, R.; Leligou, H.C.; Theocharis, E. Execution of a Federated Learning process within a smart contract. In Proceedings of the 2021 IEEE International Conference on Consumer Electronics (ICCE), Las Vegas, NV, USA, 10–12 January 2021; pp. 1–4. [Google Scholar]
- Svensén, M.; Bishop, C.M. Pattern Recognition and Machine Learning; Springer: Cham, Switzerland, 2007. [Google Scholar]
- Borji, A. Pros and Cons of GAN Evaluation Measures: New Developments. arXiv 2021, arXiv:2103.09396. [Google Scholar]
- Theis, L.; Oord, A.V.d.; Bethge, M. A note on the evaluation of generative models. arXiv 2015, arXiv:1511.01844. [Google Scholar]
- Salimans, T.; Ian, G.; Zaremba, W.; Cheung, V.; Radford, A.; Chen, X. Improved techniques for training gans. Adv. Neural Inf. Process. Syst. 2016, 29, 2234–2242. [Google Scholar]
- Heusel, M.; Ramsauer, H.; Unterthiner, T.; Nessler, B.; Hochreiter, S. Gans trained by a two time-scale update rule converge to a local nash equilibrium. Adv. Neural Inf. Process. Syst. 2017, 30, 6629–6640. [Google Scholar]
- Karras, T.; Laine, S.; Aila, T. A style-based generator architecture for generative adversarial networks. In Proceedings of the IEEE/CVF Conference on Computer Vision and Pattern Recognition, Long Beach, CA, USA, 15–20 June 2019; pp. 4401–4410. [Google Scholar]
- KDD Cup 1999 Data. Available online: http://kdd.ics.uci.edu/databases/kddcup99/kddcup99.html (accessed on 11 May 2021).
- Dhanabal, L.; Shantharajah, S.P. A study on NSL-KDD dataset for intrusion detection system based on classification algorithms. Int. J. Adv. Res. Comput. Commun. Eng. 2015, 4, 446–452. [Google Scholar]
- Choudhary, S.; Kesswani, N. Analysis of KDD-Cup’99, NSL-KDD and UNSW-NB15 datasets using deep learning in IoT. Procedia Comput. Sci. 2020, 167, 1561–1573. [Google Scholar] [CrossRef]
- Ring, M.; Wunderlich, S.; Scheuring, D.; Landes, D.; Hotho, A. A survey of network-based intrusion detection data sets. Comput. Secur. 2019, 86, 147–167. [Google Scholar] [CrossRef] [Green Version]
- Moore, D.; Shannon, C.; Brown, D.J.; Voelker, G.M.; Savage, S. Inferring internet denial-of-service activity. ACM Trans. Comput. Syst. 2006, 24, 115–139. [Google Scholar] [CrossRef]
- Khamphakdee, N.; Benjamas, N.; Saiyod, S. Improving intrusion detection system based on snort rules for network probe attack detection. In Proceedings of the 2014 2nd International Conference on Information and Communication Technology, Bandung, Indonesia, 28–30 May 2014. [Google Scholar]
- Alharbi, A.; Alhaidari, S.; Zohdy, M. Denial-of-service, probing, user to root (U2R) & remote to user (R2L) attack detection using hidden Markov models. Int. J. Comput. Inf. Technol. 2018, 7, 204–210. [Google Scholar]
- Paliwal, S.; Gupta, R. Denial-of-service, probing & remote to user (R2L) attack detection using genetic algorithm. Int. J. Comput. Appl. 2012, 60, 57–62. [Google Scholar]
- Lee, W.; Stolfo, S.J. A framework for constructing features and models for intrusion detection systems. ACM Trans. Inf. Syst. Secur. 2000, 3, 227–261. [Google Scholar] [CrossRef]
- Table Evaluator. Available online: https://baukebrenninkmeijer.github.io/table-evaluator/ (accessed on 25 July 2021).
- Synthetic Data Evaluation-Single Table Metrics. Available online: https://sdv.dev/SDV/user_guides/evaluation/single_table_metrics.html (accessed on 25 July 2021).
Figure 1.
Number of records for each attack type in NSL-KDD dataset.

Figure 2.
Cumulative Sums and Distributions for discrete feature “num_compromised”. Blue illustrates the real data, while orange illustrates the synthetic.
Figure 2.
Cumulative Sums and Distributions for discrete feature “num_compromised”. Blue illustrates the real data, while orange illustrates the synthetic.

Figure 3.
Cumulative Sums and Distributions for continuous feature “dst_host_rerror_rate”. Blue illustrates the real data, while orange illustrates the synthetic data.
Figure 3.
Cumulative Sums and Distributions for continuous feature “dst_host_rerror_rate”. Blue illustrates the real data, while orange illustrates the synthetic data.

Figure 4.
Cumulative Sums and Distributions for continuous feature “dst_host_srv_diff_host_rate”. Blue illustrates the real data, while orange illustrates the synthetic data.
Figure 4.
Cumulative Sums and Distributions for continuous feature “dst_host_srv_diff_host_rate”. Blue illustrates the real data, while orange illustrates the synthetic data.

Figure 5.
Correlation matrices, indicating the associations per column of the real dataset and each of the synthesizers.
Figure 5.
Correlation matrices, indicating the associations per column of the real dataset and each of the synthesizers.


Table 1.
Types of attacks in the NSL-KDD dataset.
| Type | Labeled Attack |
|---|---|
| DoS | neptune, back, land, pod, smurf, teardrop, mailbomb, apache2, processtable, udpstorm, worm |
| Probe | ipsweep, nmap, portsweep, satan, mscan, saint |
| R2L | ftp_write, guess_passwd, imap, multihop, phf, spy, warezclient, warezmaster, sendmail, named, snmpgetattack, snmpguess, xlock, xsnoop, httptunnel |
| U2L | buffer_overflow, loadmodule, perl, rootkit, ps, sqlattack, xterm |
Table 2.
Discrete features of the NSL-KDD dataset.
| Categorical Features | Protocol_Type, Service, Flag |
|---|---|
| Binary Features | land, logged_in, root_shell, is_host_login, is_guest_login |
| Triplets Features | su_attempted |
Table 3.
The functional features of each attack category.
| Attack Category | Intrinsic | Content | Time-Based Traffic | Host-Based Traffic |
|---|---|---|---|---|
| DoS | x | x | ||
| Probe | x | x | x | |
| U2R | x | x | ||
| R2L | x | x |
Table 4.
The statistical and the detection metrics for CTGAN, CopulaGAN, and TableGAN.
| Statistical Metrics | Detection Metrics | ||
|---|---|---|---|
| CSTest | KSTest | Logistic Regression | |
| CTGAN | 0.91 | 0.84 | 0.74 |
| CopulaGAN | 0.94 | 0.83 | 0.75 |
| TableGAN | 0.89 | 0.95 | 0.76 |
Table 5.
The Machine Learning efficacy metrics for CTGAN, CopulaGAN, and TableGAN.
| Machine Learning Efficacy Metrics | |||||
|---|---|---|---|---|---|
| Decision Tree | AdaBoost | Logistic Regression Classifier | MLP Classifier | Average | |
| CTGAN | 0.97 | 0.96 | 0.84 | 0.96 | 0.93 |
| CopulaGAN | 0.97 | 0.95 | 0.92 | 0.96 | 0.95 |
| TableGAN | 0.95 | 0.94 | 0.92 | 0.97 | 0.94 |
Publisher’s Note: MDPI stays neutral with regard to jurisdictional claims in published maps and institutional affiliations. |
© 2021 by the authors. Licensee MDPI, Basel, Switzerland. This article is an open access article distributed under the terms and conditions of the Creative Commons Attribution (CC BY) license (https://creativecommons.org/licenses/by/4.0/).
Share and Cite
MDPI and ACS Style
Bourou, S.; El Saer, A.; Velivassaki, T.-H.; Voulkidis, A.; Zahariadis, T. A Review of Tabular Data Synthesis Using GANs on an IDS Dataset. Information 2021, 12, 375. https://0-doi-org.brum.beds.ac.uk/10.3390/info12090375
AMA Style
Bourou S, El Saer A, Velivassaki T-H, Voulkidis A, Zahariadis T. A Review of Tabular Data Synthesis Using GANs on an IDS Dataset. Information. 2021; 12(9):375. https://0-doi-org.brum.beds.ac.uk/10.3390/info12090375
Chicago/Turabian StyleBourou, Stavroula, Andreas El Saer, Terpsichori-Helen Velivassaki, Artemis Voulkidis, and Theodore Zahariadis. 2021. "A Review of Tabular Data Synthesis Using GANs on an IDS Dataset" Information 12, no. 9: 375. https://0-doi-org.brum.beds.ac.uk/10.3390/info12090375
Note that from the first issue of 2016, this journal uses article numbers instead of page numbers. See further details here.