
CNMF: A Community-Based Fake News Mitigation Framework


Faculty of Computers and Artificial Intelligence, Cairo University, Giza 12613, Egypt
*
Author to whom correspondence should be addressed.
Information 2021, 12(9), 376; https://0-doi-org.brum.beds.ac.uk/10.3390/info12090376
Submission received: 25 August 2021
/
Revised: 8 September 2021
/
Accepted: 10 September 2021
/
Published: 16 September 2021
(This article belongs to the Special Issue Decentralization and New Technologies for Social Media)
Abstract
:Fake news propagation in online social networks (OSN) is one of the critical societal threats nowadays directing attention to fake news mitigation and intervention techniques. One of the typical mitigation techniques focus on initiating news mitigation campaigns targeting a specific set of users when the infected set of users is known or targeting the entire network when the infected set of users is unknown. The contemporary mitigation techniques assume the campaign users’ acceptance to share a mitigation news (MN); however, in reality, user behavior is different. This paper focuses on devising a generic mitigation framework, where the social crowd can be employed to combat the influence of fake news in OSNs when the infected set of users is undefined. The framework is composed of three major phases: facts discovery, facts searching and, community recommendation. Mitigation news circulation is accomplished by recruiting a set of social crowd users (news propagators) who are likely to accept posting the mitigation news article. We propose a set of features that identify prospect OSN audiences and news propagators. Moreover, we inspect the variant properties of the news circulation process, such as incentivizing news propagators, determining the required number of news propagators, and the adaptivity of the MN circulation process. The paper pinpoints the significance of facts searching and news propagator’s behavior features introduced in the experimental results.
1. Introduction
In recent years, online social networks allowed societies to produce and consume news on a massive scale. Researchers reported that about two-thirds (68%) of adult American persons receive their news from social media [1]. Moreover, internet users tend to trust strangers as if they are trustworthy [2]. For example, users do not regularly choose their information sources; however, it is recommended by the online platform based on their previous behavior. Such recommendations are paid and may target users with malicious intent to share fake news [2]. Fake news (FN) is a critical problem facing governments, society, academia, and industry. False and fake news are defined using many terminologies that are different in definition, and purpose, such as hoaxes, satire, propaganda, click-bait, misinformation, disinformation, and rumors. However, it shares the same effect of misleading humans intentionally or unintentionally [3]. For instance, in 2017, Myanmar Facebook users created fake swine flu (H1N1) epidemic. H1N1 is influenza passed from pigs to humans that killed 575,000 humans in 2009, according to the U.S. Centers for Disease Control and Prevention (CDC). By 2017, it was considered a “mild” seasonal disease that is covered by most flu vaccines. However, the unverified shared news has turned the public against the government requesting unnecessary costly measures such as quarantines and 24-h emergency lines. Moreover, some citizens traveled for expensive flu vaccines. Extensive research efforts have taken preliminary steps towards detecting and discrediting information sources leveraging supervised or semi-supervised machine learning techniques such as TweetCred [4]. Such techniques consider the problem as a classification problem and define a set of features to estimate a post credibility score. On the other hand, the report-and-flag feature [5] offered by OSNs has been used to detect and flag FN. This mechanism allows the social network users to report-and flag pieces of news, then the network administration sends this news to a fact-checking organization and flags it as disputed (i.e., disputed news appears lower the posts list) [6]. Despite the efforts exerted by researchers and major companies such as Google, Facebook, and Twitter, fake news is not yet a controlled problem. As a consequence, this introduced the fake news mitigation (FNM) problem [7,8] to neutralize the effect of disseminated fake news. The FNM is defined as the process of spreading a mitigation news article to correct the corresponding disseminated misinformation over a set of people. Many lines of work were introduced to solve the FNM problem such as influence blocking, mitigation news recommendation, and news mitigation campaigns techniques. Influence blocking techniques [9,10,11,12] are based on finding the smallest set of nodes whose removal will reduce FN spreading at least by a given threshold. Another method of influence blocking in [13] identifies topics that are susceptible to misinformation as a proactive mitigation approach. In contract to influence blocking, mitigation news recommendation [14,15] and campaigns [1,15,16,17,18] combat fake news by making users aware of the true information.
In this paper, we present a community-based fake news mitigation framework (CNMF). CNMF is a semi-automated three-phased framework to mitigate FN effects in OSNs of an undefined infected set of users. The first phase crawl and index fact-checking and authorized news organization articles. The second phases provide a technique to search for the most relevant mitigation news (MN) of a detected fake news through searching the indexed articles. The third phase provides a recommendation technique to optimize the performance of MN propagation over the network by ranking prospect news propagators over a set of features. The features set represents social users’ behavior, and probable response regarding a MN steering the spreading process. Achieving this goal is challenging due to the following: (P1) How to find the targeted audience? (P2) How to find online users (social crowd) that are enthusiastic about sharing mitigation news?
The paper organization is as follows: Section 2 reviews some of the most influential FNM techniques. Section 3 provides the main concepts leveraged in the proposed framework. Section 4 elaborates on the framework phases. Experimental results are presented in Section 5, followed by the conclusions and future work in Section 6.
2. Related Work
Recent fake news mitigation campaign research considered solving the problem in two different contexts:
(1) Defined infected set of users: in this context, we can identify the set of users who have been exposed to the fake news via explicitly observing information diffusion over OSNs. The exposed users are likely to be convinced by the fake news. Thus, it is needed to circulate the correct news between them such as models provided in [1,12,16,19].
(2) Undefined infected set of users: in this context, we cannot recognize the set of infected users as news can diffuse virally. Moreover, this diffusion can include offline word-of-mouth or information propagation in emails and other online platforms such as WhatsApp. This situation occurs in critical news topics such as politics, epidemics, and natural disasters. It makes the infected users’ identification process complex such as models in [15,17,18].
In both contexts, the FNM problem is considered a minimum cover set problem [1] that targets finding the minimum set of users who are requested to spread mitigation news to control the widespread effect of the fake news. Comprehensive reviews of our research area [3,7,8] discuss previous solutions that leverage influence maximization models to initiate a mitigation campaign that spans the whole network. Early solution provided in [17] introduced β-Node protectors technique. The technique aims to find the smallest set of highly influential nodes whose propagation of MN helps to contain the viral spread of fake news. It employs the greedy Hill-Climbing (HC) algorithm to cover a priorly defined fraction (β) of network users introducing the Greedy-Viral-Stopper algorithm (GVS). GVS selects the campaign users by repeatedly adding the most influential node to the solution set that maximizes the marginal gain until covering β-fraction of network users (β is an accumulated value of the selected users’ influenced nodes).
Research in [18] provided the Greedy-Approximation-Algorithm based on the greedy HC algorithm as well with an underlying assumption that “a user is not influencing all its connected nodes rather than, he\she influences only a subset of them”. Under this assumption, the algorithm repeatedly samples nodes to approximate each node’s actual influence. The algorithm stops when the remaining nodes uncovered by the solution set are less than predefined nodes. Since influence maximization is an NP-hard problem work in [17,18] provided solutions with approximation guarantee, this performance guarantee slightly better than 63% of the optimal solution.
Research in [15] presented an innovative solution combating fake news by circulating corrected news articles from fact-checking websites as general reverse news spreading direction to fake news. The model indexes social network users used to spread fact-checking URLs (guardians) and recommend similar news of their interest to post on their OSN accounts. The model inspected variant properties of the problem (i.e., similarities between guardians, URLs, and topics) through a comprehensive recommending model (Matrix factorization). We observe several properties from the previous solutions:
First, research in [17,18] states an underlying assumption of users’ acceptance to post a MN, where the algorithm targets nodes with additional marginal gain (i.e., maximum node influence). However, in real life, a social network user will not accept to spread a piece of news unless it matches his/her personal beliefs. Particularly when targeting highly influential nodes (stars of the network) because they may be cautious about what they should post to their followers regardless of the monetary incentive for this crowdsourcing task.
Second, a node influence is one of many possible factors to choose a news propagator. Other factors such as the node activation time (availability), node news spreading factor, and bias to MN (being polarized to the MN content) are also crucial factors to consider. Recent research in [20] highlighted the need to analyze user behavior as a method for classifying potential news propagators. The study identifies diverse key features of the user behavior according to three dimensions: content-based, user-based, and network-based. Content-based features such as tweet length and influenced users’ sentiment with new propagator tweets or posts. Examples of user-based features are friends count, followers count, the joined public lists count, and user posts count. Network-based features such as betweenness and load centrality. The study experiment shows that considering: the user influence score (number of connected nodes), followers count, user posts count, and survivability (how often the user stays online) are significant key factors to identify news propagators.
Third, research in [15] proposed a general news spreading strategy starting with a predefined set of news propagators faces few challenges:
- -
- The cold-start problem [15] of news propagators posted less than three fact-checking URLs.
- -
- Recommending all fact-checking articles produces many recommendations, while some of FN are unnecessary to mitigate.
- -
- The author observed that only active news propagators (that is considered a small set of users) respond frequently to mitigation requests limiting MN spreading.
This paper fills the gaps presented in the literature by proposing a framework that performs targeted news mitigation efforts of a selected fake news set. Moreover, we leverage community profile indexes to target appropriate audiences instead of spanning the whole network reducing the time complexity. Finally, we rank prospect news propagators considering several factors other than a node influence. It explores prospect users who are likely to spread MN and avoid probable news mitigation requests denials.
3. Preliminaries
In this section, we review the main concepts relevant to our framework.
3.1. Entities and Facts Discovery
The entity information is a great asset for making sense of the raw and often noisy contents. The natural language processing (NLP) field provides high-quality entity extraction and disambiguation for different entity types such as persons, locations, and organizations. State-of-the-art techniques are implemented in tools such as AIDA [21]. The online service available at [22] leverages existing knowledge bases such as YAGO [23] to identify entities. On the other hand, a fact explores a particular situation under discussion. The general form of a fact is a set of entities bounded or not bounded with a main verb in one sentence. Many techniques have been developed for further analysis of unstructured text contents and facts extraction such as [24,25]. We index mitigation news as a set of entities and facts to facilitate article searching.
3.2. Tweet Popularity
There are two types of tweet/post popularities: current popularity and future popularity. A current tweet/post popularity is defined by the number of re-tweets/re-shares and replies. Moreover, several techniques estimate the future behavior of a tweet/post such as [16] that predicts the future tweet/post popularity based on re-tweeting or re-sharing behavior without the use of training data. We utilize tweet popularity to rank detected fake news that needs mitigation.
3.3. Topic Hierarchy
Topic hierarchy is the research problem of organizing topics in a hierarchal tree such as [26]. Parent and children nodes represent super-topics and sub-topics respectively. We identify a tweet/post main topic and super, sub-topics to filter out social communities discussing the topic and/or relevant topics of a FN of interest. Online tool such as [27] provides a tweet classifier to detect the main topic of a tweet (e.g., sports and politics).
3.4. Community Profiling (CP)
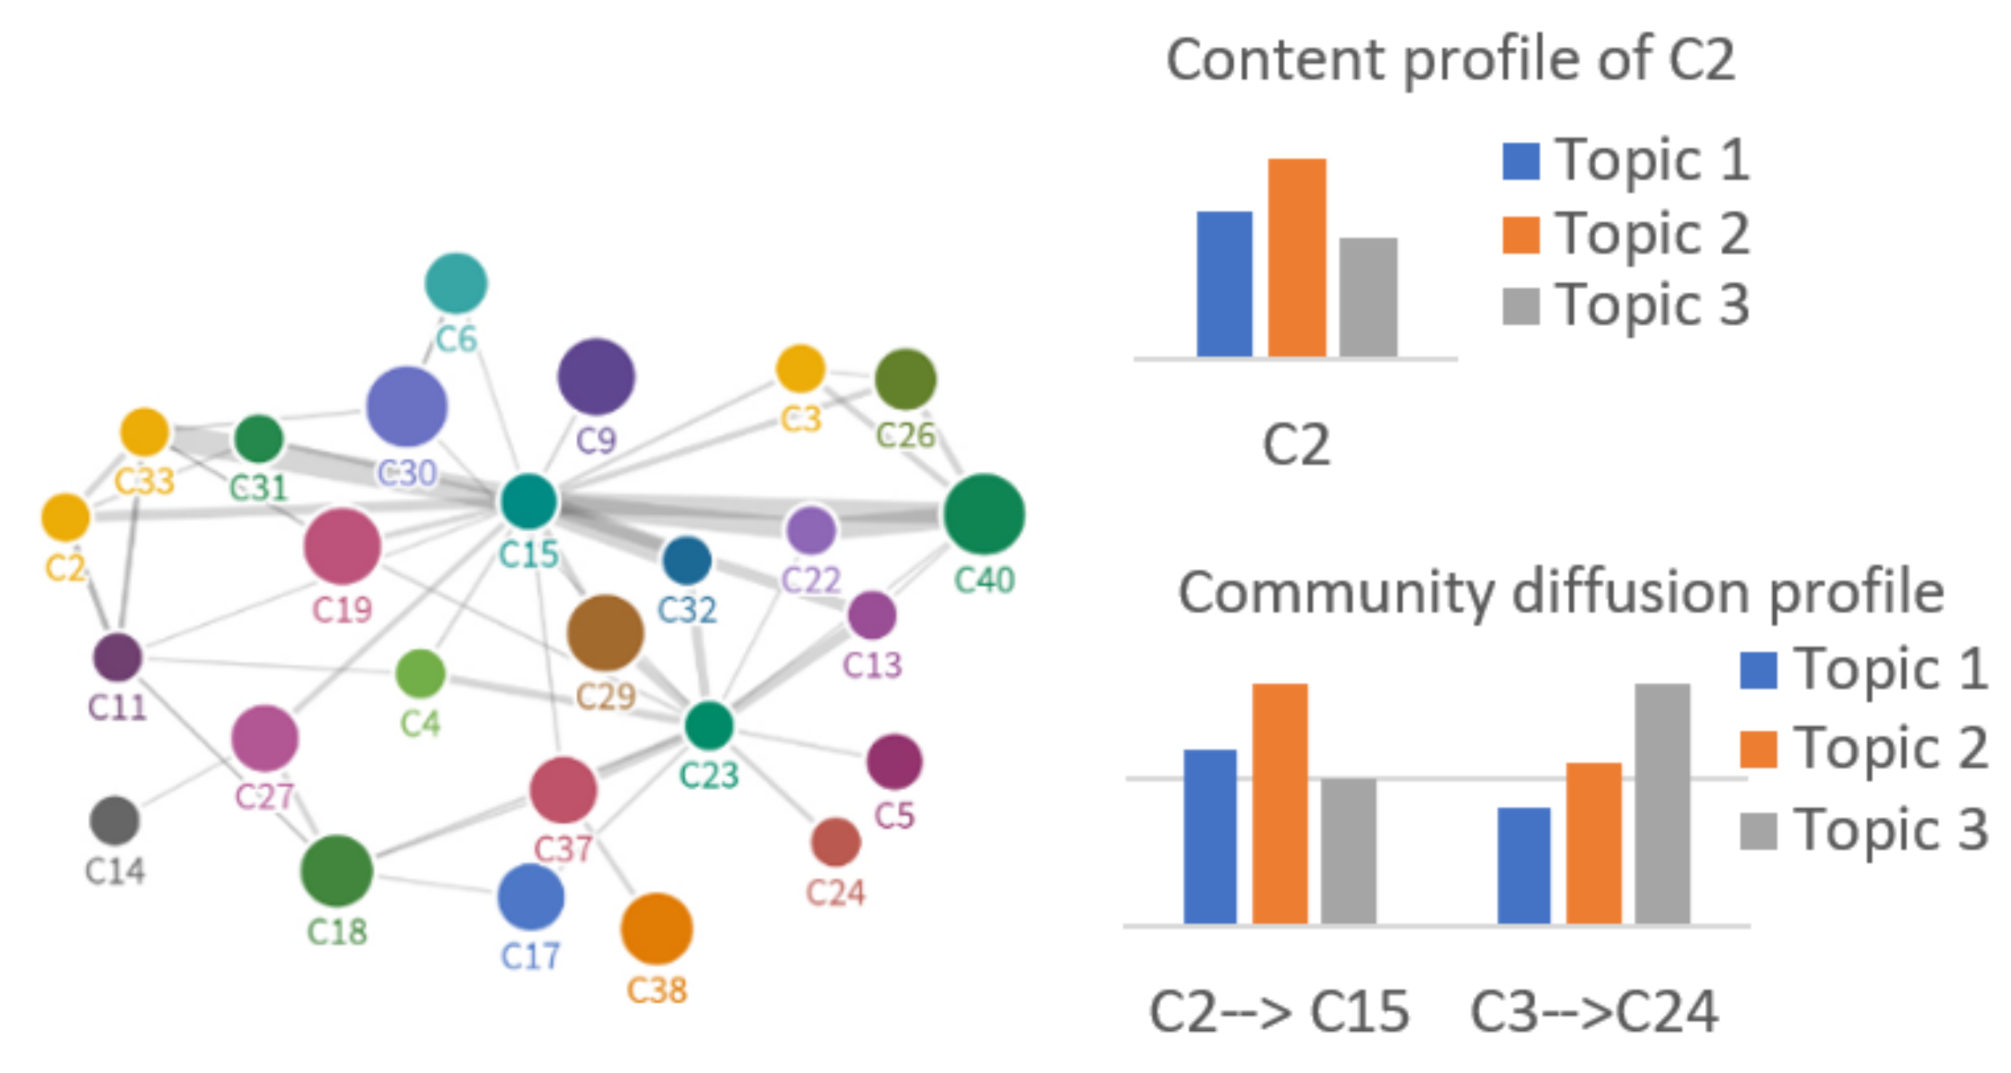
CP research defines a community as a group of densely connected users who share similar interests. A community profile defines what a community is and how it interacts with others. Many General community profiling techniques such as [28,29] cluster communities then aggregate users’ preferences to construct the community profile. General non-scalable profiling techniques should be updated on regular close time intervals to provide up-to-date community profiles. Recent work [30] identifies and indexes existing OSN communities providing content and diffusion profiles. The community index identifies community members (OSN users). The community content profile provides the set of top-m discussed topics among community users (e.g., Coronavirus and US elections). The community diffusion profile provides inter-communities diffusion probabilities. The research provides a scalable method to update the communities’ index and profiles in real-time. Figure 1 provides visualization for community content, and diffusion profiles [30]. Specifically, a community profile index (CPI) contains community index (CI), content profile (CP), and diffusion profile (DP). denotes the community set of users. CP is vector where is a set of ordered tuples with two components that are the topic and the topic popularity in community of the top-m topics. DP is vector representing a set of ordered tuples with two components are the source and target community and the diffusion probability.
Our framework leverages the output of community profiling to filter out communities discussing the fake news of interest. CPI searching greatly down-stream community searching time particularly when applied to large networks.
3.5. Sentiment Analysis and Stance Detection
Several NLP researches and commercial APIs offer sentiment analysis feature such as [31] to quantify user sentiment of a sentence. Stance detection [32] is a more comprehensive task compared to sentiment analysis in quantifying user bias to an entity. It often explores complementary information to determine the user favorability towards a given target entity even if the target entity is not explicitly mentioned in the text. Consider the following example: “Target entity: Donald Trump—Tweet: Jeb Bush is the only sane candidate in this republican lineup.” [32]. The tweet targets opinion in ‘Jeb Bush’, however, stance detection can infer that the tweeter is not favoring Donald Trump (the target entity).
In general, user stance detection provides a precise user polarity estimation over sentiment analysis. It occurs in the case of negative sentiment tweet containing multiple entities where a user is favoring an entity over another. Consider a sample tweet “#Biden Trump reveals his inability to handle the COVID-19 pandemic during train wreck disaster”. The tweet favors “Joe Biden” over “Donald Trump”. Both entities score negative polarity in sentiment analysis. However, stance detection overcomes this shortcoming by including complementary information providing an accurate polarity estimate for each mentioned entity.
4. The Community-Based News Mitigation Framework (CNMF)
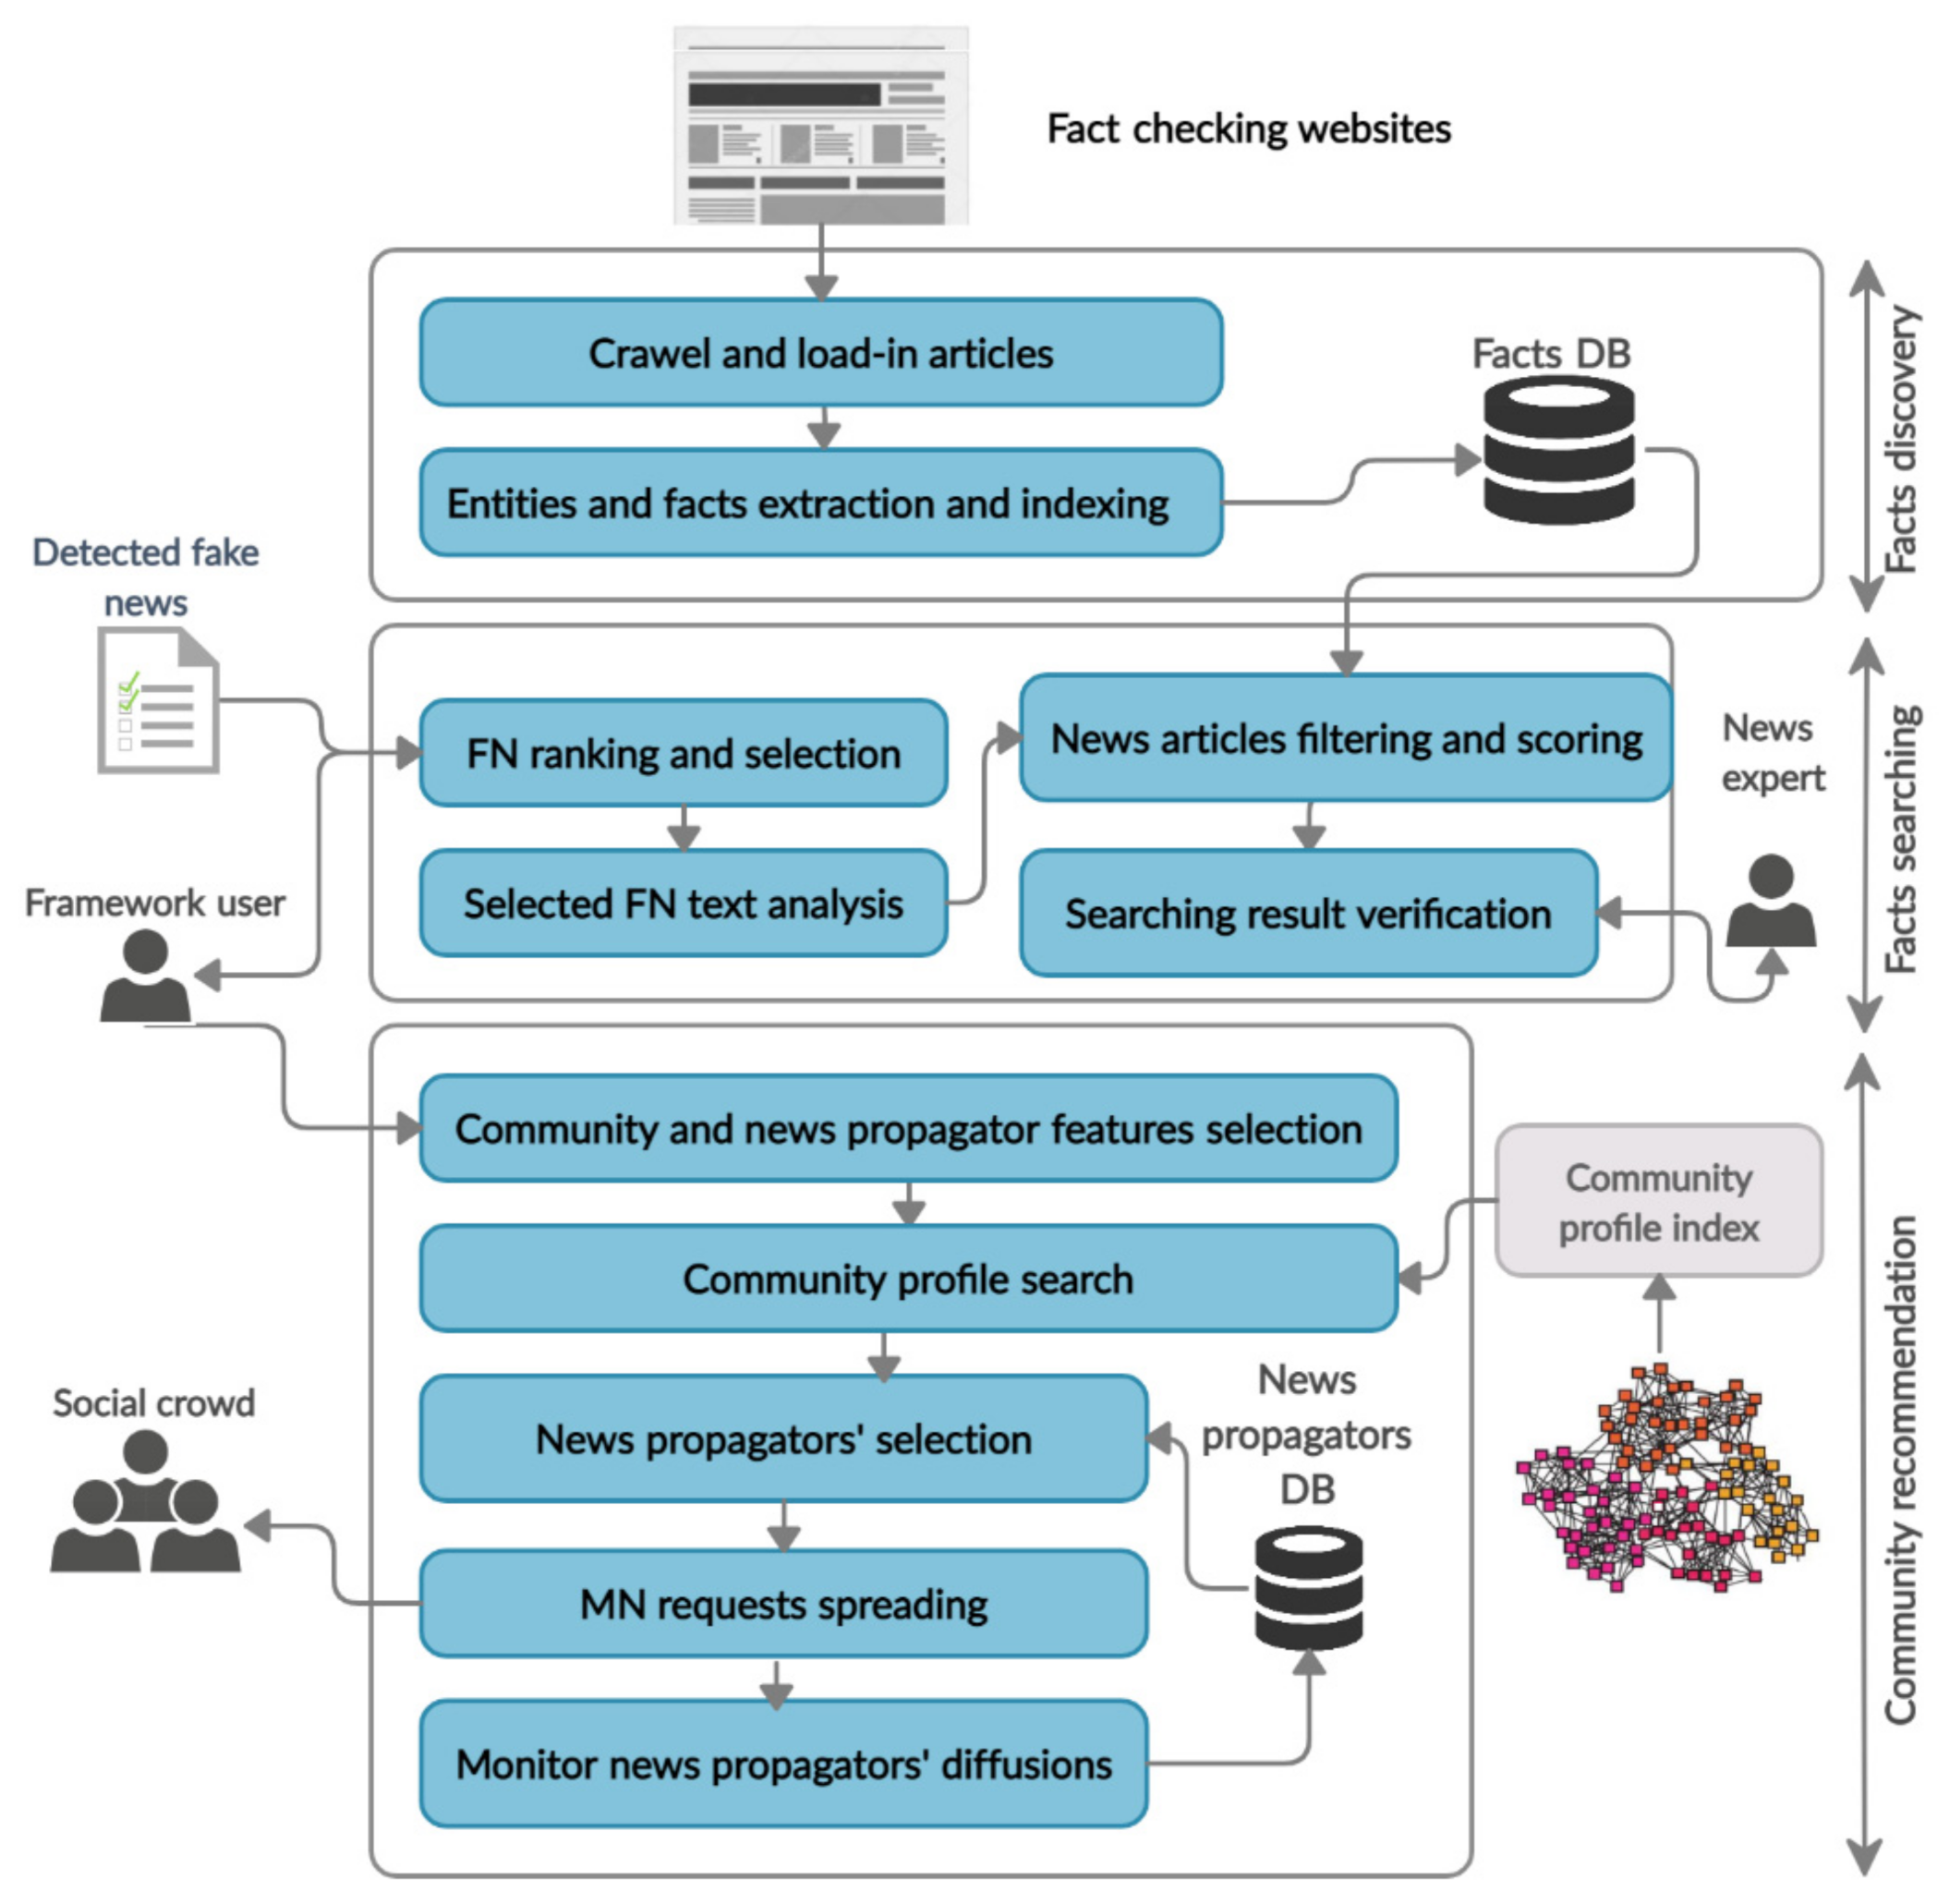
Our proposed news mitigation process starts with ranking a detected fake news list to inspect news of higher importance to mitigate based on certain features such as news popularity. The framework then searches for the most relevant mitigation news articles and finally initiates a mitigation campaign among interested communities spanning to communities of relevant interests. Figure 2 presents the community-based news mitigation framework (CNMF) key components and information flow. CNMF consists of three phases as follow:
4.1. Phase (1): Facts Discovery
The facts discovery phase crawl and import the mitigation news articles from fact-checking websites. News articles contain mentions of named entities such as people, places, or organizations. Each article is parsed into a set of entities and facts, and indexed in the facts database after filtering out stop words. We store the knowledgebase entity ID constrained by a confidence score threshold to maintain the entity distinction. We use the general form of a fact in our framework (i.e., a fact is a set of entity mentions in one sentence) and leave the enhanced fact extraction to future work. Moreover, we detect and store MN article main topic (e.g., politics and sports) for further article filtering. Main topic identification is provided in many available online tools and APIs such as [27].
4.2. Phase (2): Facts Searching
Many fake news detection algorithms can be used to detect FN posts such as [4,5]. The Facts searching phase inspects the detected FN posts and contribute to search for the most relevant mitigation article to be spread later among the social network users. This phase includes performing several steps as follows:
4.2.1. FN Ranking and Selection
The framework user represents an official and legitimate sources of the government or news organization who can benefit from using the framework and is responsible for the campaign budget. The ranked FN list provides a suggestion to guide the framework user towards candidate FN posts that need news mitigation; however, the framework user approval is a necessary step. We propose the following set of ranking features:
- -
- FN popularity: FN posts targeting valuable events present high popularity in most cases. Mitigation campaigns based on high current tweet/post popularity is a reactive method to combat FN influence while, following future tweet popularity are considered a proactive combating method.
- -
- Re-share time lag: defines the period between frequent post re-shares. Short time lag exposes viral posts. Re-share time lag interval is specified by the framework user. However, averaging sampled previous viral pieces of FN re-share time lag can provide a convenient indicator to use.
4.2.2. Selected FN Text Analysis
A selected FN text analysis is performed by Inspecting the FN topic, relevant topics (i.e., super and sub-topics), FN entities, and facts. Topics are used in mitigation articles filtering, and community recommendation that is discussed in Section 4.3. The number of super and sub-topics to include is variant, optional, and determined by the framework user.
4.2.3. News Articles Filtering and Scoring
We filter MN articles according to topics, relevant topics, and FN mentioned entities to prune irrelevant articles. We use an article relevance scoring formula to rank articles’ relevance to a FN. Given a set of MN articles , and a set of detected entities and facts that belongs to query q (i.e., FN). The article relevance score given E, F, and is produced by calculating the popular term frequency-inverse term frequency (tf-itf) technique [33]. Tf-itf is an information retrieval that weighs keyword(s) frequency within a content. We use this technique to measure the relevance of entities and facts to a certain article content due to its generality and effectiveness [33]. The score is calculated as the linear combination of entities and facts frequency multiplied by the inverse frequency of each entity , and fact ( is a regularization parameter that is set to half when entities and facts are of equal importance to be identified). Entity frequency and inverse entity frequency is defined by Equations (1) and (2) respectively:
Similarly, we can define the fact frequency , and the inverse fact frequency A MN article scoring formula applying the (tf-itf) technique [33] is defined by Equation (3):
In addition, article recency is an essential factor to be included while ranking news articles. Recent articles present higher relevance to the current FN. For example, consider FN post “An earthquake hitting San Francisco,” recent mitigation articles are expected to be of more relevance. A time-factored score is defined as follow Equation (4):
where represent the number of days () since the article have been posted online.
4.2.4. Searching Result Verification
A final essential step is to verify the results of Step 3 by crowd worker (news expert), where humans can provide deeper analytical analysis of unstructured text rather than algorithms. The news expert is responsible for selecting the most appropriate mitigation article of top-β ranked articles. Moreover, he/she investigates FN and creates a new mitigation article when CNMF cannot identify potentially relevant articles (e.g., in the case of newly emergent fake news). CNMF can leverage a set of predefined news experts in different topics or issue a fact-checking request [34].
4.3. Phase (3): Community Recommendation
CNMF proposes a community-based recommendation technique aim to select a set of people to propagate the mitigation article(s) of a certain fake news. We consider selecting the top-n mitigation news propagators under a budget limit constraint. Our technique consists of five steps: (1) Community and news propagators features selection: where the framework user identifies the set of filters to reveal communities and propagators of interest. We elaborate on community selection features in Section 4.3.1 and news propagator selection features in Section 4.3.3. (2) Community profile search. (3) News propagators’ selection. (4) MN requests spreading. (5) Monitor news propagators’ diffusions.
4.3.1. Community Selection Features
CNMF filters target communities according to an initial set of pre-defined community features that are:
- Community discussion topics: a FN topic filters communities of interest. Moreover, selecting communities discussing relevant topics widens the circle of news propagation. For example, a FN with ‘Coronavirus’ topic, is relevant to communities discussing ‘viruses’ (i.e., super-topic of ‘Coronavirus’).
- Common community geographic location: this location can be either extracted from the FN post or specified by the framework user. For example, the Coronavirus is a worldwide discussion, meanwhile, the community geographic location helps to mitigate news in specific locations.
- Community topic popularity: quantifies how popular an under discussion topic in a community. Community size: number of community members. Community diffusions: diffusions to other communities of the same or relevant interests.
Meanwhile, optional features are used as well for community filtering. Optional features represent a set of pre-defined community properties that the framework user optionally selects such as certain average age interval, profession, gender of the community users. Feature selection and ranking order are determined by the framework user.
4.3.2. Community Profile Search
Algorithm 1 specifies a top-k community selection method performing the community profile search step.
| Algorithm 1. Top-k community selection method. |
| Input: CPI: community profile index, E: set of entities for a given FN, t: time span, T: set of FN main topic, super, and sub-topics, L: geographic location(s), k: number of communities to select. |
| Output: top-k communities with highest topic popularity, geographic location commonality, community size, and community diffusions. |
| 1. Search and filter CPI to find communities mentioning E, and T. |
| 2. Sample community users’ posts over time t, users’ location. |
| 3. |
| 4. Select community size (CS) // number of community members. |
| 5. // topic popularity. |
| 6. then |
| 7. // commonality of geographic location. |
| 8. |
| //Community diffusions, is the diffusion prob. from community to community (relevant community), where |
| 9. End for |
| 10. Rank according to . |
| 11. Select Top-k community. |
Algorithm 1 starts by selecting communities discussing the FN topic and relevant topics in Line 1 using CPI. Line (2) samples the filtered community users’ posts over time interval . Lines 3–9 compute the four ranking features proposed by the framework for each selected community. Community diffusion score in Line 8 is computed using diffusion probability that is indexed in the community profile CPI [30]. A diffusion probability represents the ratio of certain topic diffusions to the total post/tweet diffusions from one community to another. The diffusion probability is multiplied by the ratio of community size to distinguish diffusions to bigger sized communities. Lines 10–11 rank the community list and select the top-k communities.
4.3.3. News Propagator Selection Features
Provided the ranked top-k communities of interest we need to allocate potential news propagators. We propose a set of user behavior features to find potential top-n news propagators and prune certain users who are guaranteed not to have the necessary support (i.e., certain thresholds). The order of pruning features is determined by the framework user. Meanwhile, the ANOVA test [35] performed in the experiments section provides guidance to features pruning order. Users’ pruning reduces the algorithm time complexity. We consider the following features:
(1) Content-based features.
(a) User-bias to a mitigation news.
The psychological theories ‘selective exposure’ and ‘confirmation bias’ state that users prefer to consume information that is consistent with their point-of-views [3]. A user accepts to circulate a piece of news mostly if it supports his/her point of view. We can detect a user bias towards a set of entities by measuring the user sentiment or stance against it. Sampling users’ posts over a time period (i.e., last few days or weeks) can identify such bias. We propose two bias measuring metrics: average user polarity and the general user bias. Average user polarity towards a set of entities quantifies a user state of agreement or opposition against the entities. It is defined by a user polarity summation of a set of posts over the total posts of user u mentioning set of entities. General user bias considers both average user polarity and user propagation-rate regarding a set of entities. Users with negative score are pruned as they are considered against the entities we seek. The formula scoring a user u bias towards a set of entities E over a defined time period is defined by Equation (5):
The formula is reduced to the term in Equation (6):
Similarly, a general user bias towards a set of entities over time period using stance score defined by Equation (7):
The user-bias feature is effective with posts mentioning persons, products, and organizations entity types. However, it is not an accurate indicator with posts that mention event entity types. For example, battle, war, catastrophe, crime, and epidemic event entity types often hold negative emotions; thus, it is inaccurate to prune negatively biased users.
(2) News propagators-based features.
(a) User diffusion-rate:
A user share rate is different over topics. Diffusion-rate of a user for a set of entities E over a defined time period is defined by Equation (8):
Weighted diffusion-rate can be used as a method to discriminate equally diffusion-rate users. It is defined in Equation (9):
(b) User popularity-rate:
A user popularity rate represents the number of positive impacts of a user’s posts over a defined time period. Positive impacts include positive likes (e.g., like, love and care emojis in Facebook), neighbors’ re-shares, and replies over a post or tweet with positive sentiment. User popularity helps to prune out the less favored community members. Moreover, high popularity rates (i.e., reputation) promotes the trust-related behavior such as information consumption and trust [36]. The popularity rate of user with social impact set over time period is defined by Equation (10):
The social impact set is the set of all social reactions of a post (e.g., like, love, care, angry emojis, positive, negative and neutral sentiment replies).
(c) Targeted user-neighbors:
Positive and negative opinions co-exist in communities over different topics. A user is positively supporting a topic when the number of his\her positive posts exceeds the number of negative posts. Accordingly, a community is positively supporting a topic if the positive opinion strength (i.e., number of positive users) exceeds the negative opinion strength . For a MN to prevail in a community, the number of news propagators is inversely proportional to the positive opinion strength occupying a community [37]. For example, if a certain community supporting “Donald Trump” (i.e., ), few news propagators are needed to spread a MN regarding him. As most of the community members are considered possible news propagators. Otherwise, many news propagators are needed. The CNMF framework user selection method ranks a community user as defined in Equation (11):
where we target users with the maximum number of neighbors of a positively supporting community. On the other hand, for a negatively supporting community, we need to target users who are positively biased and have the maximum number of negative neighbors. This will help to reach the maximum number of users against the topic.
Another precise targeted user-neighbors measure is given by considering the neighbors’ susceptibility to influence. Susceptibility to influence [38] is used to measure how easily a user can be influenced. A targeted user-neighbors score exploiting is defined in Equation (12):
where is the set of neighbor nodes of a user , and is the negatively biased set of neighbors. The number of user neighbors can be used as an auxiliary method to discriminate equally scored users. As a user with the least number of neighbors will hold higher susceptibility to influence probabilities.
(d) User community-memberships:
Community membership plays an important role in selecting the top community contributors and excluding community free riders. Community profiling techniques such as [30] identifies a user community membership regarding a set of entities E over a defined time period as Equation (13):
(e) User community-participations relevance score:
The probability of news spreading increases by increasing the number of a user topic-relevant community participations. For example, consider a MN concerning ‘Coronavirus’, and set of communities discussing topics of ‘Coronavirus’, ‘viruses’, and ‘music’ respectively. A user who is a member in is probably a broader news propagator than a user who is a member in . This stems from the fact that relevant communities are prospect news spreaders as well. Consider a mitigation news of main topic (i.e., entity of the maximum mention frequency in FN), and a user , who is a member in a set of communities . Each discusses top-m set of topics , where topics are arranged in a topic hierarchy tree such as [26]. A community discussed topics’ distance from is defined in Equation (14):
where is the topic relevance score that can be quantified as the shortest path nodes’ count from a topic to another in . The user community-participations relevance score is defined in Equation (15):
Users of smaller values of are of more relevance to the MN topic.
(3) News propagator- neighbors based features:
A news propagator neighbors’ activity is important to consider while selecting news propagators. User selection features tend to select active news re-sharer; however, if the neighbors are not news propagators this will cause the post to freeze. We consider inspecting the first-level of neighbors’ activity for generality; however, the number of neighborhood levels can be variable. We consider the following two neighbors related features:
(a) User local-centrality () [39]:
Authors in [39] Defines a user local centrality as neighbors’ re-share frequency over defined period of time. User centrality is a logical factor to consider when selecting potential news propagators, where it defines how influential or significant a node is in a network. Between-ness and load centrality proposed in [20] are computationally complex measures in large OSNs where node relationships are changing continuously. We instead propose to leverage user local centrality [39] exploring the nearest neighbors’ centrality. It presents lower computational complexity than global centrality metrics and presents a high correlation to global centrality [39]. We define of user with neighbors set and posts over a time period as in Equation (16):
(b) Local user re-share frequency ():
Defines the re-share frequency of user neighbors over a defined period of time with respect to the number of neighbors and user posts. discriminates users with higher influence on neighbors. For a user who has neighbors set , and set of posts over a time period , a local user re-share frequency is defined by Equation (17):
where are the neighbors and posts count respectively.
4.3.4. News Propagators Selection
The news propagators’ selection step seeks enthusiastic social crowd to post a mitigation news regarding a topic. CNMF maintains news propagators database of previous news campaigns for further utilization in future campaigns. This to maximize the MN diffusion and reduce the time complexity. The database maintains news propagators’ scores, diffusions (i.e., number of users exposed to MN), and MN entities; details are provided in Section 4.3.6. The framework user selects a set from the previous variety of user selection features to profile, score, and prune users. We utilize users’ scores to select top-n community news propagators. The detailed greedy budget-based community user selection algorithm is provided in Algorithm 2.
| Algorithm 2. Greedy budget-based community user selection. |
| Input: Top-k community list, B: mitigation campaign budget, I: a user incentive to distribute a piece of news, t: time span, T: set of FN main topic, super, and sub topics, : previous campaigns news propagators matrix with components () as is the user Id, is the profiled user score, and is the user diffusion in the previous campaign, : diffusion threshold. |
| Output: A set of users users. |
| 1: , // is the influenced users set (neighbors) |
| 2: . |
| 3: matrix of users with components (,,) // : user Id, : user score, and : Influenced users set |
| 4: for from do |
| 5: Set // initialize community users’ matrix |
| 6: { users >= } |
| 7: || = n continue; |
| 8: Sample users’ posts over time t excluding users < , |
| and users with denied requests. |
| 9: Score, and prune users according to selected behavior features. |
| 10: Fill with users, scores, and influenced users. |
| 11: j = 0 |
| 12: while j < n do |
| 13: // |
| 14: |
| 15: |
| 16: |
| 17: Update by deducting influenced users’ instances in |
| 18: j = j + 1 |
| 19: else Delete from |
| 20: end while |
| 21: end for |
Algorithm 2 starts computing each community budget, and how many users to be selected (Lines 1–2) considering equally distributed community budget, and user incentive. Lines 3–6 selects news propagators from previous campaign with diffusions greater than a certain threshold in the prospected news propagators set . Line (7) exit the loop iteration if the number of selected news propagators equals n. Line (8) sample users’ posts for each selected community over a time period . We exclude community users of previous MN campaigns regarding this topic of poor diffusions and users that have denied MN spreading requests. Lines 9–12 score, and prune users according to the selected user behavior features. Line 13 selects the next prospect news propagator who presents the maximum score, and number of influenced users (neighbors). Lines 14–19: If the selected user does not exist in the solution set, then we add him/her. Otherwise, we delete the user from users set where a user can exist in multiple communities. Adding a user to the solution set implies adding the influenced users’ to and remove their instances in maximizing the number of influenced users. Profiling and scoring social crowd involve a time complexity that is difficult to perform in MN campaigns involving deadlines. Thus, we maintain news propagators’ scores and post-diffusions (i.e., the number of the post re-shares). This method presents a practical approach to rapidly start an initial mitigation campaign of previously employed users regarding the same topic we seek (Line 7 of Algorithm 2).
4.3.5. Mitigation News Requests Spreading
We concern that the process automation of running campaigns may bypass the intended goal if not carefully inspected. Thus, we emphasize the need for human review and analysis for the selected set of news’ propagators and campaigns running. It ensures the budget allocation appropriateness and target achievement. MN requests spreading process involves important factors such as adaptivity, incentivization, and mitigation campaign size. The community user selection method can be extended to incorporate these factors. Each factor variability addresses the scalability of our proposed community user selection method. The application of factors variability is as follow:
(a) Adaptivity
Algorithm 2 provides a user selection method in a “non-adaptive” manner. In practice, however, employing an adaptive strategy to disseminate mitigation requests is likely to be more effective. For example, we can send mitigation requests to users in from Algorithm 2 and then wait for a while to find influenced users (i.e., exposed to the news). Moreover, we specify users that have declined the mitigation request. Afterward, we can employ the algorithm again starting with the uninfluenced users set and excluding users with denied requests. Adaptive work iterations stop upon reaching the budget limit and\or employing time limitation.
(b) Incentivization
A general approach to incentivize users (social workers) is by rewarding the same amount of money to all users as in Algorithm 2. A second approach is to use a weighted incentive that is proportional to user popularity score or diffusion-rate. A user incentive estimation function is defined by Equation (18):
where is the community campaign budget, is the user popularity or diffusion-rate score, and is the total scores for selected campaign users. Similarly, can be replaced by the score for any set of selected user features in order to assign higher rewards to better-suited workers. A third approach is to split the budget between a fixed incentive part, and a rewarding part. Any user who accepts the task request and posts the MN is paid a fixed incentive. Meanwhile, we observe the resulting diffusions for a period of time, then reward users with an extra fee proportional to that diffusion. The reward estimation function after a time period of the campaign start is defined as followed Equation (19):
where is the community rewarding budget, is the number of post diffusion stemming from user post.
(c) The mitigating campaign size (fixed mitigation campaign size versus -fraction community mitigation campaigns)
Algorithm 2 leverages an equally distributed mitigation campaign budget for each community to determine the number of campaign news propagators (i.e., fixed campaign size). However, an advanced approach is presented in [37]. Authors study opinion dynamics to control rumors. Authors present the users opinion changing process as differential equations that change with time when they see more positive opinions (MN). The paper leveraged stability theory of ordinary differential equations to study and estimate how many news propagators should post a positive opinion (MN) to dispel a FN. Authors conclude that when the positive opinion strength exceeds the negative opinion strength regarding a topic, mitigation news prevails without the need to set a campaign. Only a fixed number of news recommendations will spread the word. The number of recommendations is advised to be proportional to the community size. On the other hand, if exceeds the fraction of community news propagators should be less than to counterbalance negative opinions. Work in [37] presents a method to assess the number of needed news propagators. However, there is a challenge to accurately assess positive and negative opinion strength. Meanwhile, NLP methods such as sentiment analysis and stance detection can be leveraged to estimate both opinion strengths.
4.3.6. Monitor News Propagators’ Diffusions
CNMF monitors the employed news propagators’ diffusions to study the impact on community members regarding a topic and avoid poor diffusions in future campaigns. This is achieved through monitoring the user’s MN post re-shares within a time limit. Most OSN developers’ API allows this feature such as Twitter API [40]. Twitter API provides full details regarding a certain tweet such as re-tweeter list, mentions list, and the favorite count (the number of post likes). It helps to prune ineffective news propagators in future campaigns. Moreover, we can study the correlation between selected user features and the diffusion rate and favorite counts. CNMF archives MN campaigns details in the news propagators database. The database maintains a log file for the following properties of news propagators (OSN user ID as the unique identifier, selected features, selected features score, actual diffusion rate within time interval, the time interval, and MN topics). News propagators with denied MN requests are flagged as well to avoid sending them future requests regarding the same topics they refused.
5. Experiments and Discussion
The goal of our experiments is to understand the effectiveness of two parts of the proposed mitigation framework (i.e., mitigation articles scoring regarding FN and news propagators’ selection features). We achieve it by leveraging two real-world datasets.
5.1. Mitigation Articles’ Scoring Experiment
The first experiment seeks to provide an answer to the following inquiries: (1) Is there a statistically significant relationship between the article scoring formula discussed in Section 4.2 and an article relativeness to a certain claim? (2) Evaluating the correlation coefficient of the two variables to determine the strength of the relationship or the effect size.
Dataset. We leverage the MultiFc real-world data set presented in [41]. MultiFc is considered a large publicly claims dataset available at [42]. It is collected from 26 English fact-checking websites paired with rich metadata. It contains 27,940 claims, and 13,334 claim correcting articles (i.e., mitigation articles).
Experiment setup. We analyzed claims and articles to extract occurring entities and facts utilizing TextRazor python API [43]. TextRazor disambiguates mentions leveraging DBPedia, Freebase, and Wikipedia. We have considered entity types (person, organization, species, work, and place) un-constraining extracted entities’ confidence score. We extracted facts in two forms. The first considers a fact as a set of entities in a sentence, while the second considers a fact as a set of entities accompanied with a verb or set of verbs in a sentence. Verb entailments were extracted, while auxiliary and idiomatic construction verbs were disregarded. Table 1 provides an example of a claim instance analysis. For the claim in Table 1, we consider the entailment of ‘announced’ verb which is ‘announce’, and disregard ‘are’, and ‘going’ verbs as they are not considered discriminating verbs (i.e., does not add meaning to the fact). Two facts match when the claim fact entity set is subset of another fact entity set. Likewise, facts in the second form. An article is relevant to a claim if any of the claim entity set have been mentioned in that article. Breaking down the MultiFC dataset claims and articles into a set of entities and facts, allows to compute relevant articles score to claims.
An inverted index storing a mapping from entities to mentioning articles reduces the time of searching relevant articles. We computed articles’ relevance score and considered the top 10 relevant articles to each claim in the experiment evaluation. Afterward, 1556 relevant articles have been annotated manually by a rate from 1–5 (1 represents ‘irrelevant to the claim’ and 5 represents ‘completely relevant to the claim’). MultiFC provides the ground truth of claim main relevant articles.
Results. We leveraged Pearson’s r and Spearman’s rho [44] bivariate correlation coefficients. Both coefficients explore the statistical relationship significance between the article scoring formula and the actual article relevance to a claim and determine the effect size. Table 2 provides summary statistics of the experimented dataset part, in which we explored 756 claims and 1657 articles. Pearson’s r coefficient result indicates a high medium degree of positive linear correlation, while spearman’s rho indicates a strong monotonic correlation between the two measured factors. Facts matching in the second fact form (i.e., a fact is a set of entities accompanied with a set of verbs) has proven to be an ineffective method. The first form (i.e., a fact is a set of entities) has proven to be an auxiliary method to search matching articles. This stems from the fact that the language is rich, and an act can be expressed by many verbs. Finally, the results in Table 2 validate the main gain of the article relevance scoring formula.
5.2. News Propagators’ Selection Features Experiment
The second experiment seeks to measure news propagators’ selection features significance leveraging F-value and p-value measures of the one-way ANOVA test (analysis of variance test) followed by Tukey’s HSD (honestly significant difference) post hoc test [45]. Features discussed in Section 4.3.3.
ANOVA test is a statistical test used to compare means of more than two groups to check if there is a difference between the compared feature scores of each group. Mean differences can be inferred by analyzing variances. One-way ANOVA compares only one feature of the group’s members. We use one-way ANOVA test of α = 0.05 to test the statistical significance of news propagators’ selection features. α = 0.05 means that the test results are valid with probability 95%. ANOVA test states a null hypothesis (i.e., the tested groups behave the same regarding the tested feature) and outputs F-value, F-critical and p-value. p-value indicates how confident we are there is a difference between the tested groups. is rejected when the p-value is less than α. Otherwise the test is insignificant. Moreover, F-value supports rejecting when it is greater than F-critical. Significant test results are followed by Tukey test that performs pairwise group comparison to find means that are significantly different from each other.
Dataset. Our dataset contains tweets, retweets, and mentions of Twitter users extracted from news diffusion network provided by Hoaxy system [46]. The dataset corpus contains 1057 Twitter users, 98,019 tweets and retweets, and 178,144 mentions of the participating users.
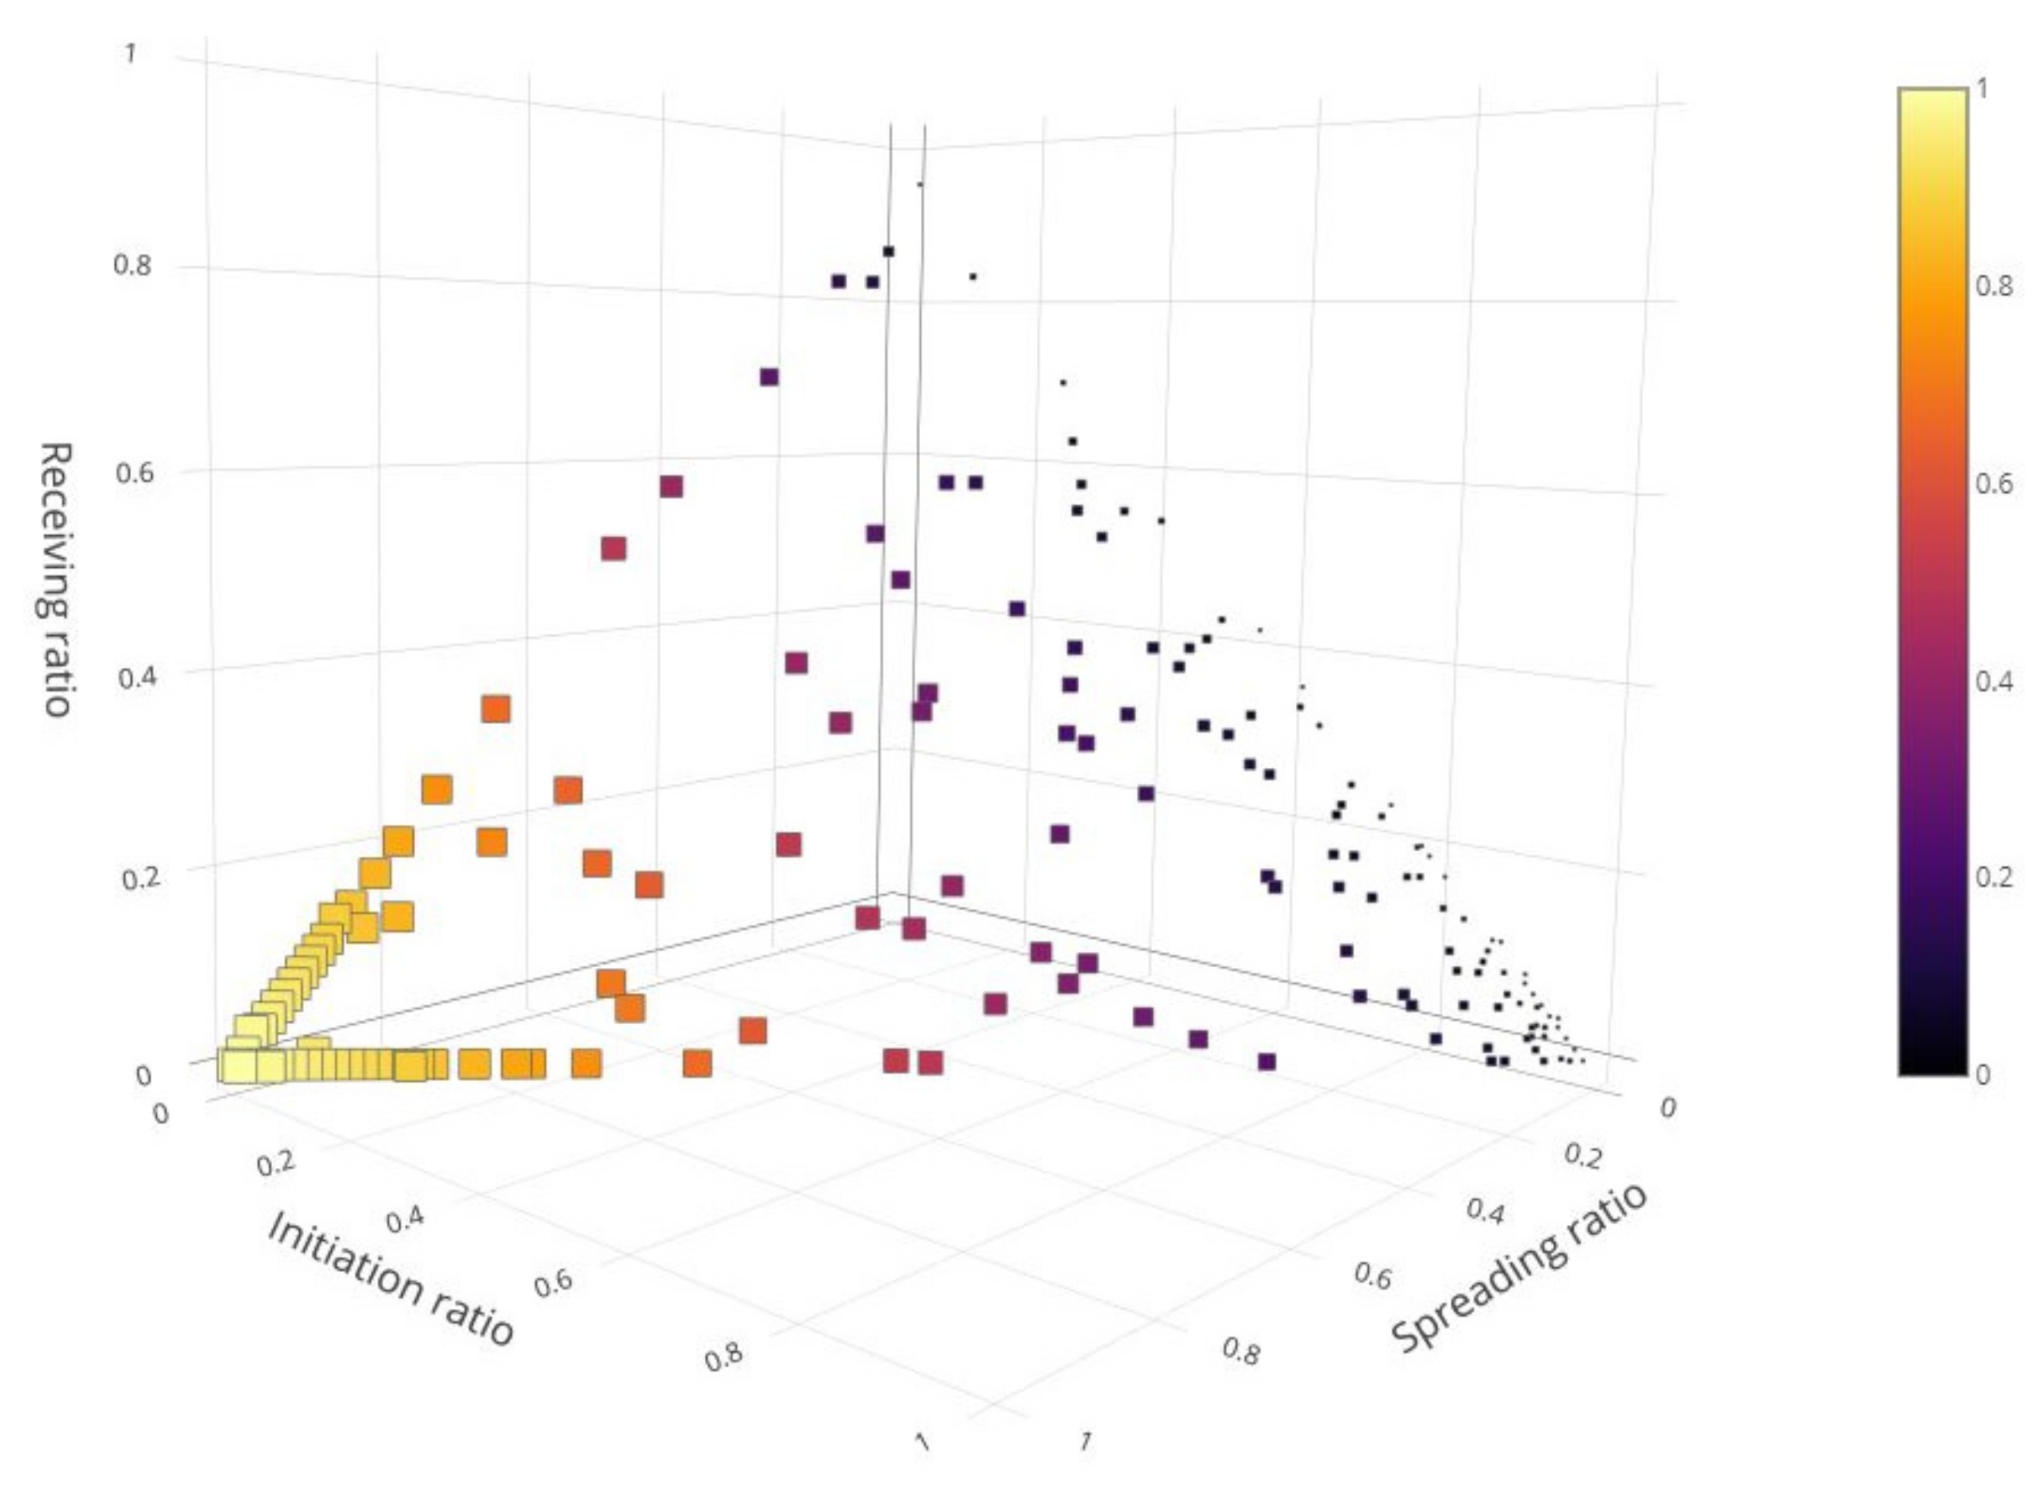
Experiment setup. Hoaxy online system [47] is a tool that extracts and visualizes the spread (diffusion) of tweets and article links found on Twitter matching an input search query. We leverage the diffusion network extracted by Hoaxy with a search query ‘Joe Biden’ during August 2020. The diffusion network corpus contains 1057 Twitter users participating in retweet cascades about ‘Joe Biden’. We crawled tweets, retweets, and mentions of each user using twitter API for python during August 2020. We used python NLP API to measure the sentiment of tweets (i.e., polarity score). Moreover, we considered scrapping shared URL text of short tweets containing links to pieces of news to measure the associated tweet sentiment. Our experiment is based on categorizing the selected users based on their reactions, and behavior hence analyzing each category behavior considering selection features similar to experiment provided in [20]. We cluster the selected users into three categories (news initiators, receivers, and propagators (spreaders)). News initiators tend to post tweets, and news receivers tend to view and read the news more often, while news propagators tend to retweet others’ tweets. Tweets provide the user initiation metric, retweets provide the user spreading metric, while user mentions by others provide the receiving metric. We leverage the three metrics to cluster users using the K-means algorithm.
Figure 3 presents 3-D scatter visualization of the three behavior dimensions of user reactions (initiation, receiving, and spreading). The point’s size and color grading are plotted with respect to users’ news spreading factor. Lighter and bigger points represent users who spread more news. K-means significance performance measures are provided in Table 3 reflecting clusters’ cohesion. Another general user type classification method is to classify the user types according to the highest user reaction ratio.
Results. We consider one user feature (factor) at a time and compare the three clustered groups. Sampled data are tested for normality before performing the ANOVA test to satisfy the ANOVA pre-requisite constraints. Table 4 shows the test results providing F-Value, F-critical, and p-Value. Moreover, we provide the mean value of the tested features in Table 4 for the three types of user categories; we abbreviate I, R, and P for initiators, receivers, and news propagators respectively. We tested seven features according to the available data, and leave the rest of features testing to future work. Features (F1–F5) present significant tests (i.e., news receivers’ mean scores are different from news initiators and propagators). News initiators and propagators showed no difference in scores’ mean (i.e., they act the same behavior.
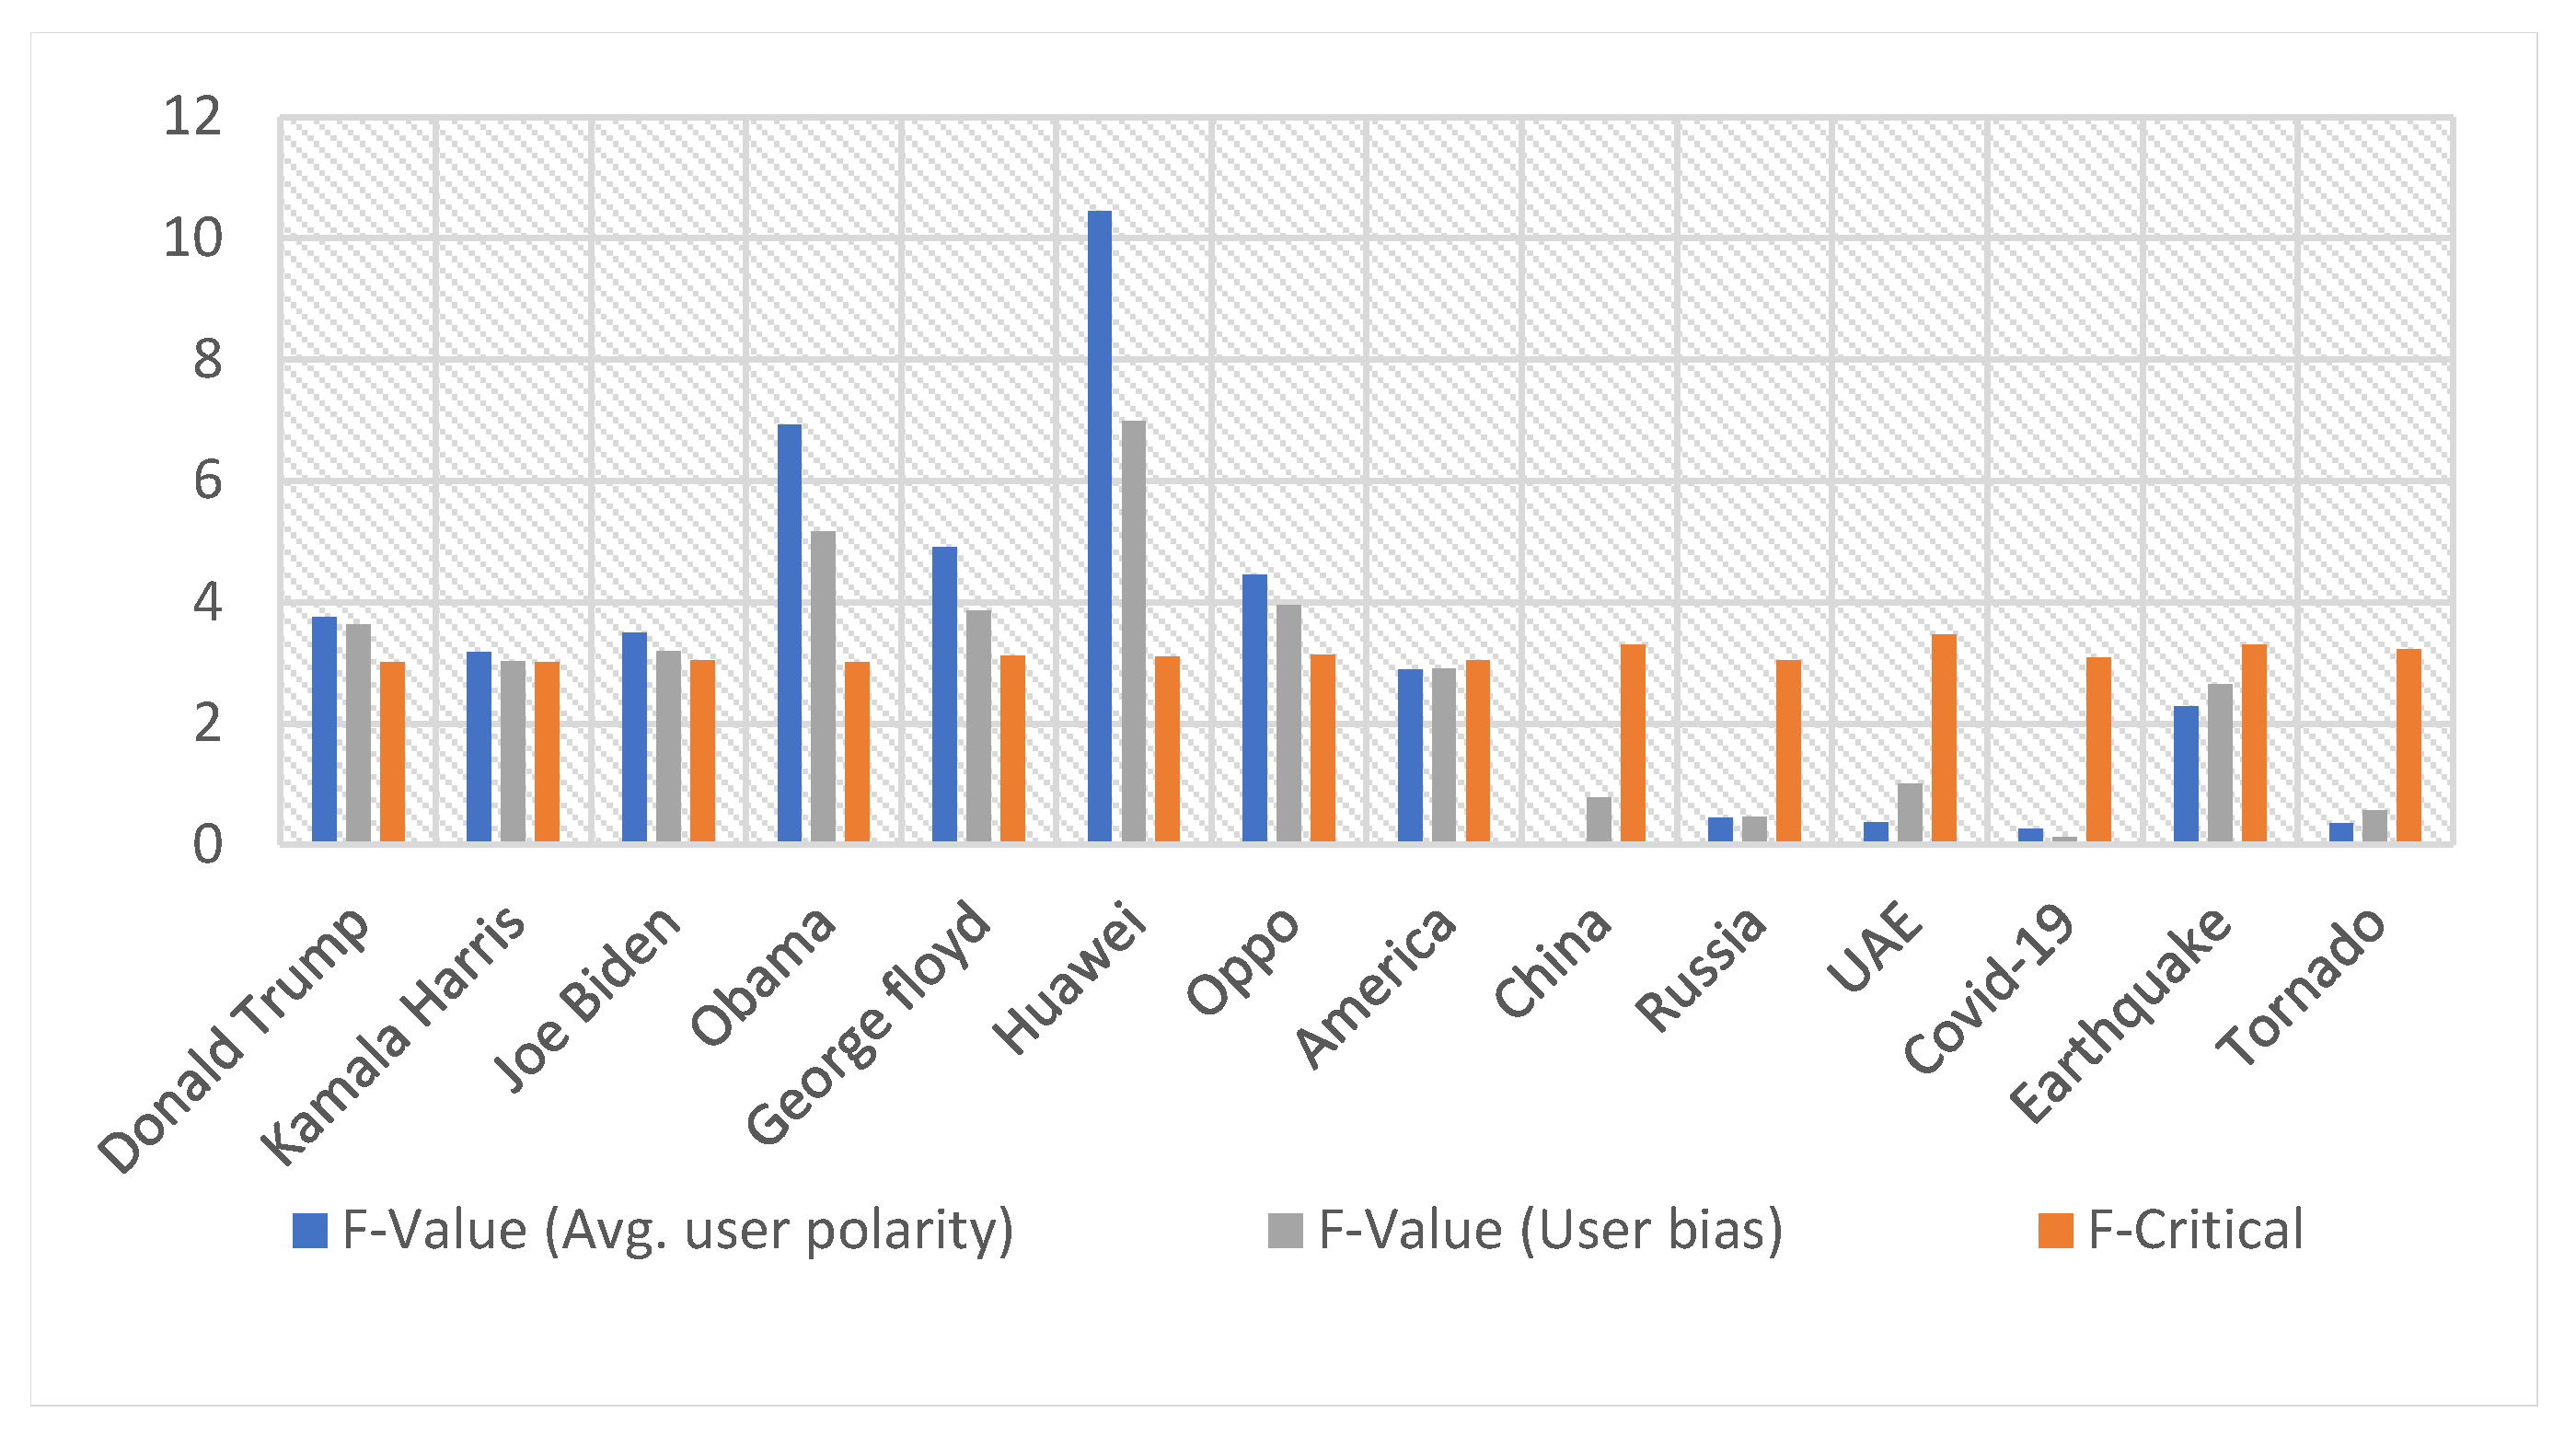
Figure 4 presents details of ANOVA test results of both average user polarity and user-bias features illustrated in Section 4.3.3. We test both features against several entity types that are popular in the collected dataset tweets. We have tested persons such as (‘Joe Biden’, ‘Kamala Harris’, ‘Obama’, ‘Donald Trump’, and ‘George Floyd), products such as (‘Huawei’, and ‘Oppo’), countries such as (‘America’, ‘China’, ‘Russia’, and ‘UAE’), diseases such as (‘COVID-19′), and natural disasters such as (‘Earthquake’, and ‘Tornado’). According to the selected sample of users, news propagators and initiators mostly exhibits strong positive and negative bias towards disseminated posts. Meanwhile, news receivers exhibit both weak and neutral bias towards the disseminated news. Figure 4 shows that both user bias features are significant for ‘persons’, and ‘products’ entity types. However, it is not significant to use when considering ‘countries’, ‘diseases (epidemics)’, and ‘natural disasters’.
6. Conclusions and Future Work
Fake news mitigation is an integral part of combating fake news in OSNs. In this paper, we presented a community-based fake news mitigation framework (CNMF) to mitigate FN effects in OSNs of an undefined infected set of users. The three-phased framework starts with ranking the detected FN list roaming the social network, search existing MN articles to find the most relevant MN using the popular tf-itf formula. We proposed a set of community features to find the appropriate audiences to disseminate the MN between them. Moreover, we proposed a set of user behavior features that helps to identify enthusiastic users to post the MN of interest.
Using the mentioned FN entities and facts in conjunction with the tf-itf formula presented high-correlation between searched MN articles and the selected FN. Several proposed user selection features have proven to be significant to identify news propagators. However, the framework would benefit from performing a significance test of the untested user behavior features presented in our paper such as the targeted user-neighbors and community-participations. Moreover, providing an approach to reduce the time complexity of profiling and scoring community users. Finally, studying the correlation between the selected news propagator’s features and the observed MN diffusion and favorite count monitored after the campaign start using OSN APIs.
Another future perspective is the framework utilization in digital marketing campaigns. Digital marking is a marketing approach that builds businesses by observing online users’ activities [48]. The framework will seek to find marketing influencers to post advertisements. Moreover, a set of free products can be distrusted to marketing influencers for posting products’ reviews. Extending the framework to digital marketing needs further inspection of marketing influencers’ features. We also need to study online consumers’ reviews and testimonials for product enhancements. Following the paper approach will personalize advertisements to interested users rather than targeting a large set of audiences.
Author Contributions
Conceptualization, S.G., N.N. and M.E.E.-S.; formal analysis, S.G. and N.N.; funding acquisition, M.E.E.-S.; investigation, S.G.; methodology, S.G., N.N. and M.E.E.-S.; project administration, N.N. and M.E.E.-S.; resources, S.G.; supervision, N.N. and M.E.E.-S.; validation, S.G.; visualization, S.G.; writing—original draft, S.G.; writing—review and editing, S.G., N.N. and M.E.E.-S. All authors have read and agreed to the published version of the manuscript.
Funding
This research received no external funding.
Institutional Review Board Statement
Not applicable.
Informed Consent Statement
Not applicable.
Data Availability Statement
Data is contained within the article.
Conflicts of Interest
The authors declare no conflict of interest.
References
- Farajtabar, M.; Yang, J.; Ye, X.; Xu, H.; Trivedi, R.; Khalil, E.; Li, S.; Song, L.; Zha, H. Fake News Mitigation via Point Process Based Intervention. In Proceedings of the International Conference on Machine Learning, Sydney, Austria, 17 July 2017; pp. 1097–1106. [Google Scholar]
- Duradoni, M.; Collodi, S.; Perfumi, S.C.; Guazzini, A. Reviewing Stranger on the Internet: The Role of Identifiability through “Reputation” in Online Decision Making. Future Internet 2021, 13, 110. [Google Scholar] [CrossRef]
- Pierri, F.; Ceri, S. False News On Social Media: A Data-Driven Survey. SIGMOD Record. 2019, 48, 18–27. [Google Scholar] [CrossRef]
- Gupta, A.; Kumaraguru, P.; Castillo, C.; Meier, P. Tweetcred: Real-time credibility assessment of content on twitter. In Proceedings of the International Conference on Social Informatics, Barcelona, Spain, 11–13 November 2014; Volume 8851, pp. 228–243. [Google Scholar]
- Tschiatschek, S.; Singla, A.; Gomez Rodriguez, M.; Merchant, A.; Krause, A. Fake News Detection in Social Networks via Crowd Signals. In Proceedings of the The Web Conference, Lyon, France, 23–27 April 2018; pp. 517–524. [Google Scholar]
- Facebook. How is Facebook Addressing False News. Available online: https://www.facebook.com/help/1952307158131536 (accessed on 25 January 2021).
- Shu, K.; Bernard, H.R.; Liu, H. Studying Fake News via Network Analysis: Detection and Mitigation. Emerg. Res. Chall. Oppor. Comput. Soc. Netw. Anal. Min. Springer 2019, 8, 43–65. [Google Scholar]
- Sharma, K.; Qian, F.; Jiang, H.; Ruchansky, N.; Zhang, M.; Liu, Y. Combating fake news: A survey on identification and mitigation techniques. ACM Trans. Intell. Syst. Technol. 2019, 10, 1–42. [Google Scholar] [CrossRef]
- Amoruso, M.; Anello, D.; Auletta, V.; Cerulli, R.; Ferraioli, D.; Raiconi, A. Contrasting the spread of misinformation in online social networks. J. Artif. Intell. Res. 2020, 69, 847–879. [Google Scholar] [CrossRef]
- Pham, C.V.; Phu, Q.V.; Hoang, H.X. Targeted misinformation blocking on online social networks. In Proceedings of the Asian Conference on Intelligent Information and Database Systems, Dong Hoi City, Vietnam, 19–21 March 2018. [Google Scholar]
- Song, C.; Hsu, W.; Lee, M.L. Temporal influence blocking: Minimizing the effect of misinformation in social networks. In Proceedings of the International Conference on Data Engineering (ICDE), San Diego, CA, USA, 19–22 April 2017. [Google Scholar]
- Saxena, A.; Saxena, H.; Gera, R. Competitive Influence Propagation and Fake News Mitigation in the Presence of Strong User Bias. arXiv 2020, arXiv:2011.04857. [Google Scholar]
- Vicario, M.D.; Quattrociocchi, W.; Scala, A.; Zollo, F. Polarization and fake news: Early warning of potential misinformation targets. ACM Trans. Web 2019, 13, 1–22. [Google Scholar] [CrossRef]
- Horne, B.D.; Gruppi, M.; Adali, S. Trustworthy misinformation mitigation with soft information nudging. In Proceedings of the 2019 First IEEE International Conference on Trust, Privacy and Security in Intelligent Systems and Applications (TPS-ISA), Los Angeles, CA, USA, 12–14 December 2019. [Google Scholar]
- Vo, N.; Lee, K. The Rise of Guardians. In Proceedings of the The 41st International ACM SIGIR Conference on Research & Development in Information Retrieval, Ann Arbor, MI, USA, 8–12 July 2018; pp. 275–284. [Google Scholar]
- Zhao, Q.; Erdogdu, M.A.; He, H.Y.; Rajaraman, A.; Leskovec, J. SEISMIC: A self-exciting point process model for predicting tweet popularity. In Proceedings of the ACM SIGKDD International Conference on Knowledge Discovery and Data Mining, Sydney, Australia, 10–13 August 2015; pp. 1513–1522. [Google Scholar]
- Nguyen, N.P.; Yan, G.; Thai, M.T.; Eidenbenz, S. Containment of misinformation spread in online social networks. In Proceedings of the 4th Annual ACM Web Science Conference, WebSci’12, Evanston, IL, USA, 22–24 June 2012; Volumes 213–222. [Google Scholar]
- Kempe, D.; Kleinberg, J.; Tardos, É. Maximizing the spread of influence through a social network. Theory Comput. 2015, 11, 105–147. [Google Scholar] [CrossRef]
- Simpson, M.; Srinivasan, V.; Alex, T. Reverse Prevention Sampling for Misinformation Mitigation in Social Networks. arxiv 2018, arXiv:1807.01162. [Google Scholar]
- Rajabi, Z.; Shehu, A.; Purohit, H. User behavior modelling for fake information mitigation on social web. In Proceedings of the International Conference on Social Computing, Behavioral-Cultural Modeling and Prediction and Behavior Representation in Modeling and Simulation, Washington, WA, USA, 9–12 July 2019; pp. 234–244. [Google Scholar]
- Yosef, M.A.; Hoffart, J.; Bordino, I.; Spaniol, M.; Weikum, G. AIDA: An online tool for accurate disambiguation of named entities in text and tables. PVLDB 2011, 4, 1450–1457. [Google Scholar] [CrossRef]
- Yosef, M.A.; Hoffart, J.; Bordino, I.; Spaniol, M.; Weikum, G. AIDA. Available online: https://gate.d5.mpi-inf.mpg.de/webaida/ (accessed on 25 January 2021).
- Suchanek, F.; Kasneci, G.; Weikum, G.; Suchanek, F.; Kasneci, G.; Weikum, G.; Core, Y.A.; Suchanek, F.M.; Weikum, G. Yago: A Core of Semantic Knowledge. In Proceedings of the World Wide Web conference, Banff, AB, Canada, 8–12 May 2017; pp. 697–706. [Google Scholar]
- Magdy, A.; Wanas, N. Web-based statistical fact checking of textual documents. Int. Conf. Inf. Knowl. Manag. 2010, 103–109. [Google Scholar]
- Hassan, N.; Sultana, A.; Wu, Y.; Zhang, G.; Li, C.; Yang, J.; Yu, C. Data in, fact out: Automated monitoring of facts by FactWatcher. PVLDB 2014, 7, 1557–1560. [Google Scholar] [CrossRef] [Green Version]
- Wikipedia. Wikipedia Topics Hierarchy. Available online: https://en.wikipedia.org/wiki/Portal:Contents/Categories# (accessed on 25 January 2021).
- Tweet Classifier. Available online: https://app.monkeylearn.com/ (accessed on 25 January 2021).
- Han, X.; Wang, L.; Farahbakhsh, R.; Cuevas, Á.; Cuevas, R.; Crespi, N.; He, L. CSD: A multi-user similarity metric for community recommendation in online social networks. Expert Syst. Appl. 2016, 53, 14–26. [Google Scholar] [CrossRef]
- Royy, S.B.; Lakshmanan, L.V.S.; Liuy, R. From group recommendations to group formation. In Proceedings of the ACM SIGMOD International Conference on Management of Data, Melbourne, Australia, 31 May–4 June 2015; pp. 1603–1616. [Google Scholar]
- Cai, H.; Zheng, V.W.; Zhu, F.; Chang, K.C.C.; Huang, Z. From community detection to community profiling. PVLDB 2017, 10, 817–828. [Google Scholar] [CrossRef]
- Nakov, P.; Ritter, A.; Rosenthal, S.; Sebastiani, F.; Stoyanov, V. SemEval-2016 task 4: Sentiment analysis in twitter. In Proceedings of the SemEval 2016-10th International Workshop on Semantic Evaluation, San Diego, CA, USA, 16–17 June 2016; pp. 1–18. [Google Scholar]
- Sobhani, P.; Mohammad, S.M.; Kiritchenko, S. Detecting stance in tweets and analyzing its interaction with sentiment. In Proceedings of the SEM 2016-5th Joint Conference on Lexical and Computational Semantics, Berlin, Germany, 11–21 August 2016; pp. 159–169. [Google Scholar]
- Rajaraman, A.; Ullman, J. Data Mining: Mining of Massive Datasets; Cambridge University Press: Cambridge, UK, 2011; pp. 1–17. [Google Scholar]
- Ask FactCheck. 2020. Available online: https://www.factcheck.org/ask-factcheck/ask-us-a-question/ (accessed on 25 January 2021).
- Weiss, N.A.; Hassett, M.J. Introductory Statistics; Pearson Education: London, UK, 2012. [Google Scholar]
- Duradoni, M.; Paolucci, M.; Bagnoli, F.; Guazzini, A. Fairness and Trust in Virtual Environments: The Effects of Reputation. Future Internet 2018, 10, 50. [Google Scholar] [CrossRef] [Green Version]
- Yan, S.; Tang, S.; Pei, S.; Jiang, S.; Zhang, X.; Ding, W.; Zheng, Z. The spreading of opposite opinions on online social networks with authoritative nodes. Phys. A Stat. Mech. Appl. 2013, 392, 3846–3855. [Google Scholar] [CrossRef]
- Hassan, N.; El-sharkawi, M.E.; El-tazi, N. Measuring User ’s Susceptibility to Influence in Twitter. In Proceedings of the Social Data Analytics and Management Workshop, co-located with VLDB, New Delhi, India, 9 September 2016. [Google Scholar]
- Gao, Z.; Shi, Y.; Chen, S. Identifying influential nodes for efficient routing in opportunistic networks. J. Commun. 2015, 10, 48–54. [Google Scholar] [CrossRef] [Green Version]
- Twitter Developer API. Available online: https://developer.twitter.com/en (accessed on 25 January 2021).
- Augenstein, I.; Lioma, C.; Wang, D.; Lima, L.C.; Hansen, C.; Hansen, C.; Simonsen, J.G. MultIFC: A real-world multi-domain dataset for evidence-based fact checking of claims. In Proceedings of the EMNLP-IJCNLP 2019—2019 Conference on Empirical Methods in Natural Language Processing and 9th International Joint Conference on Natural Language Processing, Bangkok, Tailand, 1–6 August 2020; pp. 4685–4697. [Google Scholar]
- Augenstein, I.; Lioma, C.; Wang, D.; Lima, L.C.; Hansen, C.; Hansen, C. Evidence-Based Fact Checkinh of Claims. 2020. Available online: https://competitions.codalab.org/competitions/21163 (accessed on 25 January 2021).
- TextRazor. TextRazor. Available online: https://www.textrazor.com/ (accessed on 25 January 2021).
- Chok, N.S. Pearson’s Versus Spearman’s and Kendall’s Correlation Coefficients for Continuous Data. PhD Thesis, University of Pittsburgh, Pittsburgh, PA, USA, 2010. [Google Scholar]
- Kutner, M.H.; Nachtsheim, C.J.; Neter, J.; Li, W. Applied Linear Statistical Models, 5th ed.; Mc Graw Hill: New York, NY, USA, 2013. [Google Scholar]
- Hui, P.-M.; Shao, C.; Flammini, A.; Menczer, F.; Ciampaglia, G.L. The hoaxy misinformation and fact-checking difusion network. In Proceedings of the In Twelfth International AAAI Conference on Web and Social Media, Palo Alto, CA, USA, 25–28 June 2018. [Google Scholar]
- Hui, P.-M.; Shao, C.; Alessandro Flammini, F.M.; Ciampaglia, G.L. Hoaxy. 2018. Available online: https://hoaxy.iuni.iu.edu/ (accessed on 25 January 2021).
- Digital Marketing. Available online: https://en.wikipedia.org/wiki/Digital_marketing (accessed on 25 January 2021).
Figure 1.
Community content and diffusion profiles content.

Figure 2.
The community-based news mitigation framework.

Figure 3.
The 3D visualization of user behavior leveraging the K-means algorithm.

Figure 4.
ANOVA test results for user bias features.


Table 1.
Claim instance.
| Feature | Value |
|---|---|
| Claim ID | farg-00118 |
| Claim | GM Korea company announced today that it will cease production and close its Gunsan plant in May of 2018, and they are going to move back to Detroit |
| Claim entities | Location: Gunsan, Korea, and Detroit. Company (work): GM Korea |
| Claim facts (Form 1) | The extracted fact: [‘Detroit’, ‘Gunsan’, ‘Korea’] |
| Claim facts (Form 2) | The extracted fact: [‘Detroit’, ‘Gunsan’, ‘Korea’] + [‘announce’, ‘cease’, ‘close’, ‘move’] |
Table 2.
Correlation measure coefficients.
| Claims # | Articles # | # of Claim Entities | # of Article Entities | # of Claim Facts | # of Article Facts |
|---|---|---|---|---|---|
| 756 | 1657 | 1413 | 20,925 | 674 | 37,832 |
| Pearson’s r coefficient 0.48 | Spearman coefficient 0.9 | ||||
Table 3.
K-means performance metrics.
| Clustering Algorithm | Silhoutte | Calinski-Harabaz | Davis-Bouldin |
|---|---|---|---|
| K-Mean | 0.89237 | 3618.65 | 0.195 |
Table 4.
ANOVA test results for user features over behavior categories.
| User Feature | Mean | F-Value | F-Critical | p-Value | ||
|---|---|---|---|---|---|---|
| I | R | P | ||||
| F1: Community Membership | 0.05 | 0.00 | 0.03 | 64.78 | 3.02 | 0.00 |
| F2: Diffusion rate | 0.79 | 0.38 | 0.89 | 58.93 | 3.04 | 0.00 |
| F3: Popularity-rate (favorites count) | 0.97 | 0.40 | 0.94 | 9.64 | 3.03 | 0.00 |
| F4: Average user polarity | 0.03 | 0.01 | 0.52 | 3.75 | 3.01 | 0.02 |
| F5: General user bias | 0.02 | 0.01 | 0.49 | 3.65 | 3.01 | 0.03 |
| F6: User local centrality | 0.01 | 0.01 | 0.03 | 1.88 | 3.17 | 0.17 |
| F7: Local user re-share frequency | 0.01 | 0.02 | 0.02 | 0.24 | 3.17 | 0.62 |
Publisher’s Note: MDPI stays neutral with regard to jurisdictional claims in published maps and institutional affiliations. |
© 2021 by the authors. Licensee MDPI, Basel, Switzerland. This article is an open access article distributed under the terms and conditions of the Creative Commons Attribution (CC BY) license (https://creativecommons.org/licenses/by/4.0/).
Share and Cite
MDPI and ACS Style
Galal, S.; Nagy, N.; El-Sharkawi, M.E. CNMF: A Community-Based Fake News Mitigation Framework. Information 2021, 12, 376. https://0-doi-org.brum.beds.ac.uk/10.3390/info12090376
AMA Style
Galal S, Nagy N, El-Sharkawi ME. CNMF: A Community-Based Fake News Mitigation Framework. Information. 2021; 12(9):376. https://0-doi-org.brum.beds.ac.uk/10.3390/info12090376
Chicago/Turabian StyleGalal, Shaimaa, Noha Nagy, and Mohamed. E. El-Sharkawi. 2021. "CNMF: A Community-Based Fake News Mitigation Framework" Information 12, no. 9: 376. https://0-doi-org.brum.beds.ac.uk/10.3390/info12090376
Note that from the first issue of 2016, this journal uses article numbers instead of page numbers. See further details here.