
Temporal and Spatial Evolution of Green Invention Patent Applications in China


1
School of Economics and Management, University of Science and Technology Beijing, Beijing 100083, China
2
School of Urban Economics and Management, Beijing University of Civil Engineering and Architecture, Beijing 100044, China
*
Authors to whom correspondence should be addressed.
Information 2022, 13(5), 240; https://0-doi-org.brum.beds.ac.uk/10.3390/info13050240
Submission received: 8 March 2022
/
Revised: 23 April 2022
/
Accepted: 3 May 2022
/
Published: 9 May 2022
Abstract
:This paper analyzes the temporal and spatial characteristics of green invention patent applications during 1985–2018. The results show that China’s green invention patent applications present five stages of slow development, slow growth, accelerating growth, rapid growth and booming. Green invention patent applications in the fields of energy conservation, alternative energy production and waste management have always been in the forefront, but there are relatively less green invention patent applications in transportation and nuclear power; which need to be further strengthened. Green invention patent applications show a high level of geographical agglomeration in space, mainly concentrated in the eastern region, followed by the central region, the western region and northeast region. During the study period, the differences among the four major regions, eastern, northeastern, central and western, showed a trend of first expanding and then narrowing, and the intra-regional differences were the main source of spatial differences. The number of green invention patent applications in the four regions also shifted in space during the research period. The temporal and spatial evolution characteristics are correlative to national and regional innovation policies. Aiming at solving the problems of unbalanced development in different categories of green invention patent applications and regions, this paper puts forward corresponding policy suggestions.
1. Introduction
With rapid economic growth, China’s ecological and environmental problems are becoming more and more prominent. Problems such as excessive energy consumption and serious air pollution need to be solved urgently. Green innovation is the fundamental way to realize the coordinated and sustainable development of the economy, society, resources and the environment. It has a positive effect on the quality of economic development [1]. Green technology innovation can not only improve production efficiency, but can also reduce production energy consumption and pollutant emission, so as to achieve the “win-win” goal of economic development and environmental protection.
China has implemented various policies to promote green innovation. In 2016, China issued the outline of the national innovation development strategy to encourage the development of green technology [2], including intelligent green manufacturing technology, ecological agricultural technology, clean energy technology, efficient utilization of resources and environmental protection technologies. In 2019, China’s National Development and Reform Commission and the Ministry of Science and Technology jointly issued guiding opinions on building a market-oriented green technology innovation system, pointing out that accelerating the development of a green technology innovation system, and promoting the development of green industry, is of great significance for improving China’s position in the new round of scientific and technological competition [3]. In 2021, the action plan for reaching the peak of carbon emission by 2030, issued by the State Council of China, pointed out the need to accelerate the green and low-carbon scientific and technological revolution [4]. In view of this, it is necessary to analyze the development status, temporal and spatial evolution characteristics and regional differences of China’s green technology innovation, and adjust the regional innovation policy according to the analysis results to further promote the development of green technology innovation.
Previous studies have used patent data in different periods to analyze the geographical agglomeration characteristics of China’s innovation [5,6,7,8]. Existing studies have also analyzed influencing factors of green innovation and green innovation efficiency [9,10,11]. The results show that R and D efficiency, per capita GDP [12], environmental regulation intensity [13], low carbon city pilot policy [14], carbon emission trading policy [15,16], cleaner production audit (CPA) program [17], tax, R and D subsidy [18], and pollution information transparency [19] are the main factors affecting green innovation. In order to encourage enterprises to innovate and enhance their awareness of intellectual property protection, in 1999, China’s State Council issued the decision on strengthening technological innovation, developing high technology and realizing industrialization. In the year when the policy was released, Shanghai and other regions launched activities to encourage local enterprises to apply for patents, and then other provinces launched similar projects [20]. Although the objectives are the same, the policy design for each region is different, and the number of financial subsidies is different as well. Therefore, differences in innovation policies are also the reasons for the uneven spatial distribution of patent innovation in China.
To sum up, there are abundant studies on the spatial pattern and influencing factors of patent innovation, but most of the existing studies analyze the overall development of China’s innovation, without distinguishing whether innovation is green innovation or not, and there are few studies related to the temporal and spatial evolution characteristics of green innovation. In addition, the existing research on green innovation has not subdivided the categories of green innovation, so it is impossible to analyze the specific categories of green innovation. Through data mining of patent application information from 1985 to 2018, this paper extracts seven categories of green patents, according to the IPC green inventory of the World Intellectual Property Organization (WIPO), and analyzes the dynamic evolution characteristics of seven categories of green innovation. This research will be helpful to clarify the development status of various types of green innovation and help the government formulate and adjust regional innovation policies, and specific industrial innovation policies, so as to promote the rapid and balanced development of green innovation in China.
The remainder of this article is organized as follows. The related works are reviewed in Section 2. The methods and data used in this paper are introduced in Section 3. Then the results and discussion are presented in Section 4. Finally, we offer a concluding remark and address some limitations in Section 5.
2. Related Work
China’s innovation presents the characteristics of spatial convergence and agglomeration. Using the nonlinear time-varying factor model and club clustering algorithm proposed by Phillips and Sul in 2007 [21], Bai et. al. found that there was a phenomenon of club convergence in China’s regional renewable energy technology innovation during 1997–2015. The ordered probit model was used to investigate the factors that influence club convergence. The results showed that differences in industrial structure, R and D investment intensity, and environmental regulation intensity are the main drivers of club convergence. Provinces with relatively similar industrial structure, R and D investment intensity, and environmental regulation intensity have similar levels of innovation and growth rate, and they belong to the same convergence club [5]. Ye et. al. applied social network analysis to the patent cooperation network among Chinese enterprises and found that there was small-world effect during 1985–2010 [6]. Li et. al. also used social network analysis to investigate the spatial-temporal evolution of patent collaboration networks of China’s intelligent manufacturing equipment industry, over the period 2001–2018 and found that patent collaboration networks changed over time and varied across provinces. Some provinces presented intra-provincial collaboration, while other provinces, such as Beijing and Guangdong provinces, collaborated between provinces [8]. Ying et. al. explored the agglomeration of green innovation driven by intelligent manufacturing through conducting a survey on enterprises. Their results showed that geographical proximity promoted innovation cooperation in different regions [22]. Fan and Xiao analyzed the spatial correlation of green innovation between different regions in China and found that regional development was unbalanced and some regions benefited more from the innovation network [23]. Liu et. al. used the data of patent grants from 2007 to 2017 in China, gravity model and social network analysis to analyze the evolution of the green innovation network. Their results revealed that green innovation has spillover effects among provinces [24].The government should implement proper innovation policies to promote patent cooperation and make use of the spillover effects. Zhao et. al. investigated the reasons for regional inequality of renewable energy innovation in China using patent data from 2008 to 2017, Gini coefficient and regression model. They found that regional inequality of renewable energy innovation was mainly due to the differences in regional R and D expenditure and knowledge stock [25].
The geographical agglomeration characteristics of China’s innovation are not constant, but change with time and policies’ implementation. The existing studies found that the geographical agglomeration of innovation has phased characteristics. At different stages, the regions where patent innovation concentrated changed. Zhang et. al. used patent application data, gravity model and index decomposition method to investigate the spatial features and influence factors of low-carbon energy technology innovation in China. They found that the gravity center of China’s low-carbon energy patent applications cluster moved towards southwest, southeast or northeast over 2000–2017. In addition, the technology priority of specific low-carbon energy technology assigned by investors was the main driving force for the development of innovation [7]. Bai et. al., explored the spatial characteristics of smart grid technology in China using smart grid patent data from 2009 to 2020, and found that smart grid innovations are spatially agglomerated. Furthermore, the hotspots of smart grid innovation varied in different stages [26].
The existing studies provided insight for this paper. However, most of these studies focus only on one category of green innovation, or only cover a short period, which cannot reflect the overall development trend of green innovation in China. Therefore, it is necessary to analyze temporal and spatial evolution of green innovation more thoroughly.
3. Methods and Data
3.1. Methods
3.1.1. Gini Coefficient
The Gini coefficient can reflect whether the innovation is evenly distributed in space [25]. The Gini coefficient can be calculated using Equation (1).
where N represents the total number of provinces or cities, is the mean of , G value is between 0 and 1. When innovation activities are completely evenly distributed in space, the G value is 0, and when they are completely concentrated, the G value is 1. The greater the G, the higher the degree of agglomeration.
3.1.2. Theil Index
The Theil index (T) can be used to measure change of differences [27]. It can be calculated using Equation (2).
where, is the share of innovation output of regional i in the country, and N is the total number of provinces or cities in the country. The Theil index (T) decomposes the differences into intra-regional differences () and interregional differences (), as shown in Equations (3)–(5). is the share of innovation output of region r in total national innovation output, is the number of provinces or cities in region r, and M is the total number of regions.
3.1.3. Global Moran Index
The Global Moran Index (Moran’s I) has been used to calculate spatial dependence in previous studies [28,29]. We use Global Moran’s I to calculate the spatial correlation of green invention patent applications in China’s provinces or cities. The calculation of the Global Moran Index is shown in Equation (6).
where , , , is the row standardized spatial weight matrix. N is the total number of regions. is the aggregation of all spatial weights. The standardized Z statistics test the significance of Moran index, as shown in Equation (7).
where , , is the expected mean, and is the standard deviation.
3.2. Data
The OECD Patent Statistics Manual points out that patent data provide unique information on inventive activities and processes compared with other innovation indicators like R and D expenditure and personnel [30]. Although there are drawbacks of using patent data as a proxy for innovation activities, patent data form a consistent basis for comparison across time and regions [30]. Patent data can be used to analyze specific categories of technology innovation, while data of R and D expenditure for specific technology are unavailable.
There are two types of patents, i.e., invention patents and utility patents. Invention patent data is used to measure the level of innovation, as it can represent the output of high-quality innovation activities [17,31]. In addition, due to the lag of patent authorization, it is difficult to investigate the impact of recent policies using the data of patent granted [16]. Following previous studies [7,16,31,32], we select invention patent application data to measure innovation efforts.
Patent data generally lag from application to publication for half a year to one and a half years. The current statistics of patent applications in 2019 and 2020 are incomplete. Therefore, this paper mainly analyzes the invention patents registered in China from 1985 to 2018. The invention patent application data of 31 provinces or autonomous regions in China, from 1985 to 2018, were selected as the sample. Patent application data comes from the State Intellectual Property Office (SIPO) of China. The green invention patent application data were screened and extracted from SIPO according to the International Patent Classification (IPC) Green Inventory codes developed by the World Intellectual Property Organization (WIPO) in 2010 (https://www.wipo.int/classifications/ipc/green-inventory/home, accessed on 1 March 2022). The IPC Green Inventory summarizes the patents relating to Environmentally Sound Technologies. It divides green patents into seven categories (including alternative energy production, transportation, energy conservation, waste management, agriculture and forestry, administrative, regulatory or design aspects, and nuclear power generation), and each category has detailed International Patent Classification codes.
4. Results and Discussion
4.1. Temporal Evolution Characteristics
4.1.1. Overall Trend and Innovation Policies
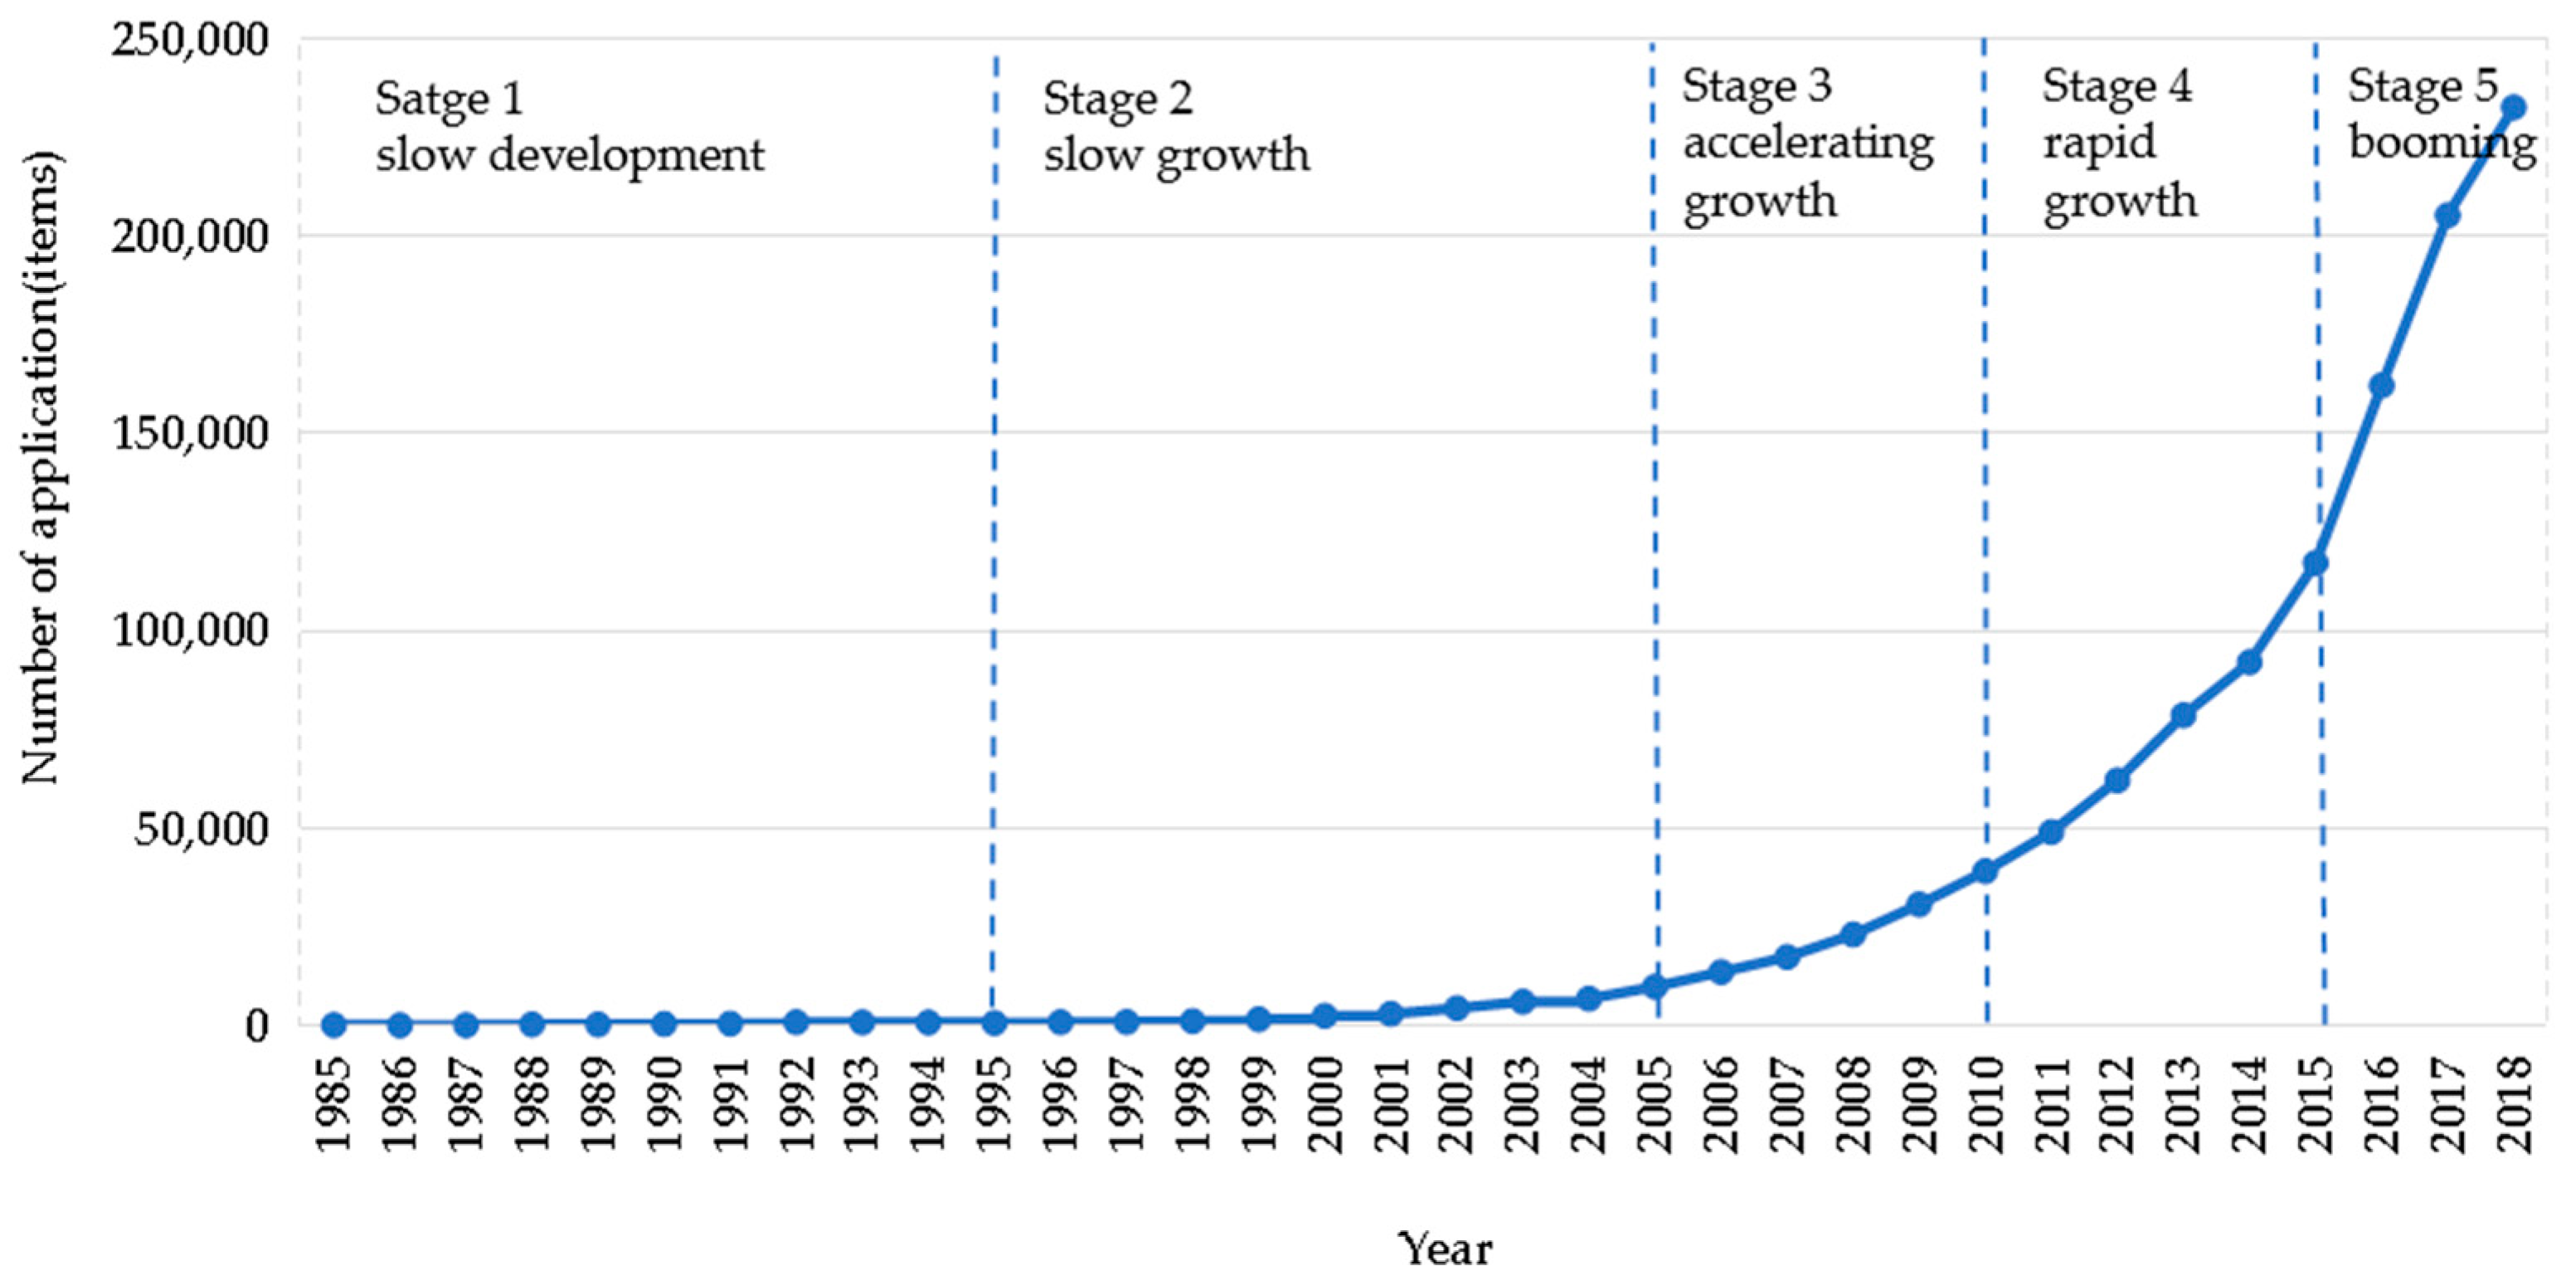
During the 34 years from 1985 to 2018, the number of green invention patent applications in China showed an increasing trend (as shown in Figure 1). The cumulative number of green invention patent applications in China during the 34 years was 1.17 million. As can be seen from Figure 1, the development of green invention patent applications in China can be roughly divided into five stages, which are mainly related to China’s Five-Year Plan periods. There were few changes during the first two stages; the first and second stages include about ten years i.e., two Five-Year Plan periods.
The first stage: slow development. From 1985 to 1995, the 7th and 8th Five Year Plan periods, the number of green invention patent applications increased slowly, with a cumulative number of seven thousand, accounting for 0.6% of the total number of applications in 34 years, and the average annual applications was seven hundred.
The second stage: slow growth. From 1996 to 2005, the 9th and 10th Five Year Plan periods, the growth rate increased. The cumulative number of applications was 39 thousand, accounting for 3.3% of the total number of applications in 34 years. The average annual number of applications was four thousand. Since 2005, the annual number of applications has exceeded ten thousand.
The third stage: accelerating growth. During the 11th Five Year Plan period (2006–2010), the cumulative number of applications was 124 thousand, accounting for 10.7% of the total number of applications in 34 years, and the average annual applications reached 25 thousand.
Stage 4: rapid growth. During the 12th Five Year Plan period (2011–2015), the cumulative number of applications was 399 thousand, accounting for 34.1% of the total number of applications in 34 years, and the average annual number of applications reached 80 thousand, three times that of the 11th Five Year Plan period. Since 2015, the annual application volume has exceeded 100 thousand.
Stage 5: booming. During the first three years of the 13th Five Year Plan period (2016–2018), the cumulative number of applications was 600 thousand, accounting for 51.2% of the total number of applications in 34 years, and the average annual applications reached 200 thousand.
The temporal characteristics of China’s green invention patent applications are closely related to changes in national and local scientific and technological innovation policies. China formulated a series of scientific and technological innovation policies from 1985 to 2018 [33]. In 1993, the law of the People’s Republic of China on scientific and technological progress was adopted [34]. It stipulates that the government should gradually increase the overall level of scientific and technological investment and implement preferential policies for R and D institutions and enterprises engaged in the development and production of high-technology products. In 1996, the law of the People’s Republic of China on promoting the transformation of scientific and technological achievements was adopted and the decision of the CPC Central Committee and the State Council on accelerating scientific and technological progress was promulgated [35]. In 2005, the outline of technological innovation of the national high-technology industry development zone was printed and issued. Through the implementation of the development strategy of secondary entrepreneurship (focusing on creating an innovation and entrepreneurship environment and enhancing technological innovation ability), the national high-technology zone has truly become a technological radiation source for transforming and upgrading traditional industries [36]. These policies promote the development of scientific and technological innovation, but do not emphasize green technology innovation. The growth of green invention patent applications is relatively slow.
During the Eleventh Five-Year Plan period, China’s State Council issued the outline of the national medium and long term science and technology development plan (2006–2020) [37], which puts forward the key areas and priority themes of technological development, including energy conservation, clean and efficient development and utilization of coal, large-scale development and utilization of renewable energy in the field of energy; comprehensive pollution control and waste recycling in the field of environmental protection; environmentally friendly fertilizer and ecological agriculture in the field of agriculture; green manufacturing, recyclable steel process technology and equipment; low energy consumption and new energy vehicle technology in the transportation industry; building energy conservation and green building. These themes belong to the field of green technology innovation, and promoted the rapid growth of green invention patent applications in the third stage and subsequent years (2006–2018).
During the 12th Five-Year Plan period, the national 12th Five-Year Plan for science and technology development, issued by the Ministry of Science and Technology of China, proposed to focus on the development of advanced green manufacturing technologies and products [38], and issued the 12th Five-Year Plan for the development of green manufacturing technology in 2012 [39]. These policies promoted the rapid growth of green invention patent applications during the 12th Five Year Plan period.
During the 13th Five-Year Plan period, China’s State Council issued the 13th five-year plan for national scientific and technological innovation, which further emphasized the development of intelligent green manufacturing technology, clean and efficient energy technology, green technology in rail transit, green biological manufacturing technology, efficient resource recycling technology, green building technology, etc. [40]. These policies promoted the rapid development of green invention patent applications during the 13th Five-Year Plan period.
4.1.2. Development Trend of Different Categories of Green Patents
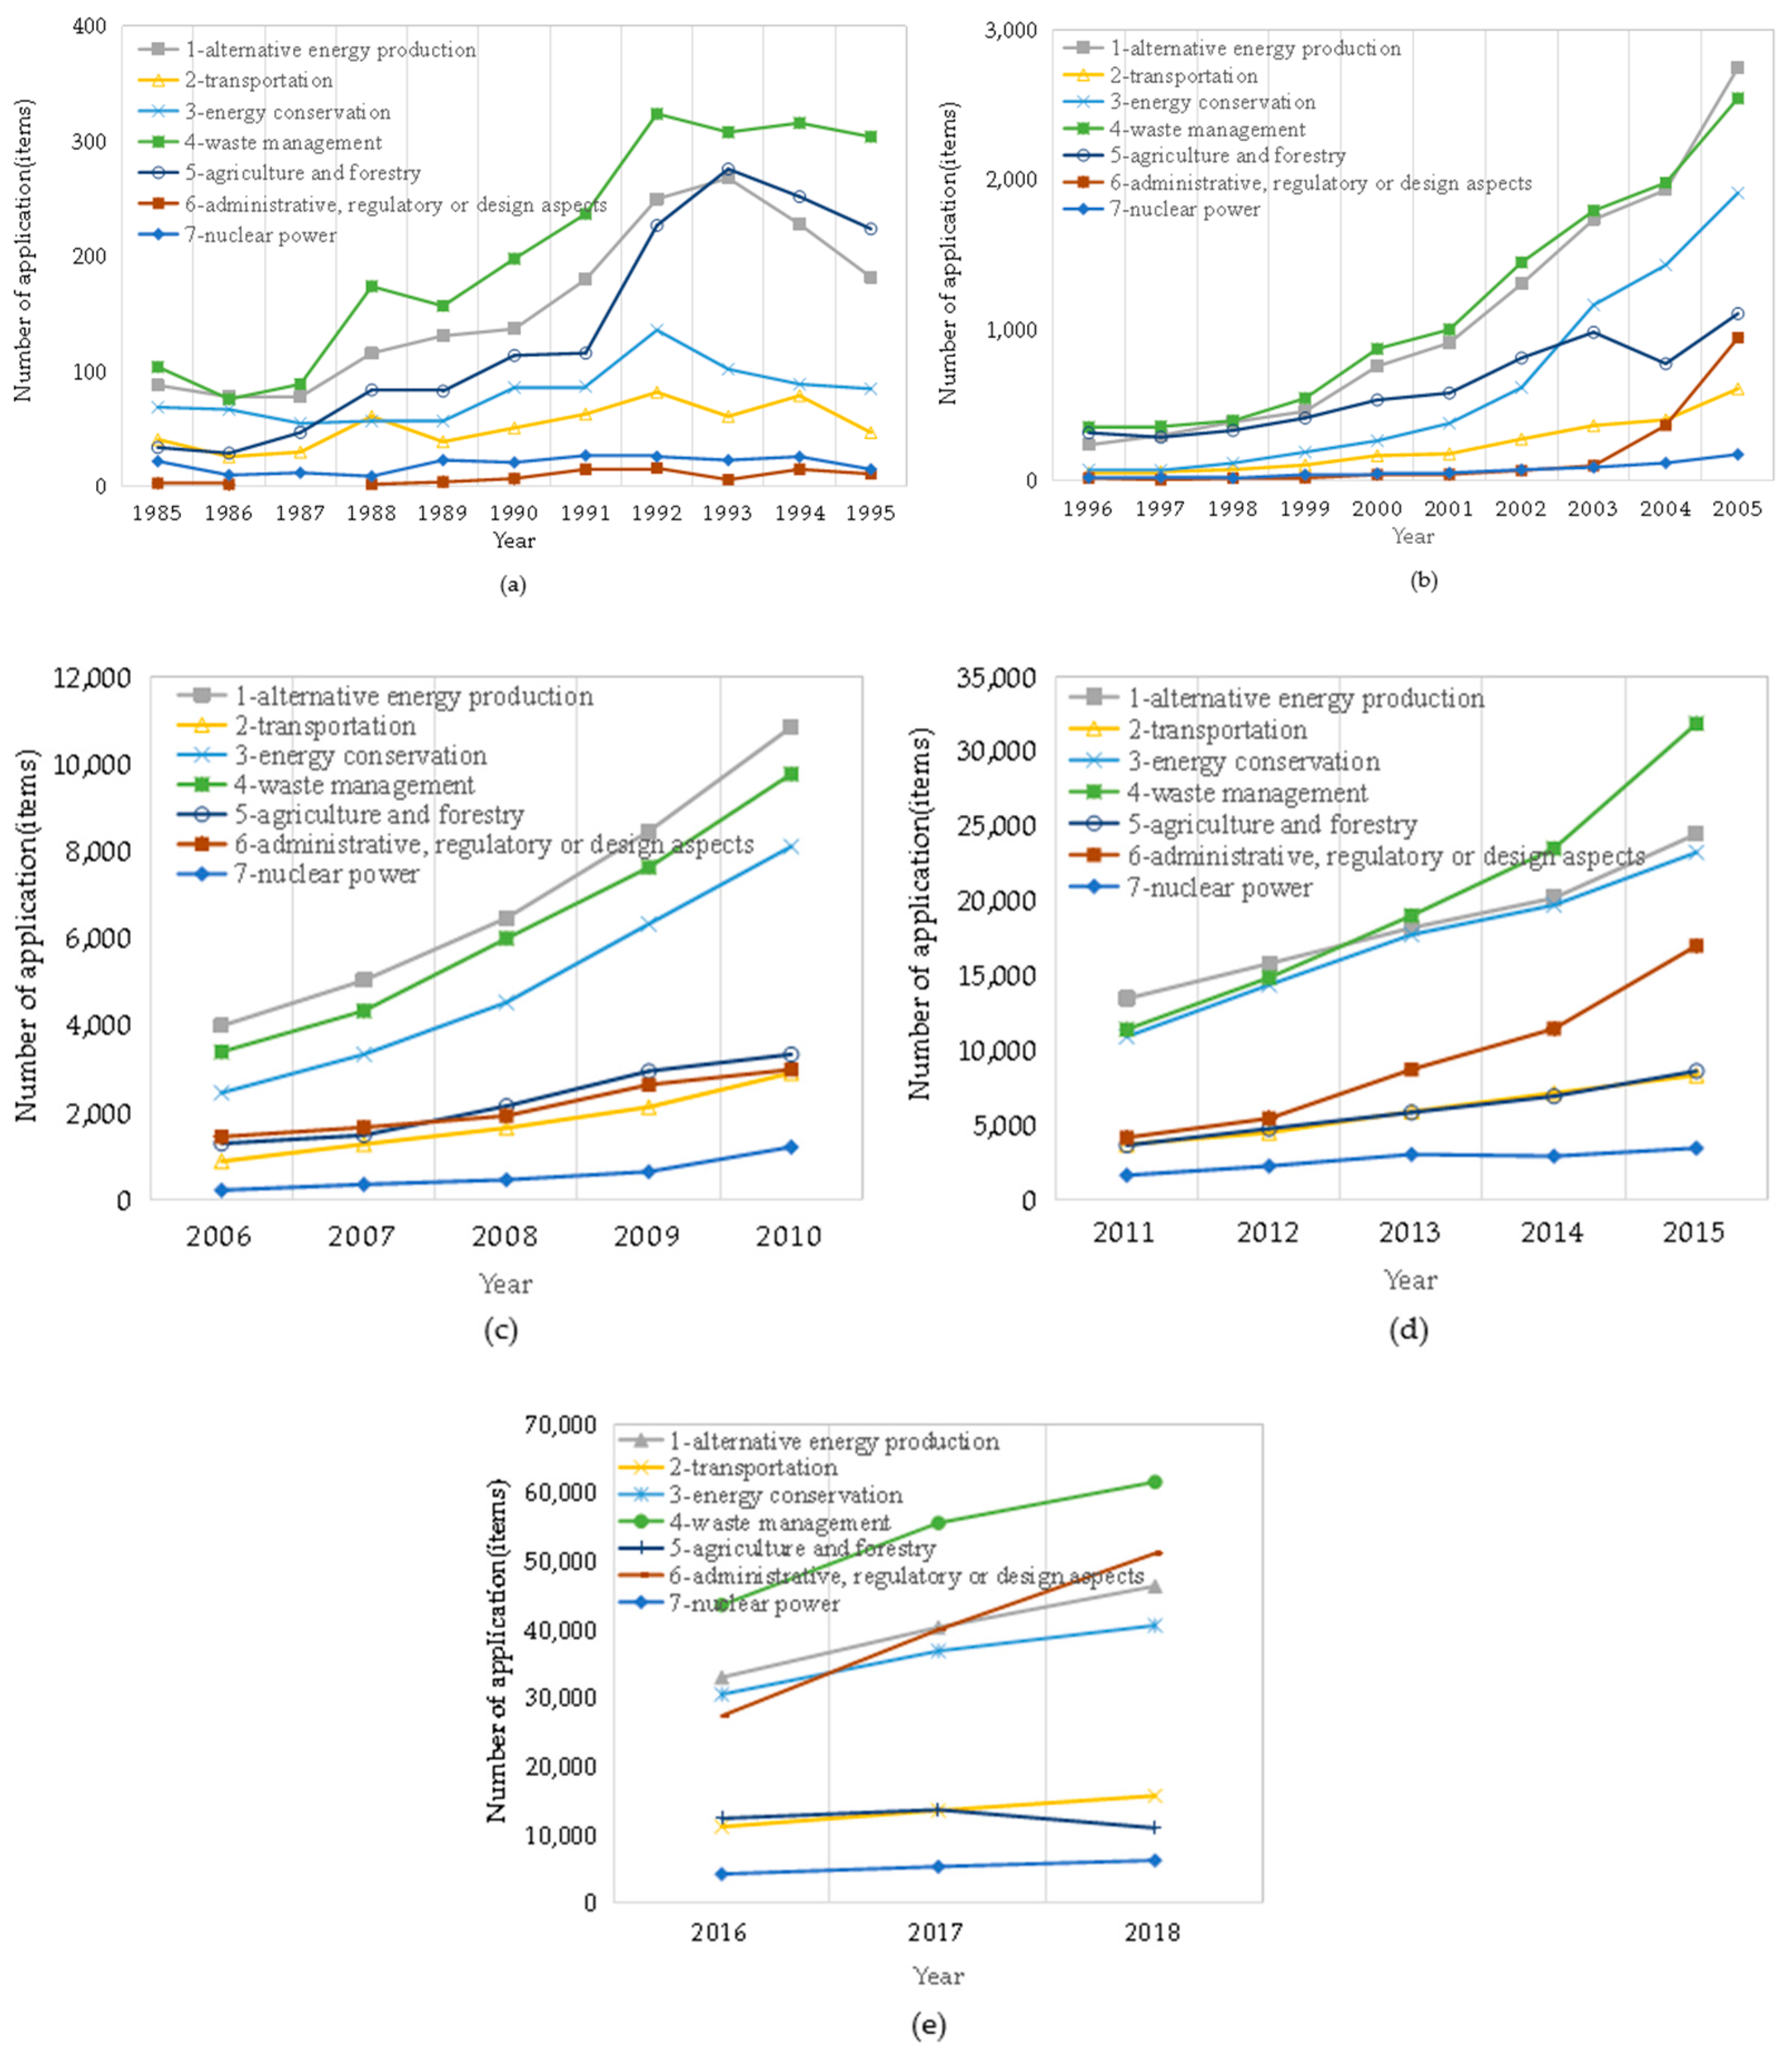
In order to further analyze the time evolution characteristics of different categories, green invention patent applications are divided into seven categories according to the IPC Green Inventory codes of the World Intellectual Property Organization (WIPO), including alternative energy production, transportation, energy conservation, waste management, agriculture and forestry, administrative, regulatory or design aspects, and nuclear power. Figure 2 shows the characteristics of green invention patent applications over time.
As can be seen from Figure 2a, the first stage (1985–1995) saw relatively rapid growth in the number of green invention patent applications, including Category 1 (alternative energy production), Category 4 (waste management) and Category 5 (agriculture and forestry). As can be seen from Figure 2b, Category 1, Category 3 (energy conservation) and Category 4 increased rapidly in the second stage (1996–2005). After 2003, the growth rate of Category 3 exceeded that of Category 5. Since 2003, Category 6 (administrative, regulatory or design aspects) has also shown a rapid growth trend. As is shown in Figure 2c, Category 1, Category 3 and Category 4 still grew rapidly in the third stage (2006–2010). The growth rate of Category 2 (transportation) and Category 6 (administrative, regulatory or design aspects) is close to that of Category 5 (agriculture and forestry).
Figure 2d shows that Category 1, Category 3 and Category 4 increased rapidly in the fourth stage (2011–2015). The annual average number of applications for waste management ranked the first, reaching 20 thousand. The second was Category 1 (alternative energy production), with an average annual application volume of about 18 thousand. As can be seen from Figure 2e, the application volume of Category 4 in the fifth stage (2016–2018) exceeded that of Category 1 and Category 3, becoming the category with the largest annual application volume. Category 6 (administrative, regulatory or design aspects) showed a rapid growth trend as well. Since 2018, the annual application volume of Category 6 has exceeded Category 1 and Category 3.
From the above analysis, it can be seen that during 1985–2018, green invention patent applications in the fields of alternative energy production (Category 1), energy conservation (Category 3) and waste management (Category 4) have always been in the lead, and green invention patent applications in the field of administrative, regulatory or design aspects (Category 6) have been paid more and more attention. However, there are relatively few green invention patent applications in transportation (Category 2) and nuclear power (Category 7), which need to be further strengthened.
4.2. Spatial Evolution Characteristics
4.2.1. Geographical Agglomeration Characteristics
Green invention patent applications in 31 provinces or cities in China show a high level of geographical agglomeration. Figure 3 shows the change of Gini coefficient during 1985–2018. As can be seen from Figure 3, the Gini coefficient of China’s green invention patent applications is mostly above 0.4, and shows an overall growth trend. After 2000, the Gini coefficient was above 0.5, and during 2005–2018, the Gini coefficient was about 0.6. This means that China’s green invention patent applications show a certain degree of self-strengthening among provinces or cities. The development of innovation ability of provinces or cities is uneven.
4.2.2. Spatial Difference Evolution
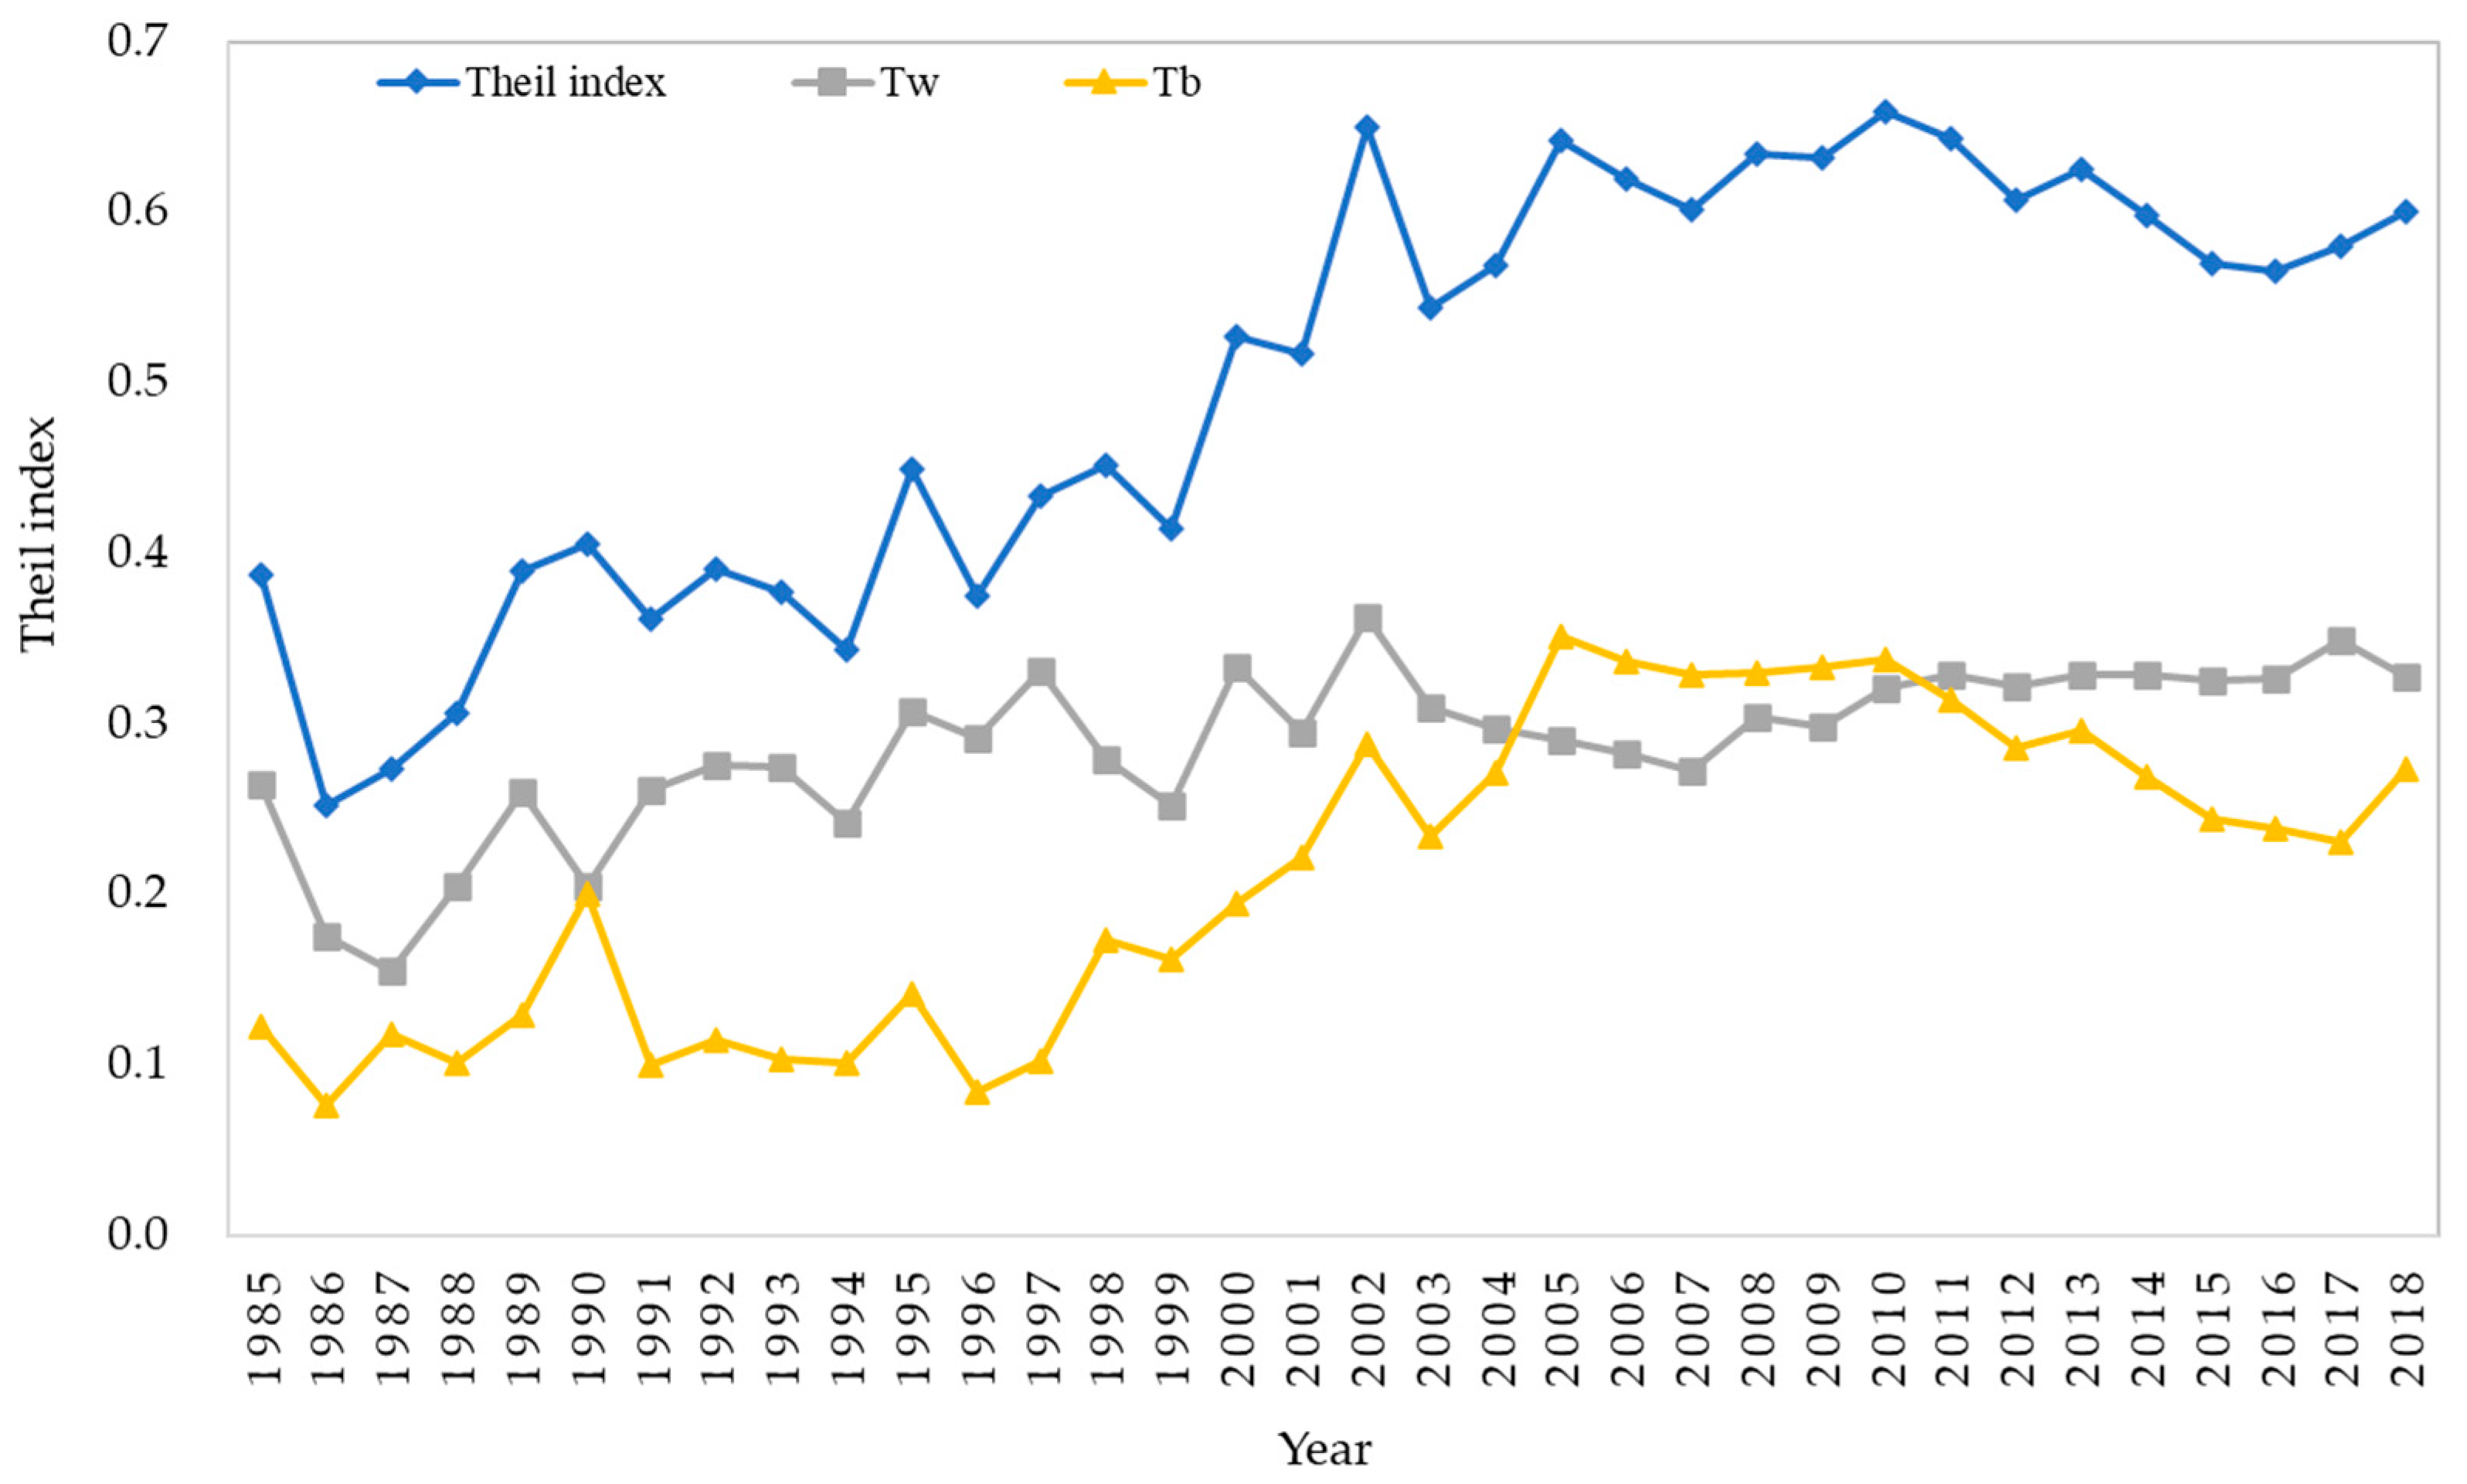
Referring to existing research, 31 provinces or cities in China are divided into four regions (east, northeast, central and west). The eastern region includes 10 provinces or cities, namely Shandong, Beijing, Hebei, Tianjin, Jiangsu, Shanghai, Zhejiang, Fujian, Guangdong and Hainan. Northeast China includes three provinces; namely Heilongjiang, Jilin and Liaoning. The central region includes six provinces; namely Henan, Shanxi, Anhui, Hubei, Hunan and Jiangxi. The western region includes 12 provinces or cities; namely Shaanxi, Ningxia, Qinghai, Xinjiang, Gansu, Tibet, Yunnan, Sichuan, Chongqing, Guizhou, Inner Mongolia and Guangxi. The variation of Theil index and the intra-regional (Tw) and interregional (Tb) differences with time are shown in Figure 4.
As can be seen from Figure 4, the Theil index shows an increasing trend as a whole, from 0.39 in 1985 to 0.60 in 2018, indicating that the difference in green invention patent applications among provinces or cities was expanding. According to the decomposition results of Theil index in Figure 4, the intra-regional difference is the main source of the total difference, and the average contribution to the total difference was 59%. The difference within the western region was the largest. In 2018, the Theil index of the western region reached 0.48, and the polarization characteristics were the most significant. The Theil index of the eastern region was 0.33 in 2018. The Theil indices of the central region and the northeast region in 2018 were 0.24 and 0.10, respectively. These two regions had relatively balanced spatial distribution of green invention patent applications.
The differences among the four regions, e, northeast, central and west, showed a trend of first expanding and then narrowing. For the period 1996–2005, interregional differences showed an increasing trend as a whole. In 2005, the contribution rate of interregional differences to the total difference reached 55%. For the period 2006–2018, interregional differences fluctuated and decreased, and the contribution rate of interregional differences to the total difference decreased to 46% in 2018. To a certain extent, this was related to the implementation of the western development strategy. On December 8, 2006, the executive meeting of the State Council deliberated on and approved the Eleventh Five Year Plan for Western Development. Since then, the differences in the level of green scientific and technological innovation among China’s regions have gradually narrowed. In addition, in 2006, the State Council issued the outline of the national medium- and long-term science and technology development plan (2006–2020) [31], marking the fact that China’s regional innovation has entered the stage of coordinated development. Therefore, since 2006, the differences in regional invention patent applications have been shrinking.
4.2.3. Spatial Correlation Analysis
The results of Global Moran’s I are shown in Table 1. As can be seen from Table 1, only the Global Moran Index in 1988 was significantly positive, at the level of 1%, and the Global Moran Index in other years was insignificant. Therefore, there was no significant spatial correlation between the number of green invention patent applications in China, and the spatial spillover effect of green invention patent applications was unobvious. Incentive policies should be formulated to encourage demonstration of leading roles for regions with high innovation levels.
4.3. Spatiotemporal Transfer
4.3.1. Interregional Transfer
In order to further analyze the spatiotemporal transfer characteristics of green invention patent applications, the cumulative number of green invention patent applications in different time periods in the four regions is shown in Figure 5.
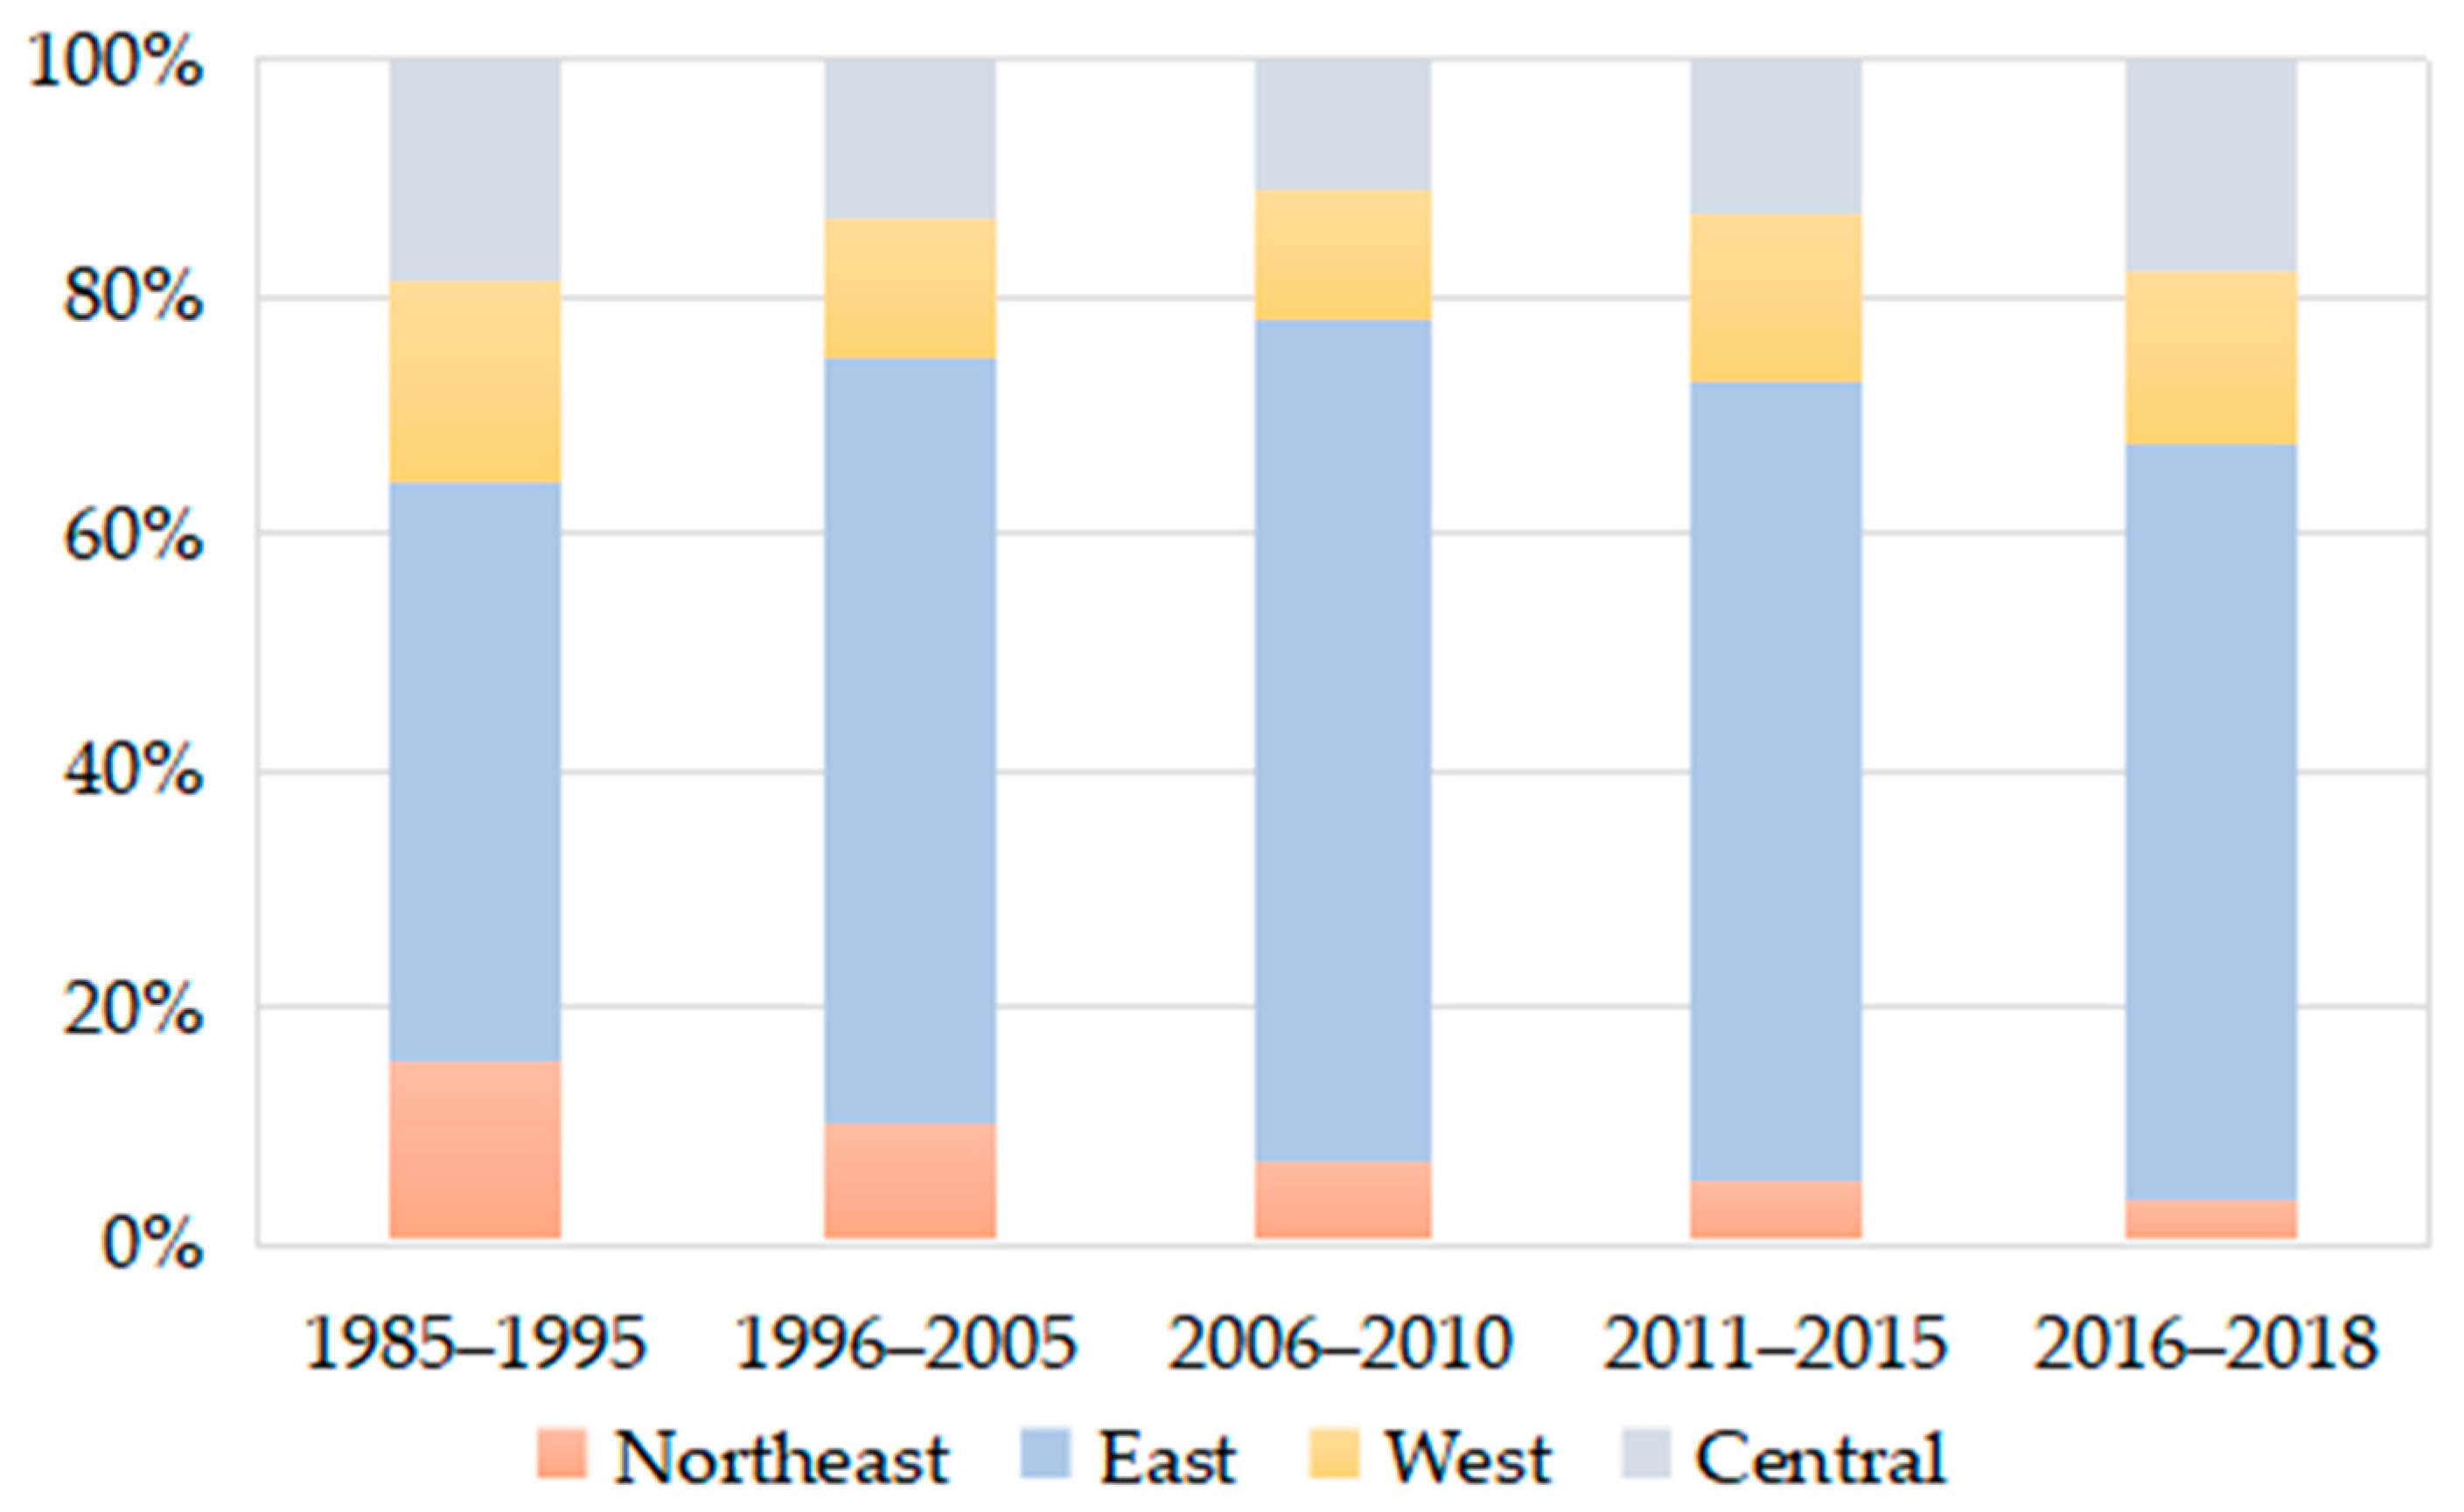
As can be seen from Figure 5, green invention patent applications are mainly concentrated in the eastern region, followed by the central region, and less so in the western and northeast regions. The details are as follows:
In the first stage (1985–1995), the number of green invention patent applications in the eastern region accounted for 49% of the total number of applications in the four regions, and the central, western and northeast regions accounted for 19%, 17% and 15%, respectively.
In the second stage (1996–2005), the proportion of green invention patent applications in the eastern region further increased (up to 64%), and the proportion in the central, western and northeast regions decreased to 14%, 12% and 10%, respectively.
During the third stage of the Eleventh Five Year Plan period (2006–2010), the proportion of green invention patent applications in the eastern region reached the highest (71%), and the proportion in the central, western and northeast regions decreased to 11%, 11% and 7%, respectively.
In the fourth stage, i.e., the 12th Five Year Plan period (2011–2015), the proportion of central and western regions increased, especially the western region. Among them, the proportion of the western region increased to 14%, and that of the central region increased to 13%. The proportion of the eastern and northeast regions decreased.
During the first three years of the 13th Five Year Plan period (2016–2018), the proportion of the central region increased significantly (reaching 18%), the western region remained unchanged (14%), and the proportion of the eastern region and the northeast region decreased to 64% and 4%, respectively.
To sum up, in the first, second and third stages, the proportion of green invention patent applications in the east region continued to increase, and that in other regions continued to decrease. The fourth and fifth stages showed the phenomenon of transfer from the east to the central and west. The proportion of the central and west increased while the proportion of the east and northeast decreased. To some extent, this is related to the implementation of the western development strategy. With the implementation of the overall planning and coordination policy of regional innovation, the green invention patent applications levels of the central and western regions have improved.
4.3.2. Intra-Regional Transfer
In order to further analyze the temporal and spatial transfer characteristics of green invention patent applications among provinces in the region, the cumulative number of green invention patent applications in different time periods is drawn in Figure 6.
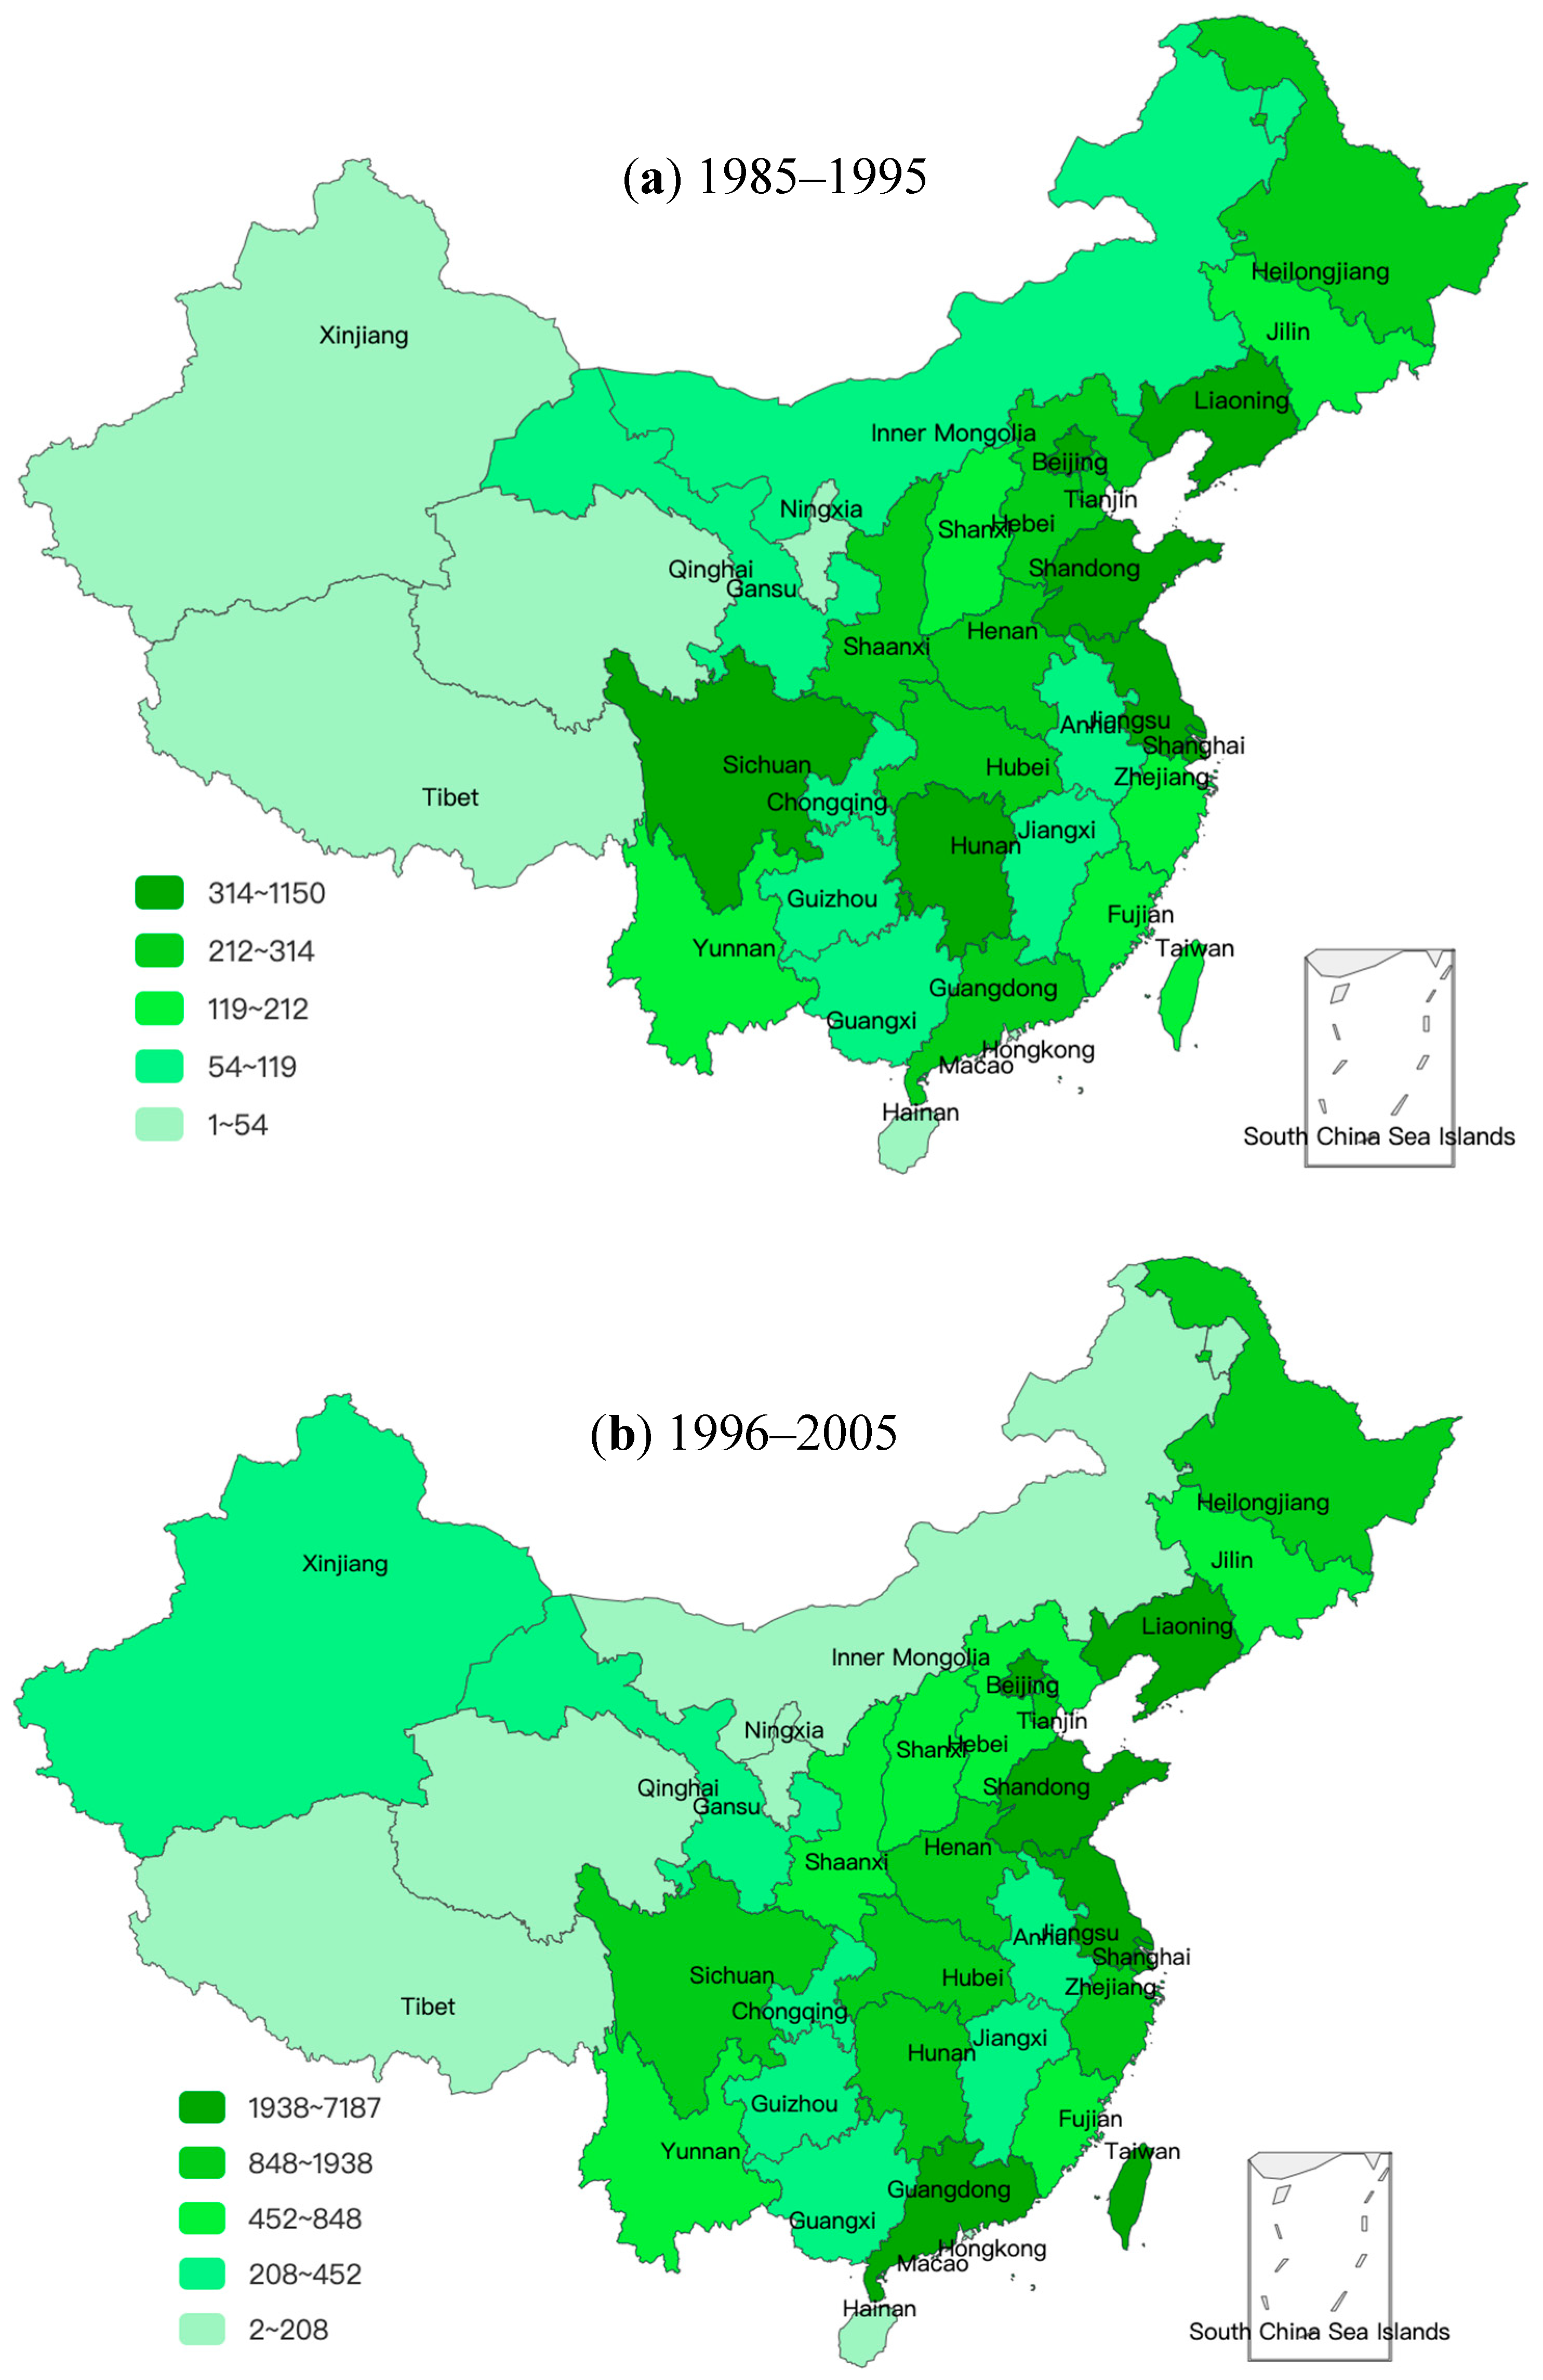
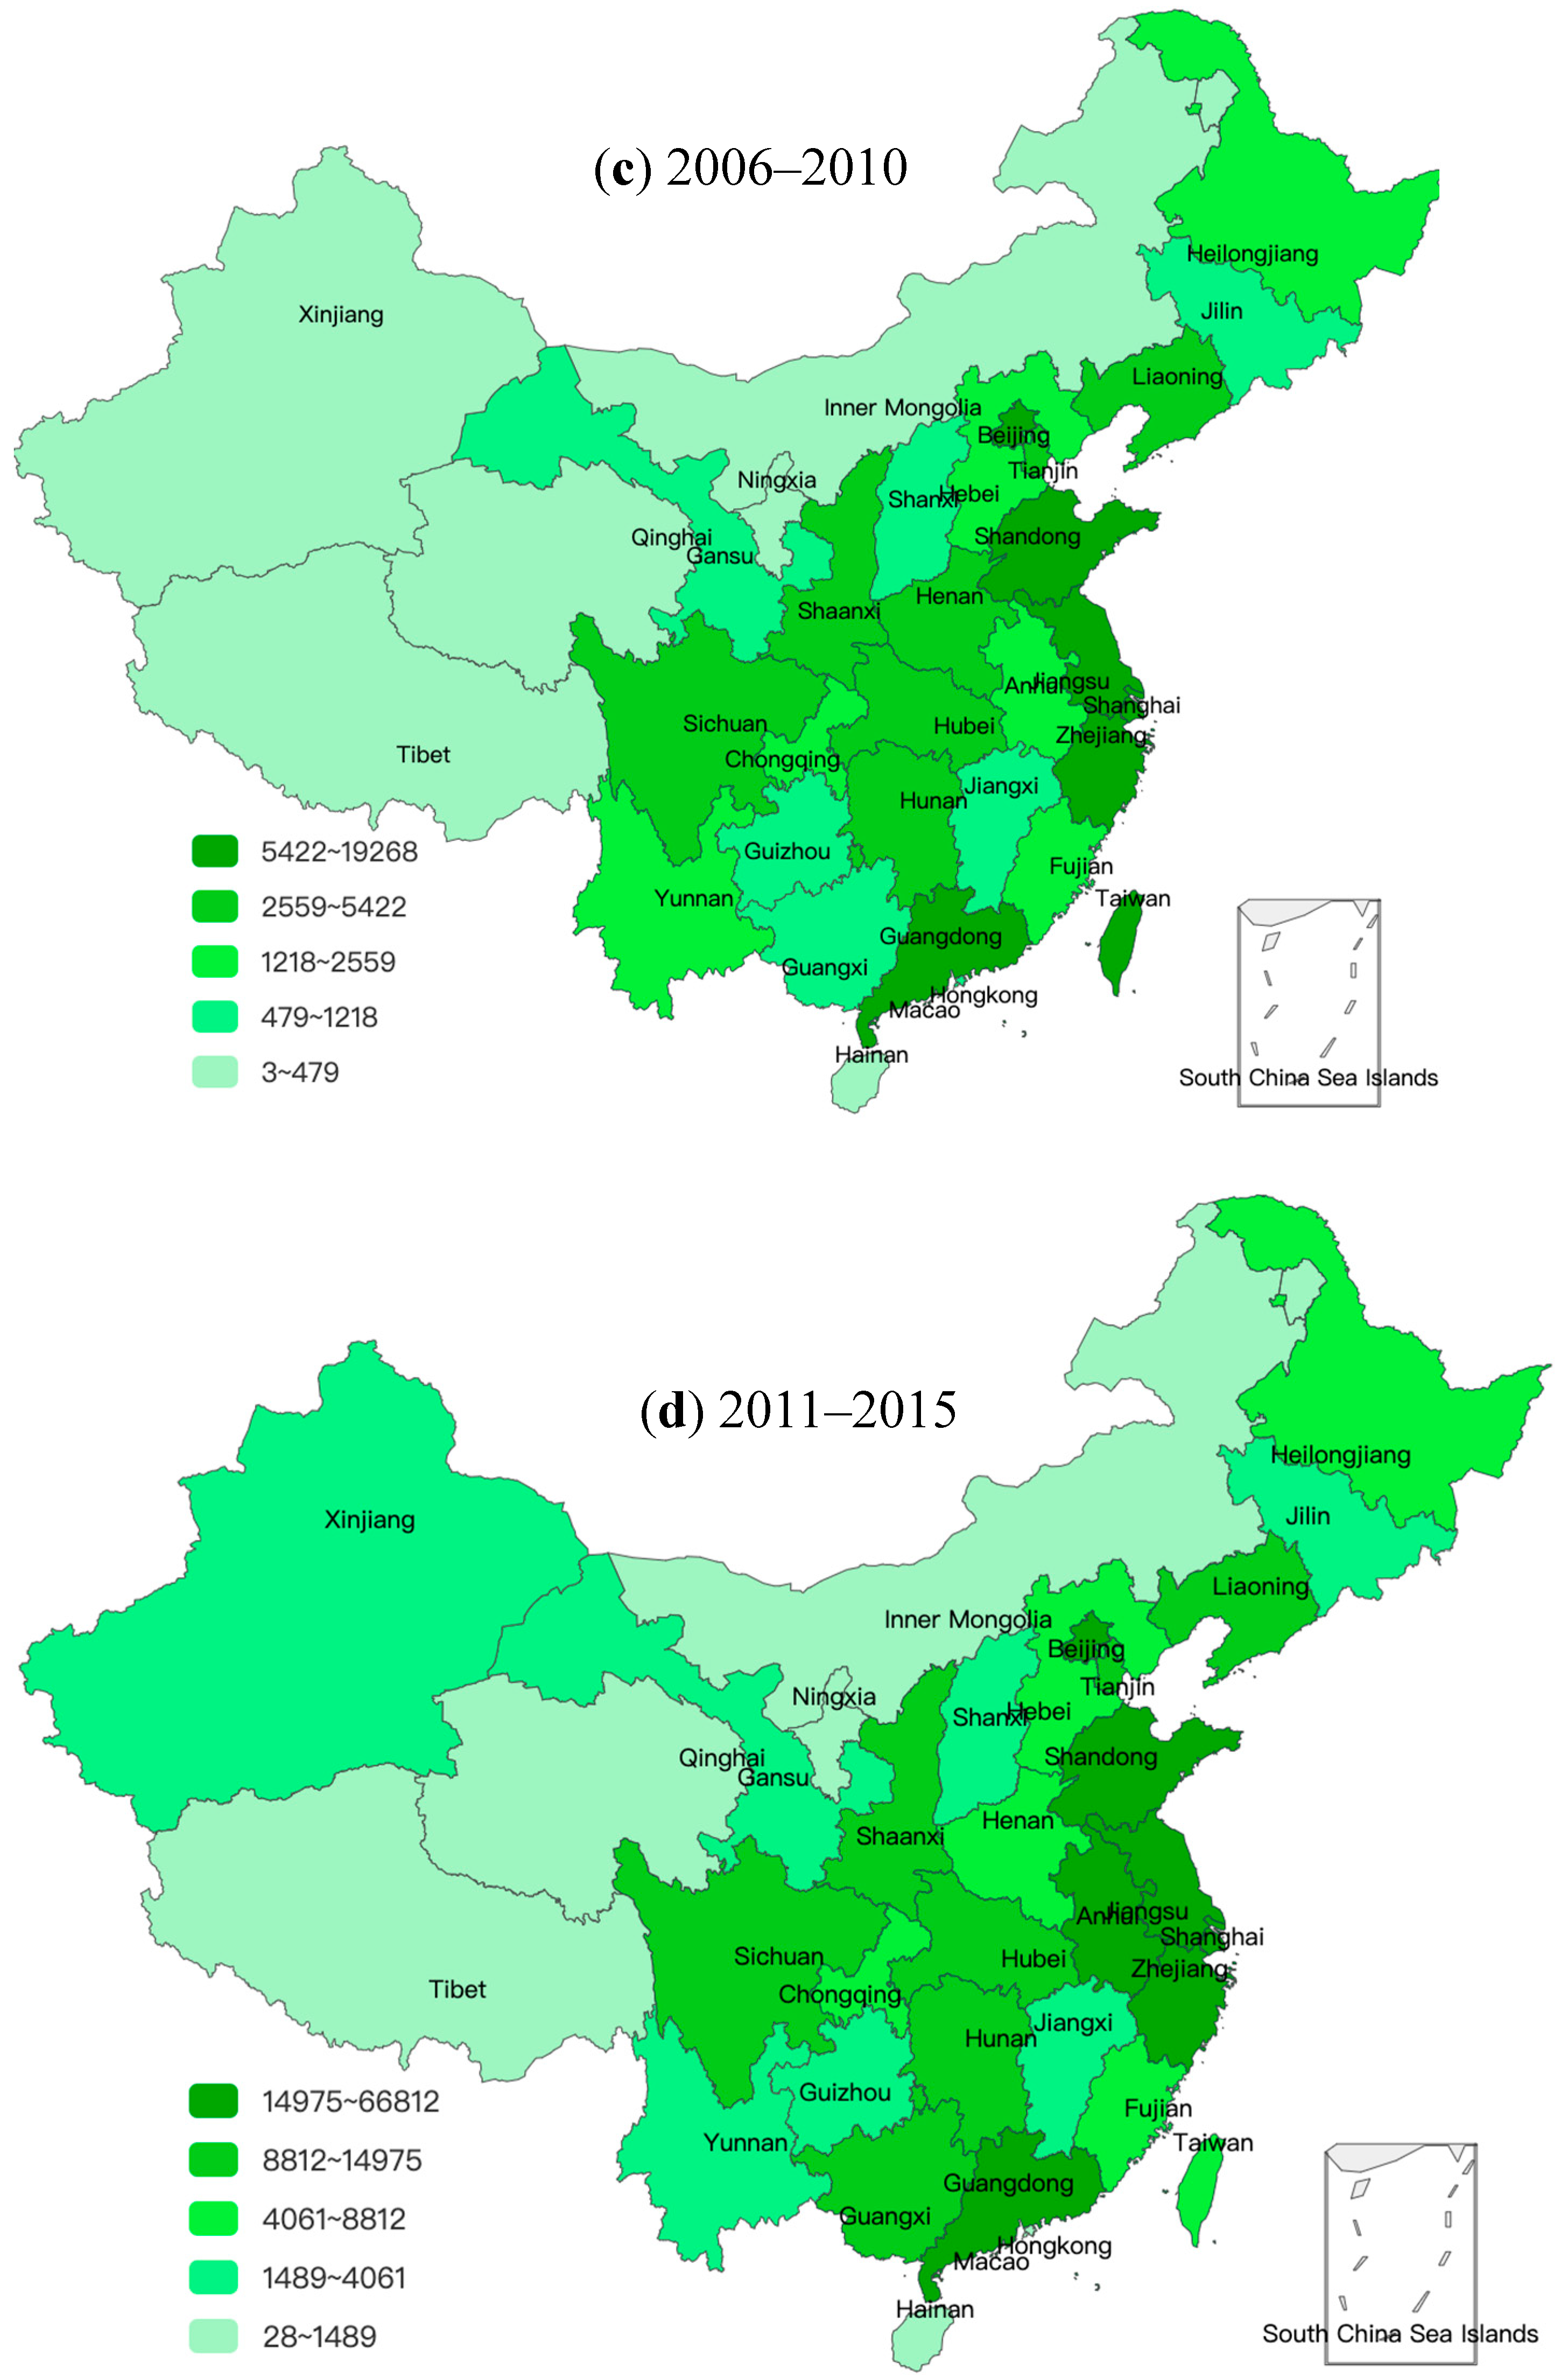
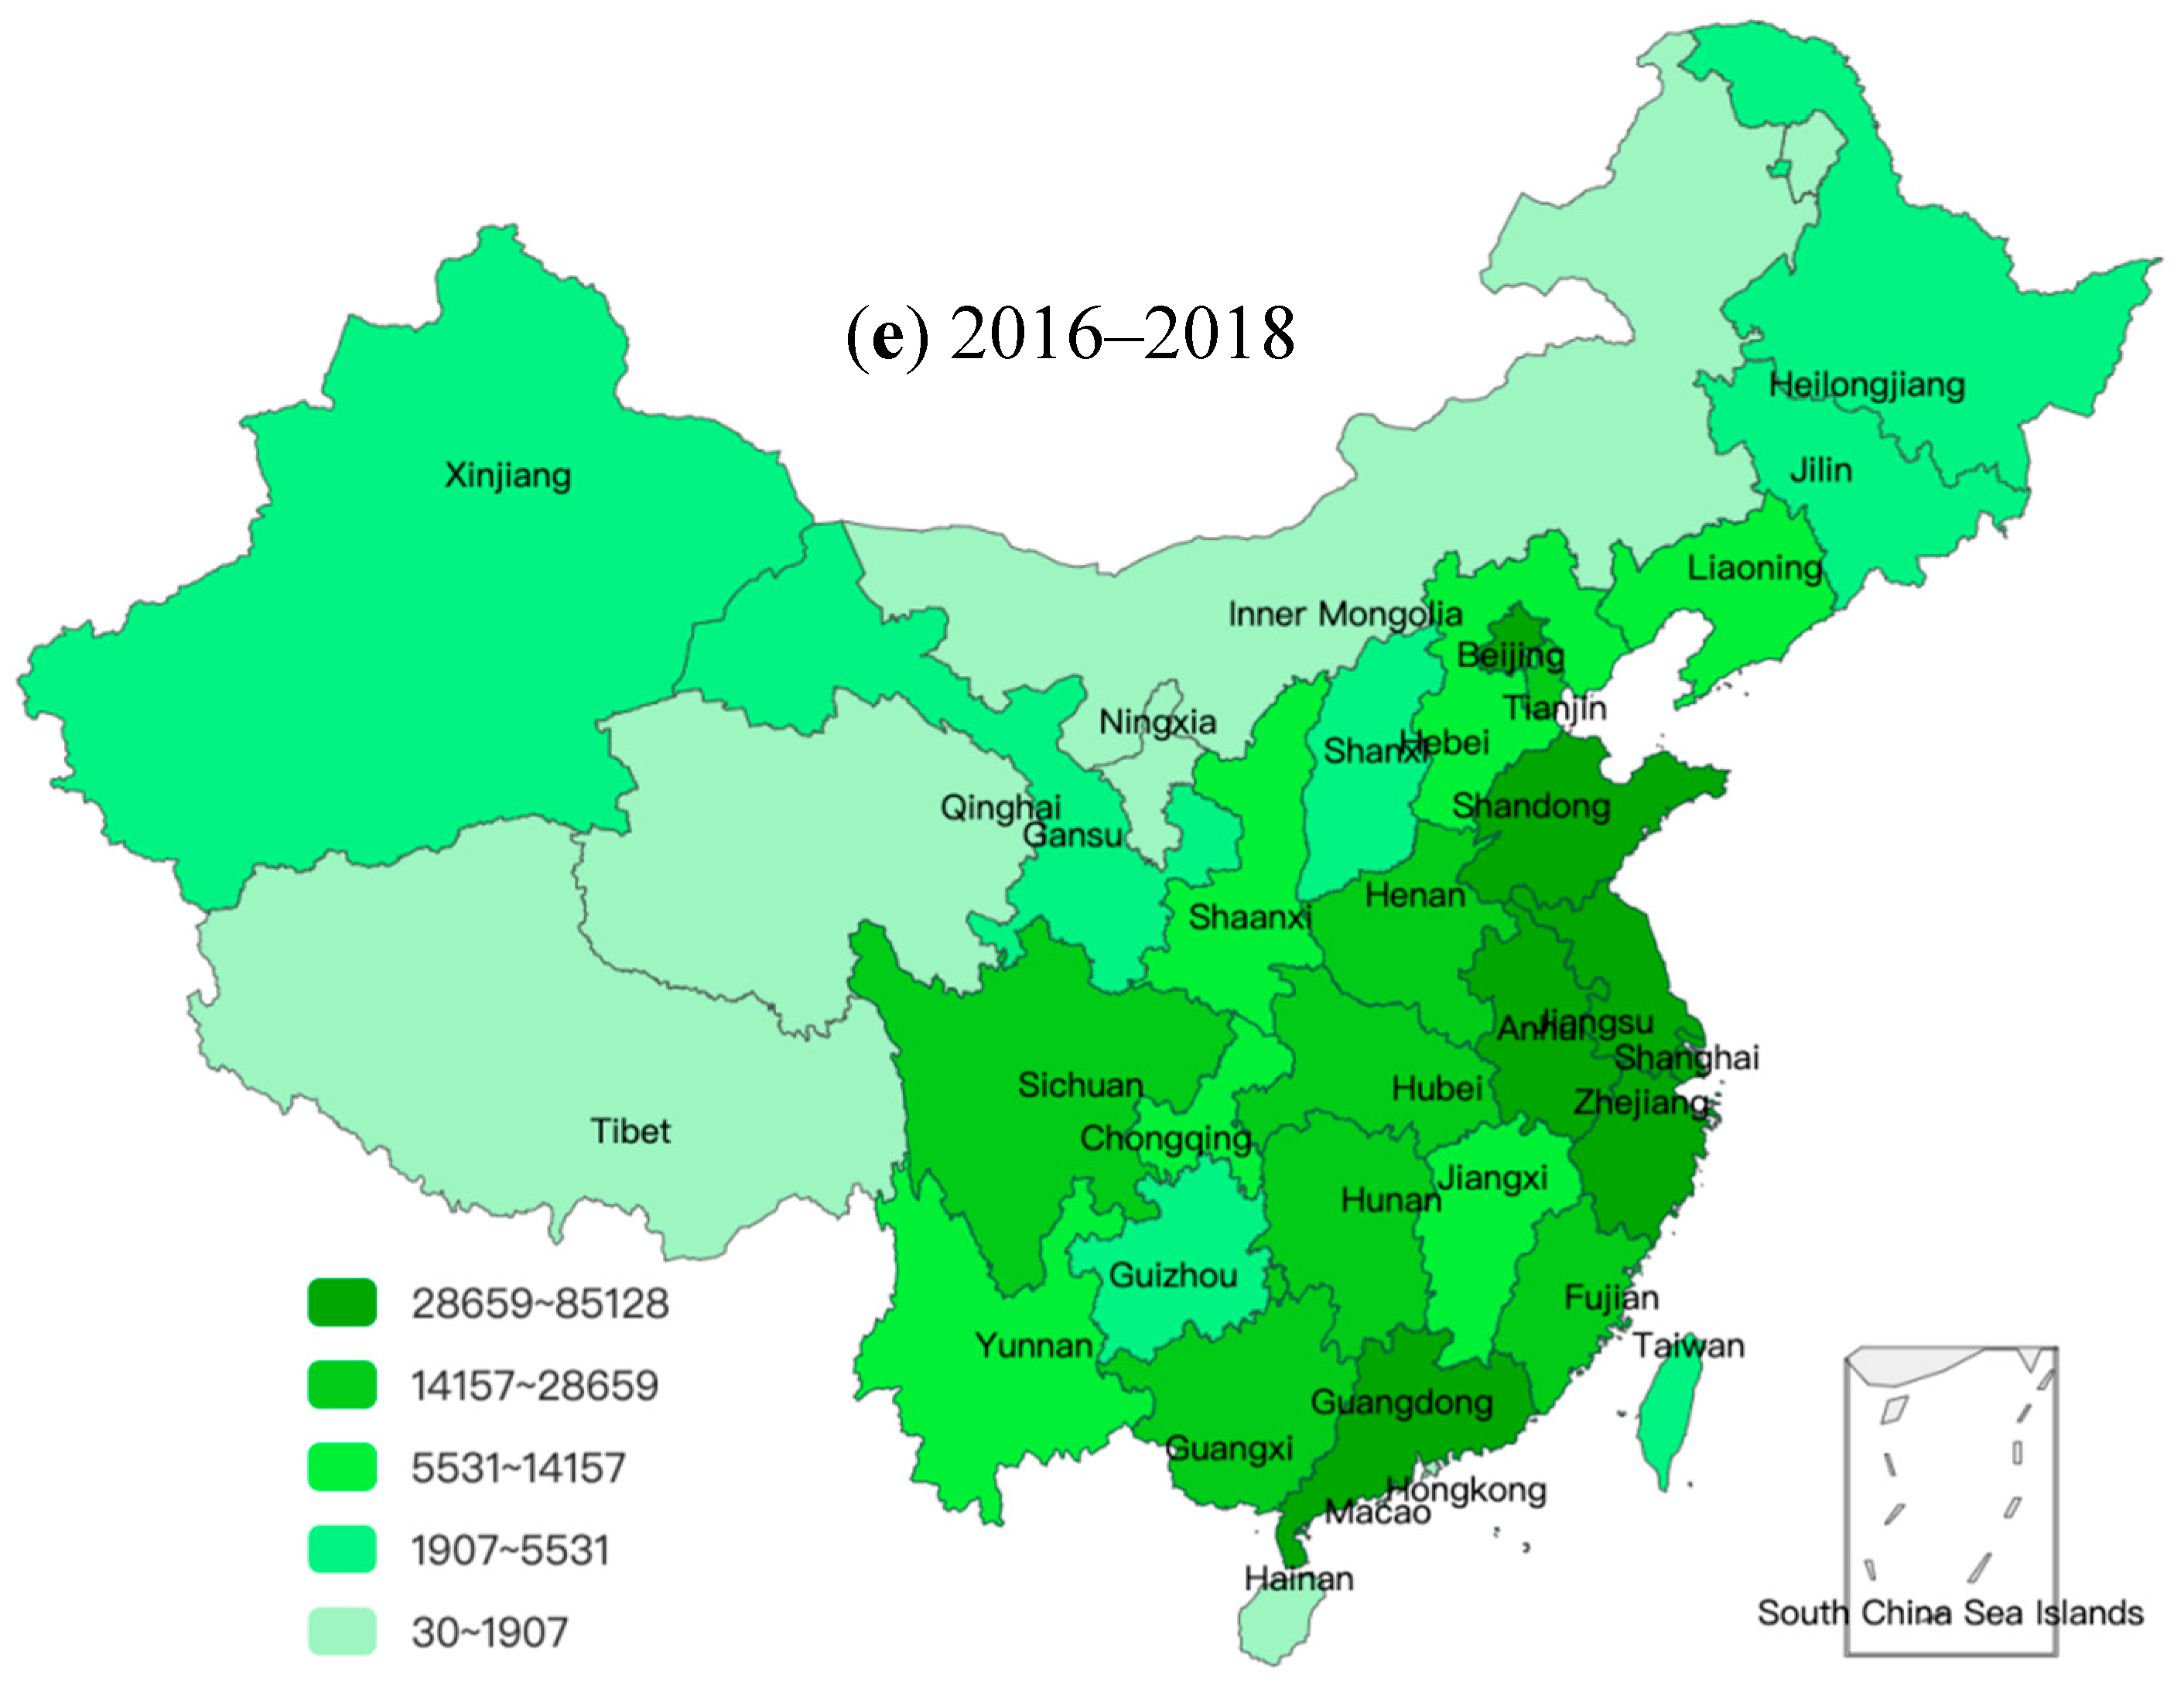
As can be seen from Figure 6, green invention patent applications in the eastern region are mainly concentrated in Beijing, Guangdong, Jiangsu, Zhejiang, Shanghai and Shandong, and less so in Tianjin, Fujian, Hebei and Hainan. At different stages, the agglomeration provinces or cities are different. The province or city with the largest proportion showed the transfer direction of Beijing → Shanghai → Guangdong → Jiangsu. In the first stage (1985–1995), Beijing accounted for the largest proportion (accounting for 33% of green invention patent applications in the eastern region), followed by Shandong (12%) and Jiangsu (12%). In the second stage (1996–2005), the proportions for Shanghai (15%) and Guangdong (14%) increased, and the proportion for Shandong (9%) decreased. In the third stage (2006–2010), the proportions for Guangdong (18%) and Jiangsu (18%) increased and that of Beijing (23%) decreased. In the fourth stage (2011–2015), the proportion for Jiangsu (25%) continued to increase, while those for Shanghai, Guangdong and Beijing all decreased. In the fifth stage (2016–2018), the proportions for Zhejiang (12%) and Guangdong (22%) increased, while those of Beijing, Jiangsu and Shanghai decreased.
Green invention patent applications in northeast China are mainly concentrated in Liaoning (the fifth stage accounts for 56% of the green invention patent applications in northeast China), followed by Heilongjiang (25%), and Jilin (19%). The phenomenon of spatial transfer in this region is unobvious, and the proportion of provinces is relatively stable.
Green invention patent applications in the central region are mainly concentrated in Anhui (the fifth stage accounts for 40% of the green invention patent applications in the central region), Hubei (19%), Hunan (17%) and Henan (15%). The province or city with the largest proportion in the five stages shows the direction of Hunan → Hubei → Anhui. Among them, the application volume in Anhui increases the fastest, from 8% to 40% of the application volume in the central region. The applications of Jiangxi and Shanxi in the central region are small, and the applications in the fifth stage account for 5% and 4% of the central region respectively. These two provinces can appropriately adjust green innovation incentive policies to enhance their green innovation output.
Green invention patent applications in the western region are mainly concentrated in Sichuan (accounting for 33% of green invention patent applications in the Western region in the fifth stage), Guangxi (18%), Shaanxi (16%) and Chongqing (10%). Yunnan, which accounted for a relatively high proportion in the first and second stages, decreased its proportion after the third stage. The proportion of Chongqing increased significantly in the third stage, from 9% in the second stage to 14% in the third stage. However, the proportions for Guizhou, Gansu, Xinjiang, Inner Mongolia, Ningxia, Qinghai and Tibet have been relatively small.
Overall, the number of green invention patent applications in the four regions has also undergone spatial transfer. The innovation level of green invention patents in some provinces in each region has been low. These provinces should appropriately adjust incentive policies for green innovation and improve the level of green innovation. In addition, we should promote the spillover effect of regions with high innovation levels and promote balanced development of green innovation in all provinces or cities in the regions.
5. Conclusions
Using invention patent application data from 1985 to 2018, this study analyzed temporal and spatial characteristics of green invention patent applications. The results show that the development of green invention patent applications in China presents five stages: slow development → slow growth → accelerating growth → rapid growth → booming. The applications of green invention patents in the fields of energy conservation, alternative energy production and waste management have always been in the lead, while the number of green invention patent applications in transportation and nuclear power is relatively low. These two categories need to be further strengthened. Green invention patent applications show a high level of geographical agglomeration in space. Green invention patent applications are mainly concentrated in the eastern region, followed by the central region, western and northeast regions. The differences among the four regions show a trend of first expanding and then narrowing during the study period. The intra-regional differences are the main source of spatial differences. The number of green invention patent applications in the four regions also shifted spatially during the research period.
The temporal and spatial evolution of green invention patent applications is consistent with green technology innovation policies implemented by the country and in various regions at different stages. During the first two stages, innovation policies promoted the development of scientific and technological innovation, but did not emphasize green technology innovation. The growth of green invention patent applications was relatively slow. From the third stage, China took the development of energy conservation, renewable energy production, and waste management as key areas and priority themes of technological development. The green invention patent applications in Category 1 (alternative energy production), Category 3 (energy conservation), and Category 4 (waste management) increased rapidly. The differences among the four regions of the east, northeast, central and west showed a narrowing trend from stage 3. This was related to the Eleventh Five Year Plan for Western Development, introduced in 2006. Moreover, the variation in degree of provincial governments’ emphases on green innovation also impacted on intra-regional differences.
From a theoretical perspective, the results of this study show the importance of paying attention to the different categories of green invention patent applications. Previous studies [12,15,17,24] have not subdivided the categories of green innovation, or they only analyzed one category of green innovation, such as renewable energy [5], solar energy [18] and smart grid technology [26], making it difficult to thoroughly analyze the development of the seven specific categories of green innovation. Future research on the impacts of policies on green innovation needs to clearly identify the category of green innovation and include more categories in any analysis. In addition, the spatial evolution characteristics within a region have been revealed. Existing studies [22,25] mainly focused on inter-regional differences, while neglecting intra-regional differences. Future studies on innovation policies should emphasize intra-regional differences.
In view of the unbalanced development of green invention patent applications in both categories and regions, the following innovation policy suggestions are put forward. First, formulate policies to guide the development of green technology innovation in transportation. In 2020, the general office of China’s State Council issued the development plan for new energy vehicle industry (2021–2035), pointing out that the development of new energy vehicles is a strategic measure to deal with climate change and promote green development. It is necessary to promote the development of intelligent green logistics systems and an efficient recycling system for batteries [41]. All provinces and regions should formulate policies to support the innovation of green technology in transportation.
Second, in view of the unbalanced development of green invention patent applications in various regions, we should further promote the demonstration and driving role of regions with high innovation levels. In addition, regions with reduced innovation levels, such as Beijing, Shandong, Guangdong and Shanghai, or regions with low innovation levels, such as Hebei, Jiangxi, Shanxi, Guizhou and Gansu, could promote participation of local enterprises in identification of enterprises promoting green technology innovation, by formulating a green rating system, implementing fiscal and tax incentives, expanding government green procurement and other policies. In 2019, the National Development and Reform Commission and the Ministry of Science and Technology of China jointly issued the guiding opinions on building a market-oriented green technology innovation system, pointing out that by 2022, a market-oriented green technology innovation system should be built, and a number of leading enterprises should be cultivated [3]. With the development of green technology innovation enterprises, the level of green technology innovation in various regions will continue to improve.
This study also has some limitations. First, we found that the development path of green invention patent applications in five stages are consistent with the development of innovation policies. However, we have not analyzed the impacts of policies and incentives on patent applications through empirical research methods, such as the regression model and index decomposition model. We can investigate this further in future studies. Second, the data used in this study were green invention patent applications from the SIPO. Green invention patent grants data or R and D expenditures data, which can also represent innovative activity, were not analyzed. It would be interesting to compare findings using such different data in future studies.
Author Contributions
Conceptualization and methodology, H.W.; formal analysis: H.W. and M.L.; writing—original draft preparation, H.W. and M.L.; writing—review and editing, Z.W.; visualization, X.Z.; funding acquisition, H.W., M.L. and Z.W. All authors have read and agreed to the published version of the manuscript.
Funding
This research was funded by the National Natural Science Foundation of China (71903013 and 72101028), Emergency project of National Natural Science Foundation of China (71641027), the Fundamental Research Funds for the Central Universities (FRF-BR-19-004B, FRF-BR-20-03A), the Fundamental Research Funds for Beijing University of Civil Engineering and Architecture (X20042), and Beijing Postdoctoral Science Fund (21009919006).
Institutional Review Board Statement
Not applicable.
Informed Consent Statement
Not applicable.
Data Availability Statement
The data are available upon request.
Acknowledgments
The authors would also like to thank the anonymous reviewers, whose comments and suggestions helped us to improve the paper. We would like to acknowledge the experts who provided suggestions.
Conflicts of Interest
The authors declare no conflict of interest.
References
- Peng, W.; Yin, Y.; Kuang, C.; Wen, Z.; Kuang, J. Spatial spillover effect of green innovation on economic development quality in China: Evidence from a panel data of 270 prefecture-level and above cities. Sustain. Cities Soc. 2021, 69, 102863. [Google Scholar] [CrossRef]
- TheStateCouncil. The Outline of the National Innovation Development Strategy to Encourage the Development of Green Technology. 2016. Available online: http://www.scio.gov.cn/xwfbh/xwbfbh/wqfbh/33978/34585/xgzc34591/Document/1478339/1478339_1.htm (accessed on 8 March 2022).
- NdrcandMst. The Guiding Opinions on Building a Market-Oriented Green Technology Innovation System. 2019. Available online: https://www.ndrc.gov.cn/xxgk/zcfb/tz/201904/t20190419_962441.html?code=&state=123 (accessed on 8 March 2022).
- The State Council. The Action Plan for Reaching the Peak of Carbon Emission by 2030. 2021. Available online: http://www.gov.cn/zhengce/content/2021–10/26/content_5644984.htm (accessed on 8 March 2022).
- Bai, C.; Feng, C.; Du, K.; Wang, Y.; Gong, Y. Understanding spatial-temporal evolution of renewable energy technology innovation in China: Evidence from convergence analysis. Energy Policy 2020, 143, 111570. [Google Scholar] [CrossRef]
- Ye, C.; Yu, X.; Li, W. Empirical Analysis on Evolution and Small World Effect of Chinese Enterprise-Enterprise Patent Cooperation Network: From the Perspective of Open Innovation. Information 2013, 4, 398–410. [Google Scholar] [CrossRef] [Green Version]
- Zhang, X.; Geng, Y.; Tong, Y.W.; Kua, H.W.; Tian, X.; Wu, R.; Zhao, X.; Chiu, A.S.F. Spatial characteristics and its driving factors of low-carbon energy technology innovation in China: A gravity movement and exploratory spatial data analysis. J. Clean. Prod. 2021, 295, 126481. [Google Scholar] [CrossRef]
- Li, F.; Liu, W.; Bi, K. Exploring and visualizing spatial-temporal evolution of patent collaboration networks: A case of China’s intelligent manufacturing equipment industry. Technol. Soc. 2021, 64, 101483. [Google Scholar] [CrossRef]
- Albino, V.; Ardito, L.; Dangelico, R.M.; Petruzzelli, A.M. Understanding the development trends of low-carbon energy technologies: A patent analysis. Appl. Energy 2014, 135, 836–854. [Google Scholar] [CrossRef]
- Chen, J.; Cheng, J.H.; Dai, S. Regional eco-innovation in China: An analysis of eco-innovation levels and influencing factors. J. Clean. Prod. 2017, 153, 1–14. [Google Scholar] [CrossRef]
- Hou, J.; Chen, H.; Xu, J.Z. External Knowledge Sourcing and Green Innovation Growth with Environmental and Energy Regulations: Evidence from Manufacturing in China. Sustainability 2017, 9, 342. [Google Scholar] [CrossRef] [Green Version]
- Zhou, X.; Yu, Y.; Yang, F.; Shi, Q. Spatial-temporal heterogeneity of green innovation in China. J. Clean. Prod. 2020, 282, 124464. [Google Scholar] [CrossRef]
- Yin, S.; Zhang, N.; Li, B.; Dong, H. Enhancing the effectiveness of multi-agent cooperation for green manufacturing: Dynamic co-evolution mechanism of a green technology innovation system based on the innovation value chain. Environ. Impact Assess. Rev. 2021, 86, 106475. [Google Scholar] [CrossRef]
- Lai, X.; Liu, J.; Shi, Q.; Georgiev, G.; Wu, G. Driving forces for low carbon technology innovation in the building industry: A critical review. Renew. Sustain. Energy Rev. 2017, 74, 299–315. [Google Scholar] [CrossRef]
- Liu, Y.; Liu, S.; Shao, X.; He, Y. Policy spillover effect and action mechanism for environmental rights trading on green innovation: Evidence from China’s carbon emissions trading policy. Renew. Sustain. Energy Rev. 2022, 153, 111779. [Google Scholar] [CrossRef]
- Zhu, J.; Fan, Y.; Deng, X.; Xue, L. Low-carbon innovation induced by emissions trading in China. Nat. Commun. 2019, 10, 4088. [Google Scholar] [CrossRef] [PubMed] [Green Version]
- Cui, J.; Dai, J.; Wang, Z.; Zhao, X. Does Environmental Regulation Induce Green Innovation? A Panel Study of Chinese Listed Firms. Technol. Forecast. Soc. Change 2022, 176, 121492. [Google Scholar] [CrossRef]
- Luan, C.; Sun, X.; Wang, Y. Driving forces of solar energy technology innovation and evolution. J. Clean. Prod. 2021, 287, 125019. [Google Scholar] [CrossRef]
- Li, G.; Xue, Q.; Qin, J. Environmental information disclosure and green technology innovation: Empirical evidence from China. Technol. Forecast. Soc. Change 2022, 176, 121453. [Google Scholar] [CrossRef]
- Li, X. Behind the recent surge of Chinese patenting: An institutional view. Res. Policy 2012, 41, 236–249. [Google Scholar] [CrossRef]
- Phillips, P.C.B.; Sul, D. Transition modeling and econometric convergence tests. Econometrica 2007, 75, 1771–1855. [Google Scholar] [CrossRef] [Green Version]
- Ying, L.; Li, M.; Yang, J. Agglomeration and driving factors of regional innovation space based on intelligent manufacturing and green economy. Environ. Technol. Innov. 2021, 22, 101398. [Google Scholar] [CrossRef]
- Fan, J.; Xiao, Z. Analysis of spatial correlation network of China’s green innovation. J. Clean. Prod. 2021, 299, 126815. [Google Scholar] [CrossRef]
- Liu, Y.; Shao, X.; Tang, M.; Lan, H. Spatio-temporal evolution of green innovation network and its multidimensional proximity analysis: Empirical evidence from China. J. Clean. Prod. 2021, 283, 124649. [Google Scholar] [CrossRef]
- Zhao, G.; Zhou, P.; Wen, W. What cause regional inequality of technology innovation in renewable energy? Evidence from China. Appl. Energy 2022, 310, 118464. [Google Scholar] [CrossRef]
- Bai, Y.; Chou, L.; Zhang, W. Industrial innovation characteristics and spatial differentiation of smart grid technology in China based on patent mining. J. Energy Storage 2021, 43, 103289. [Google Scholar] [CrossRef]
- Sinha, A. Inequality of renewable energy generation across OECD countries: A note. Renew. Sustain. Energy Rev. 2017, 79, 9–14. [Google Scholar] [CrossRef]
- Wang, H.; Cui, H.; Zhao, Q. Effect of green technology innovation on green total factor productivity in China: Evidence from spatial durbin model analysis. J. Clean. Prod. 2021, 288, 125624. [Google Scholar] [CrossRef]
- Wen, Q.; Chen, Y.; Hong, J.; Chen, Y.; Ni, D.; Shen, Q. Spillover effect of technological innovation on CO2 emissions in China’s construction industry. Build. Environ. 2020, 171, 106653. [Google Scholar] [CrossRef]
- OECD. OECD Patent Statistics Manual; OECD Publishing: Paris, France, 2009. [Google Scholar]
- Dang, J.; Motohashi, K. Patent statistics: A good indicator for innovation in China? Patent subsidy program impacts on patent quality. China Econ. Rev. 2015, 35, 137–155. [Google Scholar] [CrossRef]
- Liu, Q.; Qiu, L.D. Intermediate input imports and innovations: Evidence from Chinese firms’ patent filings. J. Int. Econ. 2016, 103, 166–183. [Google Scholar] [CrossRef]
- China’SMST. Innovation Policies. 2006. Available online: http://www.most.gov.cn/ztzl/jqzzcx/zzcxcxzzo/zzcxcxzz/zzcxgncxzz/index.html (accessed on 1 March 2022).
- National People’s Congress. The Law of the People’s Republic of China on Scientific and Technological Progress. 1993. Available online: http://www.most.gov.cn/xxgk/xinxifenlei/fdzdgknr/fgzc/flfg/200811/t20081129_65693.html (accessed on 1 March 2022).
- National People’s Congress. The Law of the People’s Republic of China on Promoting the Transformation of Scientific and Technological Achievements. 1996. Available online: http://www.npc.gov.cn/wxzl/gongbao/2000–12/05/content_5004658.htm (accessed on 1 March 2022).
- China’SMST. The Outline of Technological Innovation of the National High-Tech Industry Development Zone. 2005. Available online: http://www.most.gov.cn/xxgk/xinxifenlei/fdzdgknr/qtwj/qtwj2010before/200512/t20051214_143524.html (accessed on 1 March 2022).
- The State Council. The Outline of the National Medium and Long Term Science and Technology Development Plan (2006–2020). 2006. Available online: http://www.scio.gov.cn/32344/32345/35889/36946/xgzc36952/document/1558921/1558921.htm (accessed on 1 March 2022).
- China’SMST. The National 12th Five Year Plan for Science and Technology Development. 2011. Available online: http://www.cutech.edu.cn/cn/rxcz/2011/07/1308270514779582.htm (accessed on 1 March 2022).
- China’SMST. The 12th Five Year Plan for the Development of Green Manufacturing Technology. 2012. Available online: http://www.most.gov.cn/tztg/201204/t20120424_93837.html (accessed on 1 March 2022).
- The State Council. The 13th Five-Year Plan for National Scientific and Technological Innovation. 2016. Available online: http://www.gov.cn/zhengce/content/2016–08/08/content_5098072.htm (accessed on 1 March 2022).
- The State Council. The Development Plan for New Energy Vehicle Industry (2021–2035). 2020. Available online: http://www.gov.cn/zhengce/content/2020–11/02/content_5556716.htm (accessed on 1 March 2022).
Figure 1.
Number of green invention patent applications for the period 1985–2018.

Figure 2.
Number of green invention patent applications of seven categories for the period 1985–2018. (a): the first stage (1985–1995). (b): the second stage (1996–2005). (c): the third stage (2006–2010). (d): the fourth stage (2011–2015). (e): the fifth stage (2016–2018).
Figure 2.
Number of green invention patent applications of seven categories for the period 1985–2018. (a): the first stage (1985–1995). (b): the second stage (1996–2005). (c): the third stage (2006–2010). (d): the fourth stage (2011–2015). (e): the fifth stage (2016–2018).

Figure 3.
Gini coefficient of green invention patent applications for the period 1985–2018.

Figure 4.
Theil index of green invention patent applications for the period 1985–2018.

Figure 5.
Regional distribution of green invention patent applications in different periods.

Figure 6.
Spatial distribution of green invention patent applications in different periods. (a): the first stage (1985–1995). (b): the second stage (1996–2005). (c): the third stage (2006–2010). (d): the fourth stage (2011–2015). (e): the fifth stage (2016–2018).
Figure 6.
Spatial distribution of green invention patent applications in different periods. (a): the first stage (1985–1995). (b): the second stage (1996–2005). (c): the third stage (2006–2010). (d): the fourth stage (2011–2015). (e): the fifth stage (2016–2018).


Table 1.
Global Moran’s I for the period 1985–2018.
| Year | Moran’s I | Z | P | Year | Moran’s I | Z | P | Year | Moran’s I | Z | P |
|---|---|---|---|---|---|---|---|---|---|---|---|
| 1985 | 0.02 | 0.38 | 0.70 | 1997 | −0.06 | −0.19 | 0.85 | 2009 | −0.13 | −0.69 | 0.49 |
| 1986 | 0.11 | 0.96 | 0.34 | 1998 | −0.08 | −0.36 | 0.72 | 2010 | −0.13 | −0.71 | 0.48 |
| 1987 | 0.12 | 1.08 | 0.28 | 1999 | −0.17 | −0.98 | 0.33 | 2011 | −0.07 | −0.27 | 0.79 |
| 1988 | 0.23 | 1.86 | 0.06 | 2000 | −0.10 | −0.48 | 0.63 | 2012 | −0.06 | −0.18 | 0.85 |
| 1989 | −0.02 | 0.06 | 0.96 | 2001 | −0.10 | −0.51 | 0.61 | 2013 | −0.03 | 0.03 | 0.98 |
| 1990 | 0.06 | 0.61 | 0.54 | 2002 | −0.08 | −0.31 | 0.76 | 2014 | 0.01 | 0.30 | 0.77 |
| 1991 | 0.08 | 0.77 | 0.44 | 2003 | 0.01 | 0.26 | 0.80 | 2015 | 0.07 | 0.70 | 0.48 |
| 1992 | −0.06 | −0.23 | 0.82 | 2004 | −0.11 | −0.57 | 0.57 | 2016 | 0.09 | 0.83 | 0.41 |
| 1993 | 0.03 | 0.44 | 0.66 | 2005 | −0.10 | −0.51 | 0.61 | 2017 | 0.03 | 0.43 | 0.67 |
| 1994 | −0.01 | 0.15 | 0.88 | 2006 | −0.10 | −0.52 | 0.60 | 2018 | 0.02 | 0.37 | 0.71 |
| 1995 | 0.02 | 0.32 | 0.75 | 2007 | −0.11 | −0.57 | 0.57 | ||||
| 1996 | −0.04 | −0.09 | 0.93 | 2008 | −0.14 | −0.75 | 0.45 |
Publisher’s Note: MDPI stays neutral with regard to jurisdictional claims in published maps and institutional affiliations. |
© 2022 by the authors. Licensee MDPI, Basel, Switzerland. This article is an open access article distributed under the terms and conditions of the Creative Commons Attribution (CC BY) license (https://creativecommons.org/licenses/by/4.0/).
Share and Cite
MDPI and ACS Style
Wang, H.; Li, M.; Wang, Z.; Zhang, X. Temporal and Spatial Evolution of Green Invention Patent Applications in China. Information 2022, 13, 240. https://0-doi-org.brum.beds.ac.uk/10.3390/info13050240
AMA Style
Wang H, Li M, Wang Z, Zhang X. Temporal and Spatial Evolution of Green Invention Patent Applications in China. Information. 2022; 13(5):240. https://0-doi-org.brum.beds.ac.uk/10.3390/info13050240
Chicago/Turabian StyleWang, Hongxia, Ming Li, Zhiru Wang, and Xiaobo Zhang. 2022. "Temporal and Spatial Evolution of Green Invention Patent Applications in China" Information 13, no. 5: 240. https://0-doi-org.brum.beds.ac.uk/10.3390/info13050240
Note that from the first issue of 2016, this journal uses article numbers instead of page numbers. See further details here.