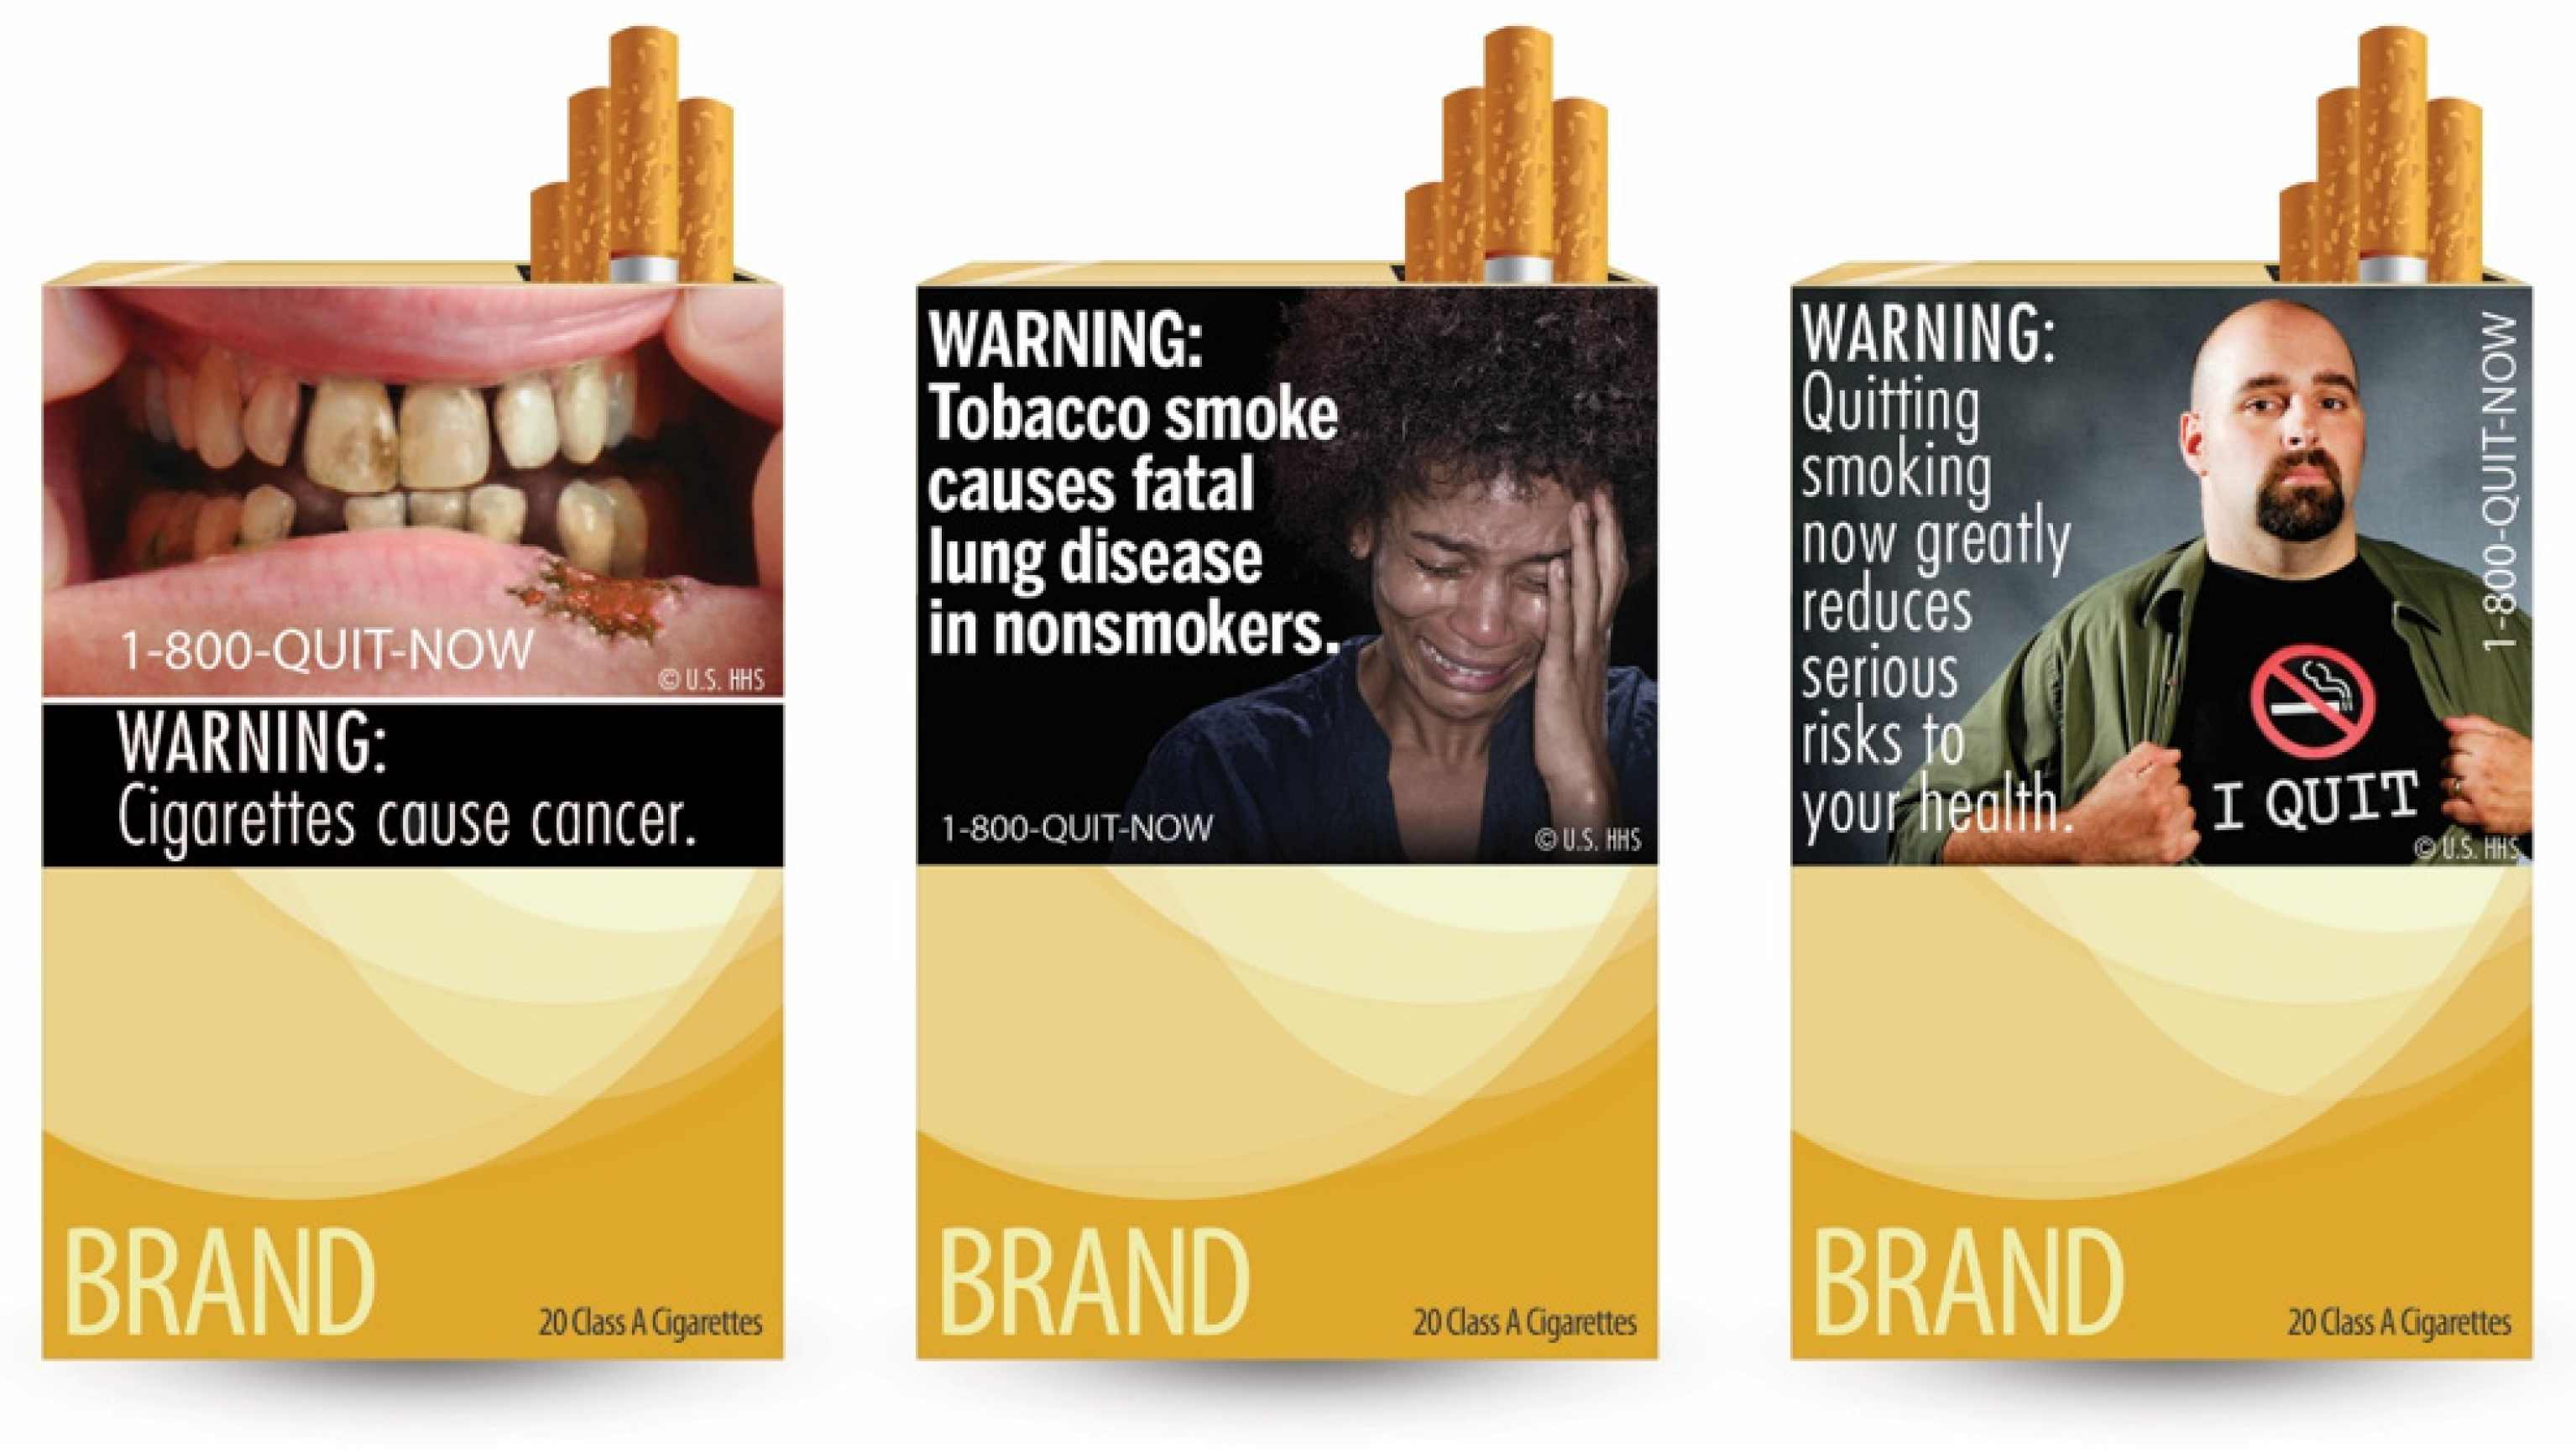
Figure 1.
The FDA’s proposed cigarette labels from 2011 [
32].
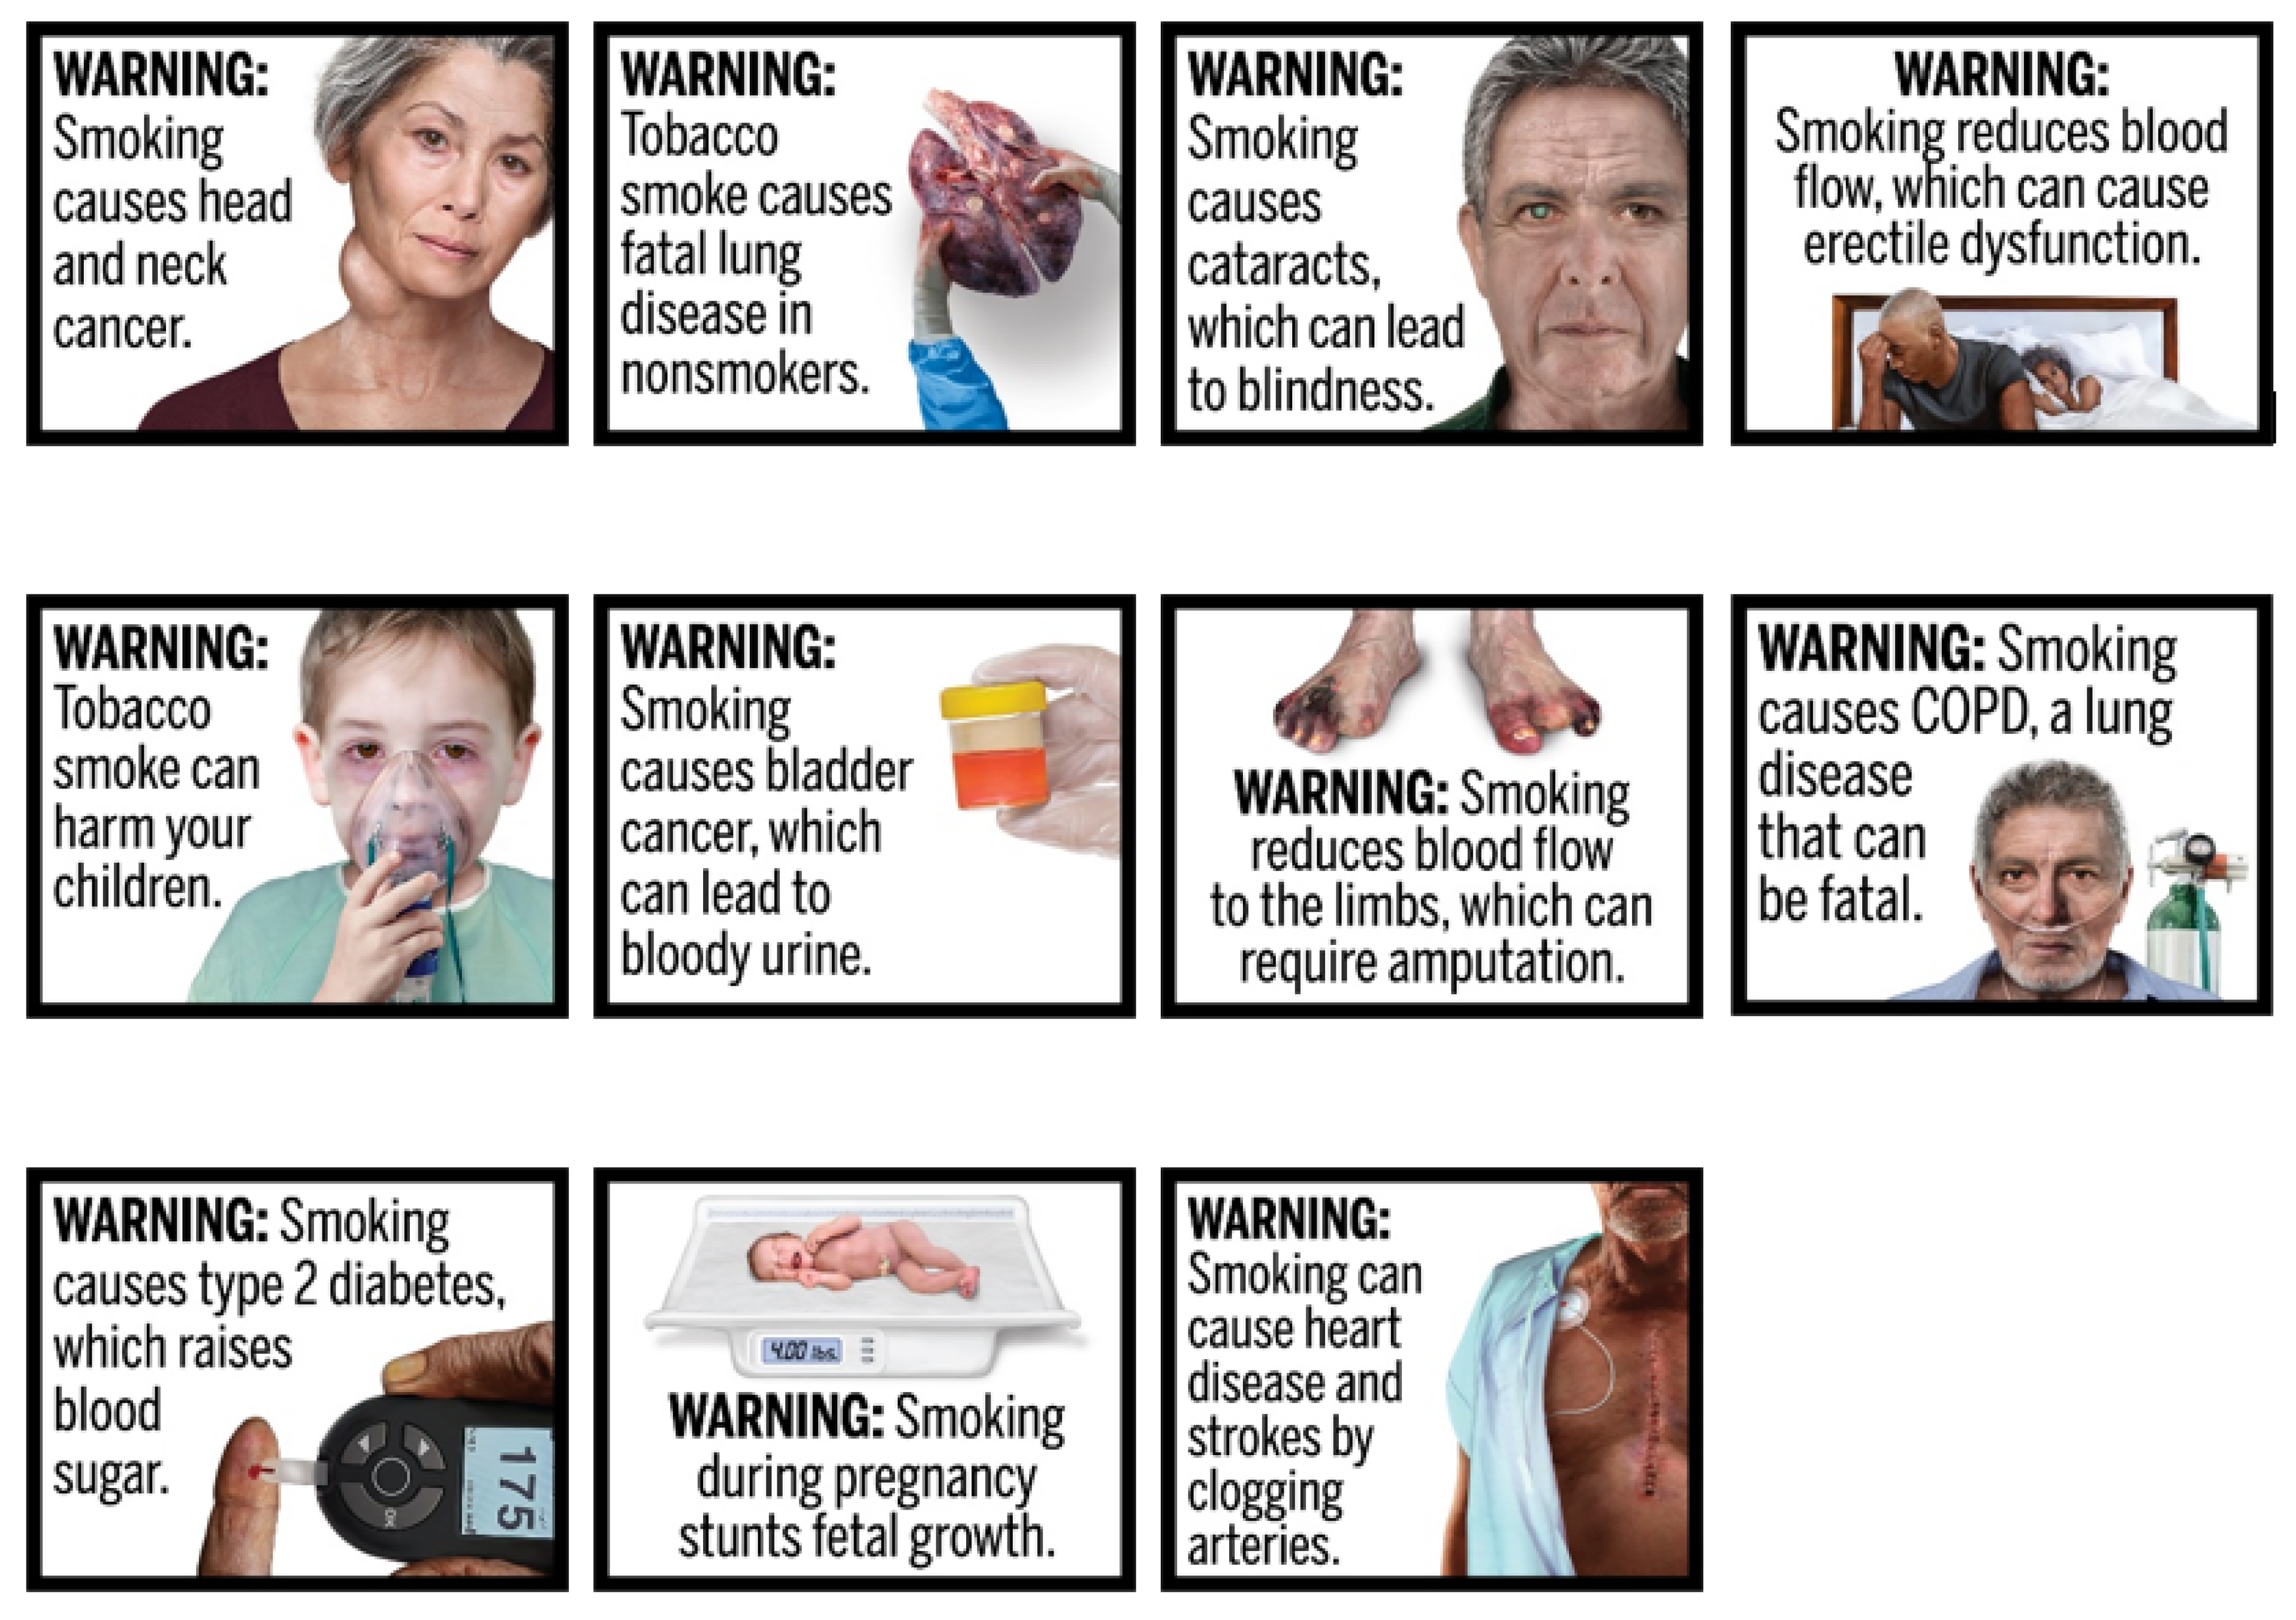
Figure 2.
Cigarette labels proposed in 2019 [
34].
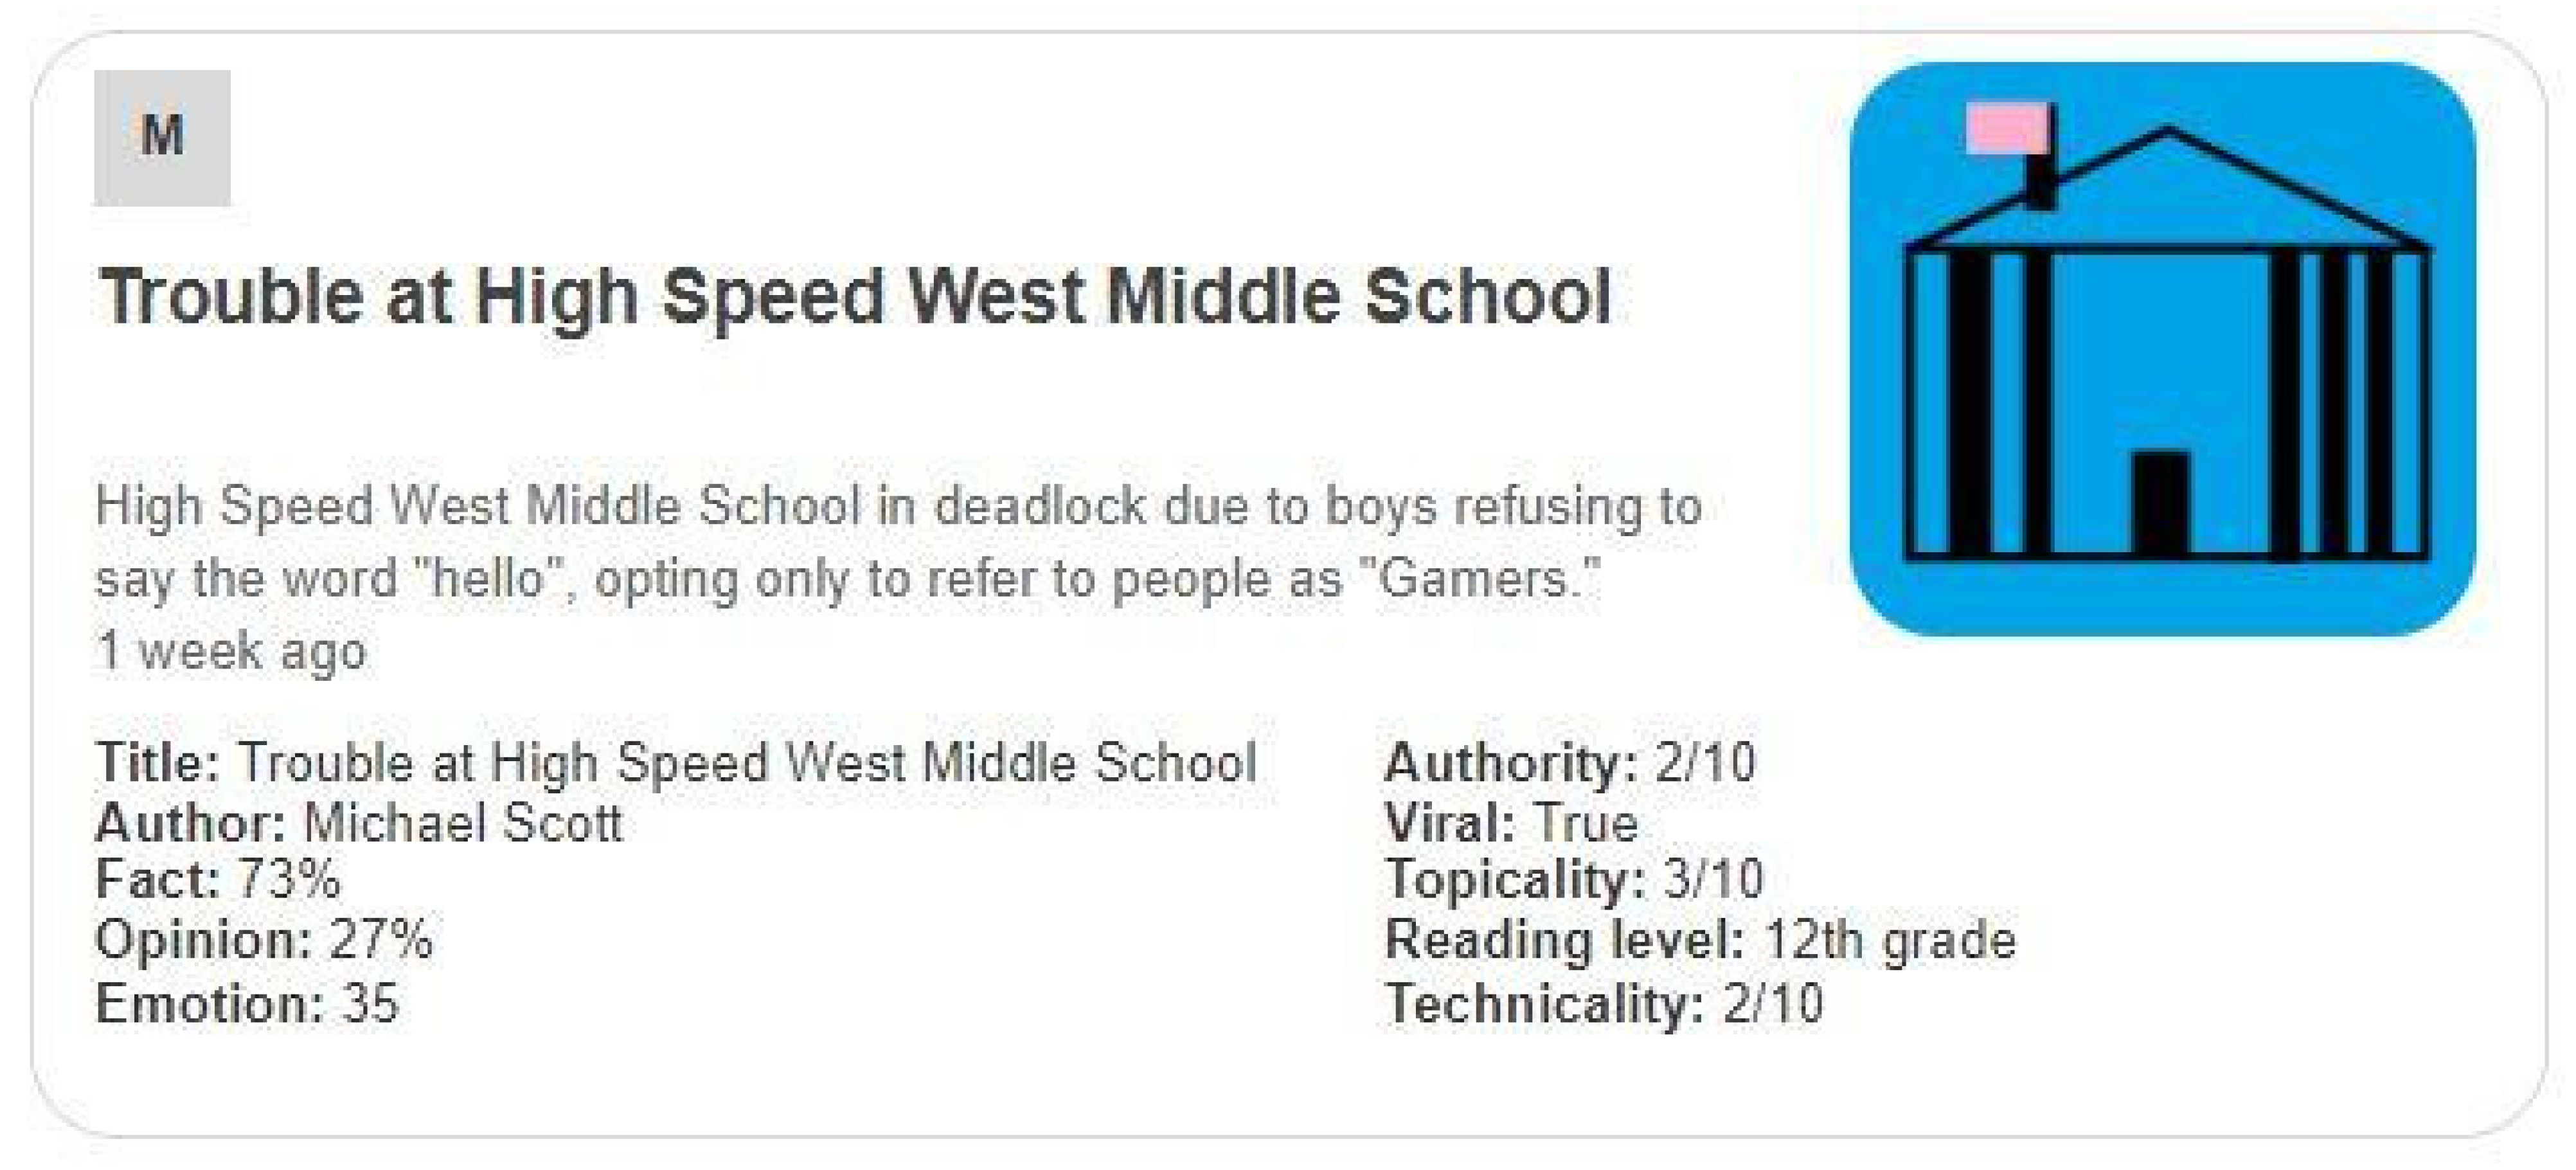
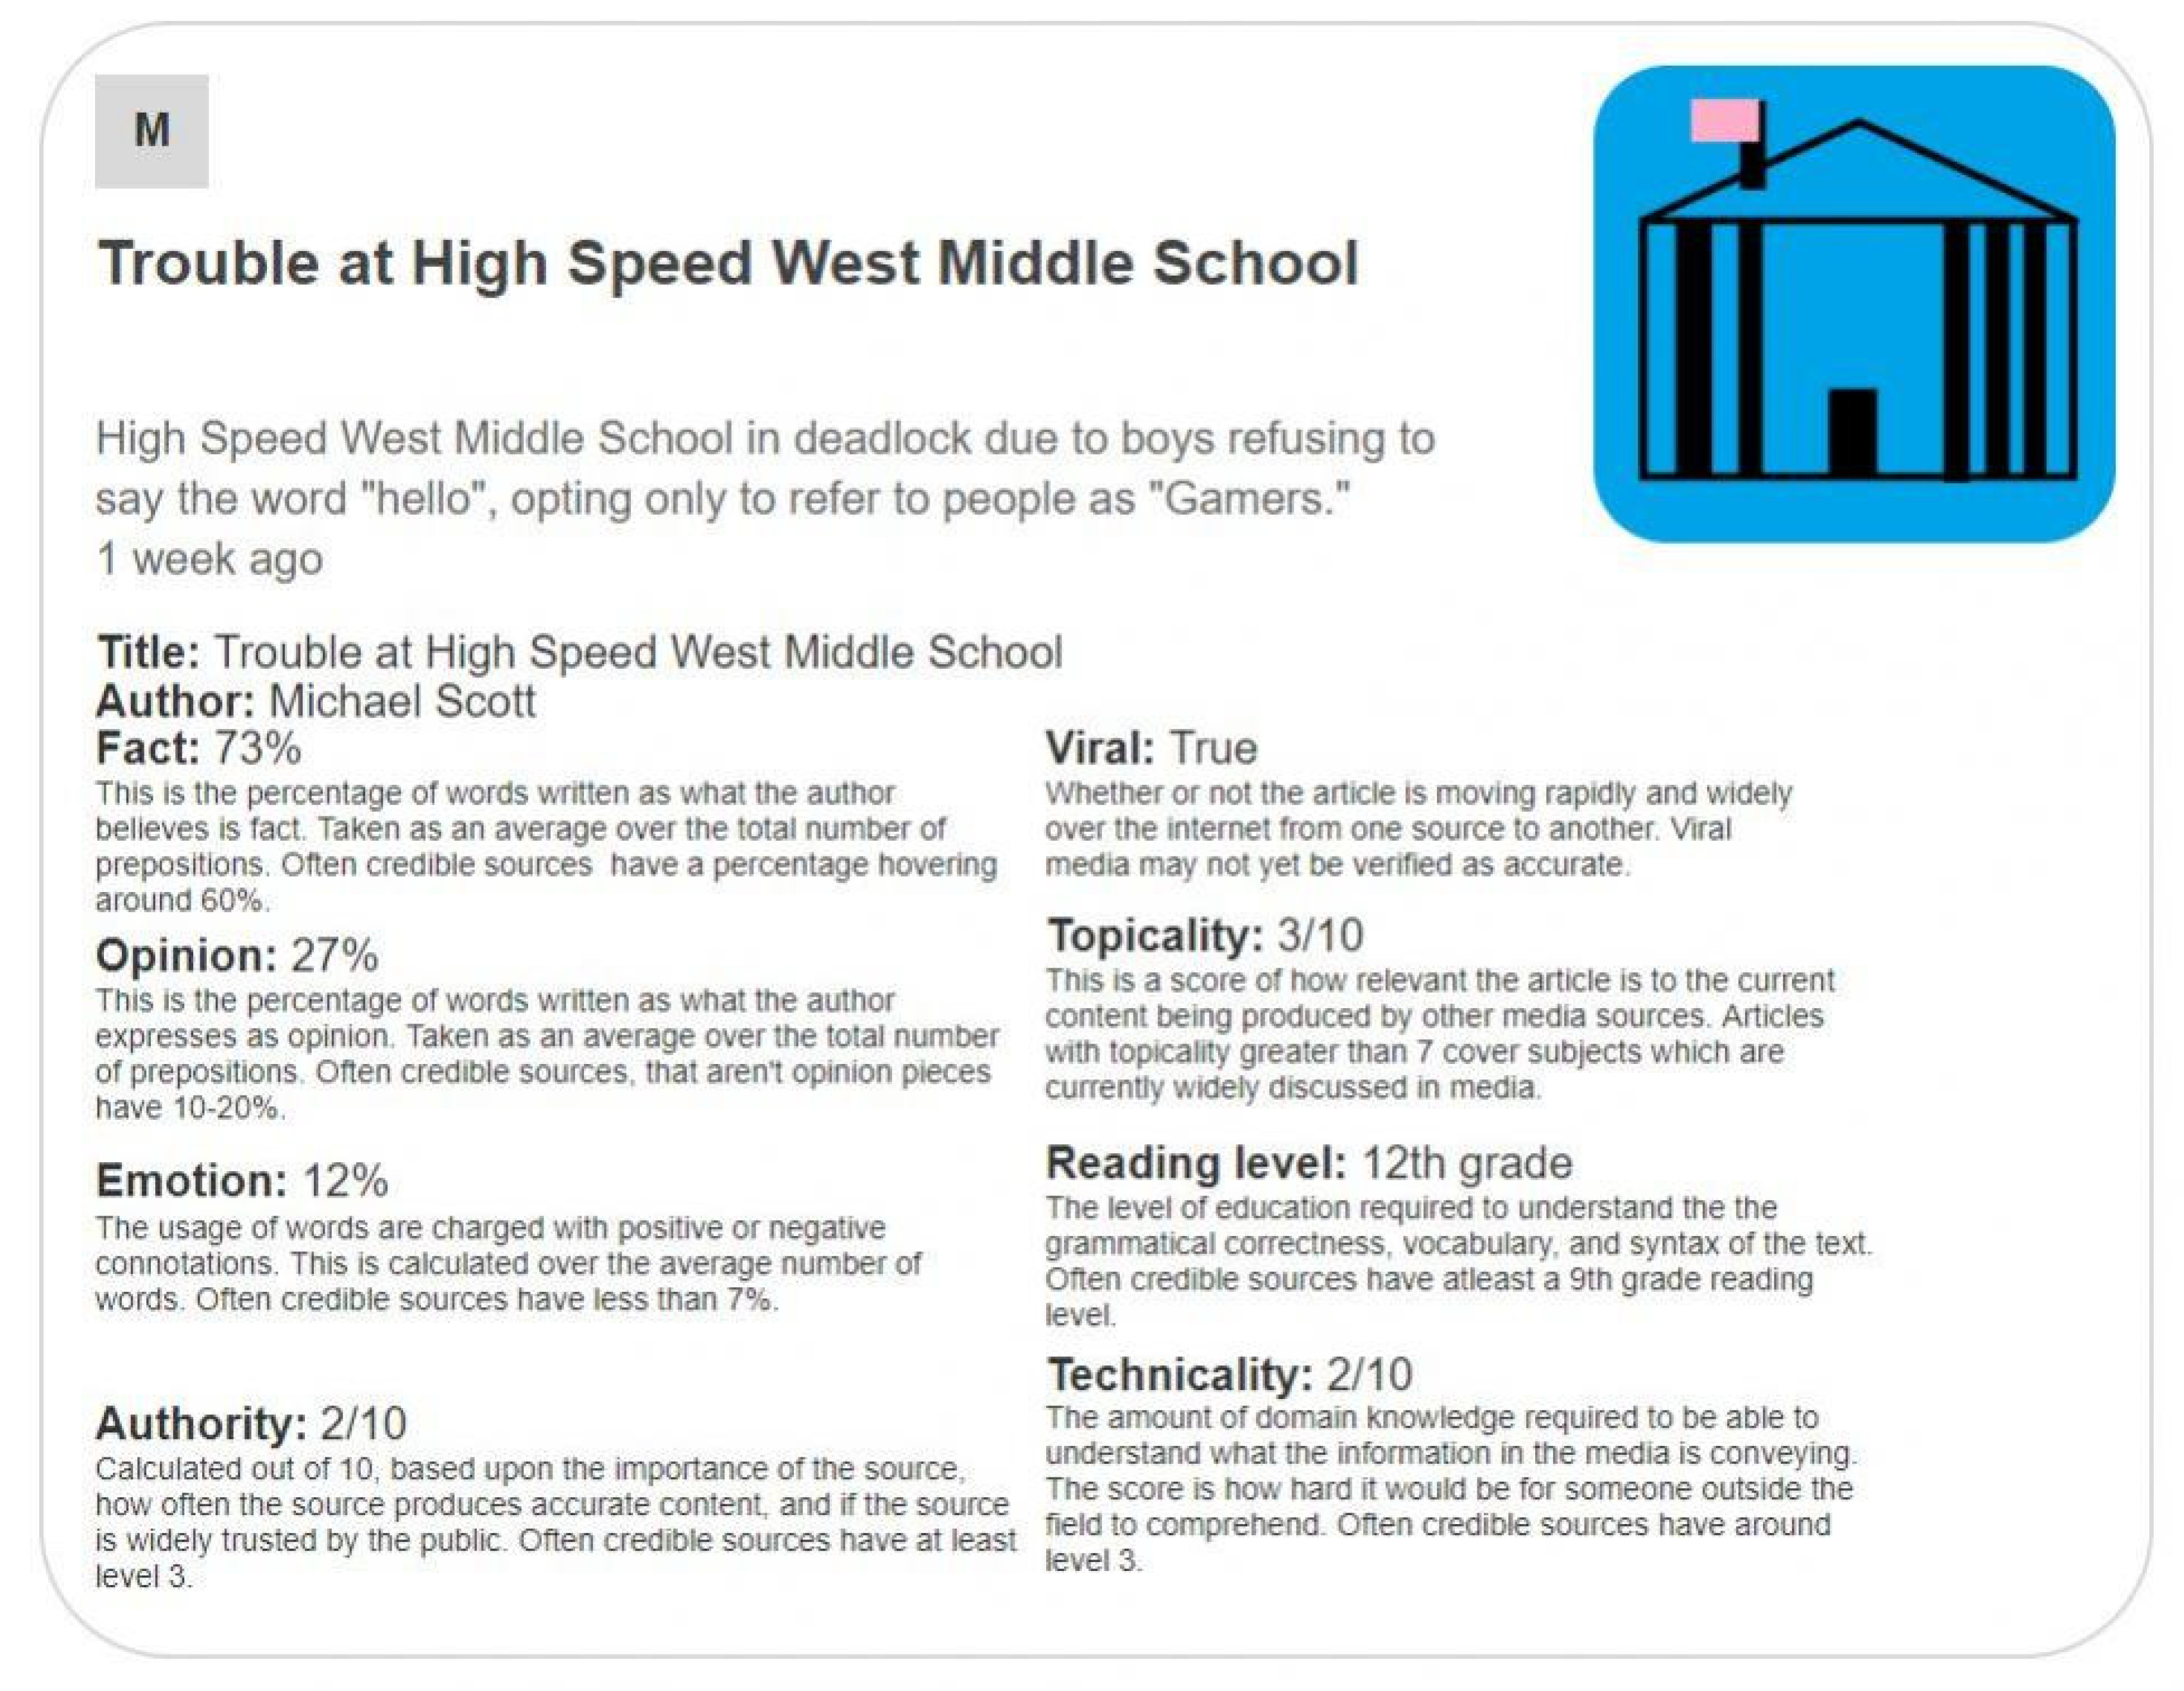
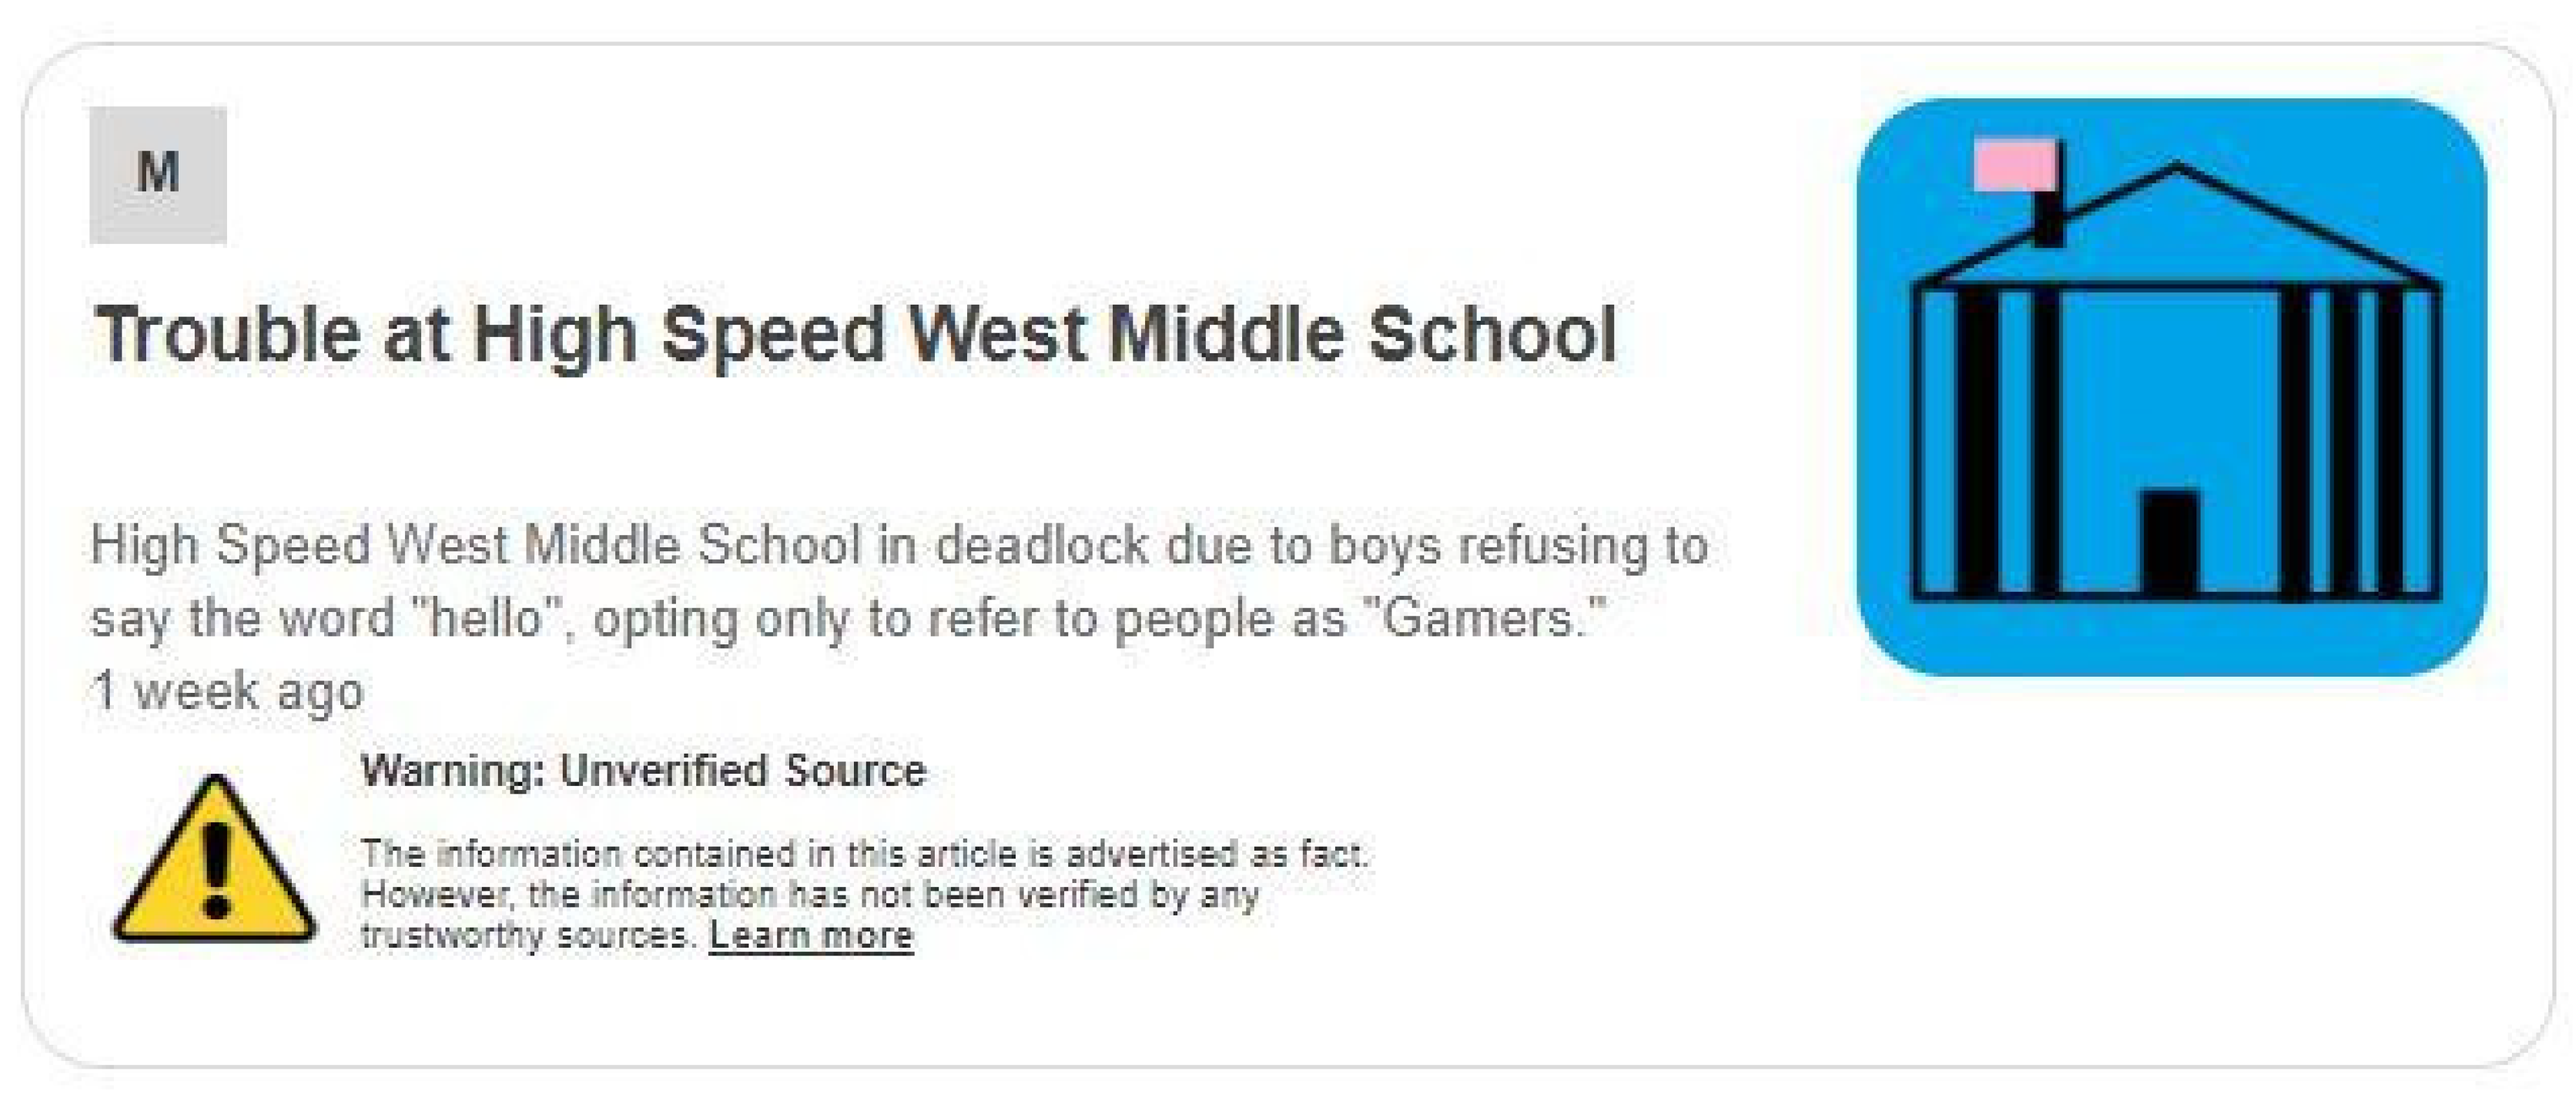
Figure 3.
Informational label with article summary [
76].
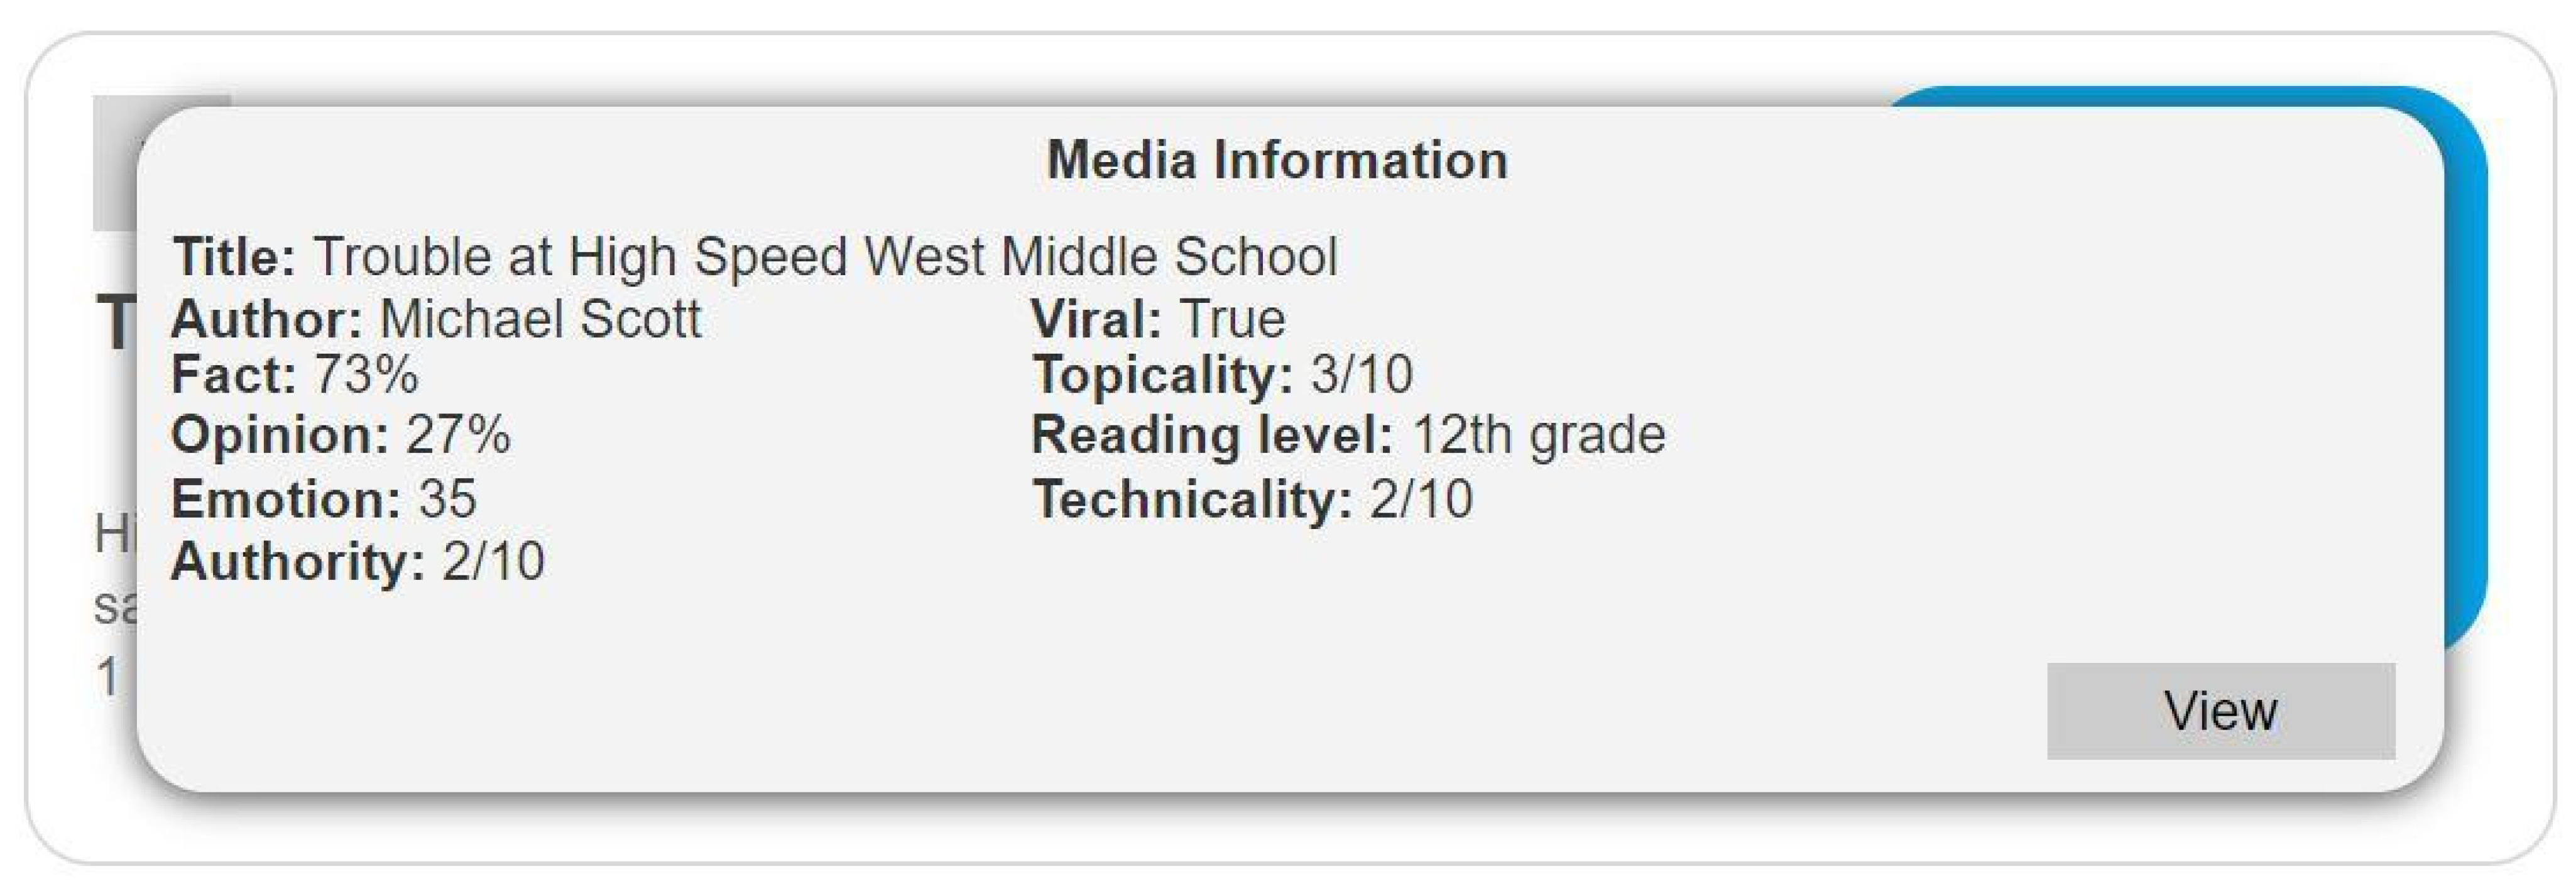
Figure 6.
Warning label with description [
76].
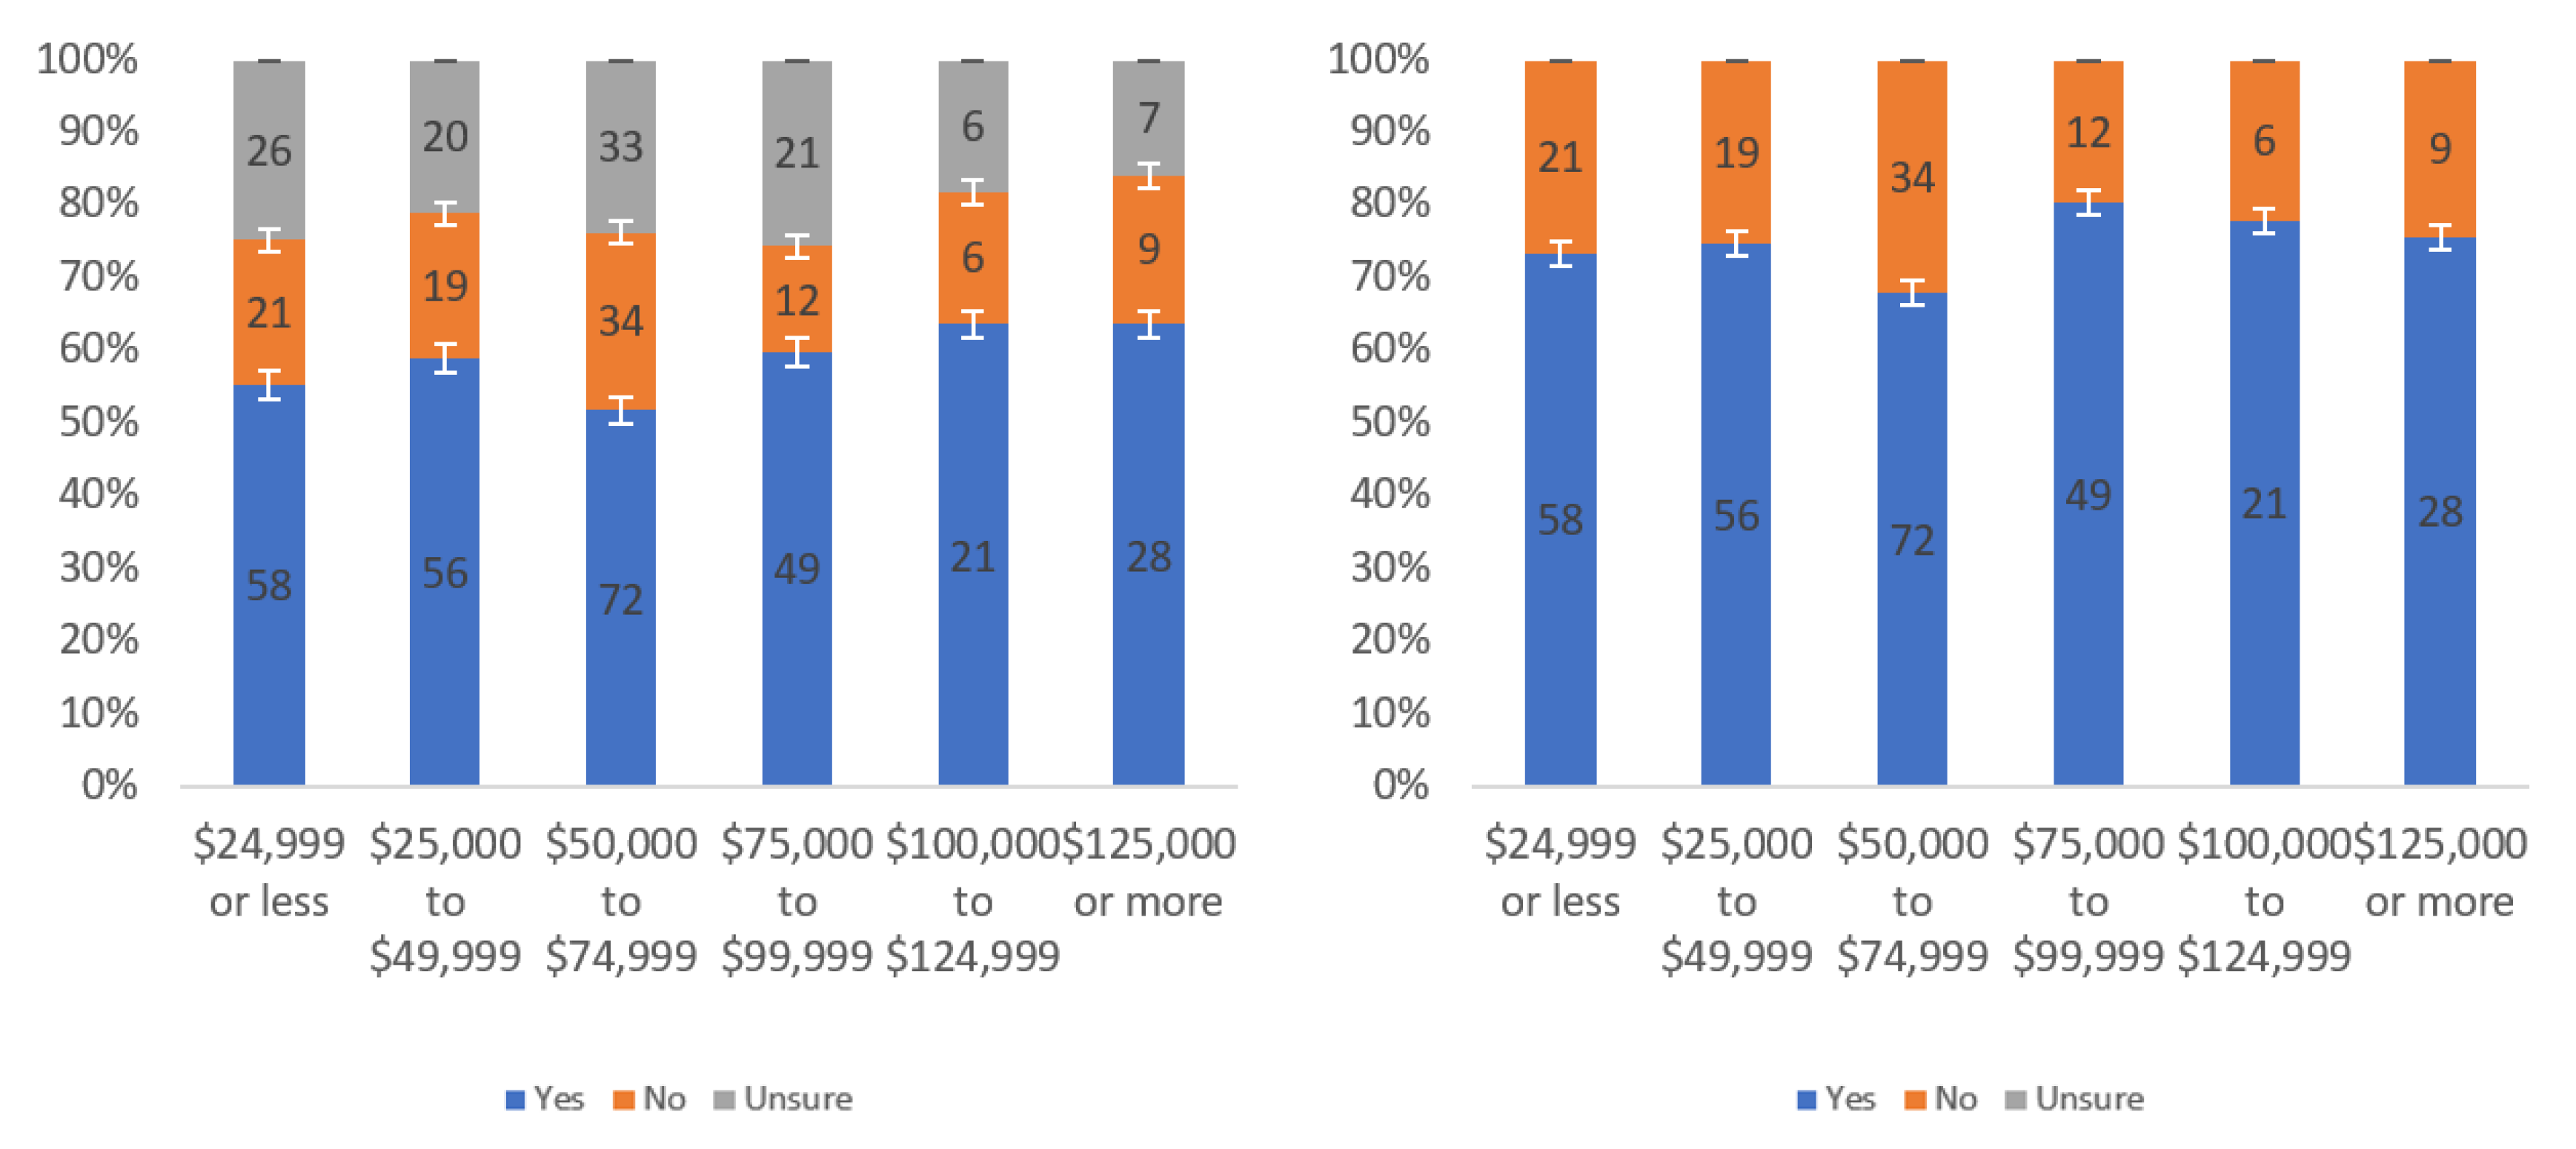
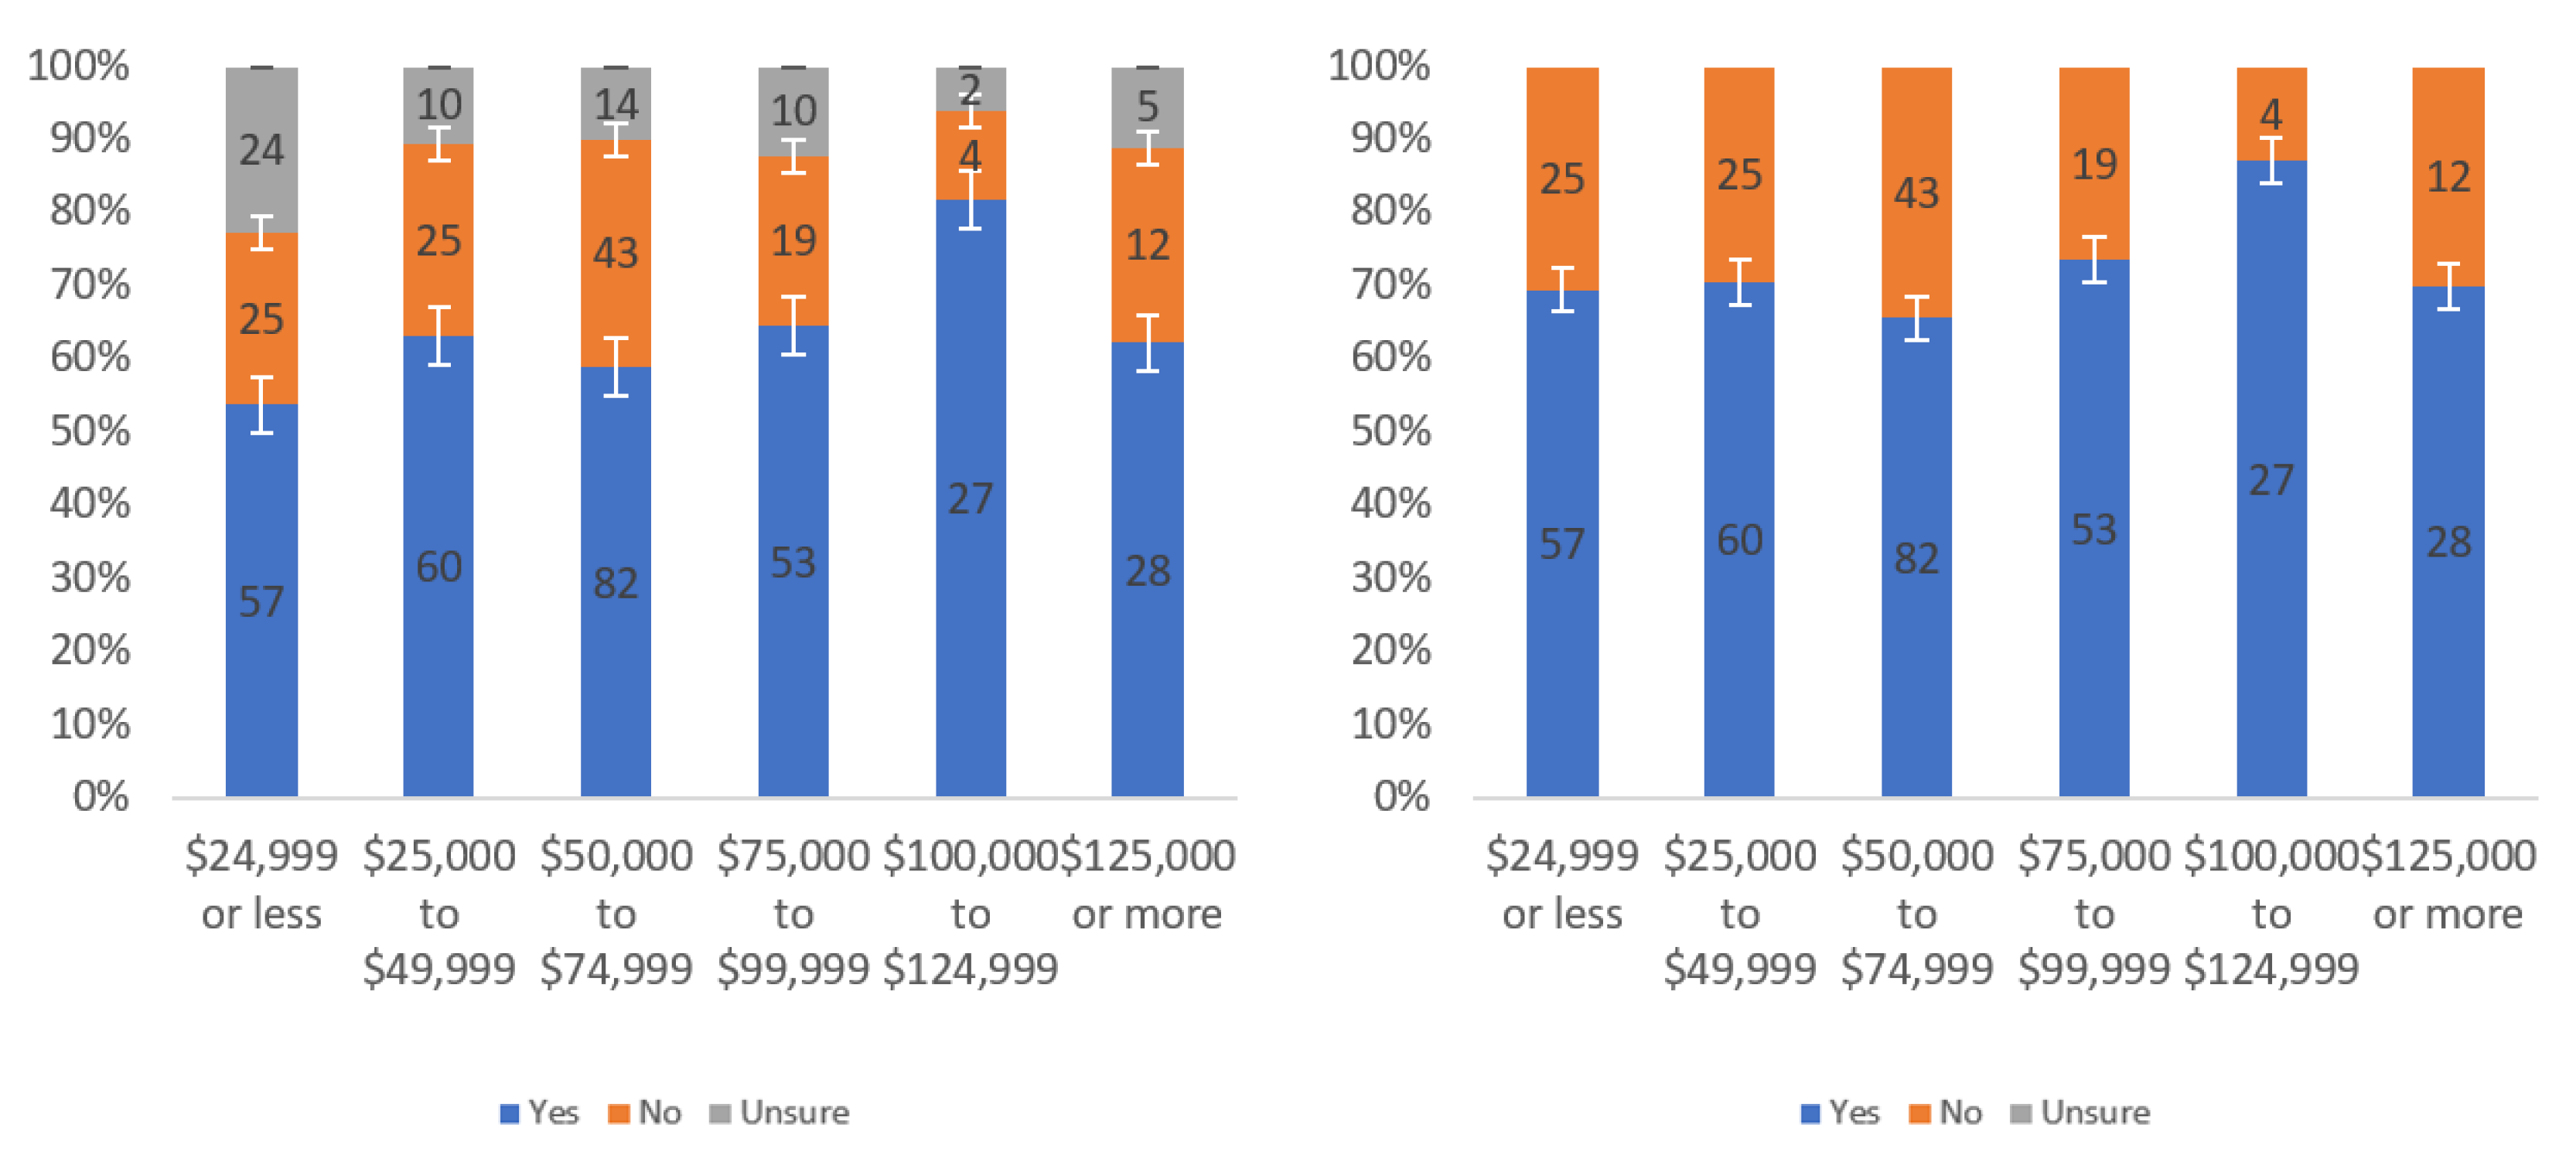
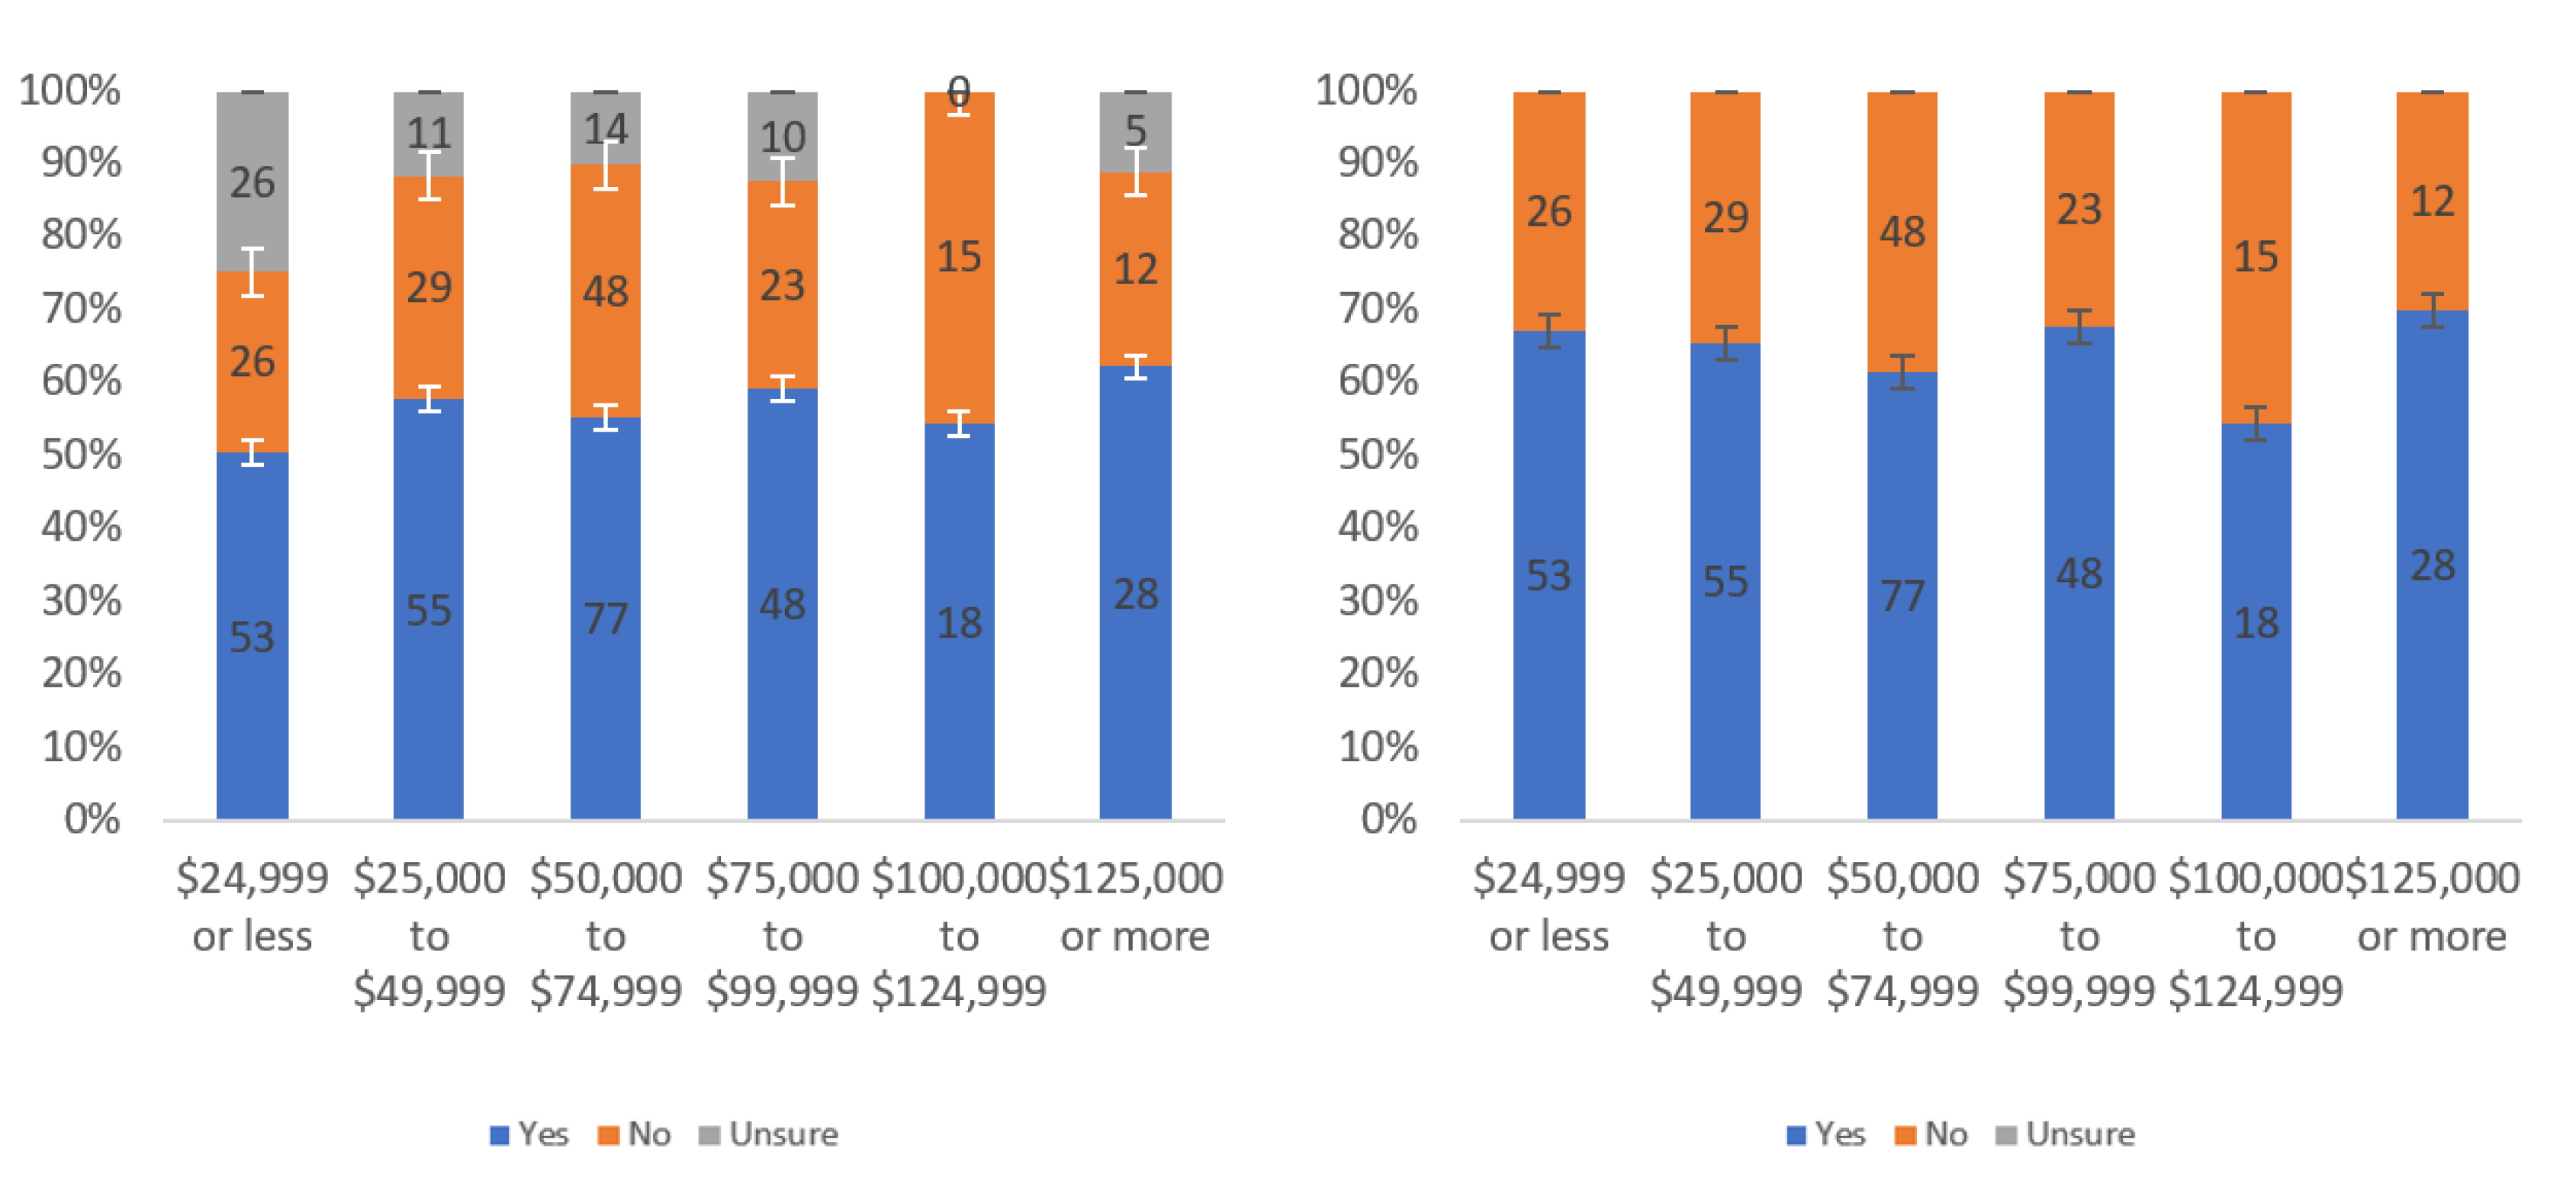
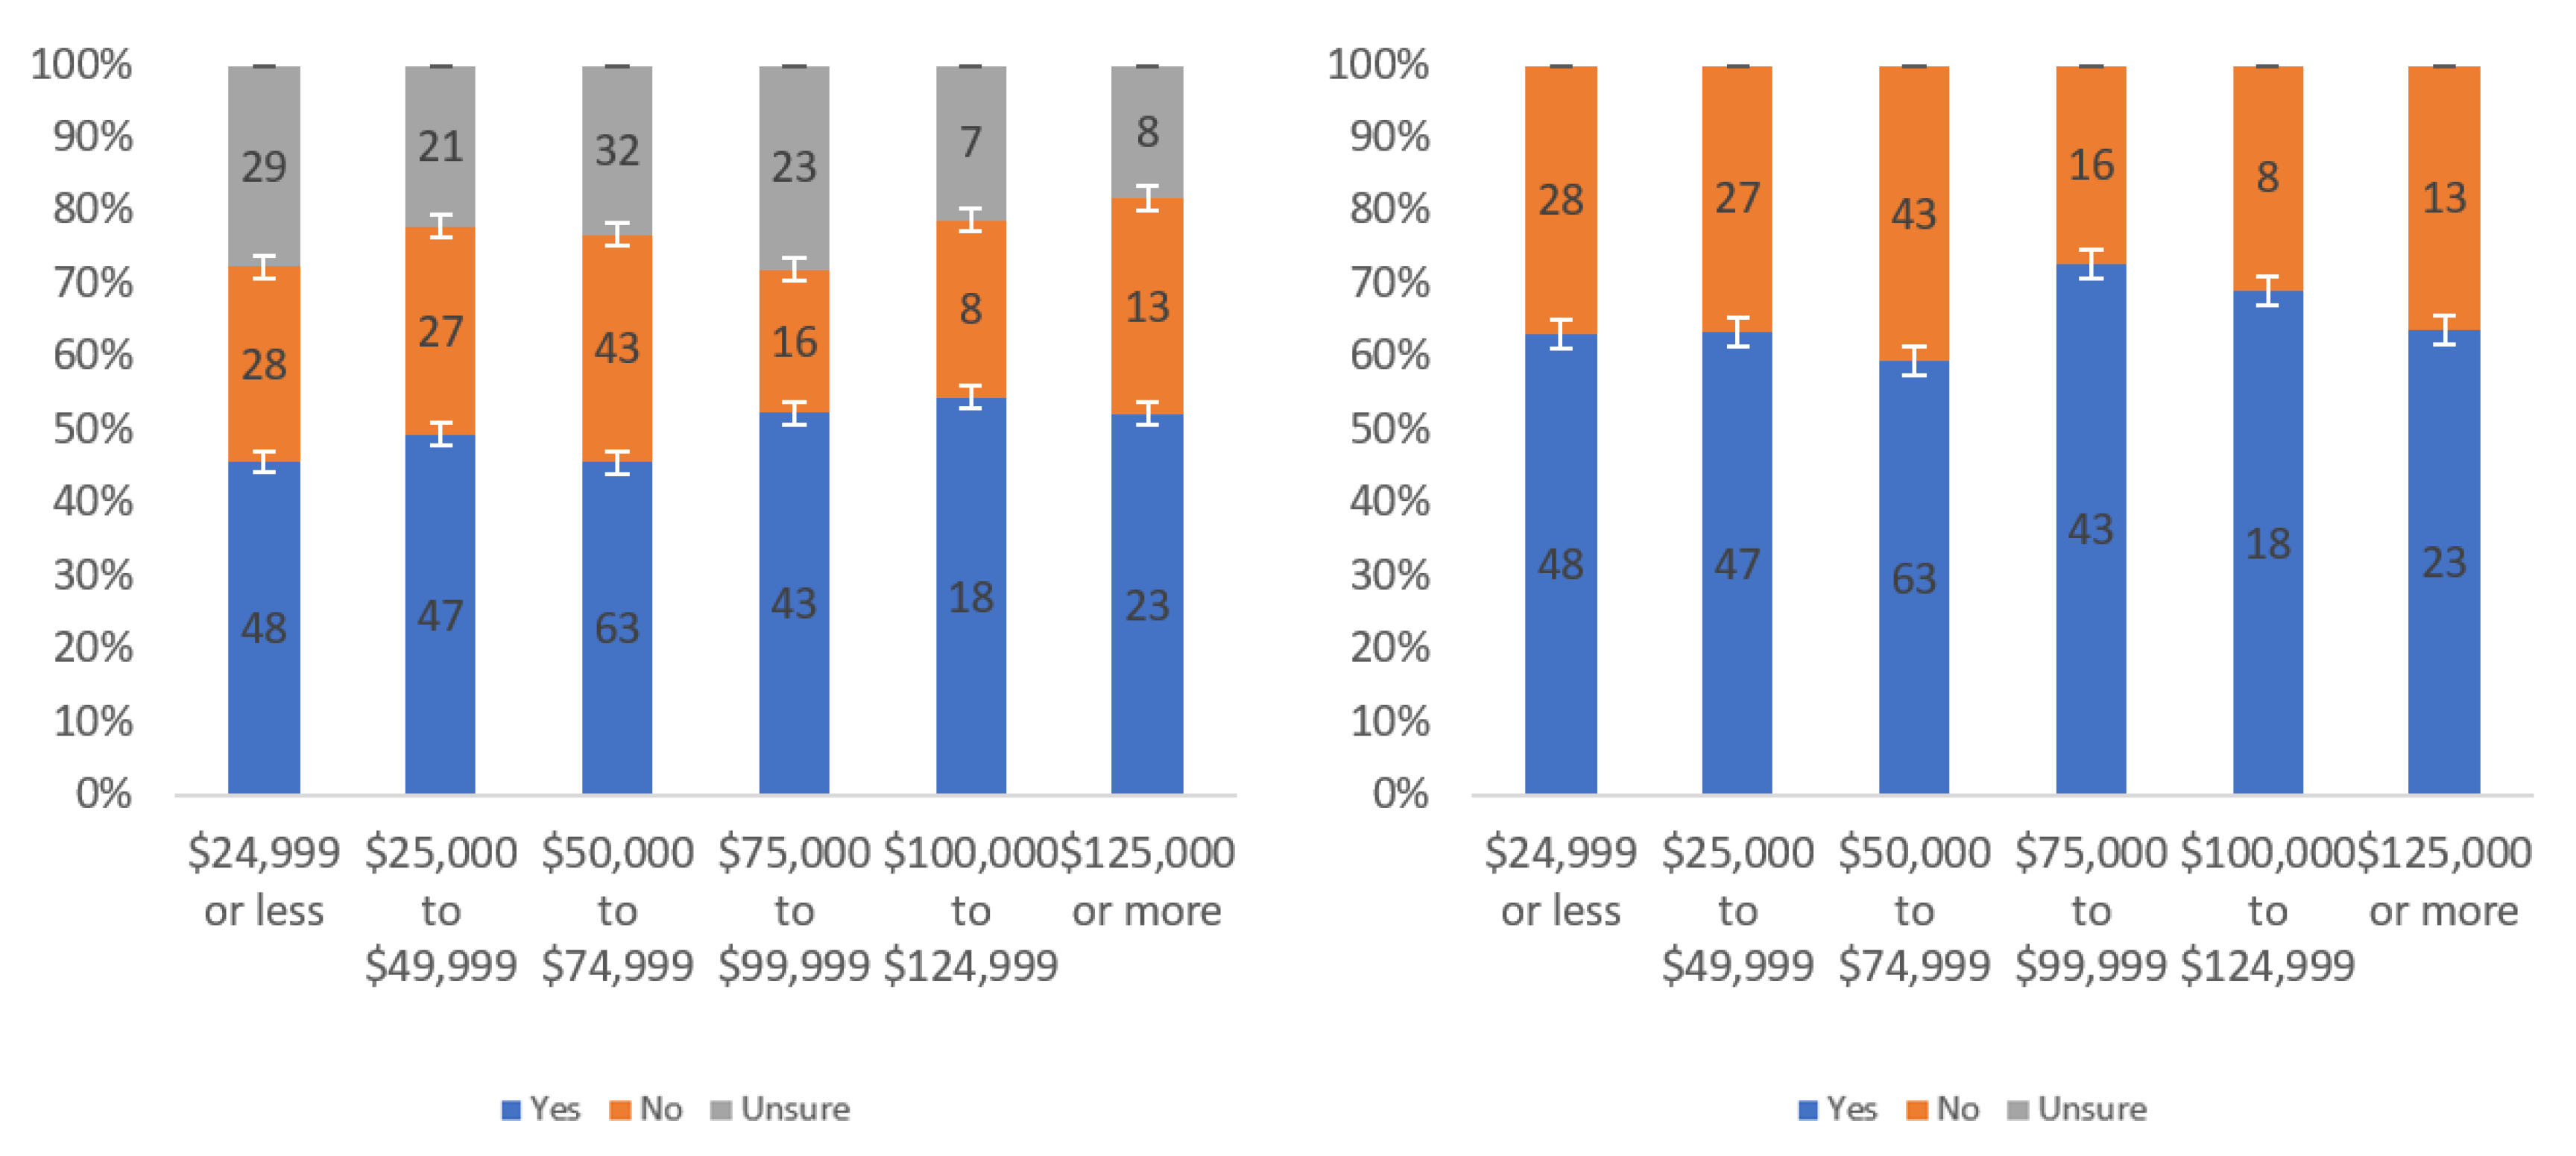
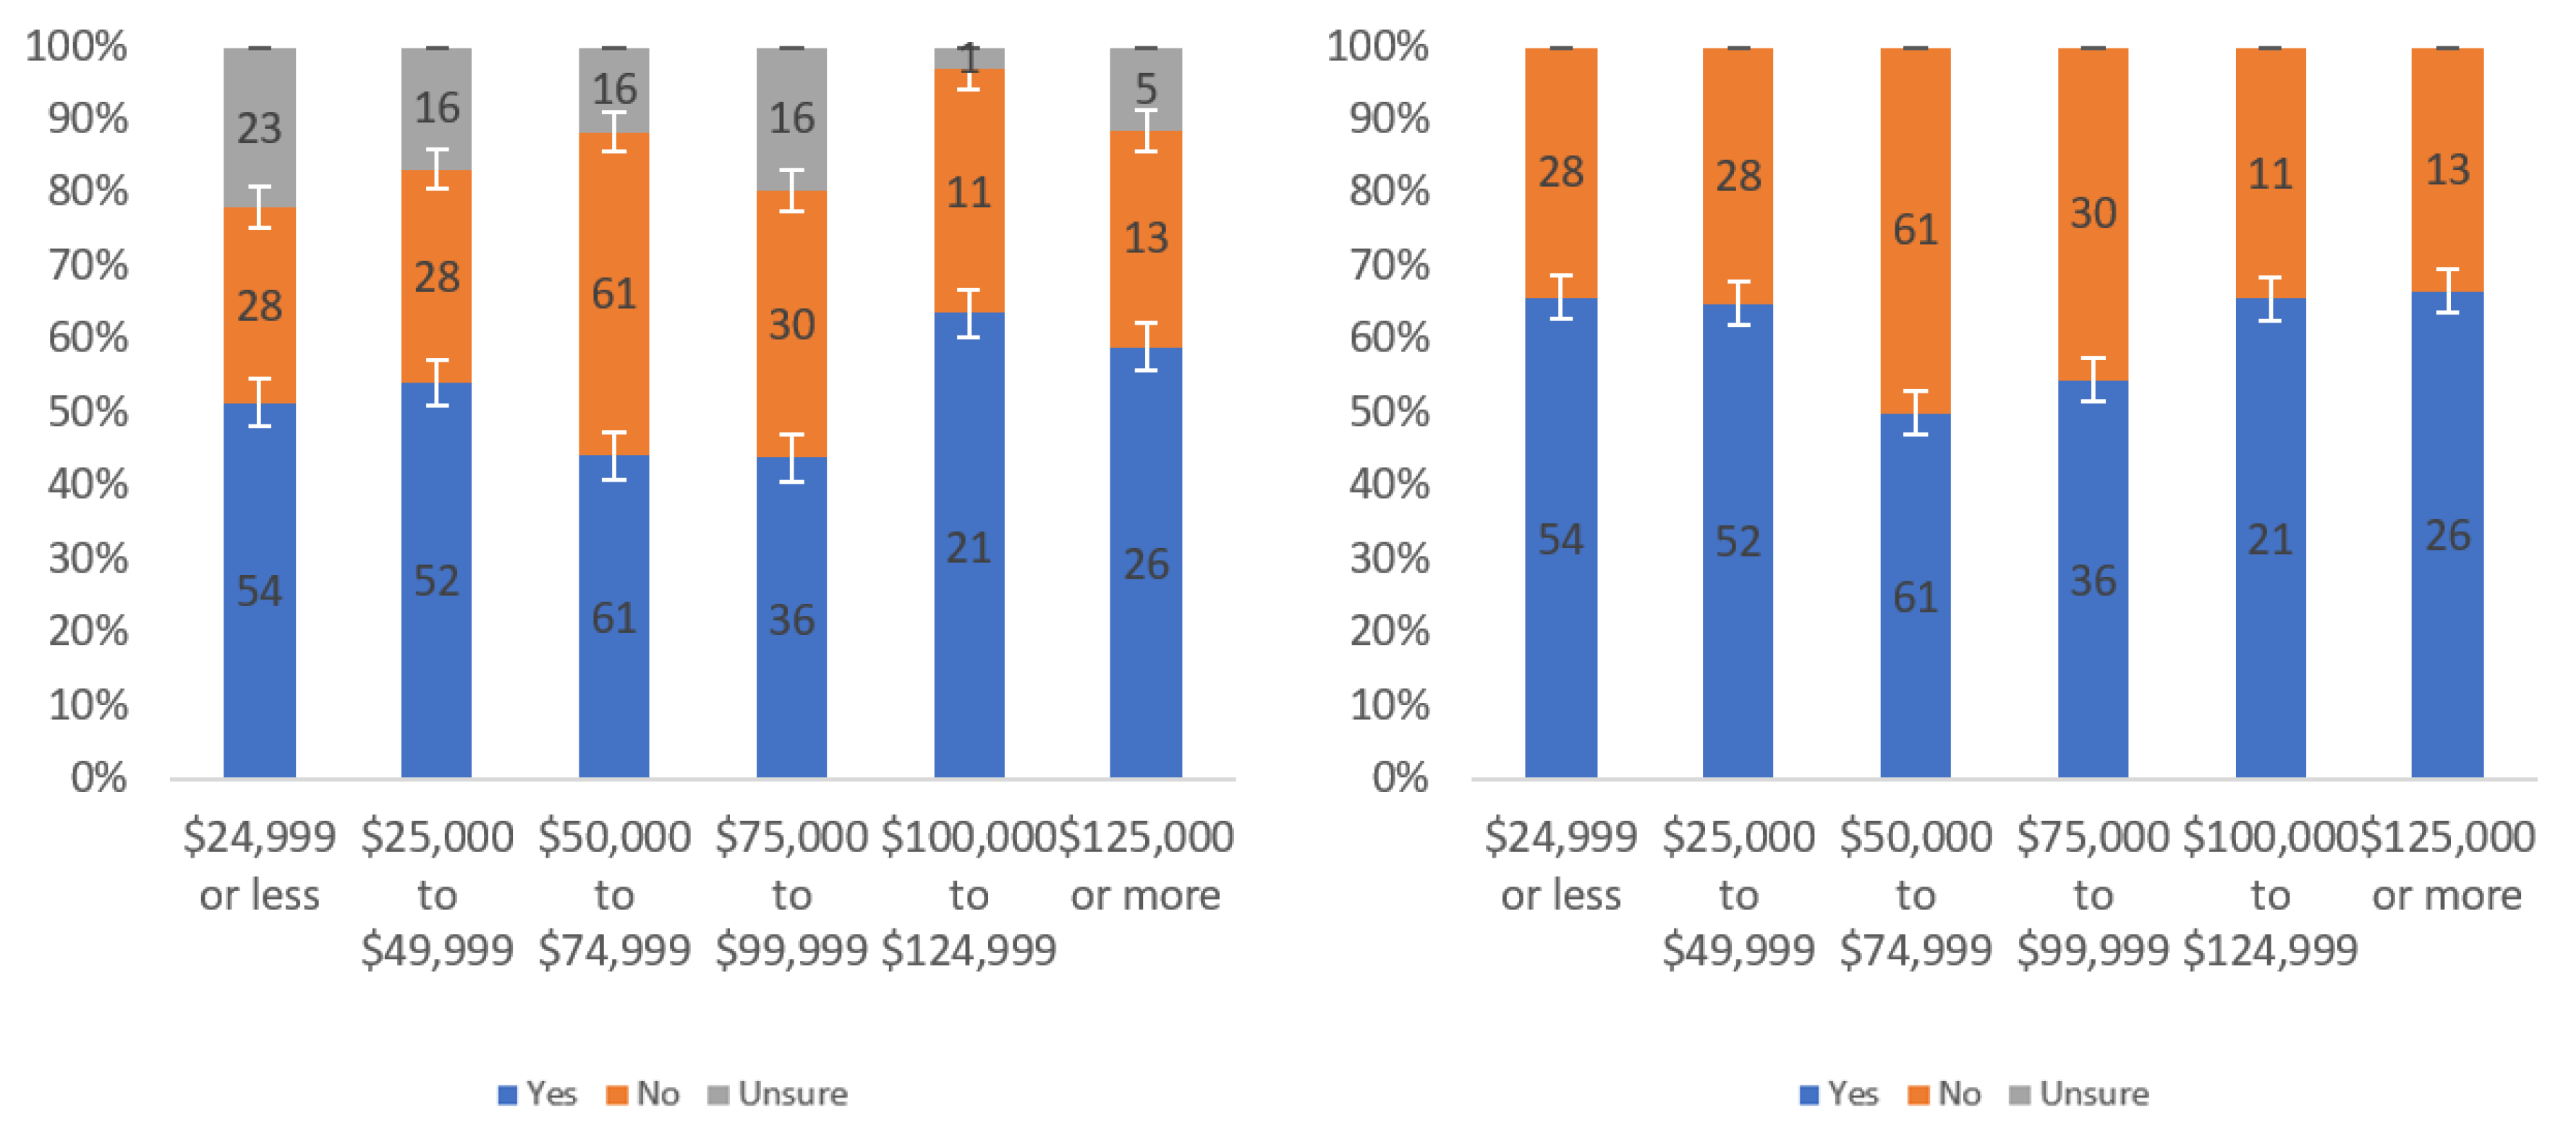
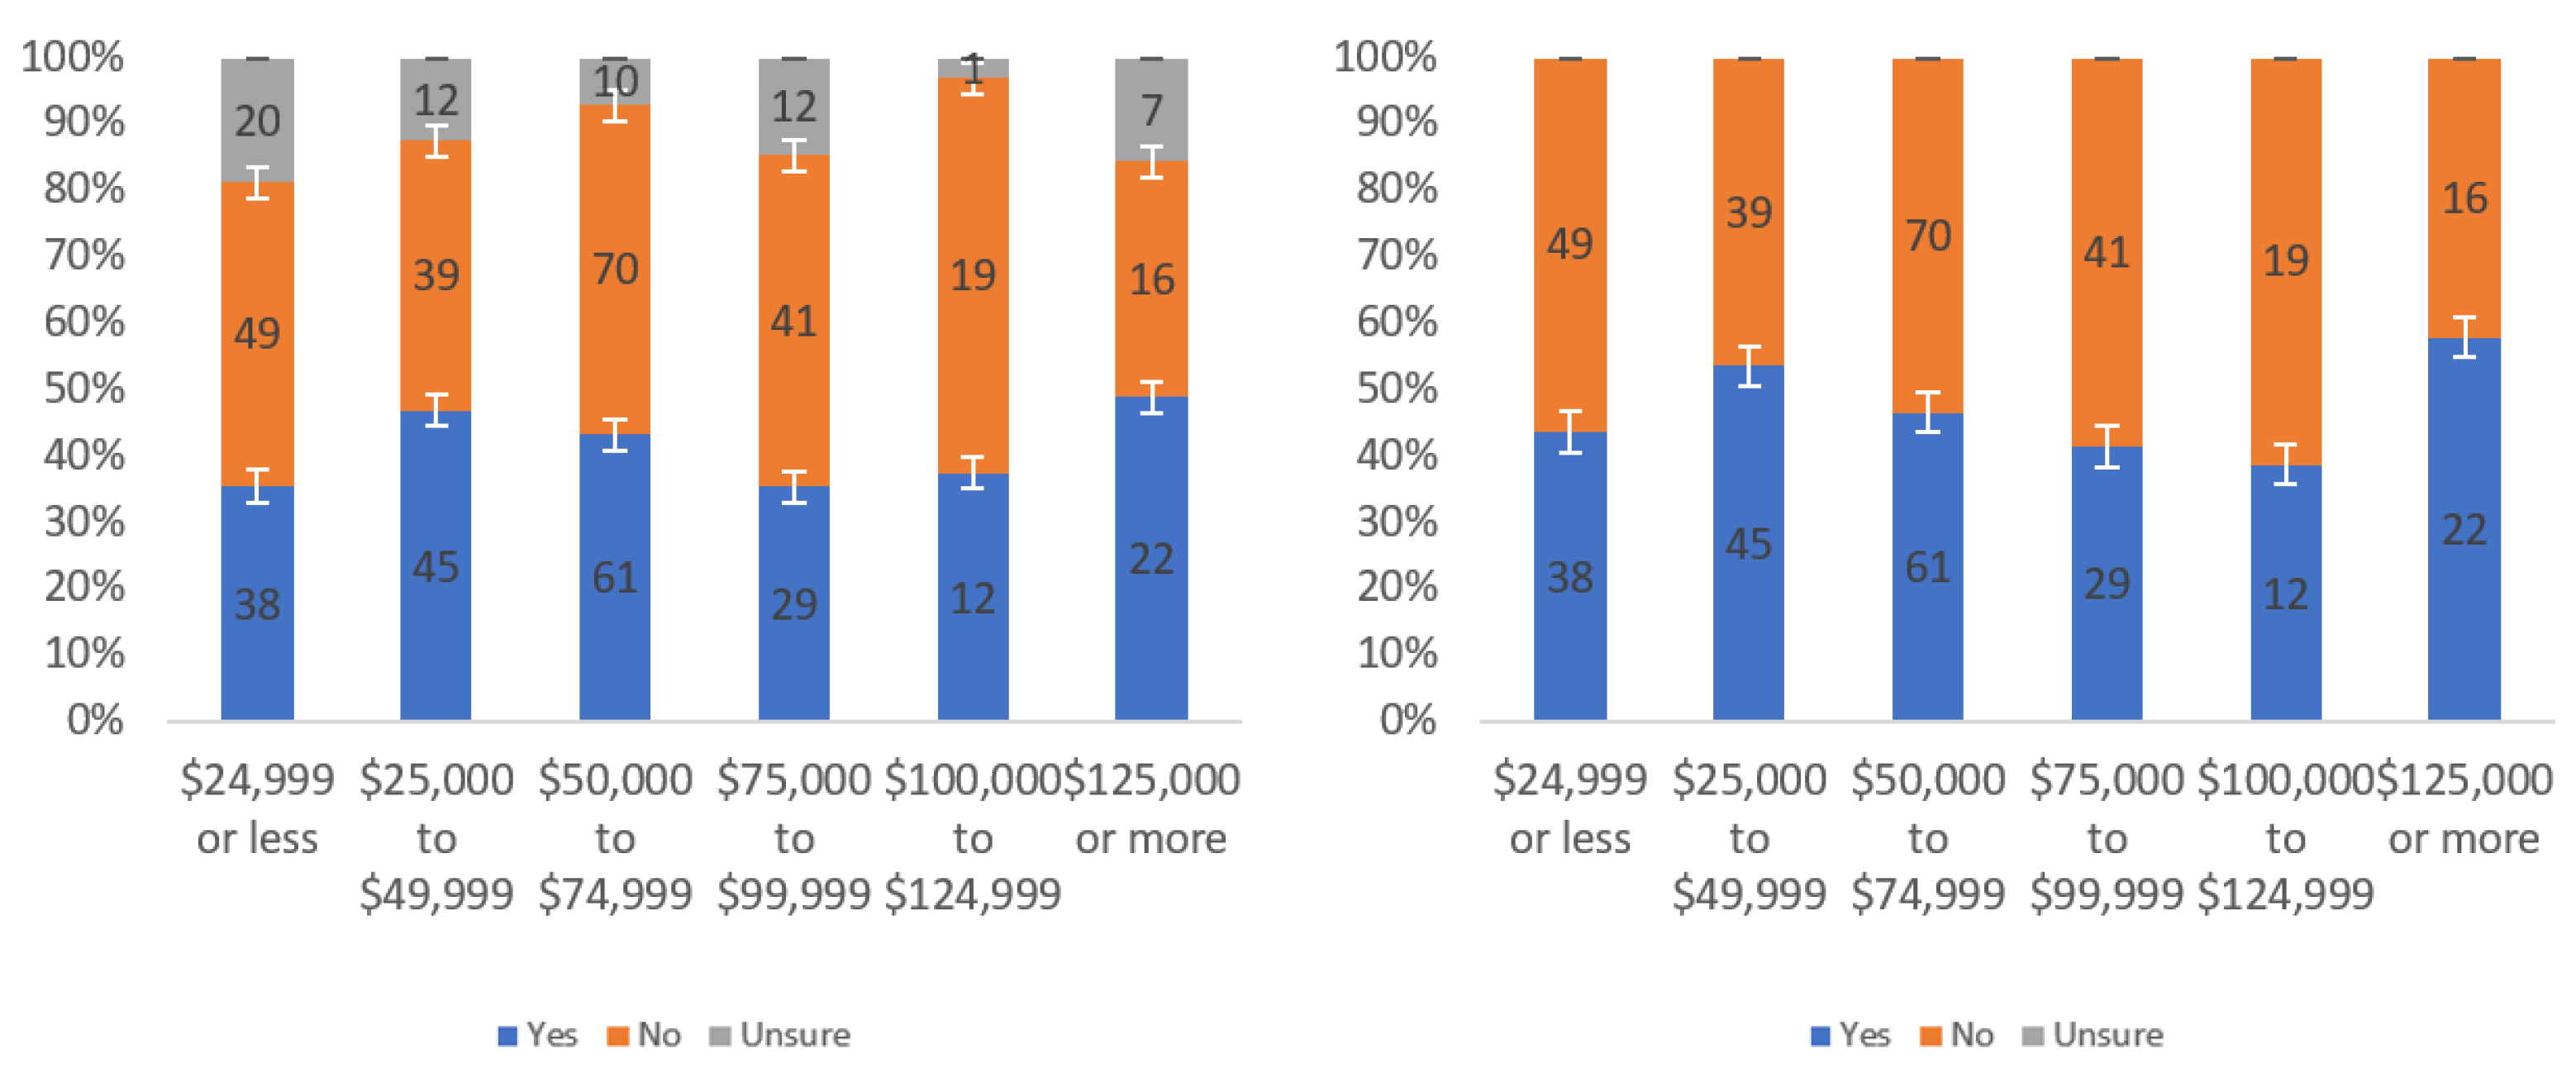
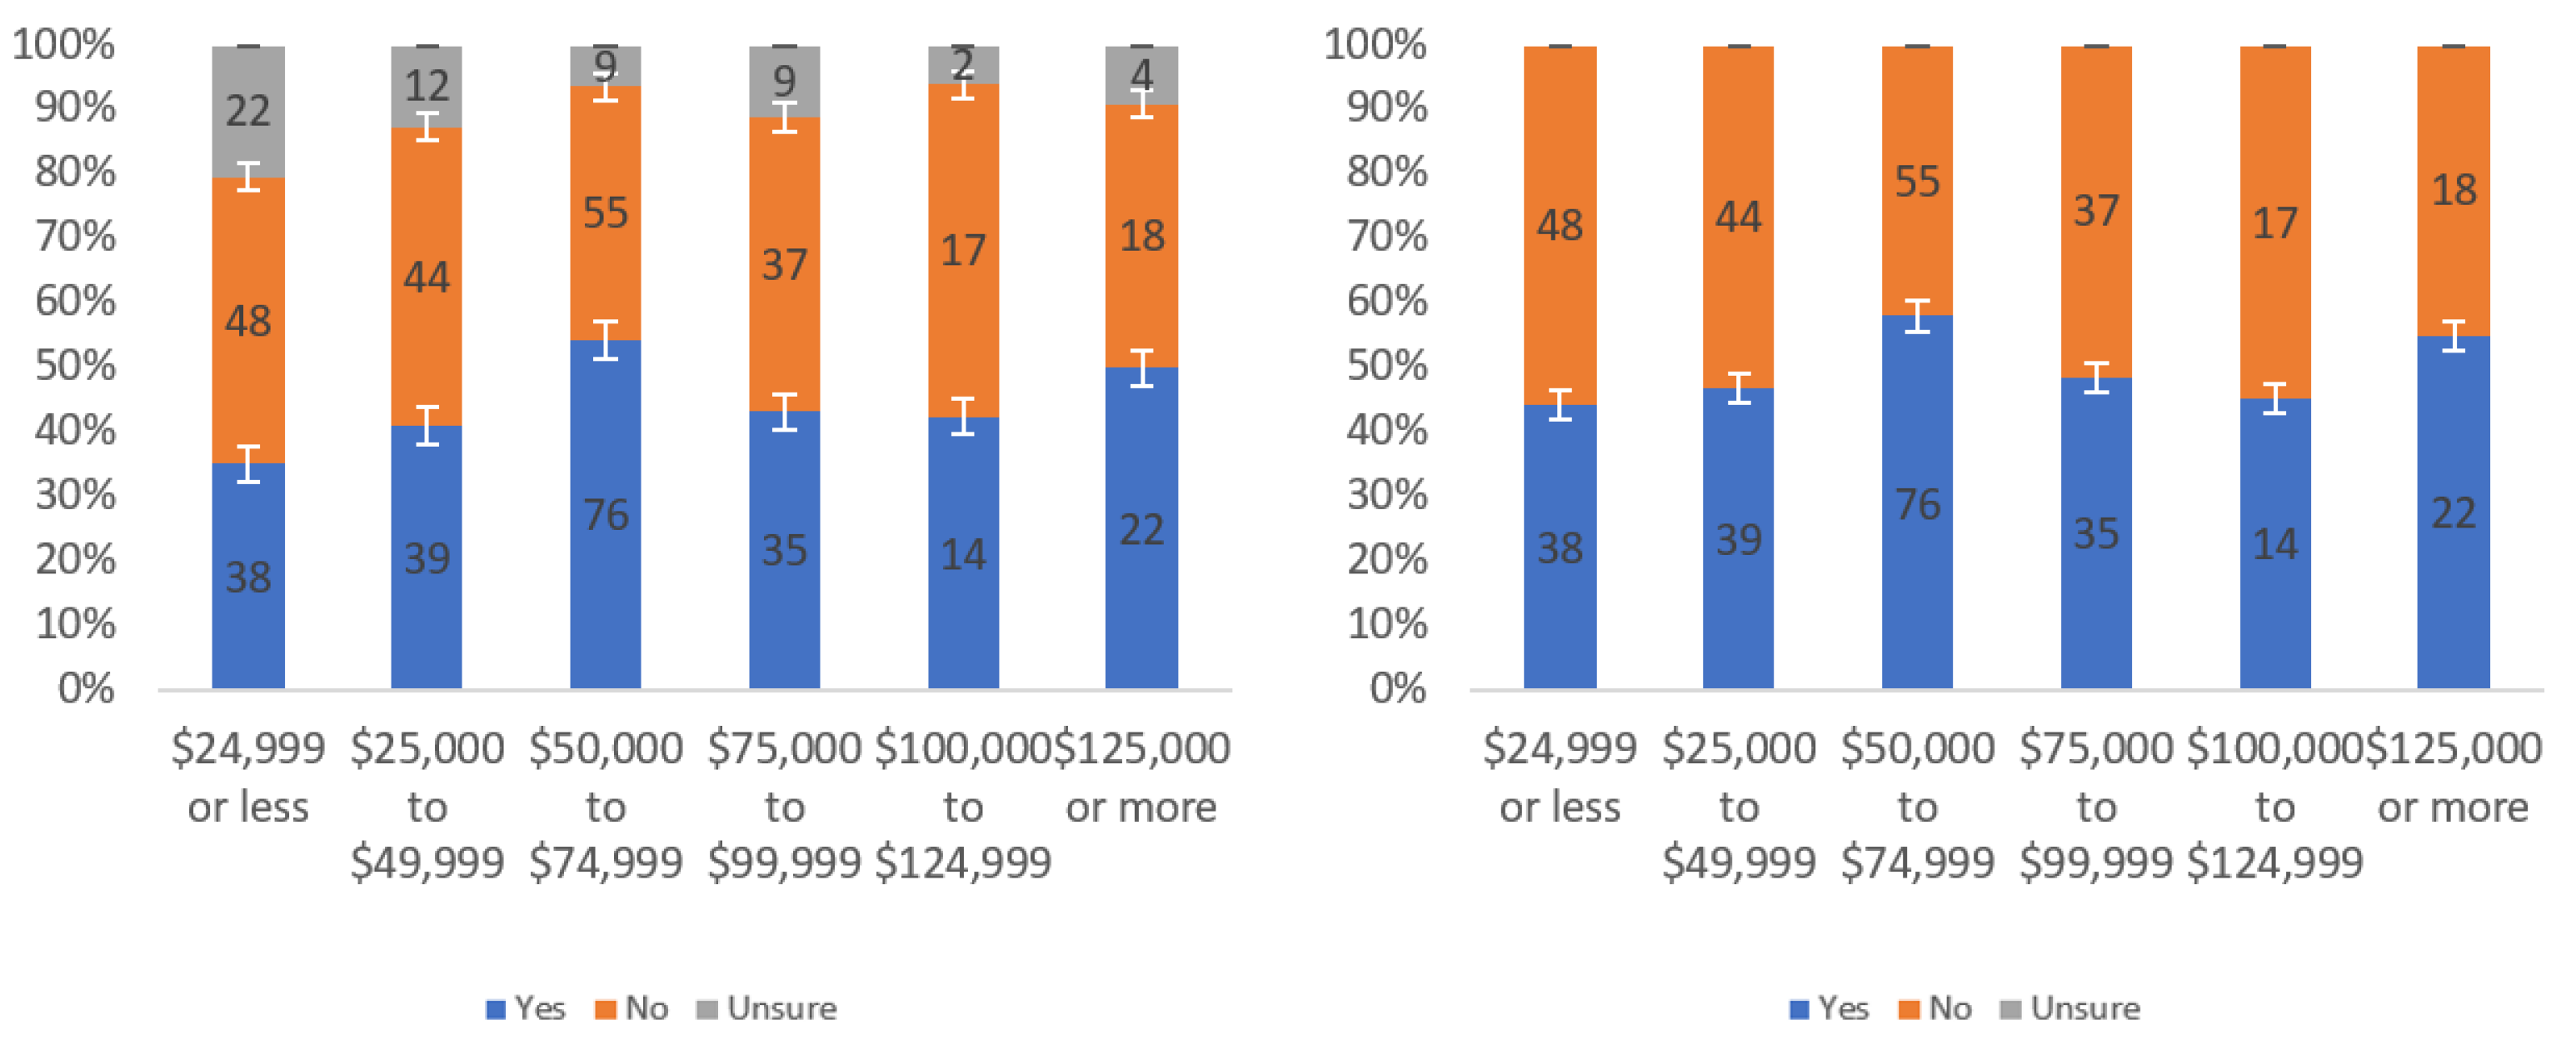
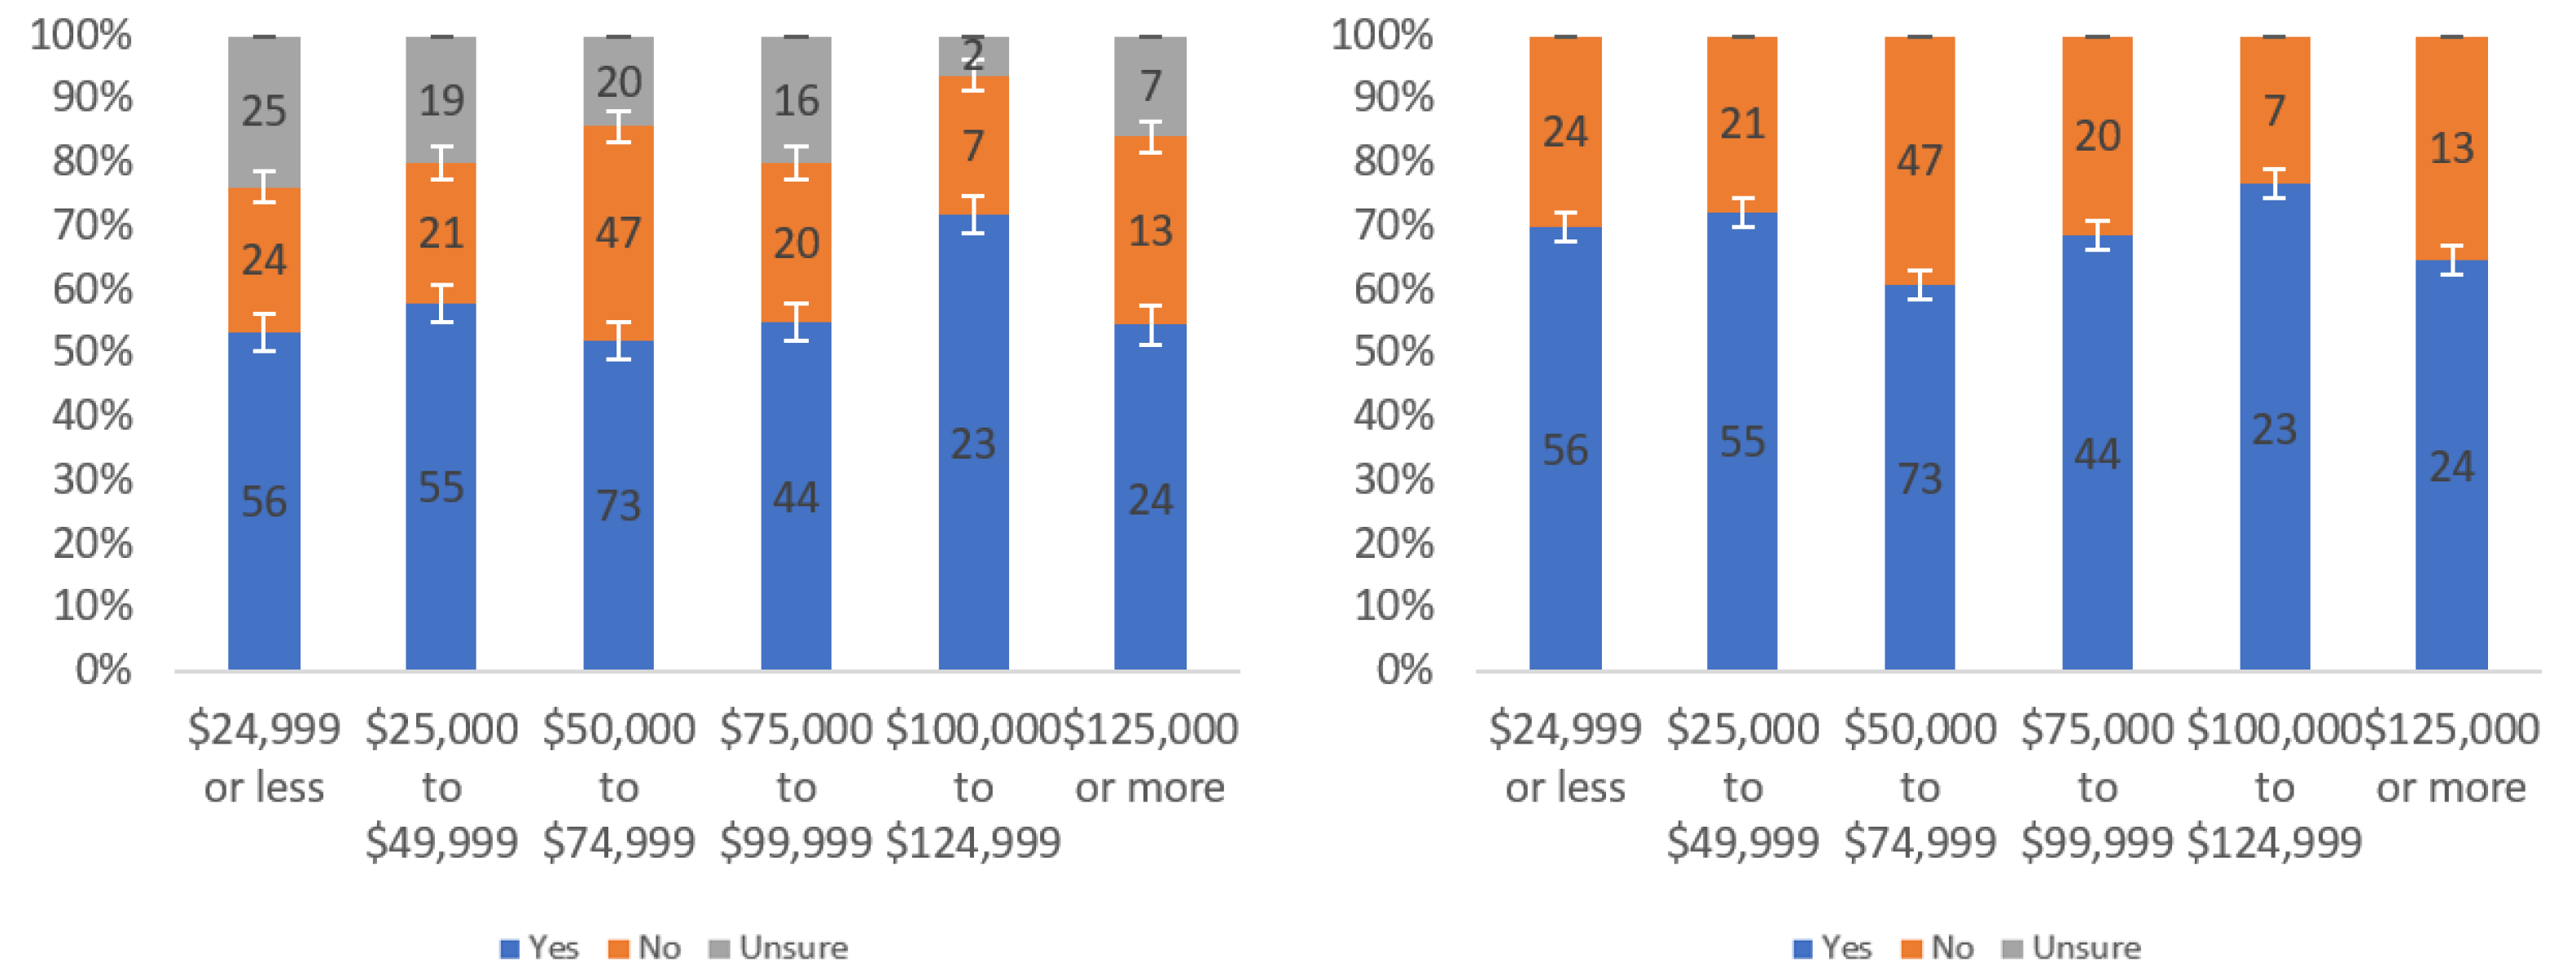
Figure 7.
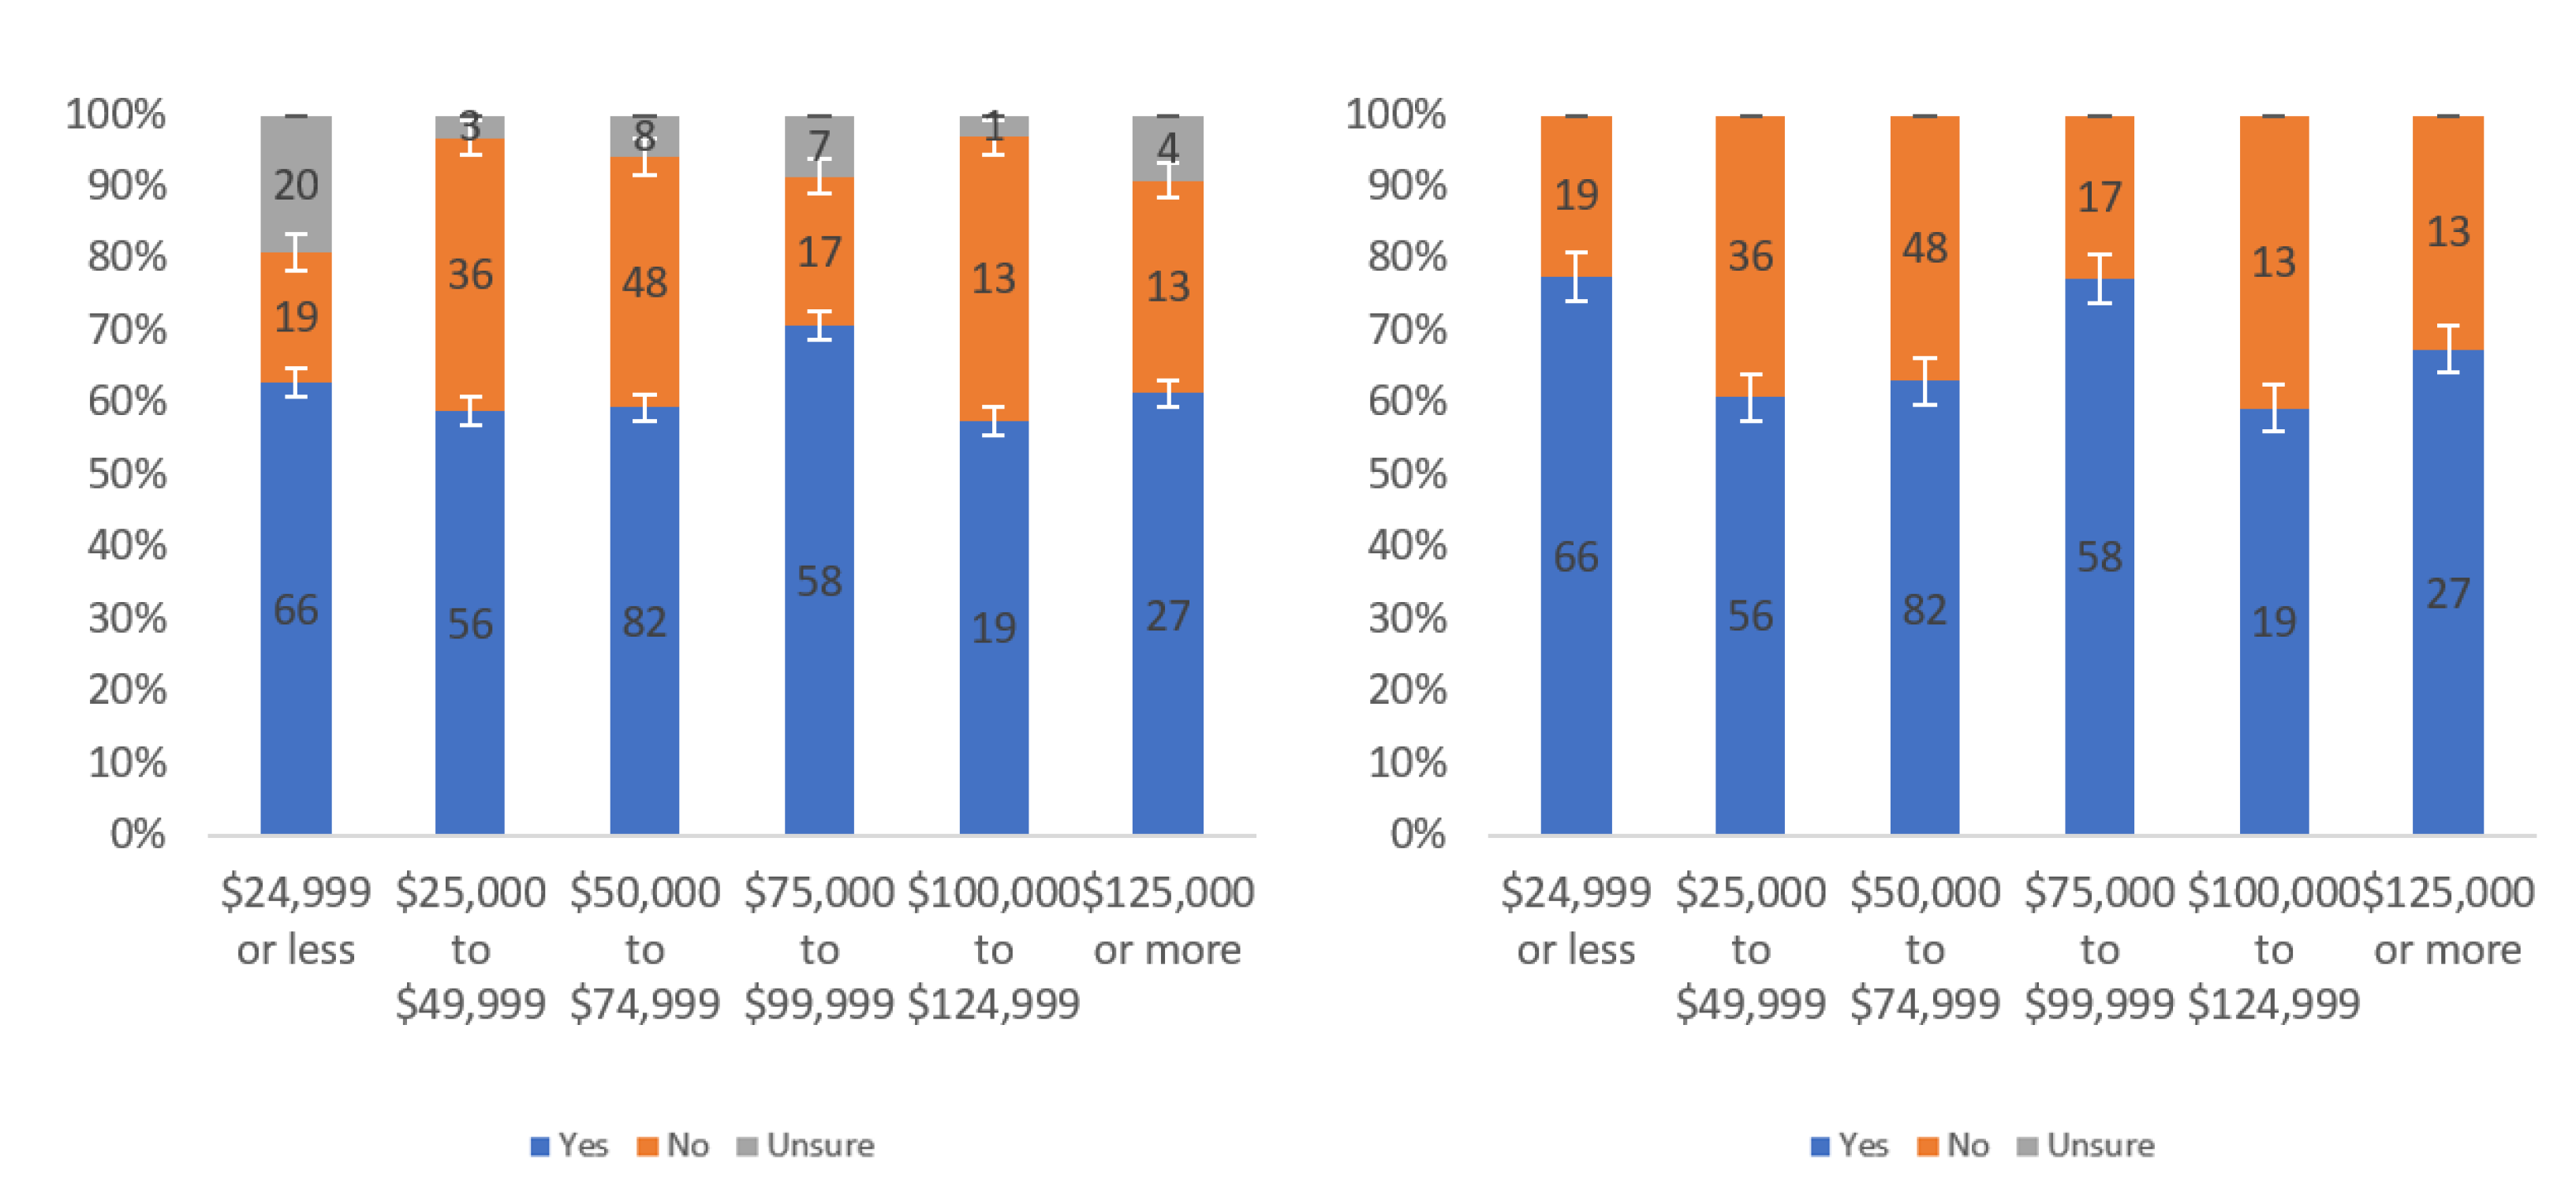
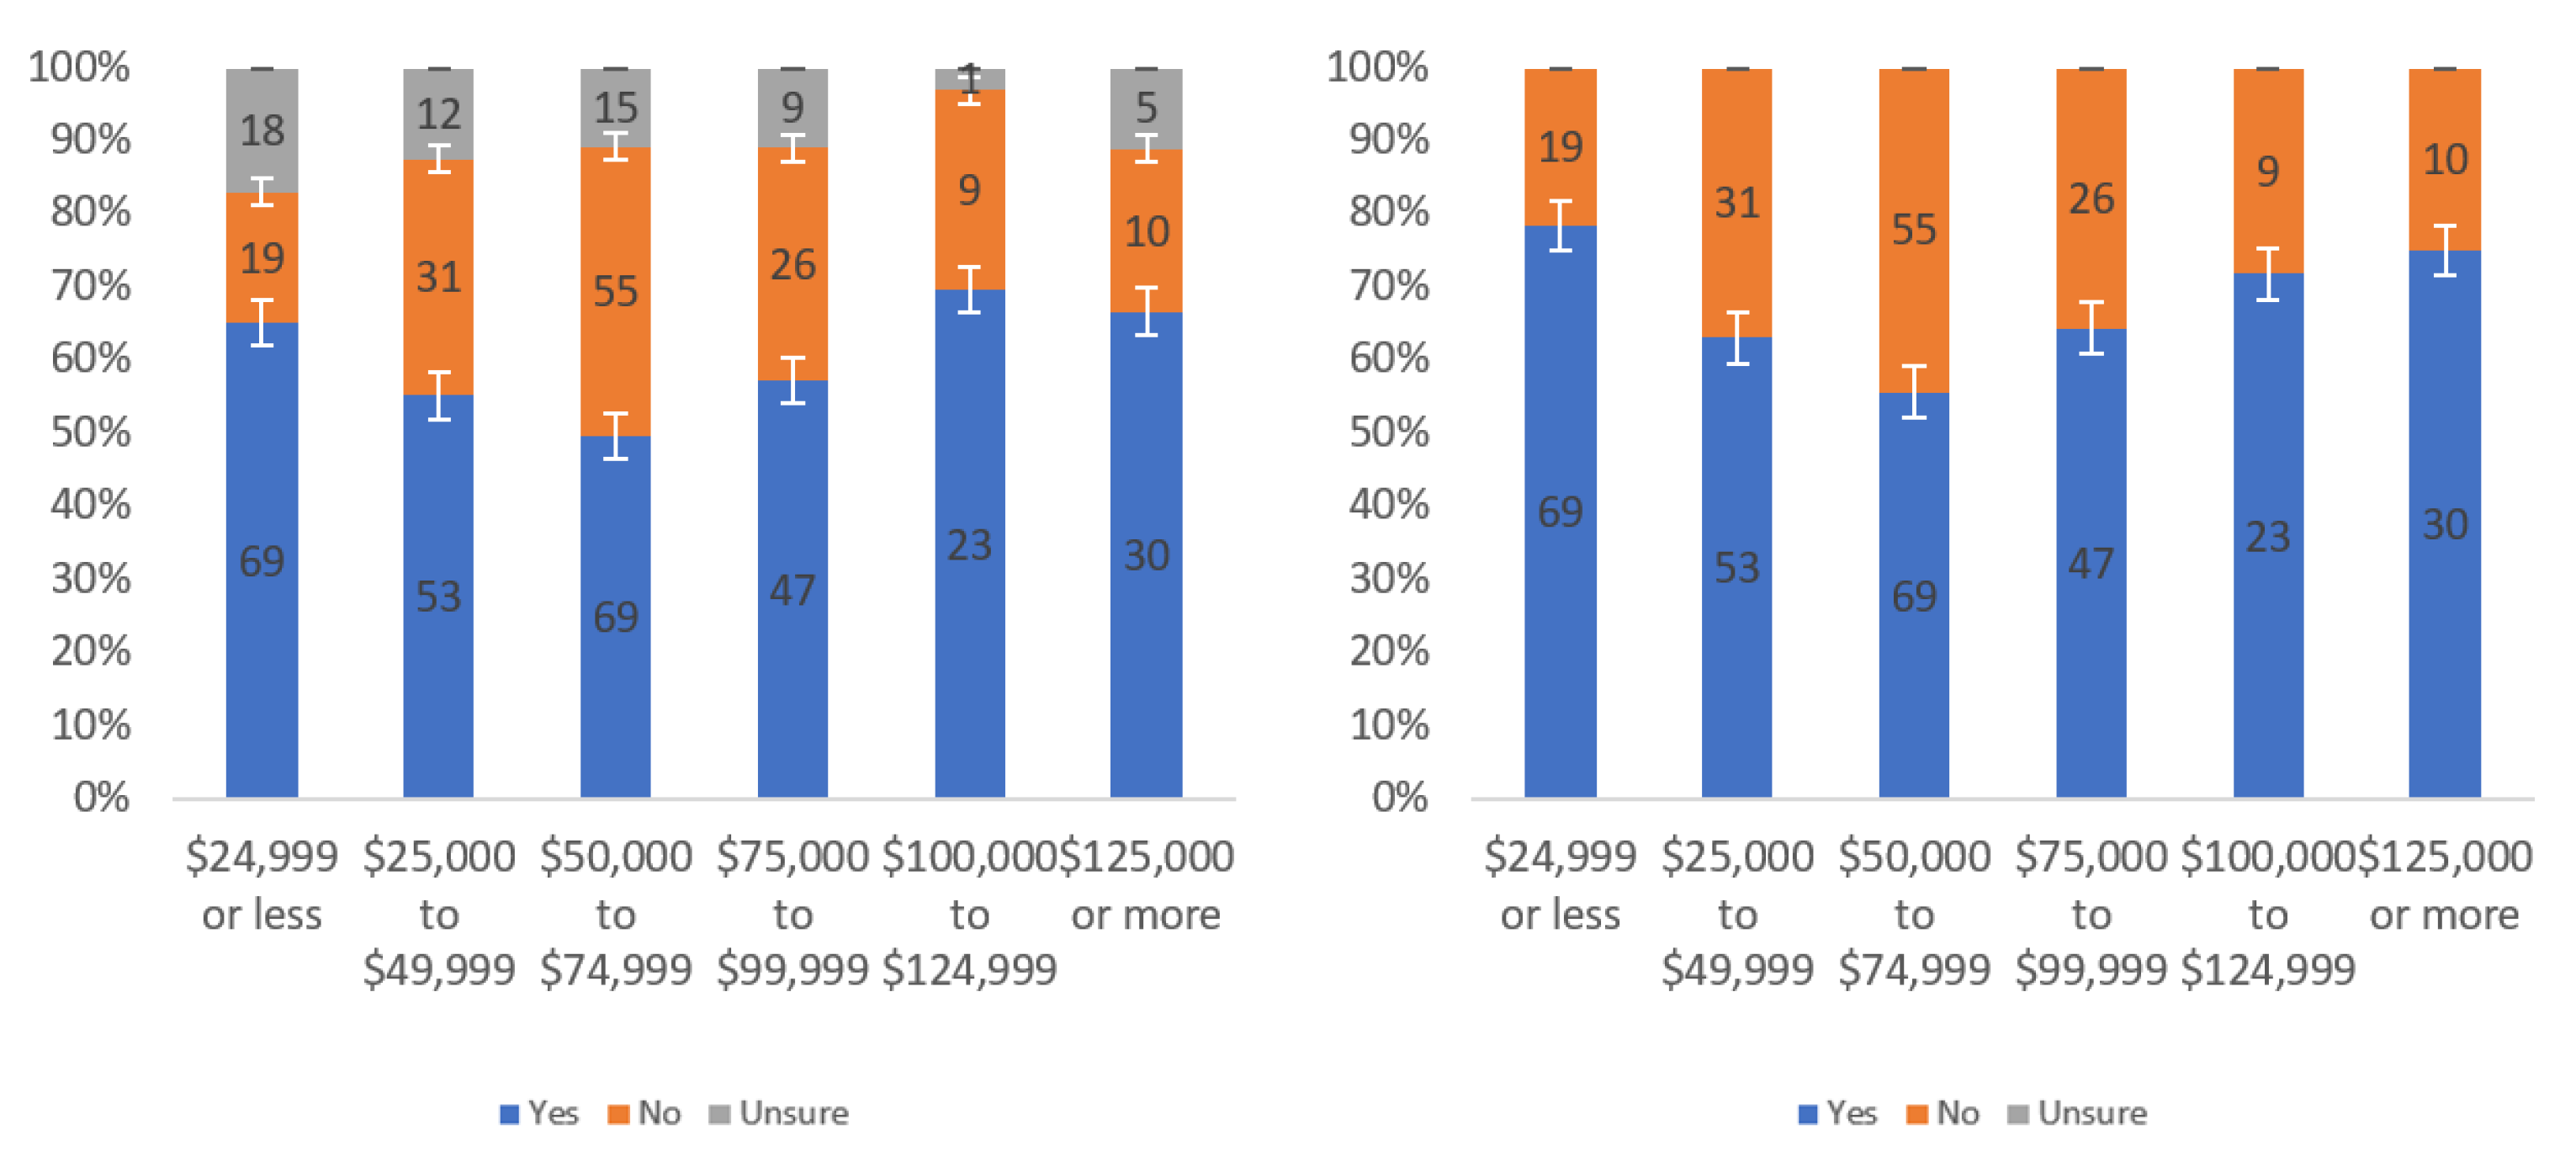
Responses regarding label helpfulness by income level including (left) and excluding (right) unsure responses.
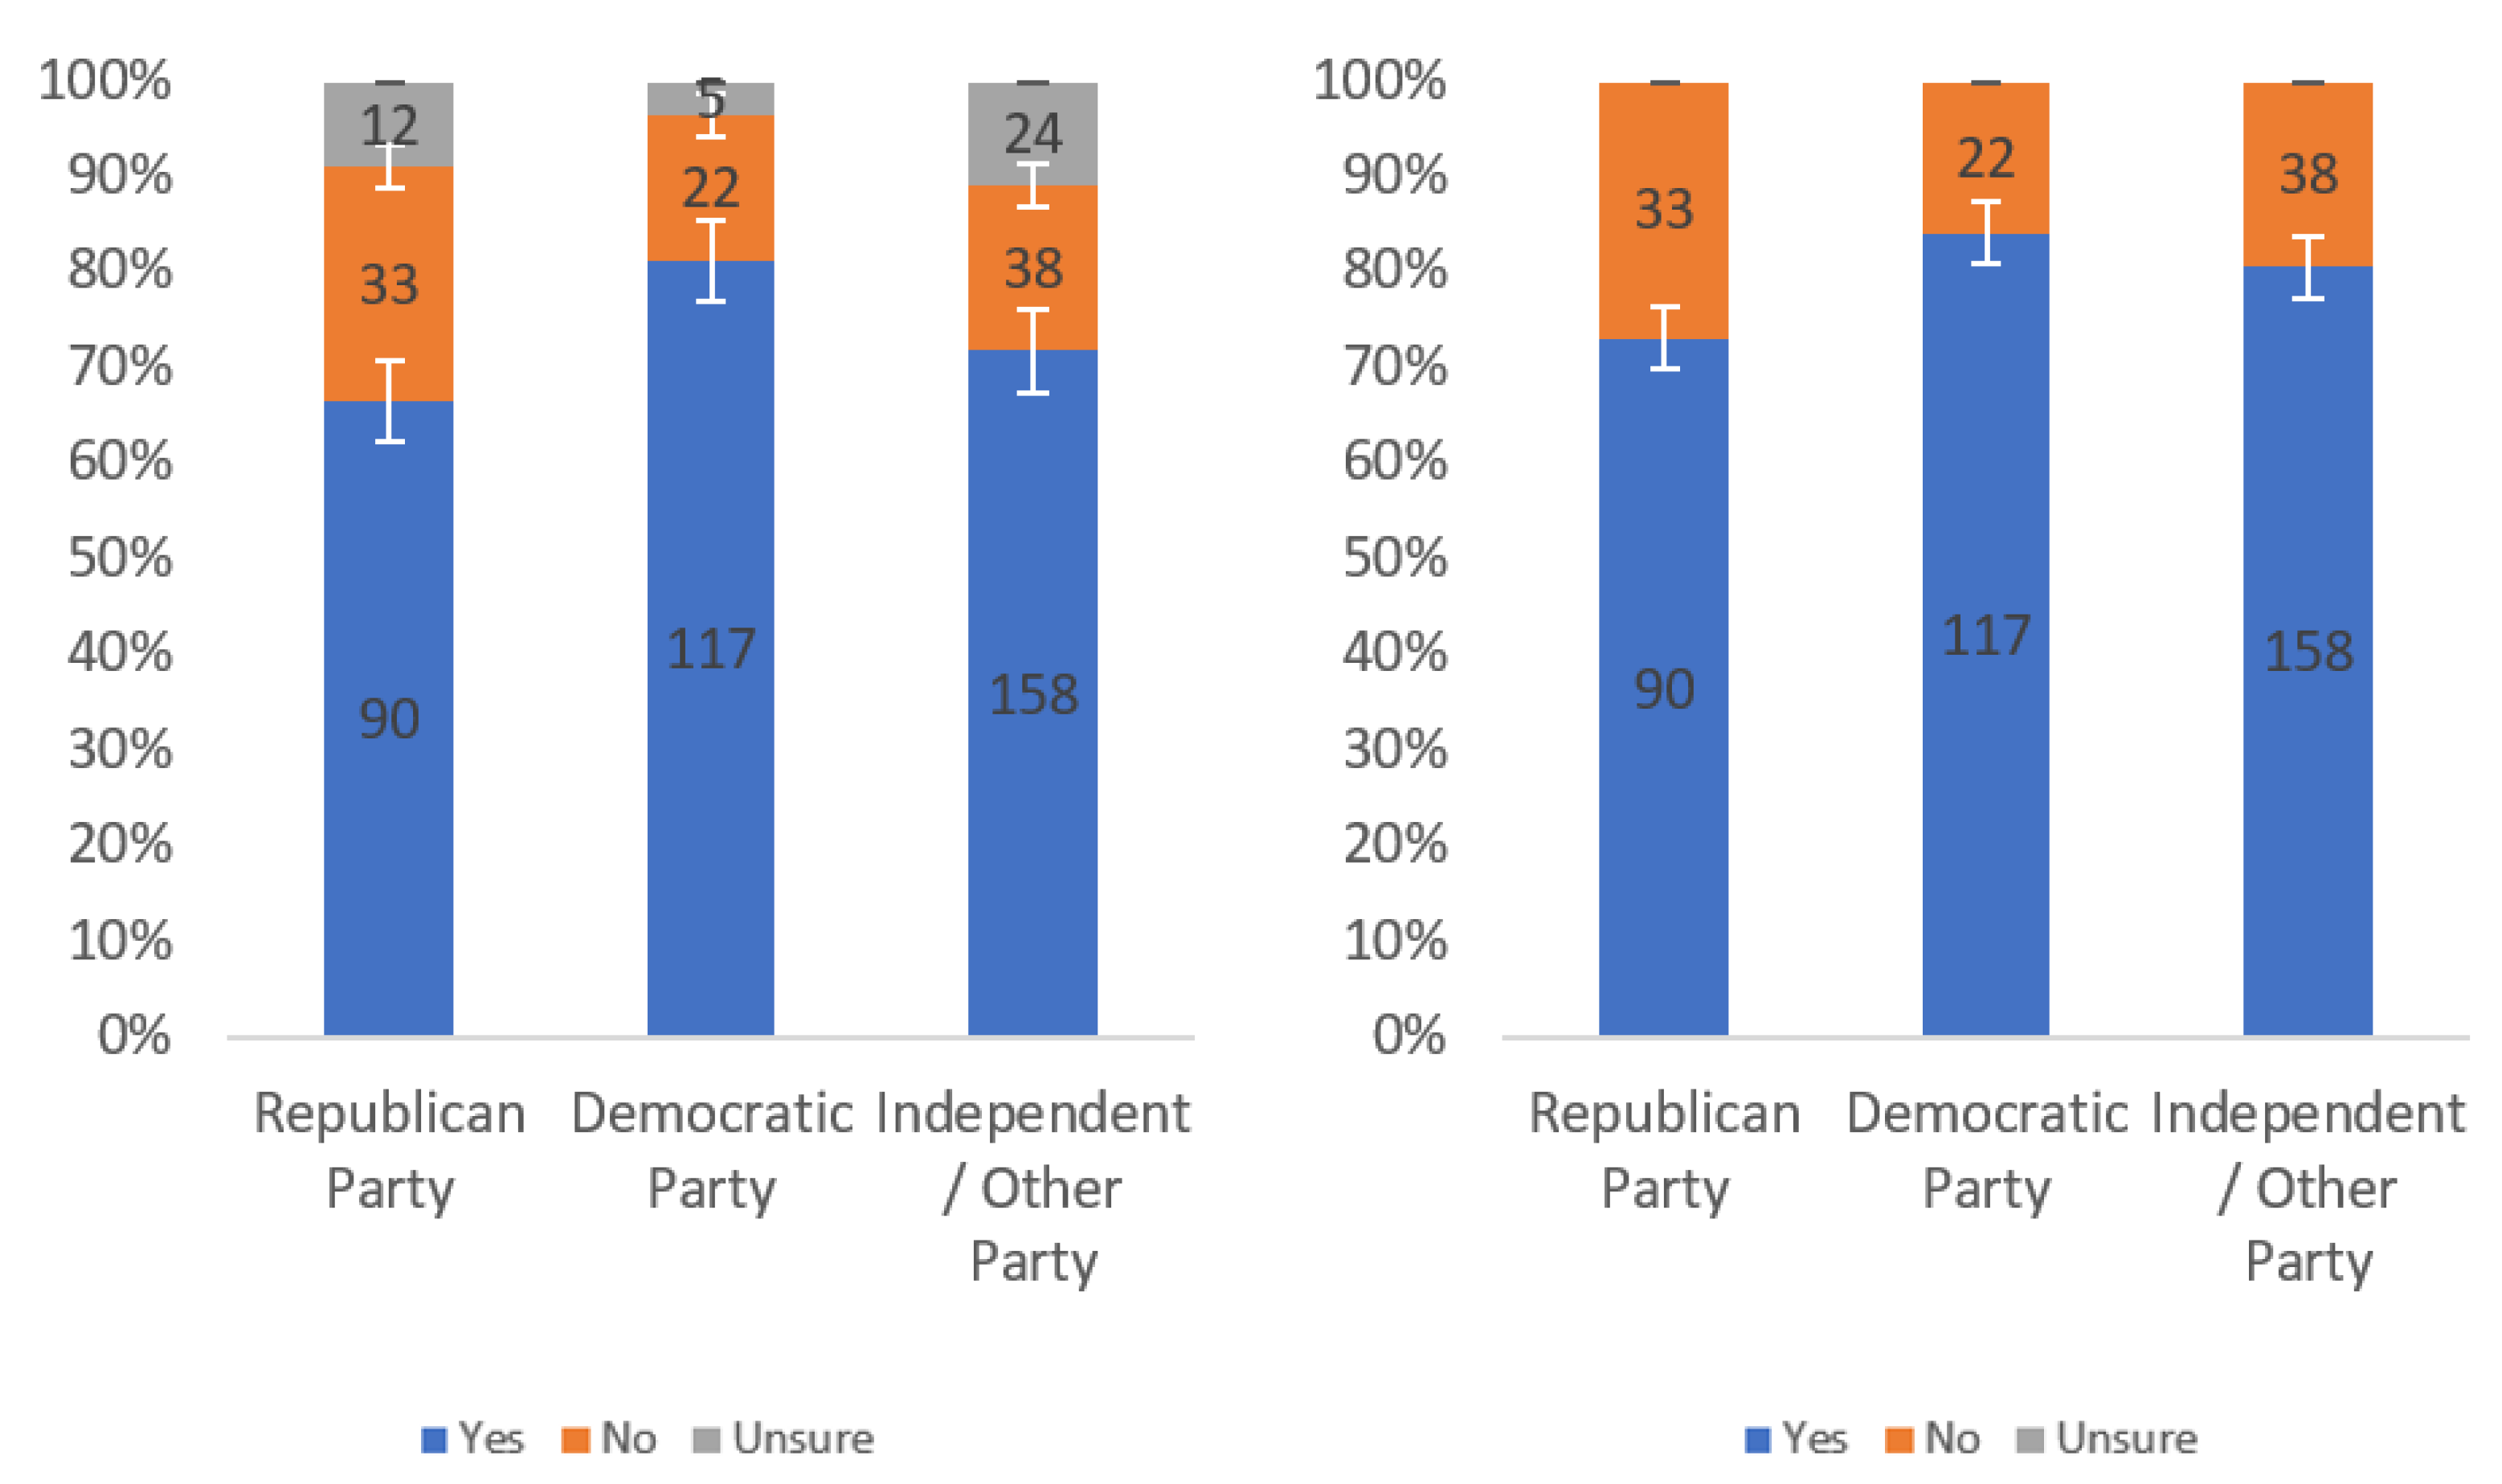
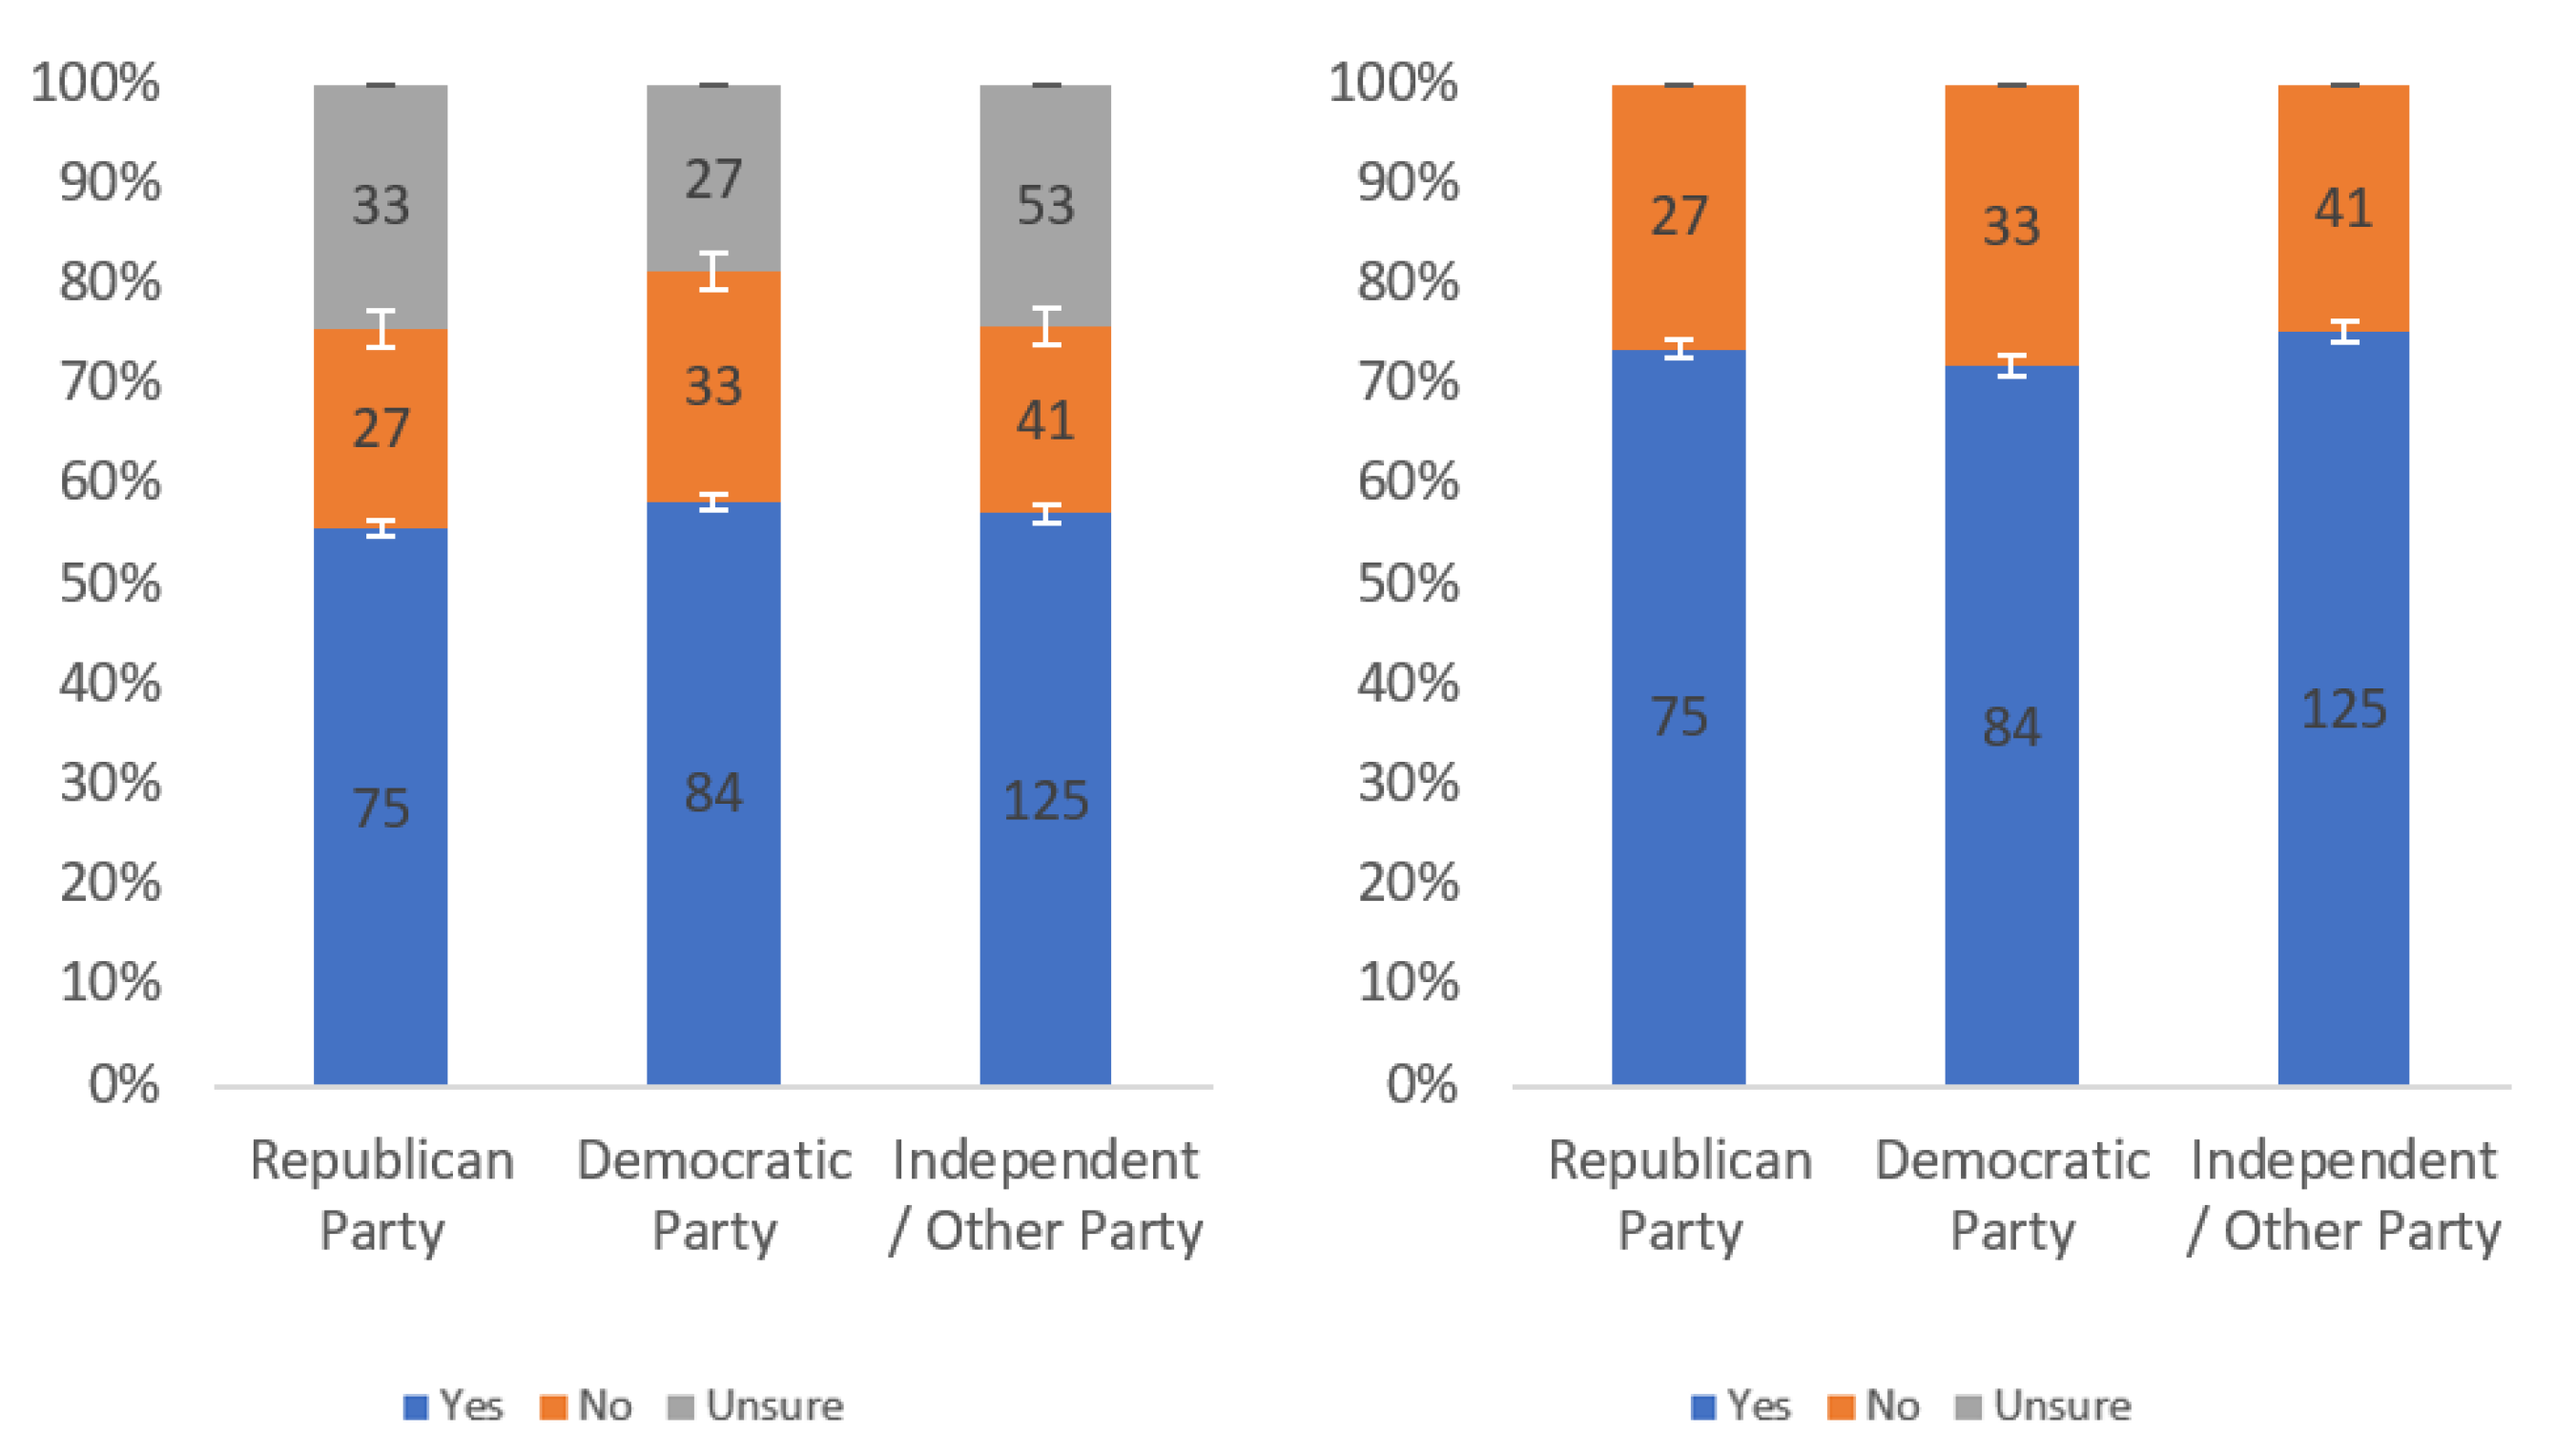
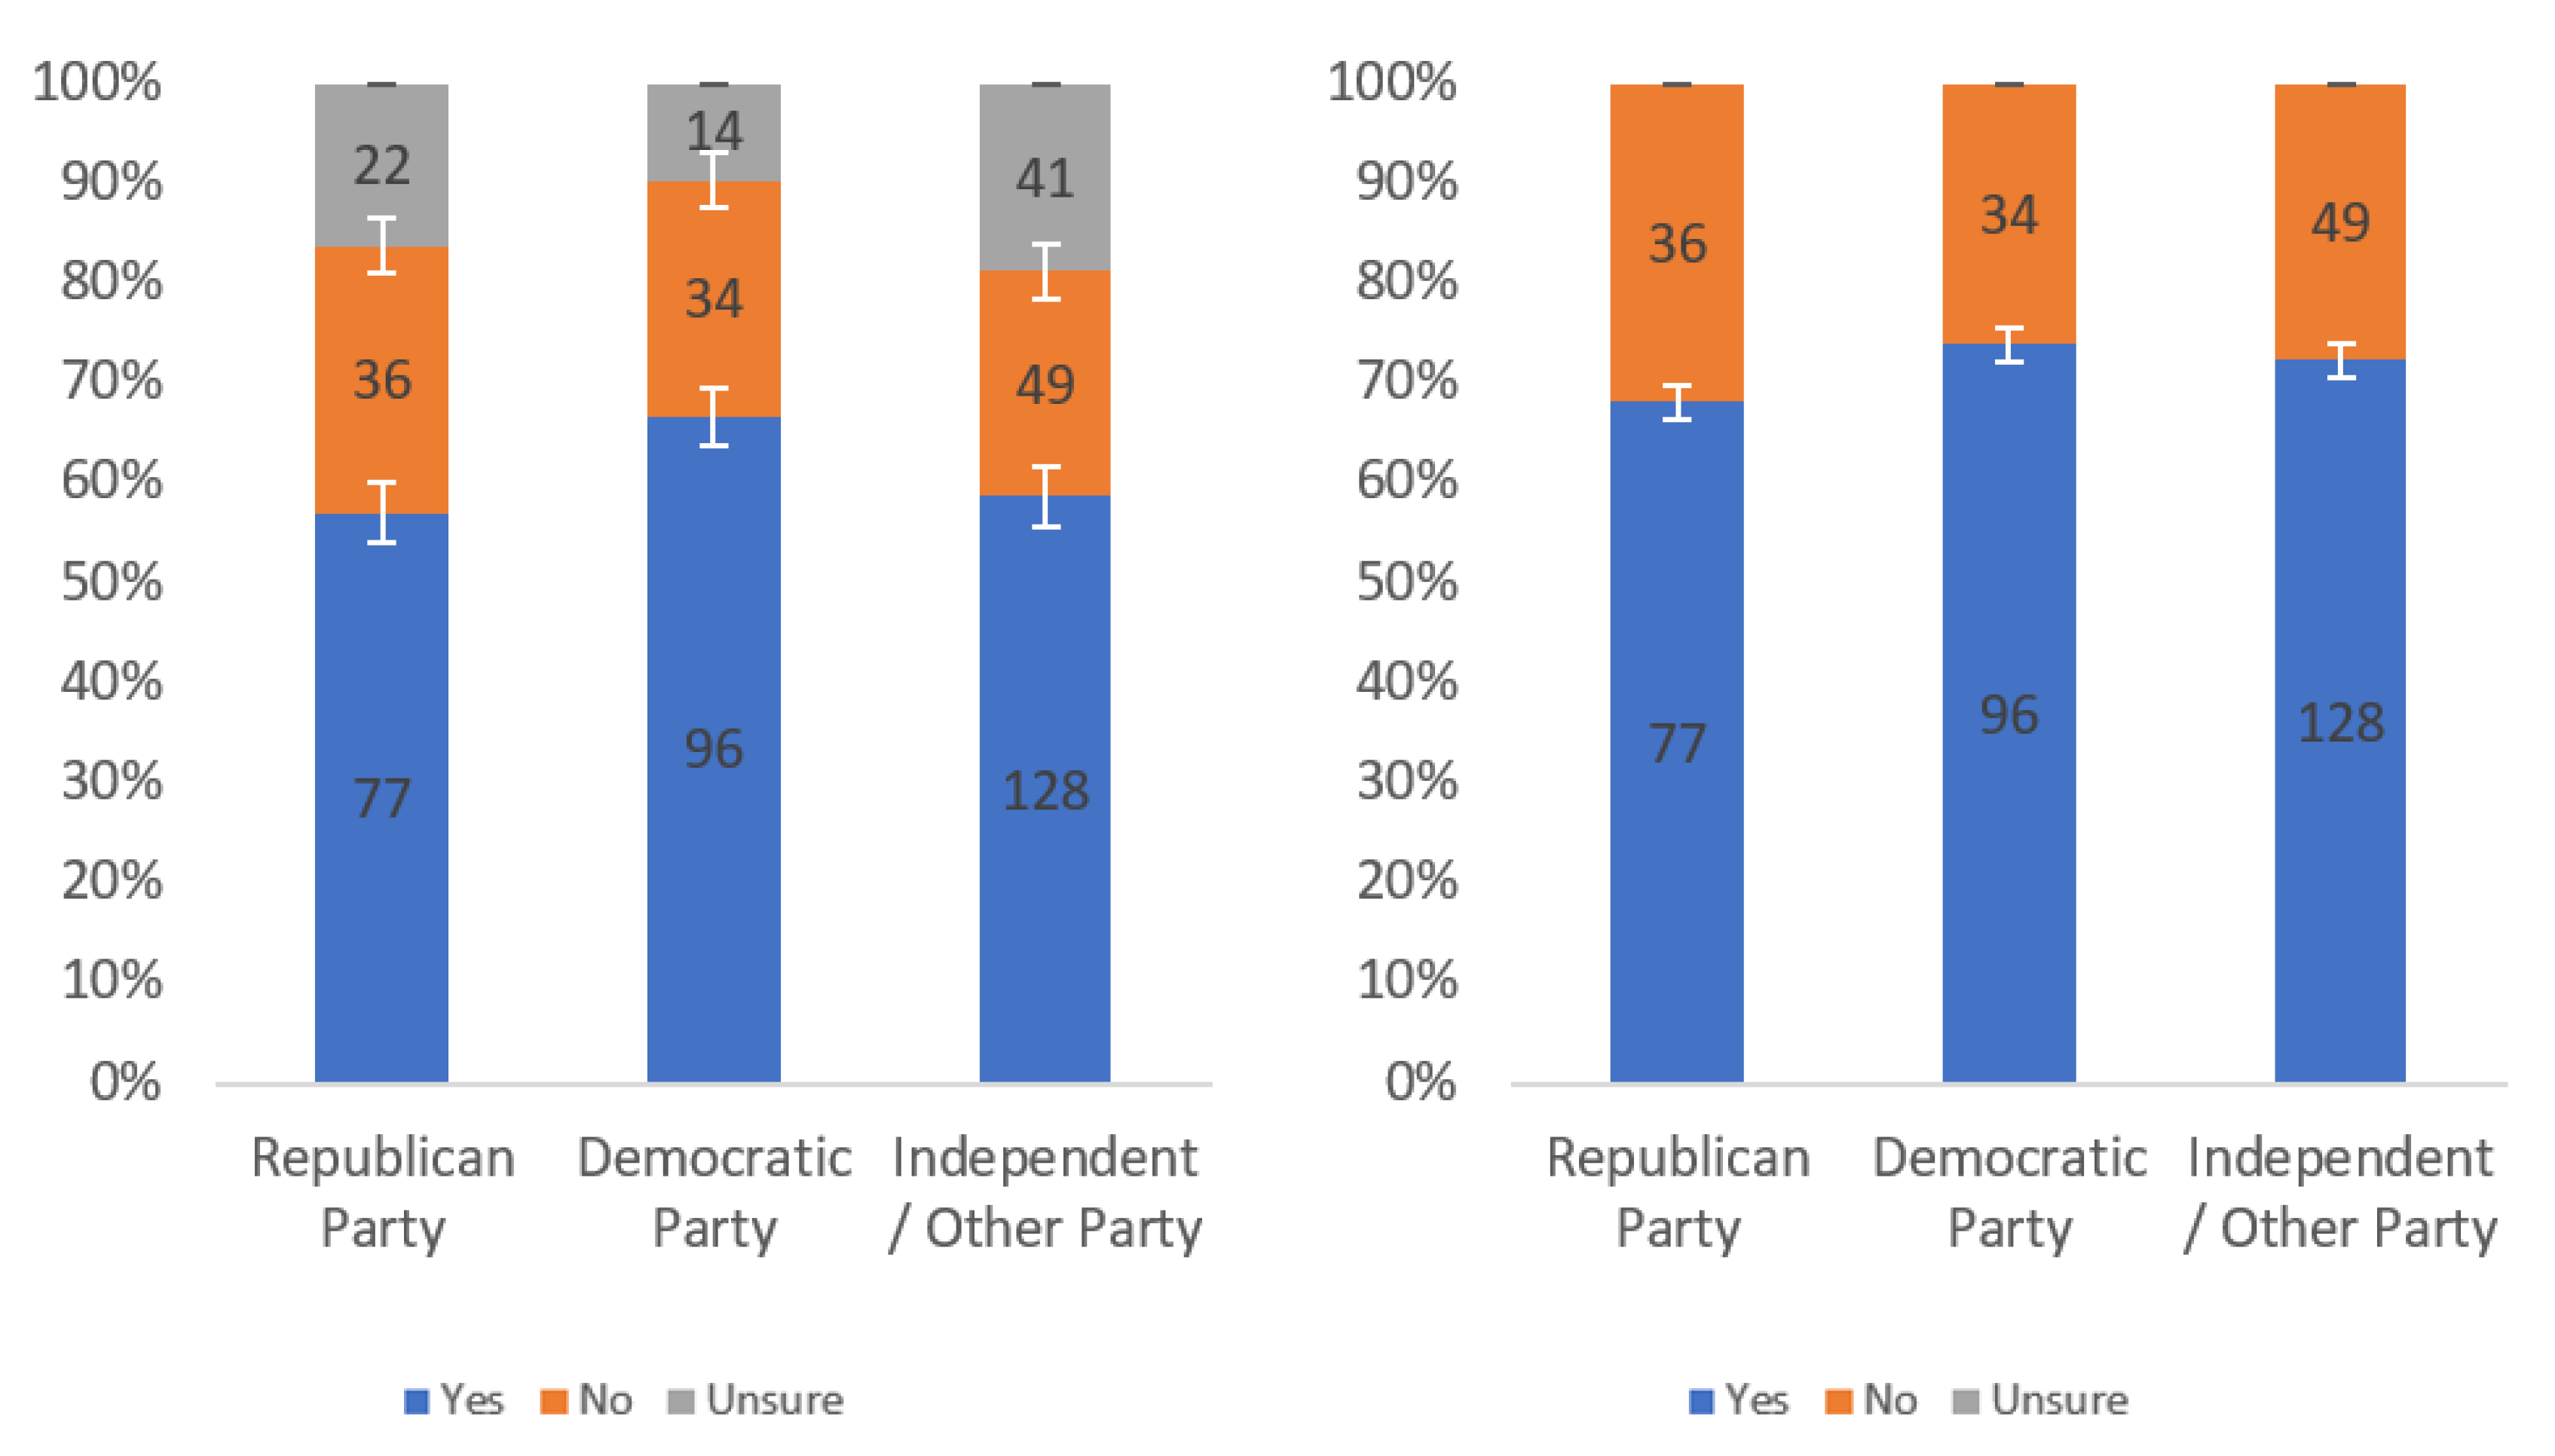
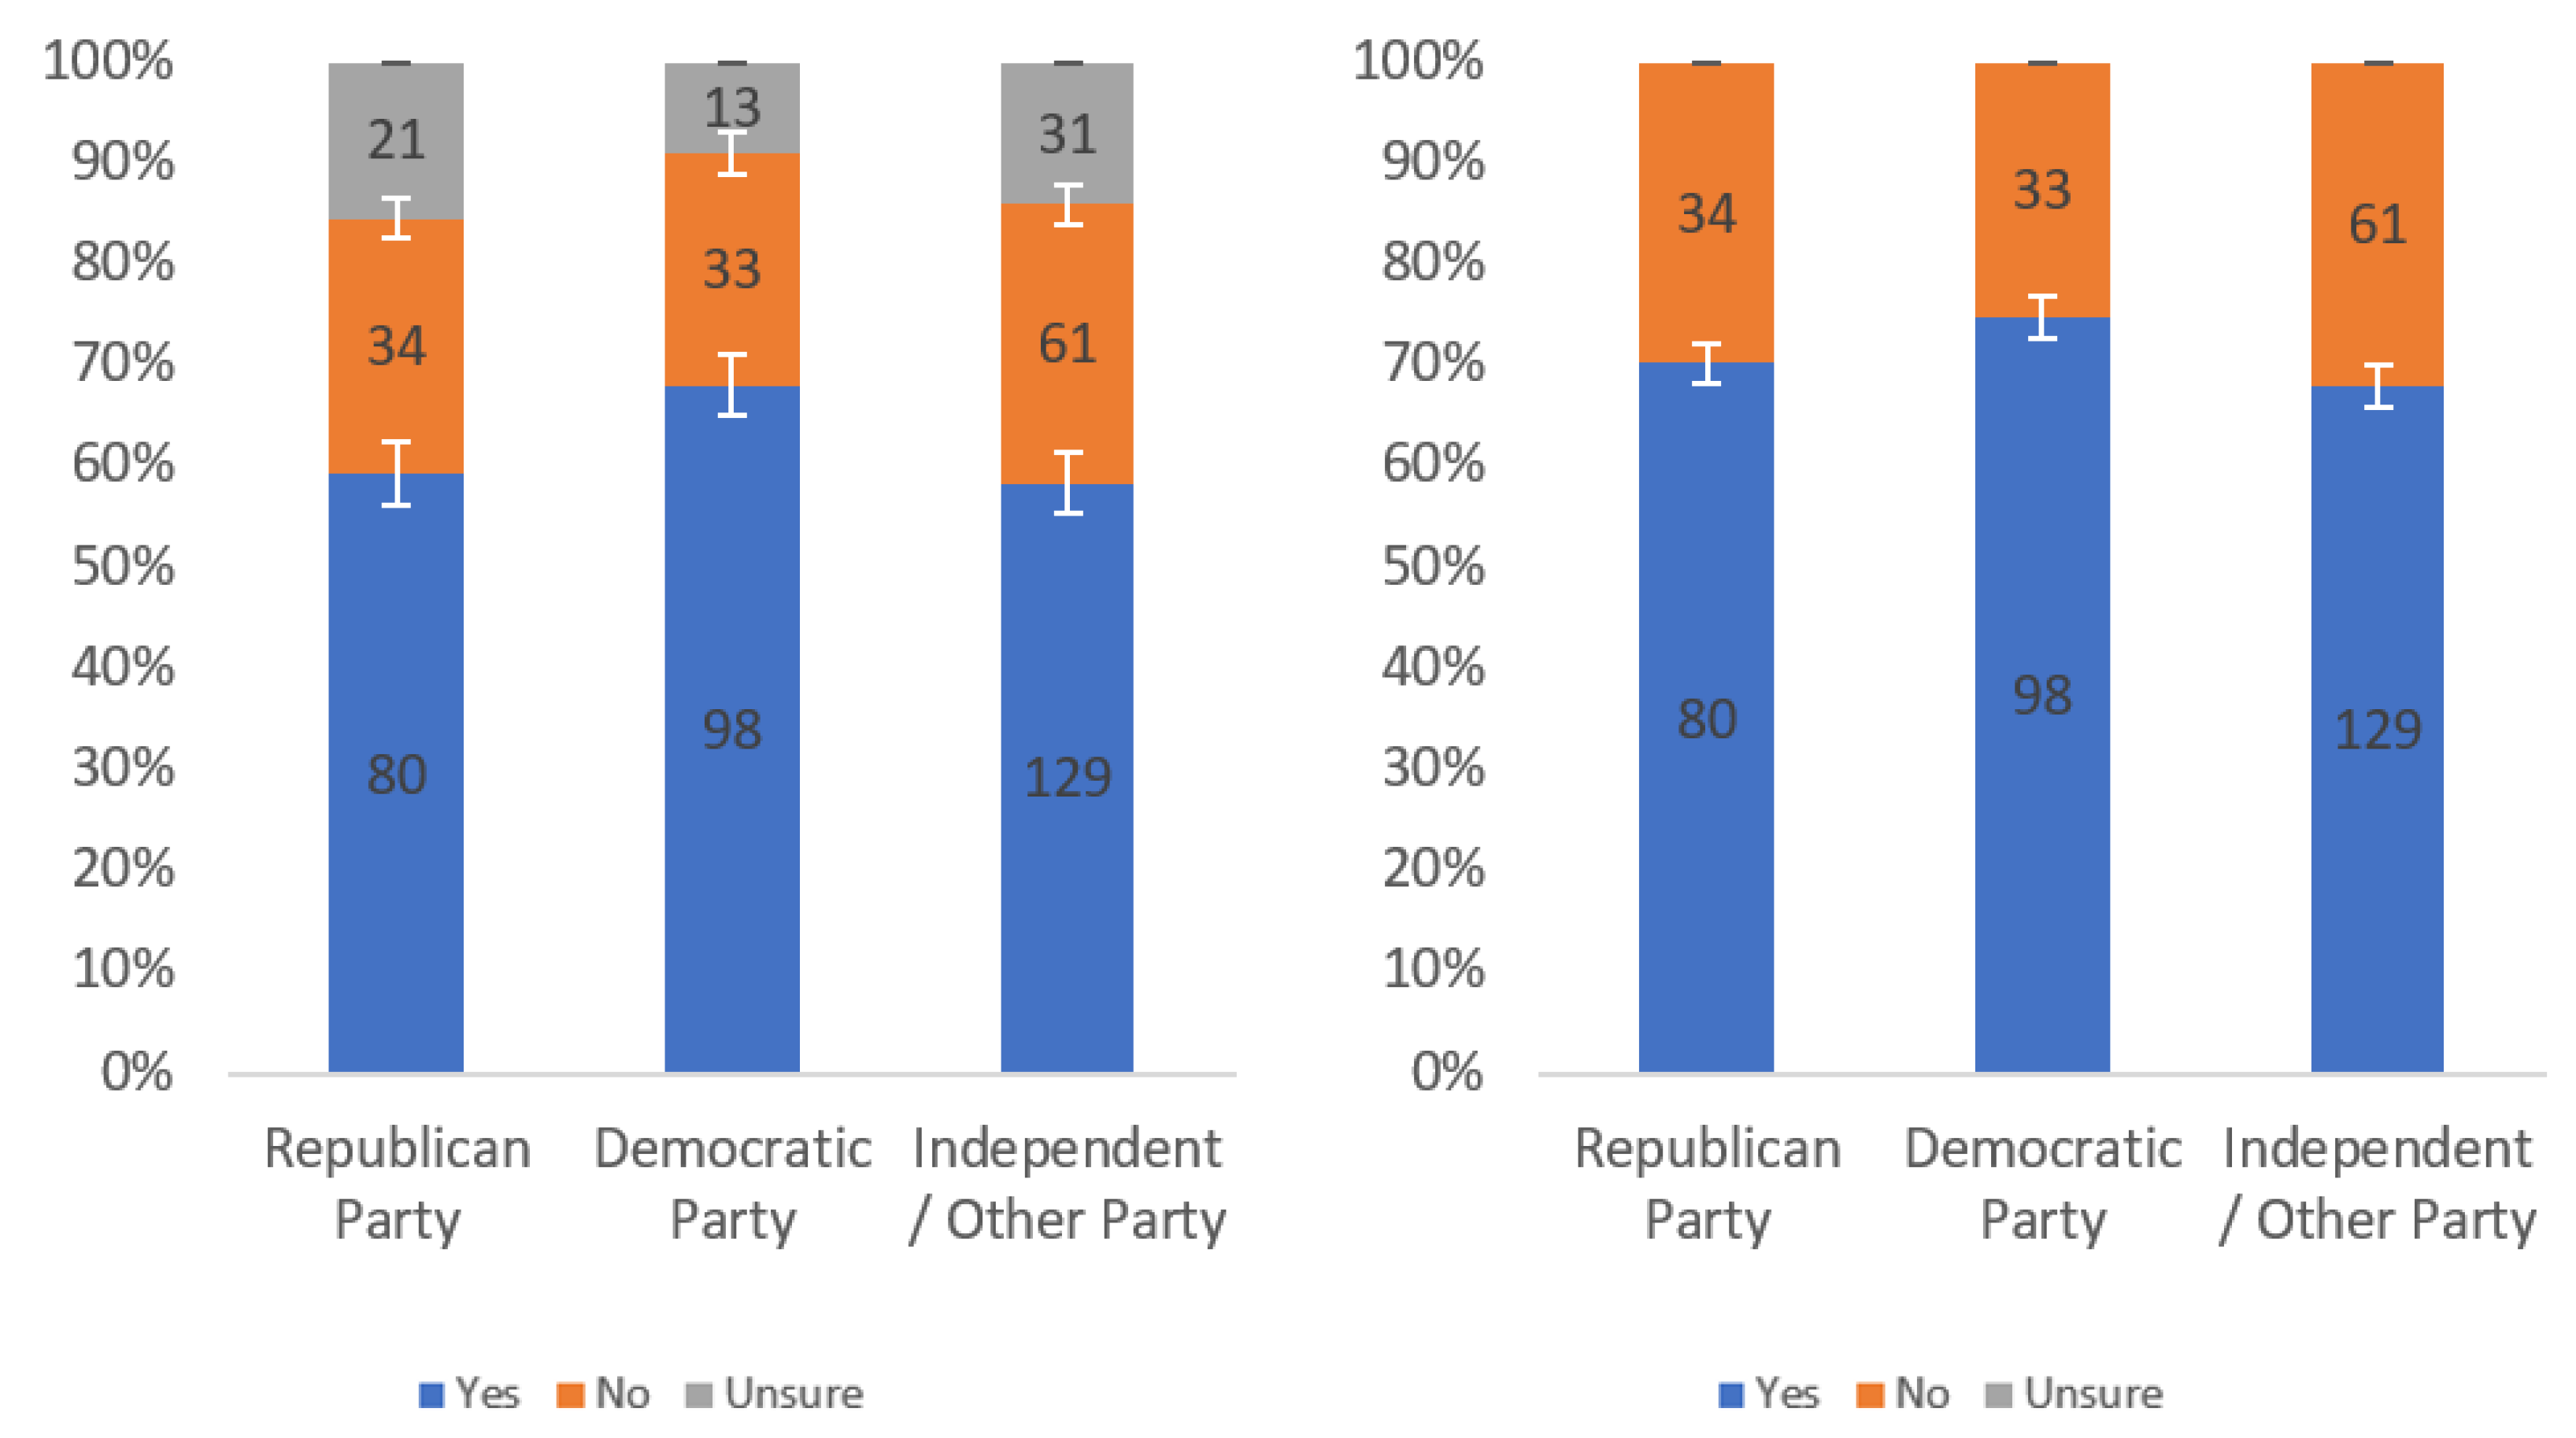
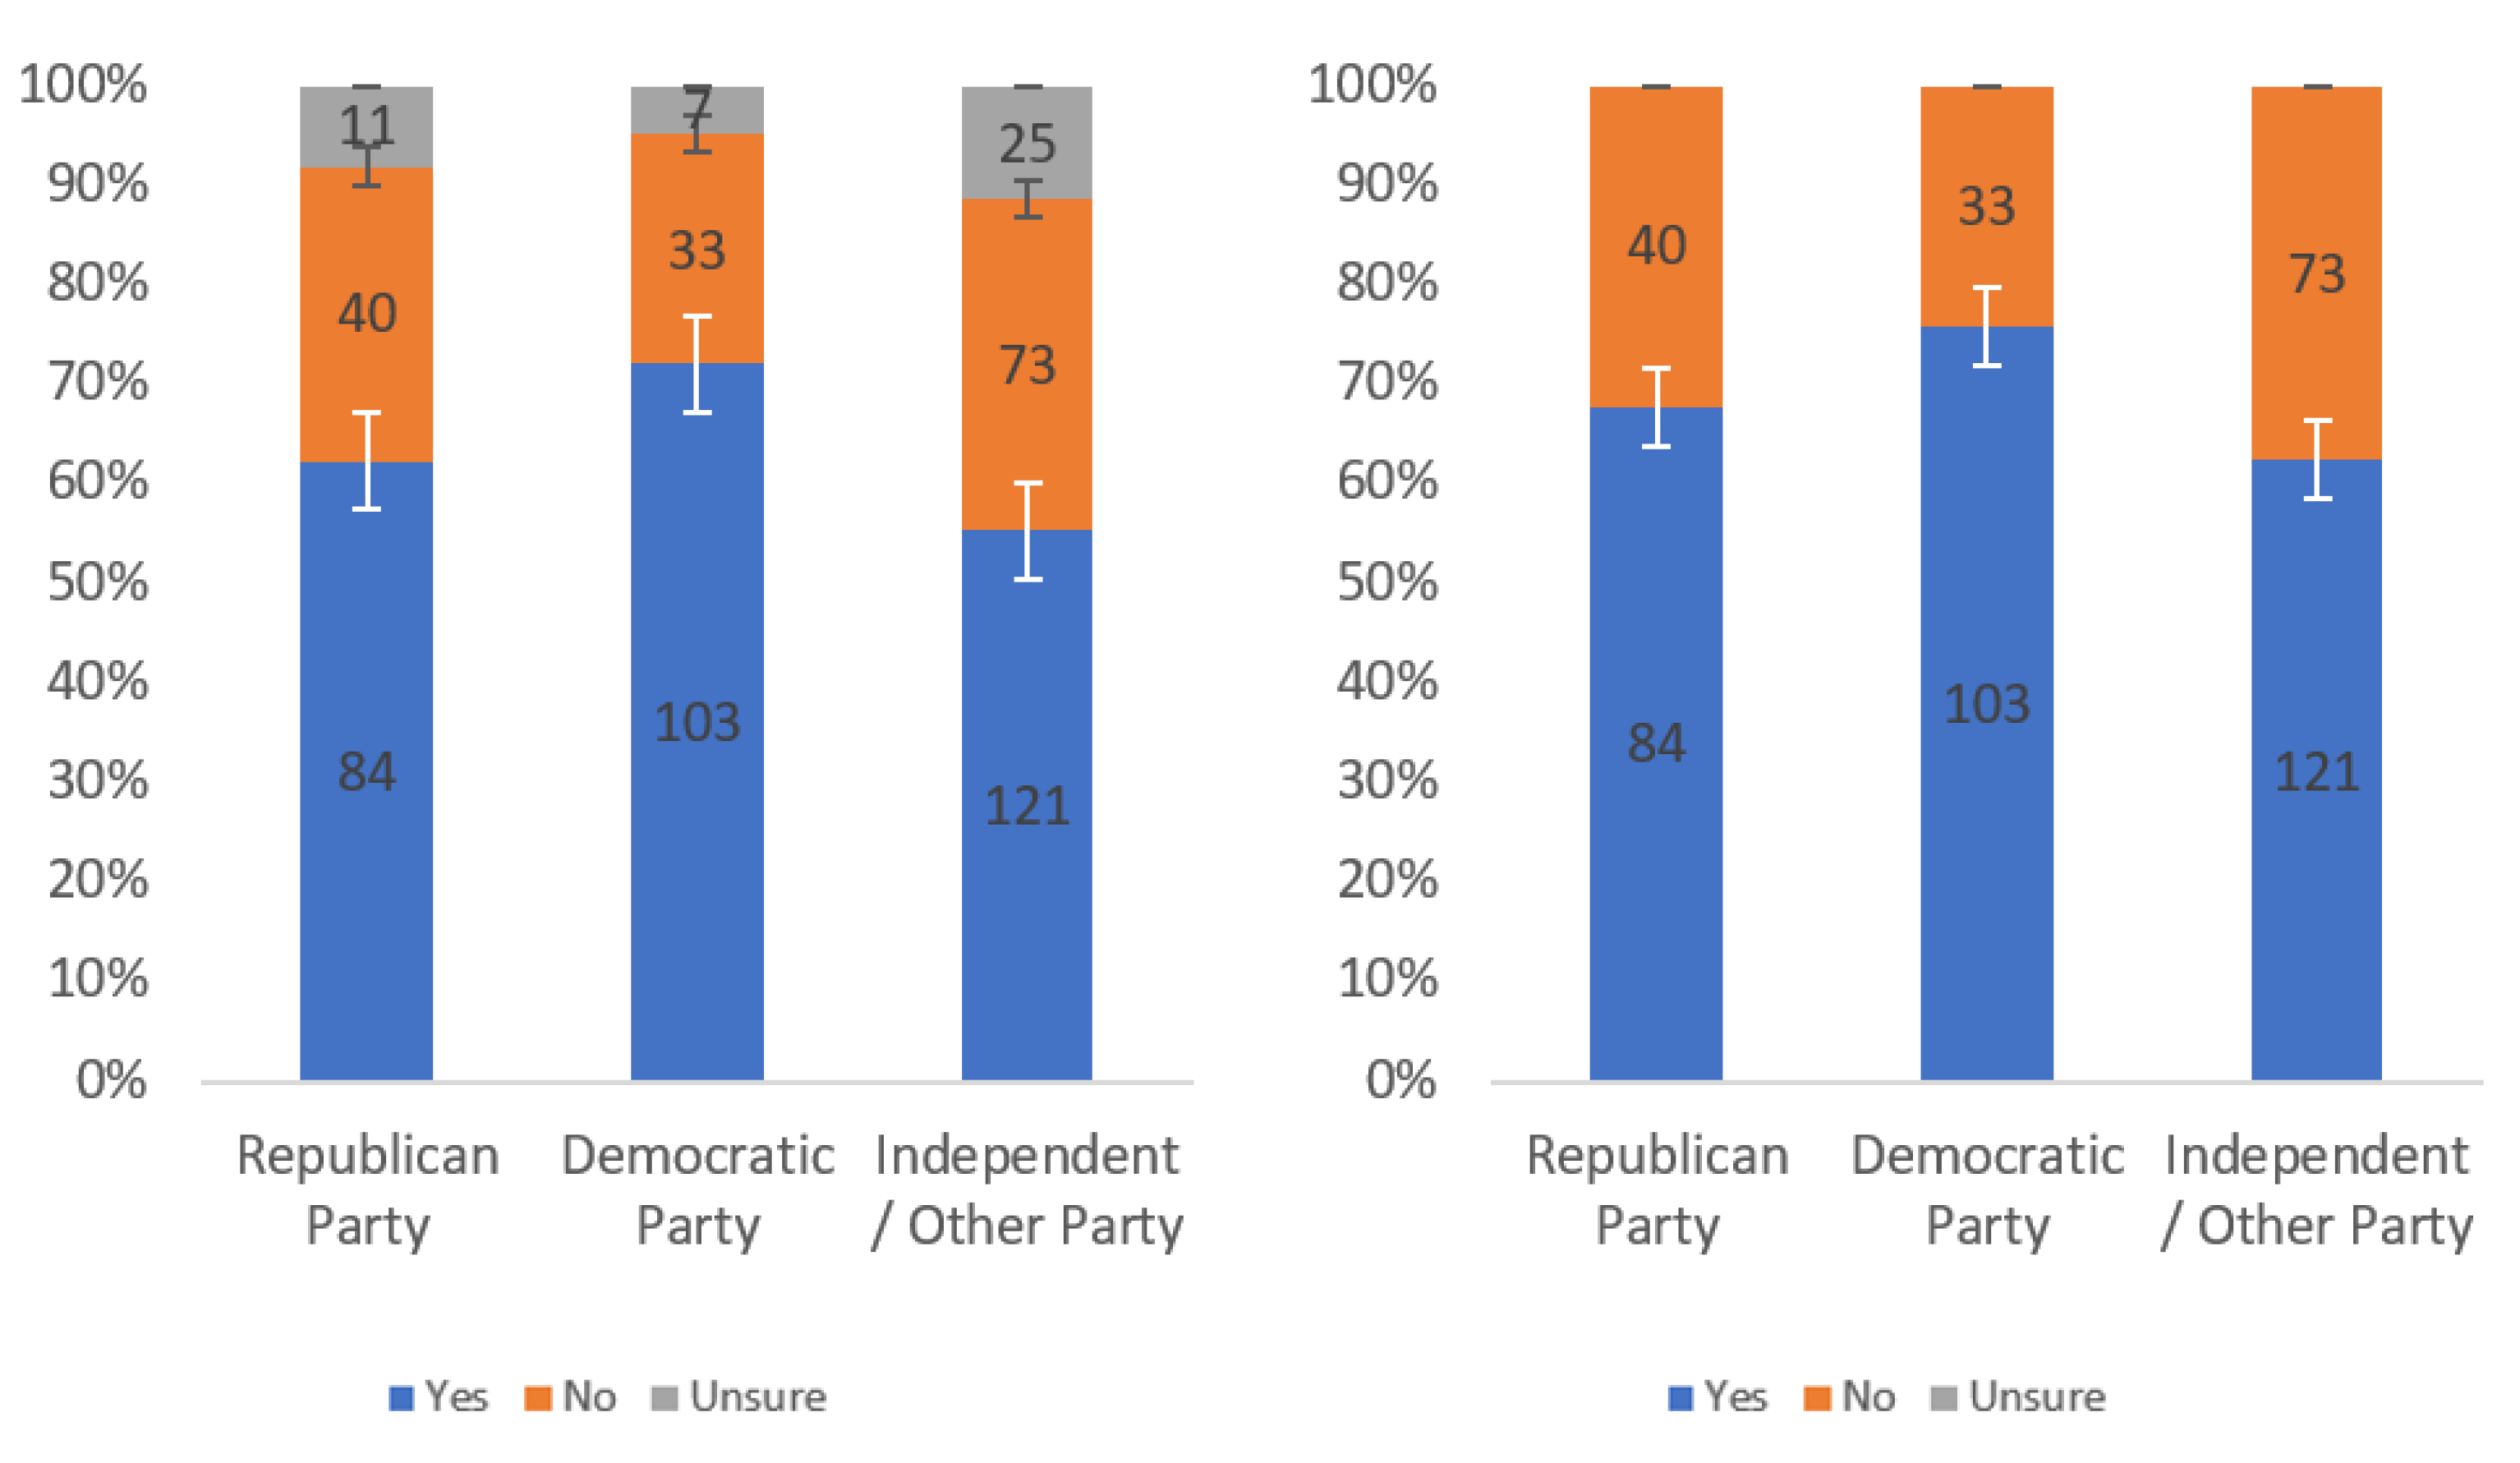
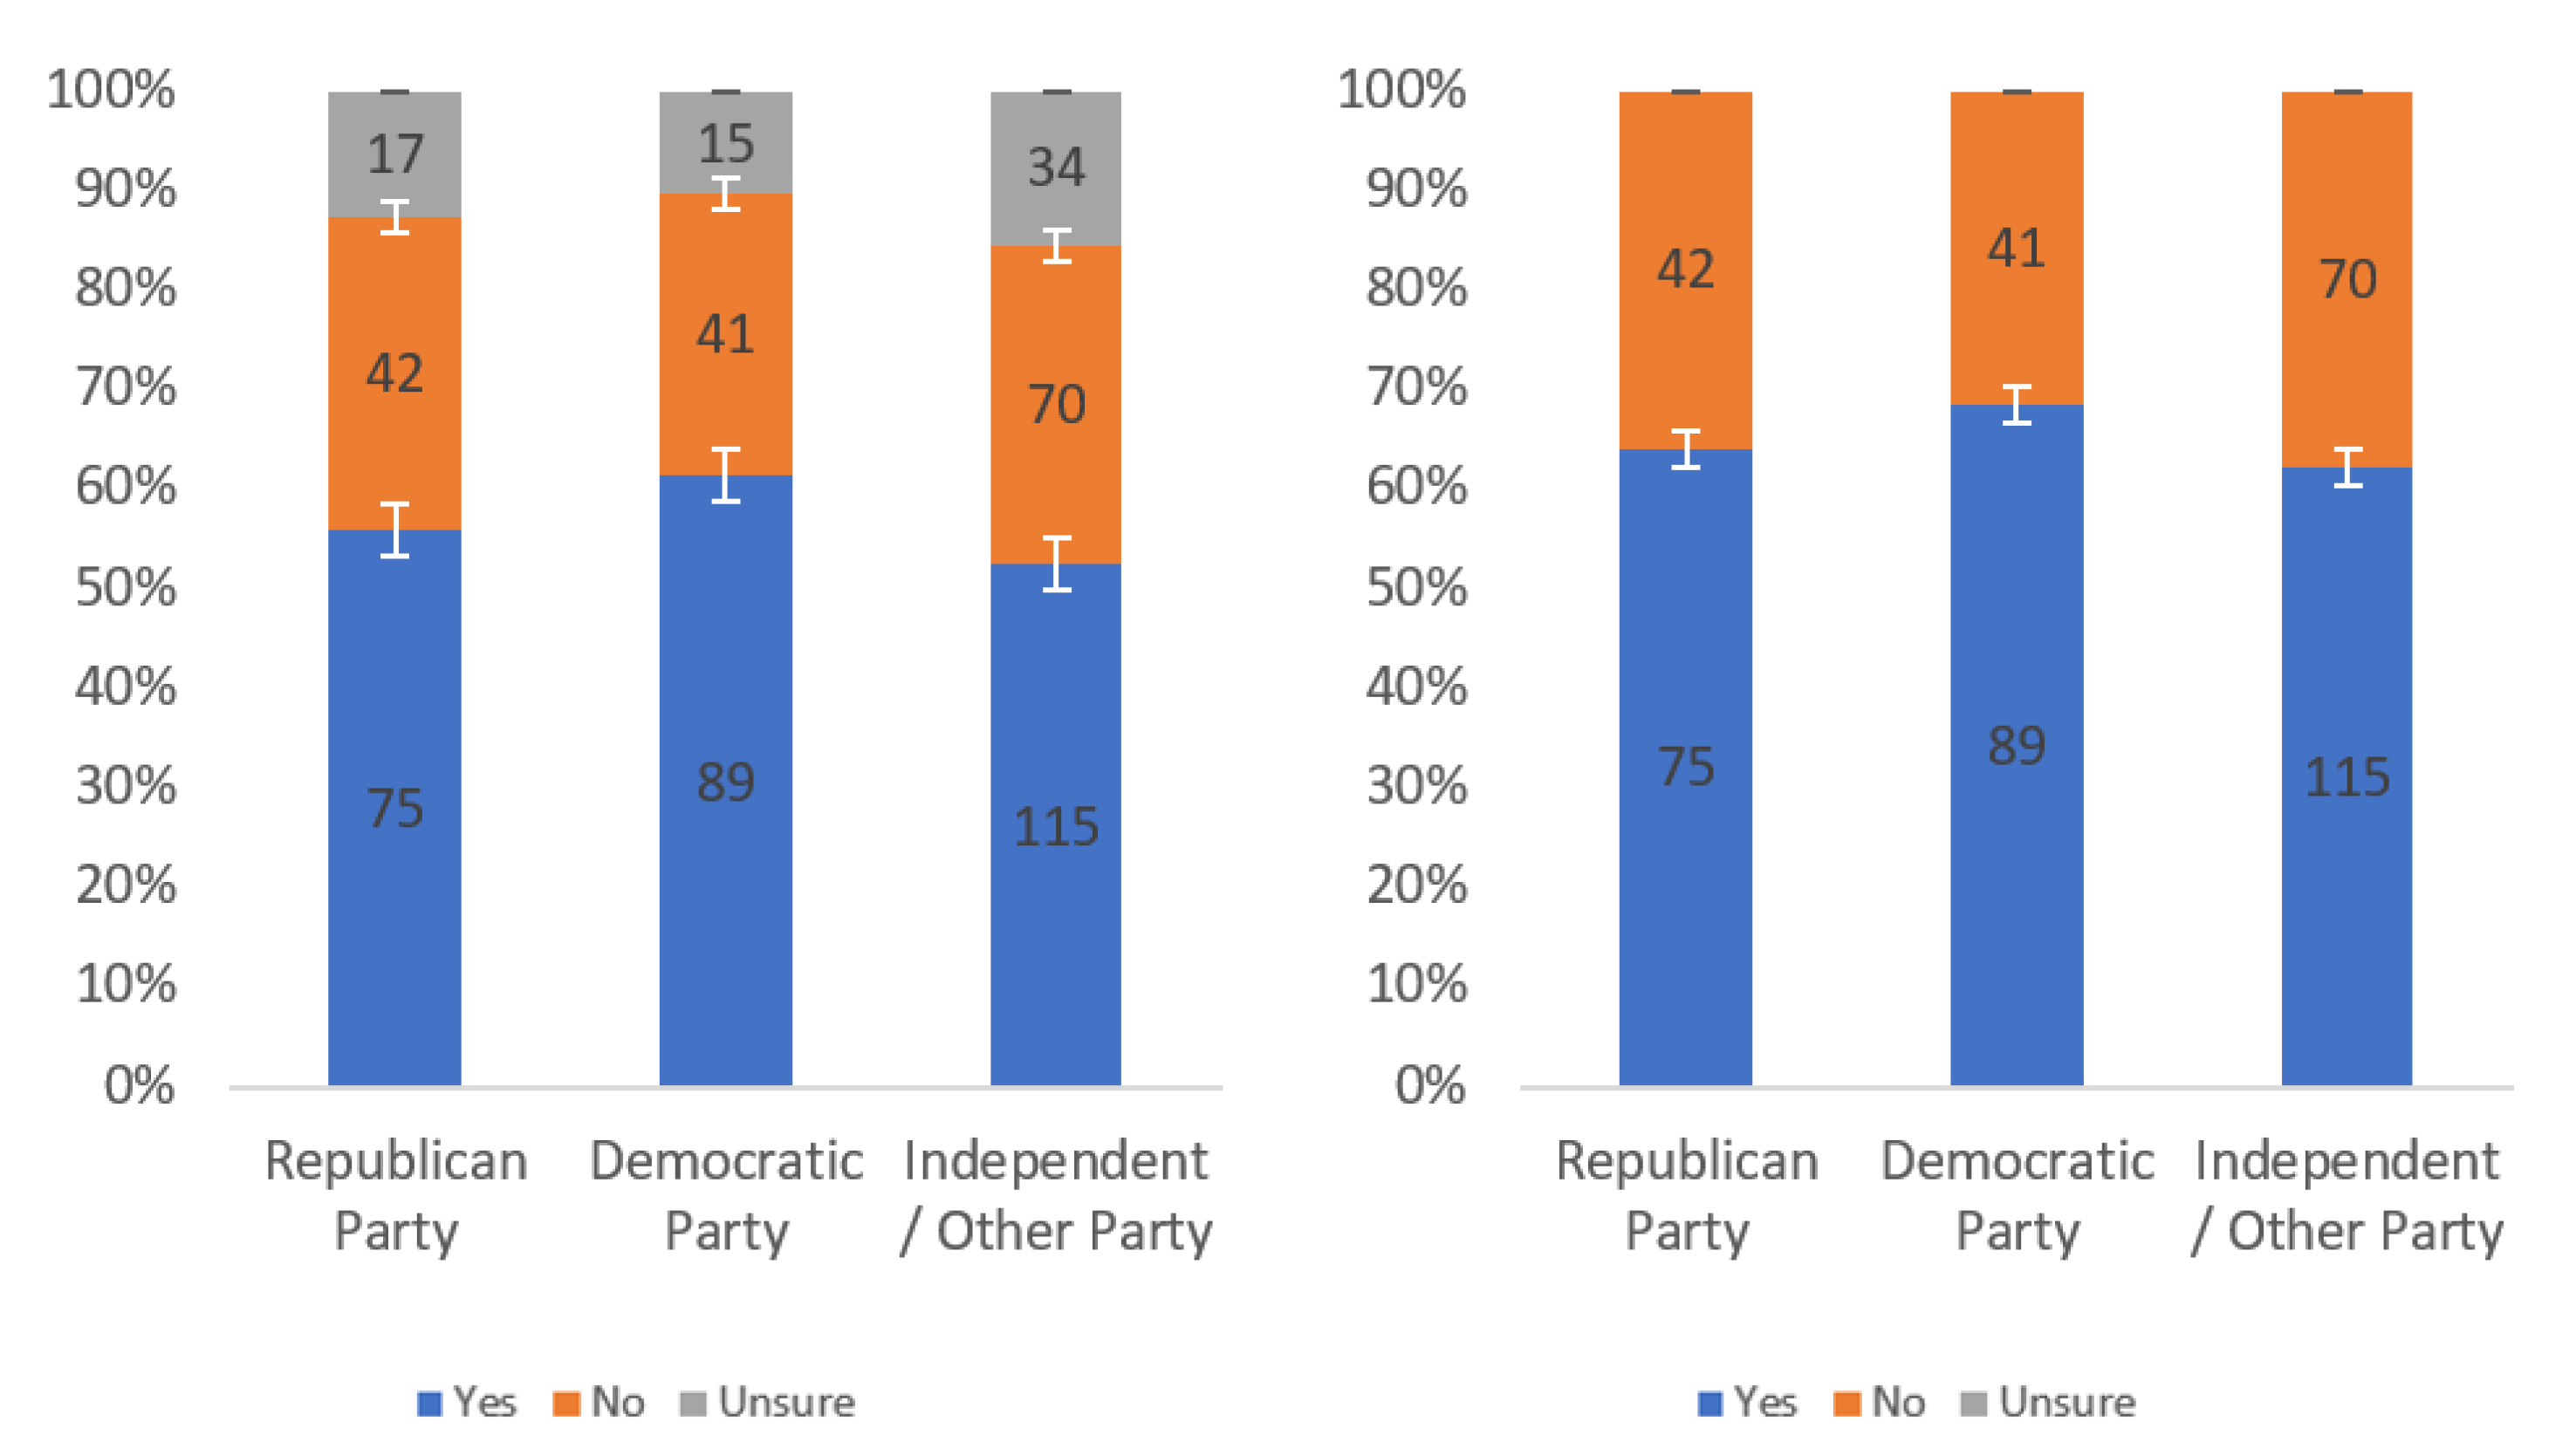
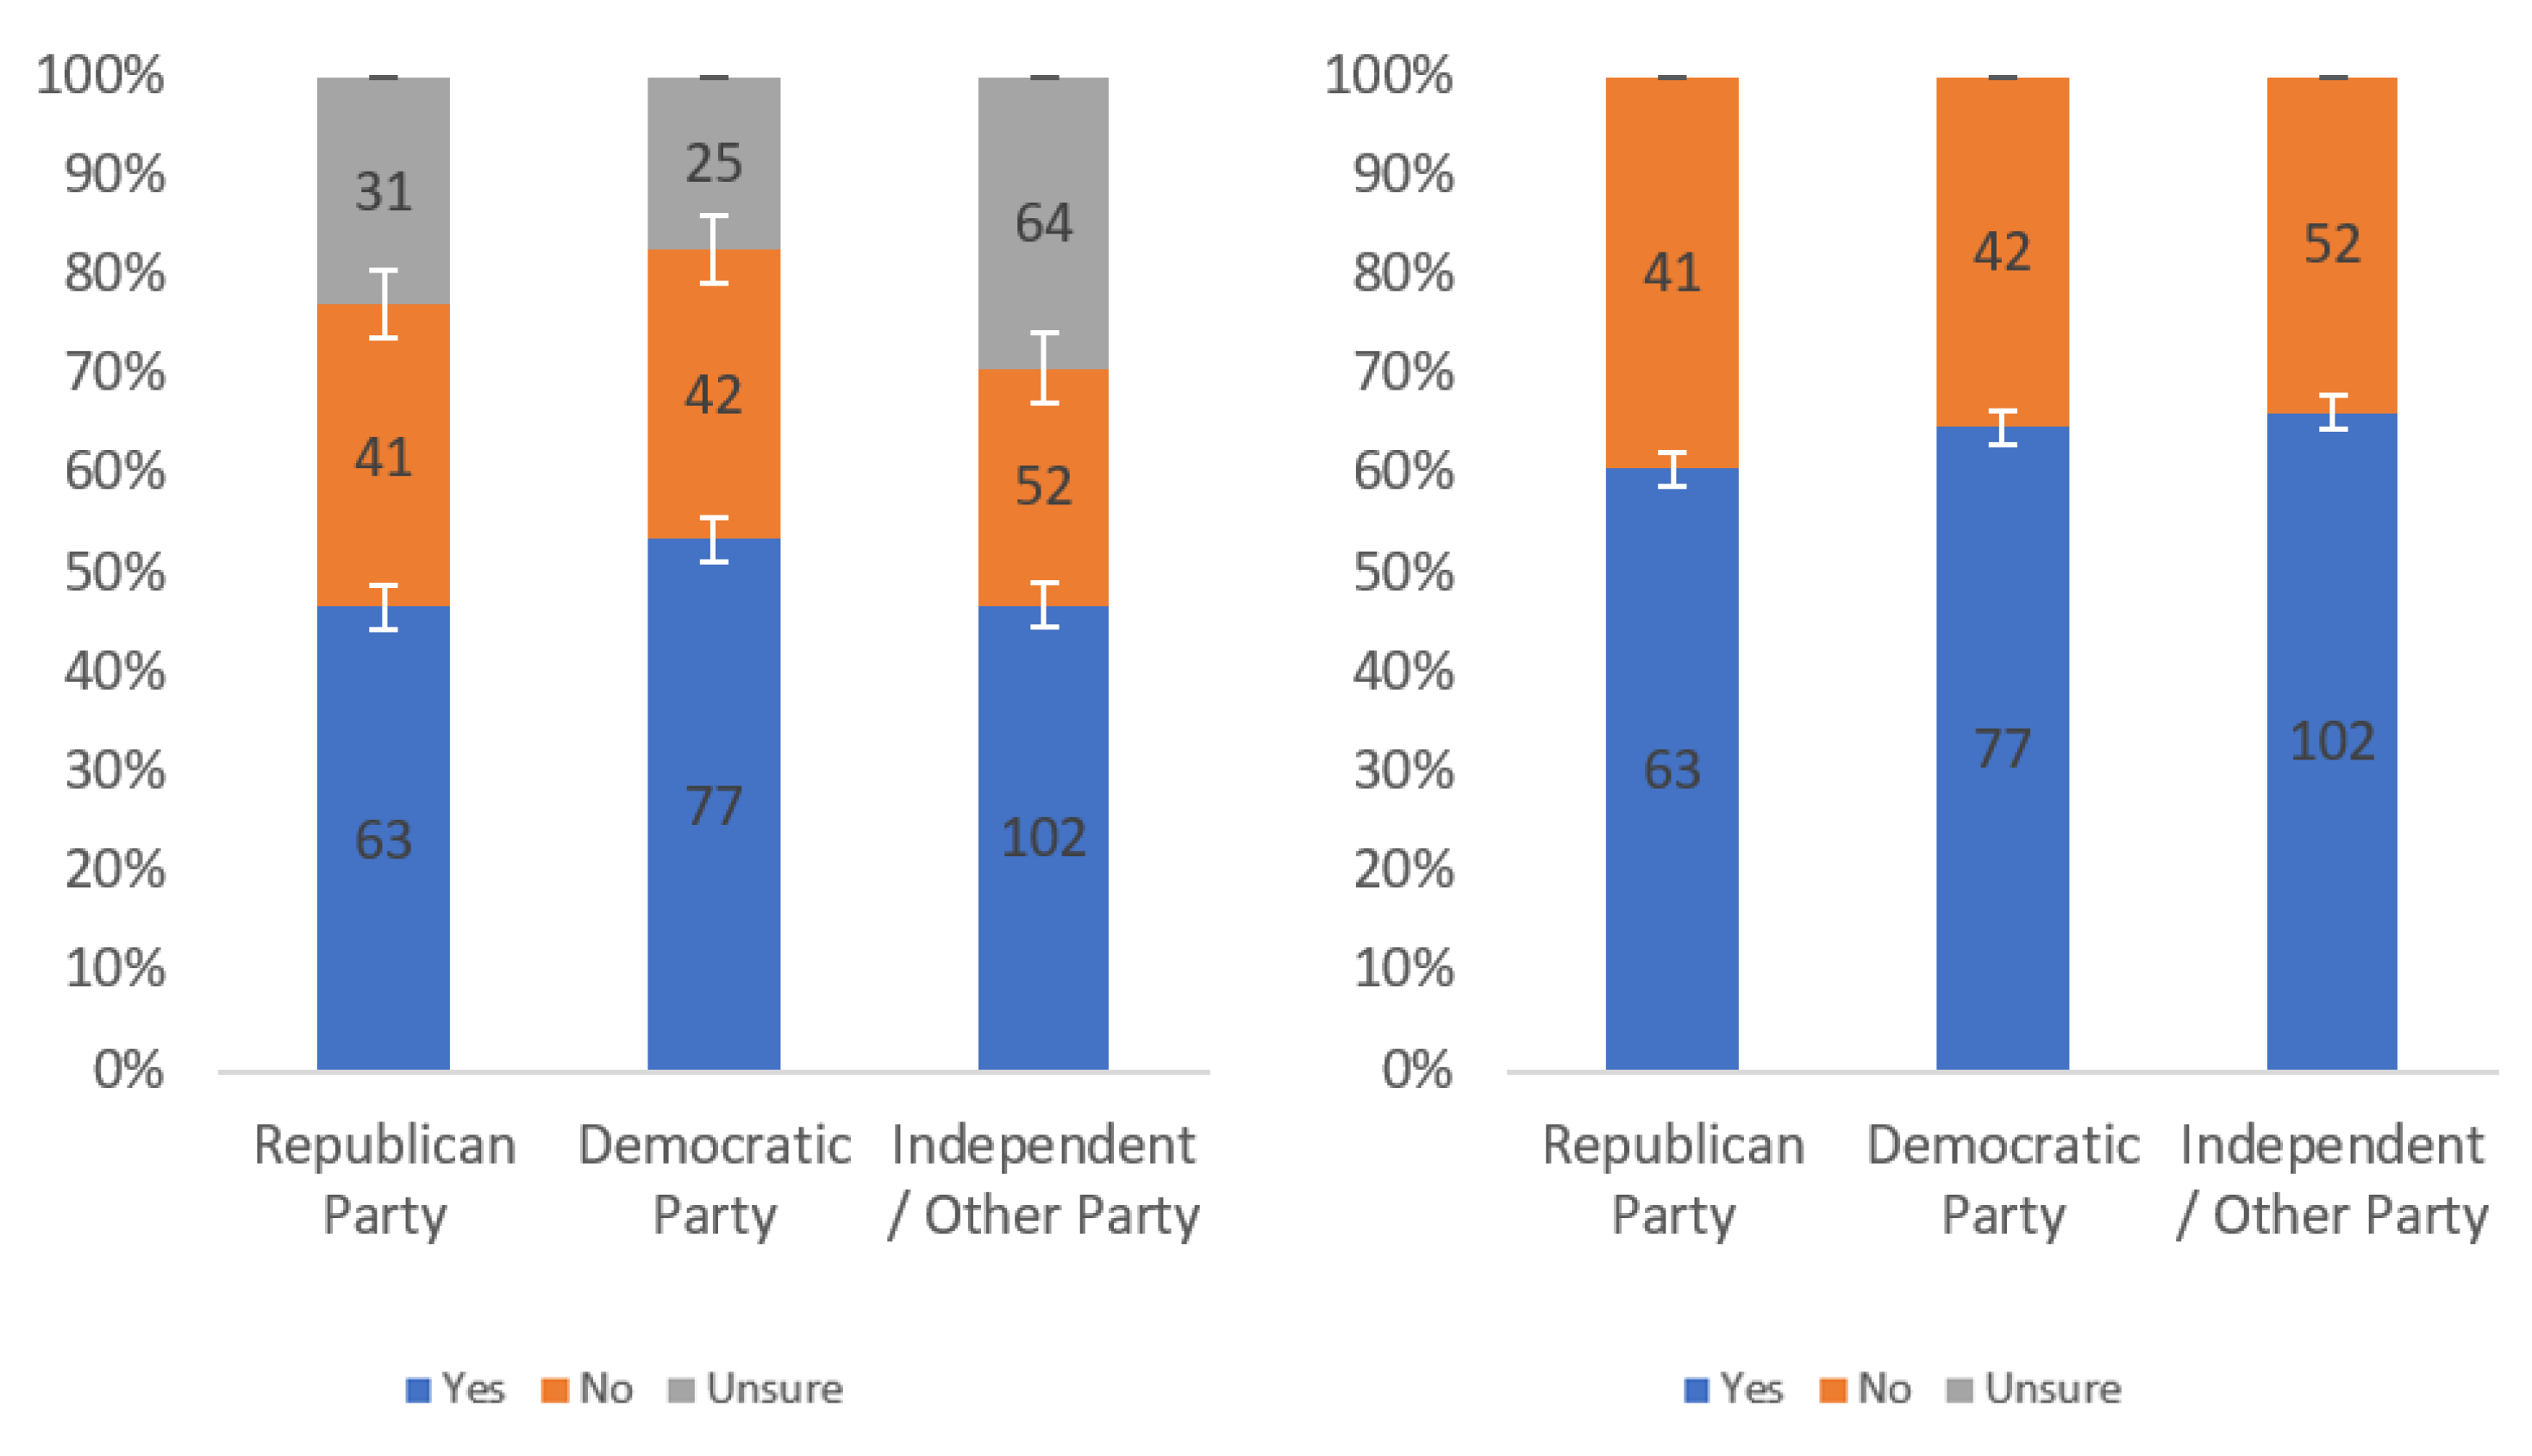
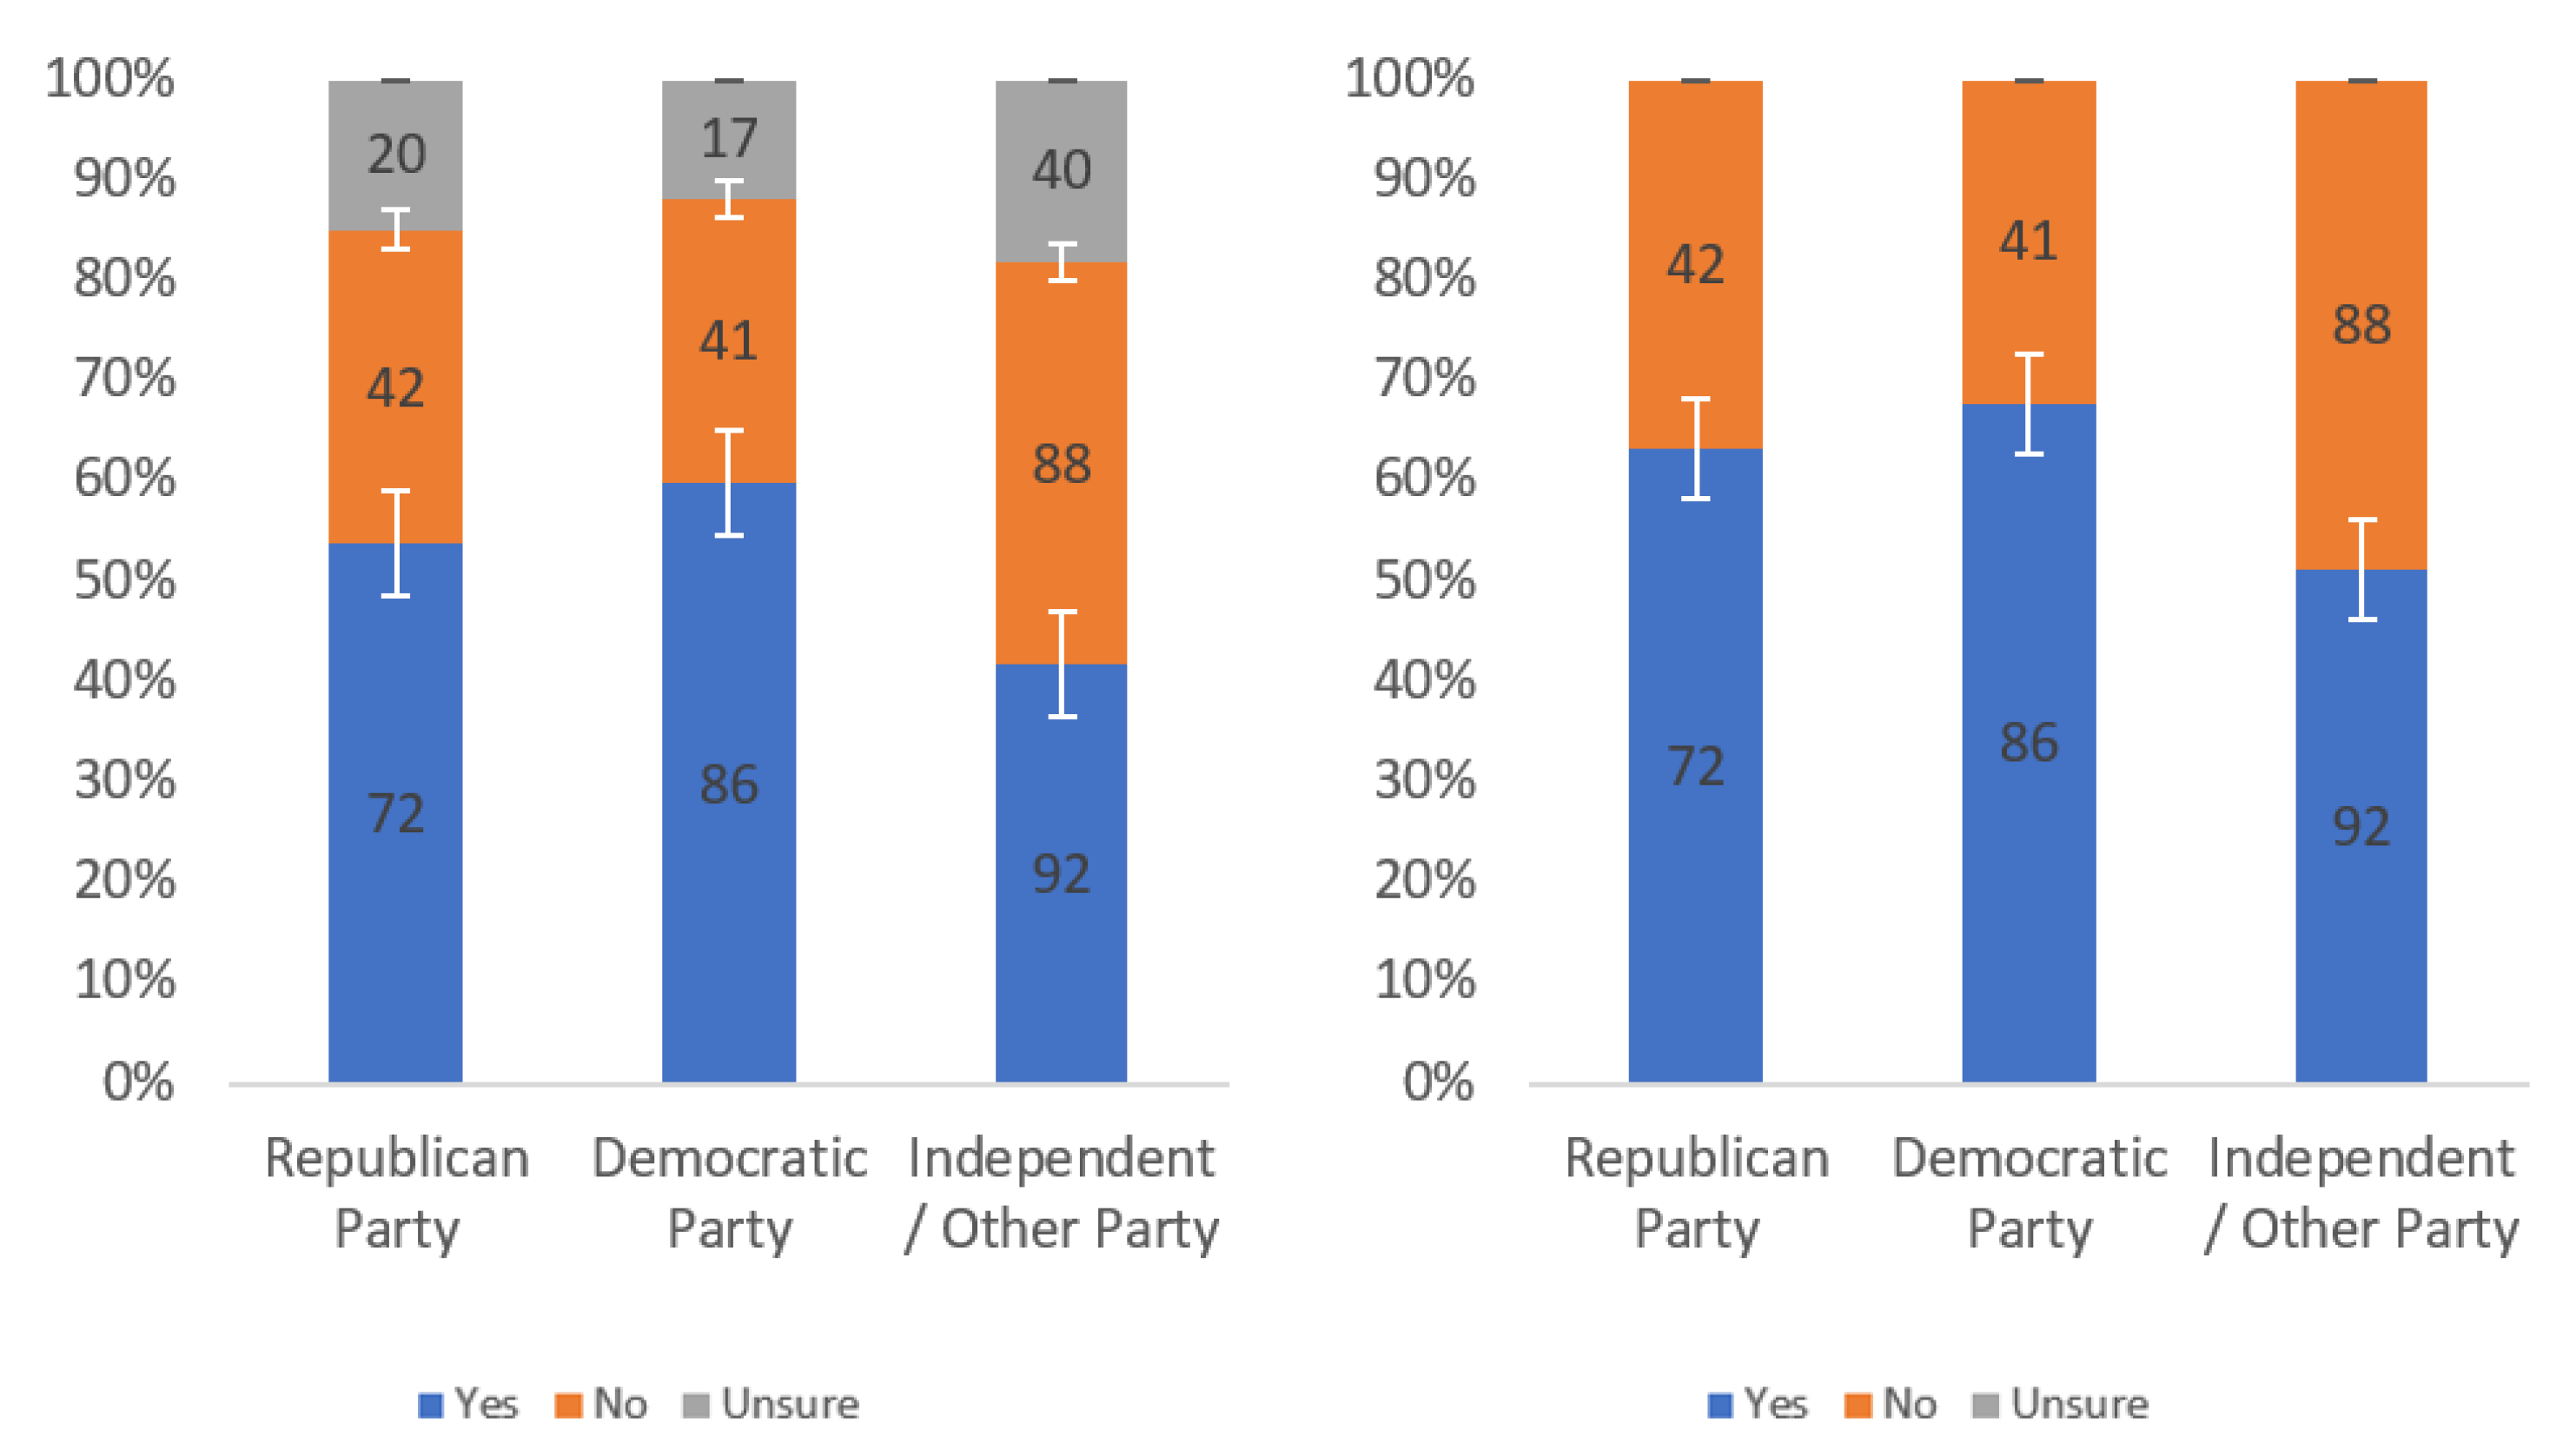
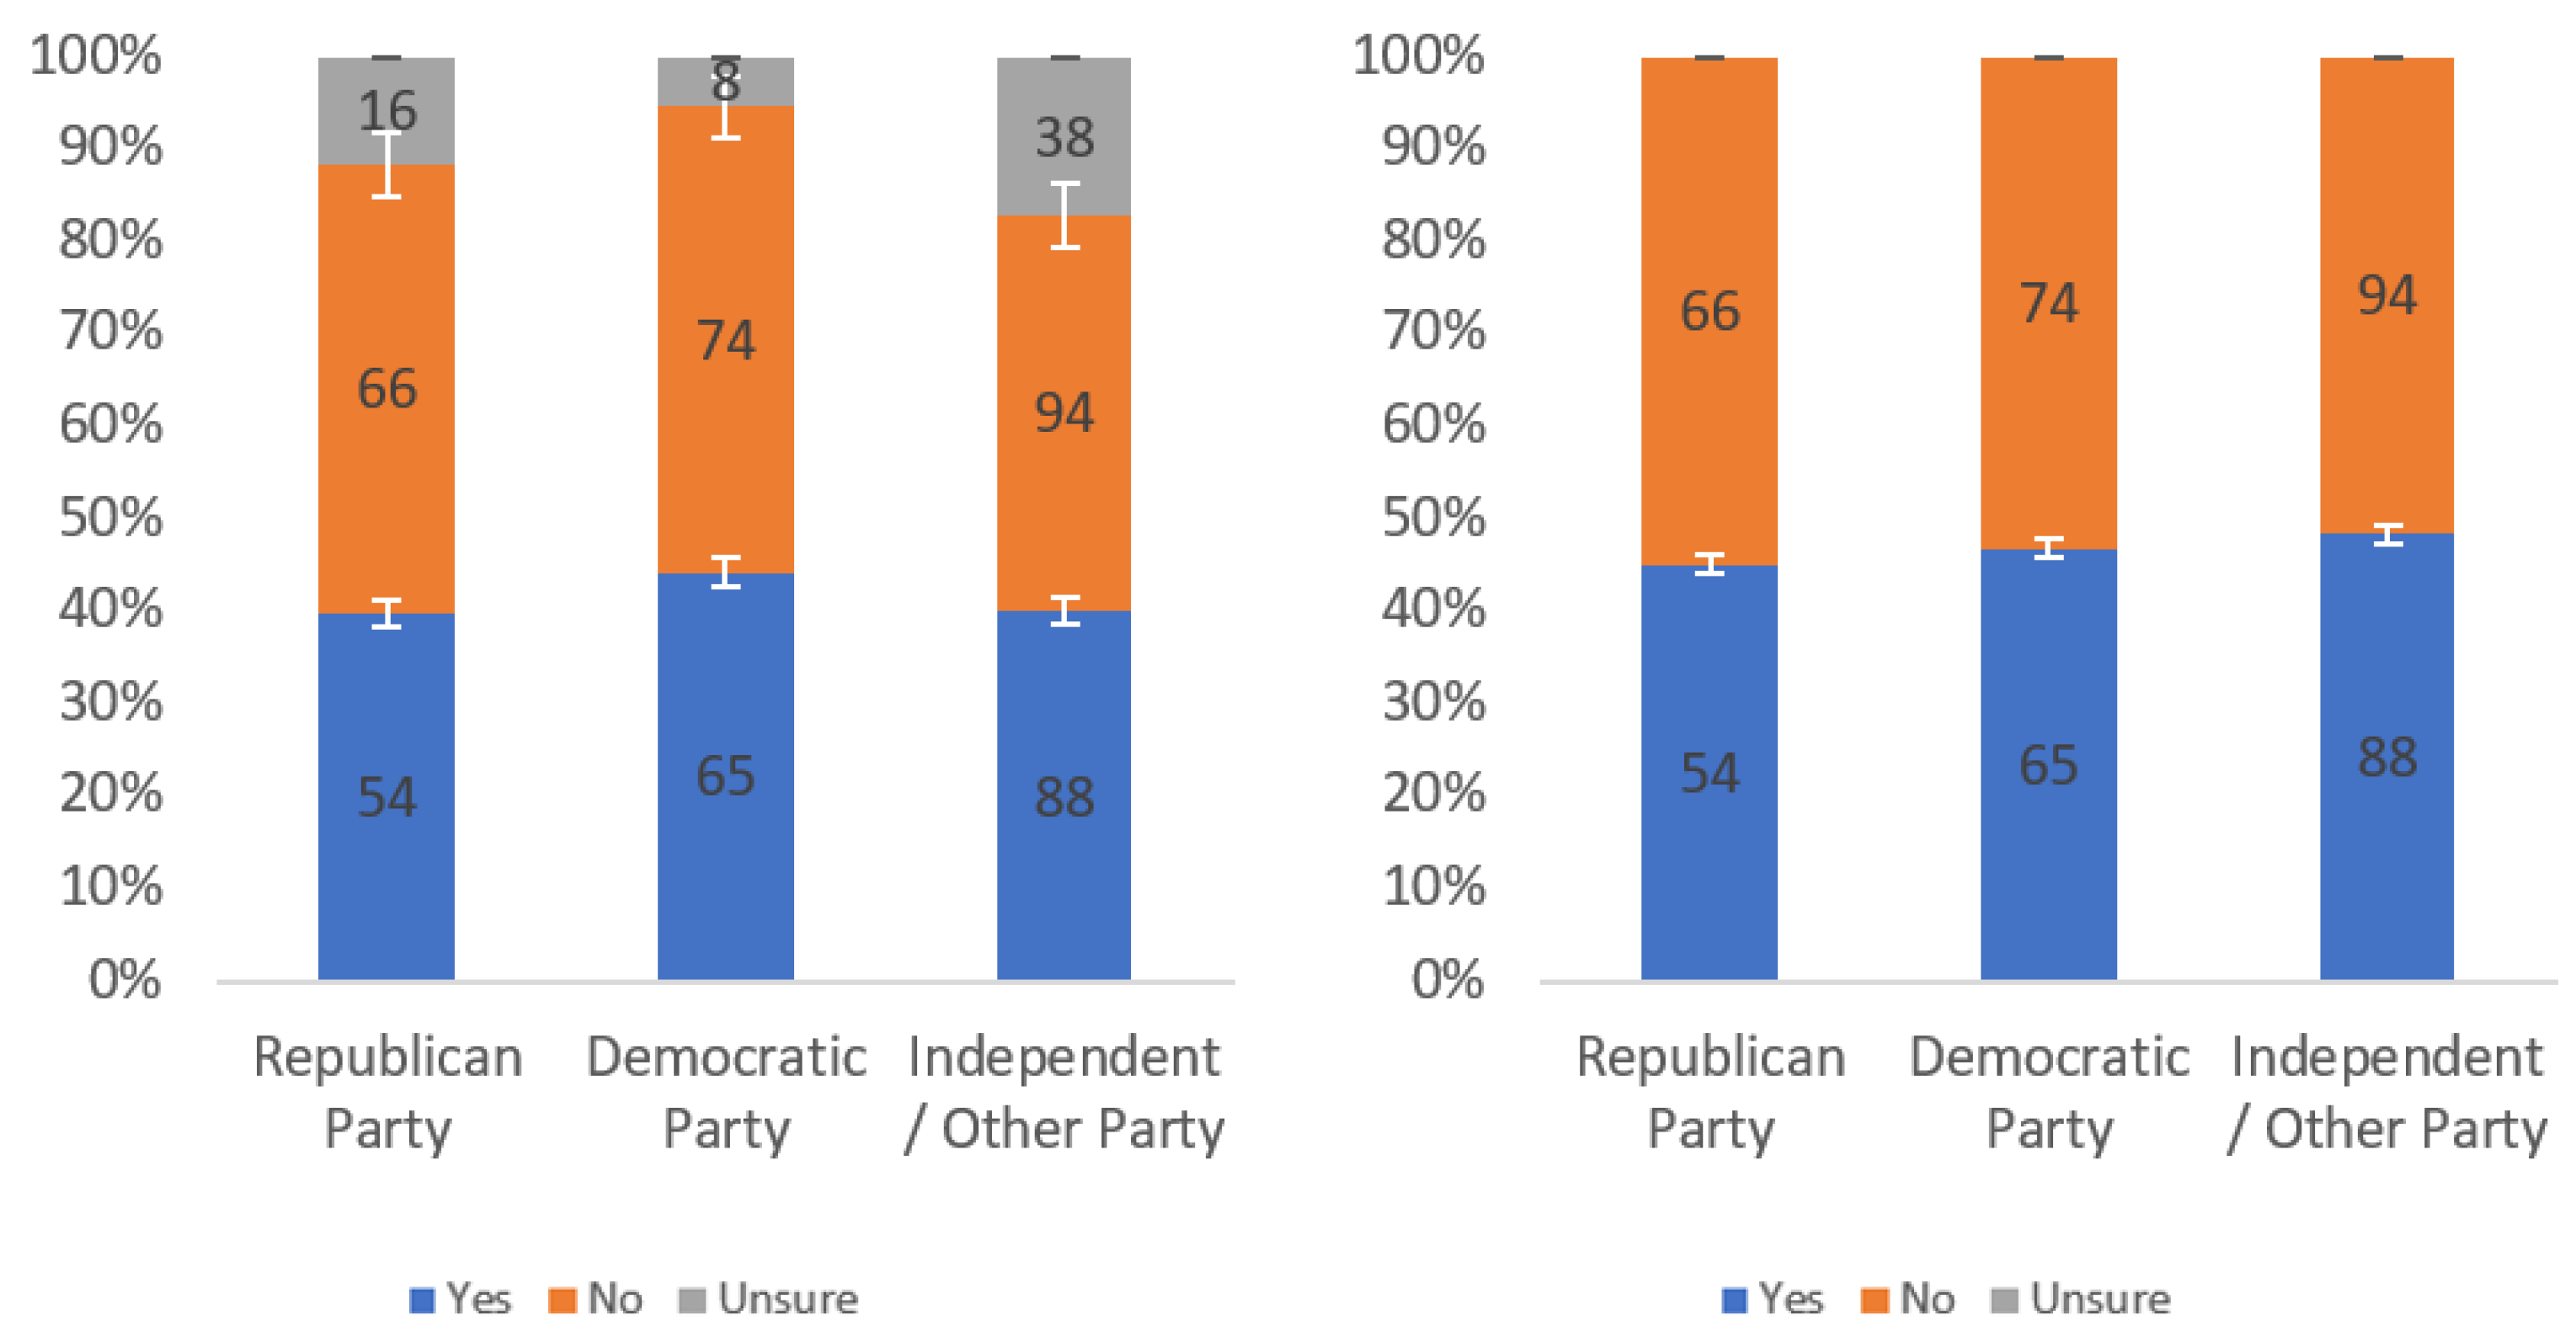
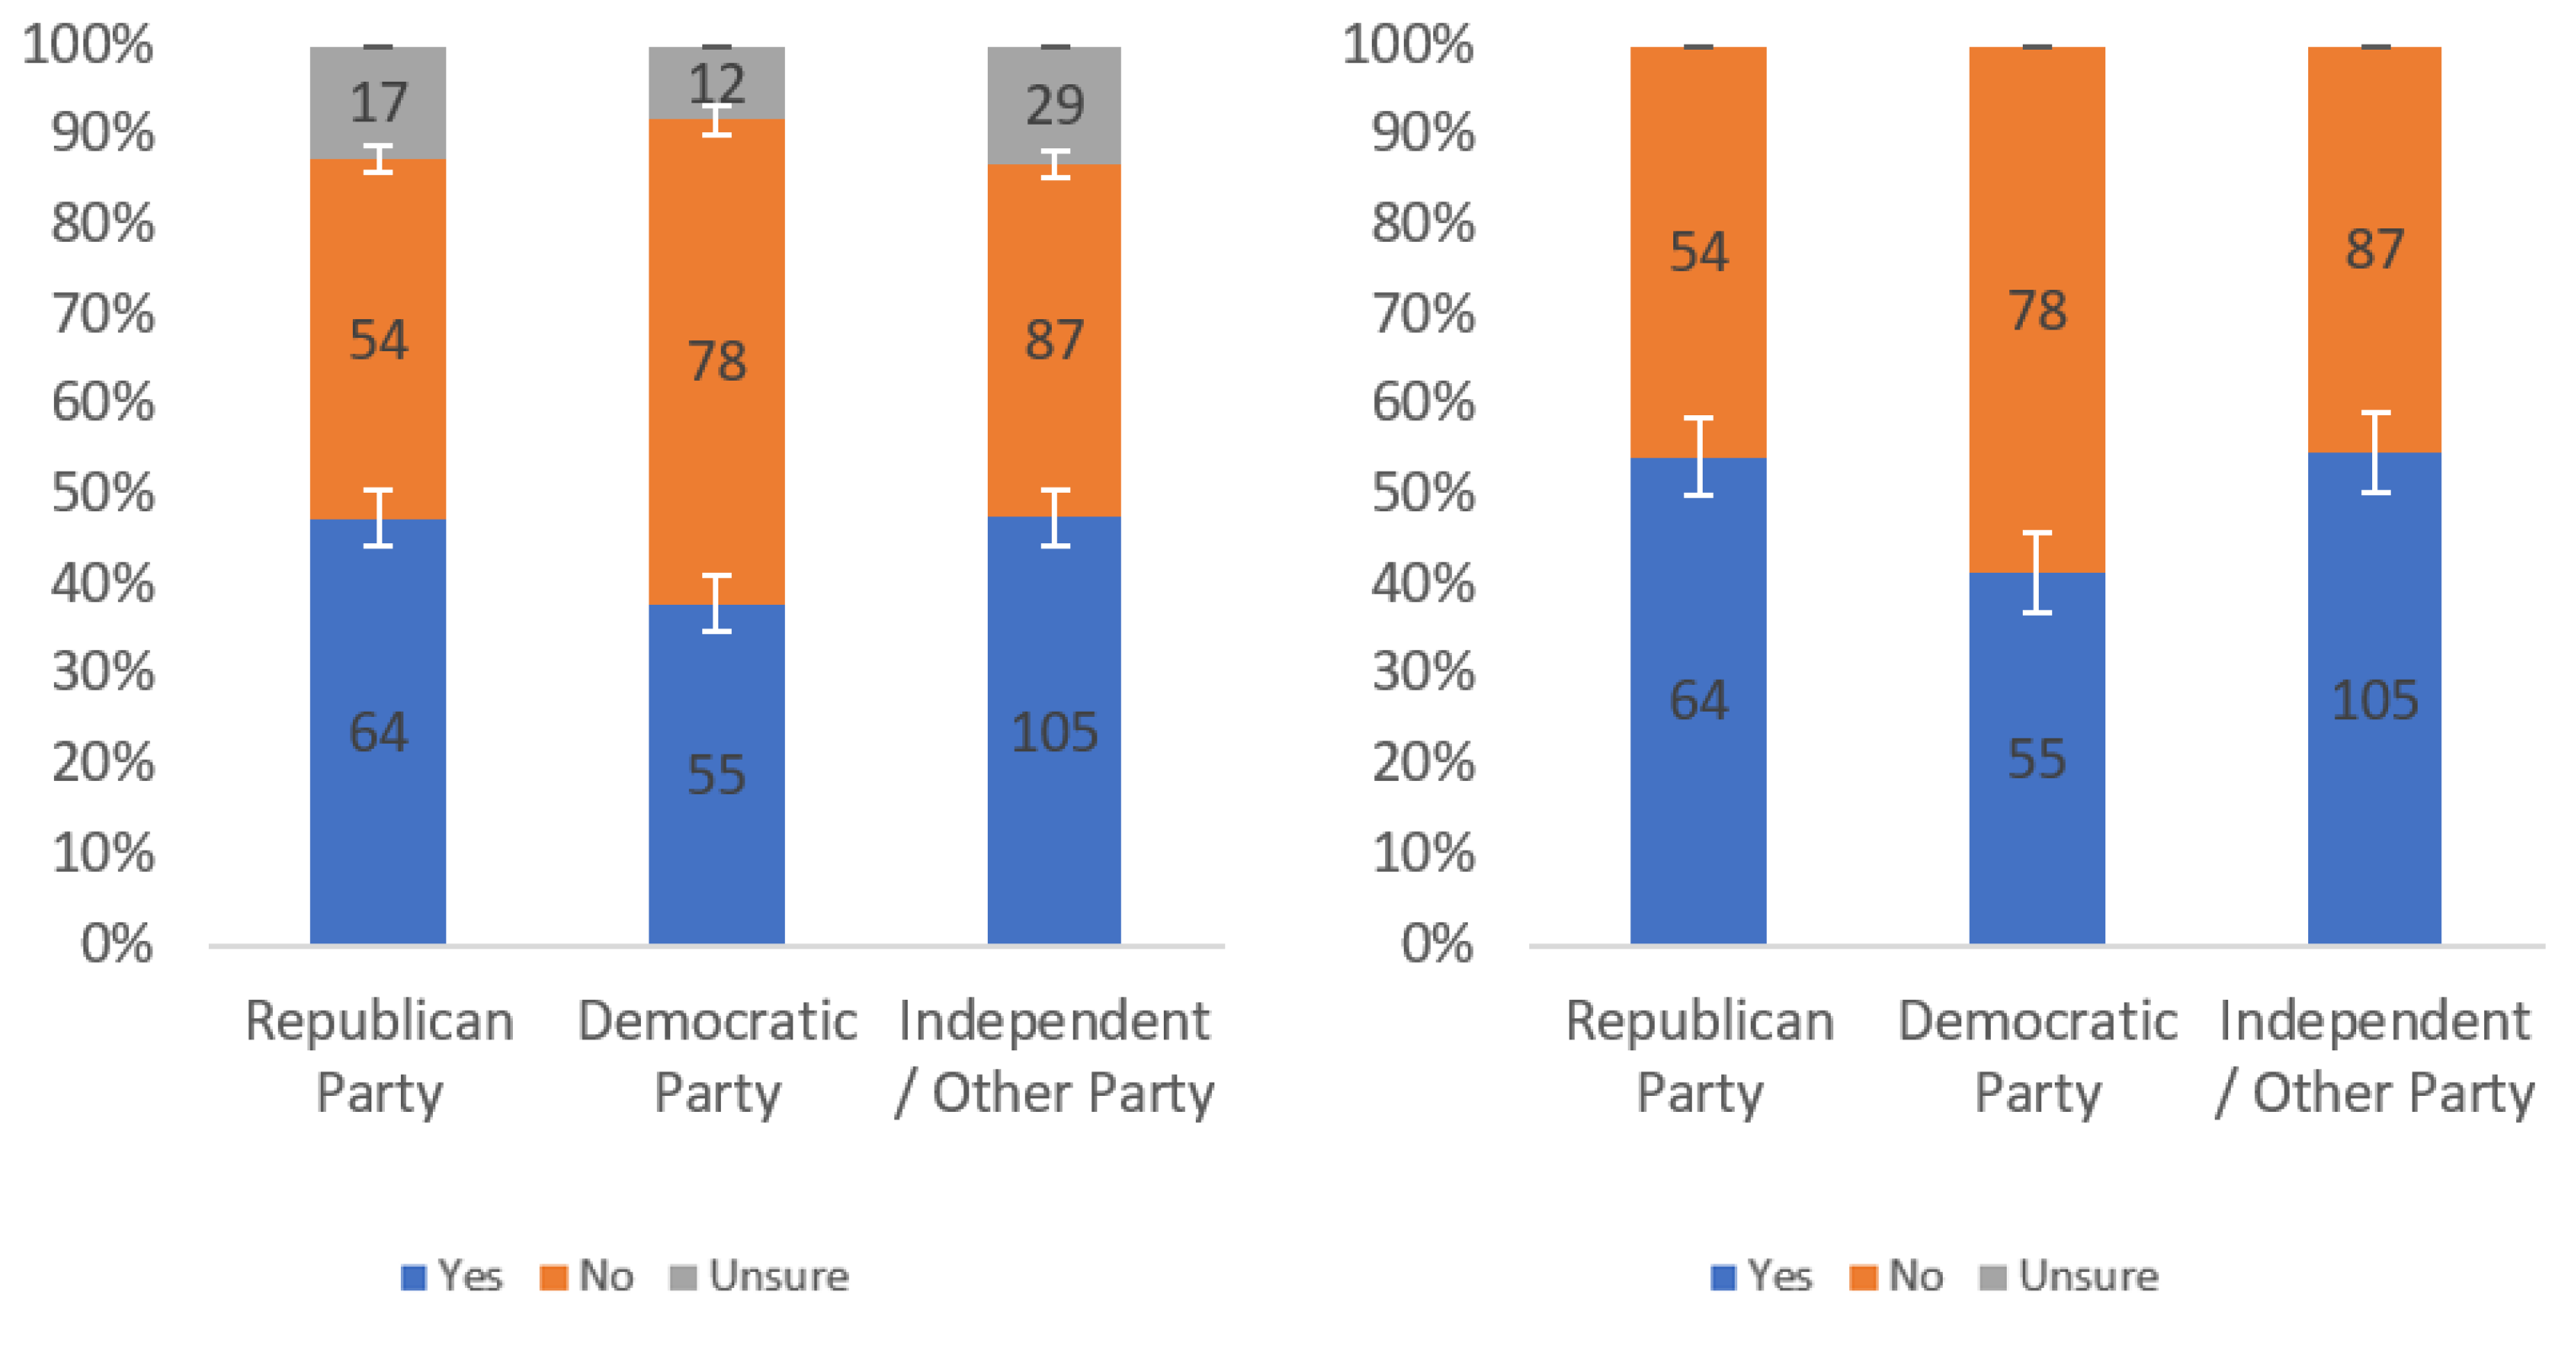
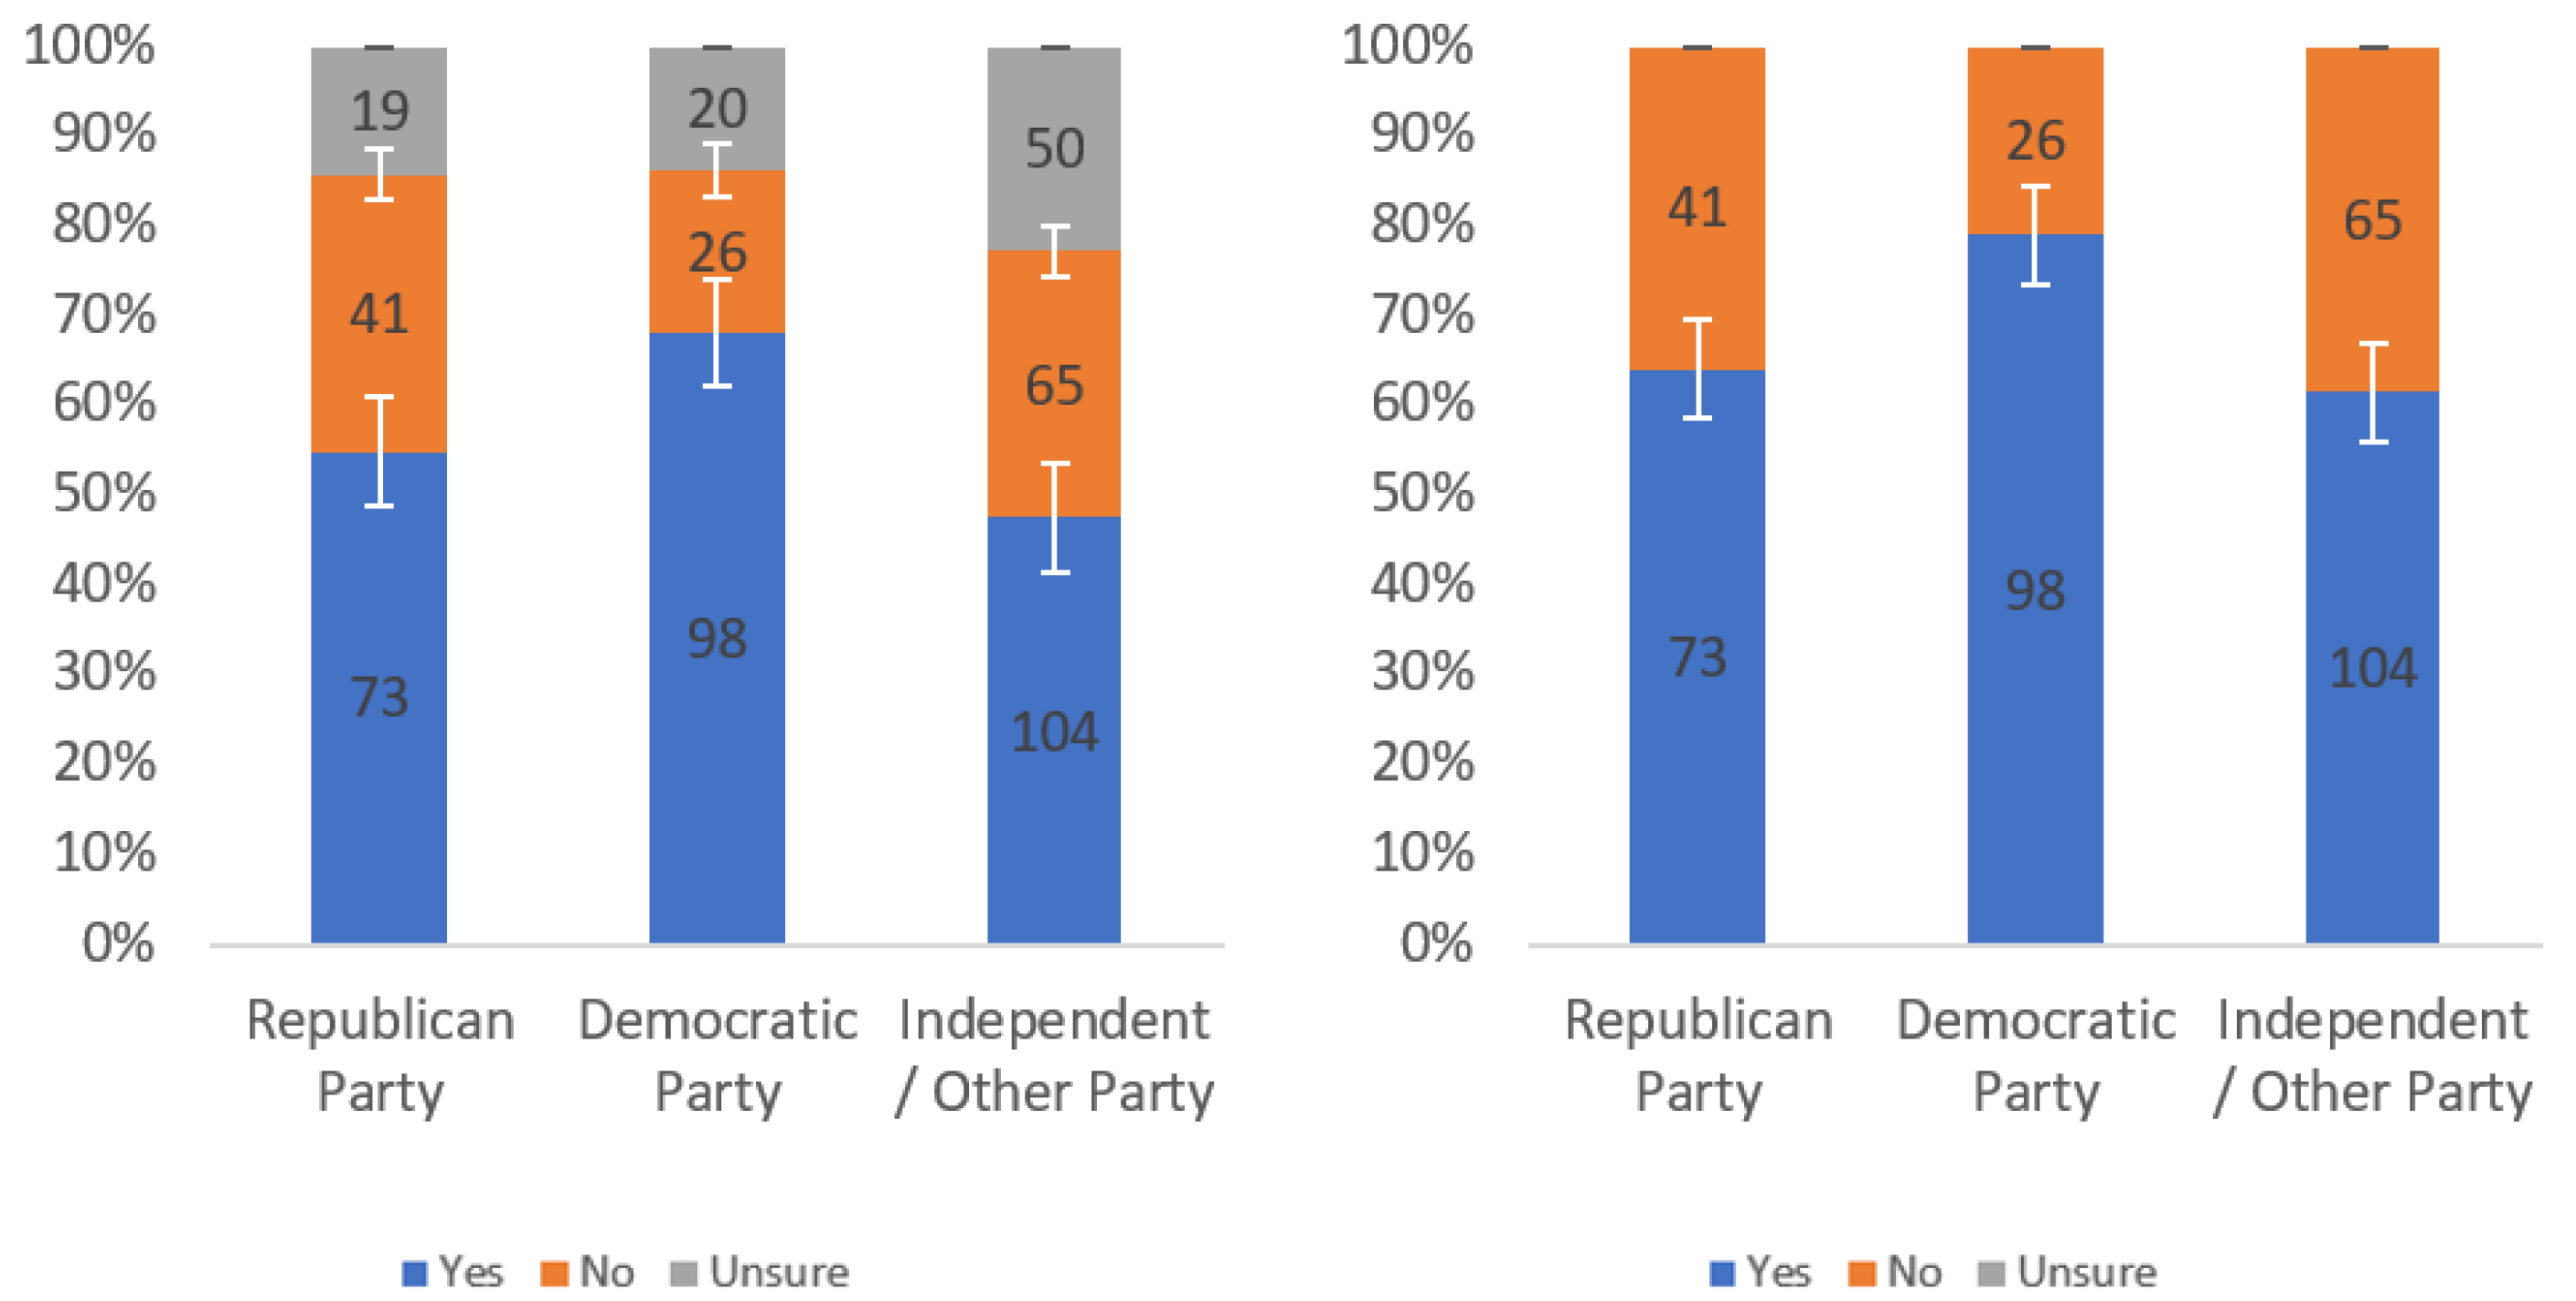
Figure 8.
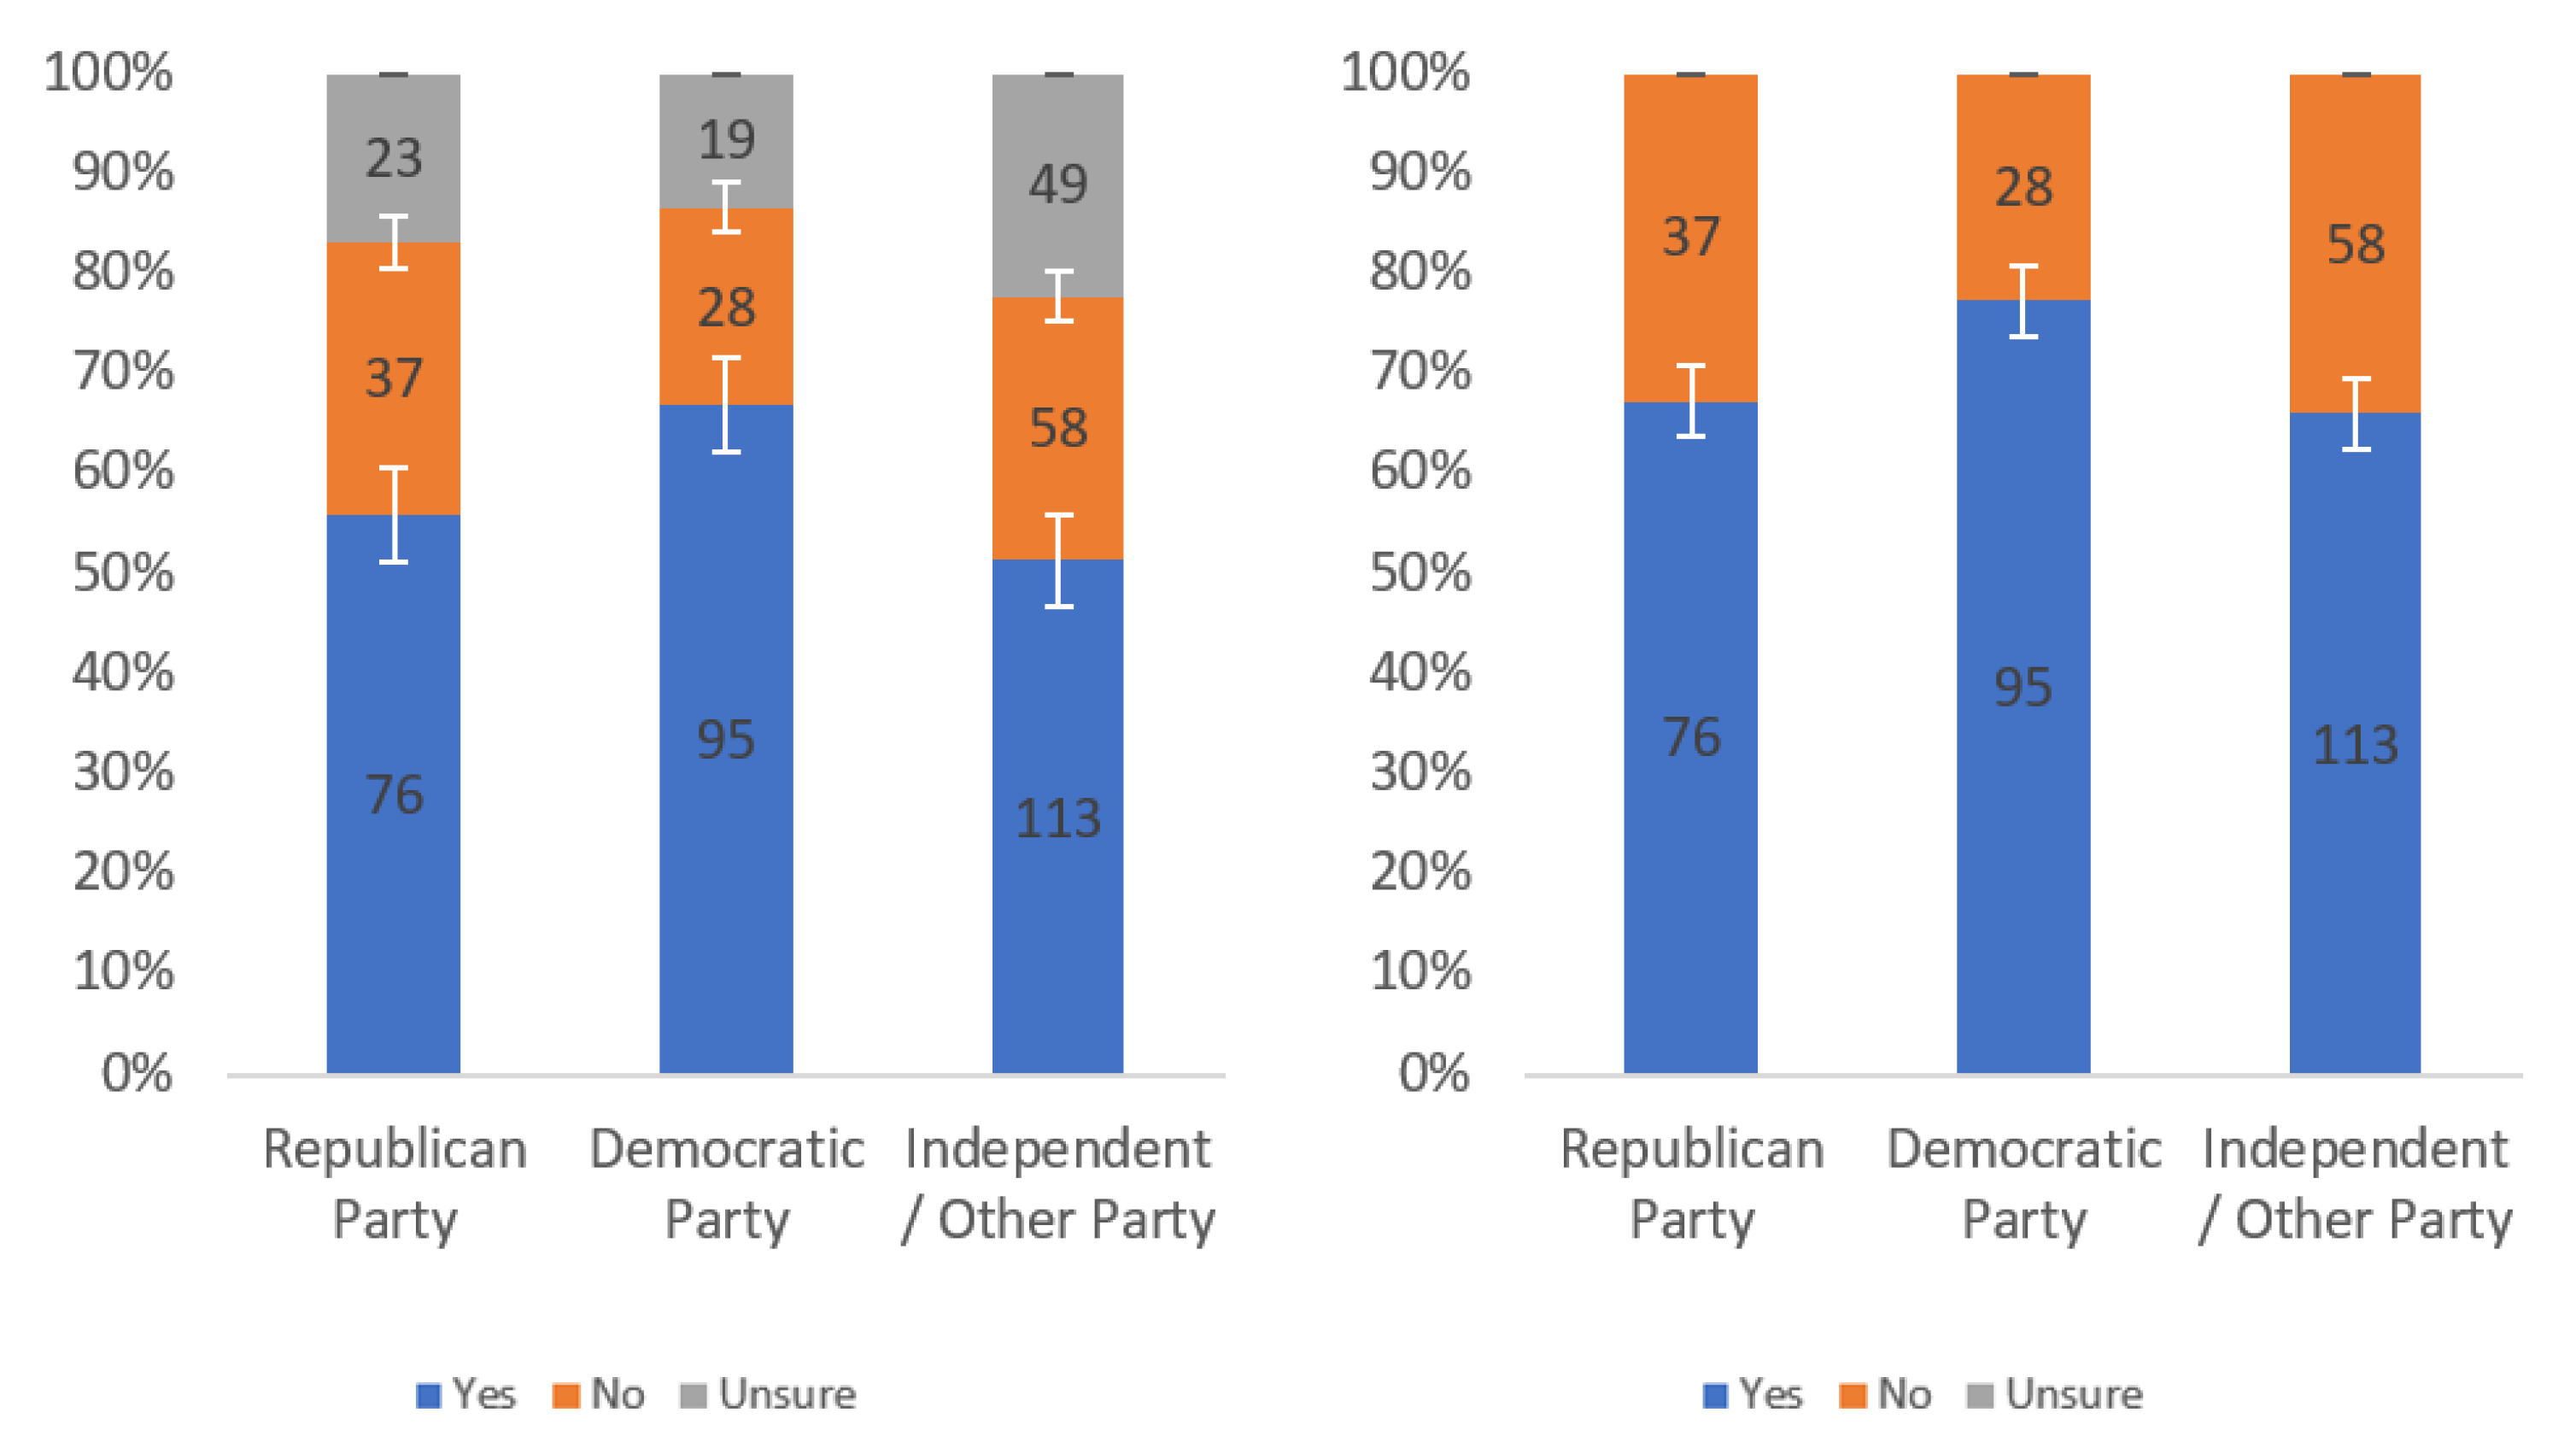
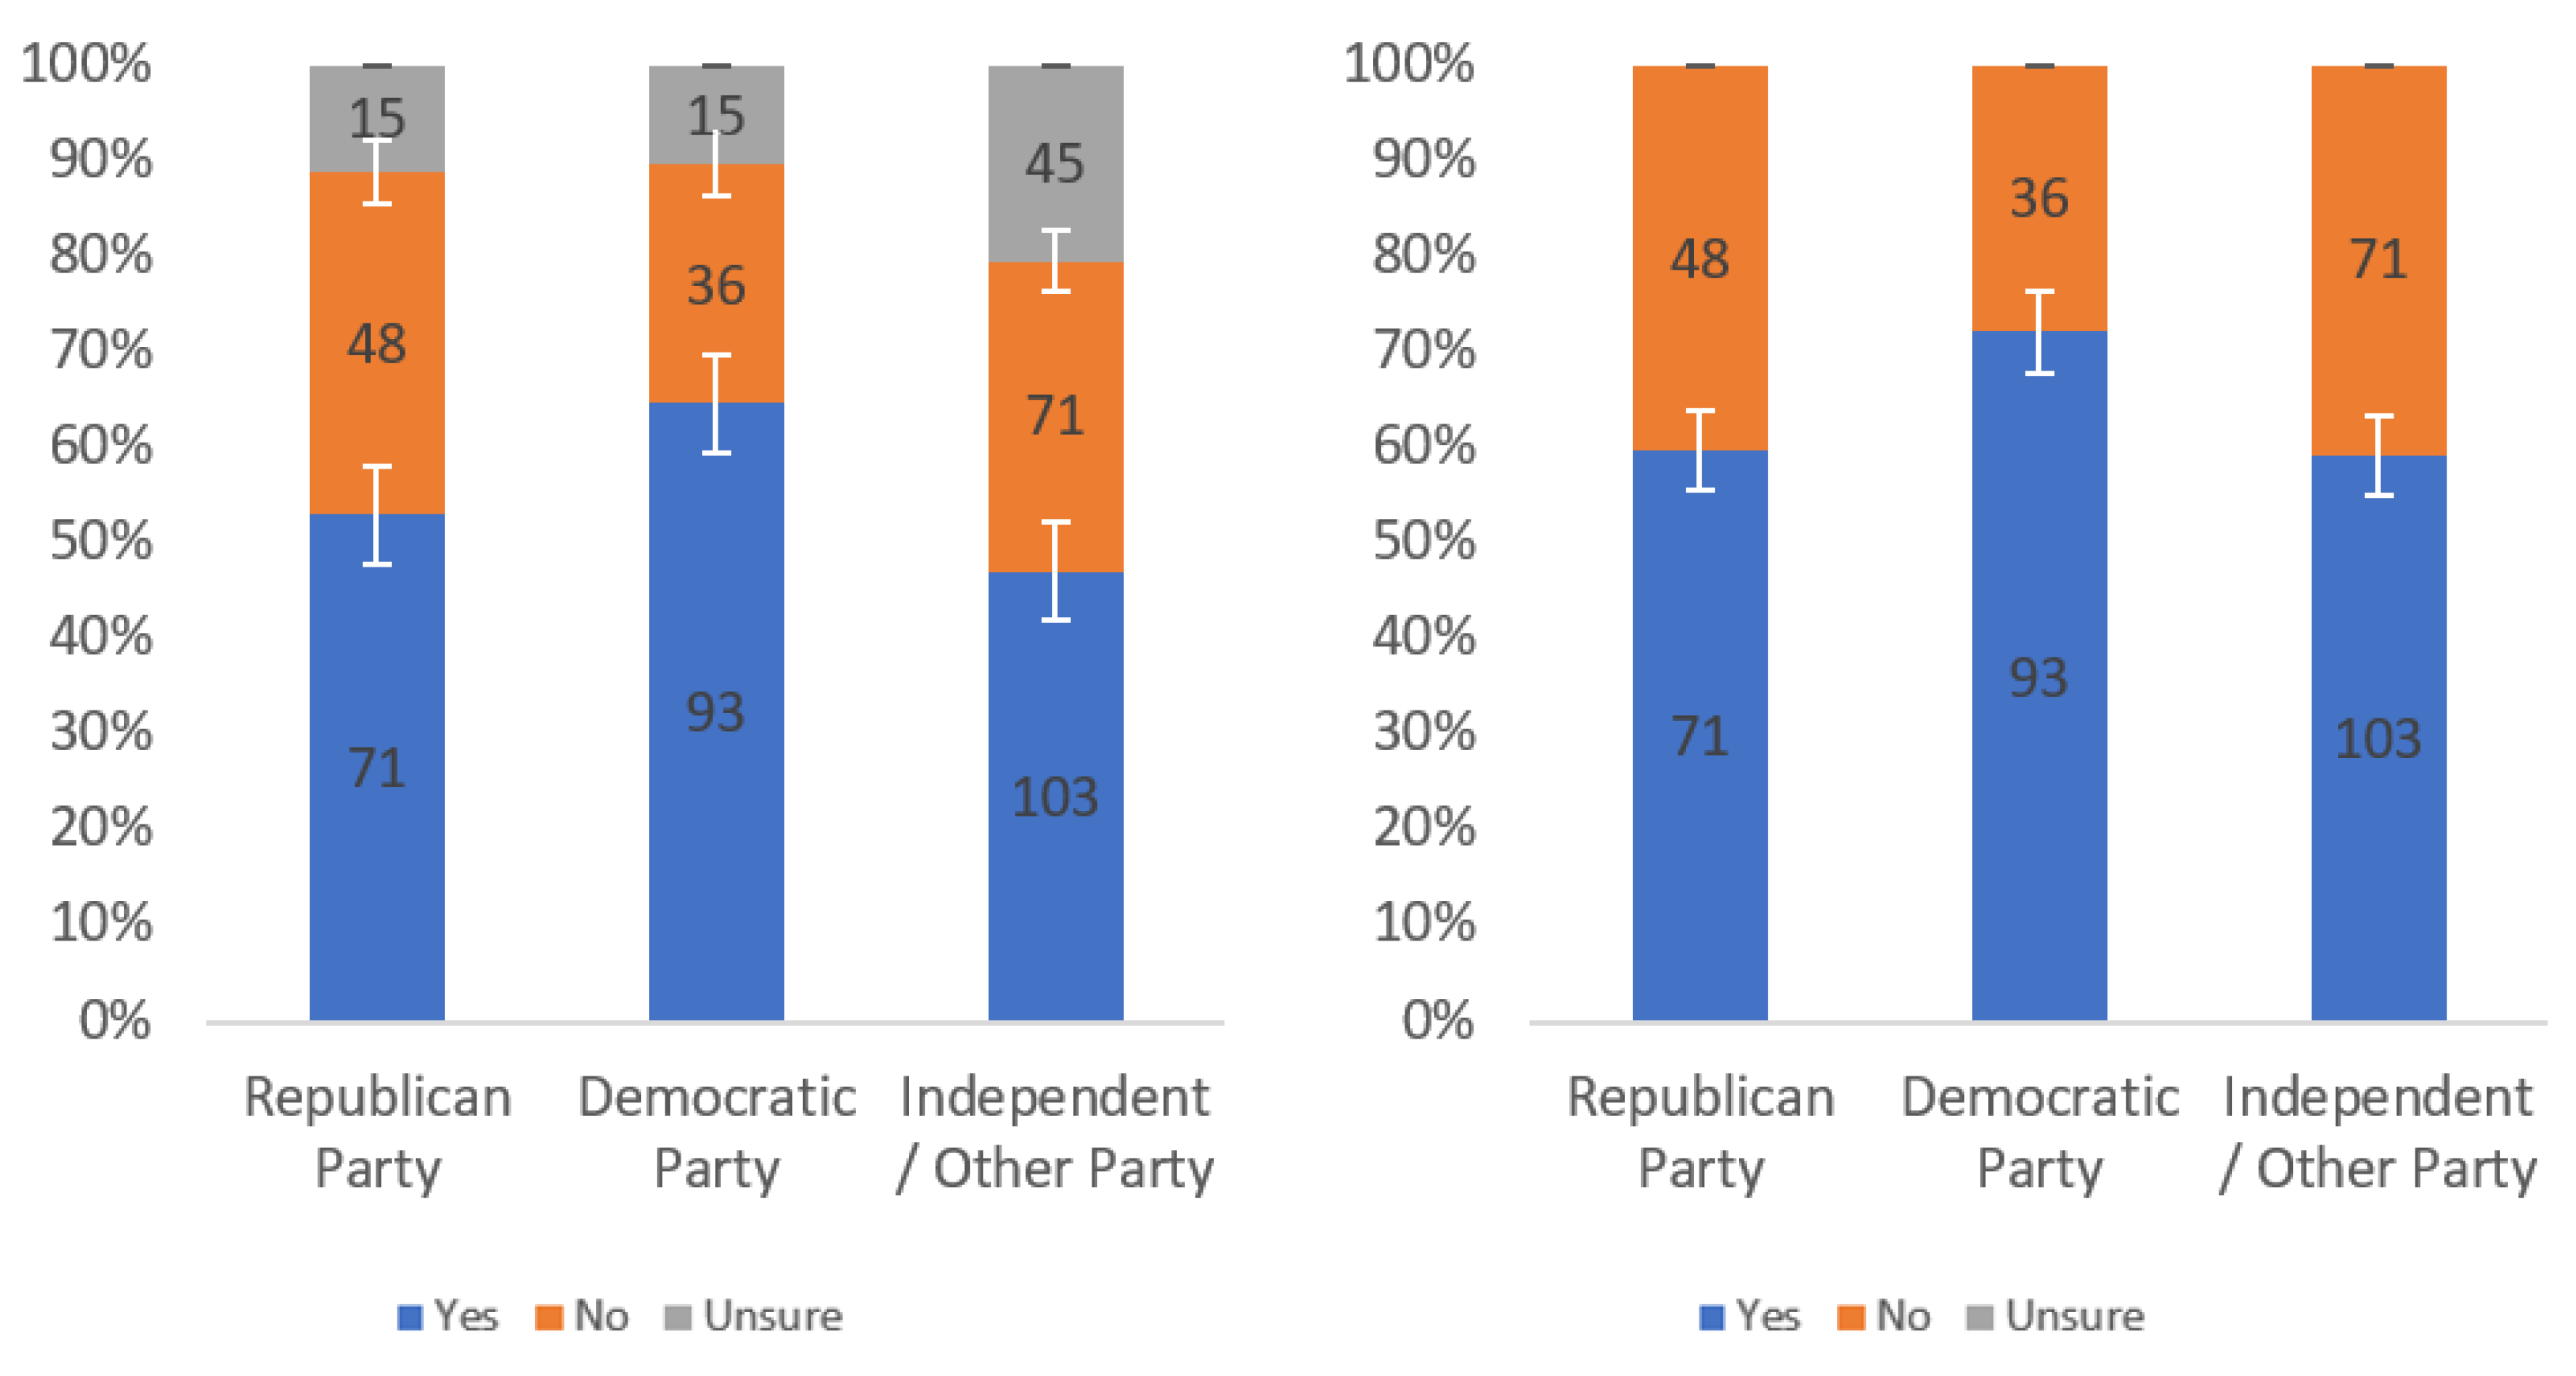
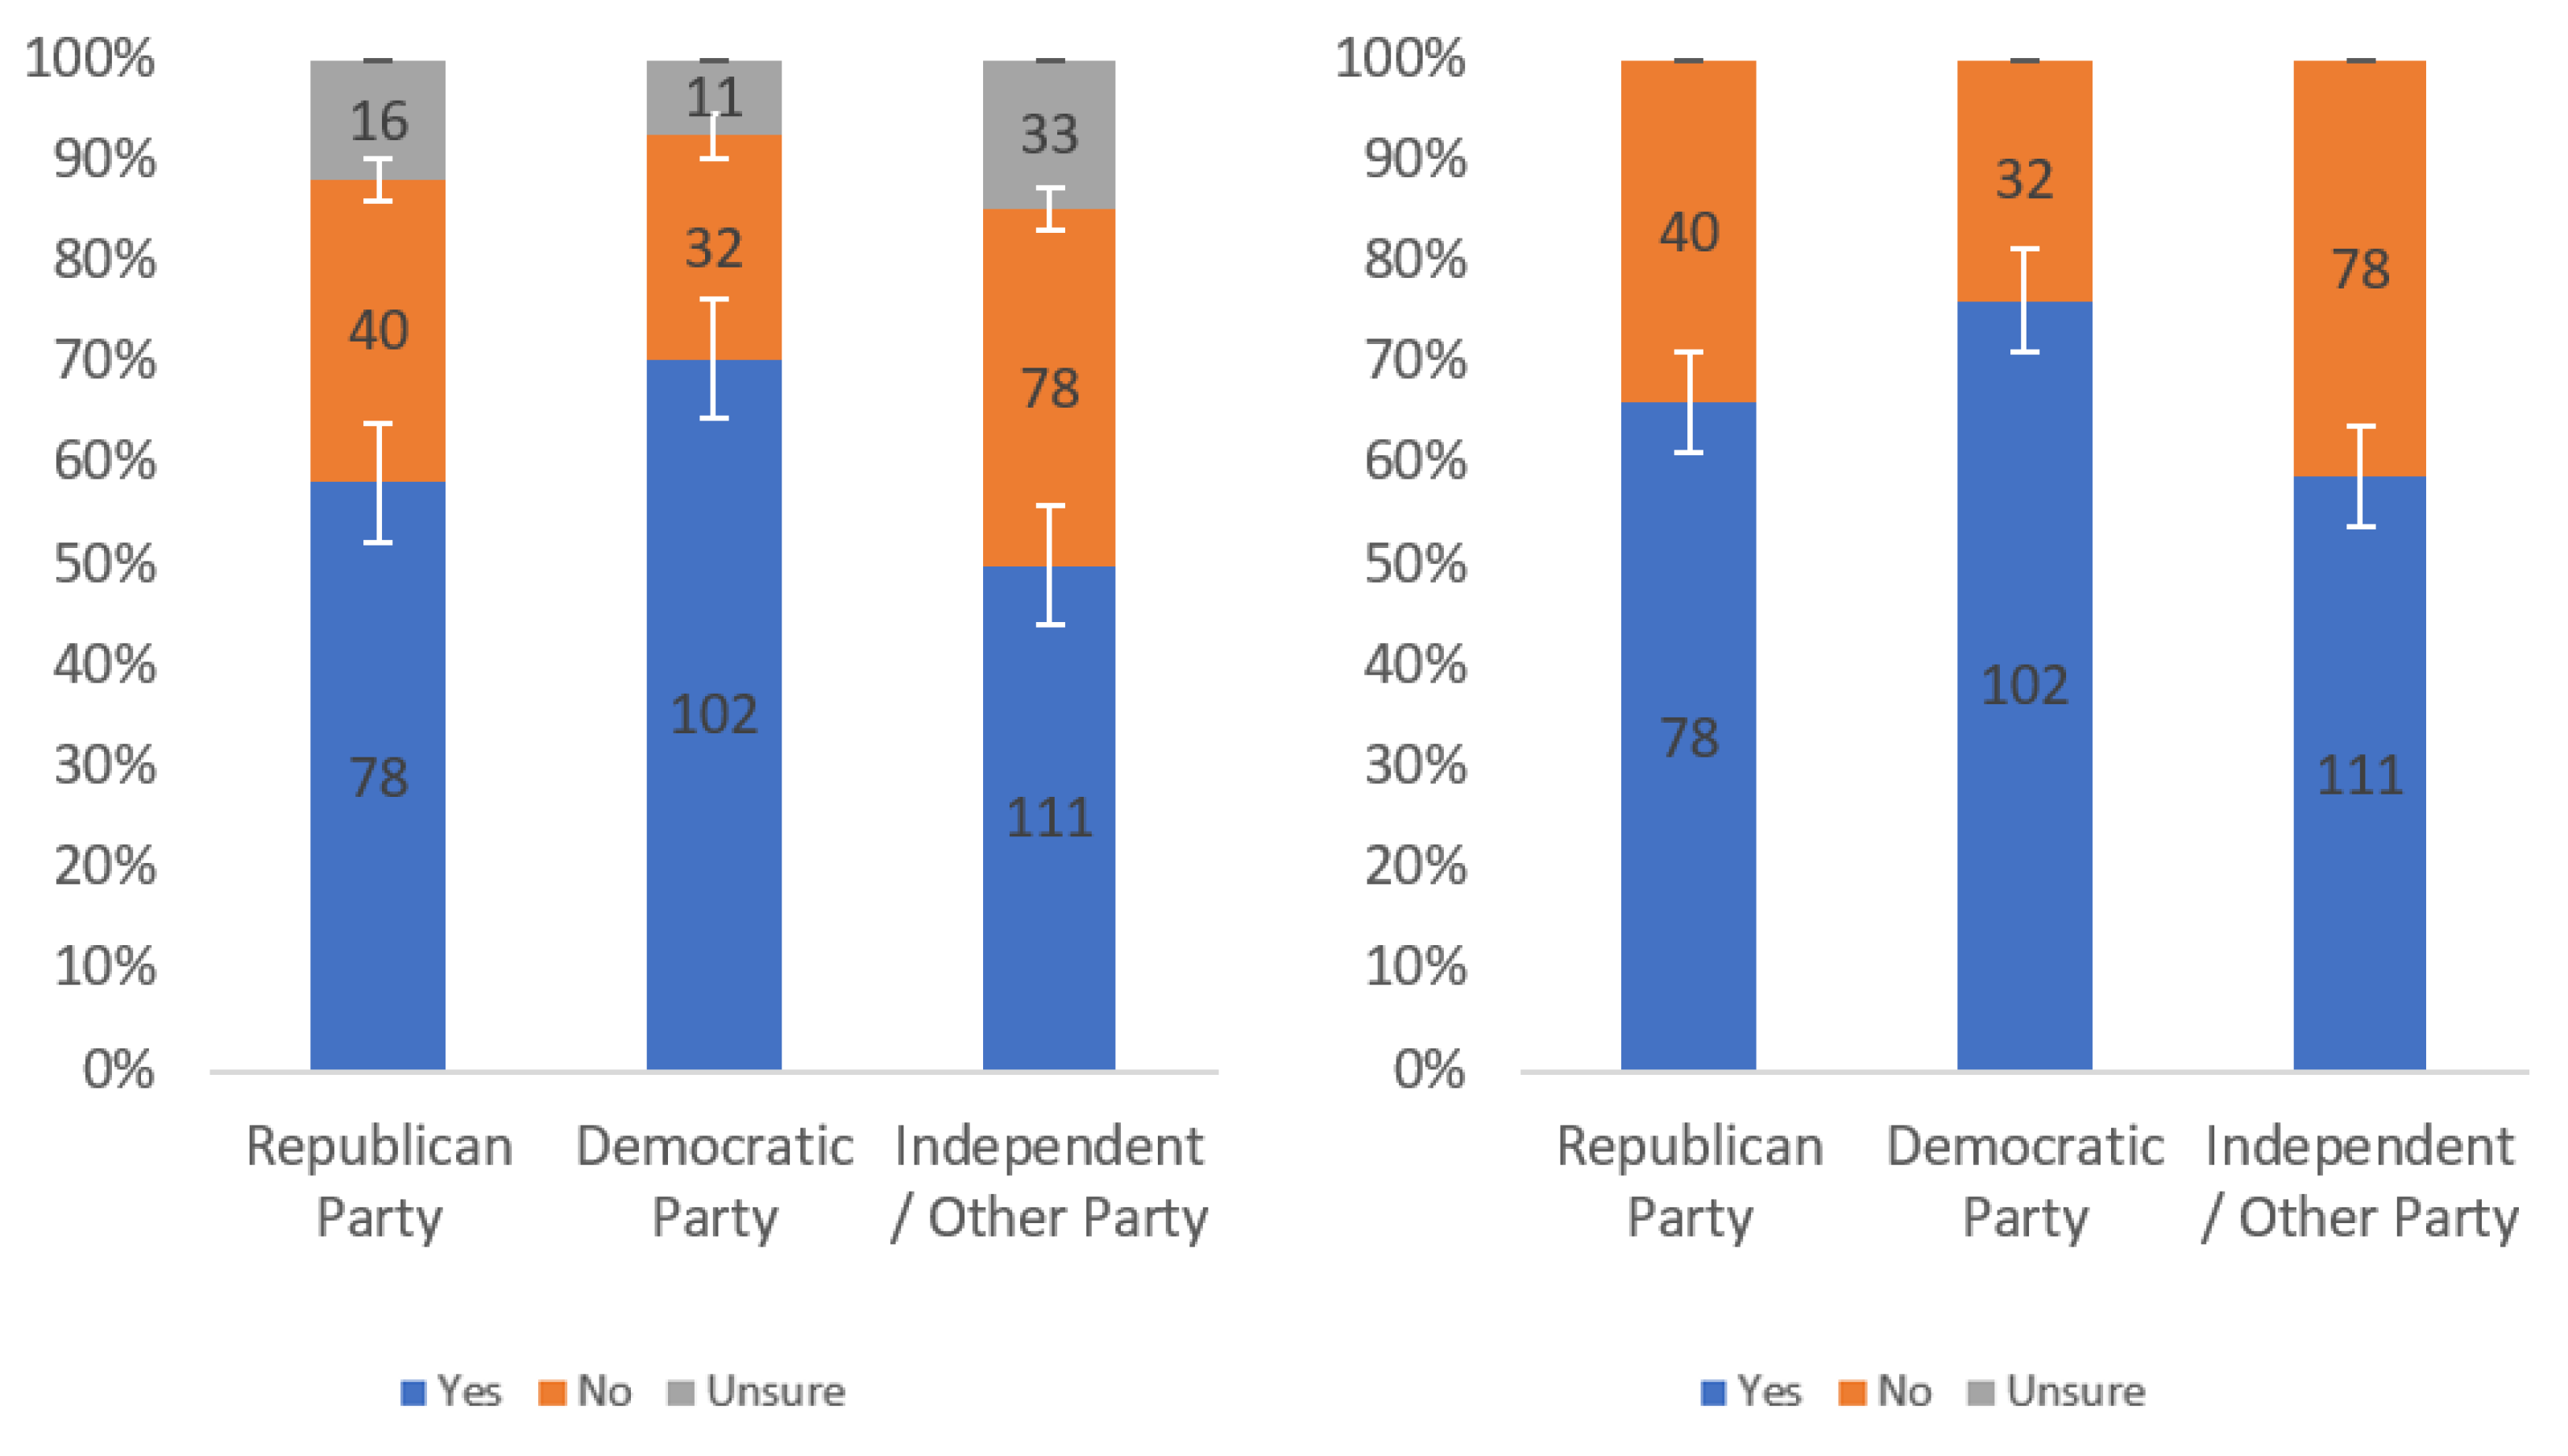
Responses regarding label helpfulness by political affiliation including (left) and excluding (right) unsure responses.
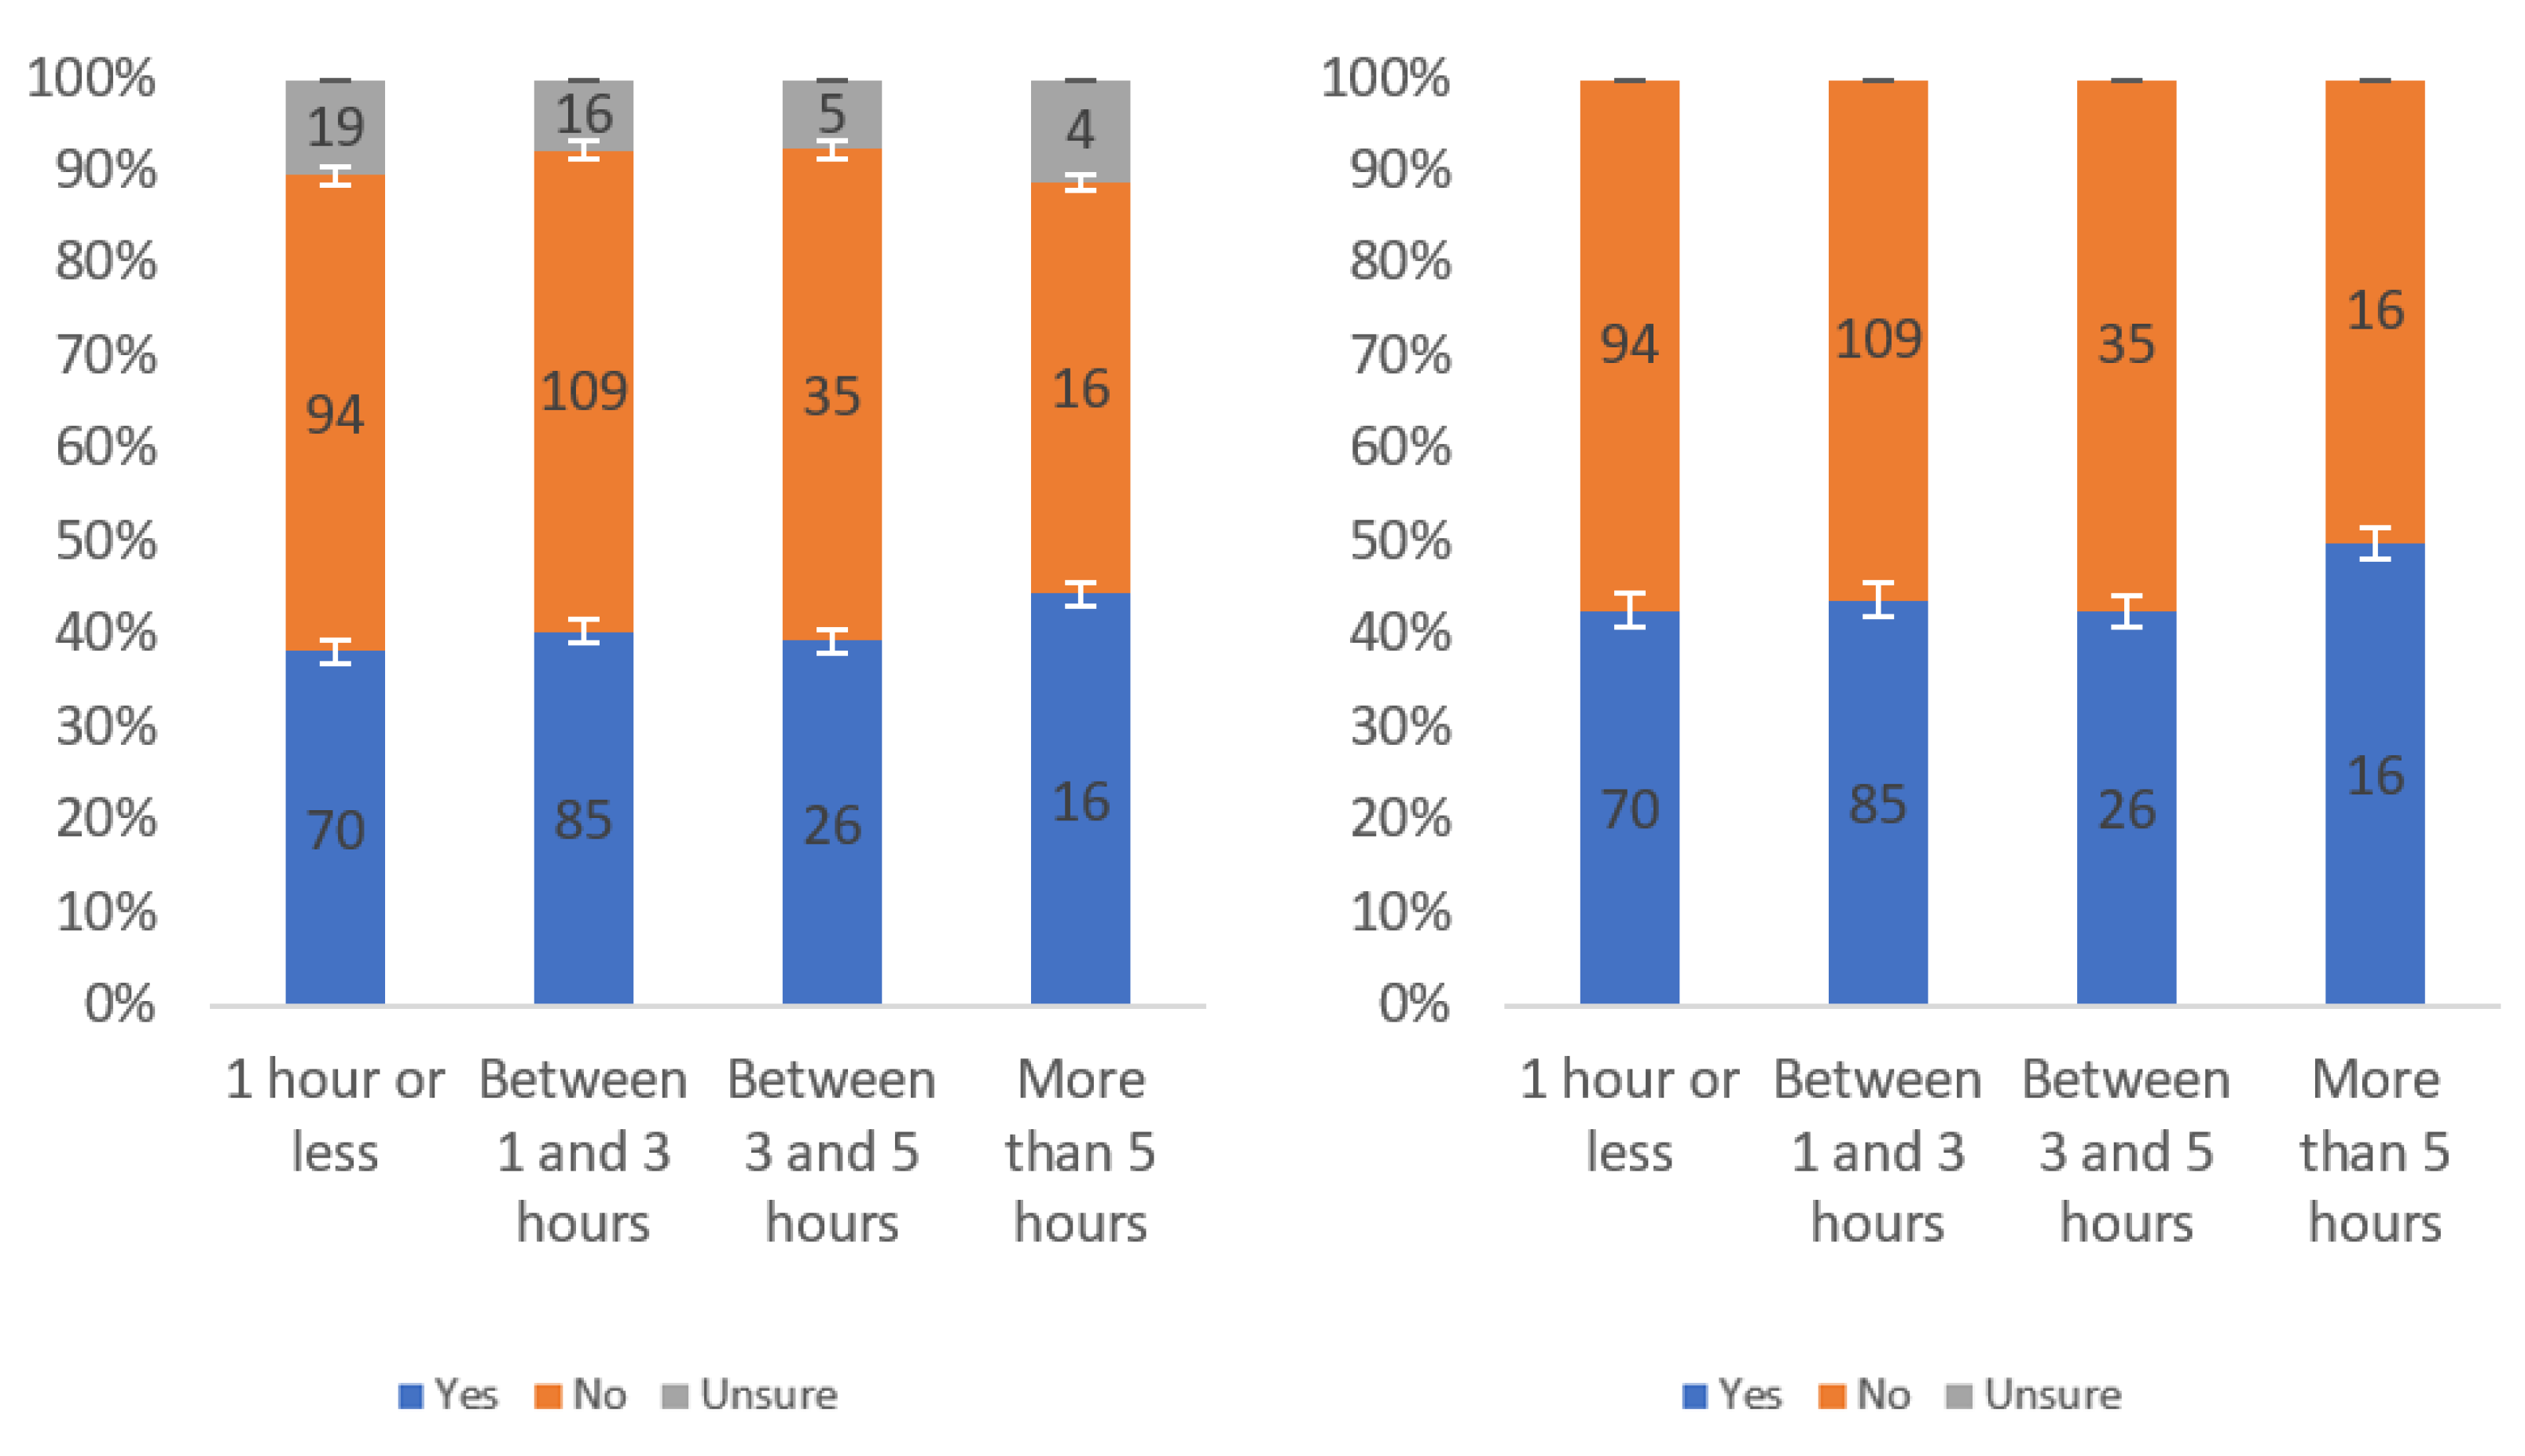
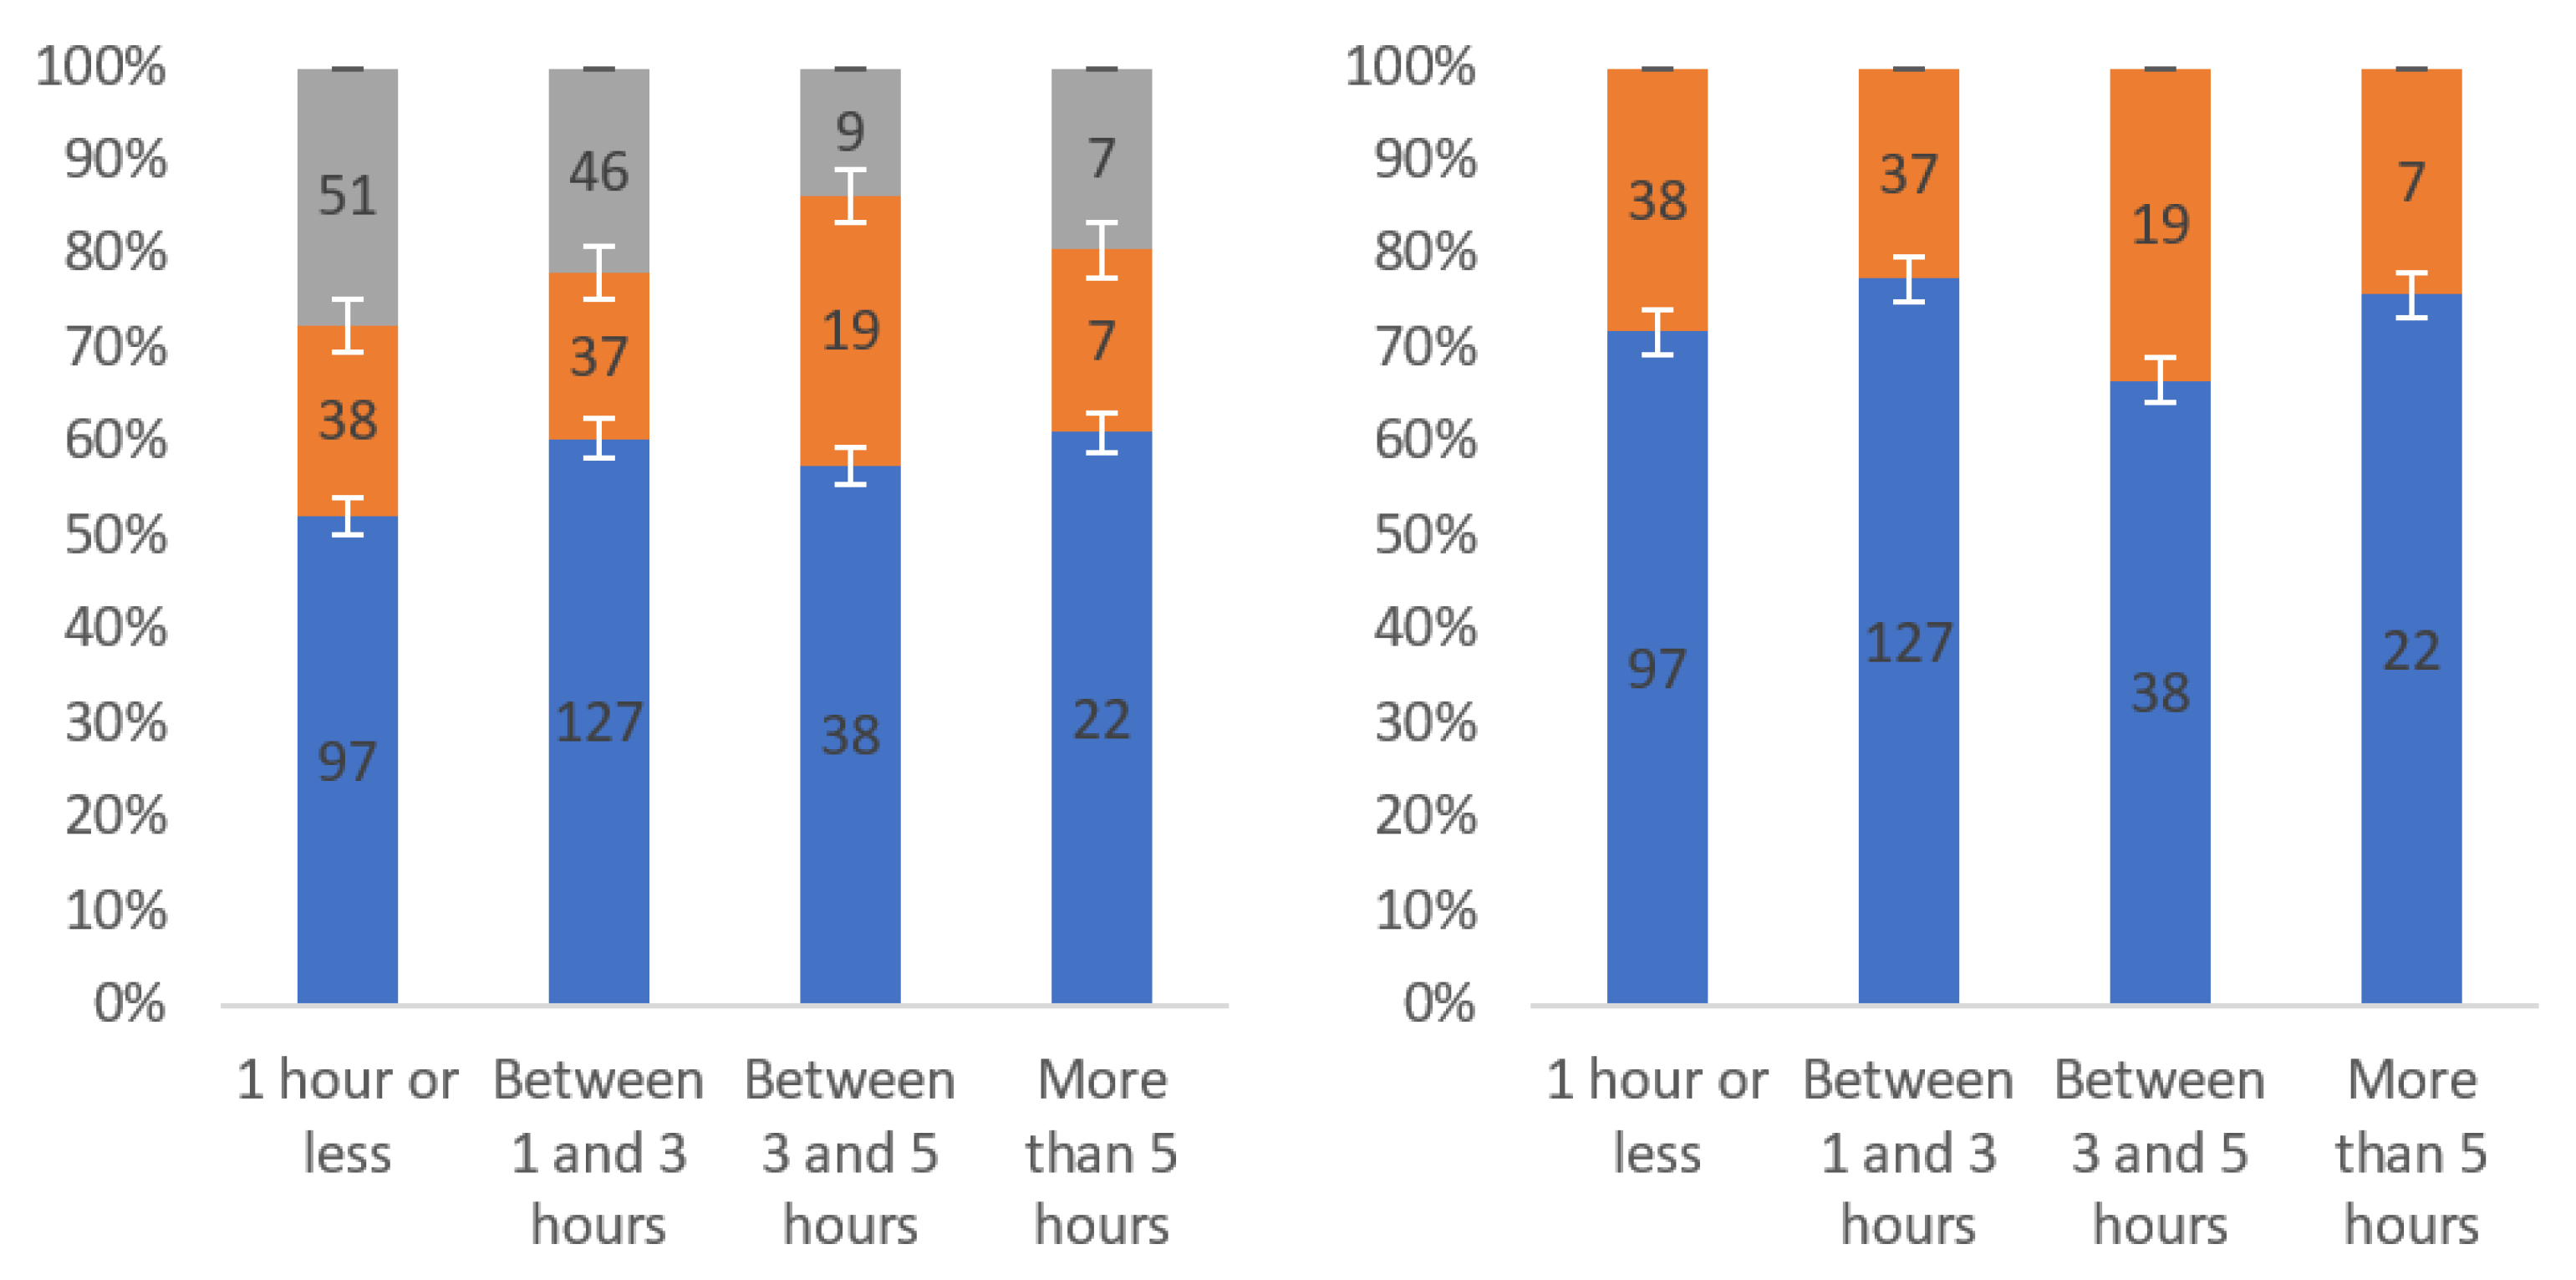
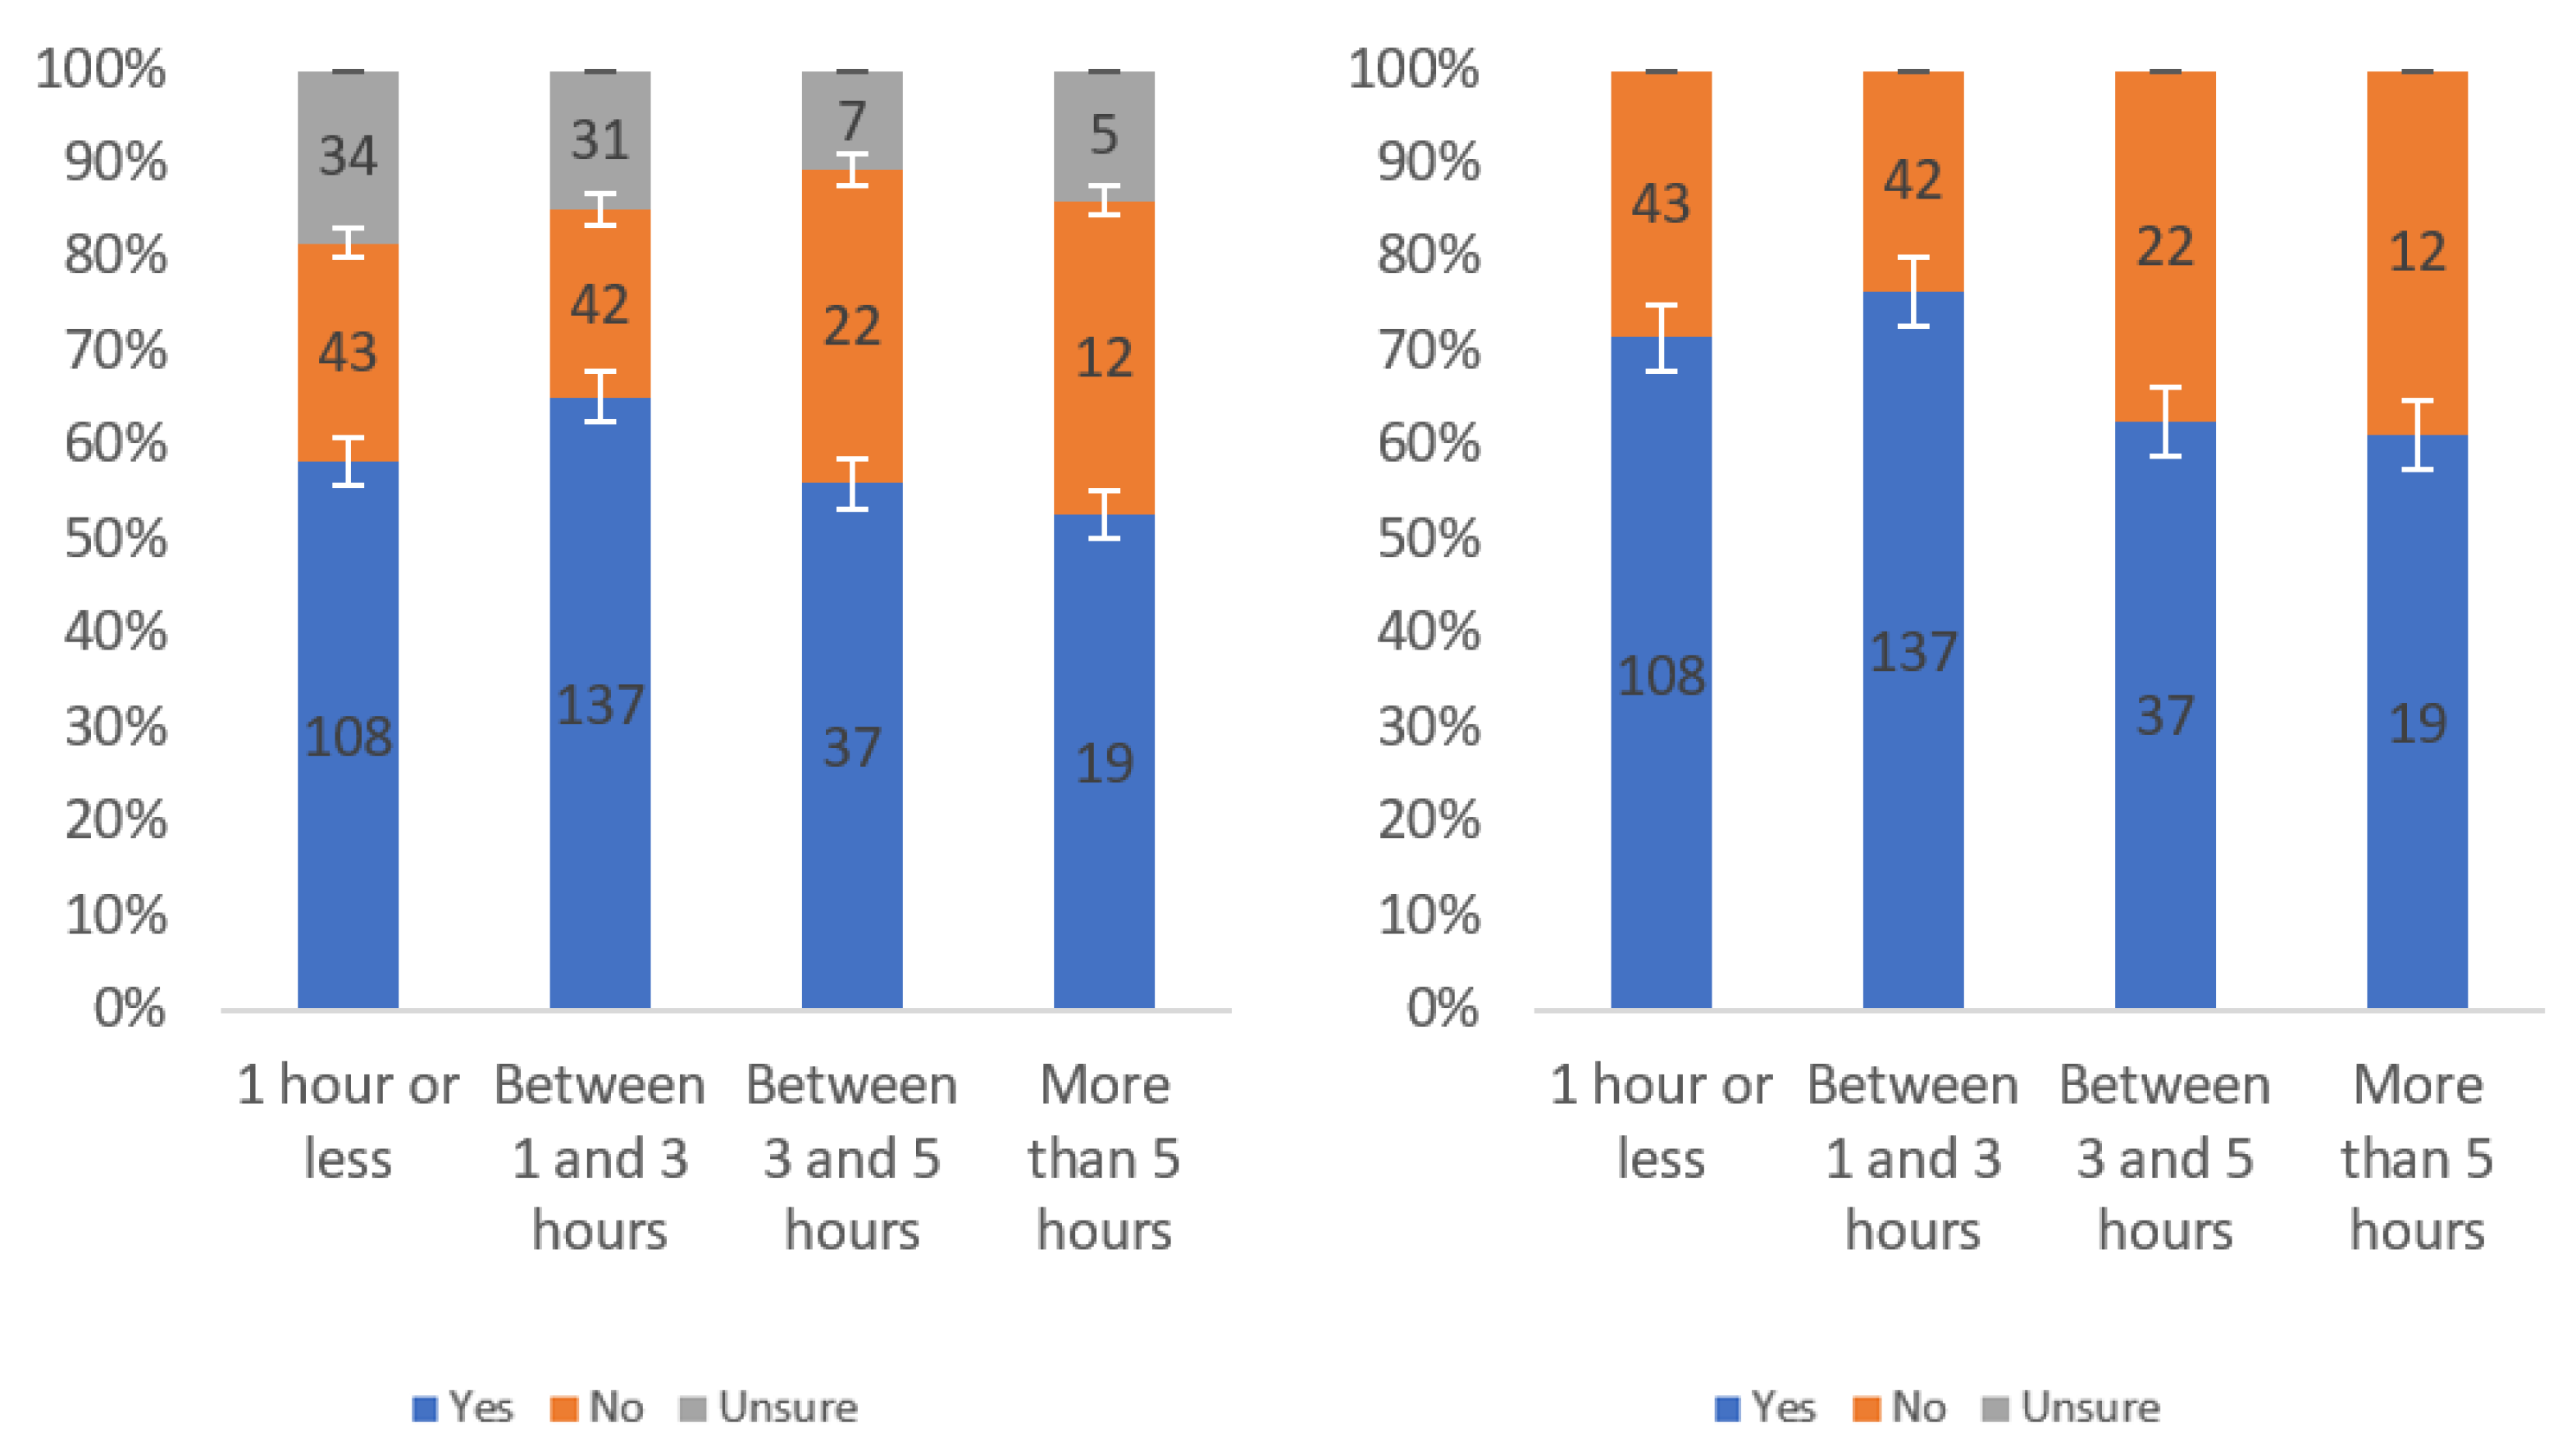
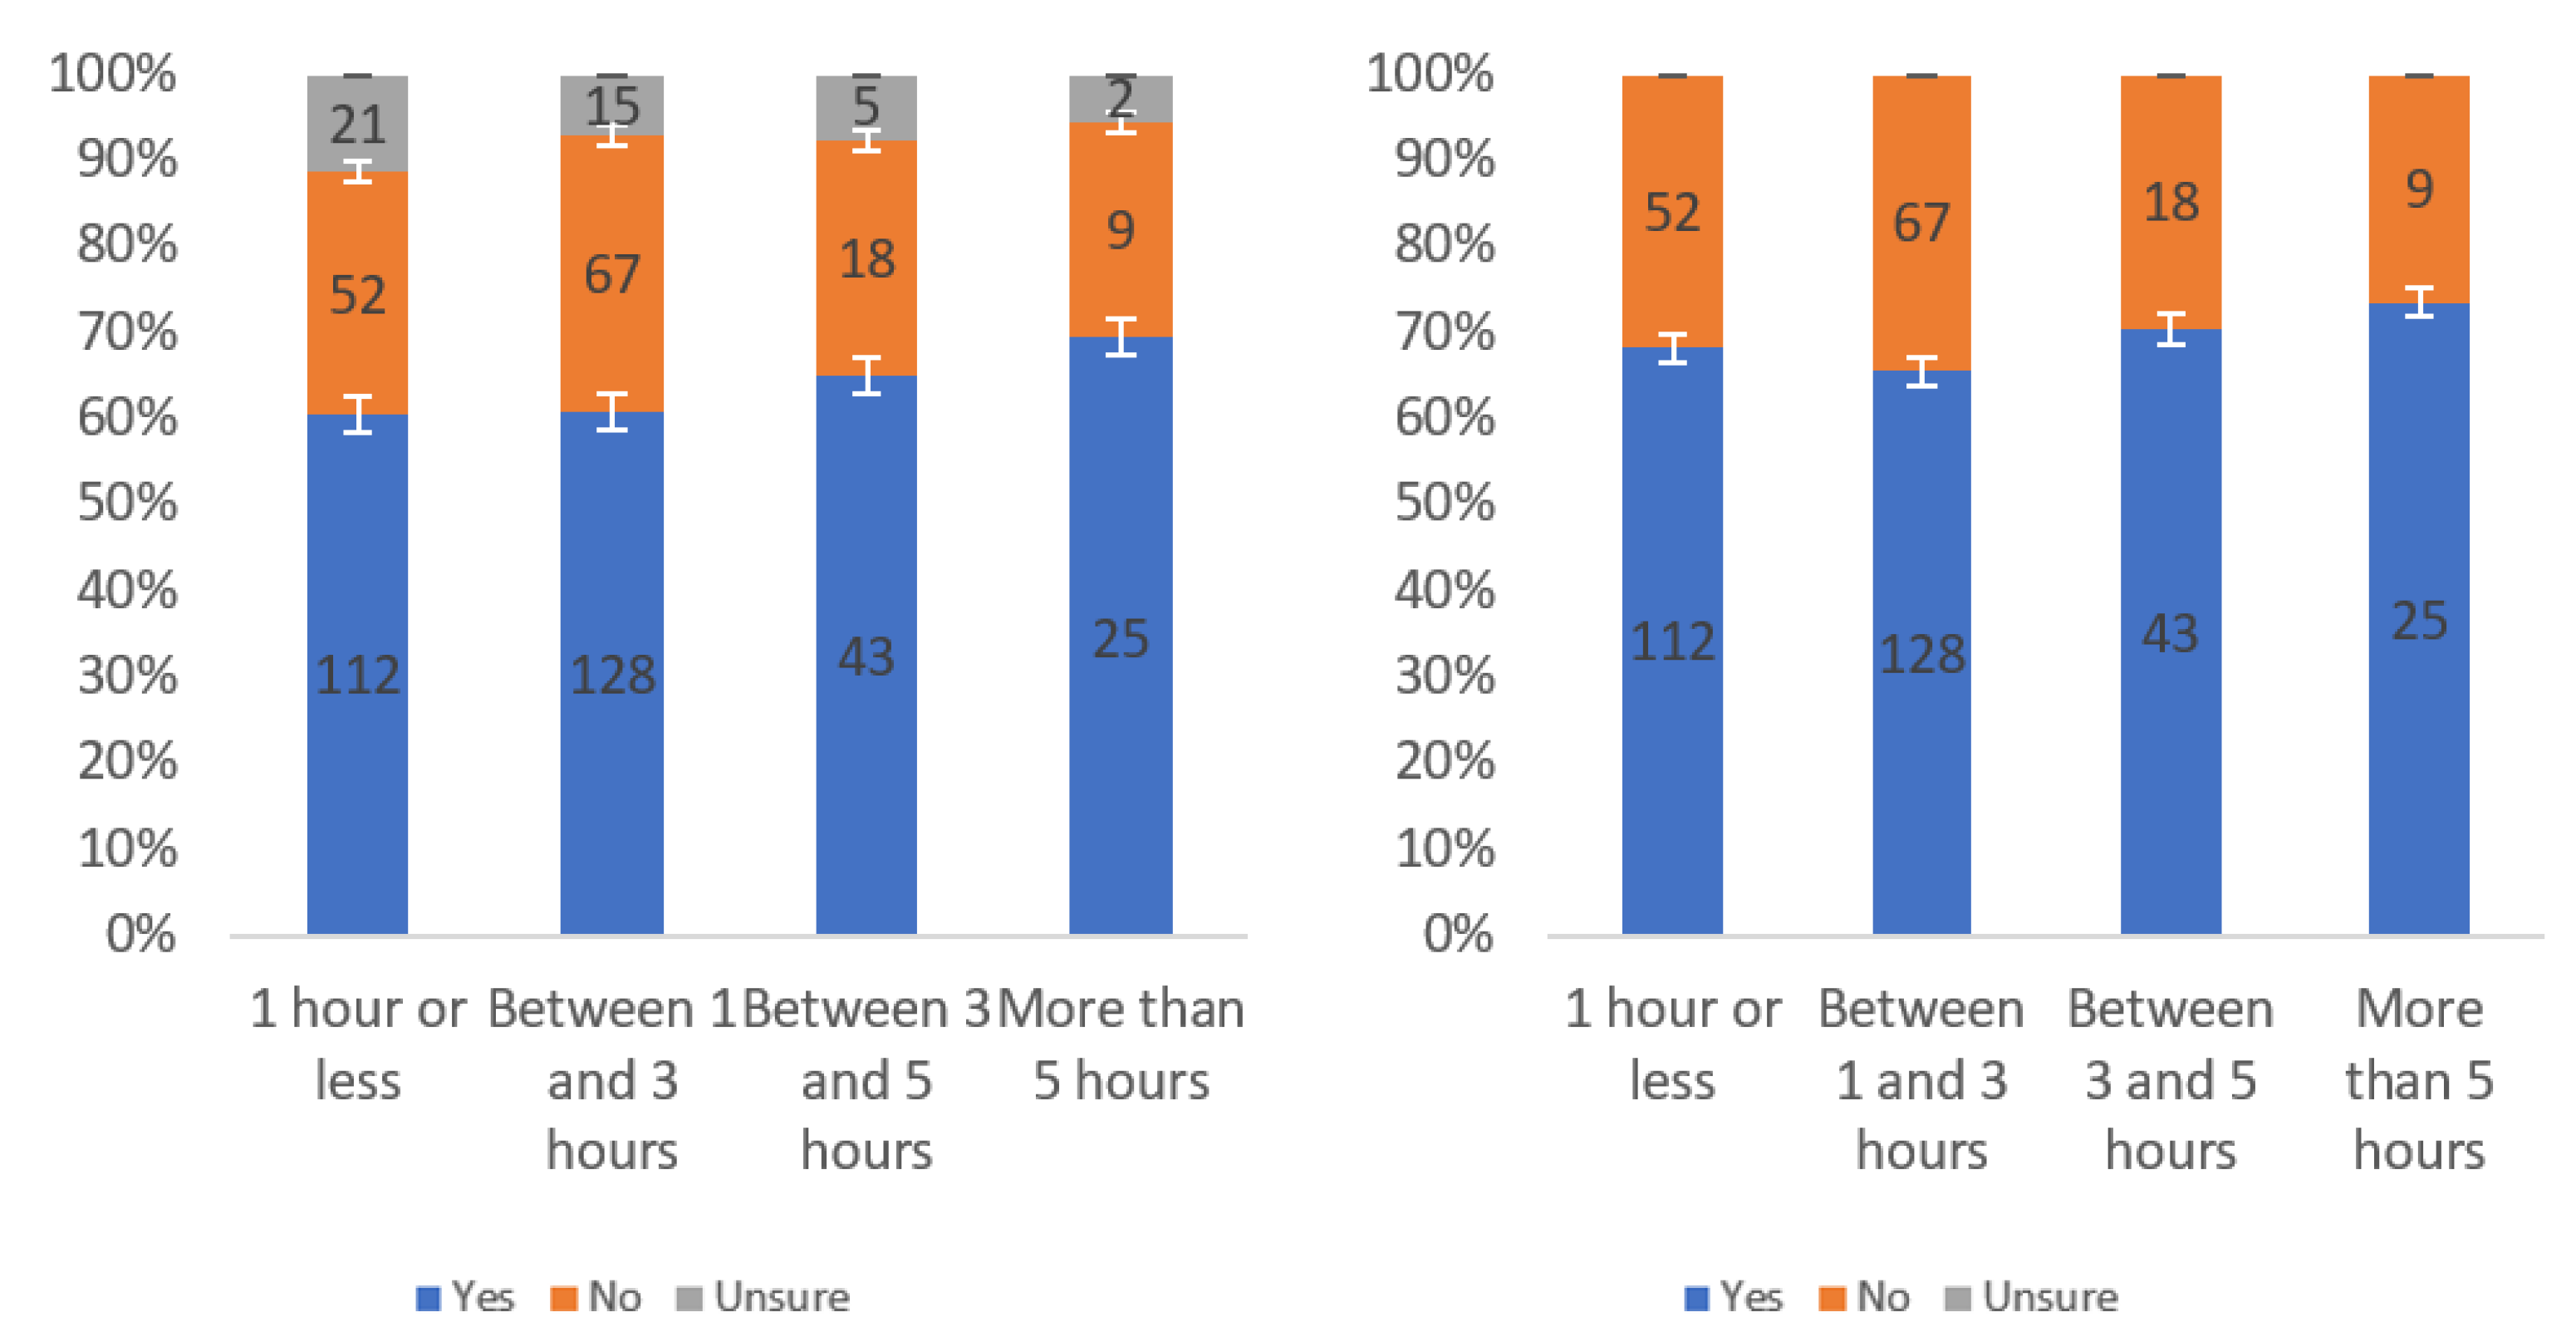
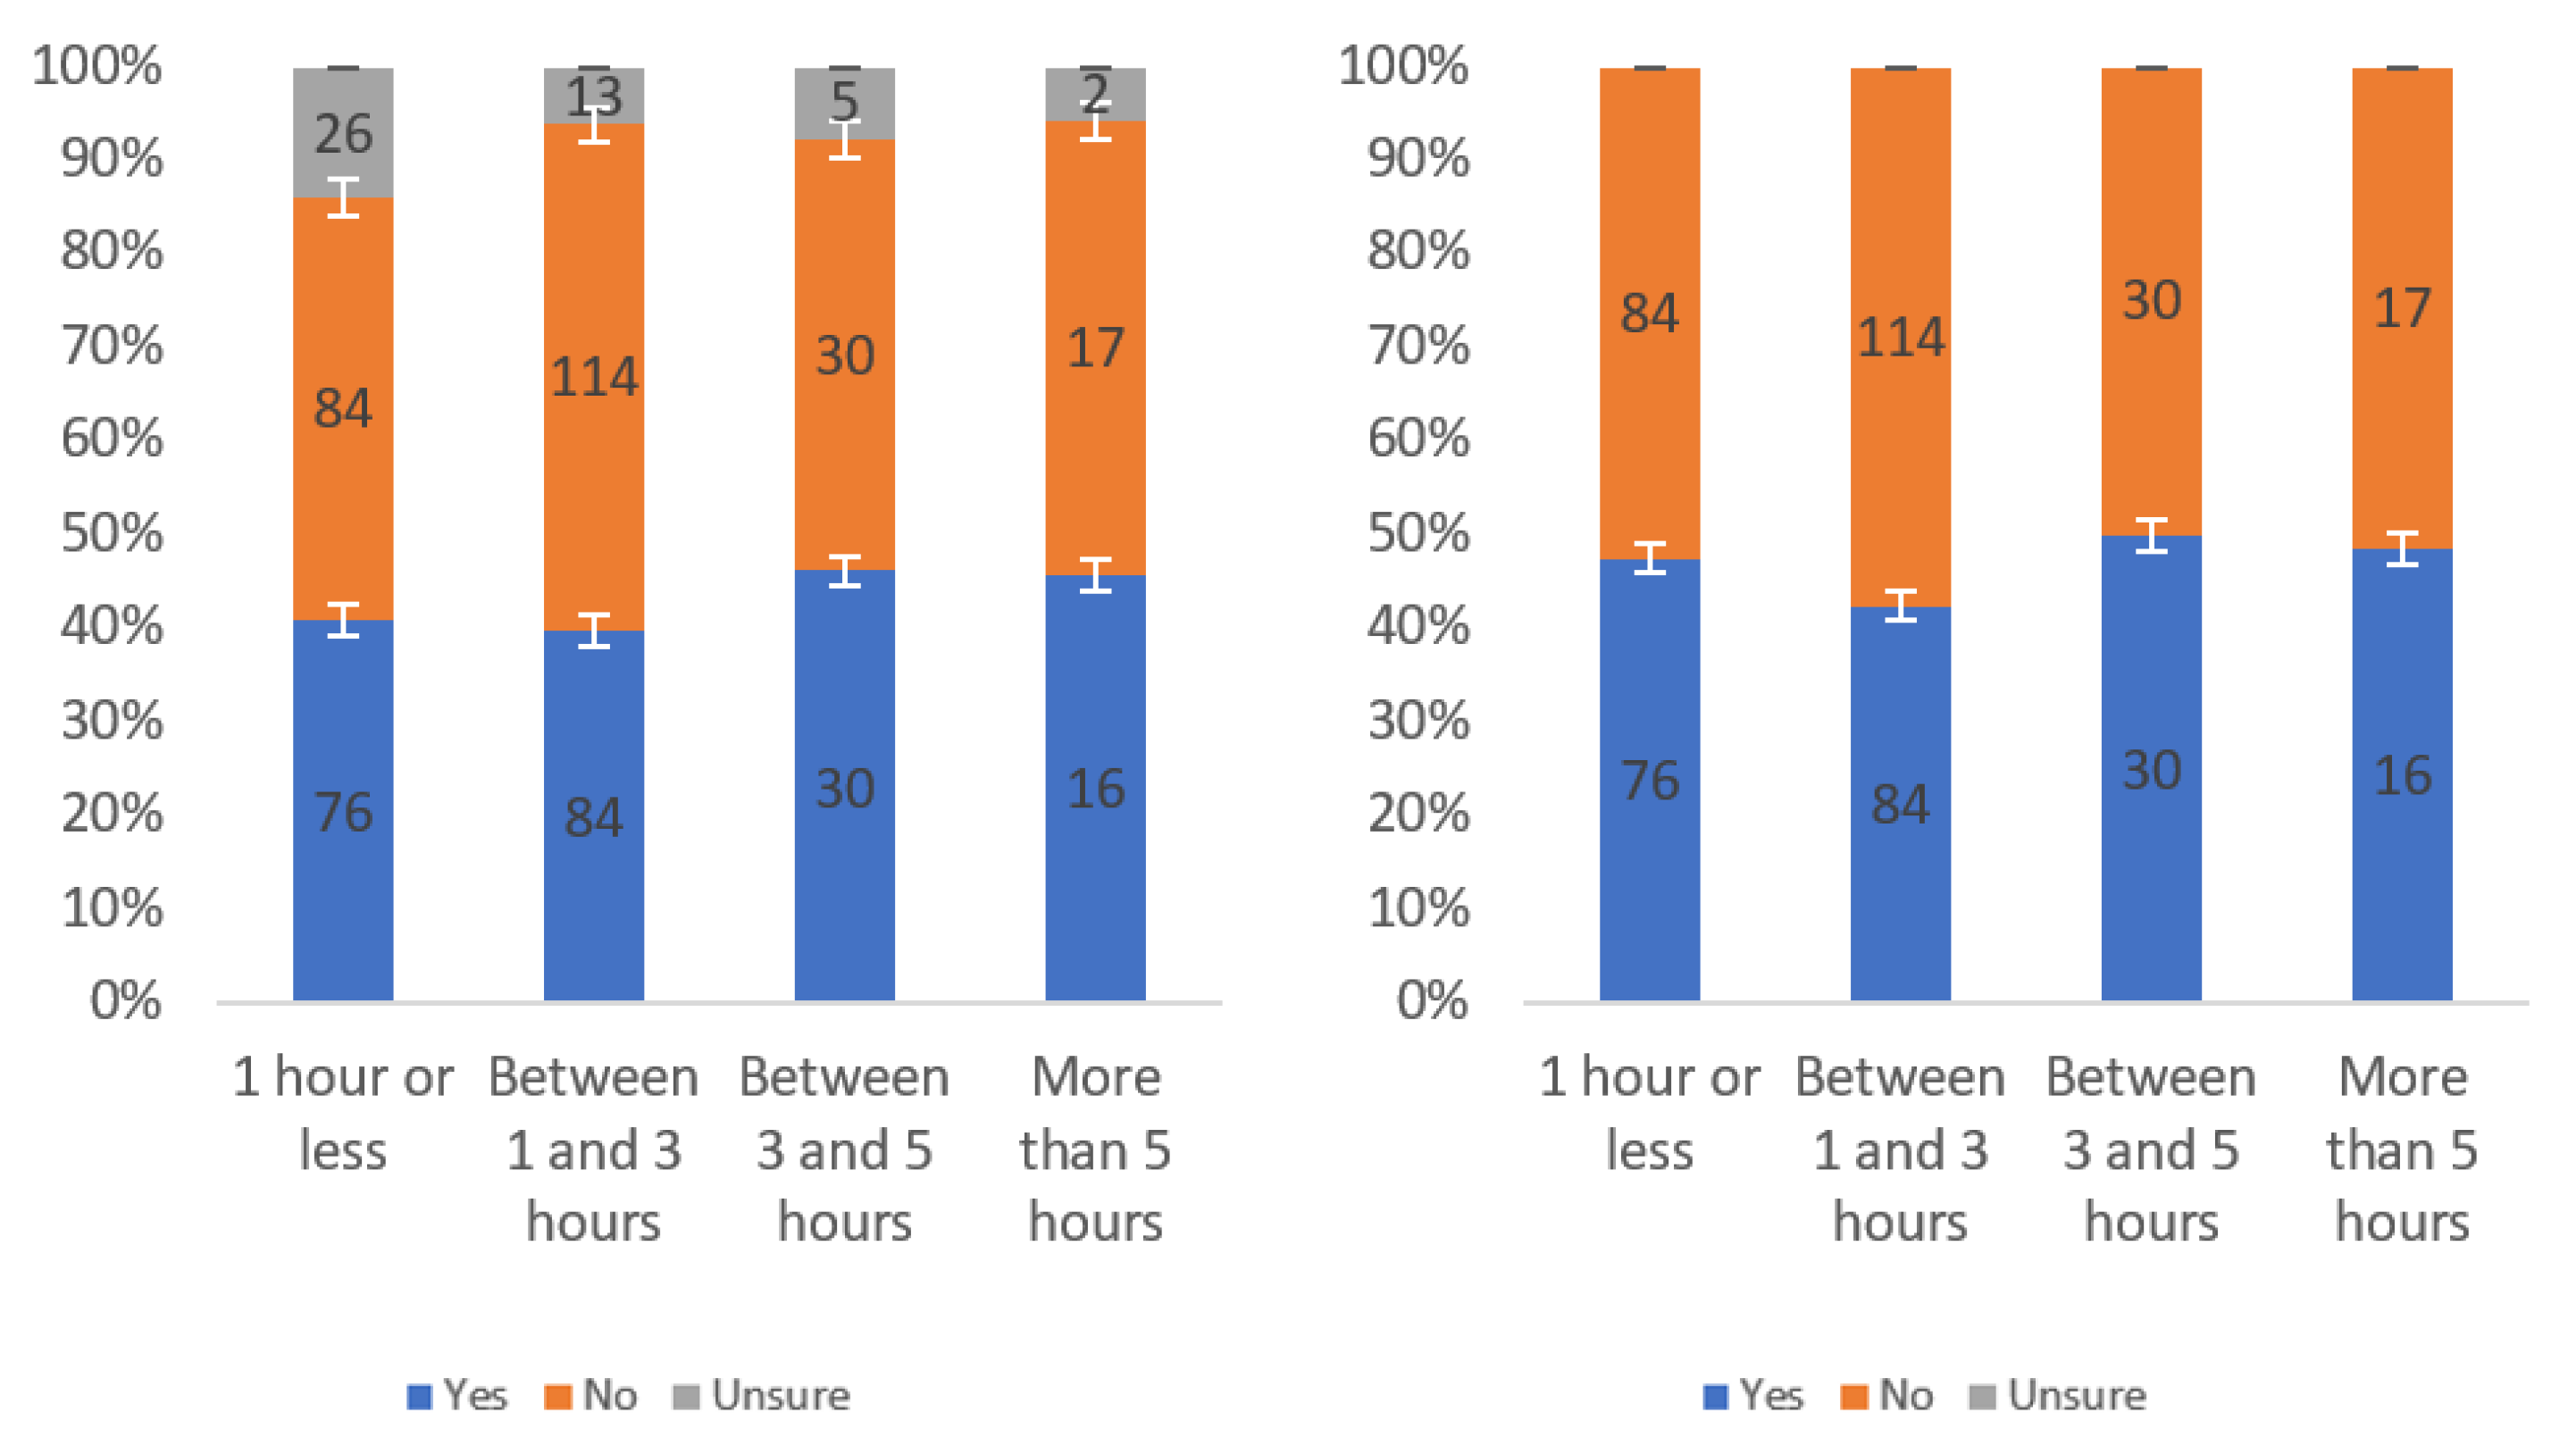
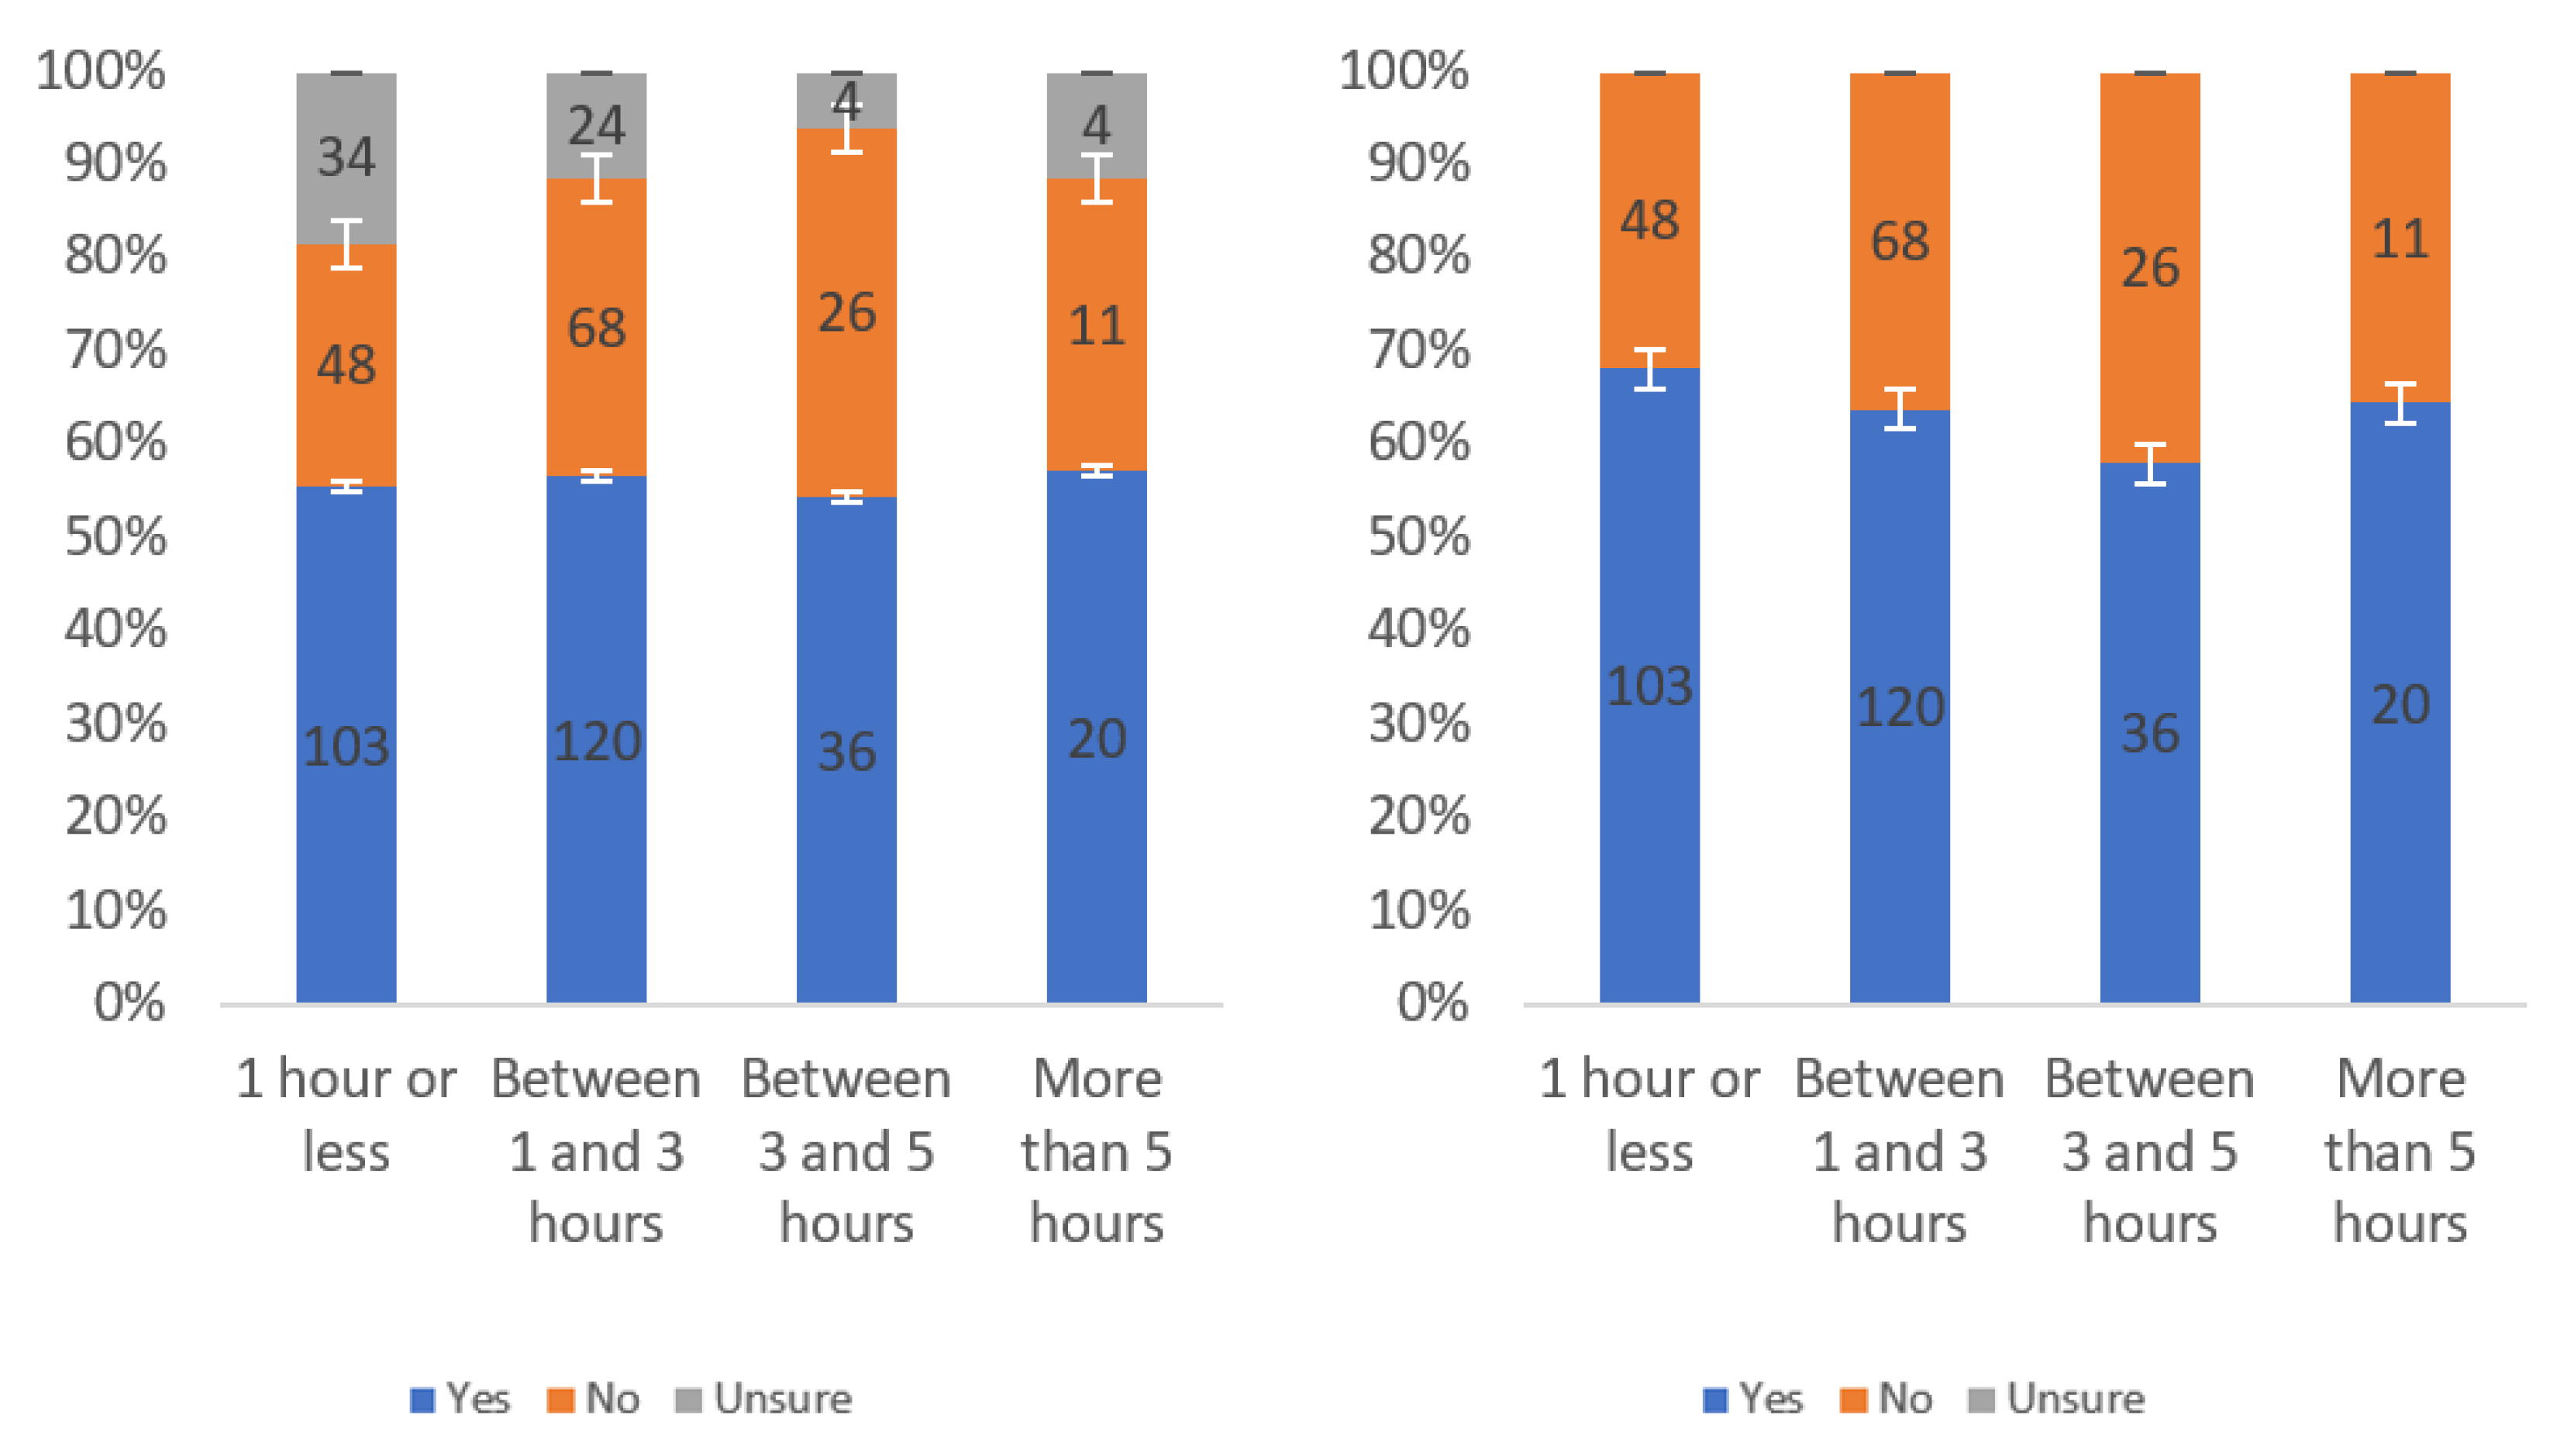
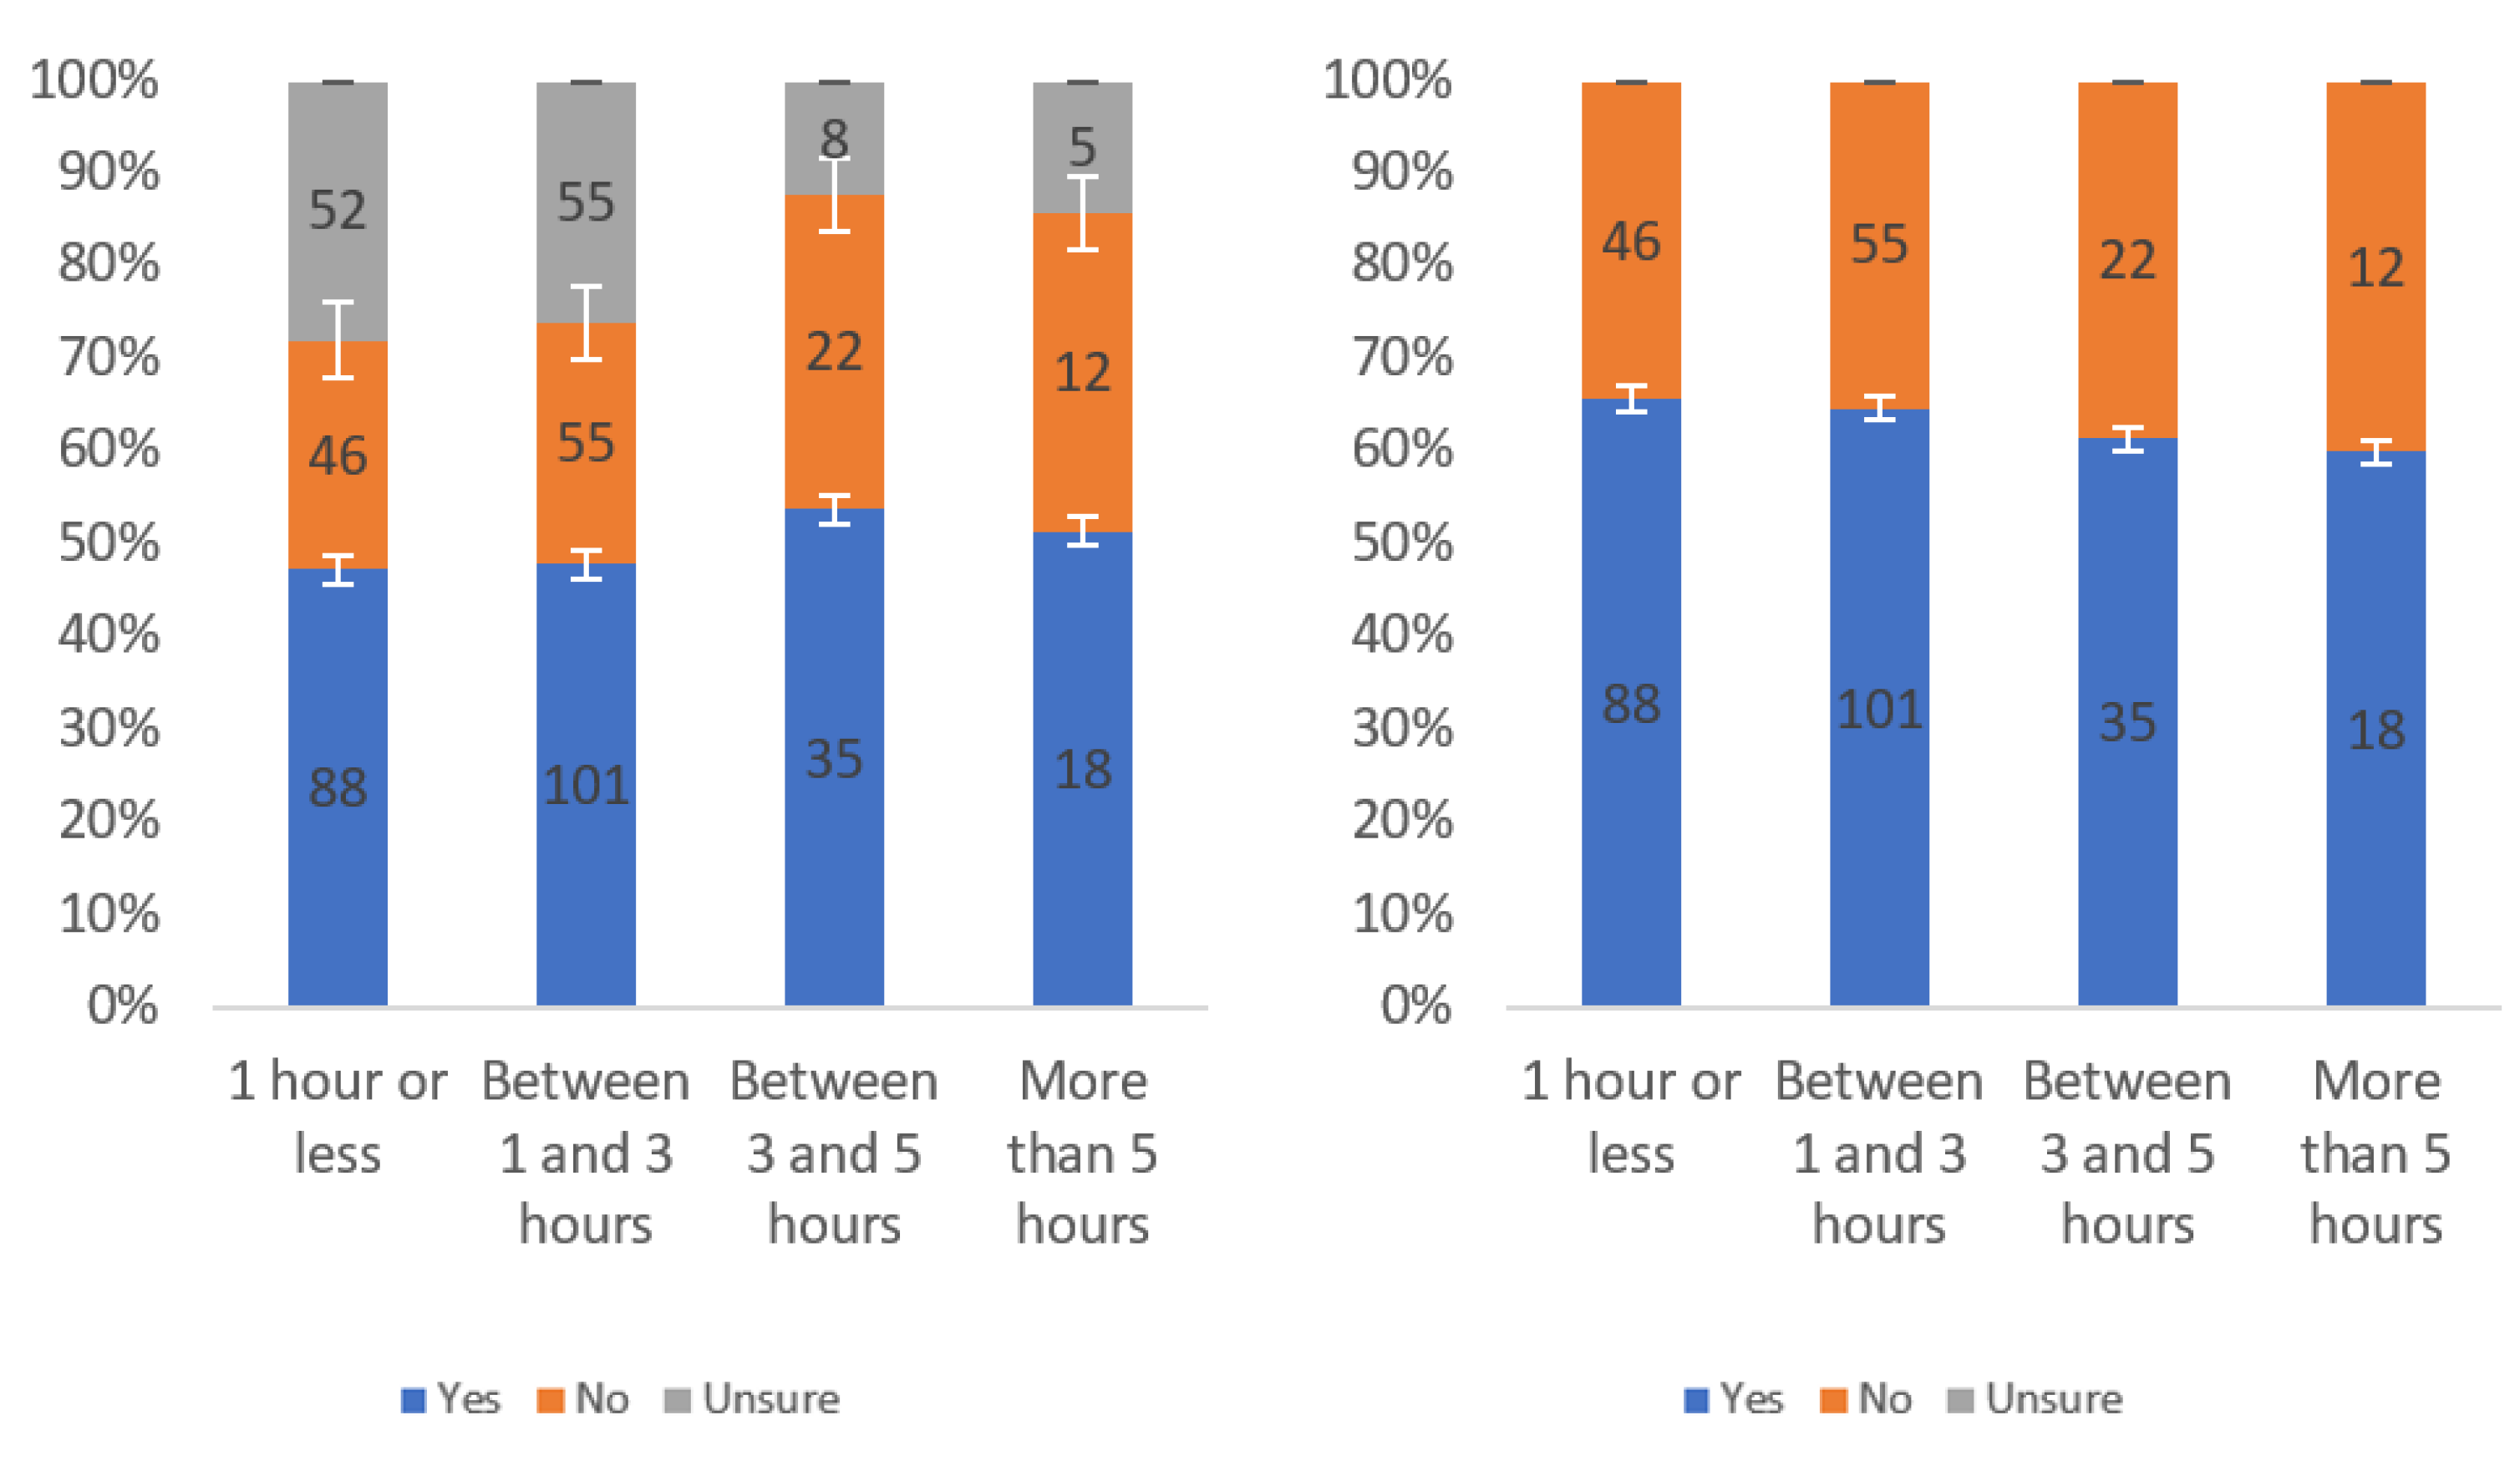
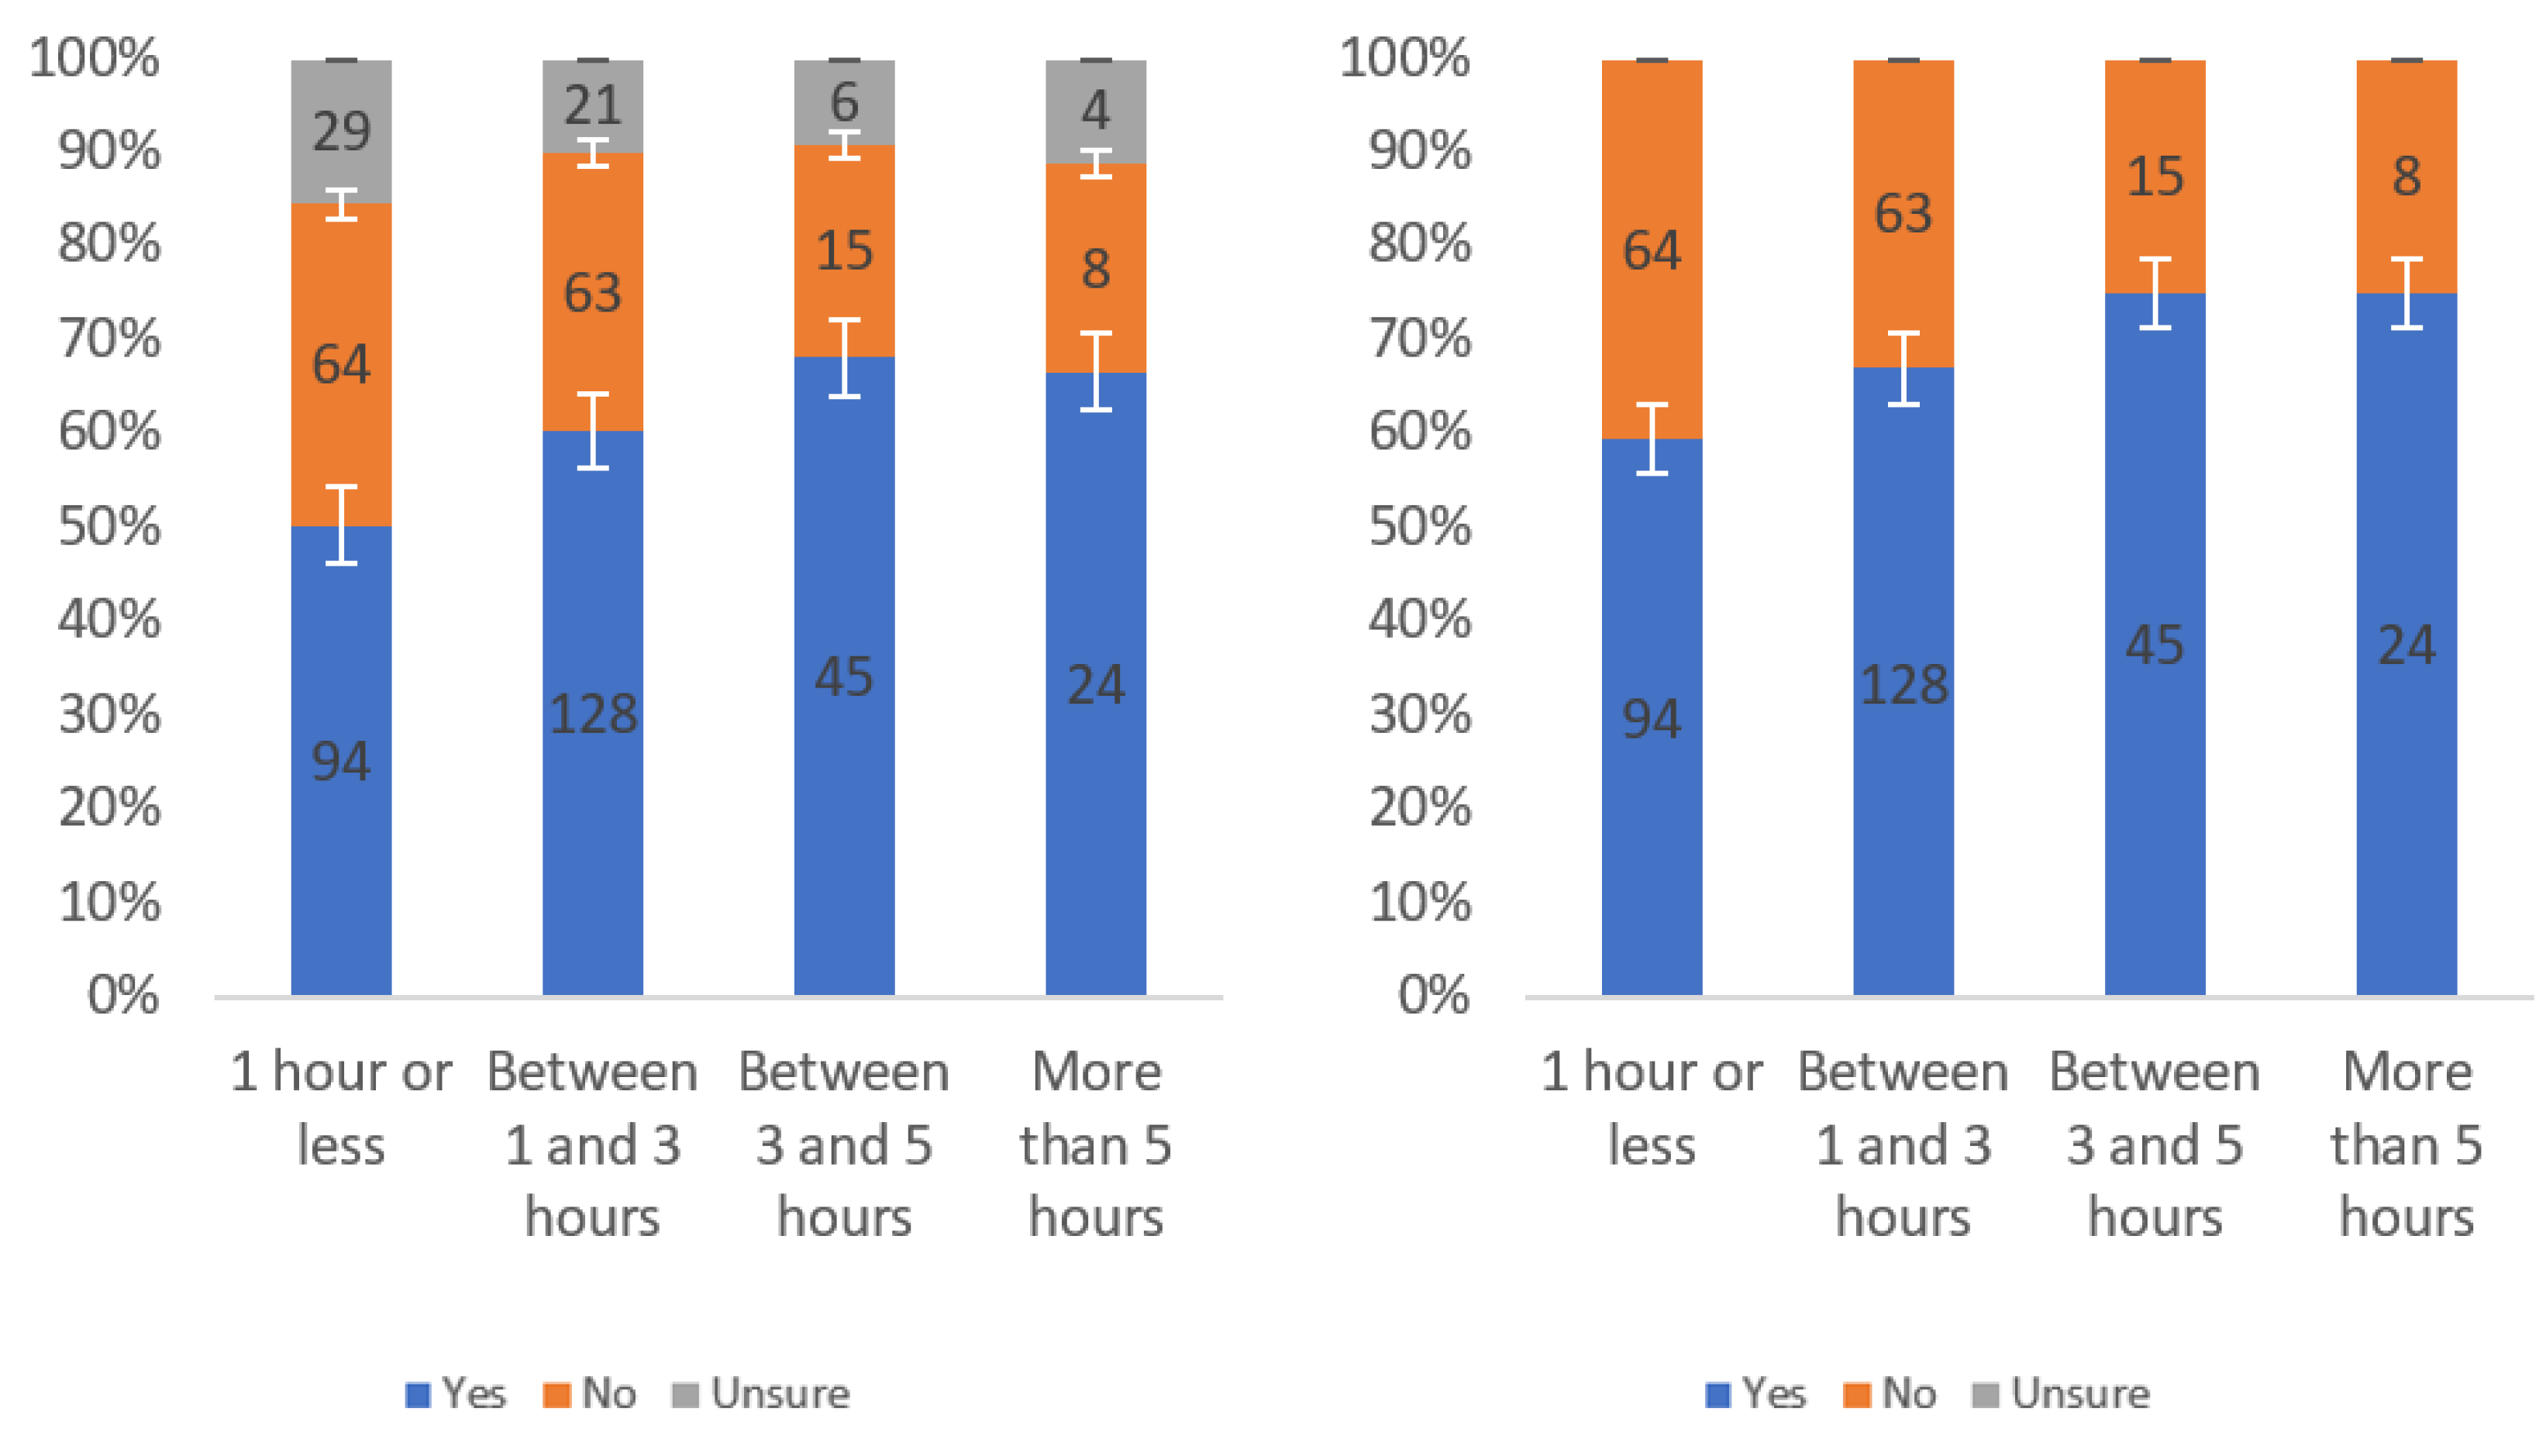
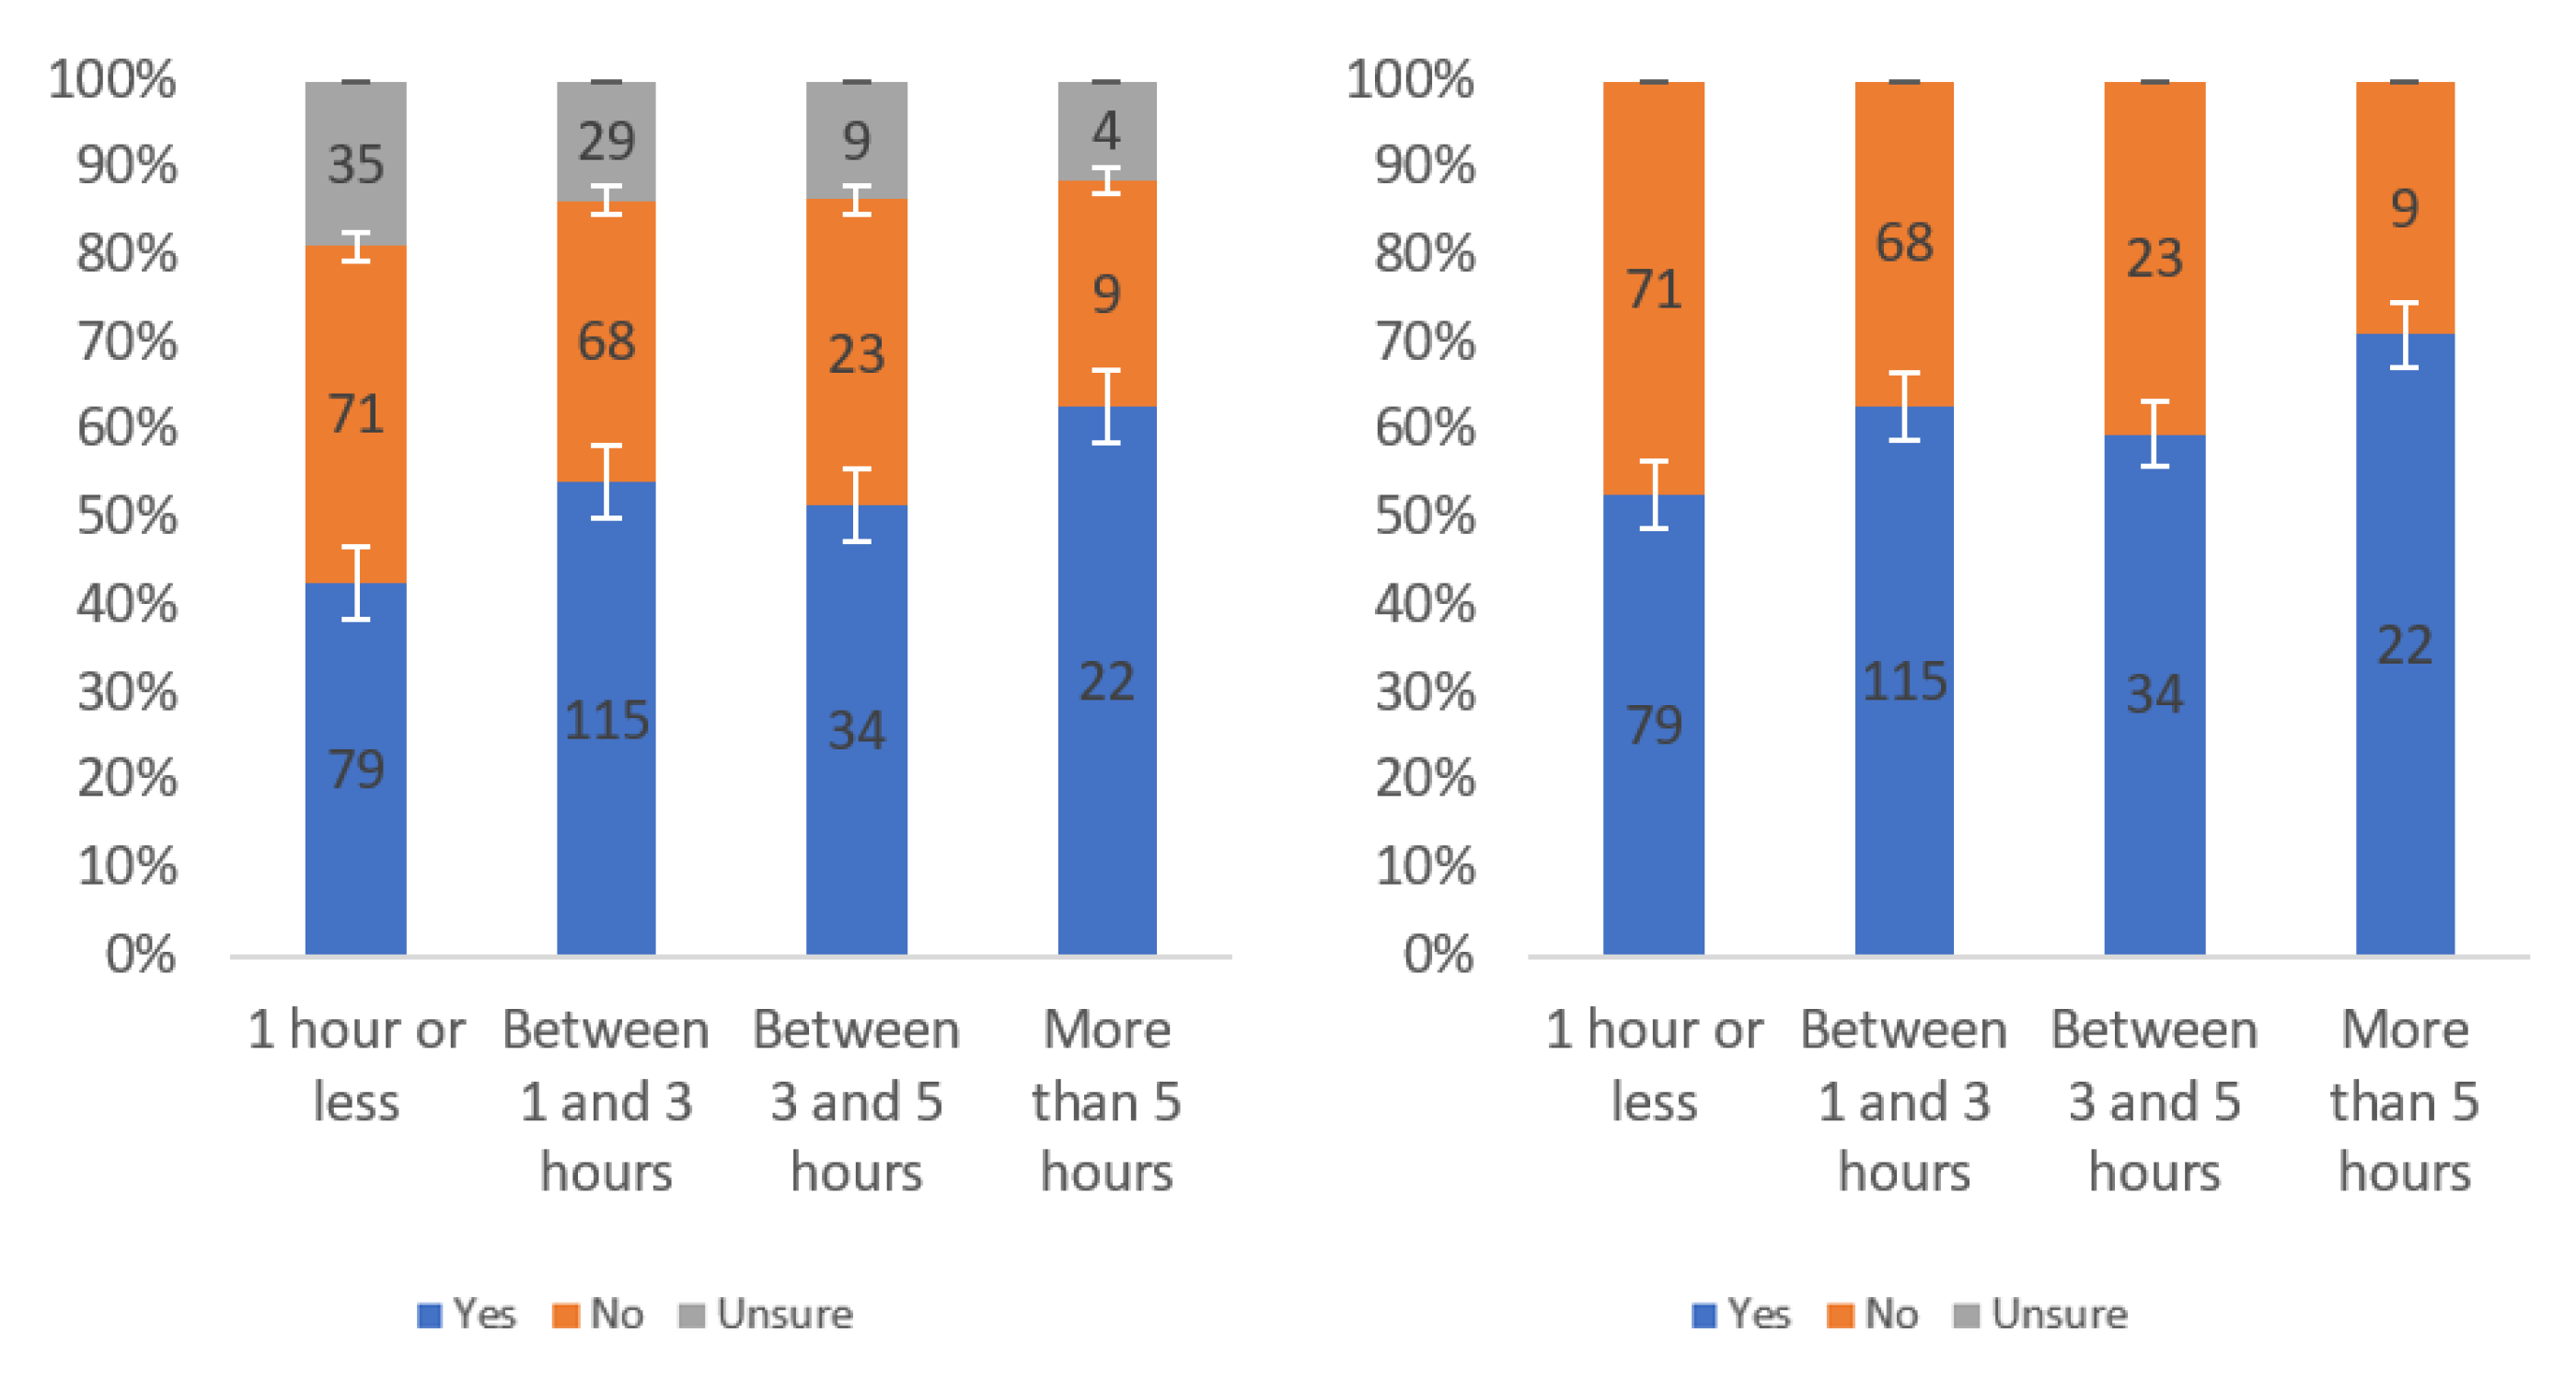
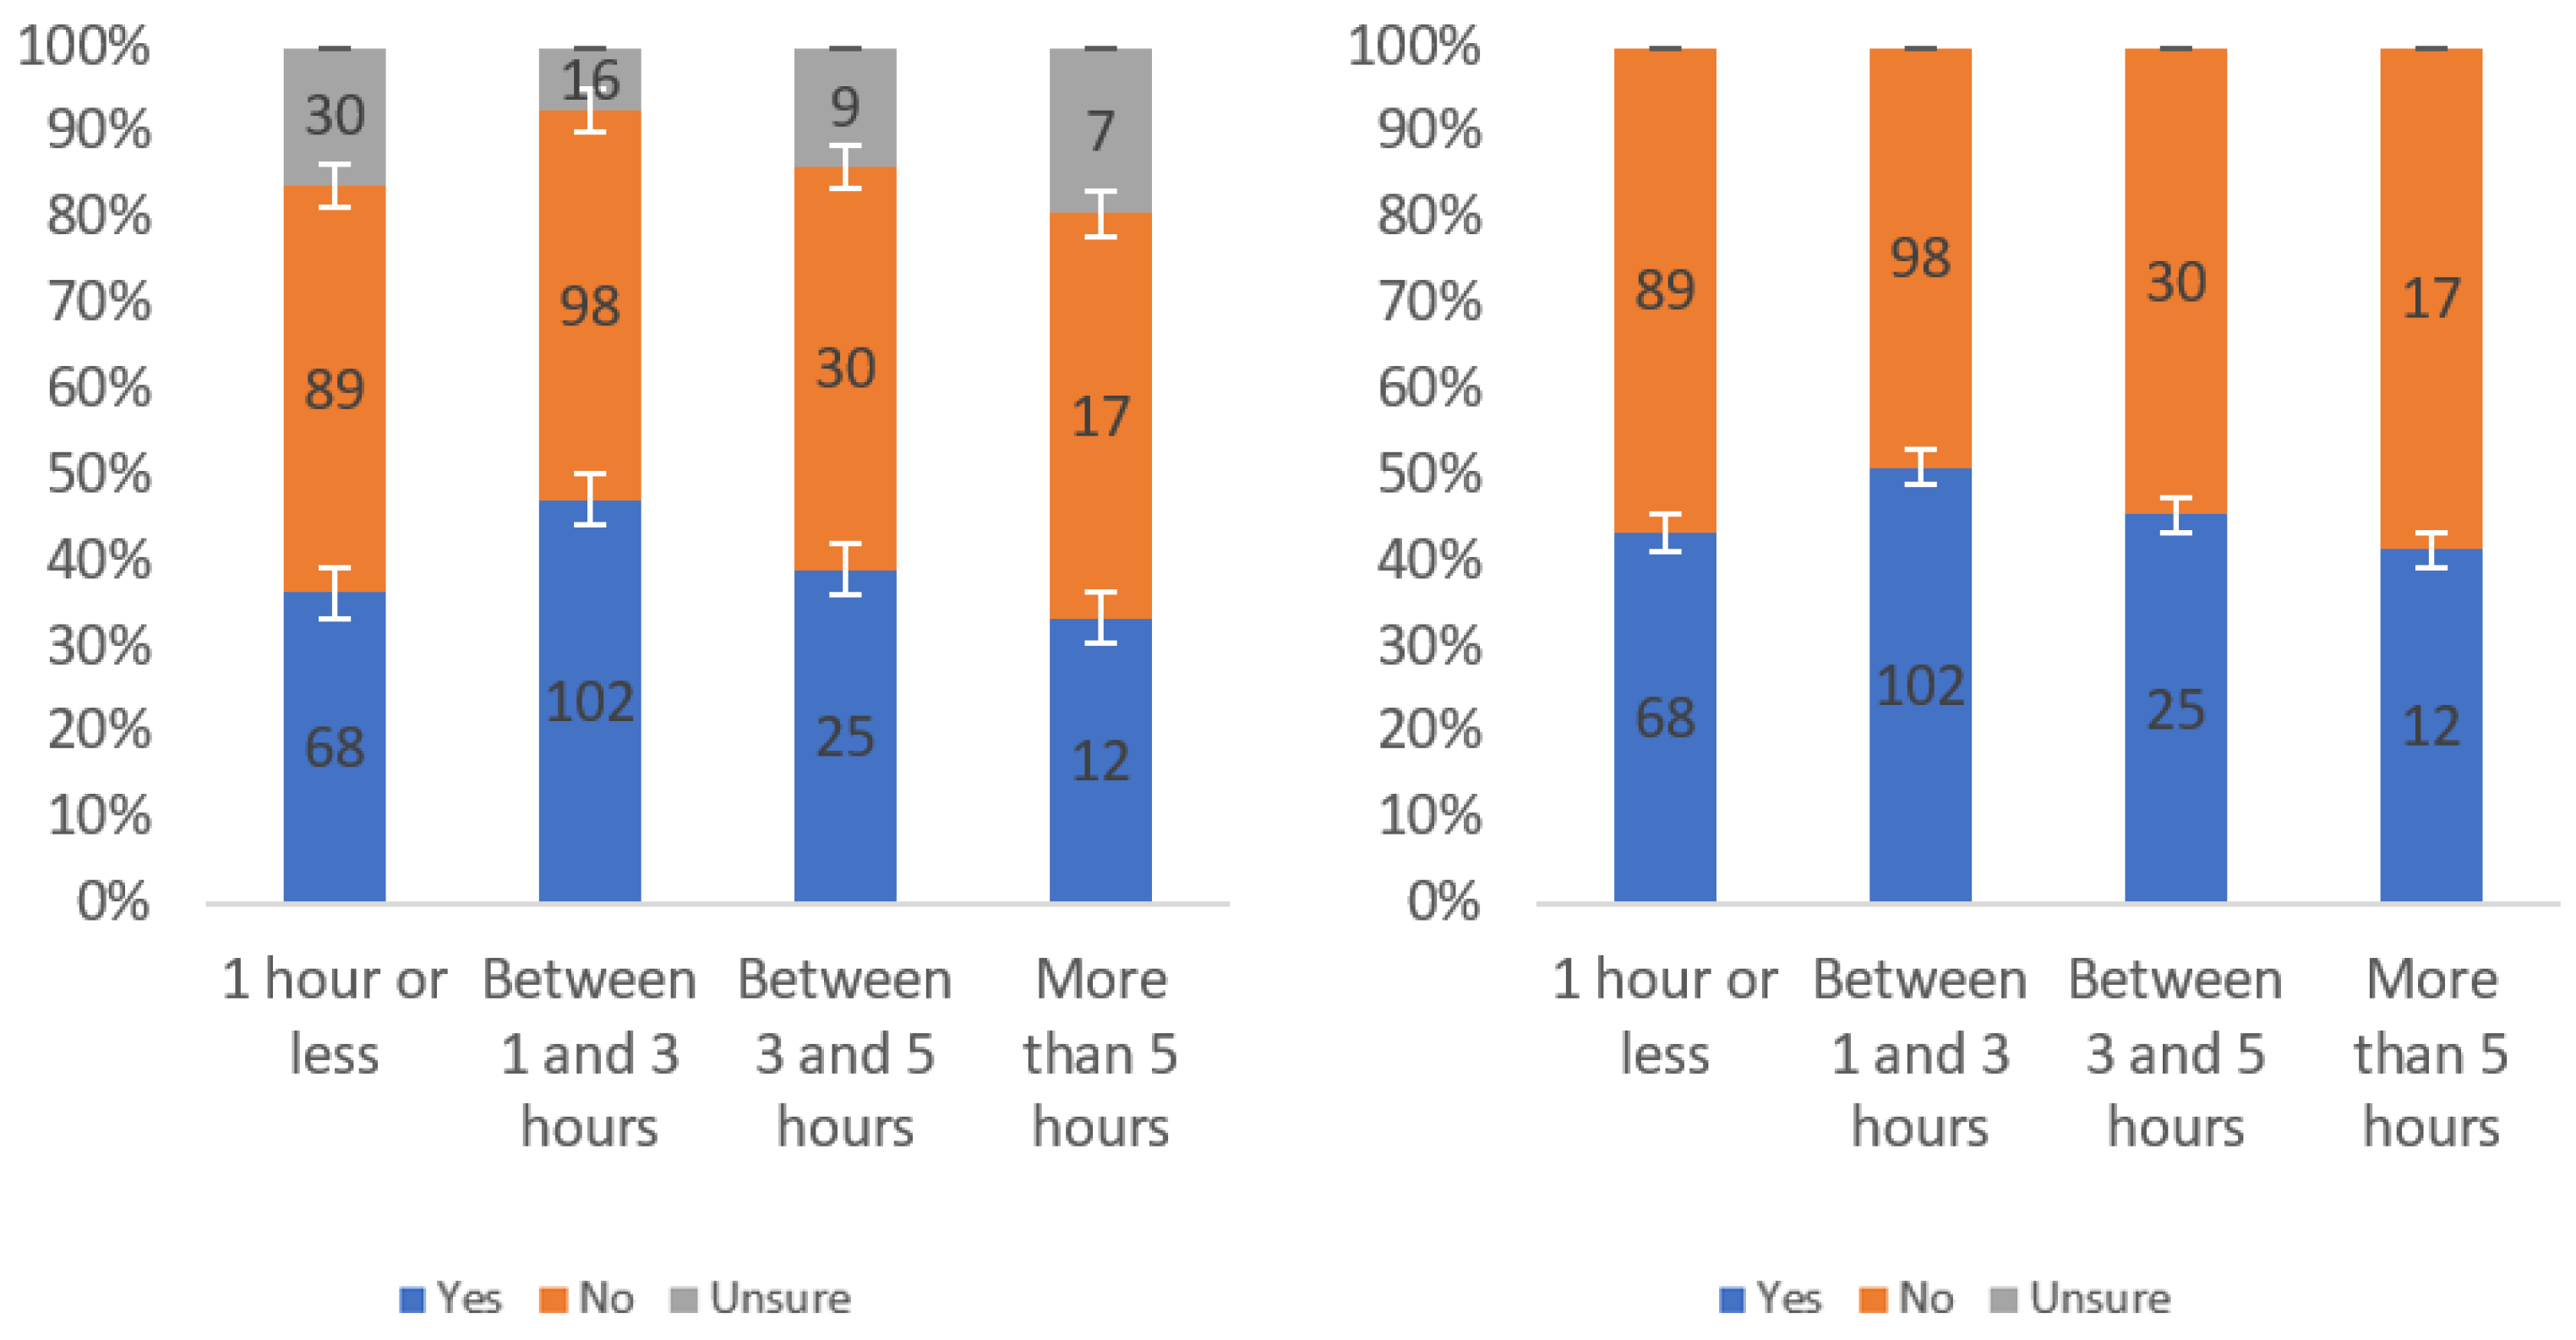
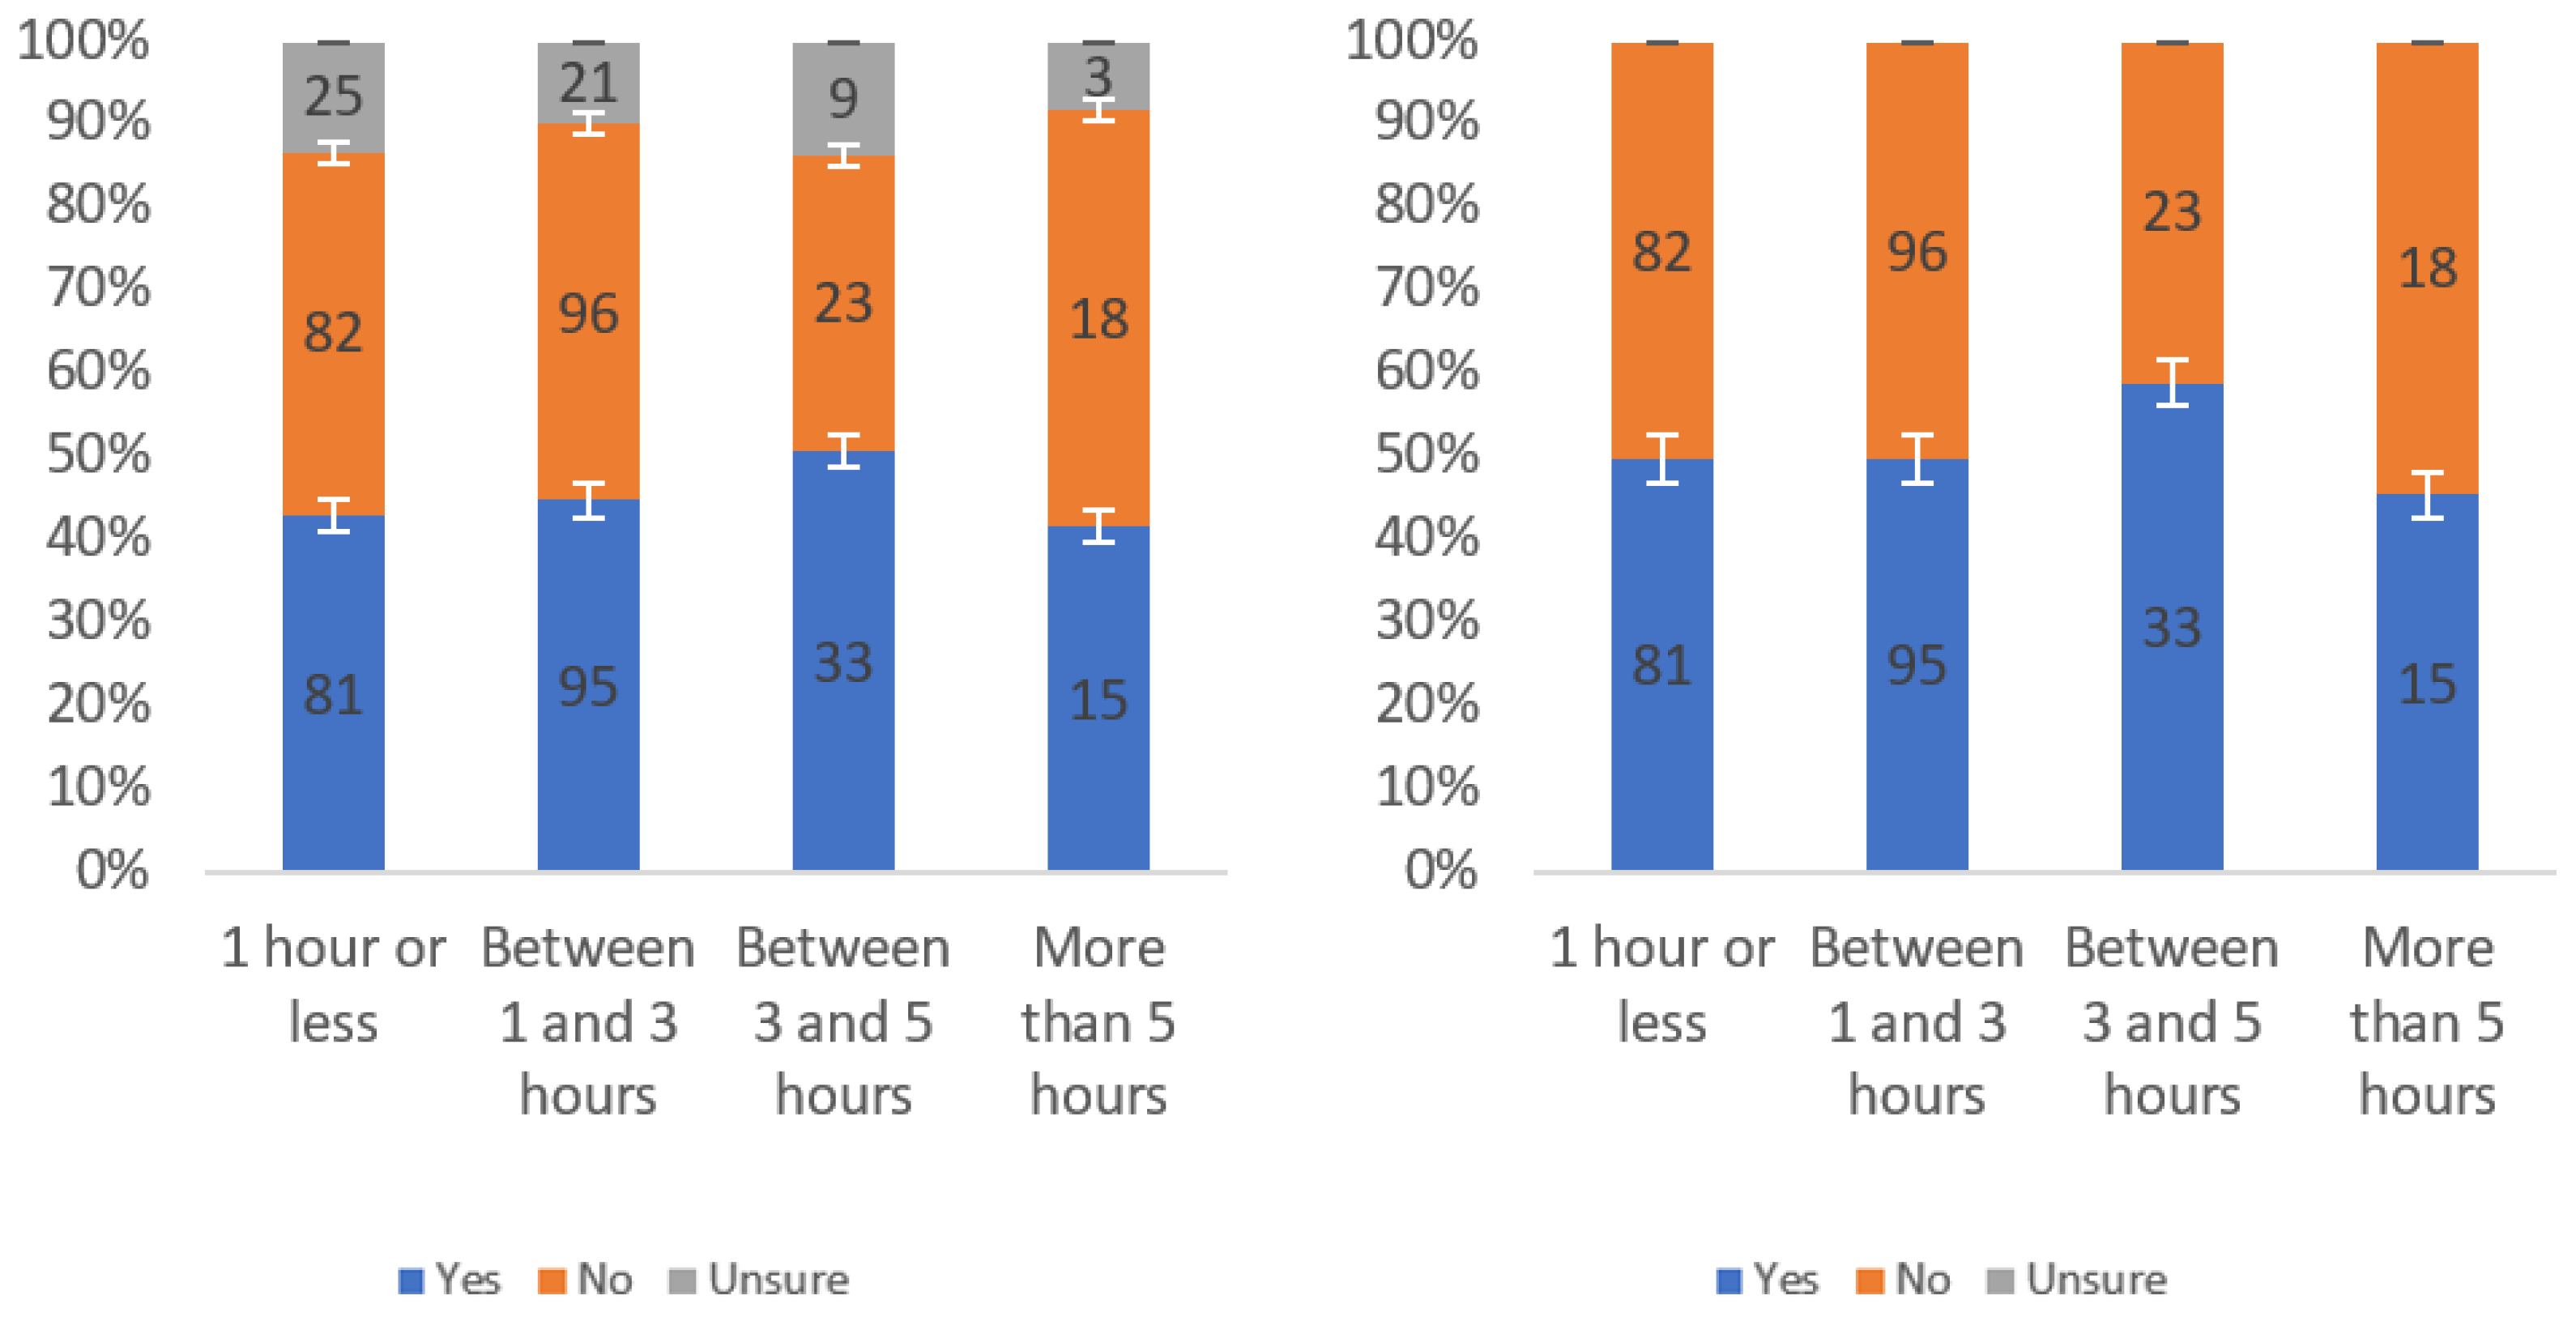
Figure 9.
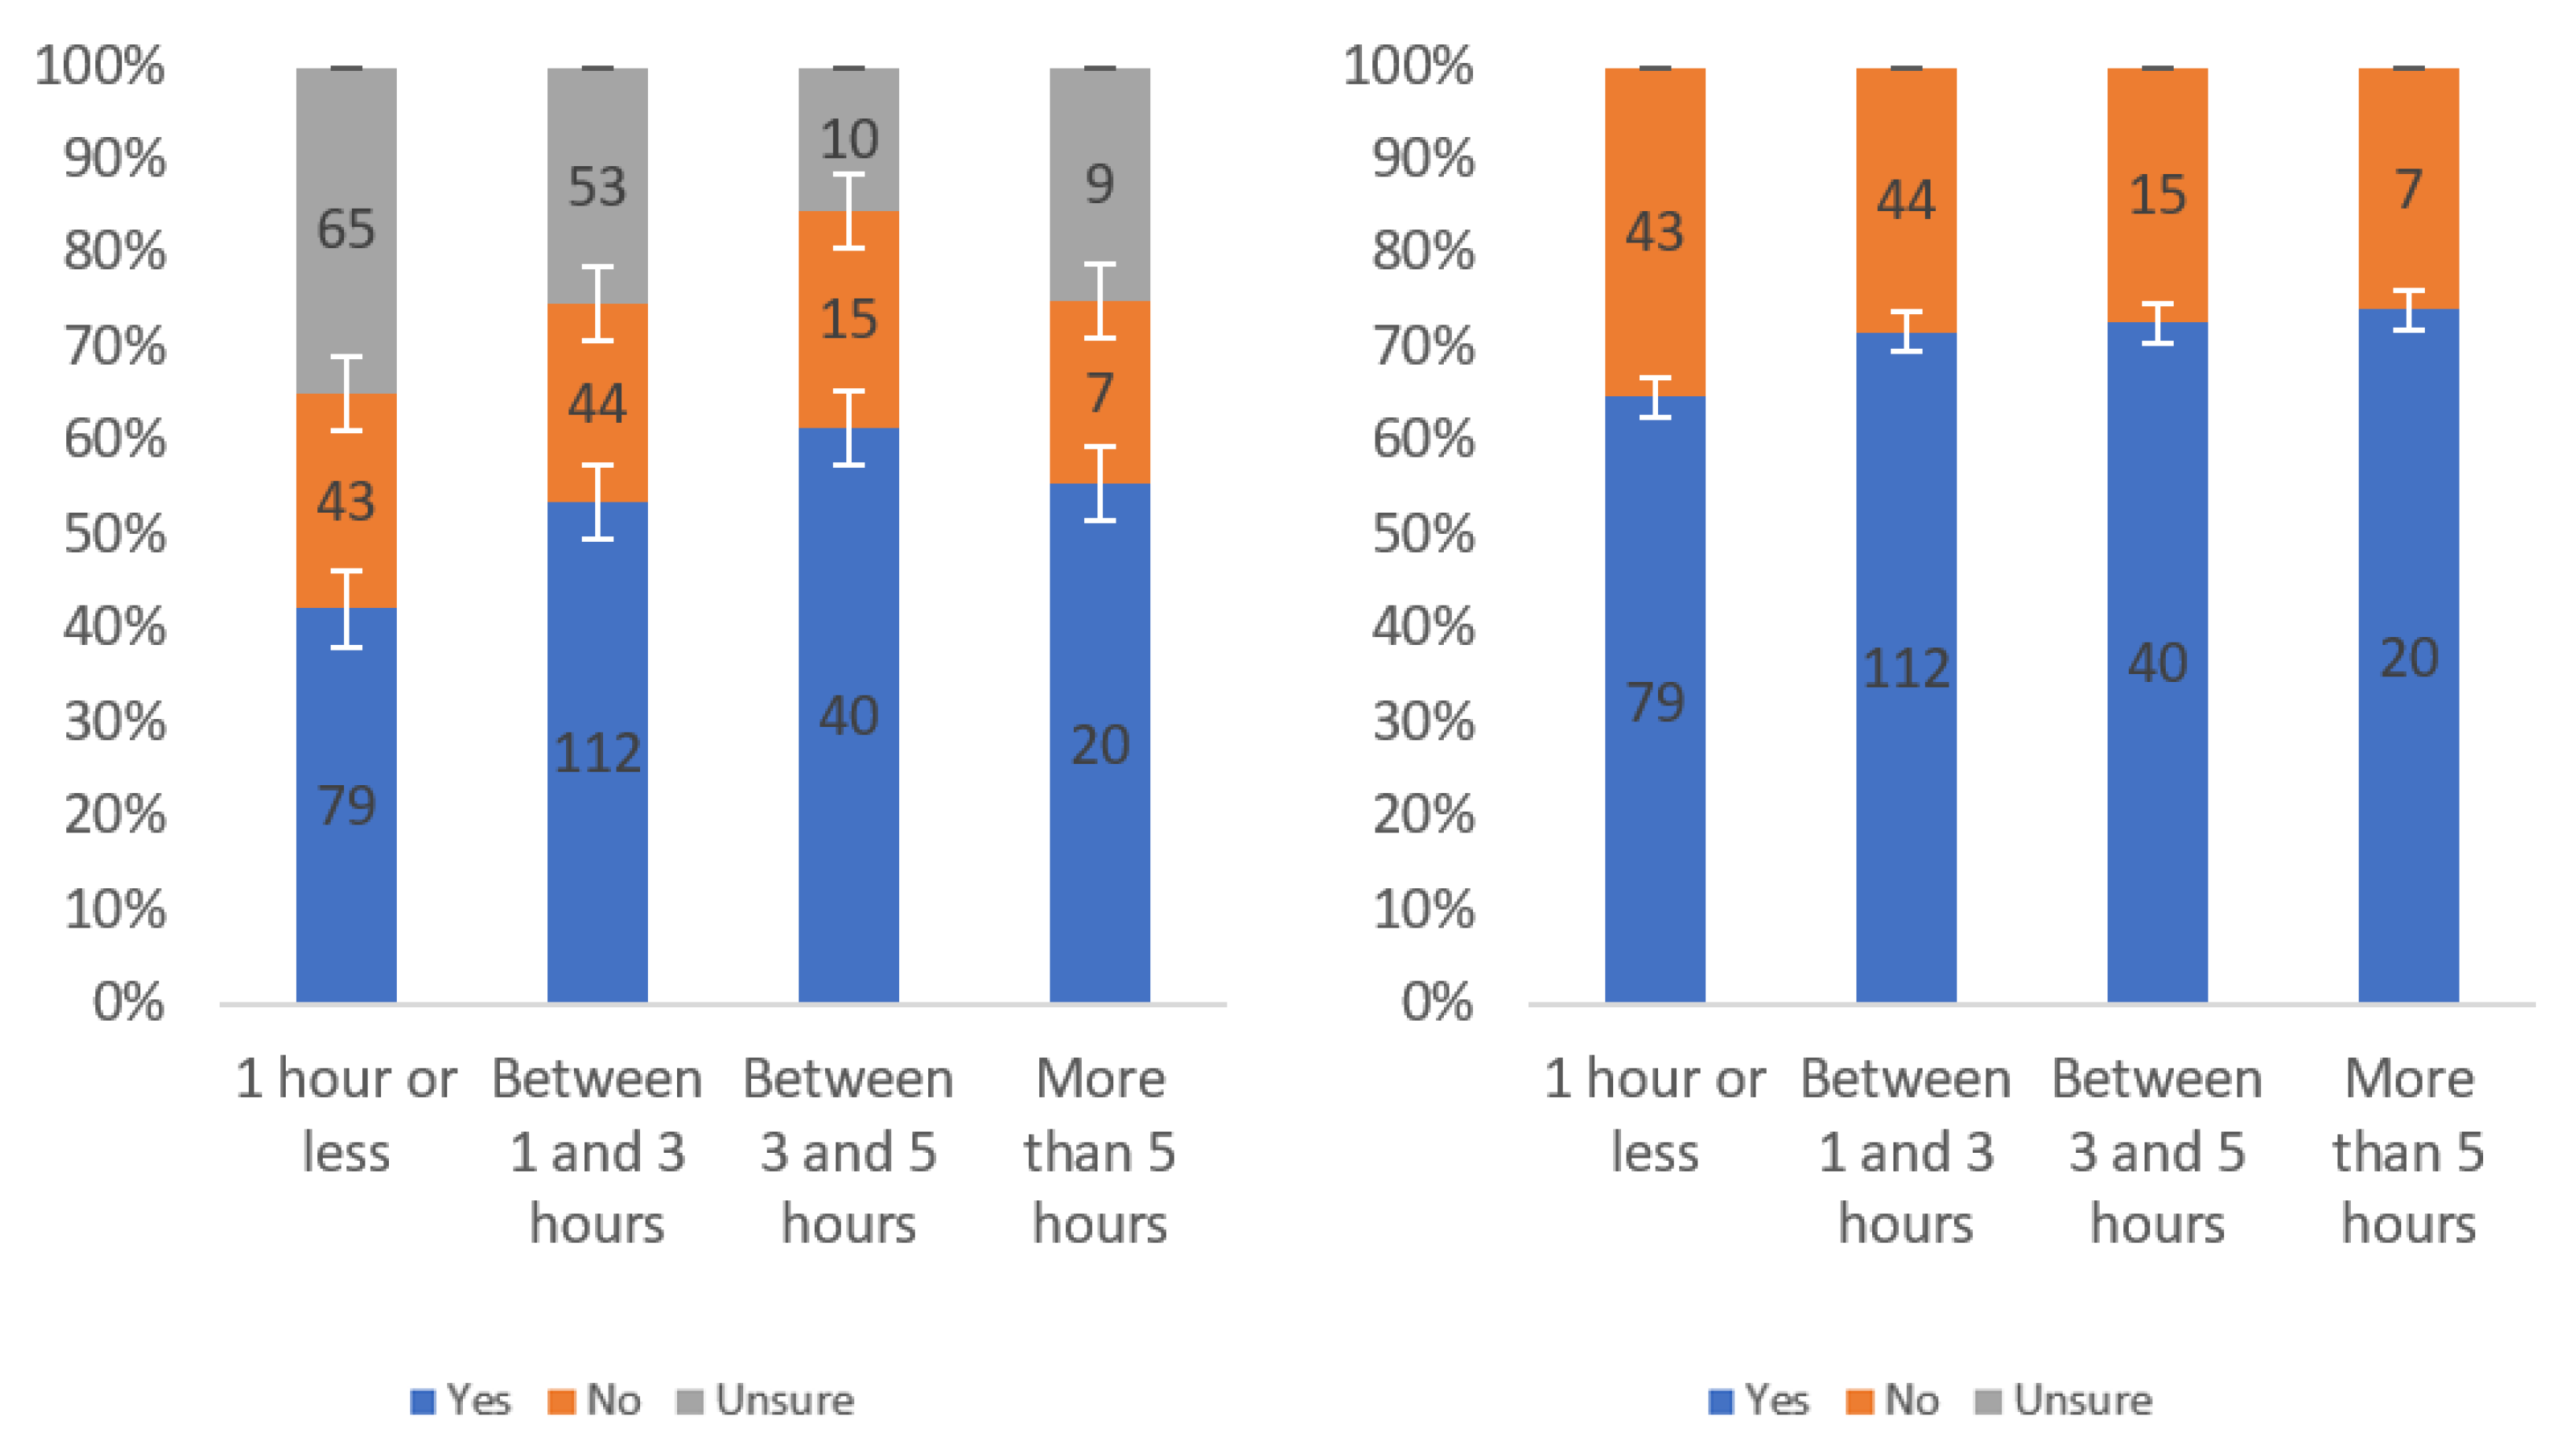
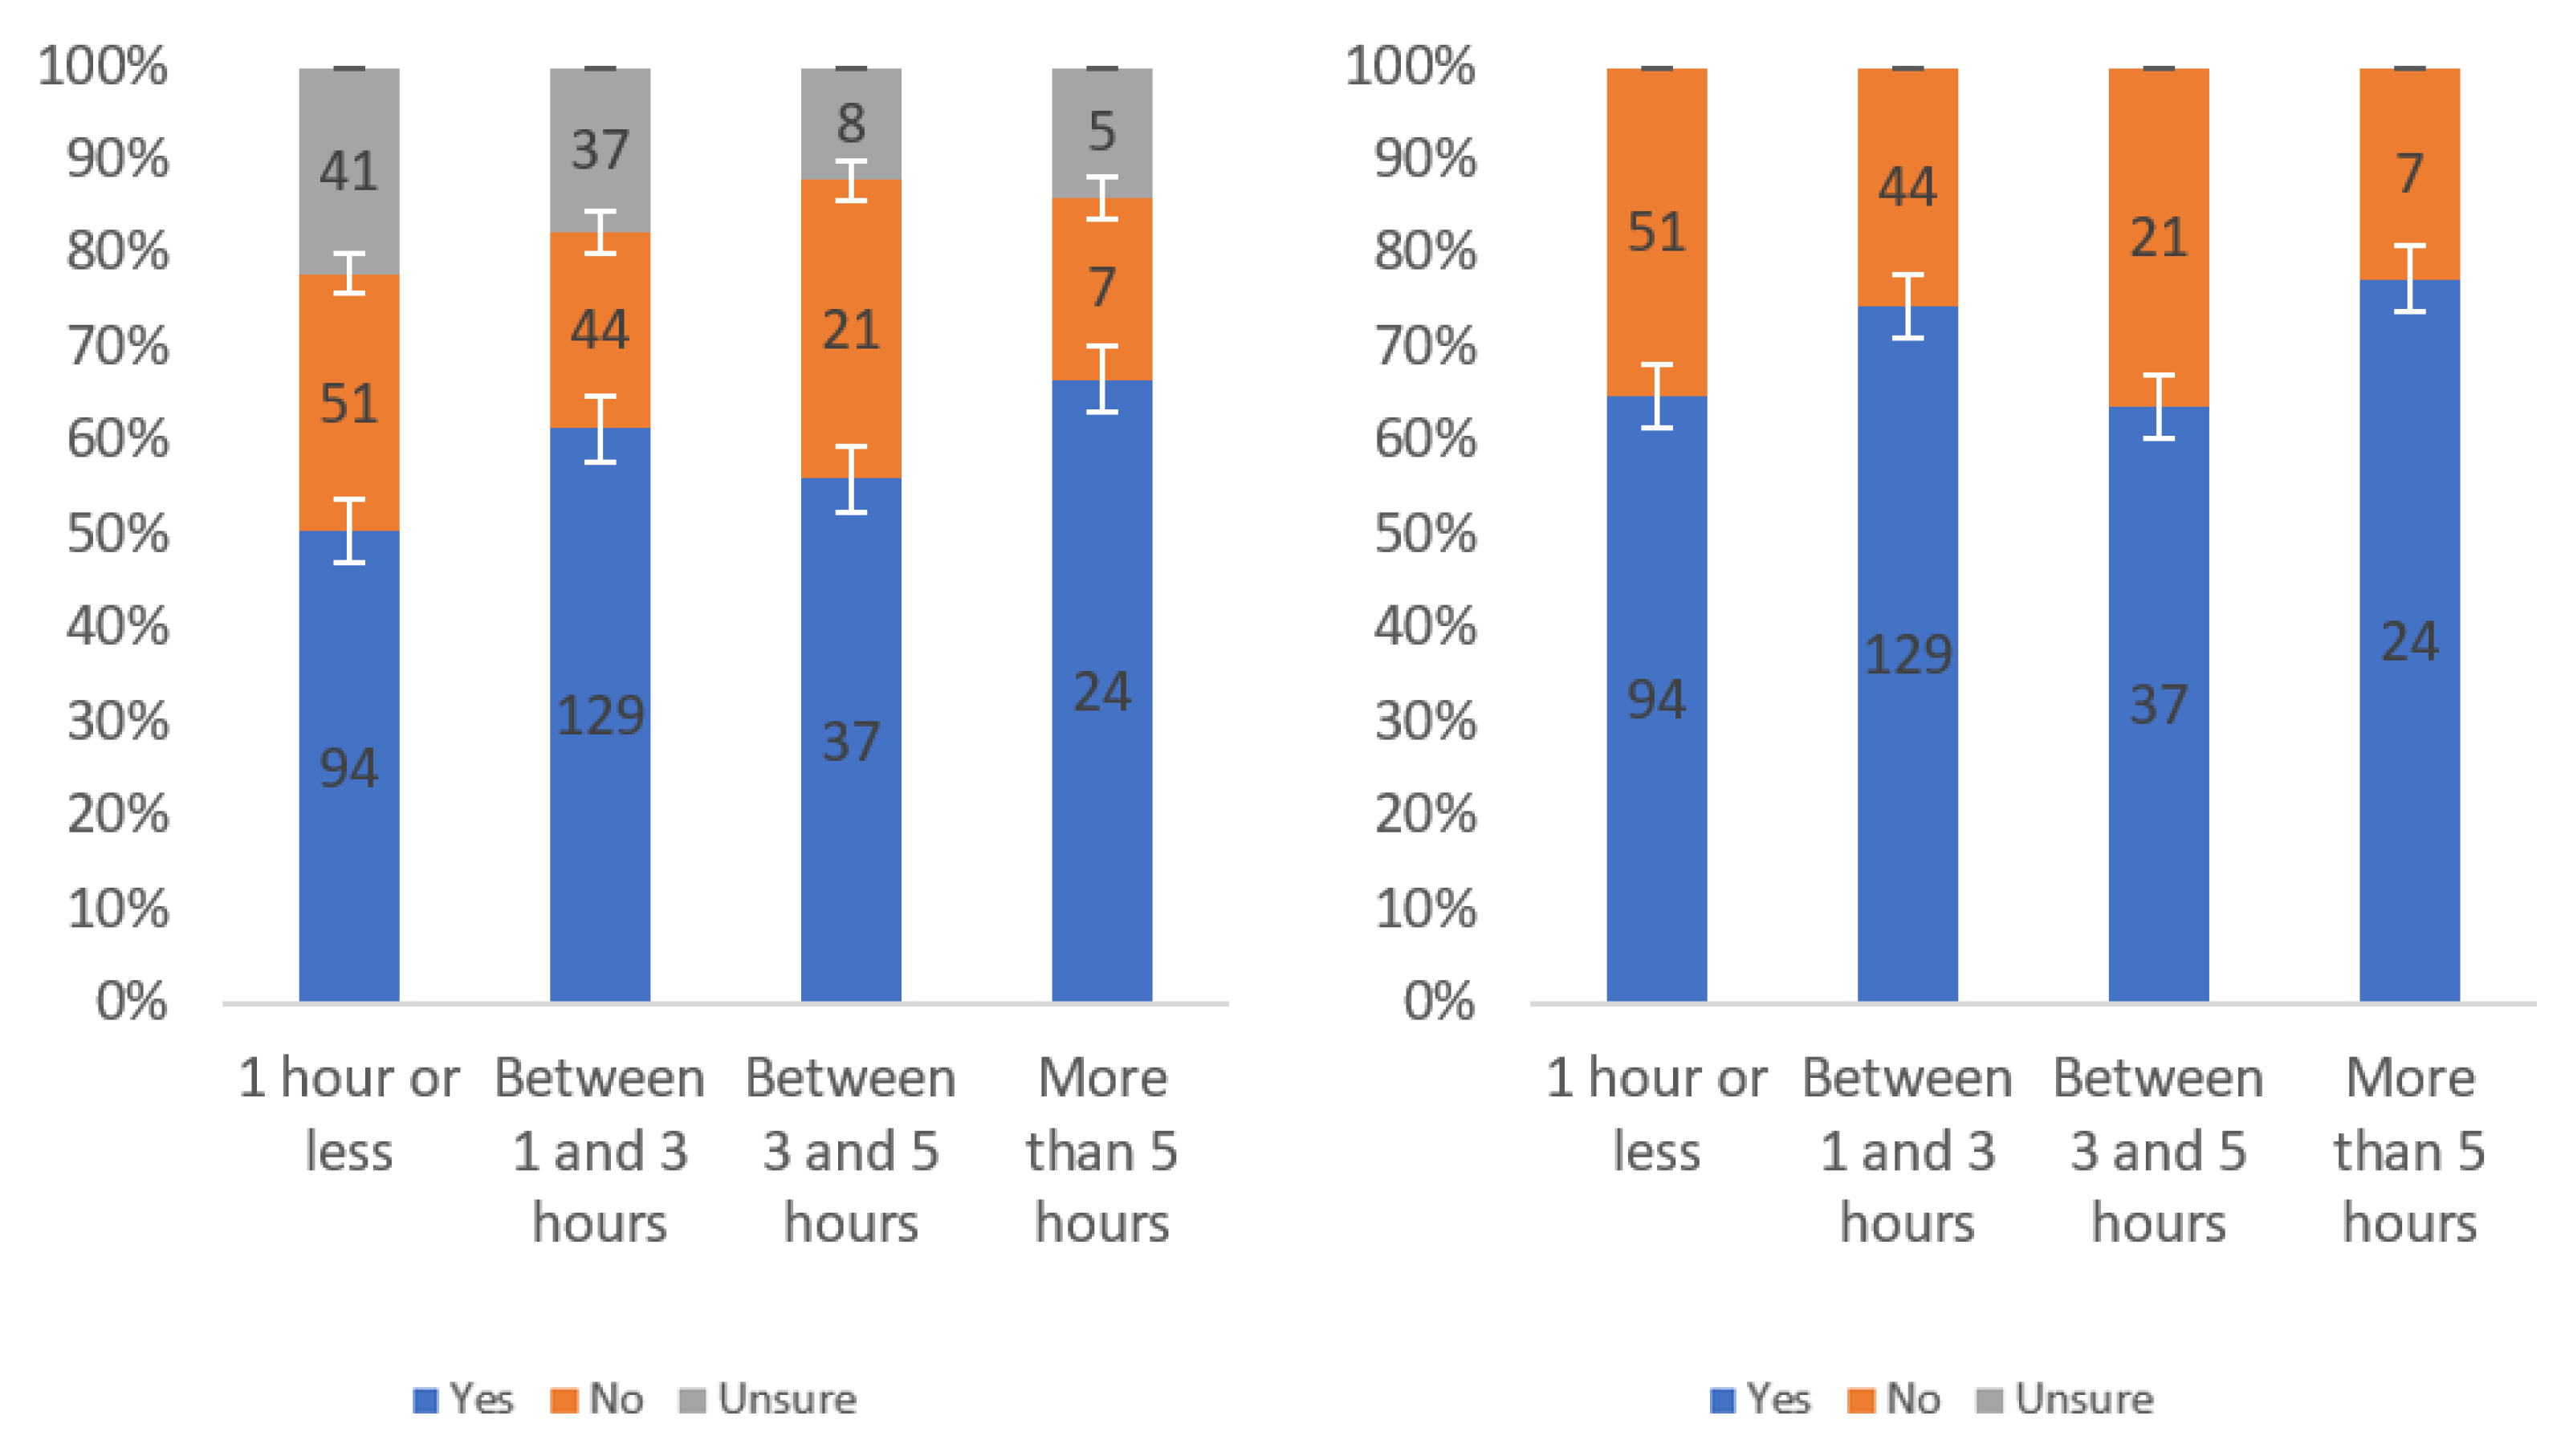
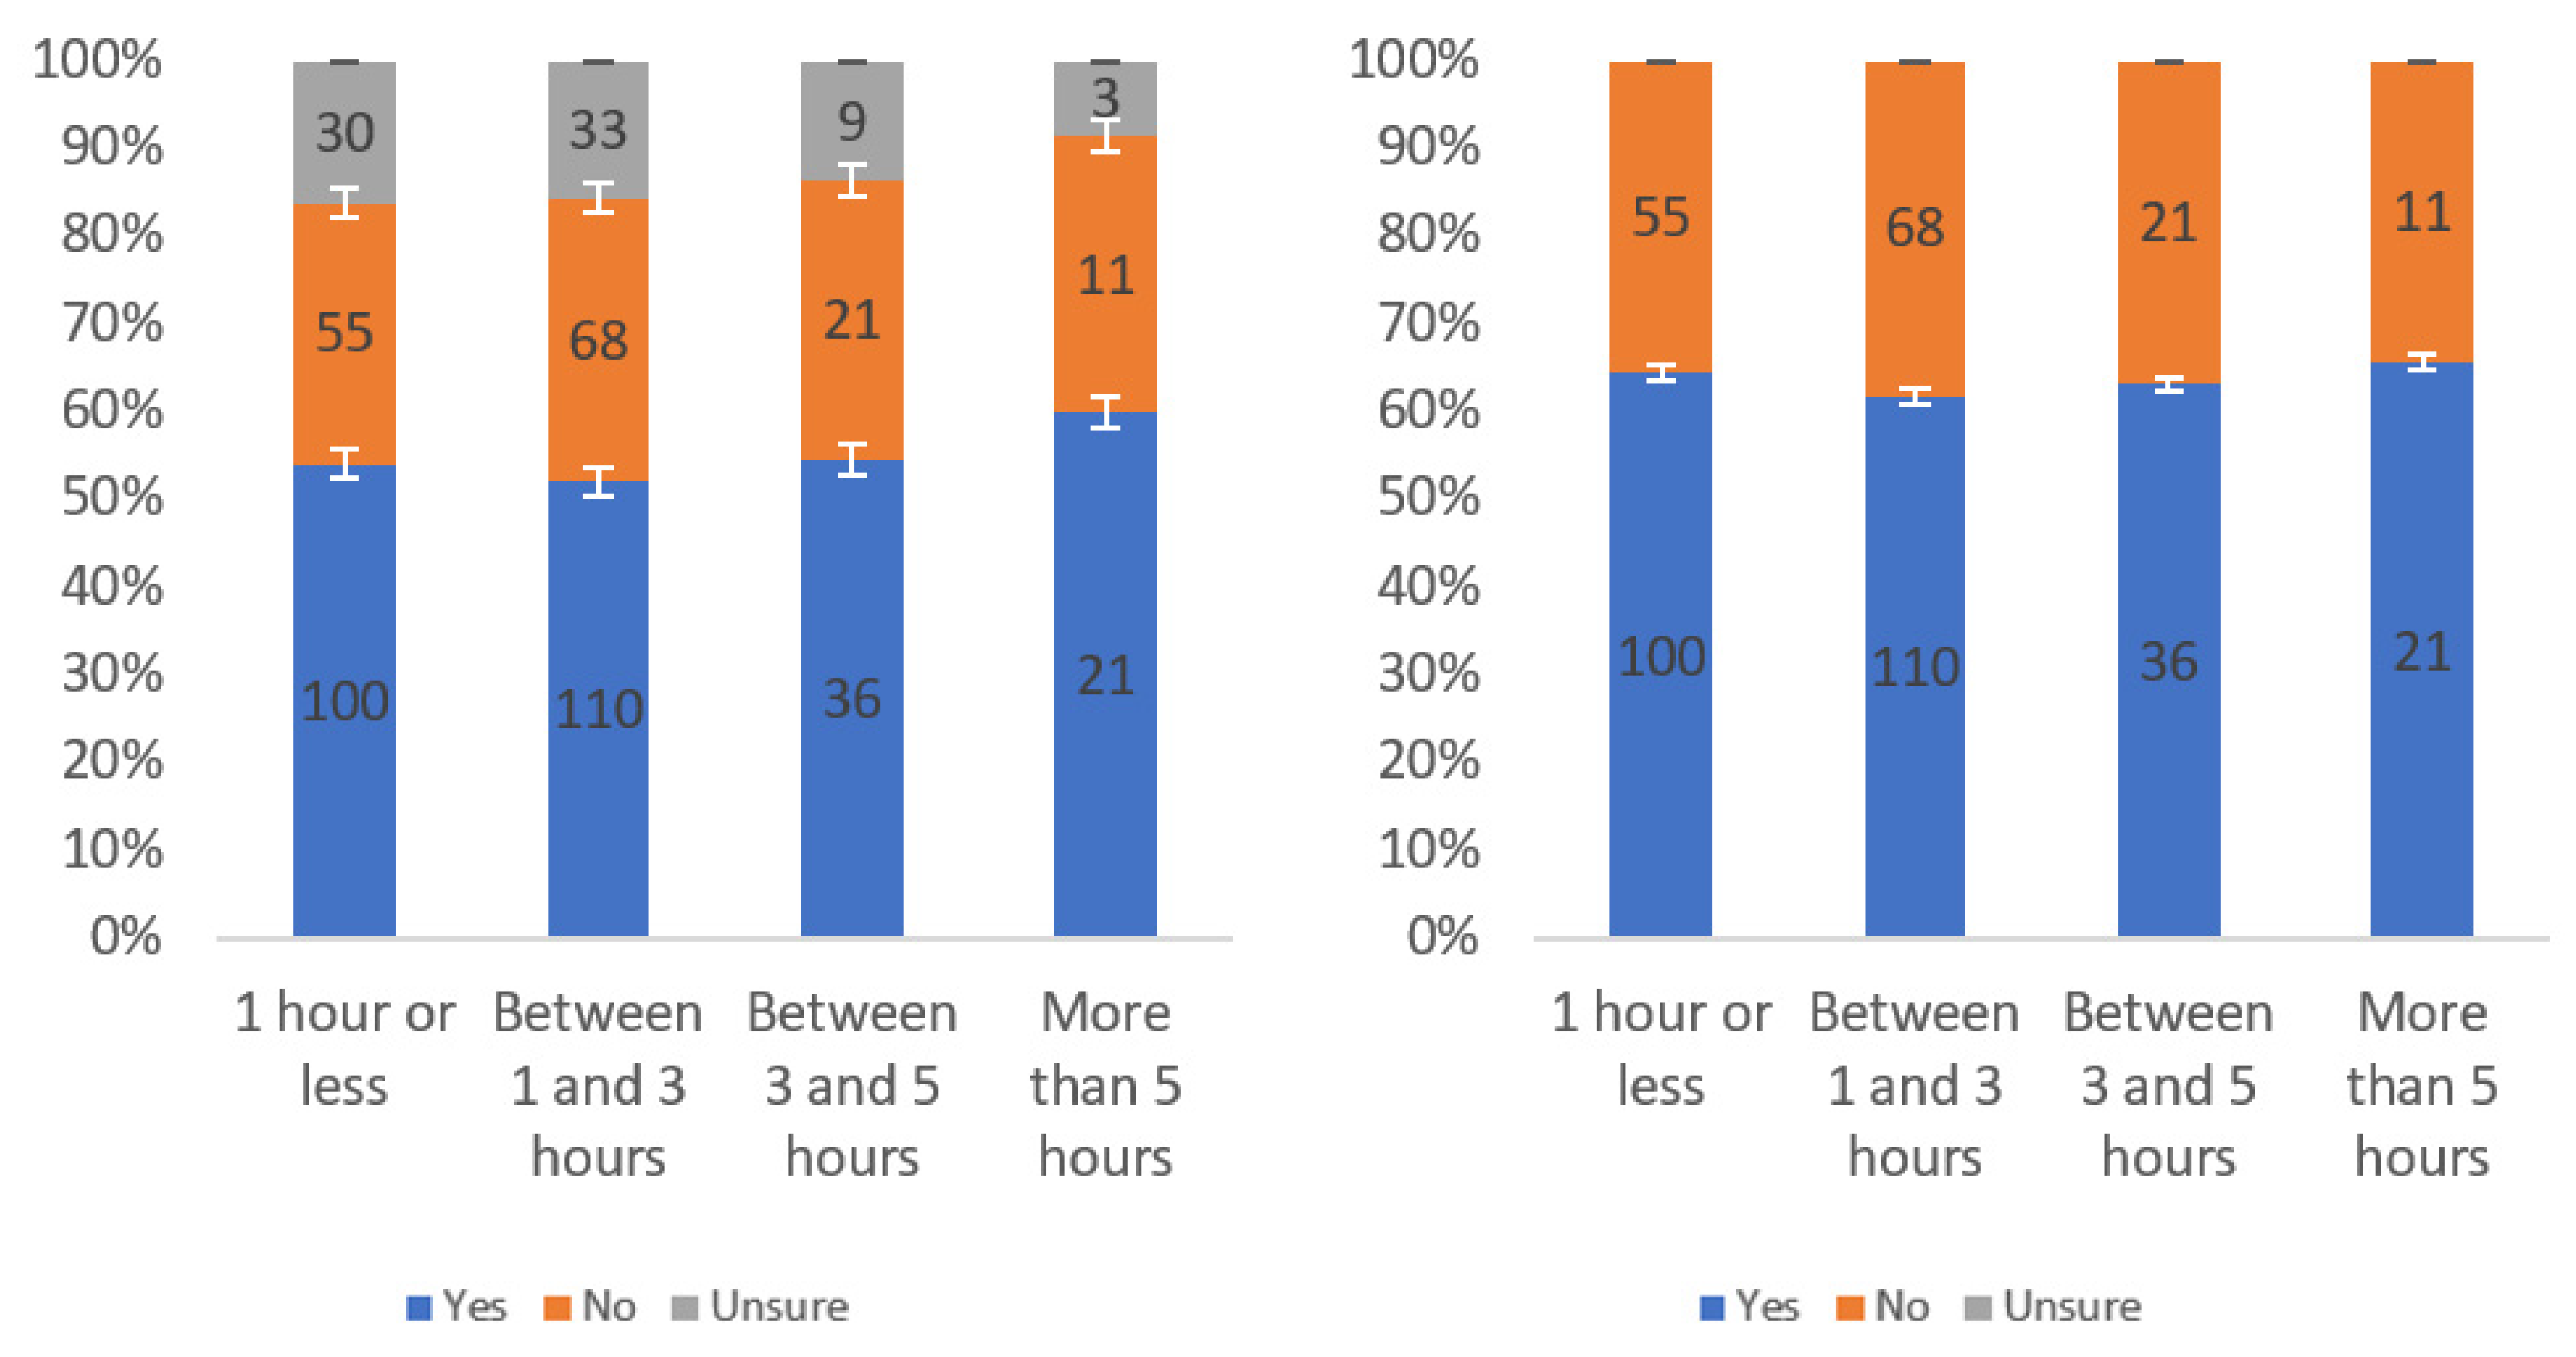
Responses regarding label helpfulness by internet usage level including (left) and excluding (right) unsure responses.
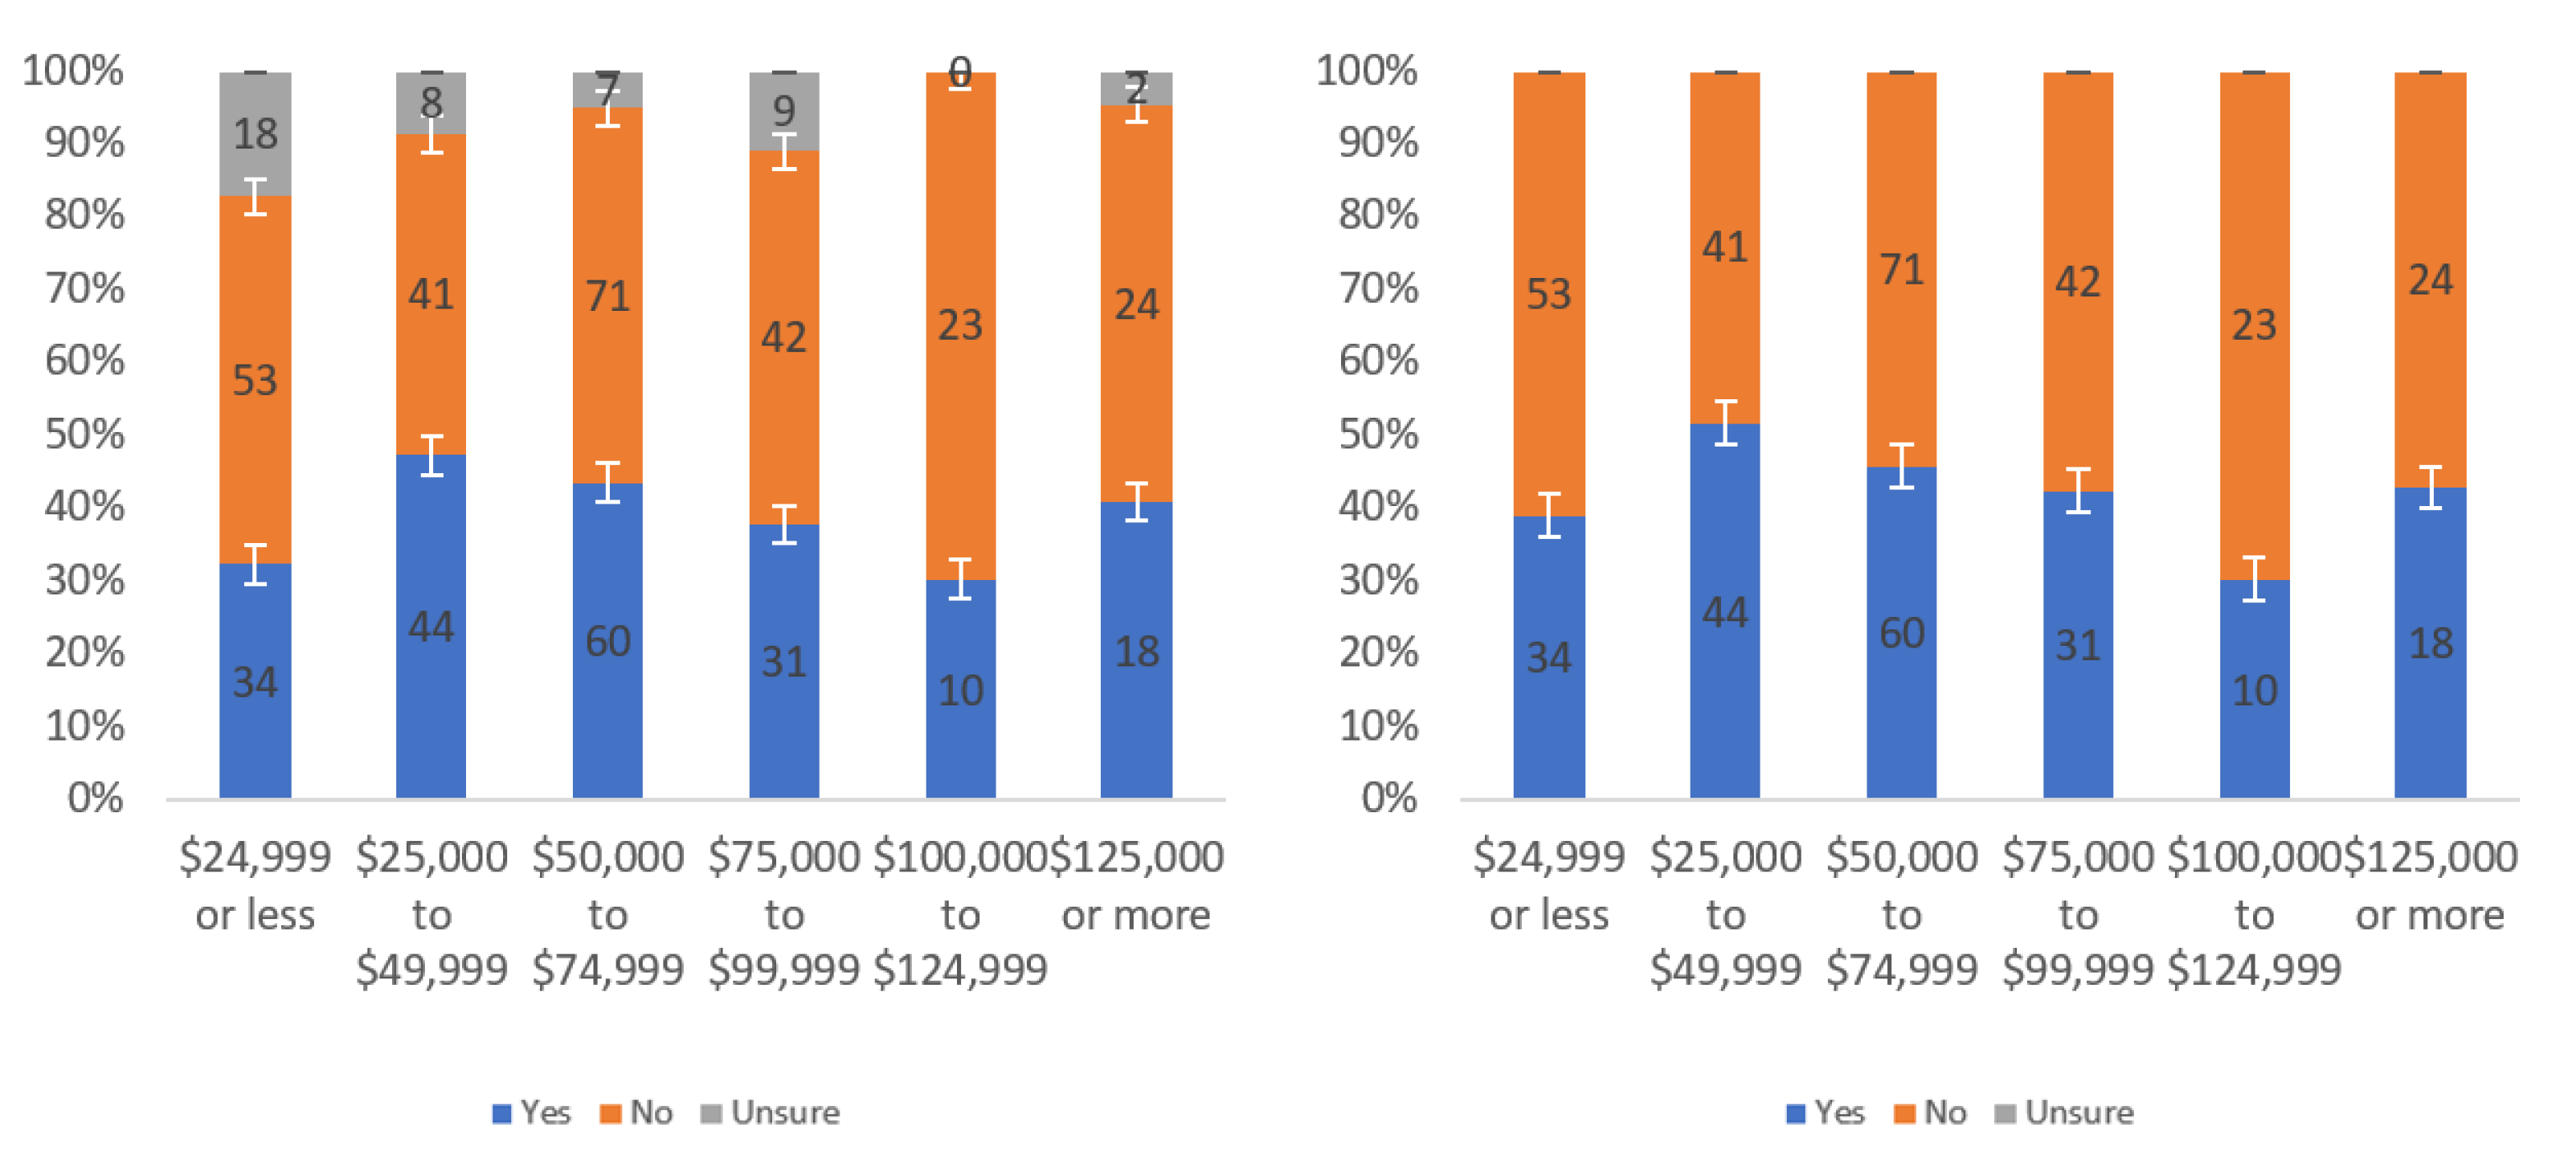
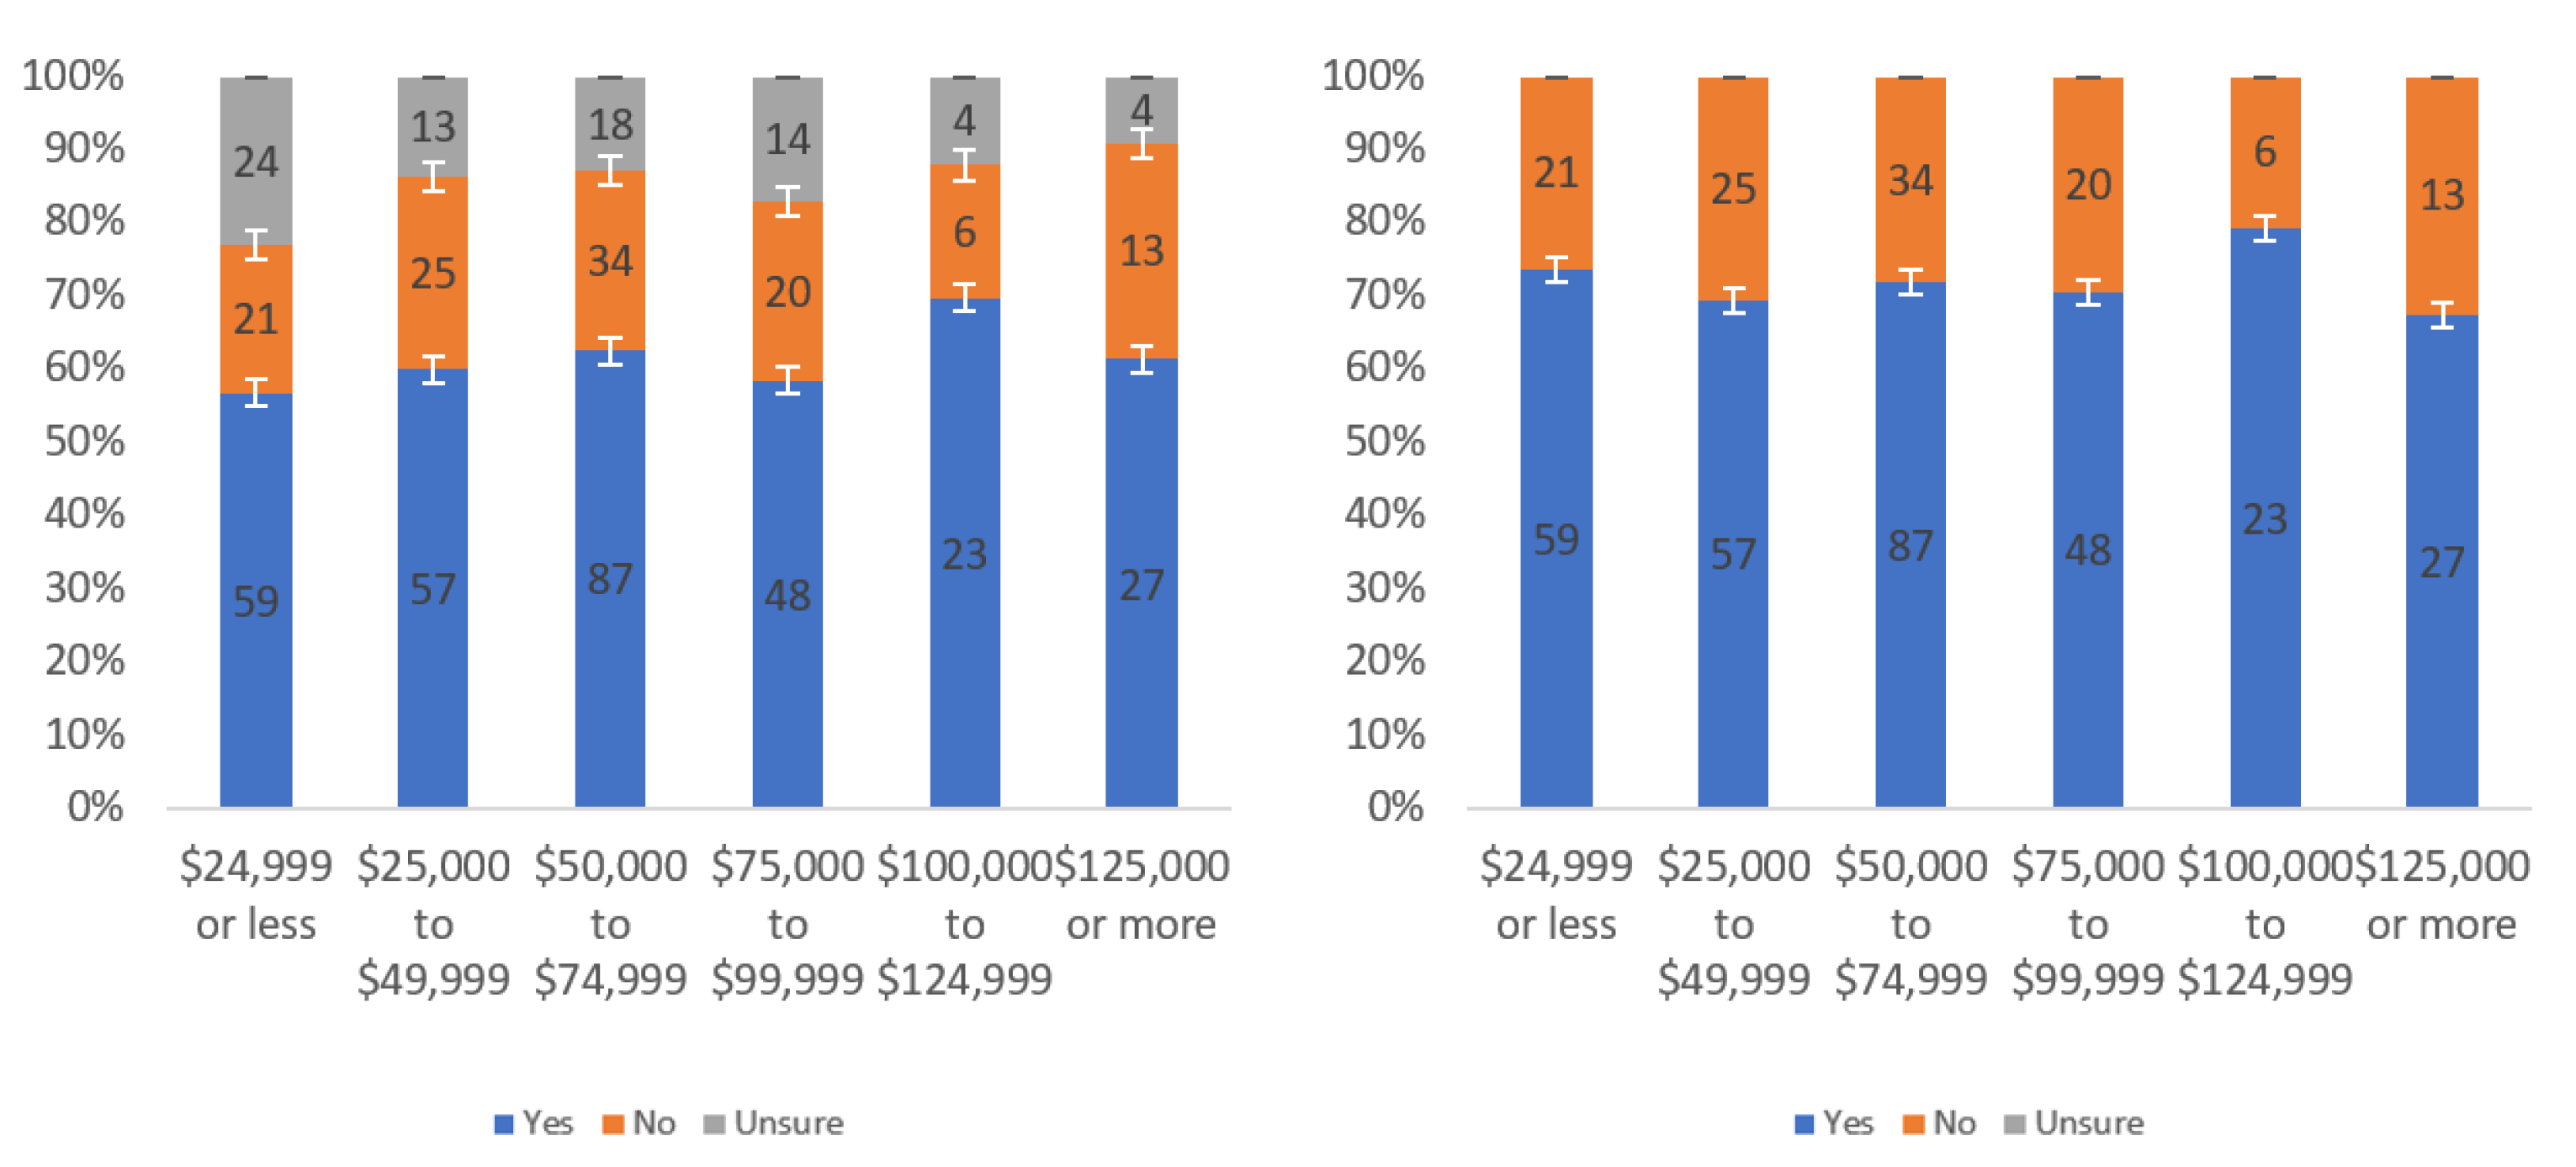
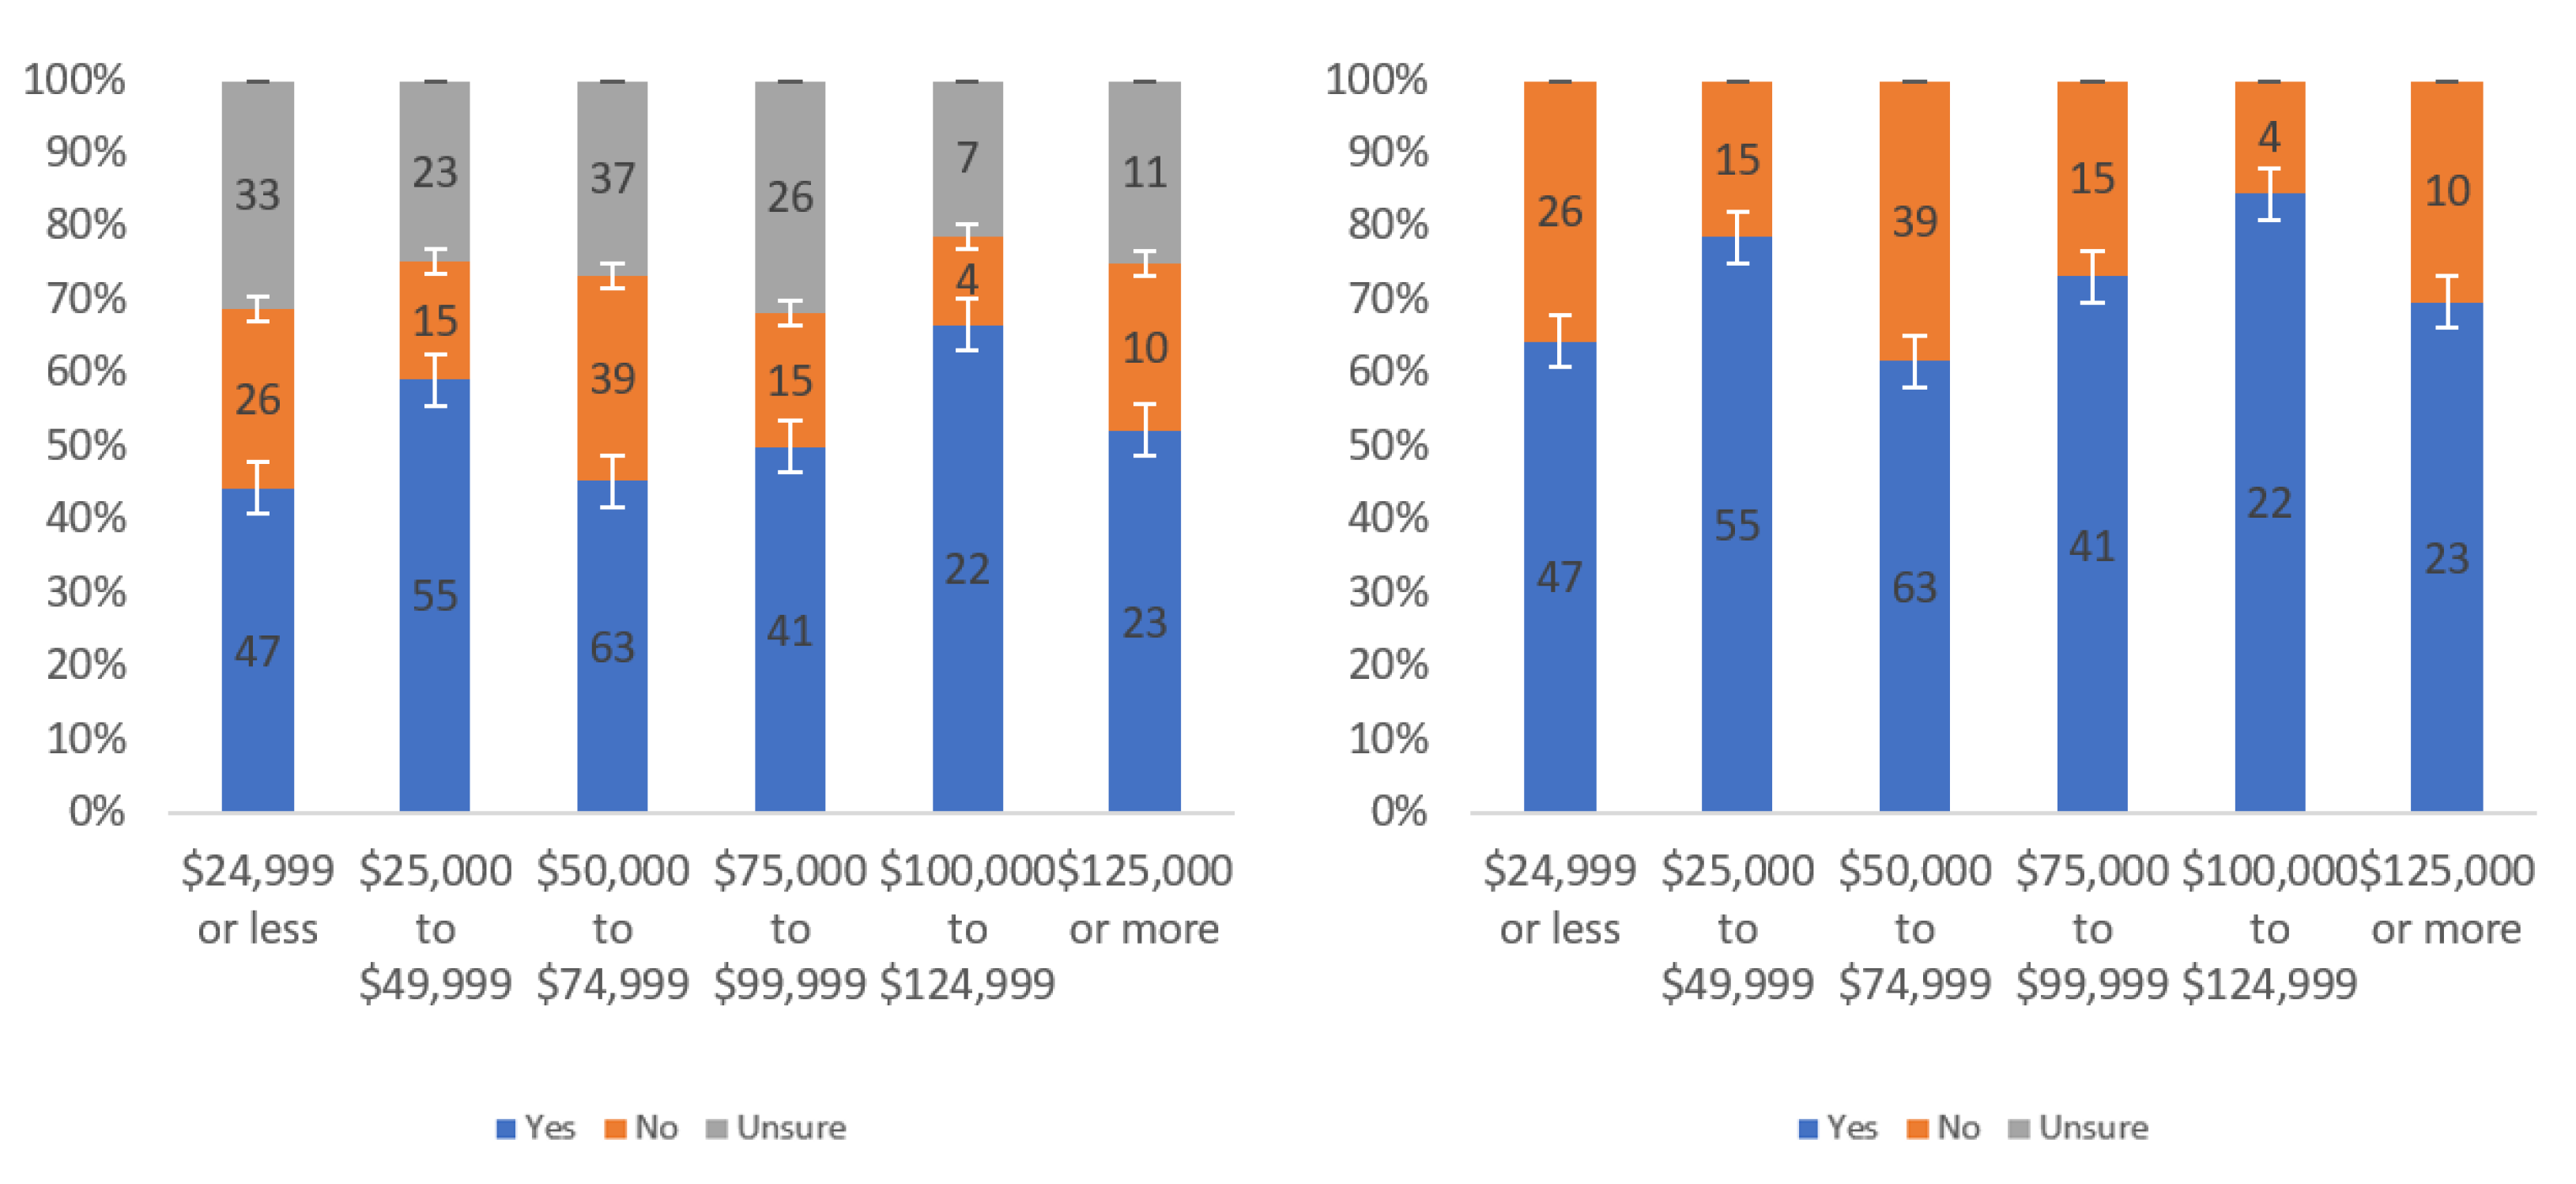
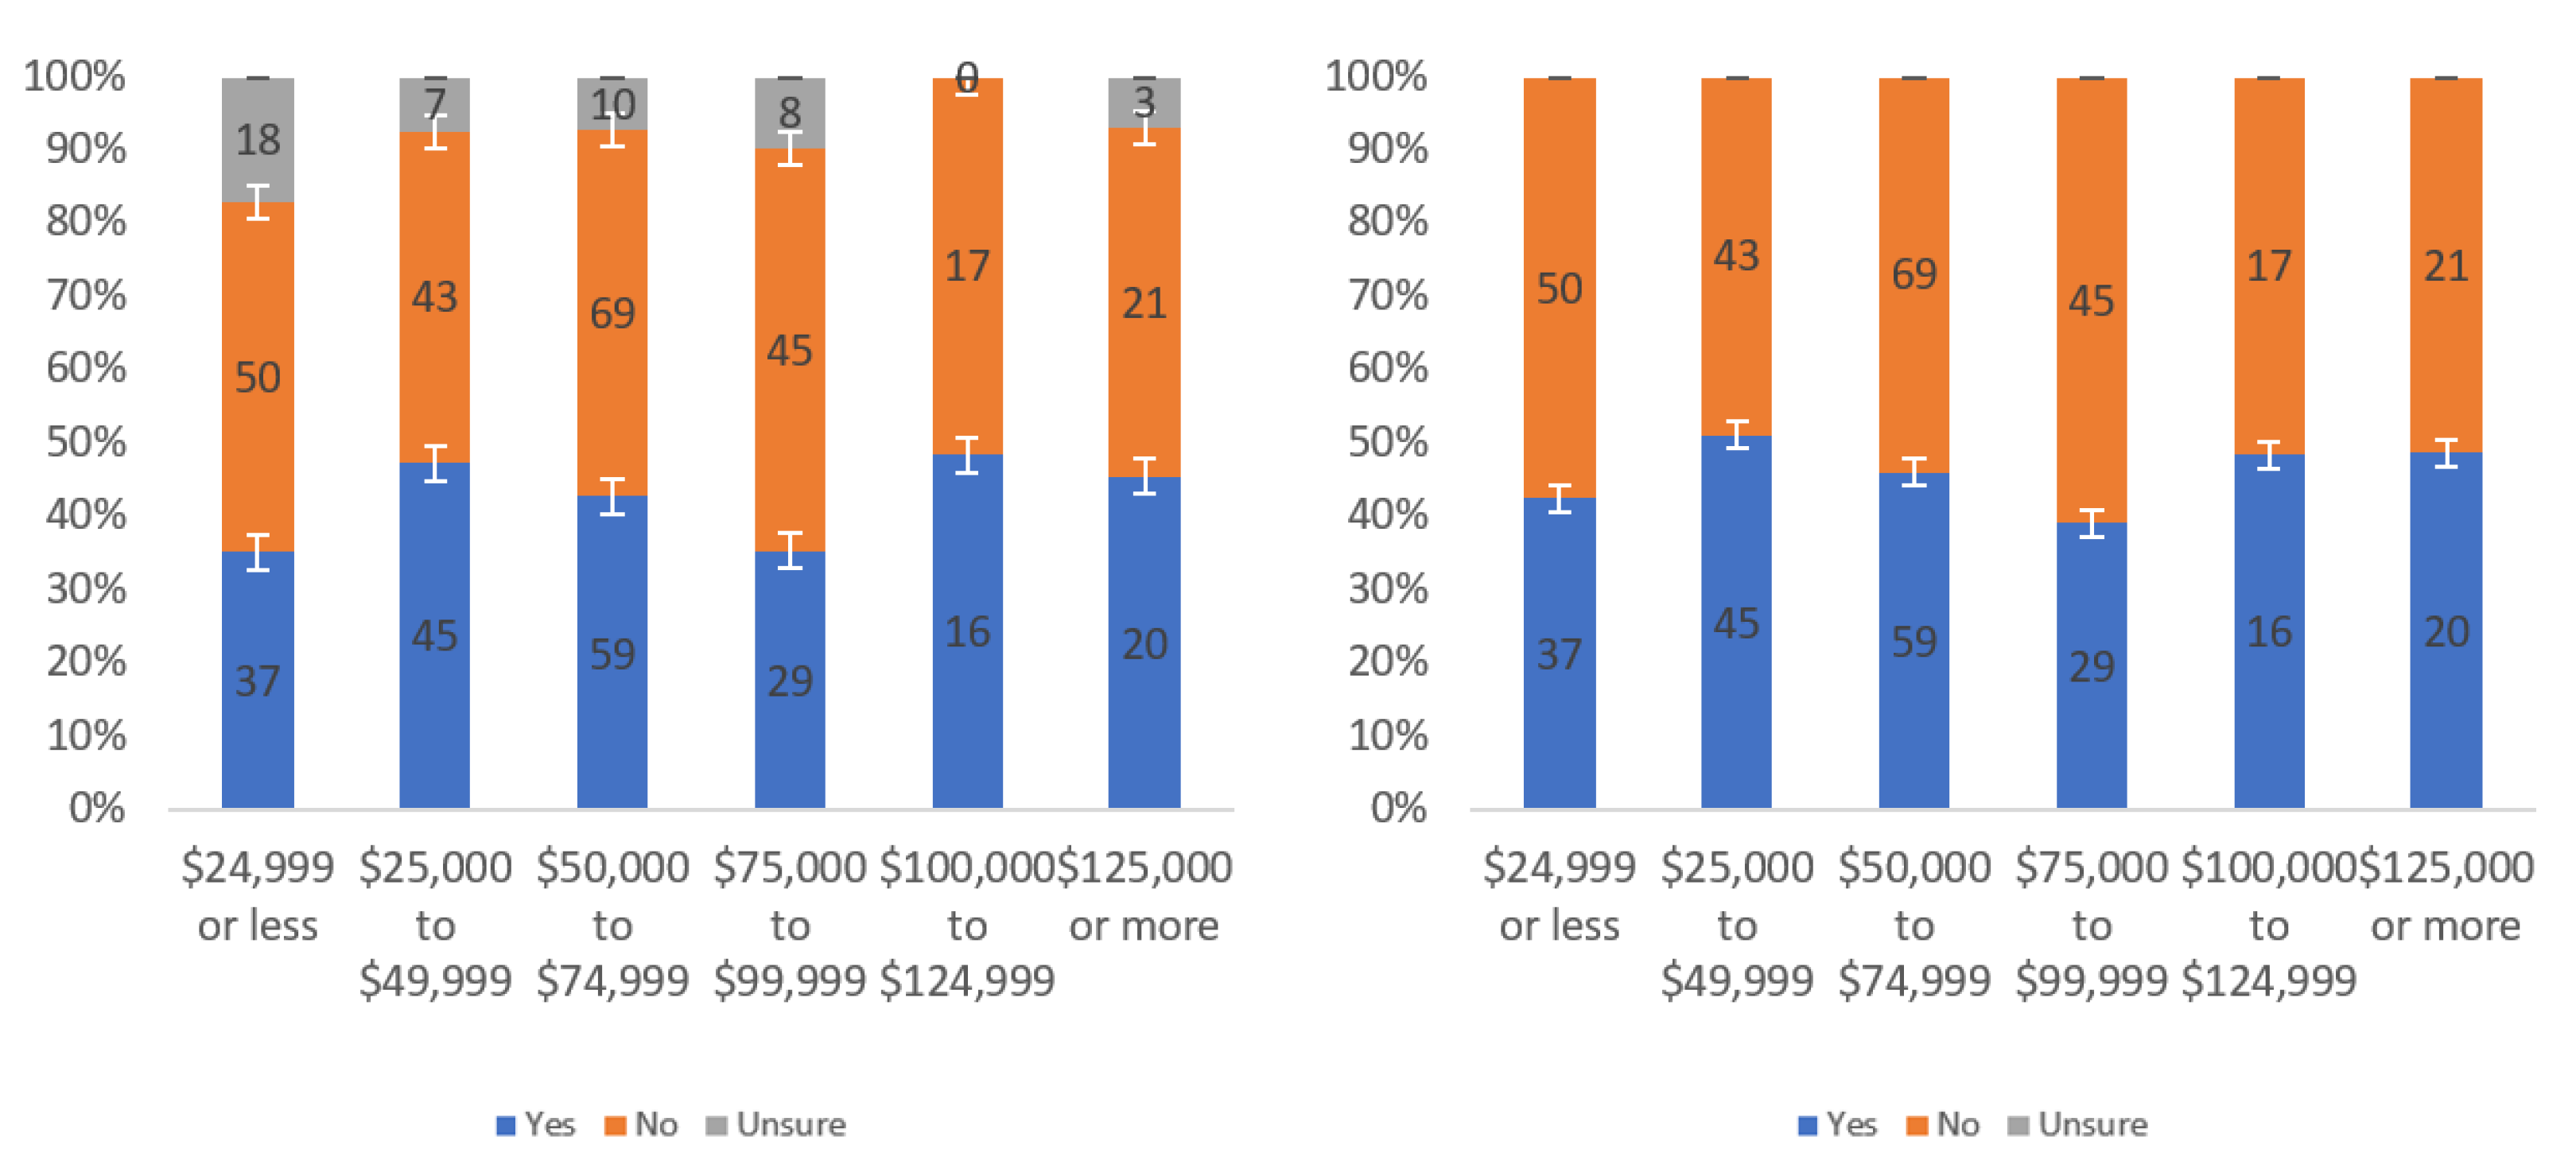
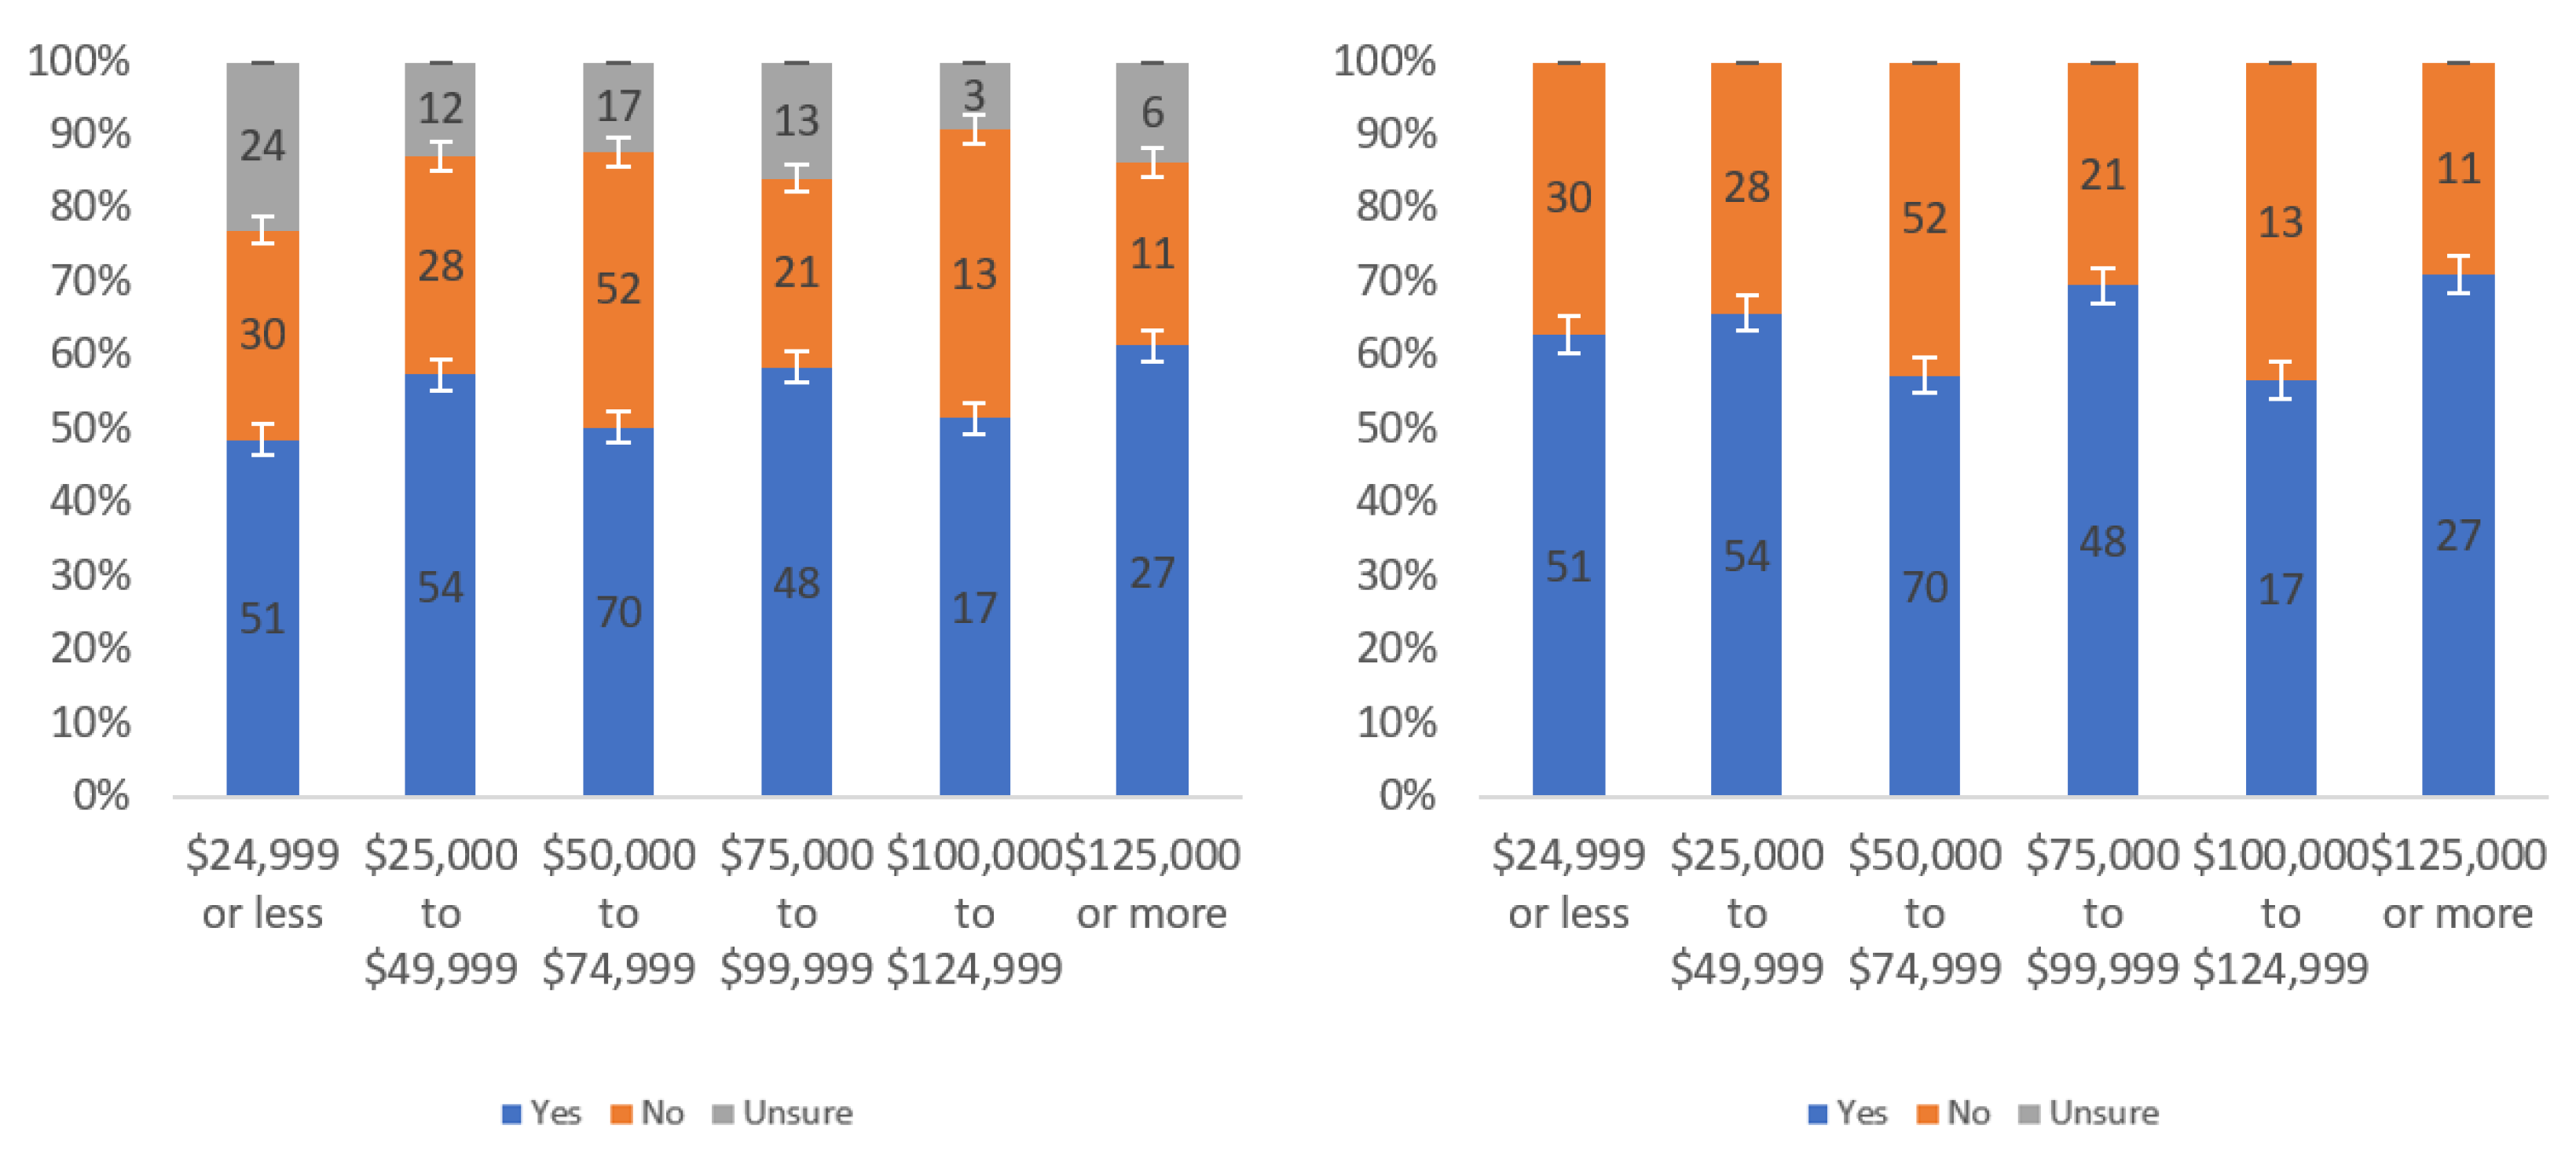
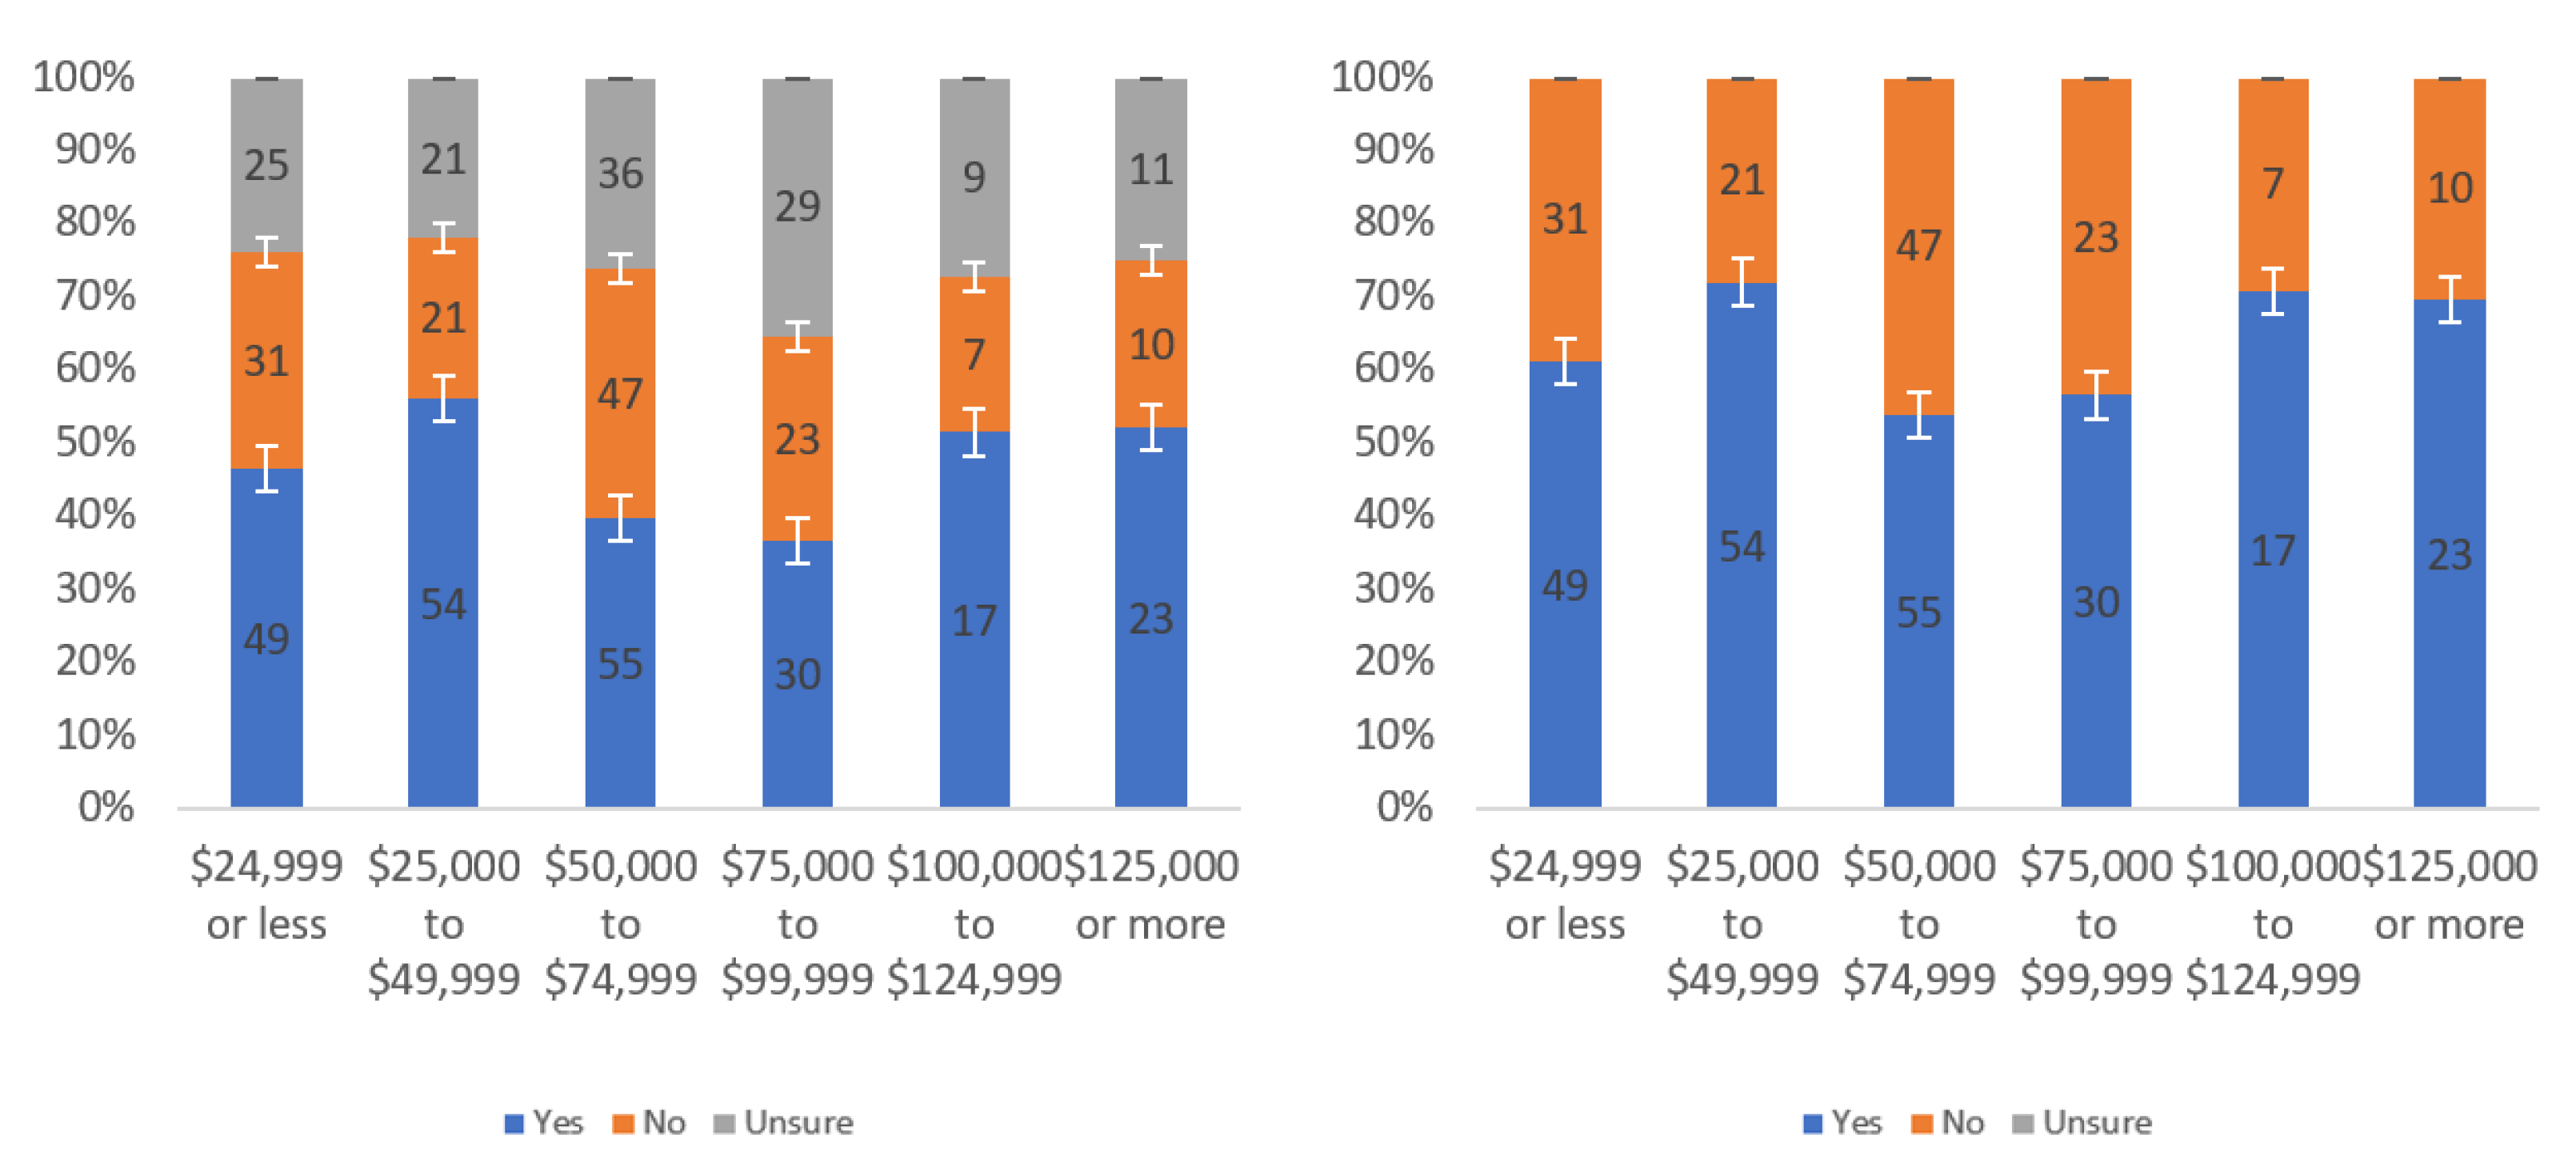
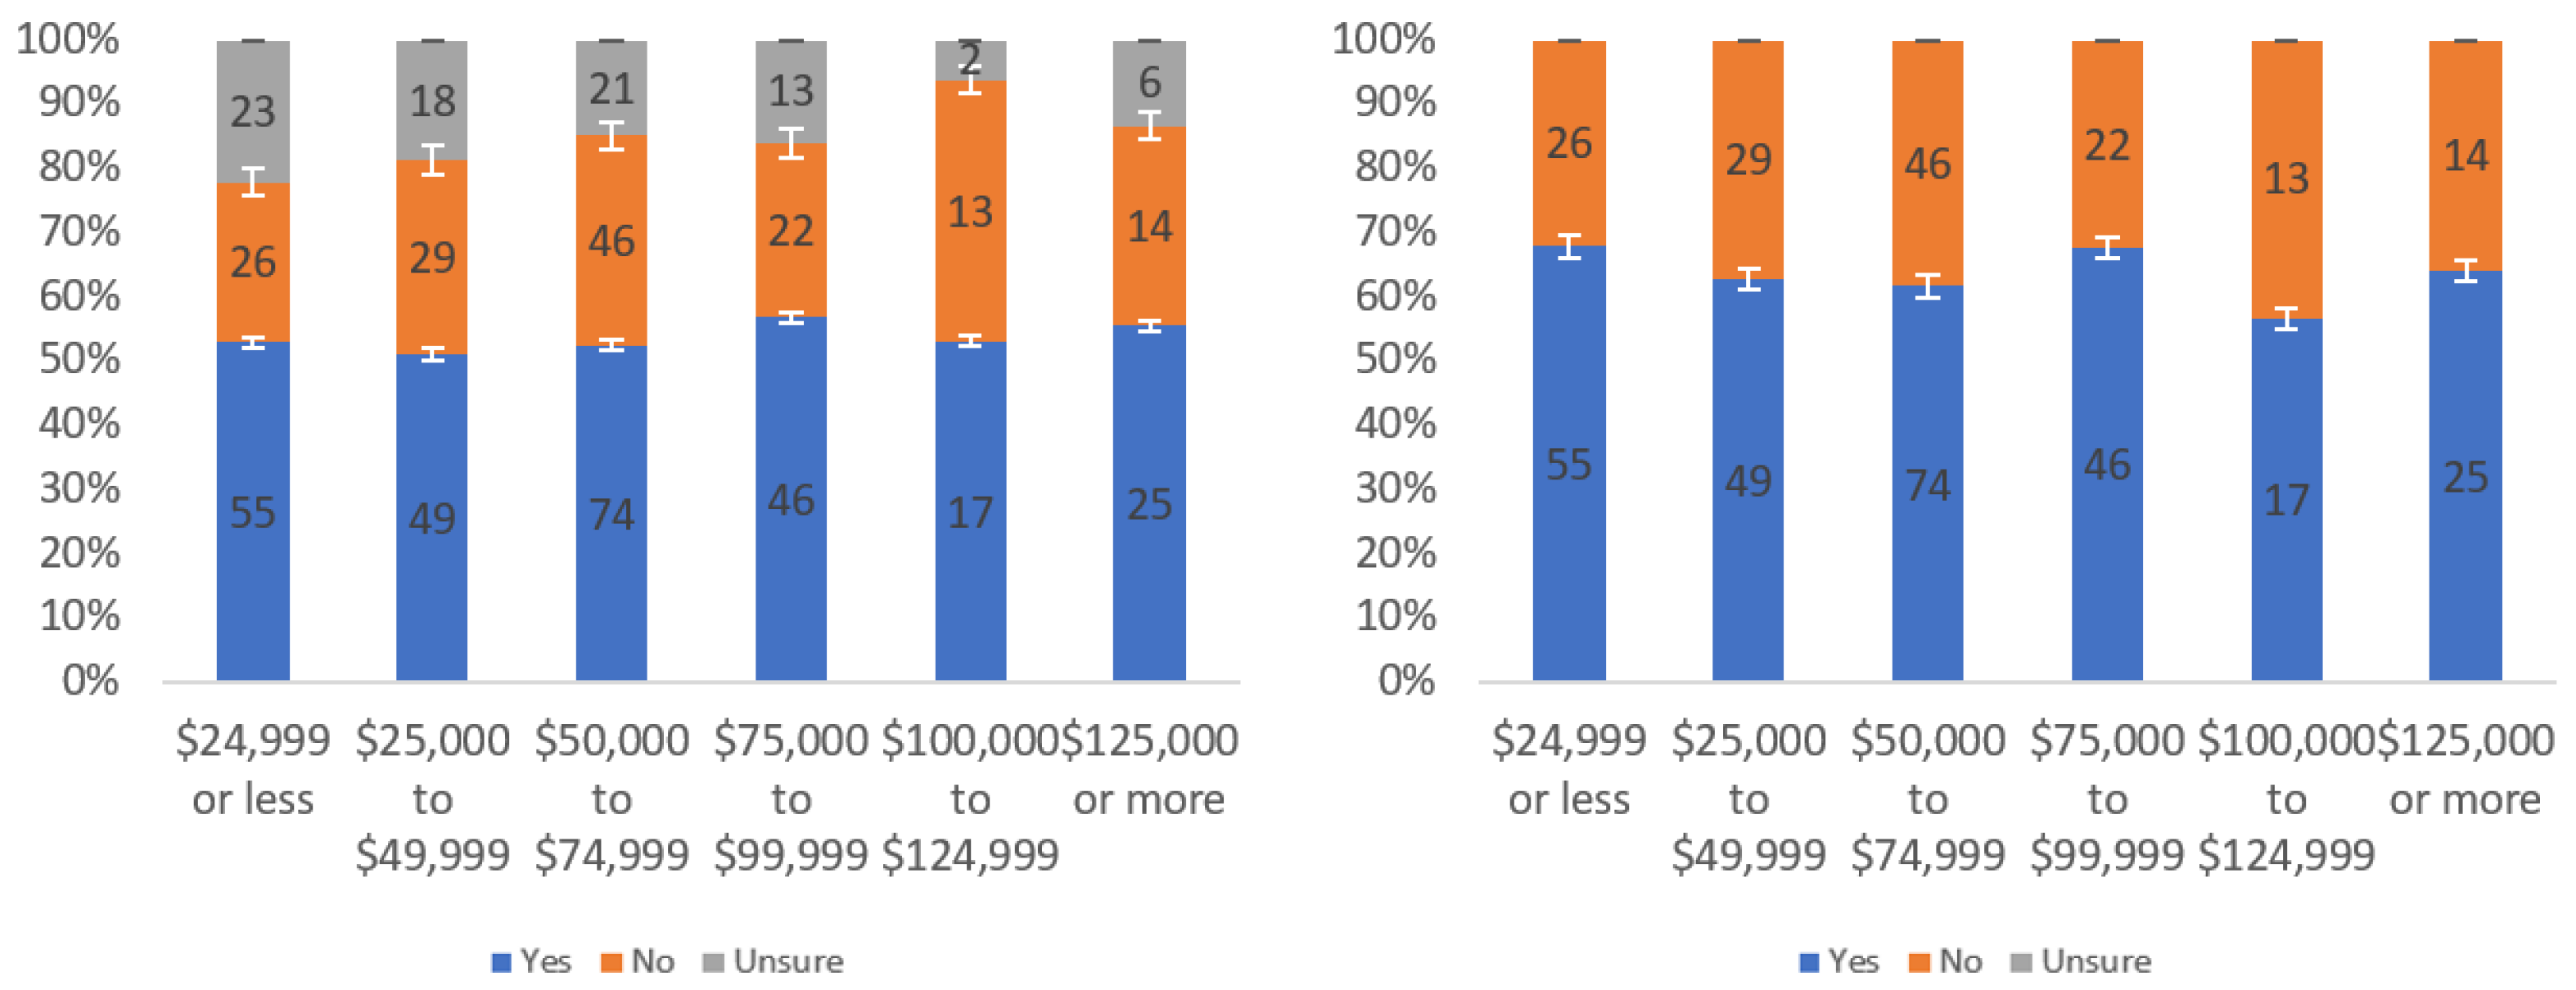
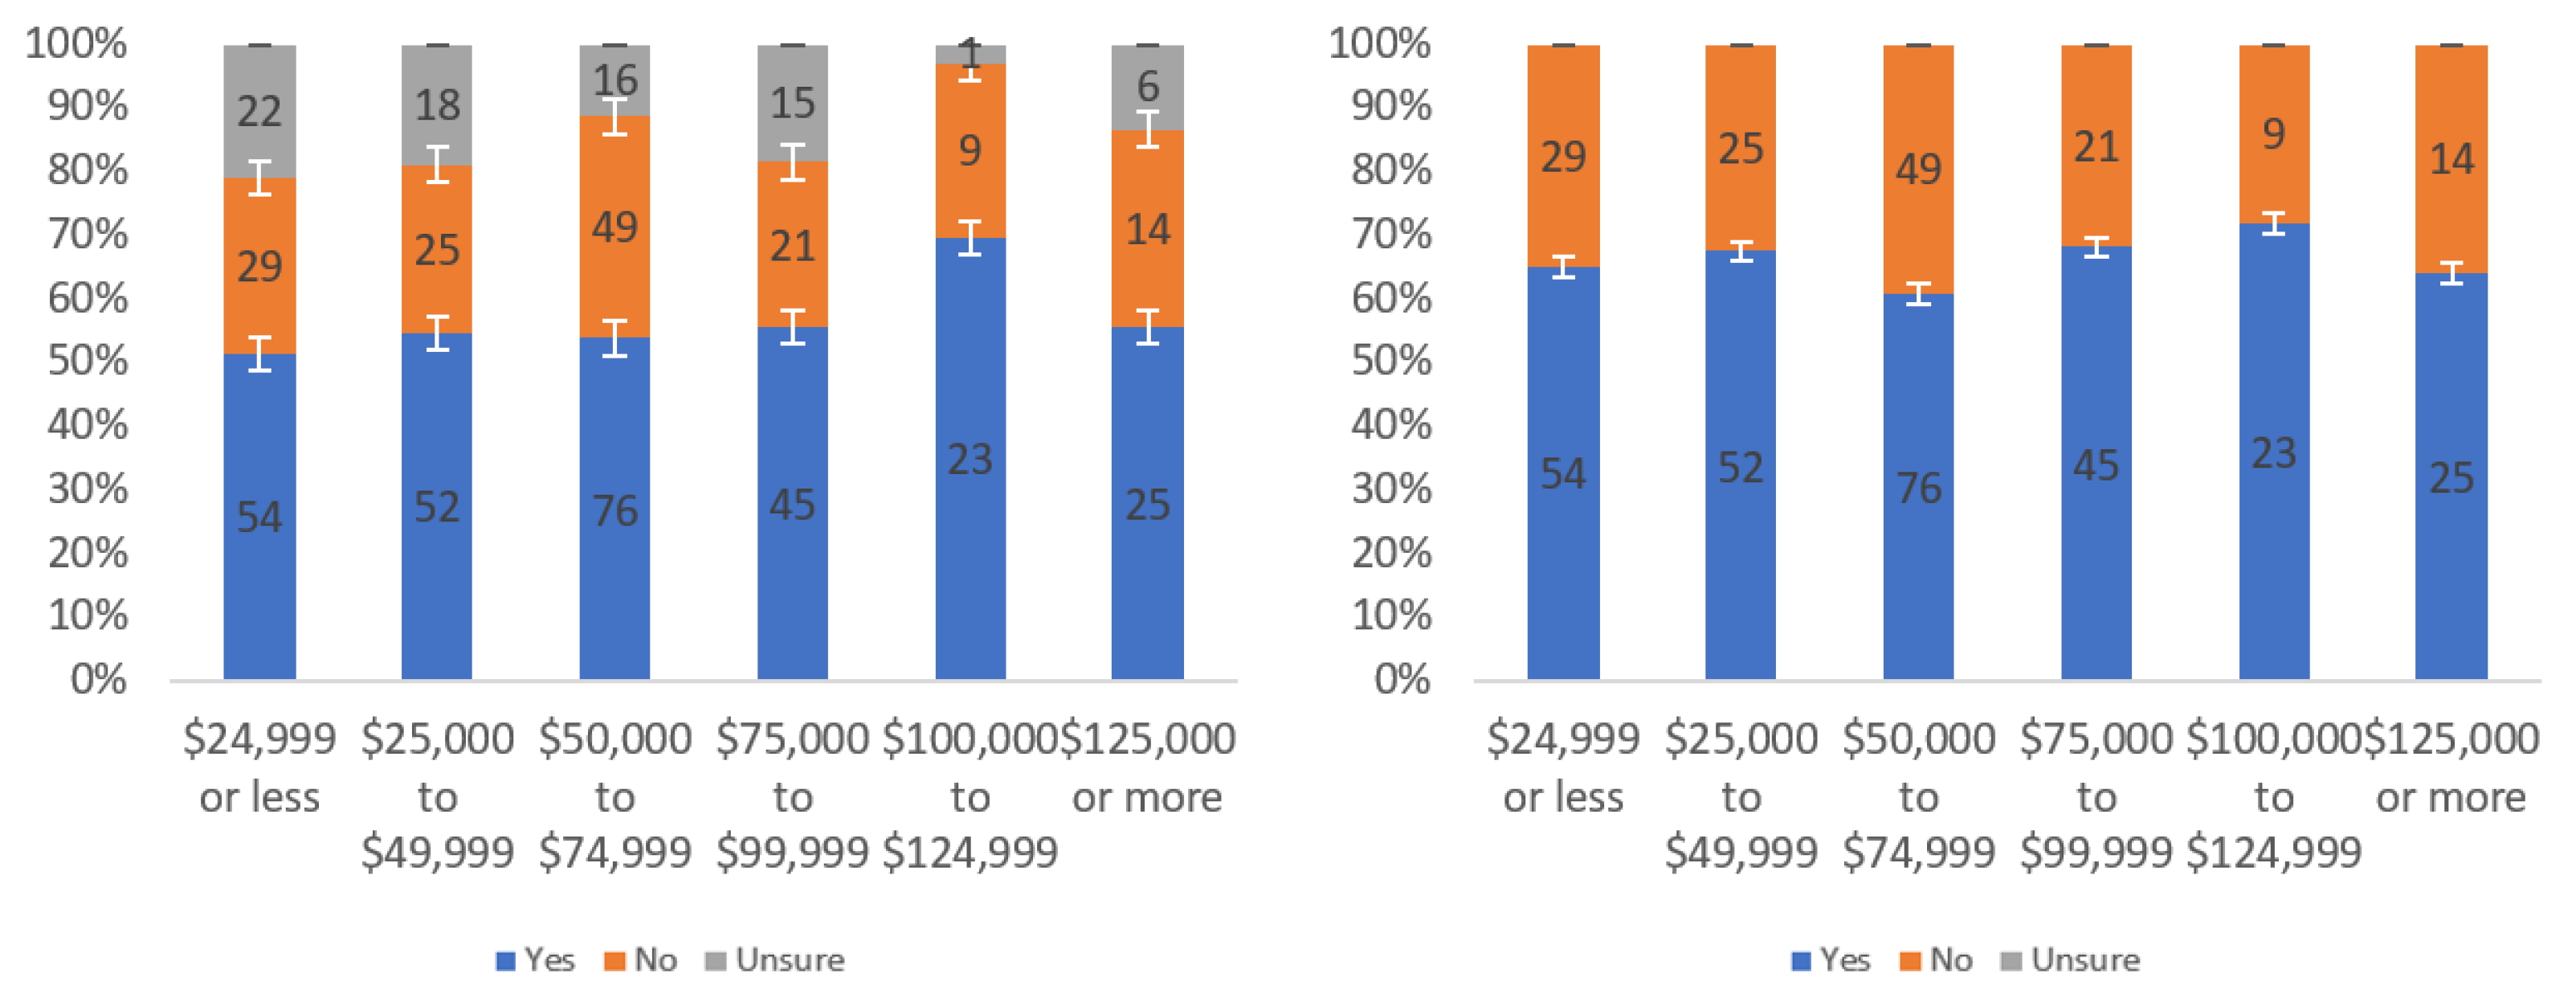
Figure 10.
Responses regarding label annoyingness by income level including (left) and excluding (right) unsure responses.
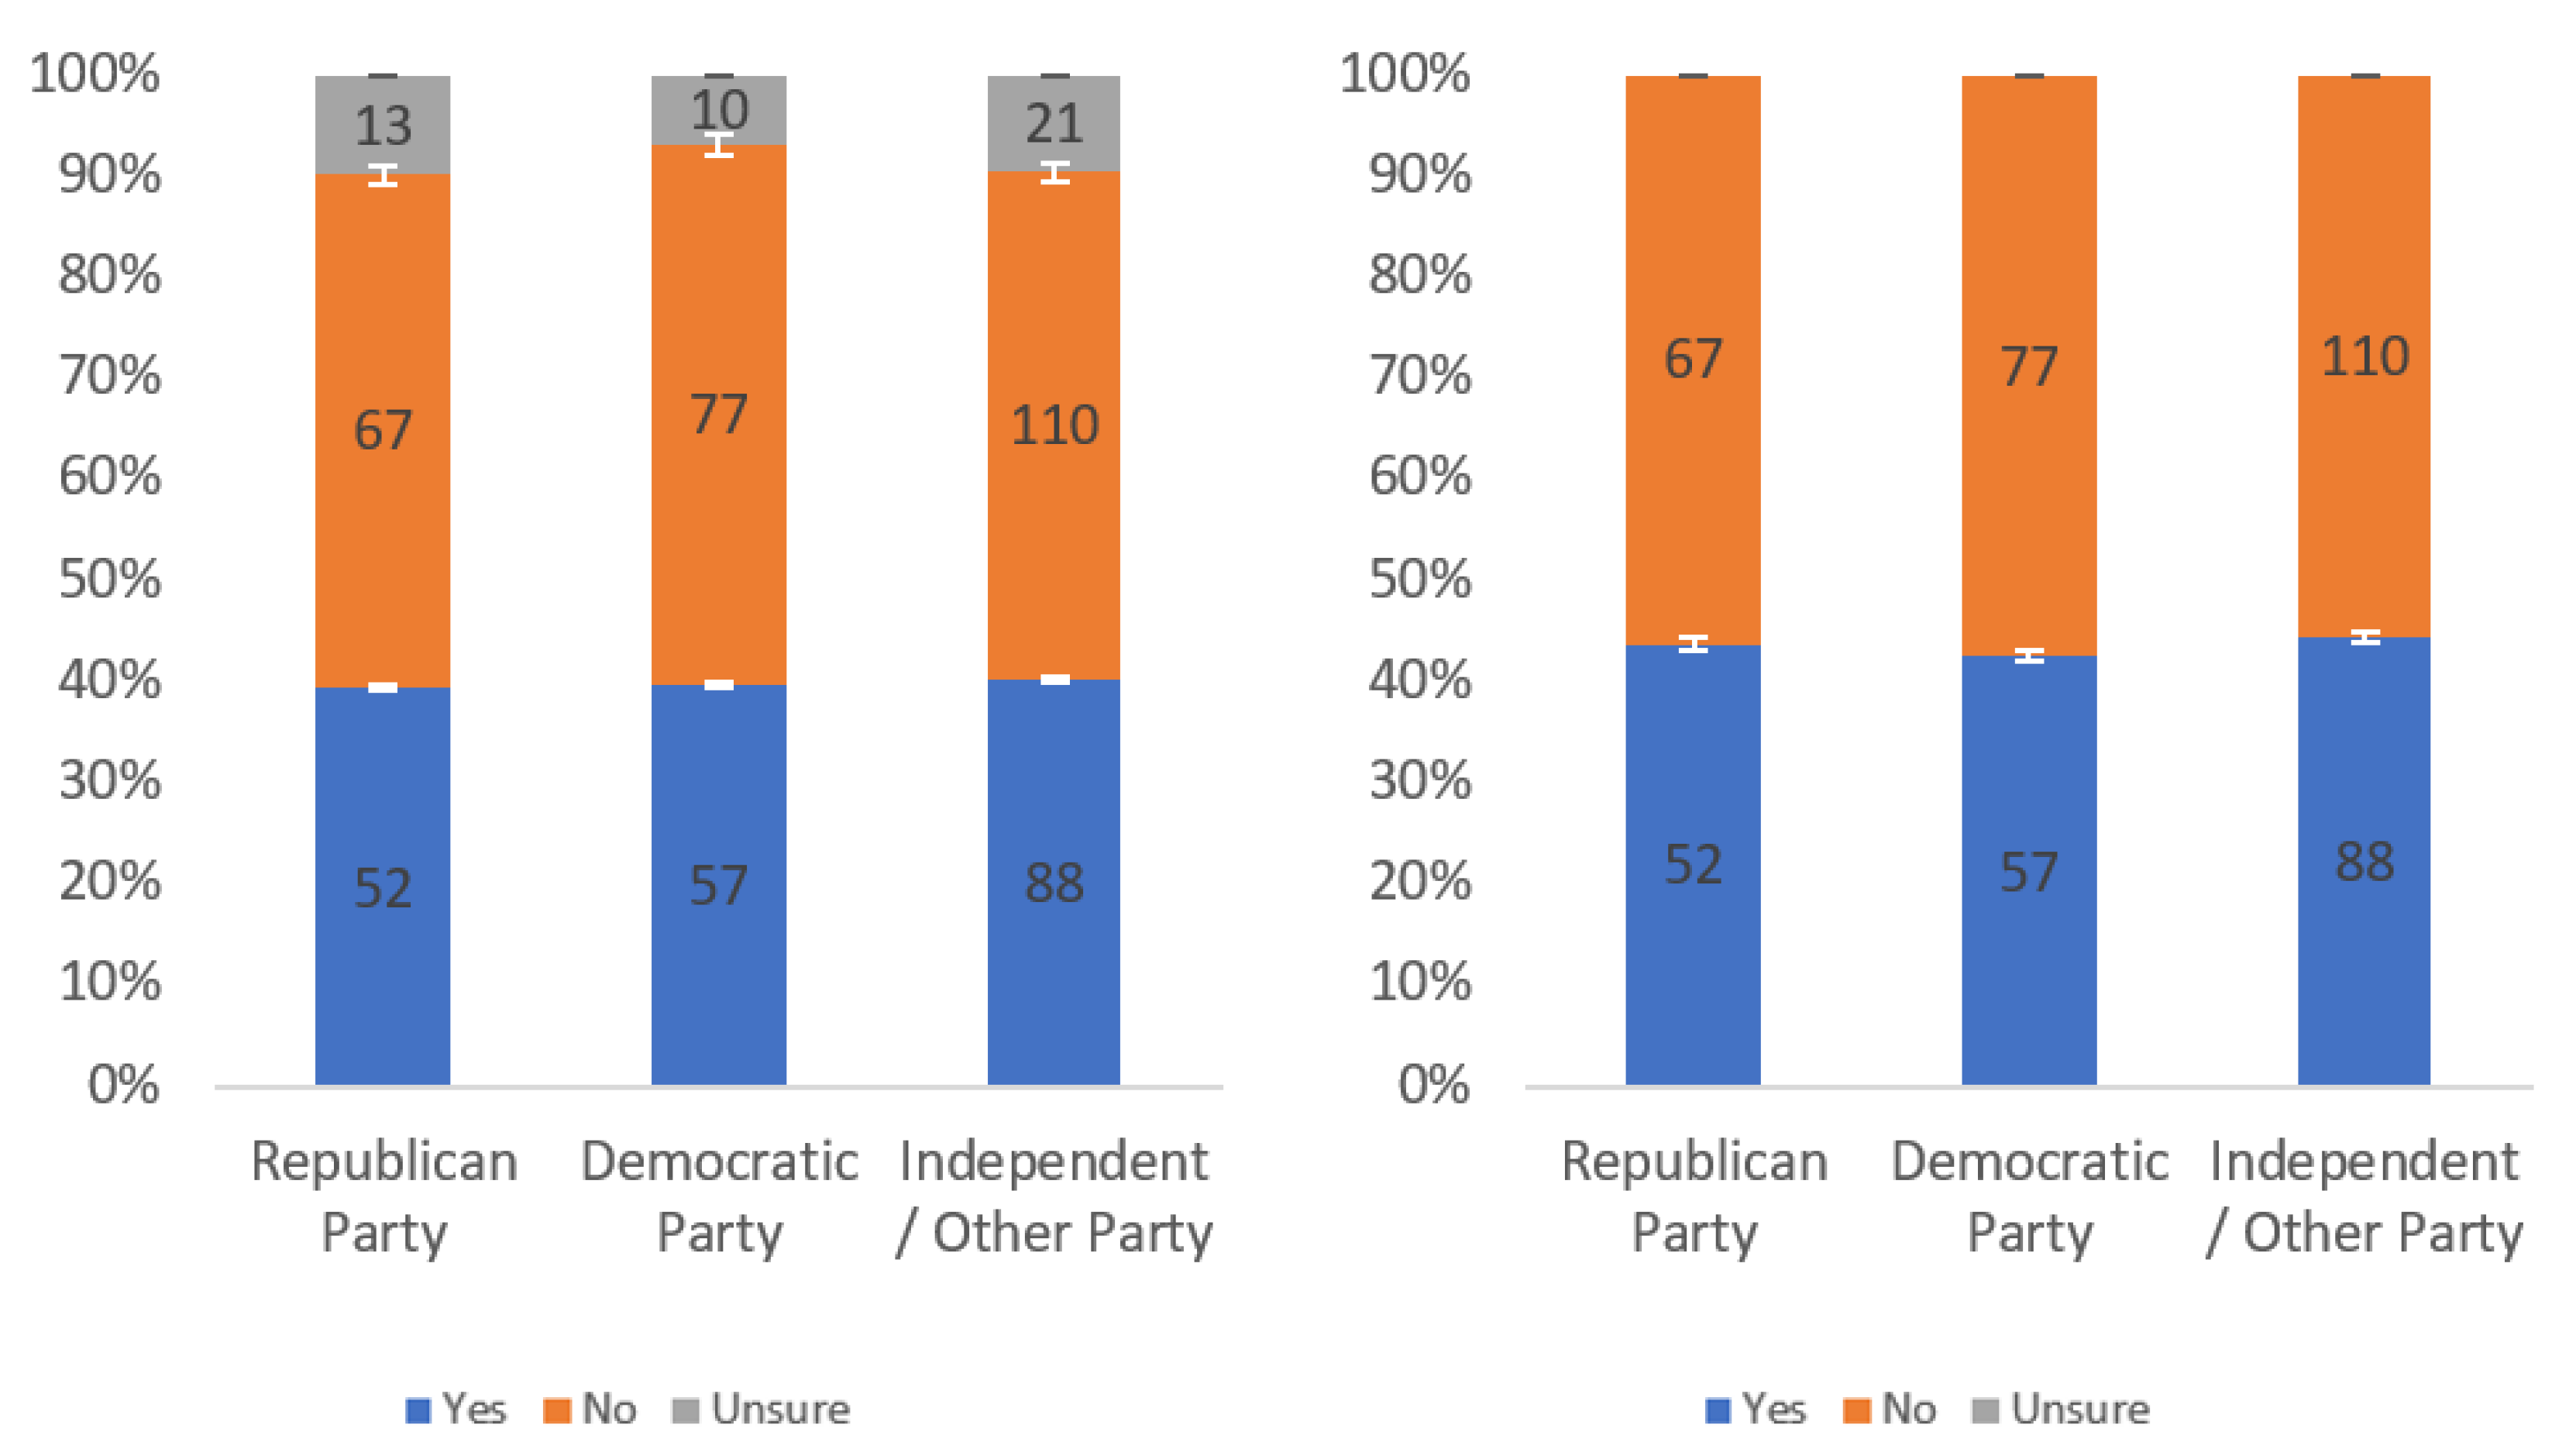
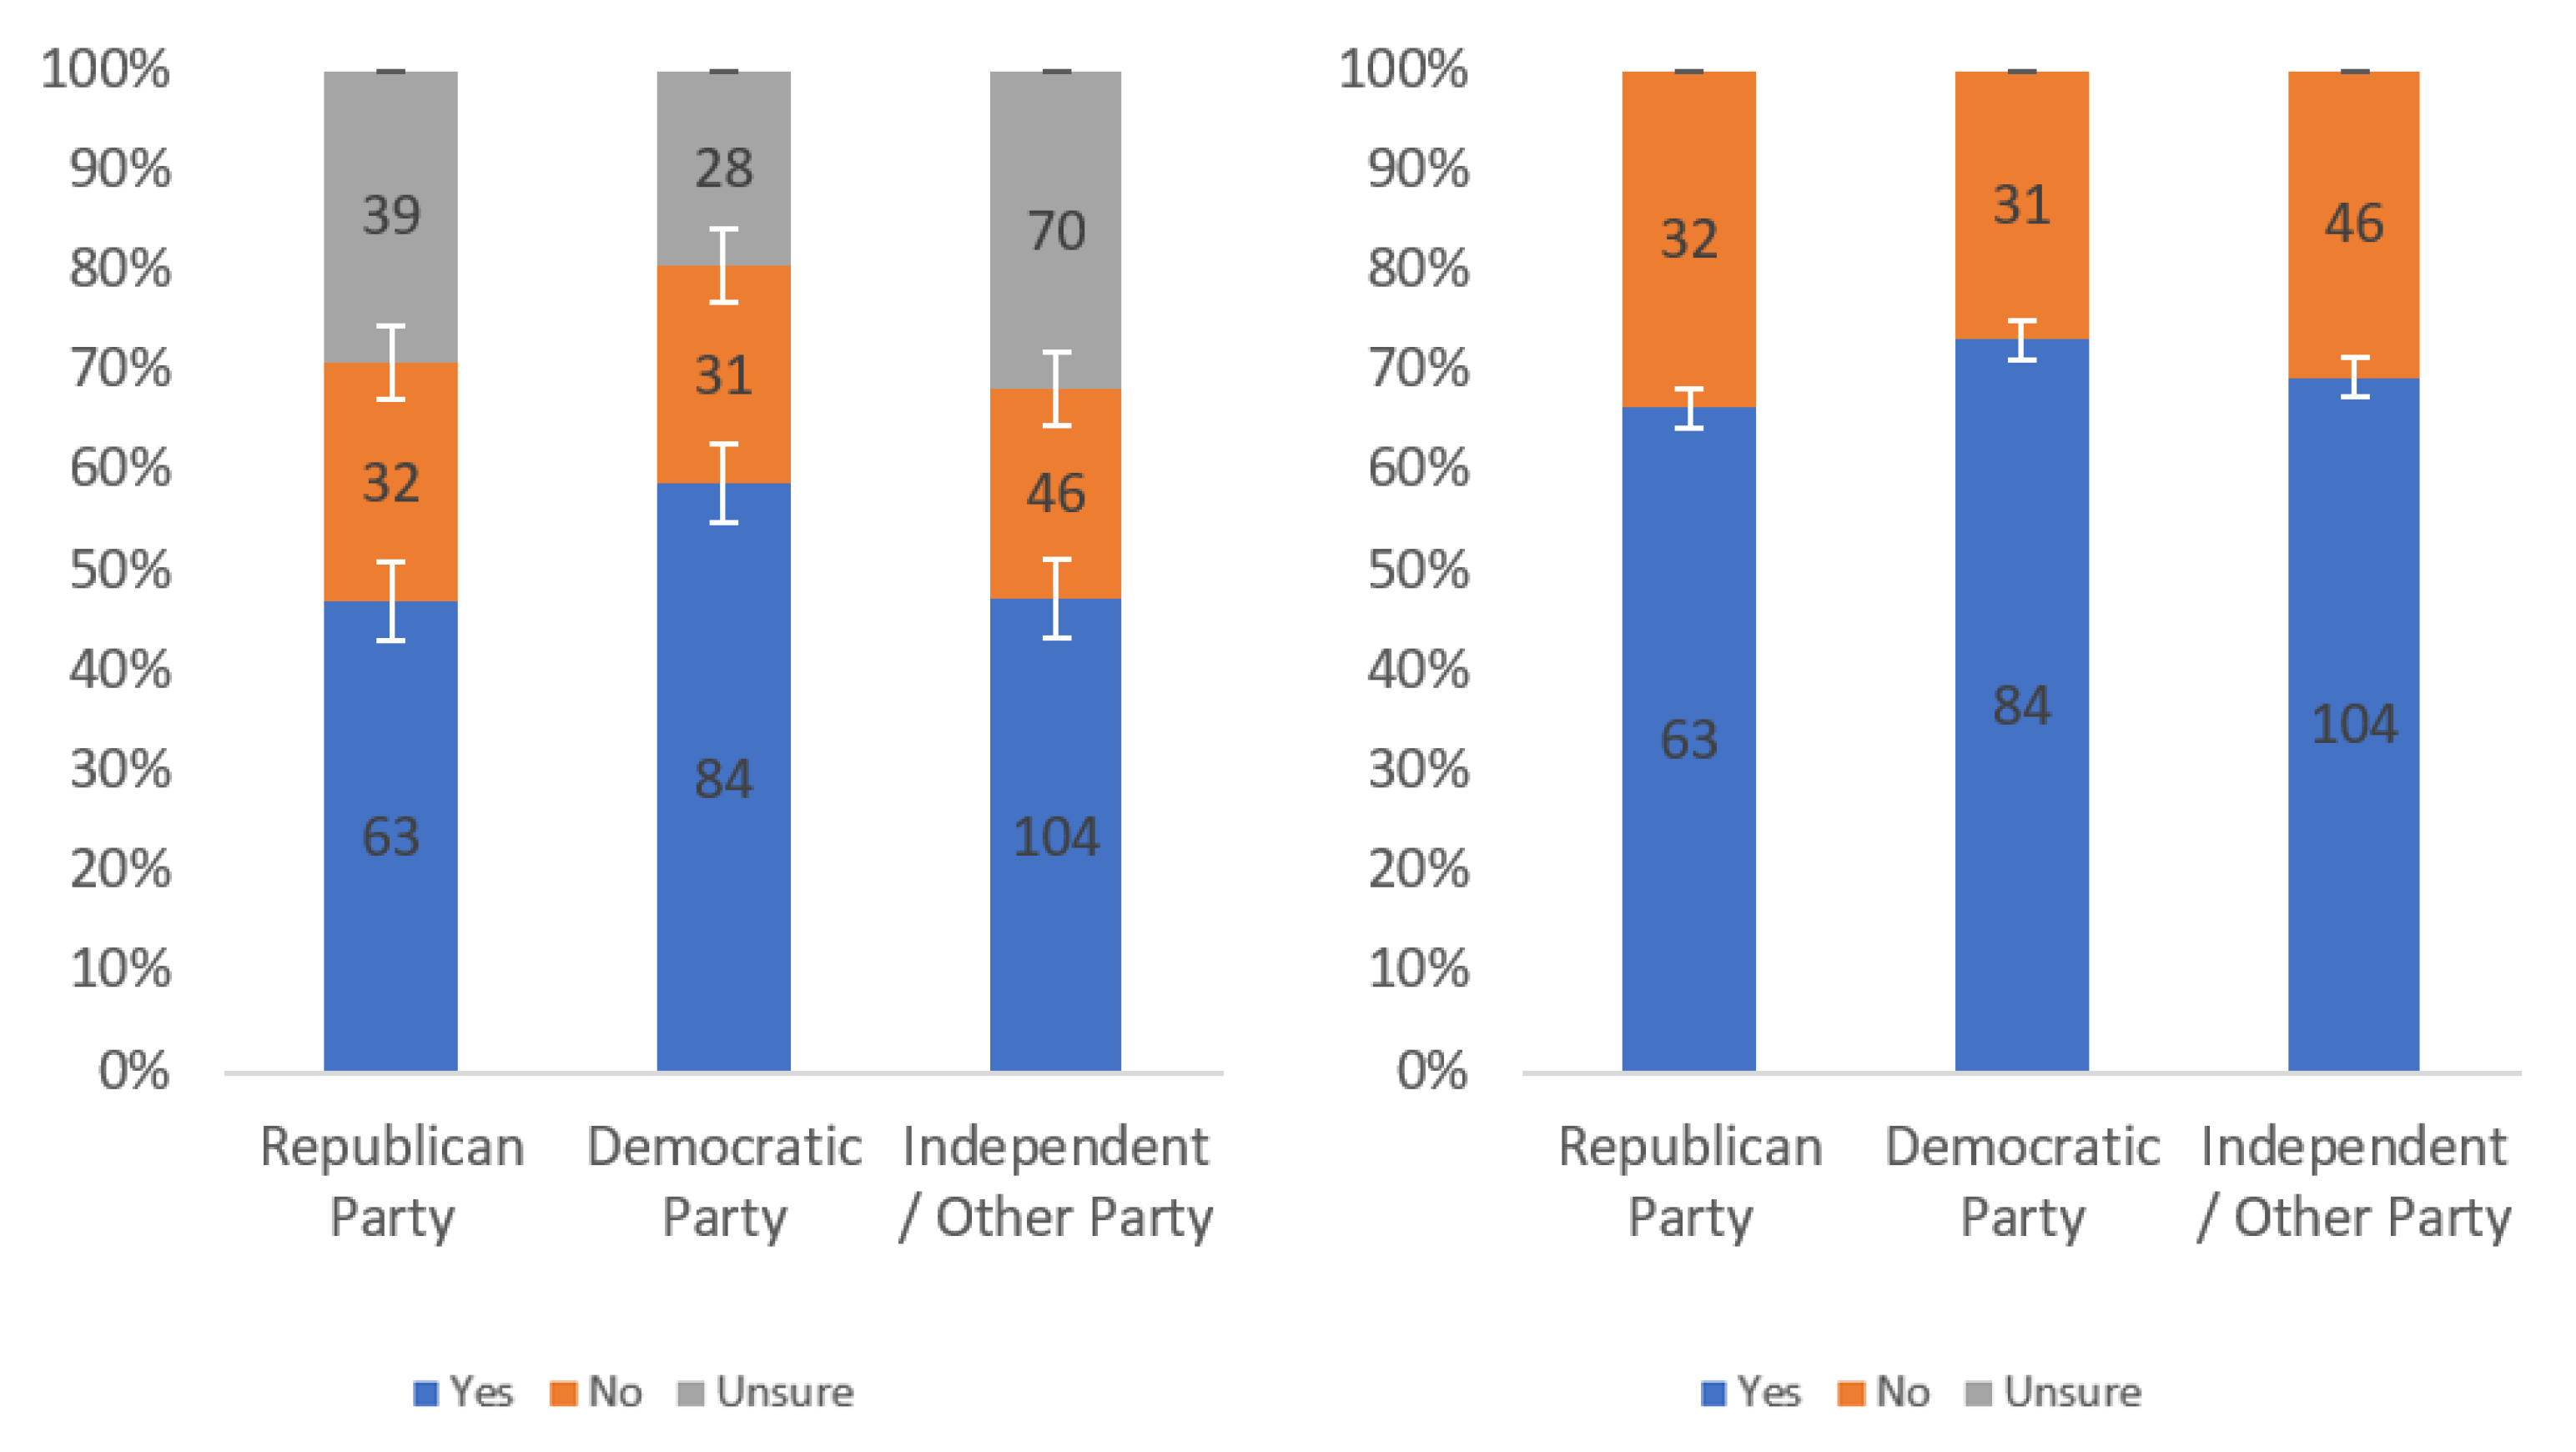
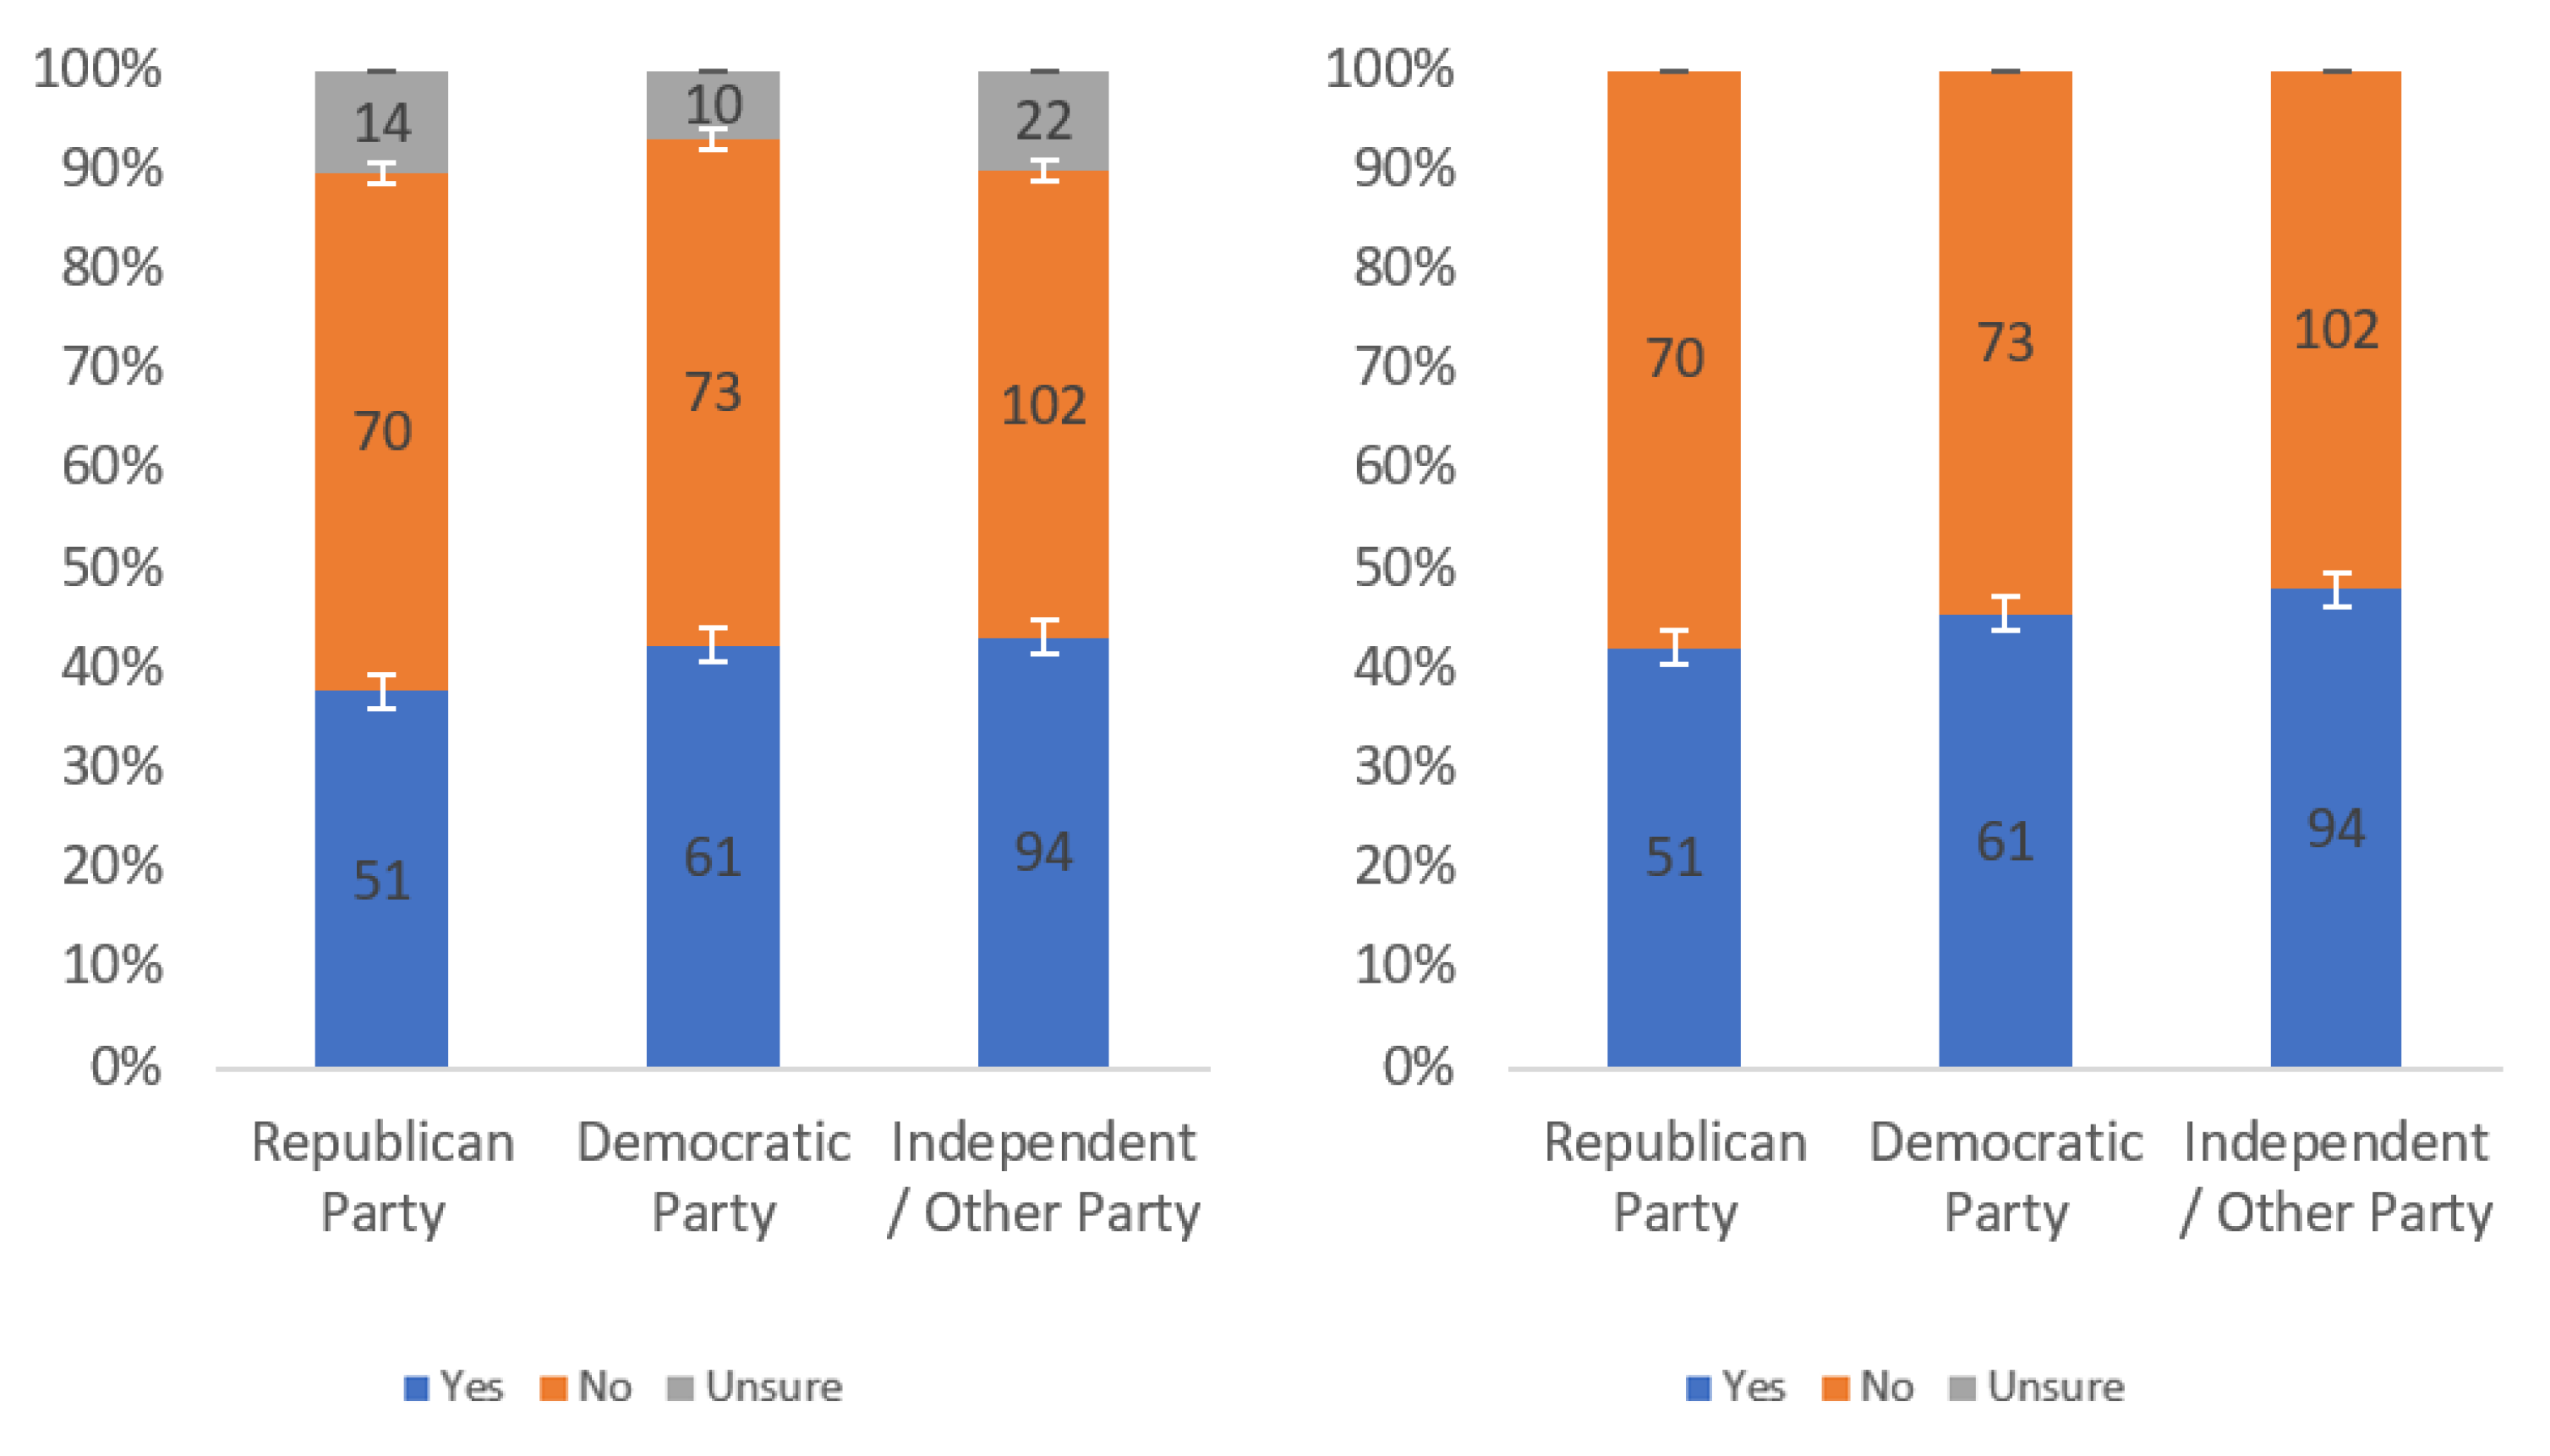
Figure 11.
Responses regarding label annoyingness by political affiliation including (left) and excluding (right) unsure responses.
Figure 12.
Responses regarding label annoyingness by internet usage level including (left) and excluding (right) unsure responses.
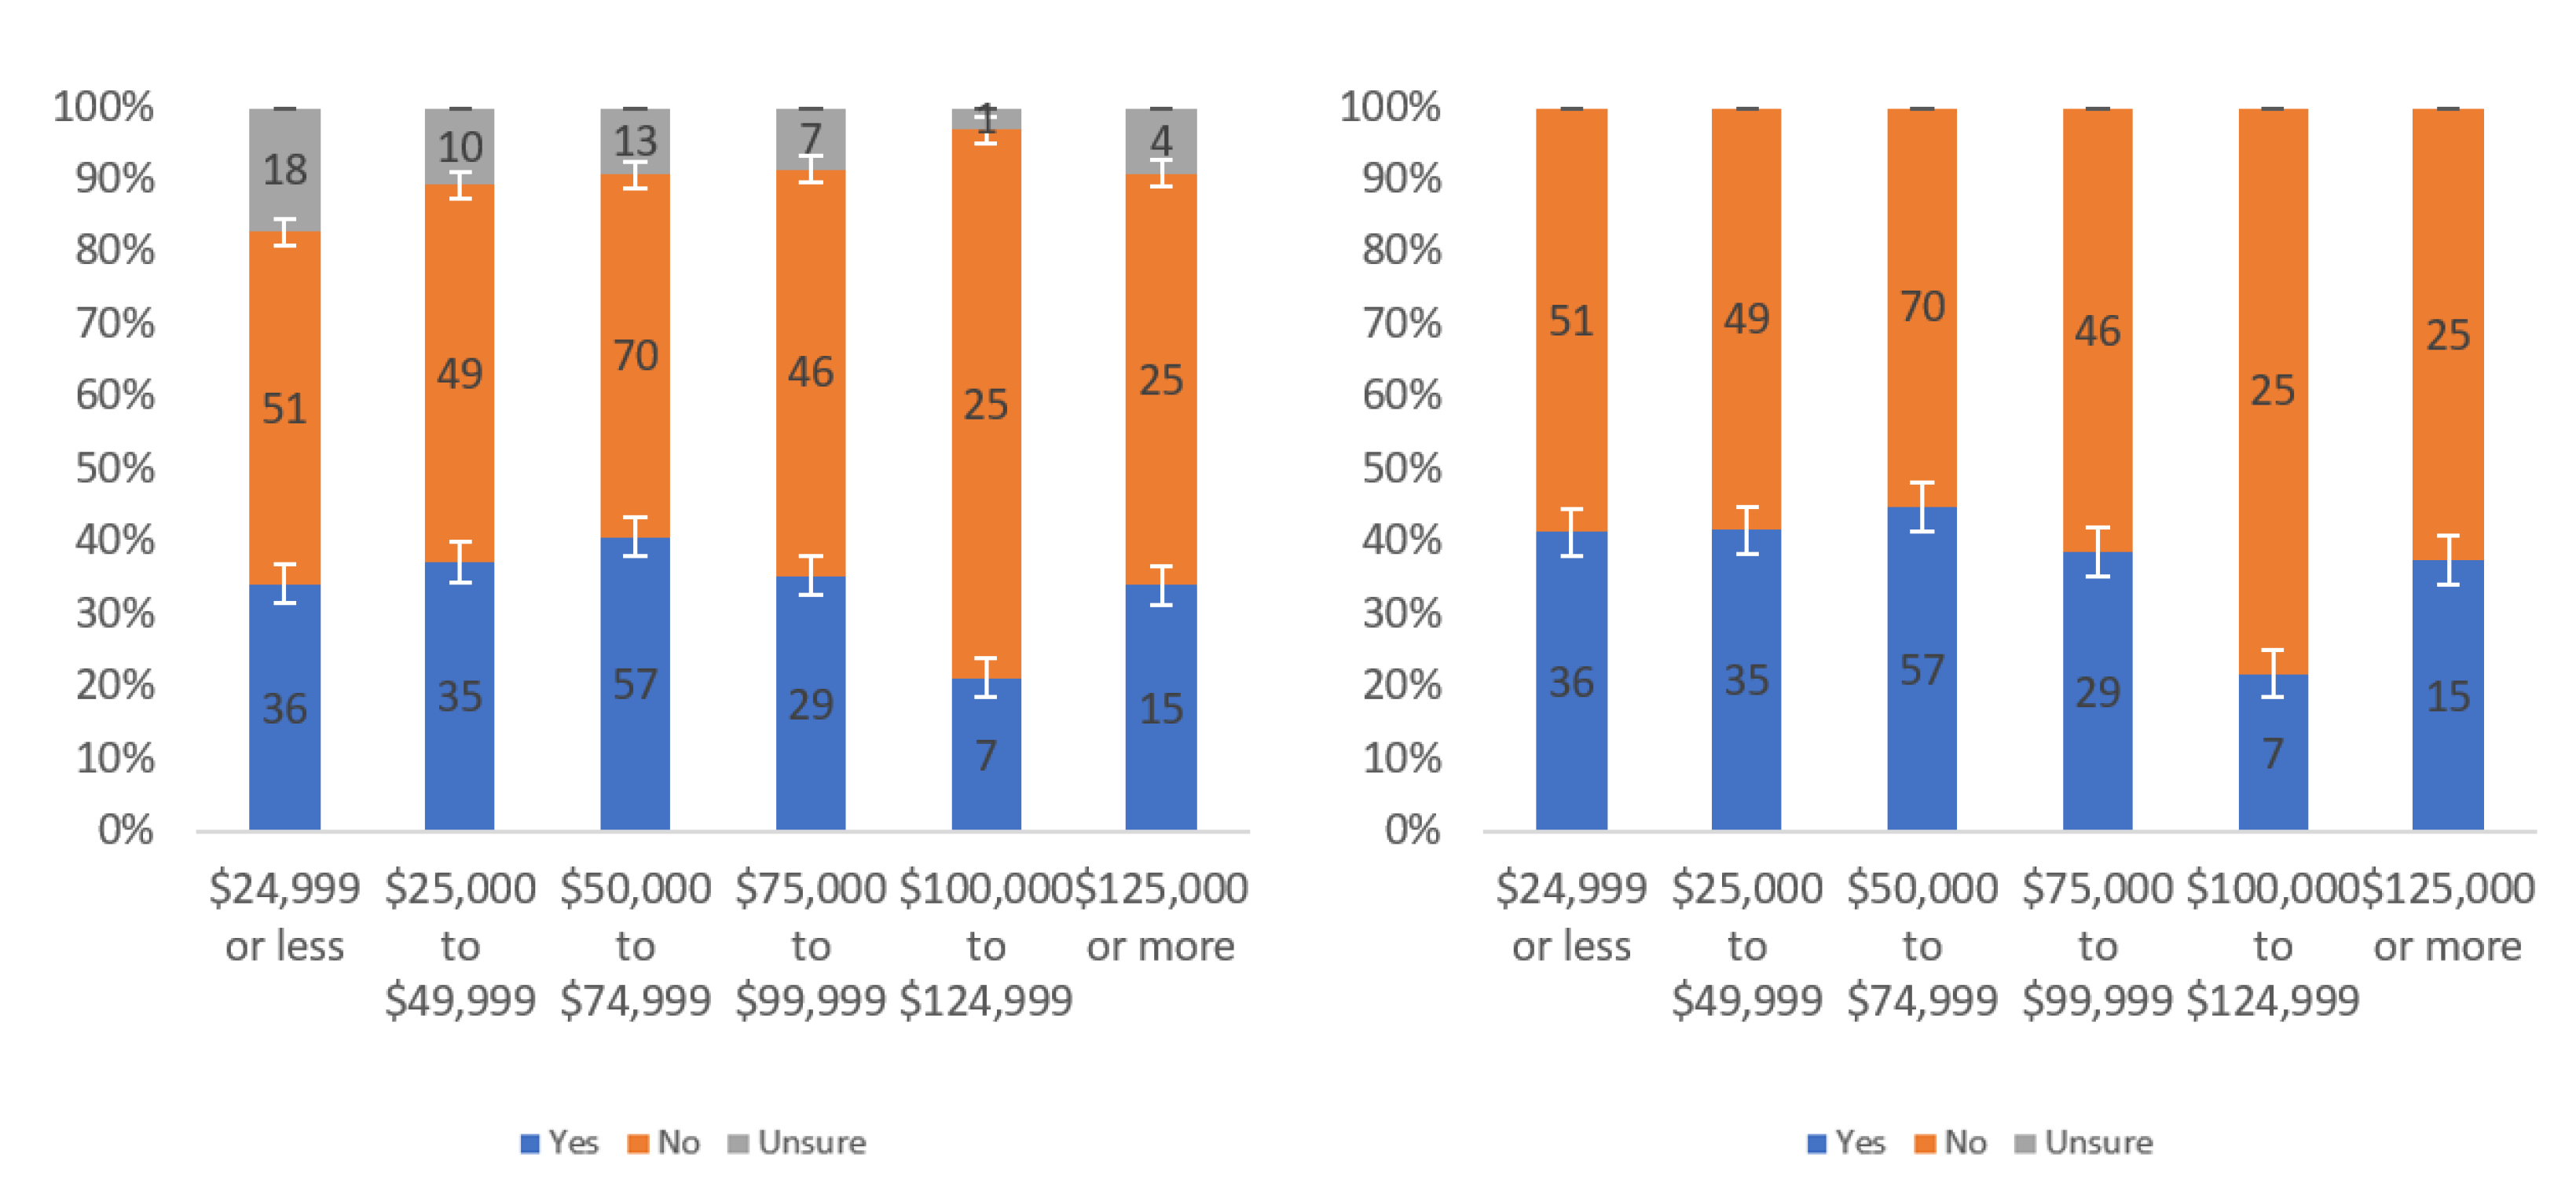
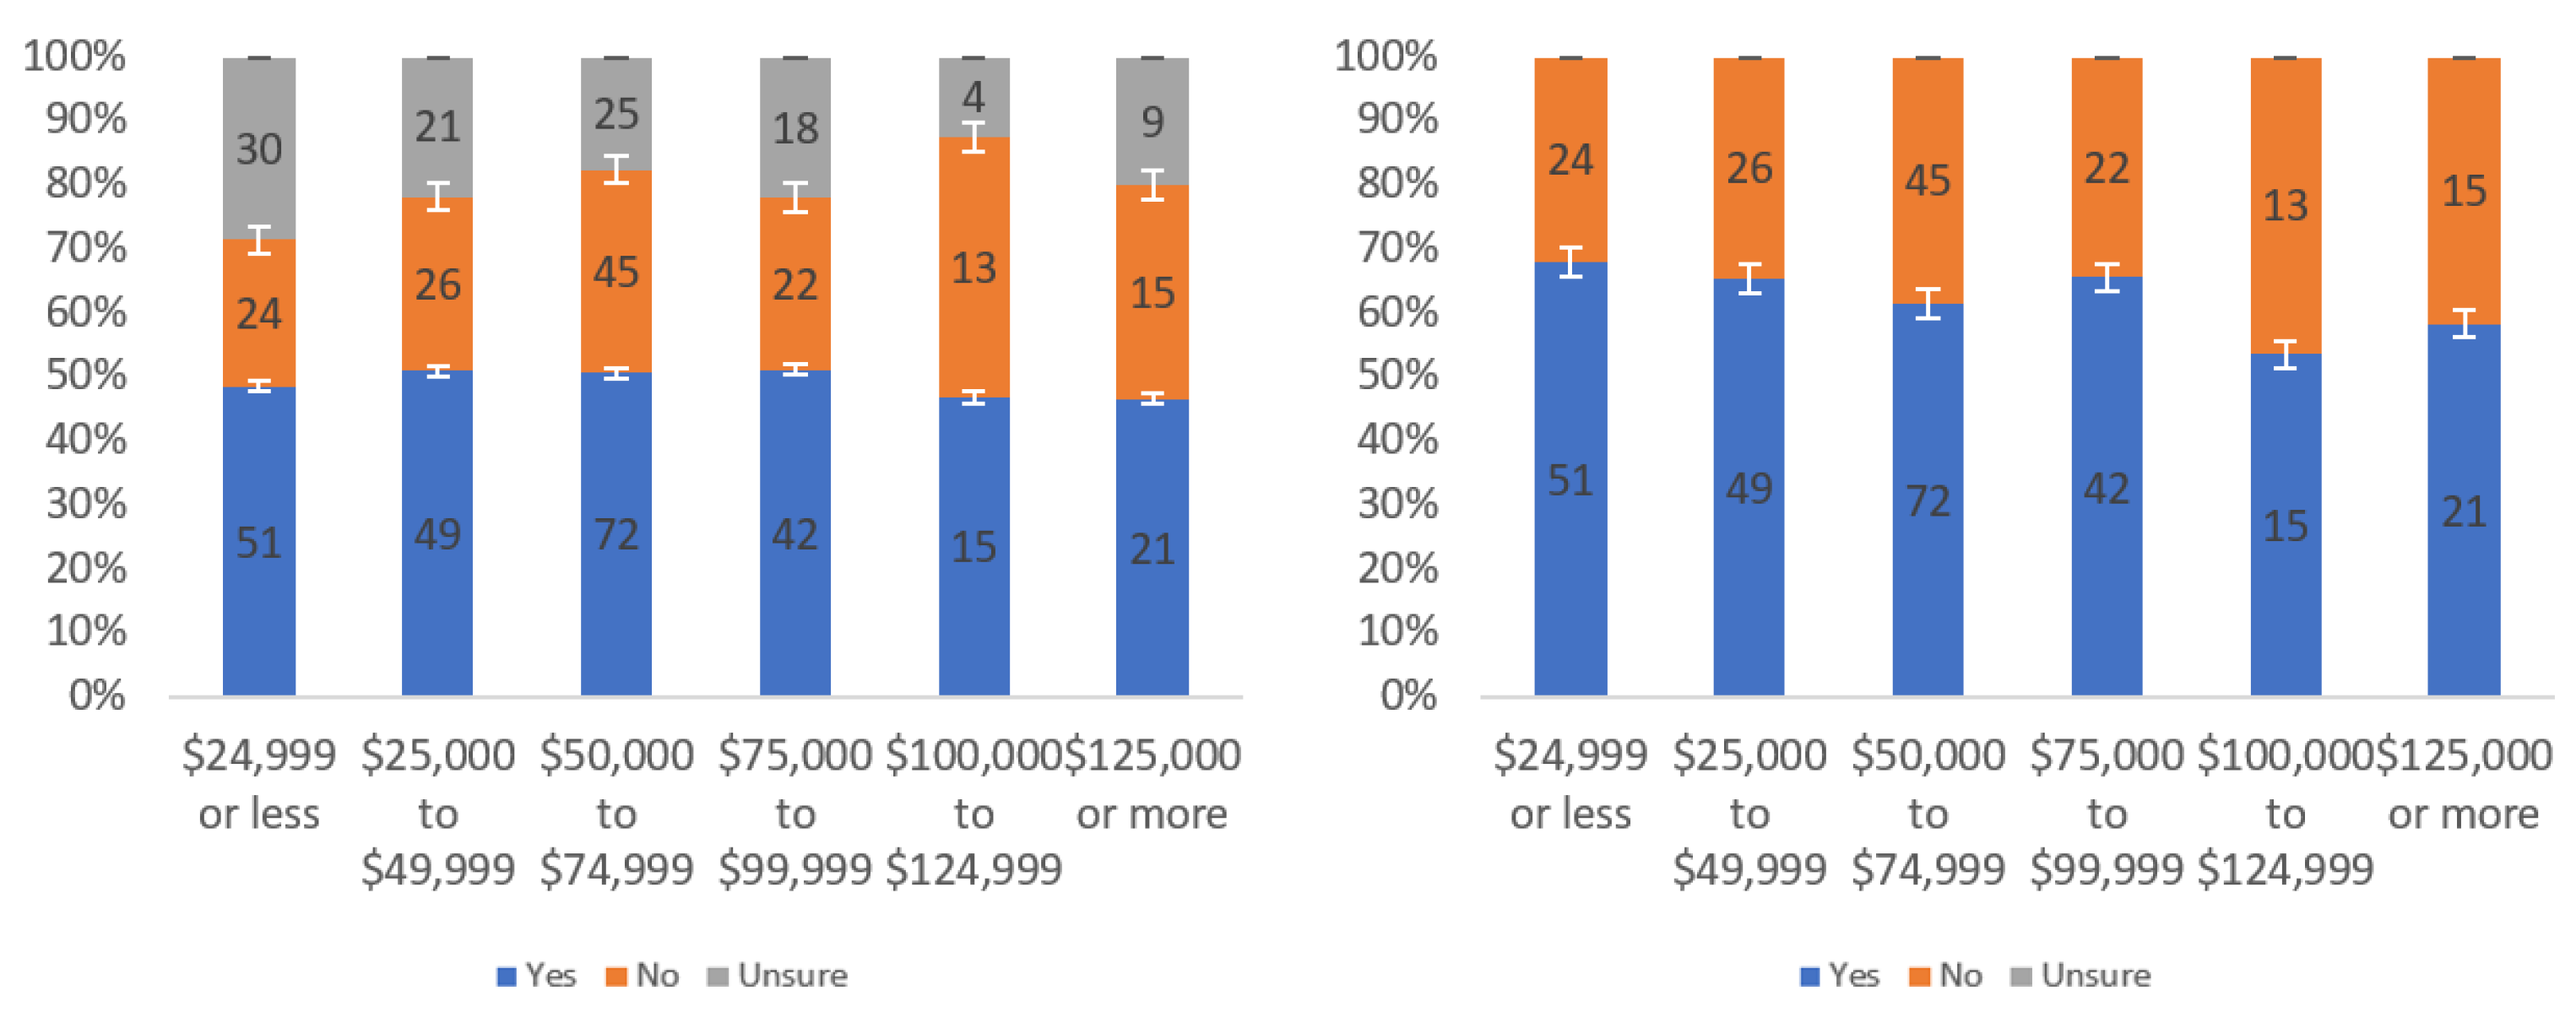
Figure 13.
Responses regarding respondents’ willingness to review by income level including (left) and excluding (right) unsure responses.
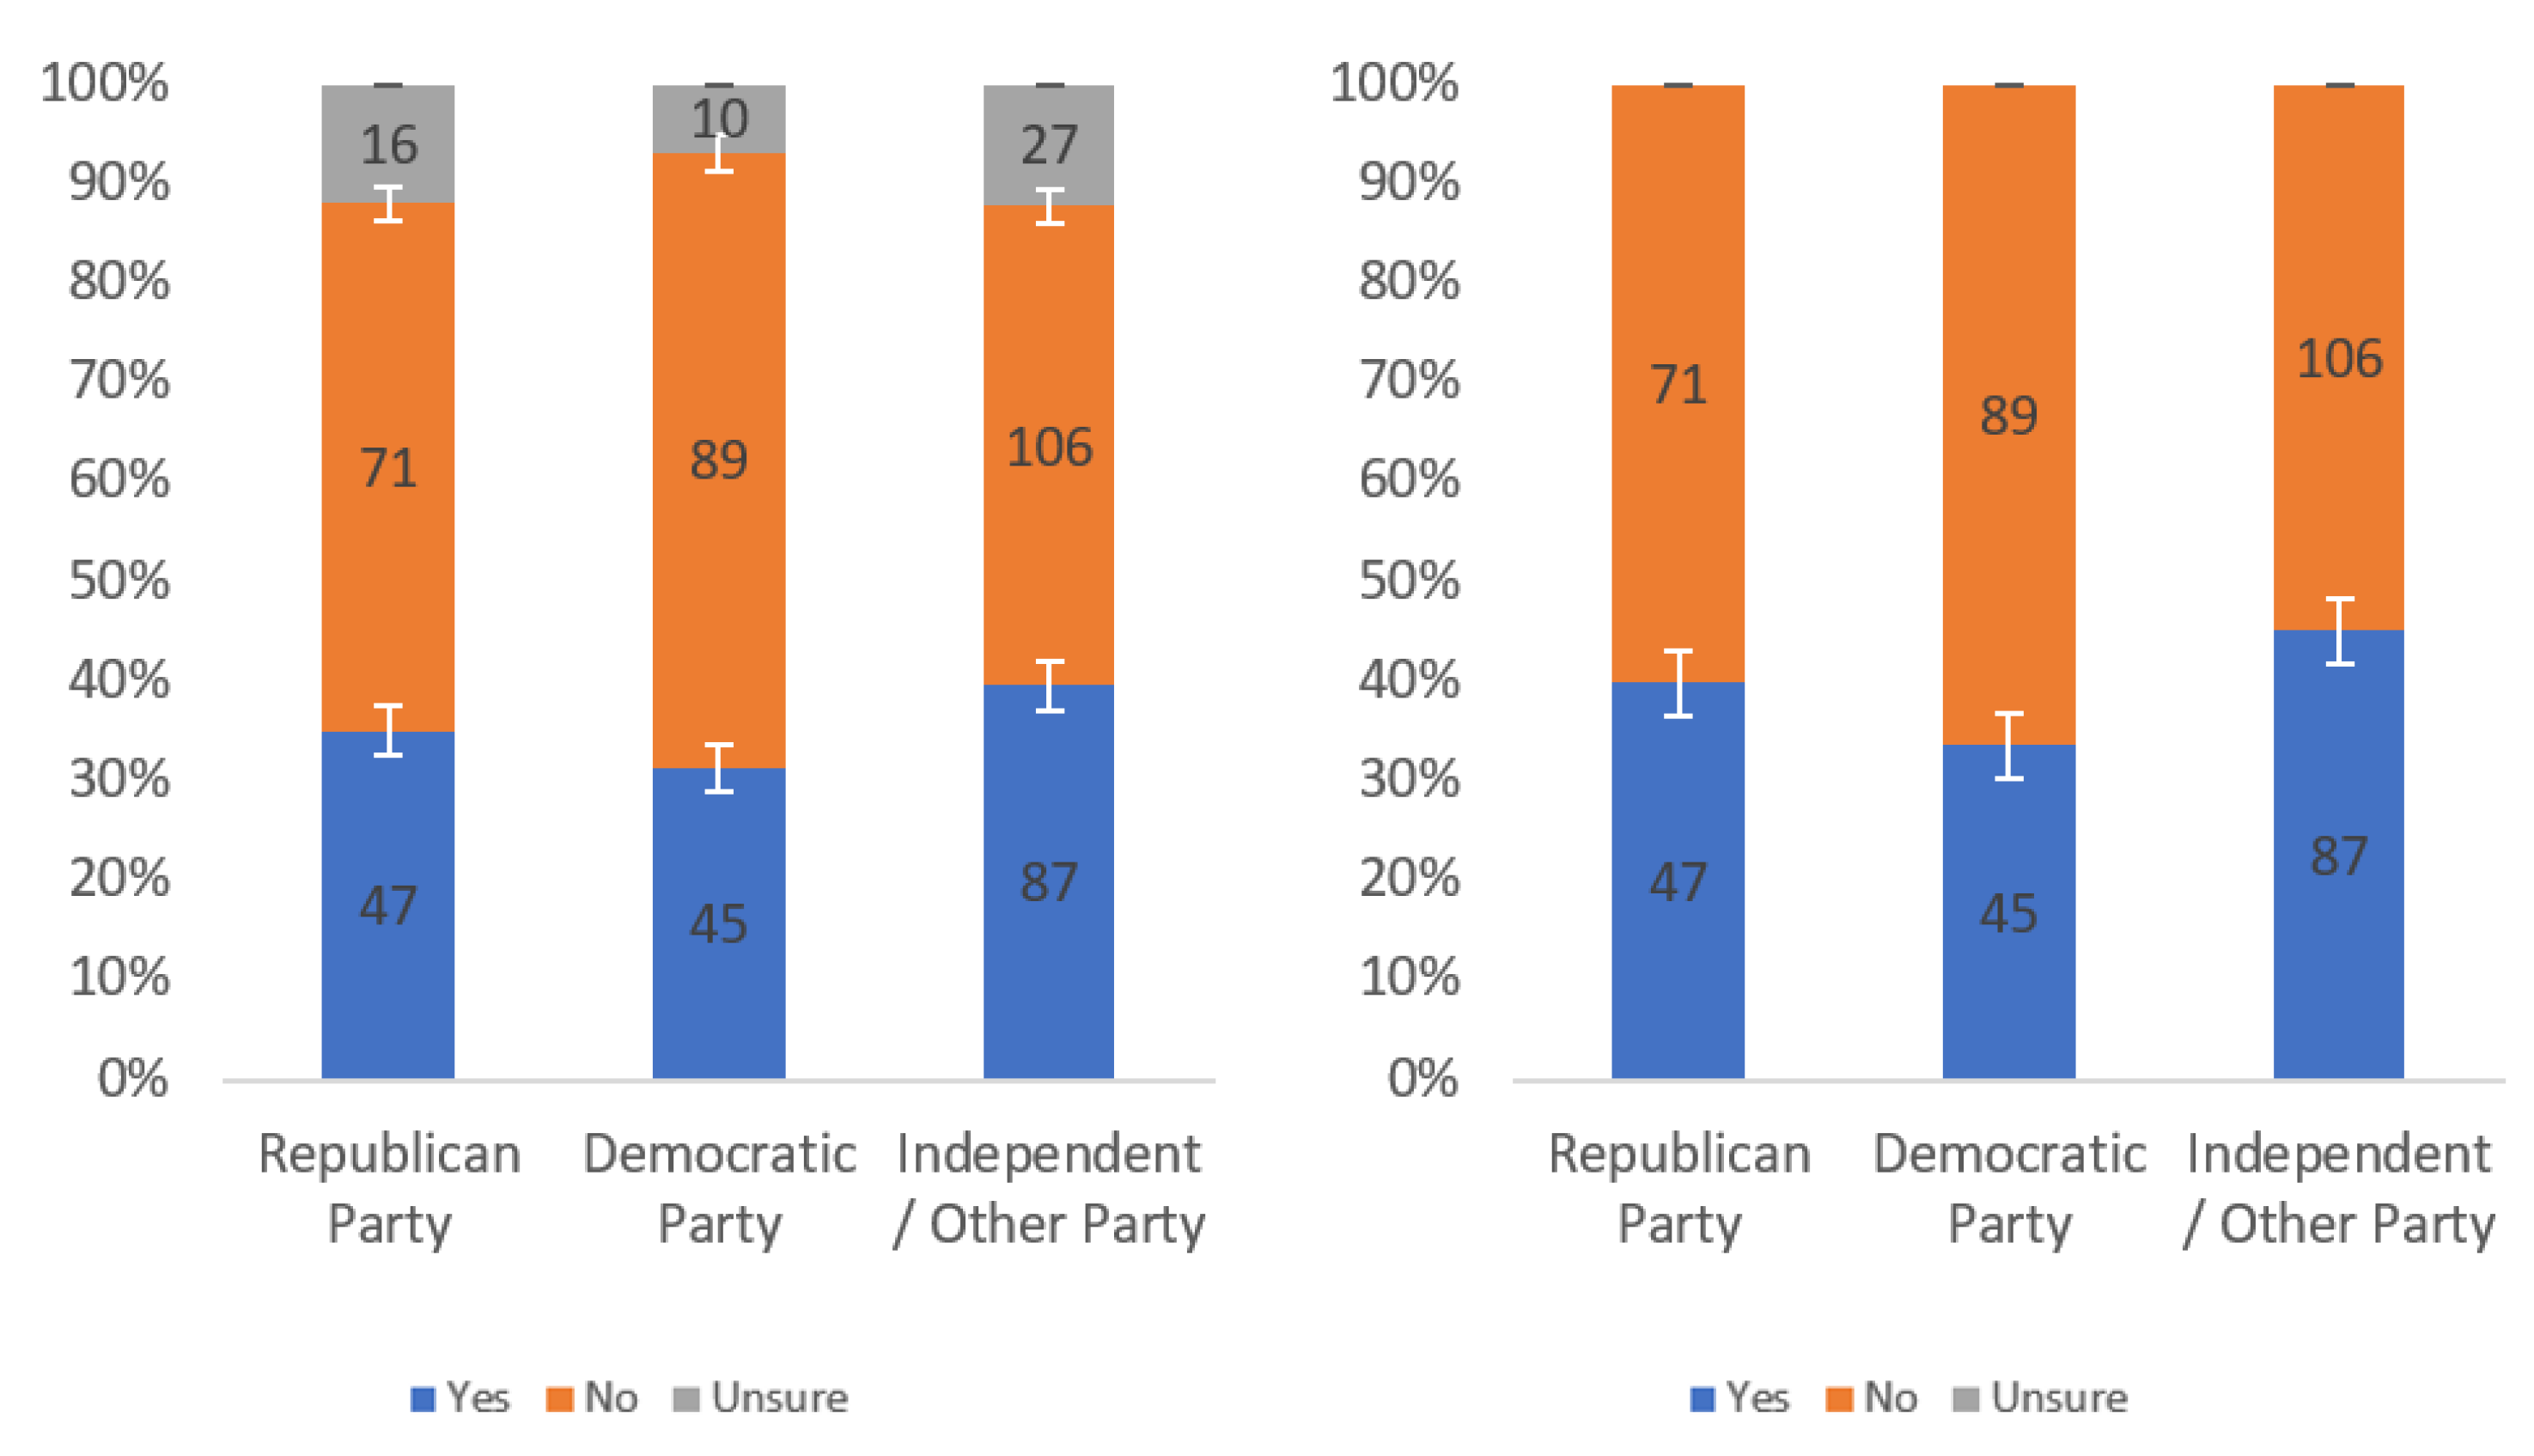
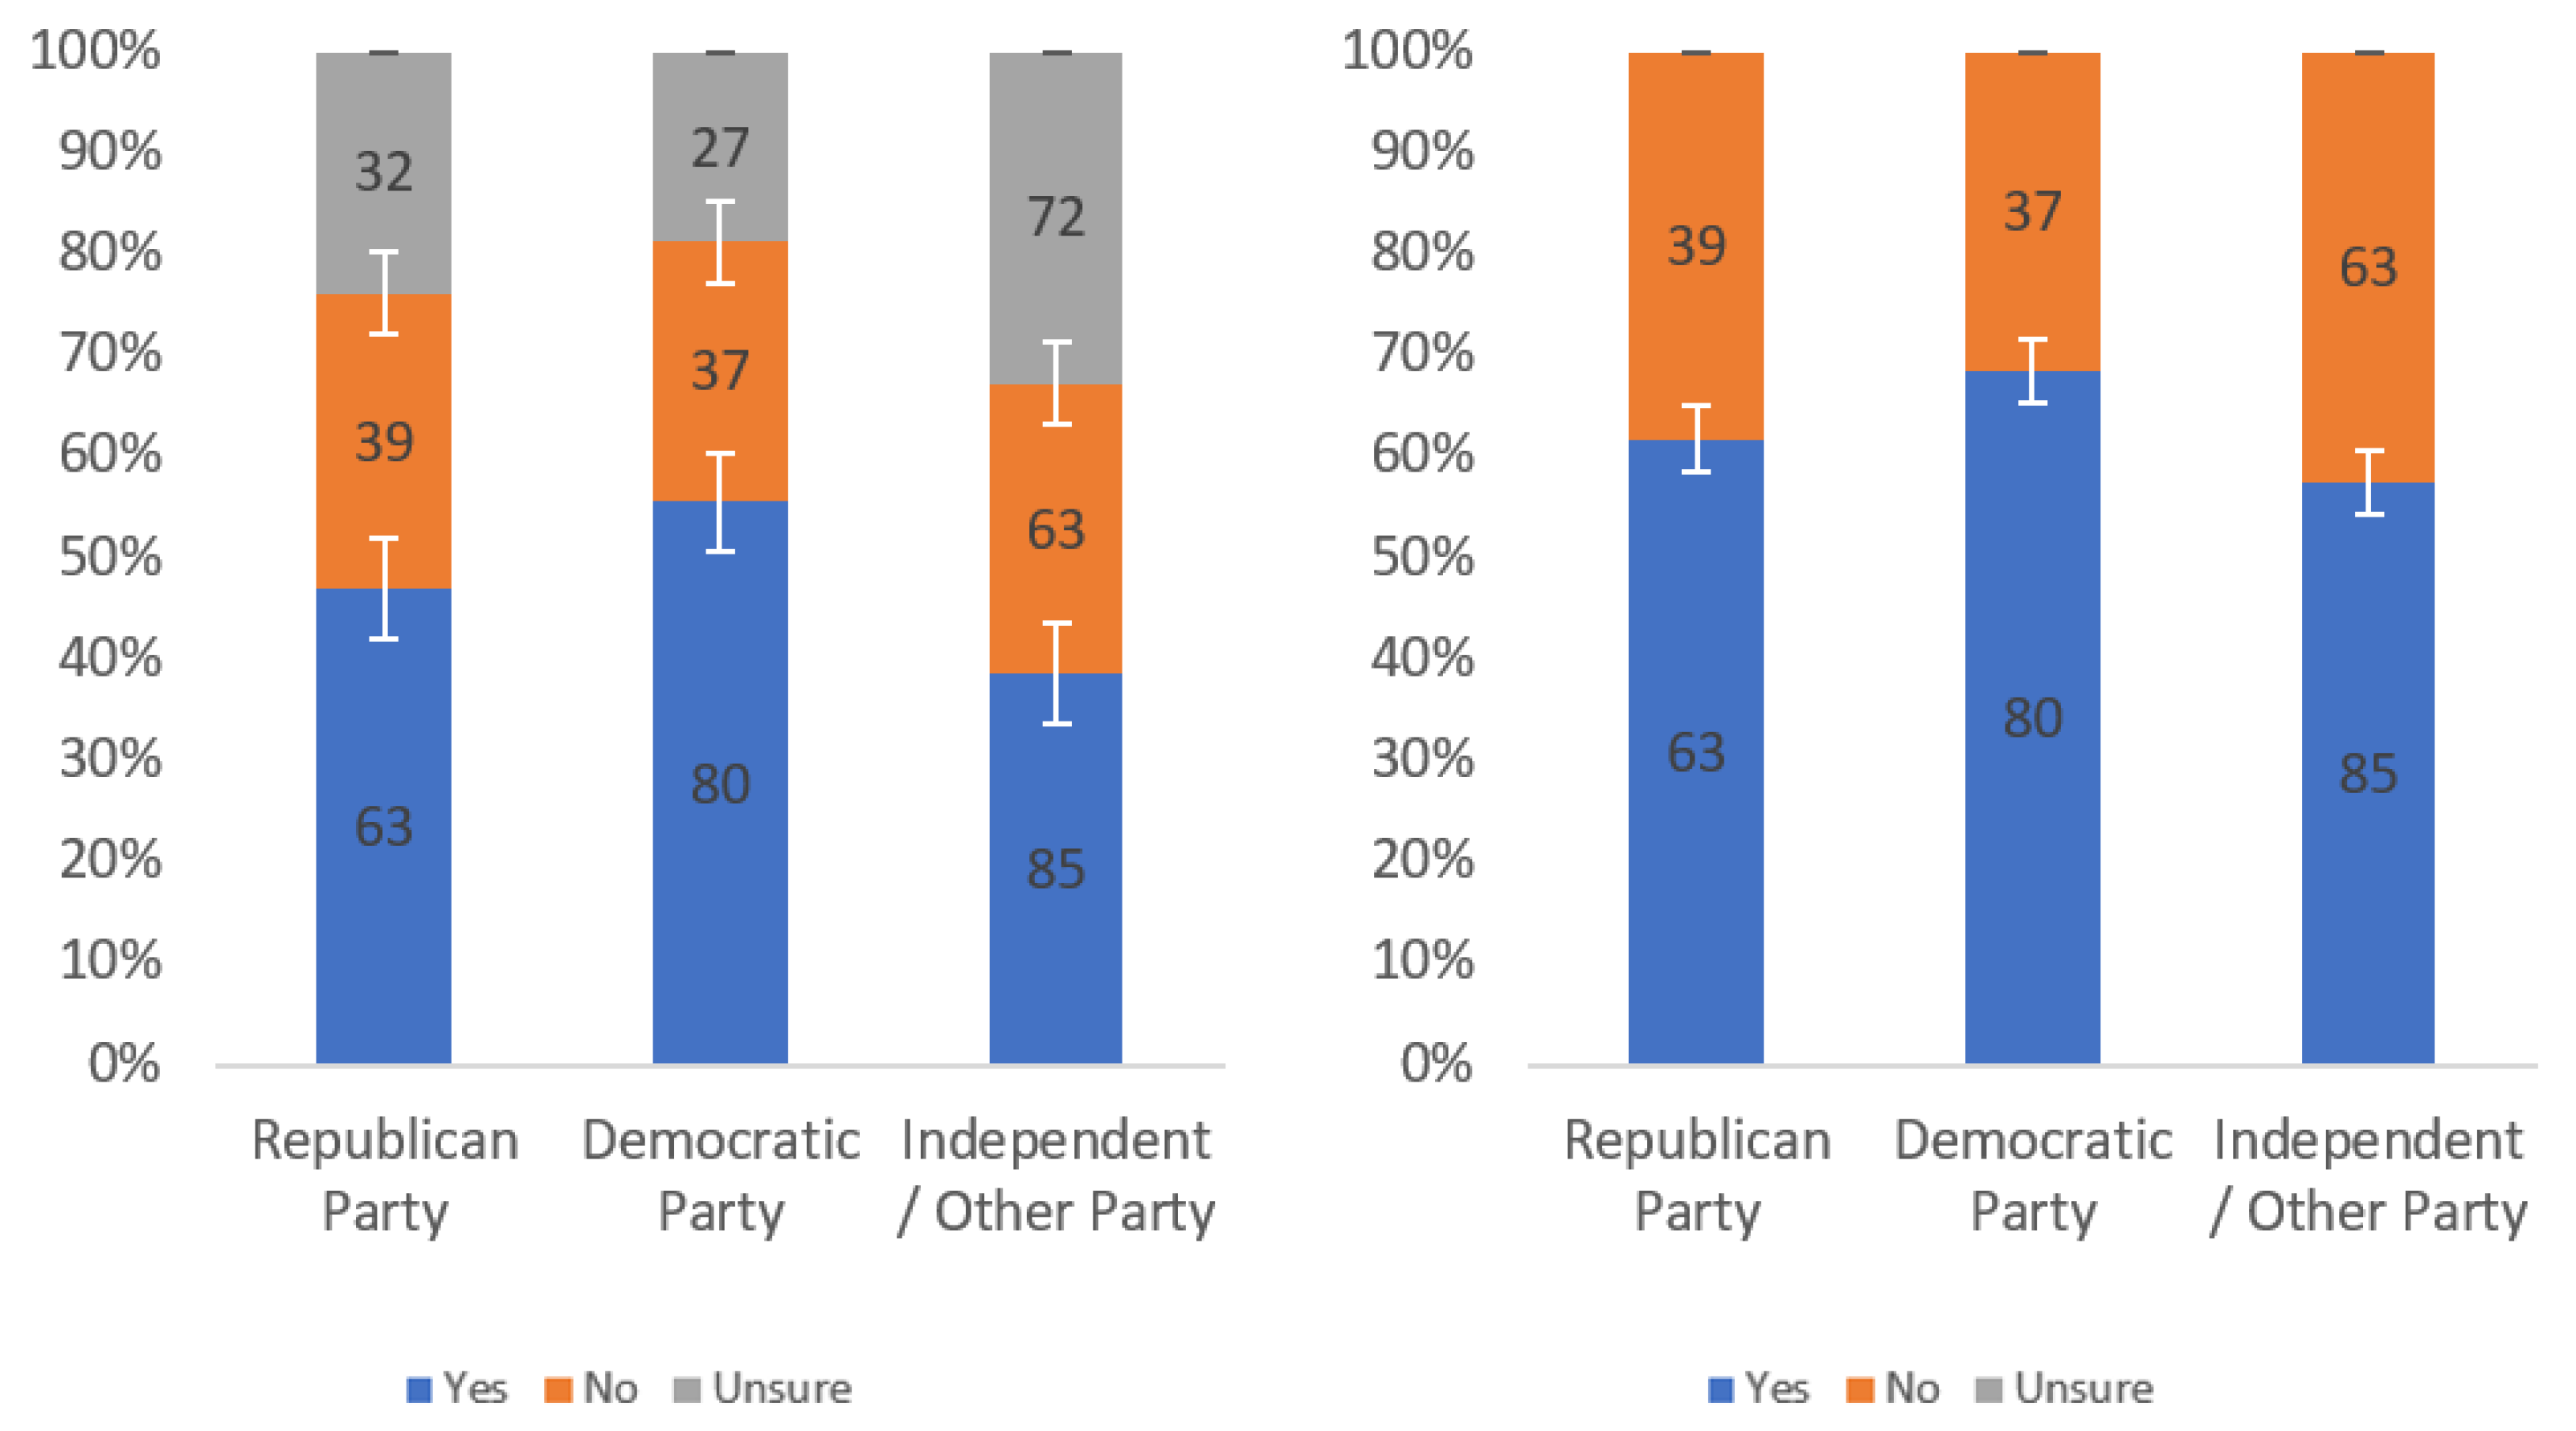
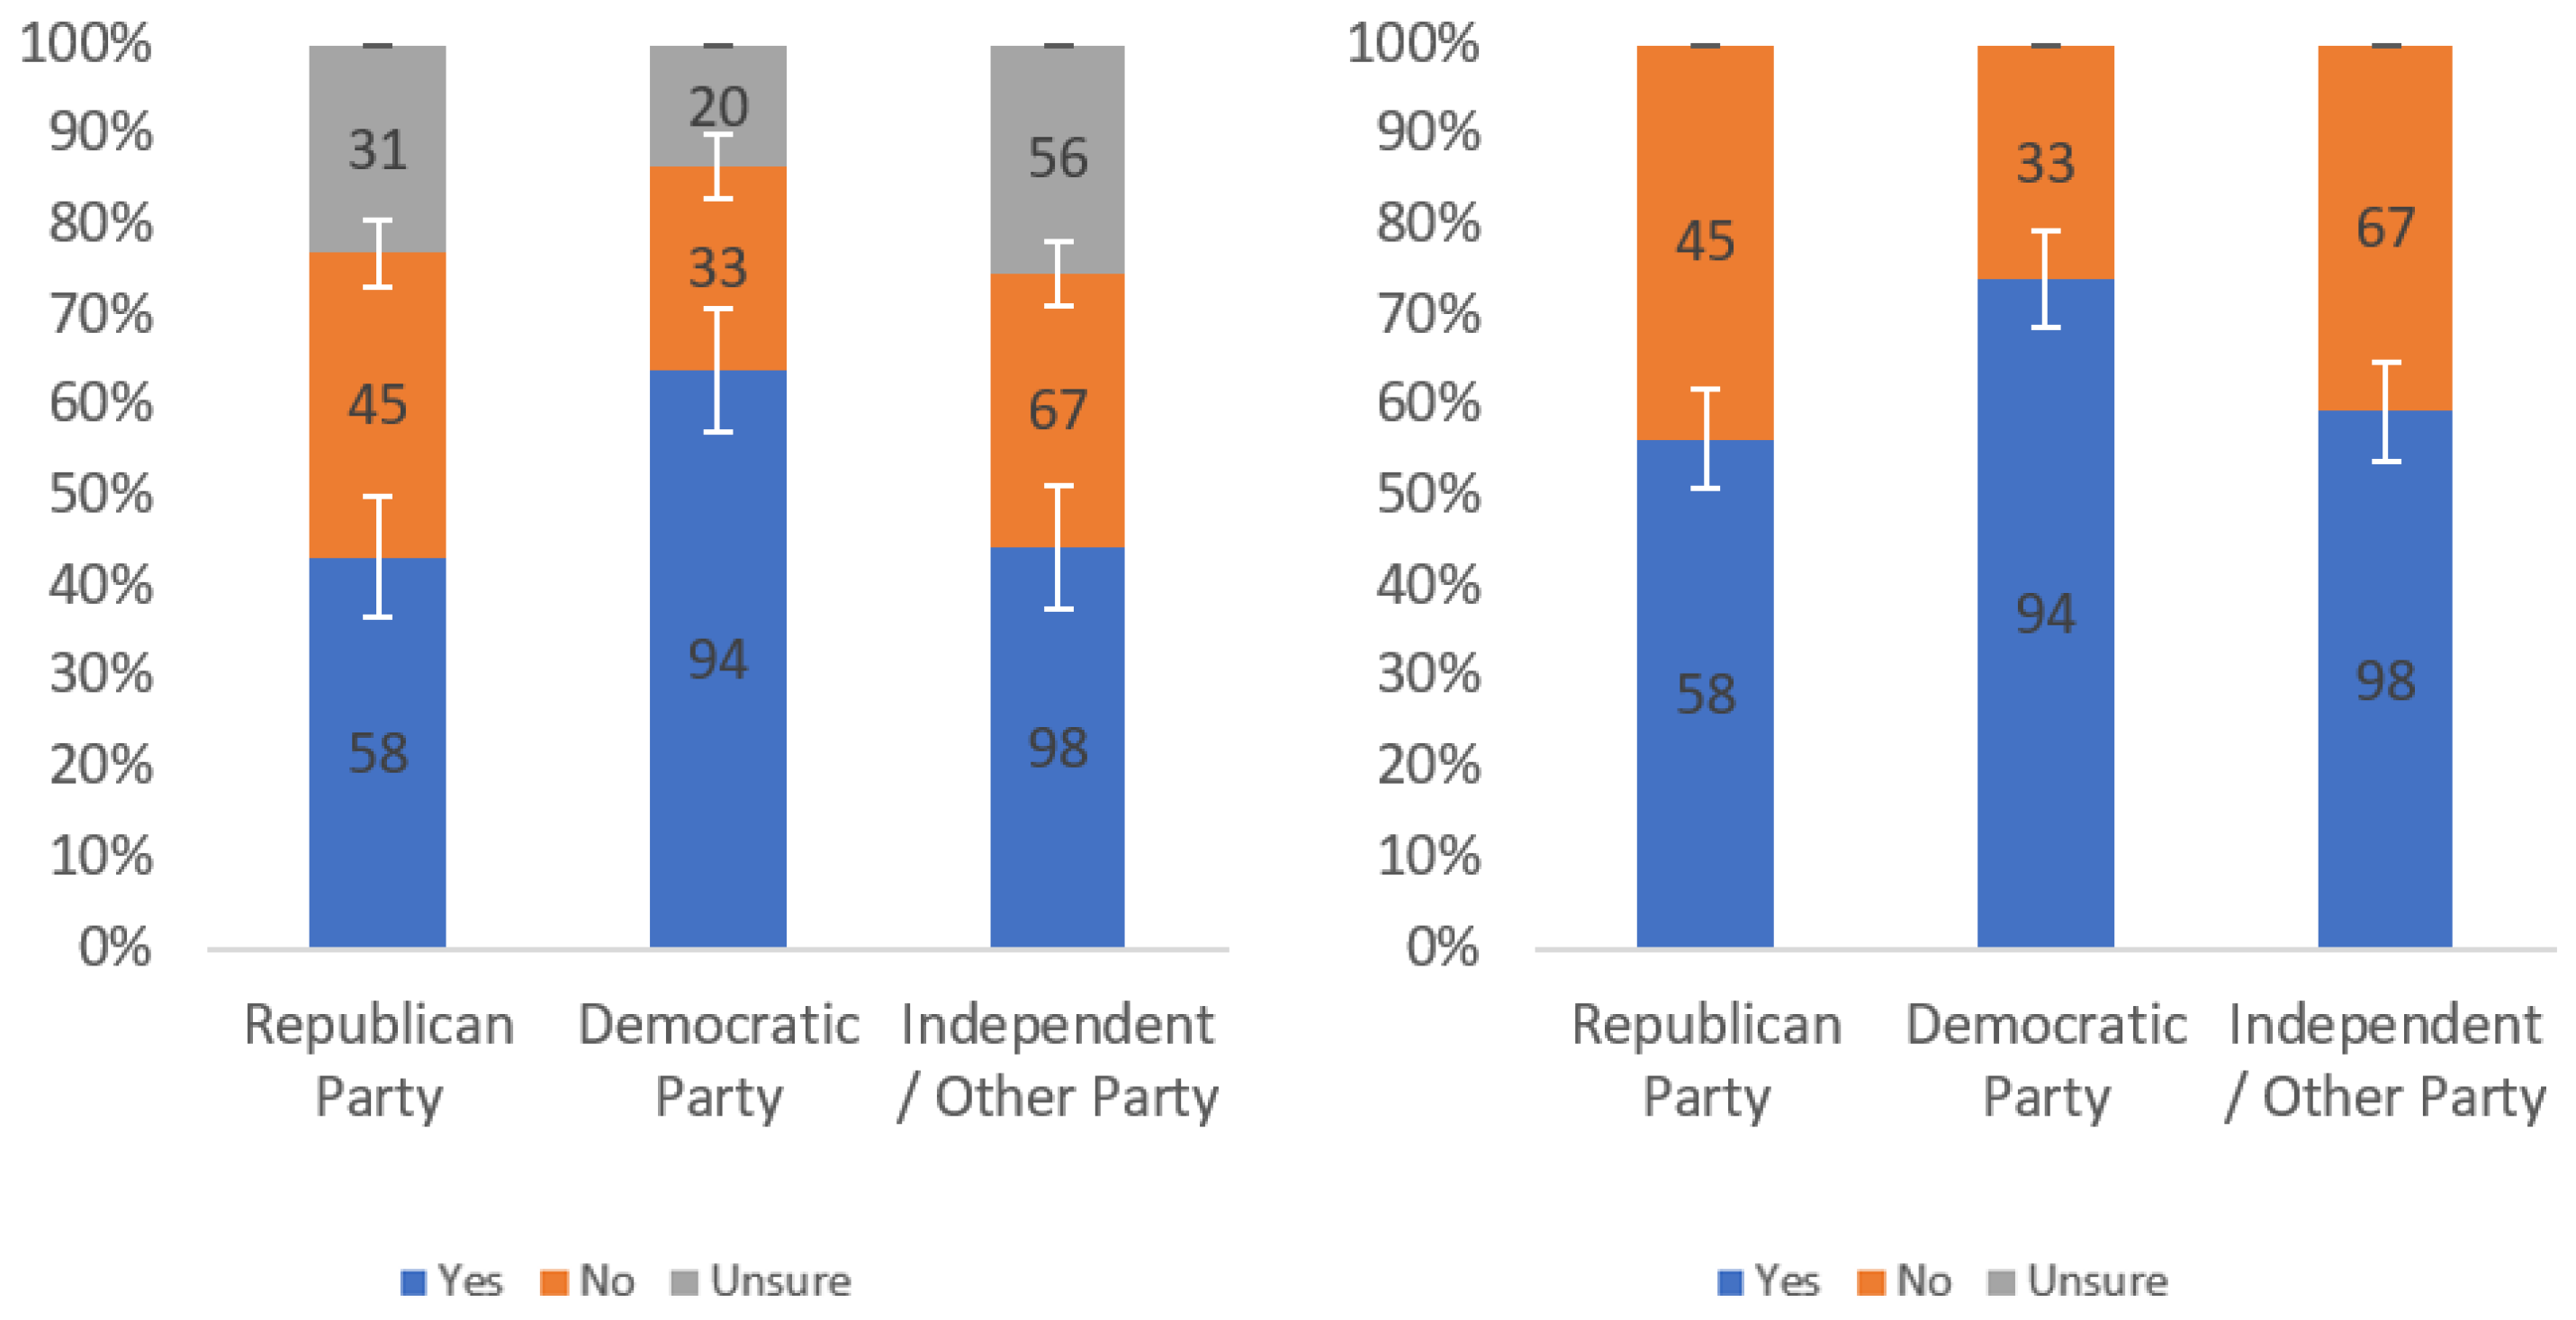
Figure 14.
Responses regarding respondents’ willingness to review by party affiliation including (left) and excluding (right) unsure responses.
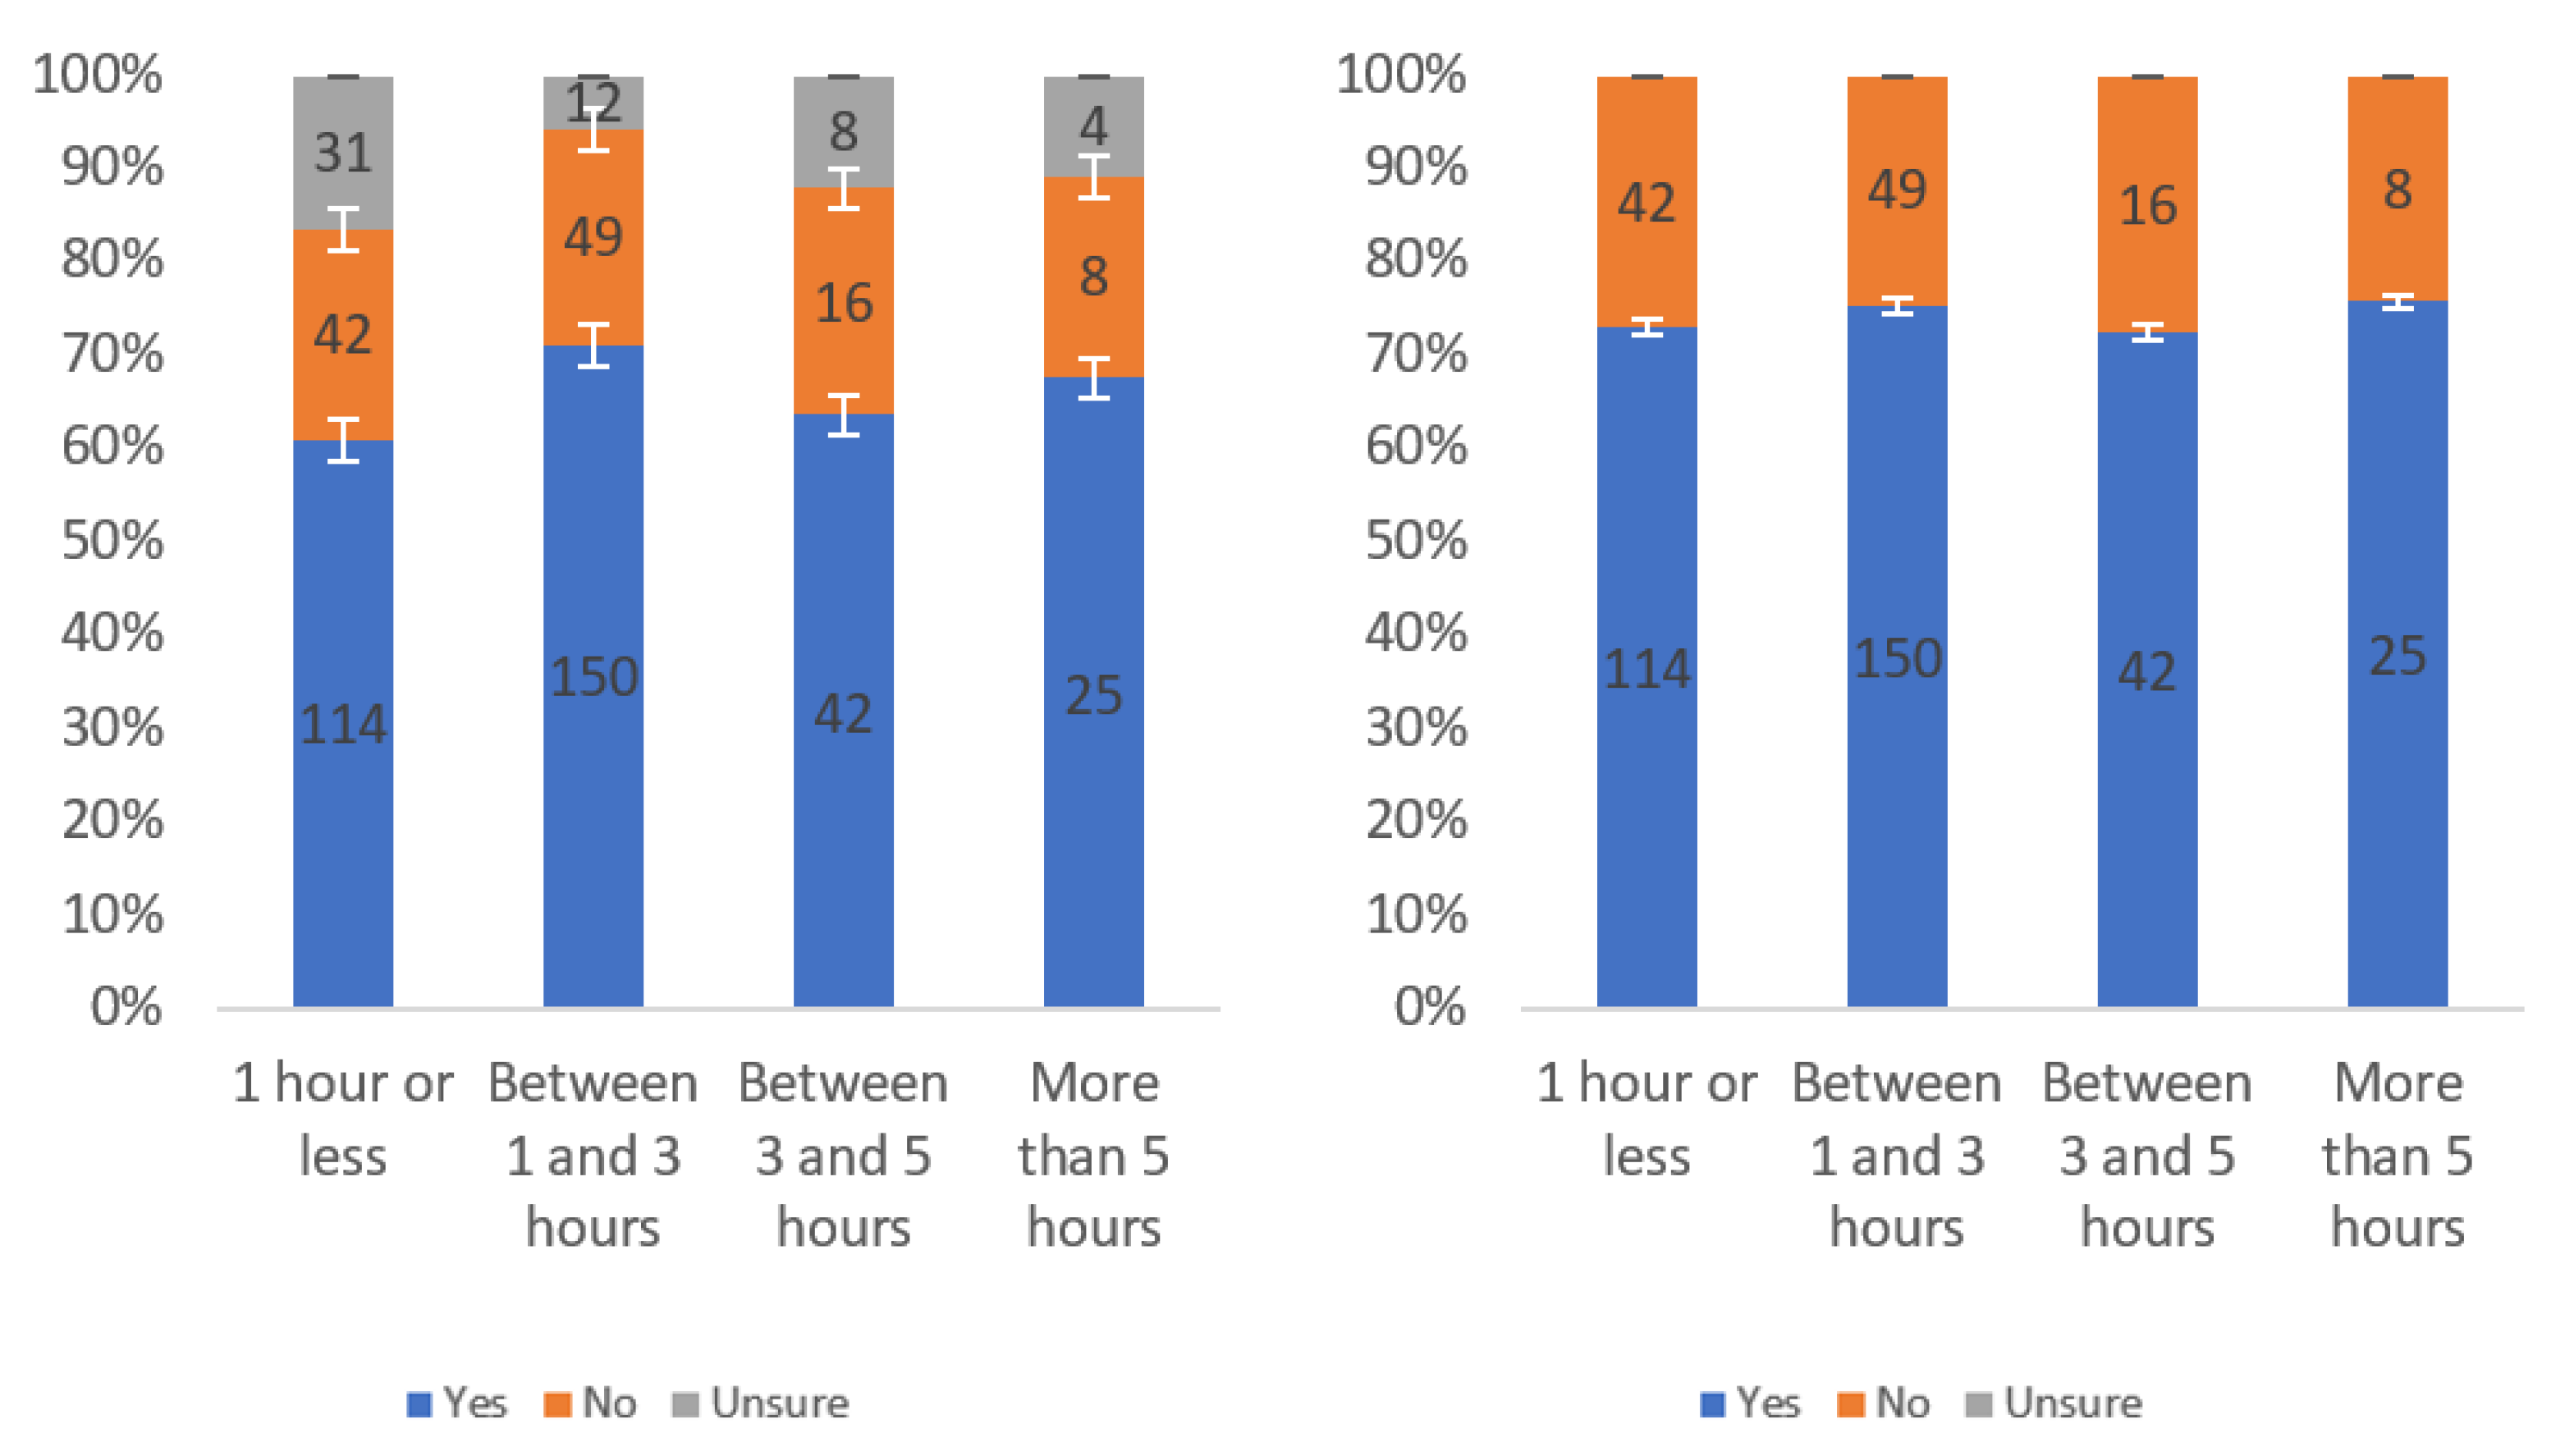
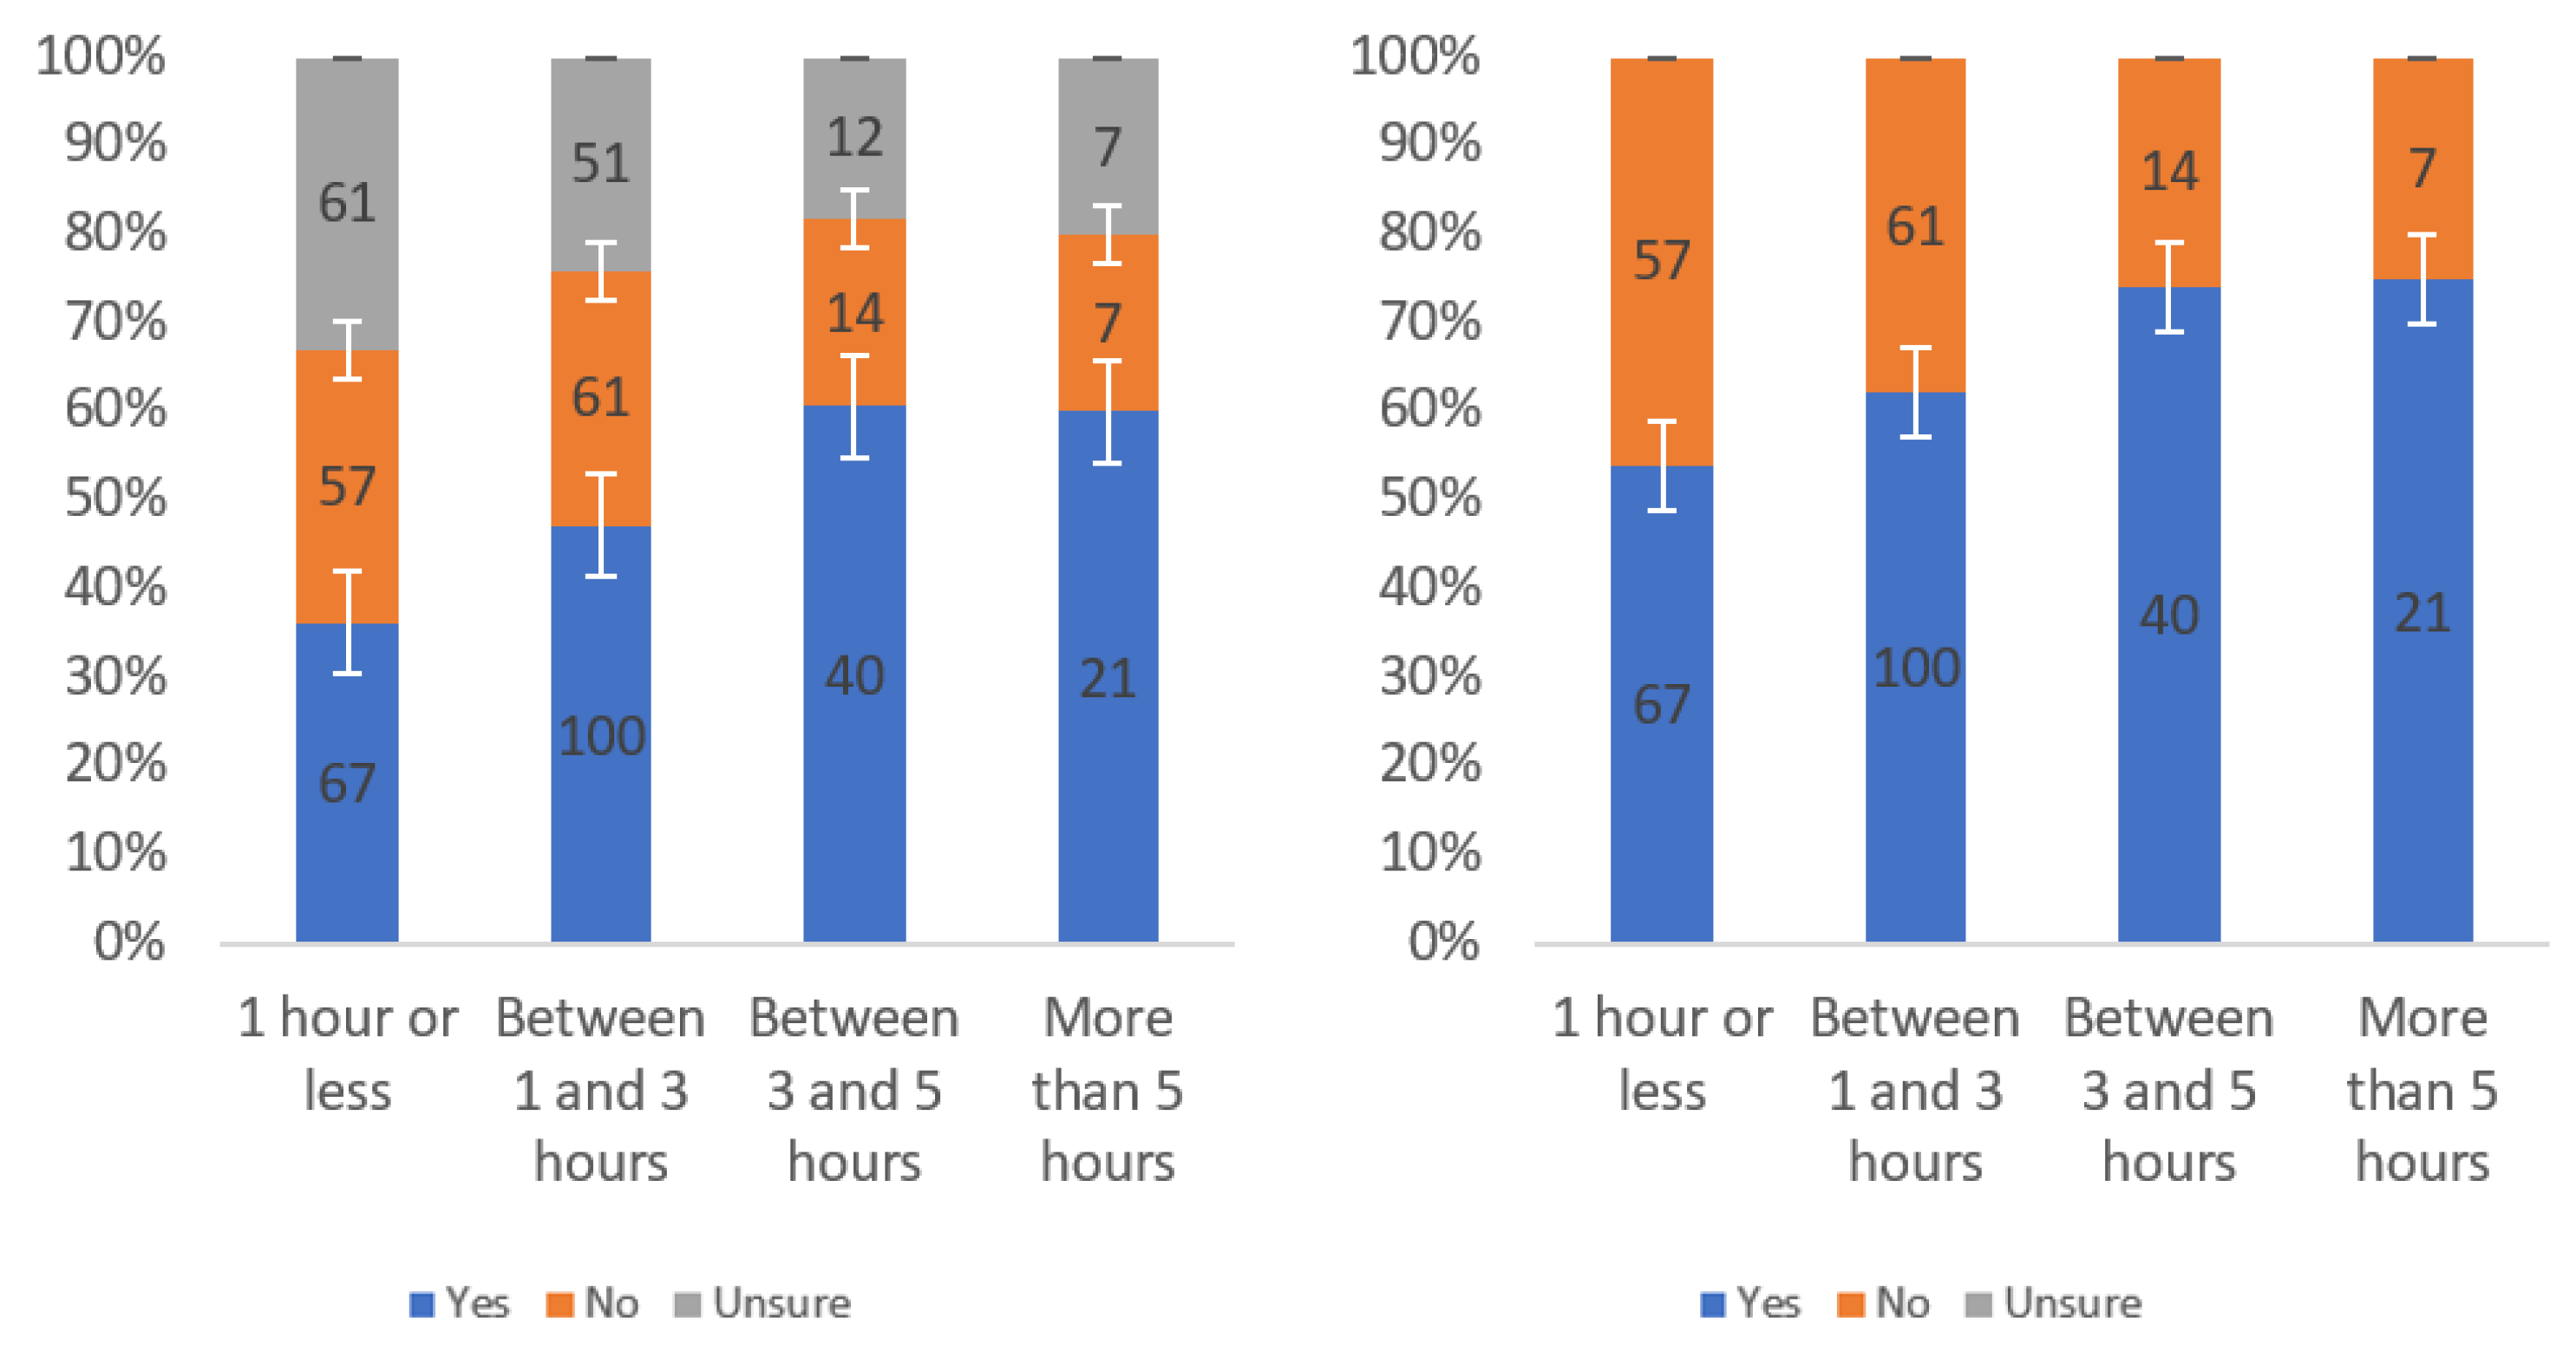
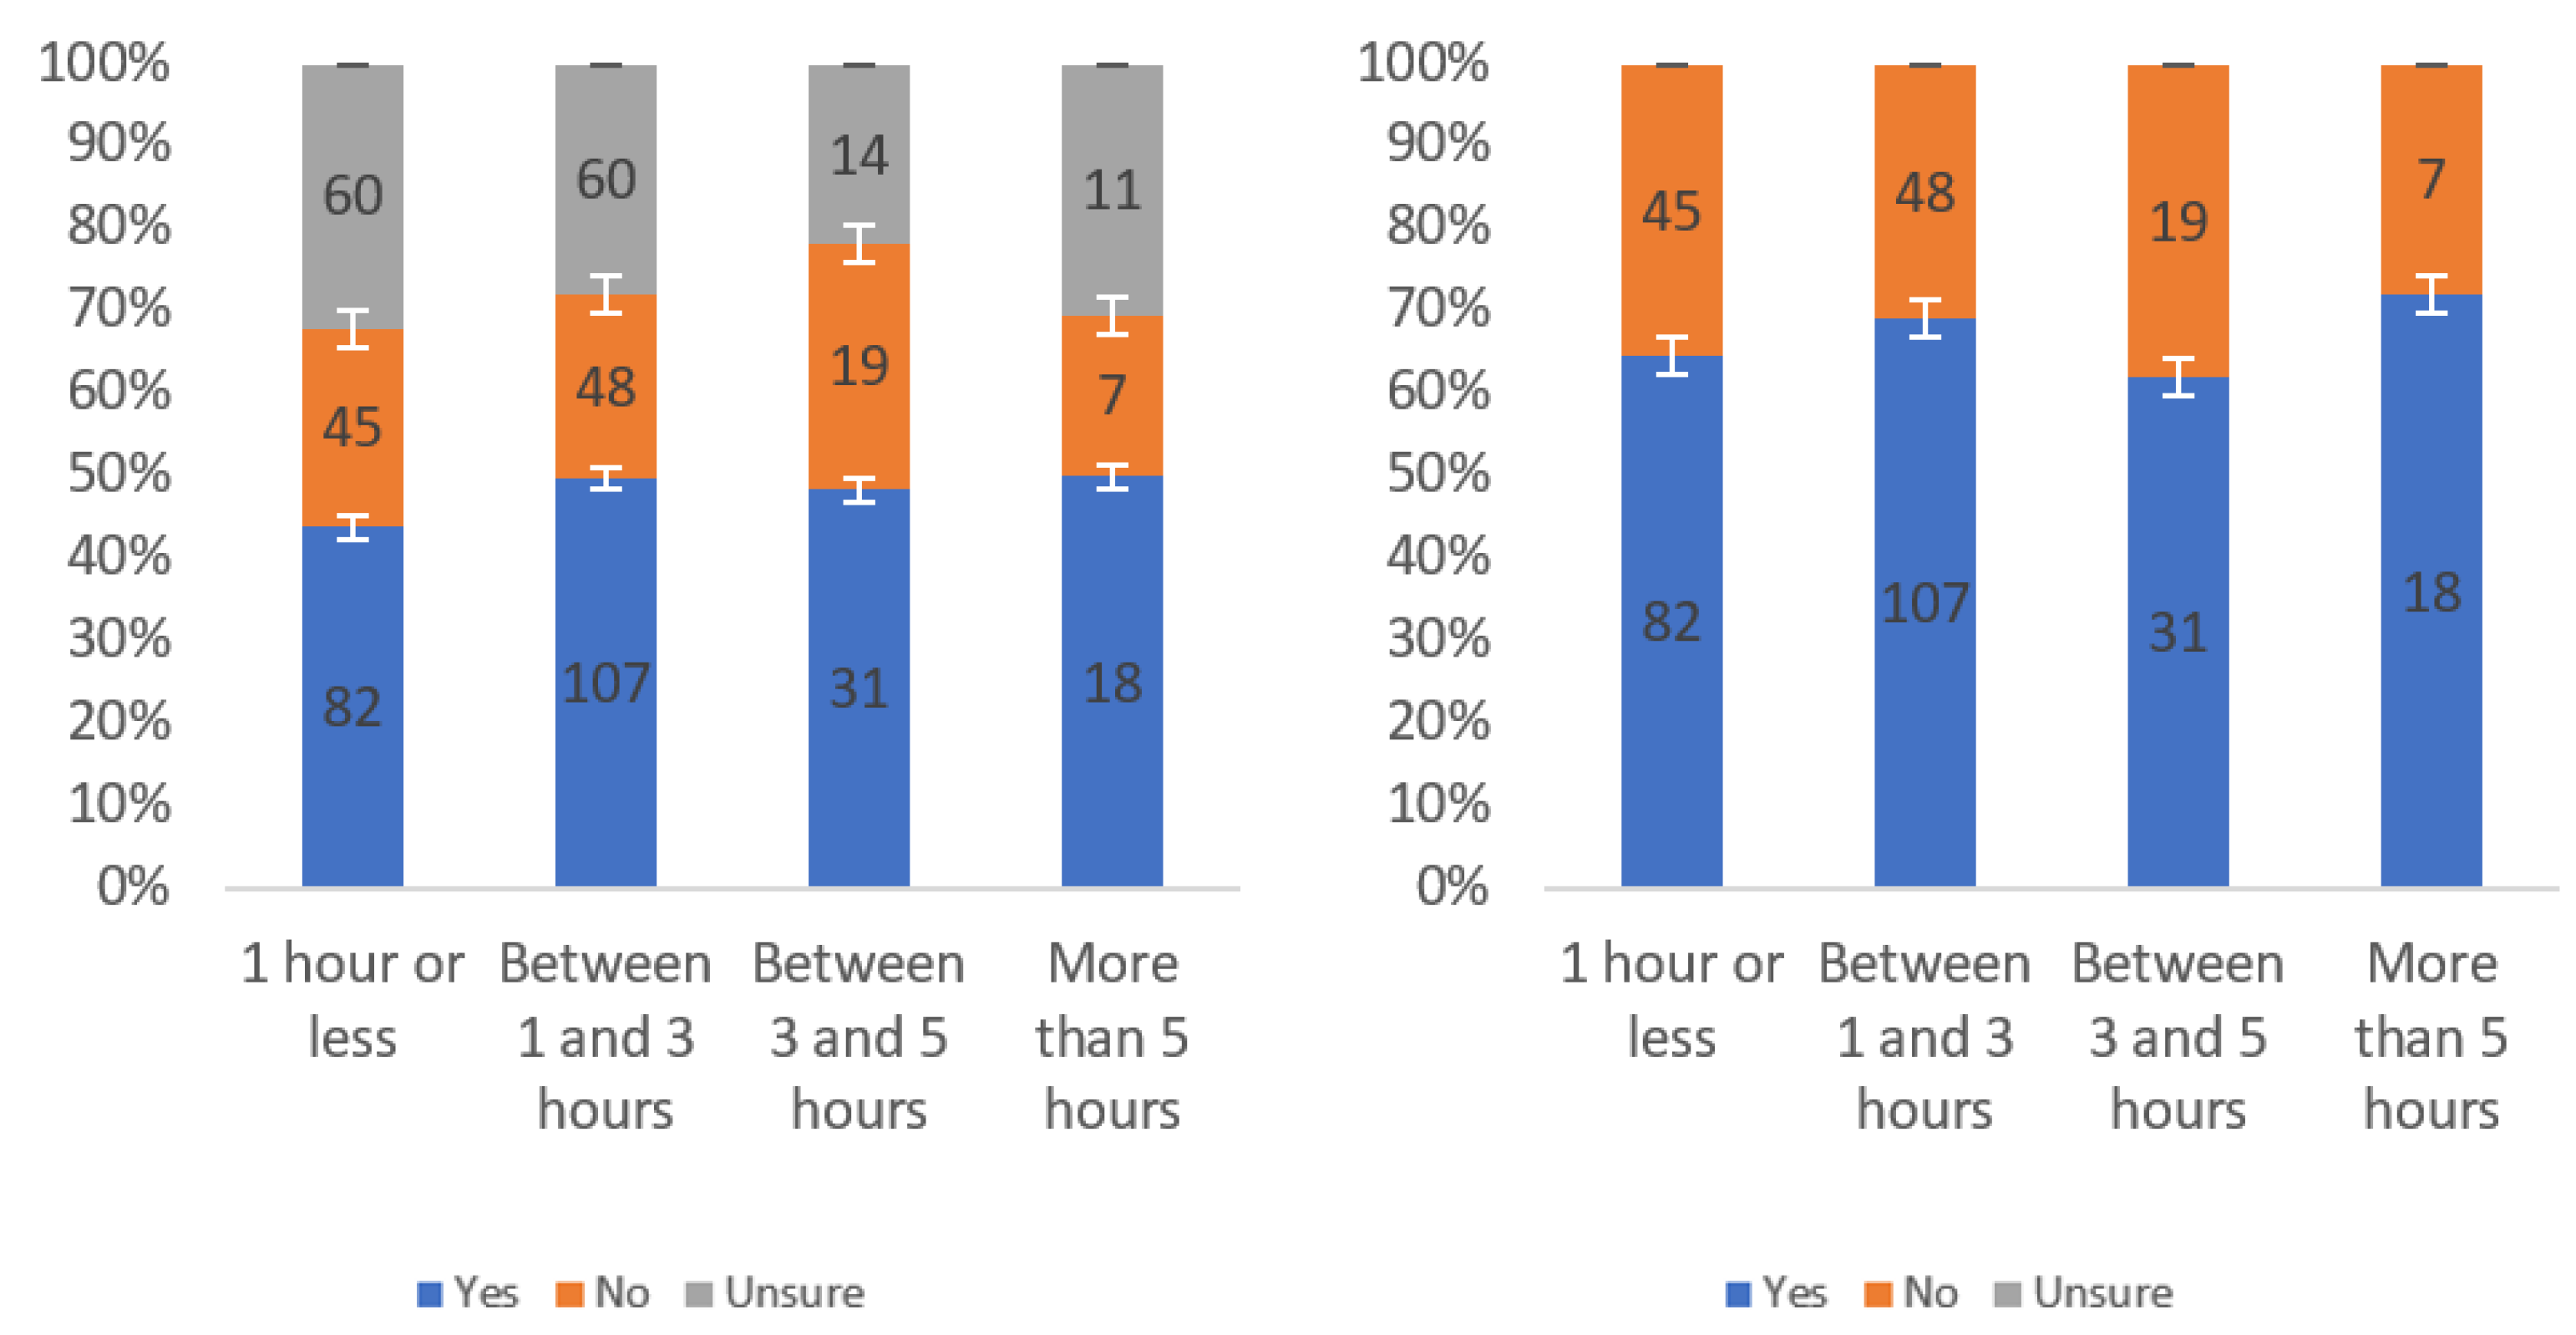
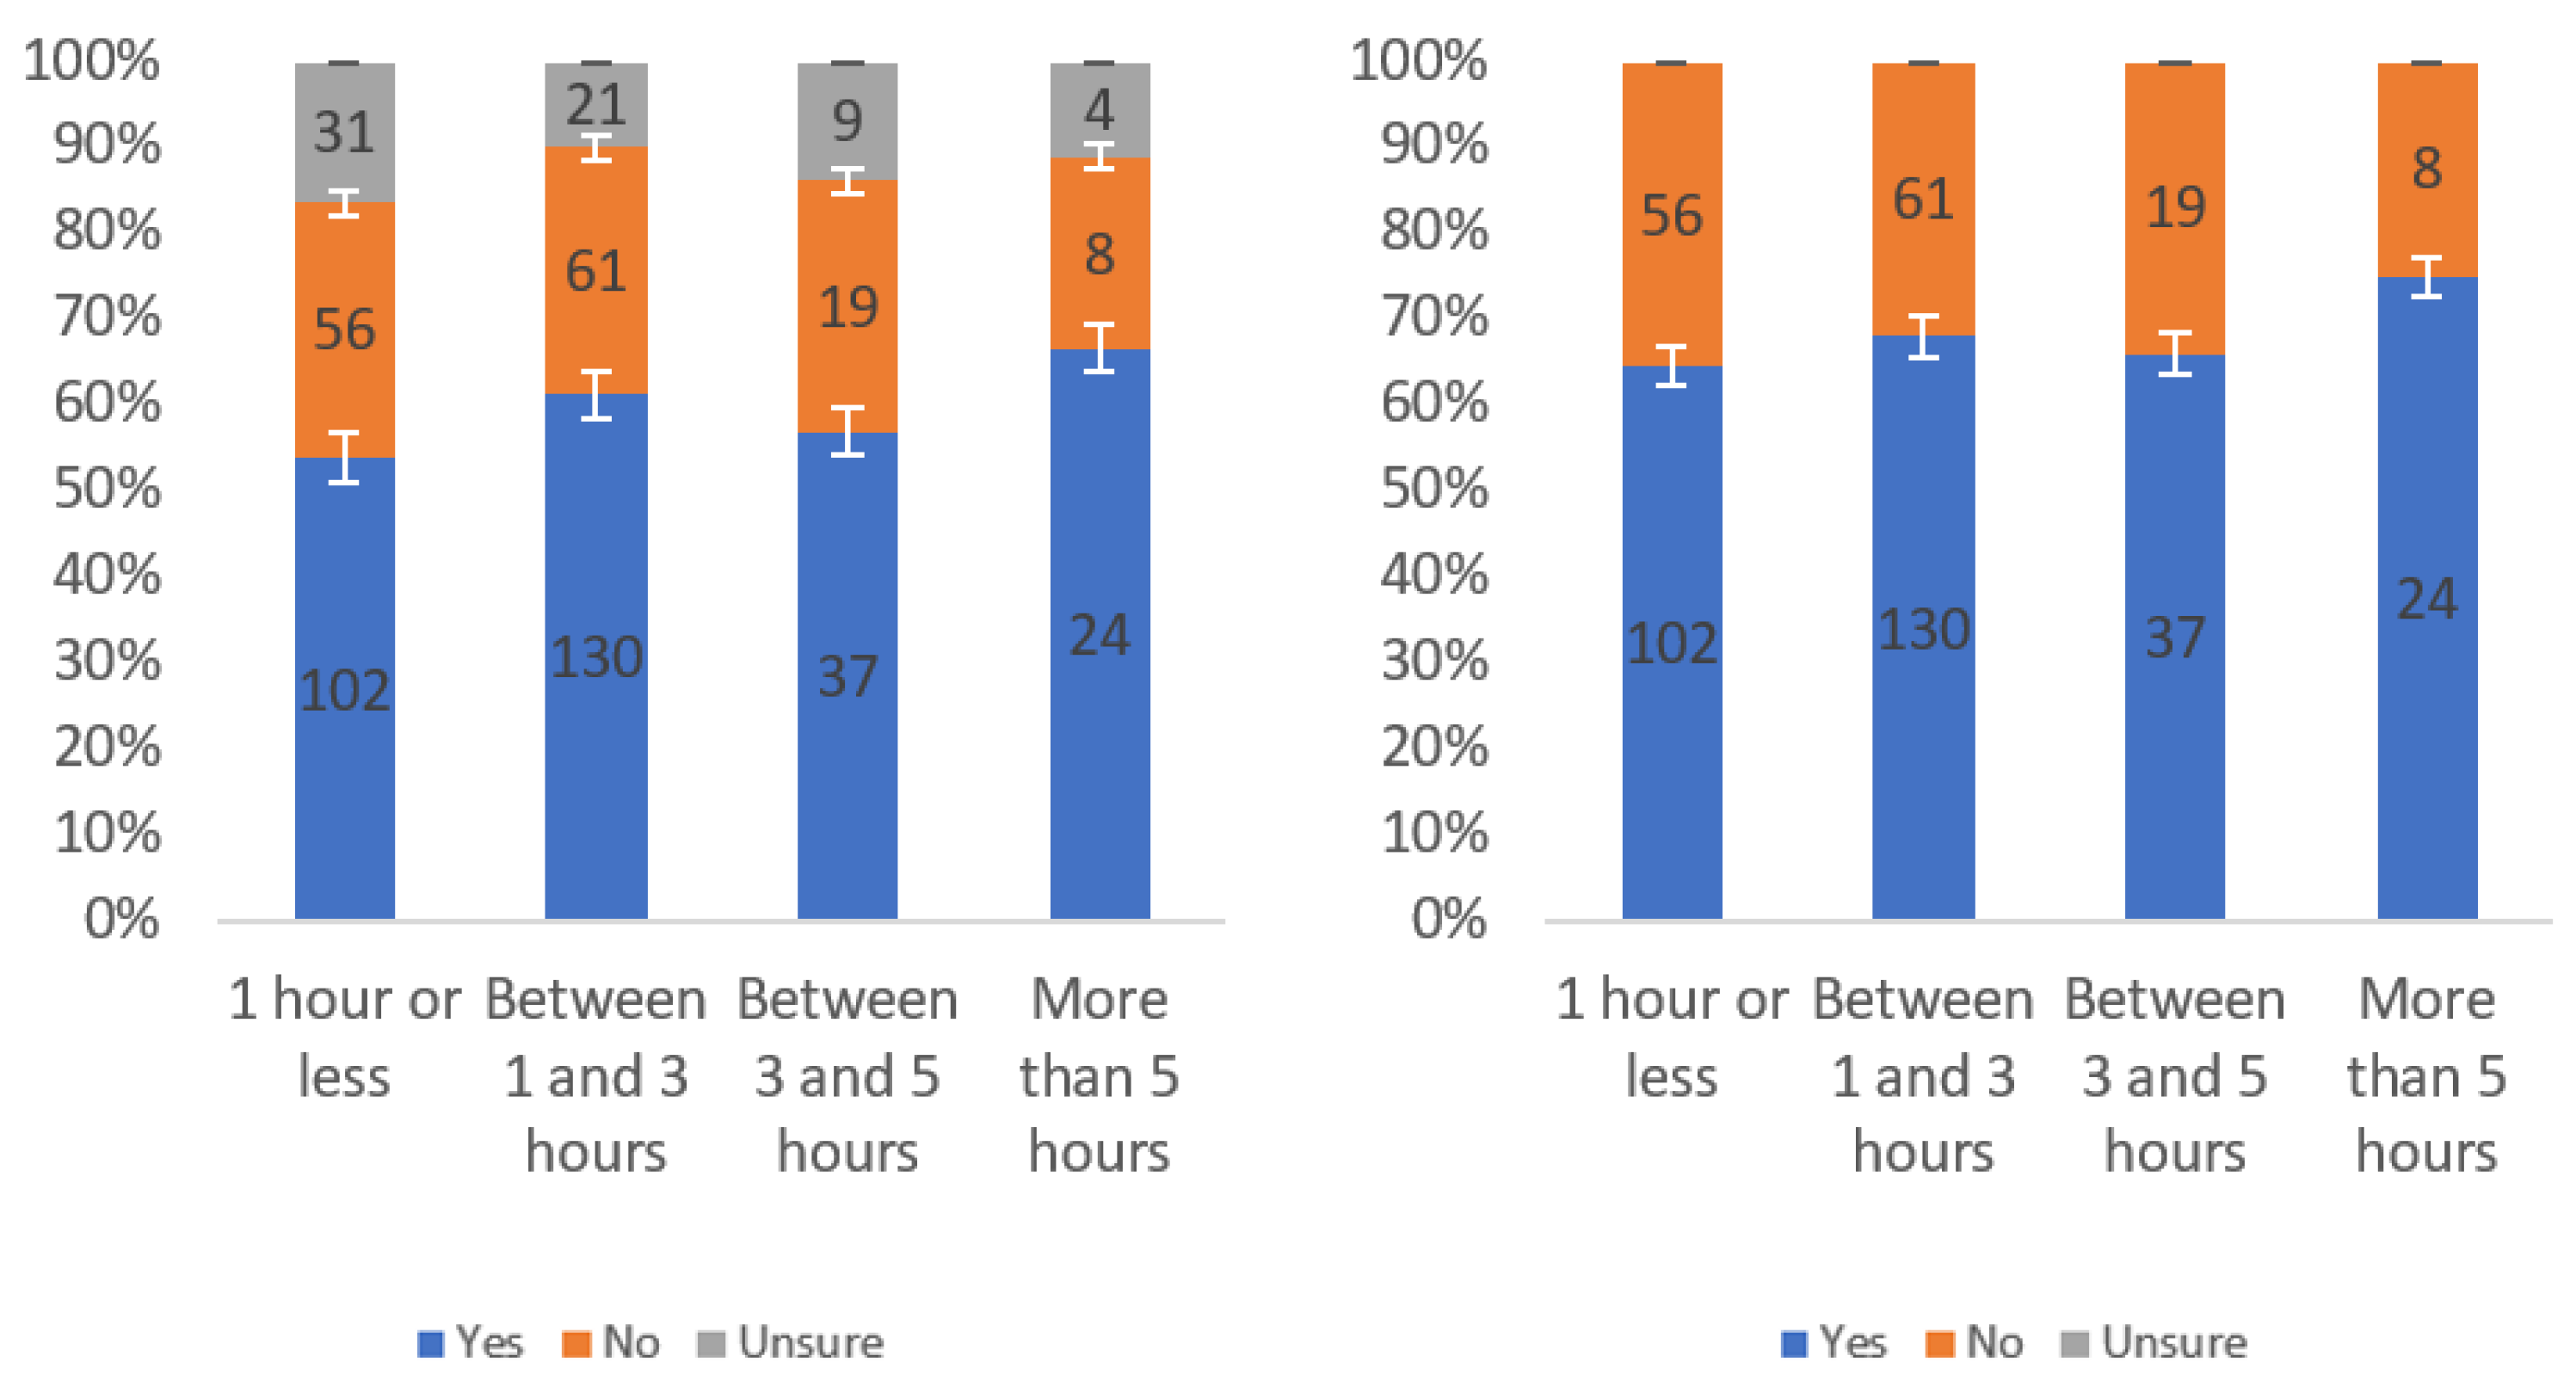
Figure 15.
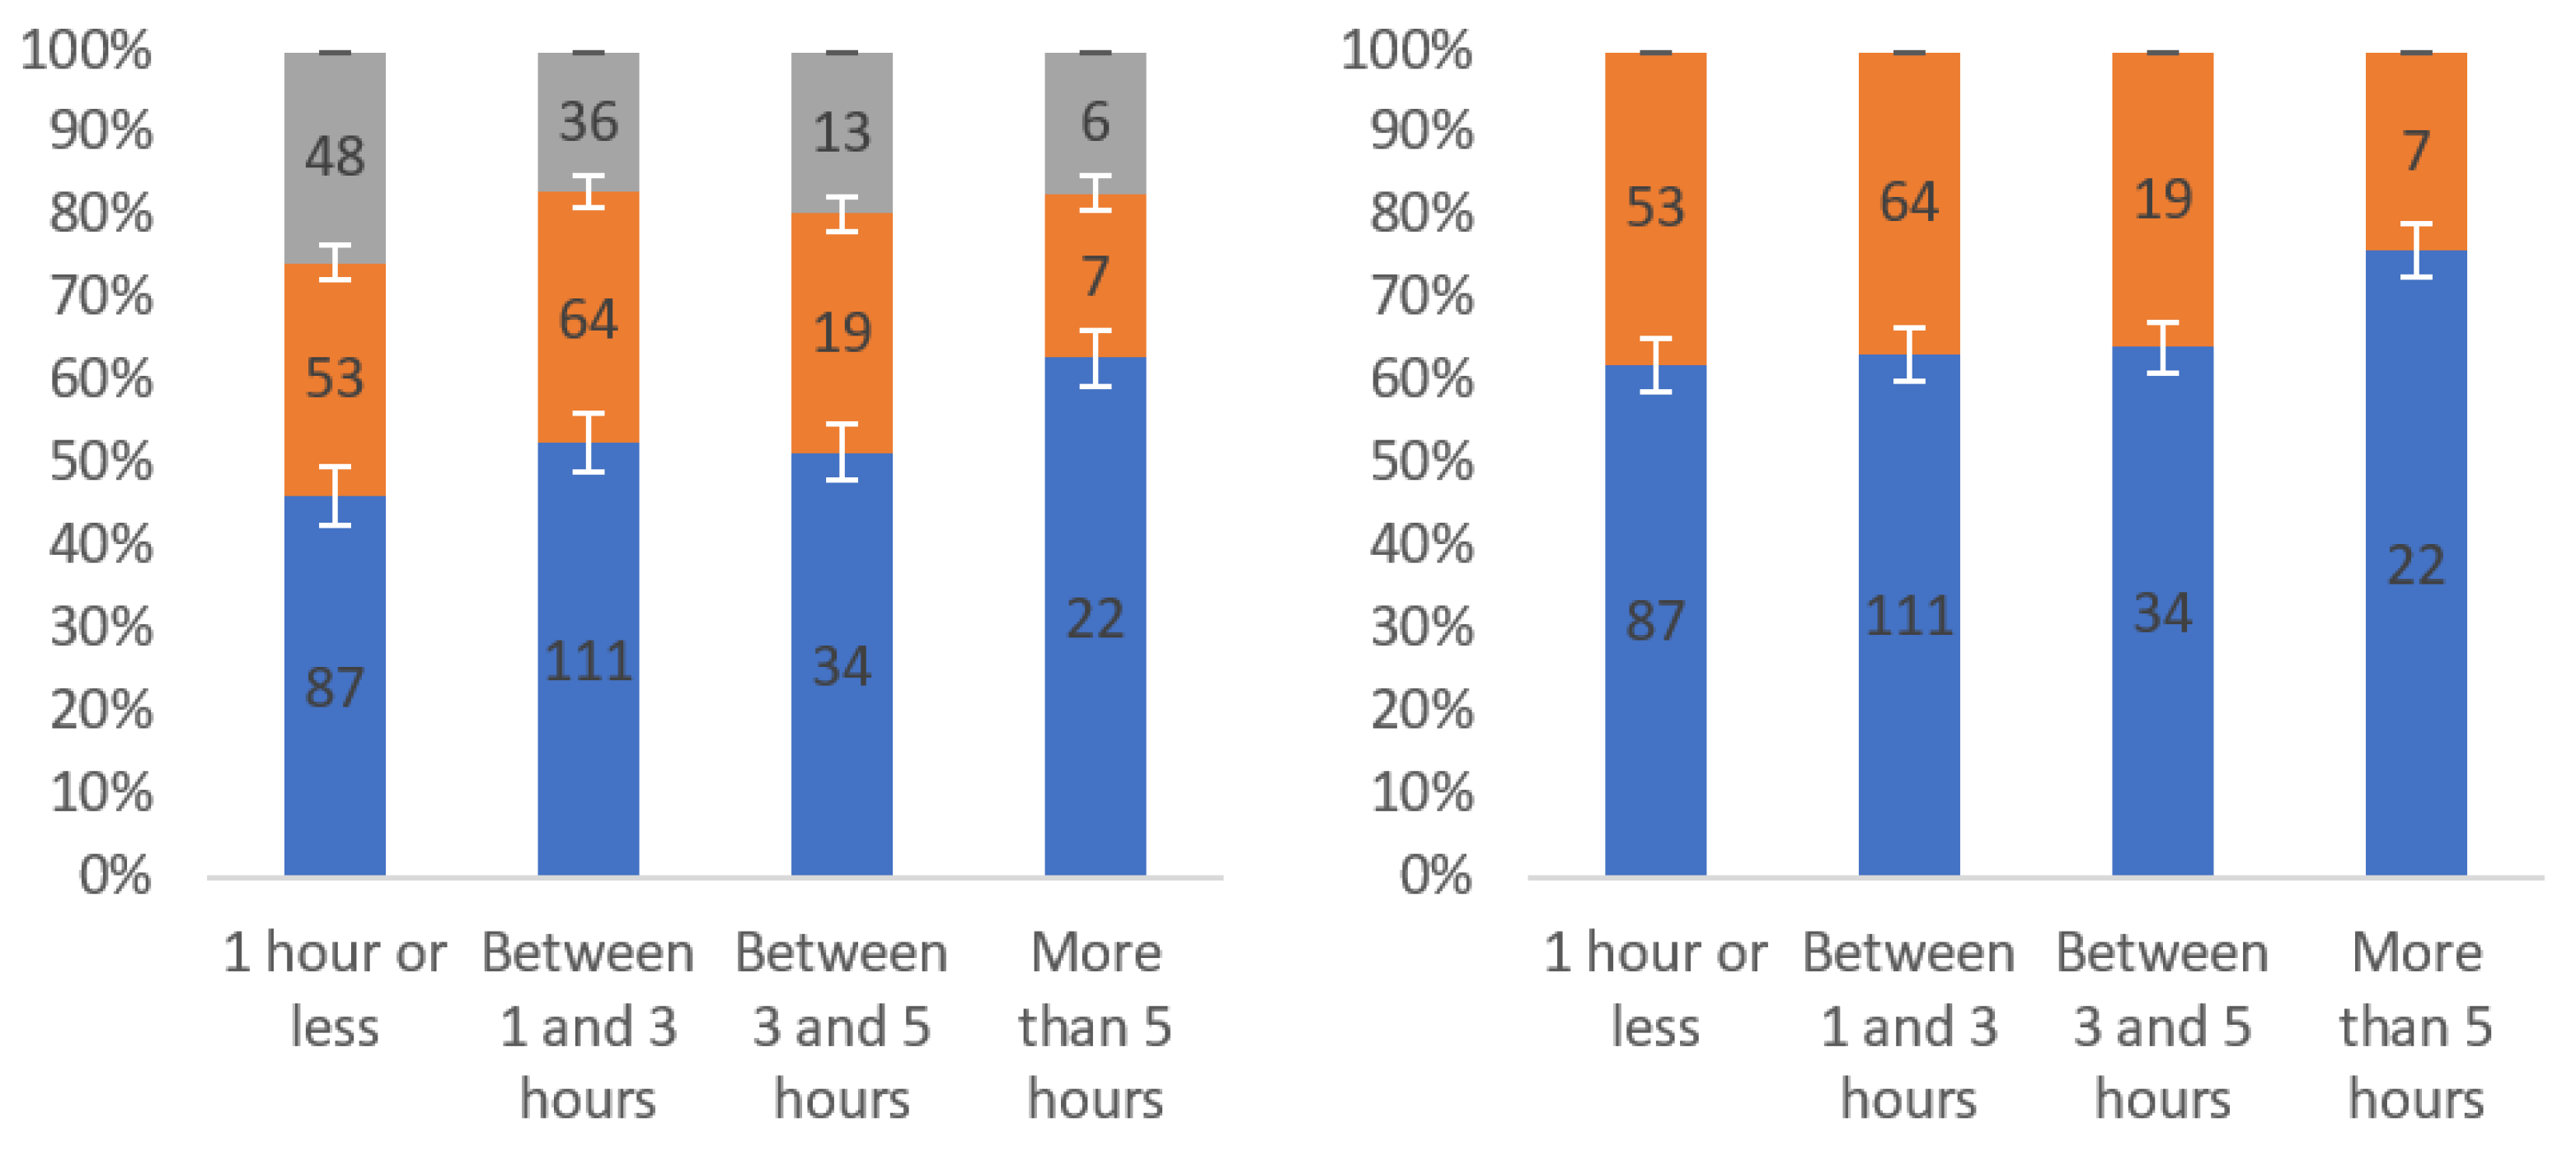
Responses regarding respondents’ willingness to review by internet usage level including (left) and excluding (right) unsure responses.
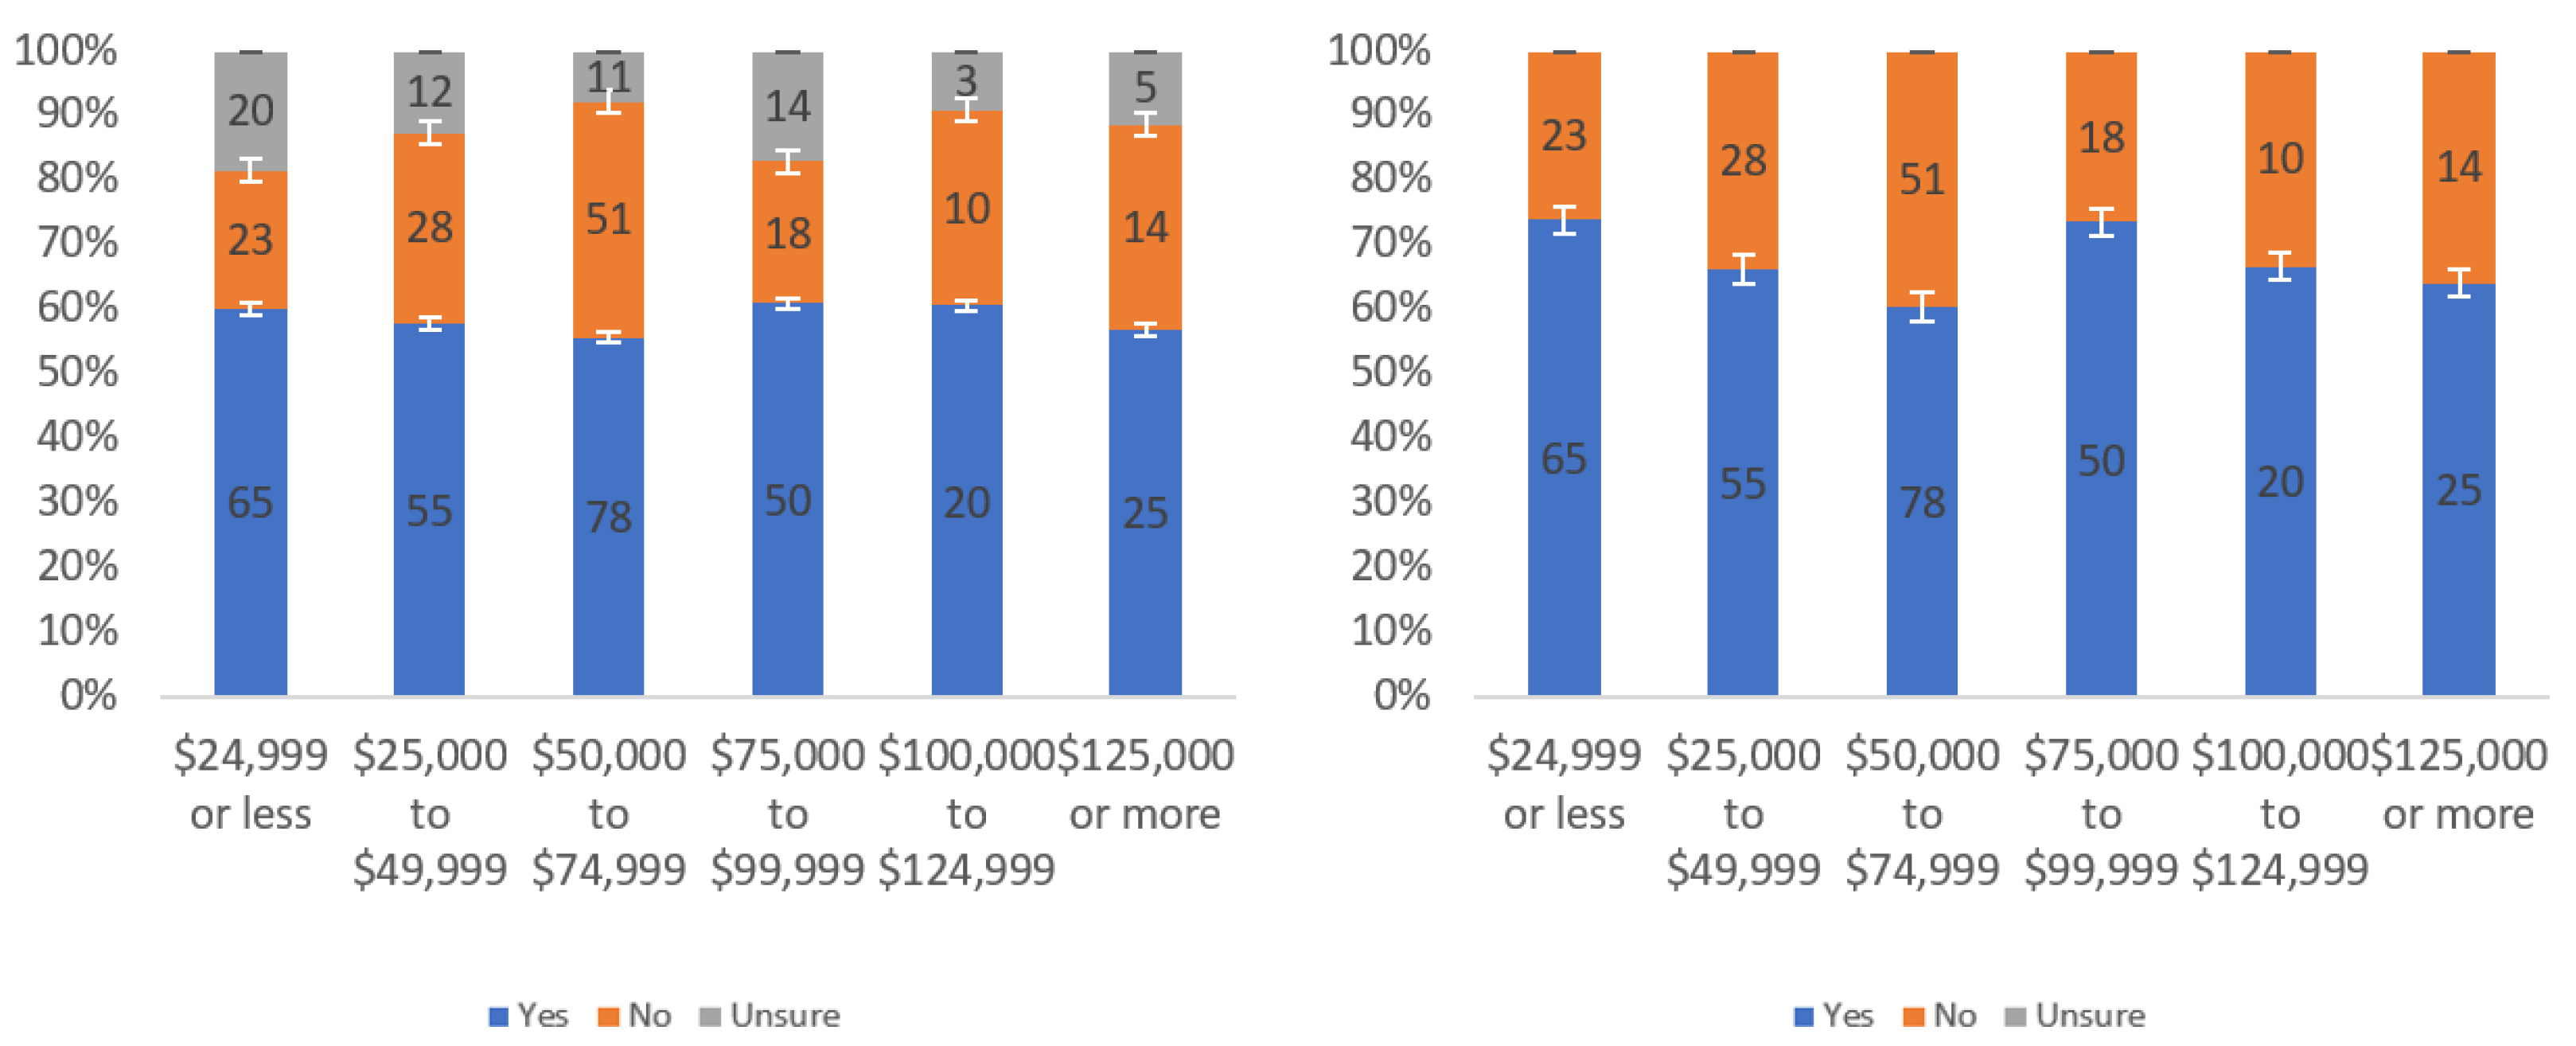
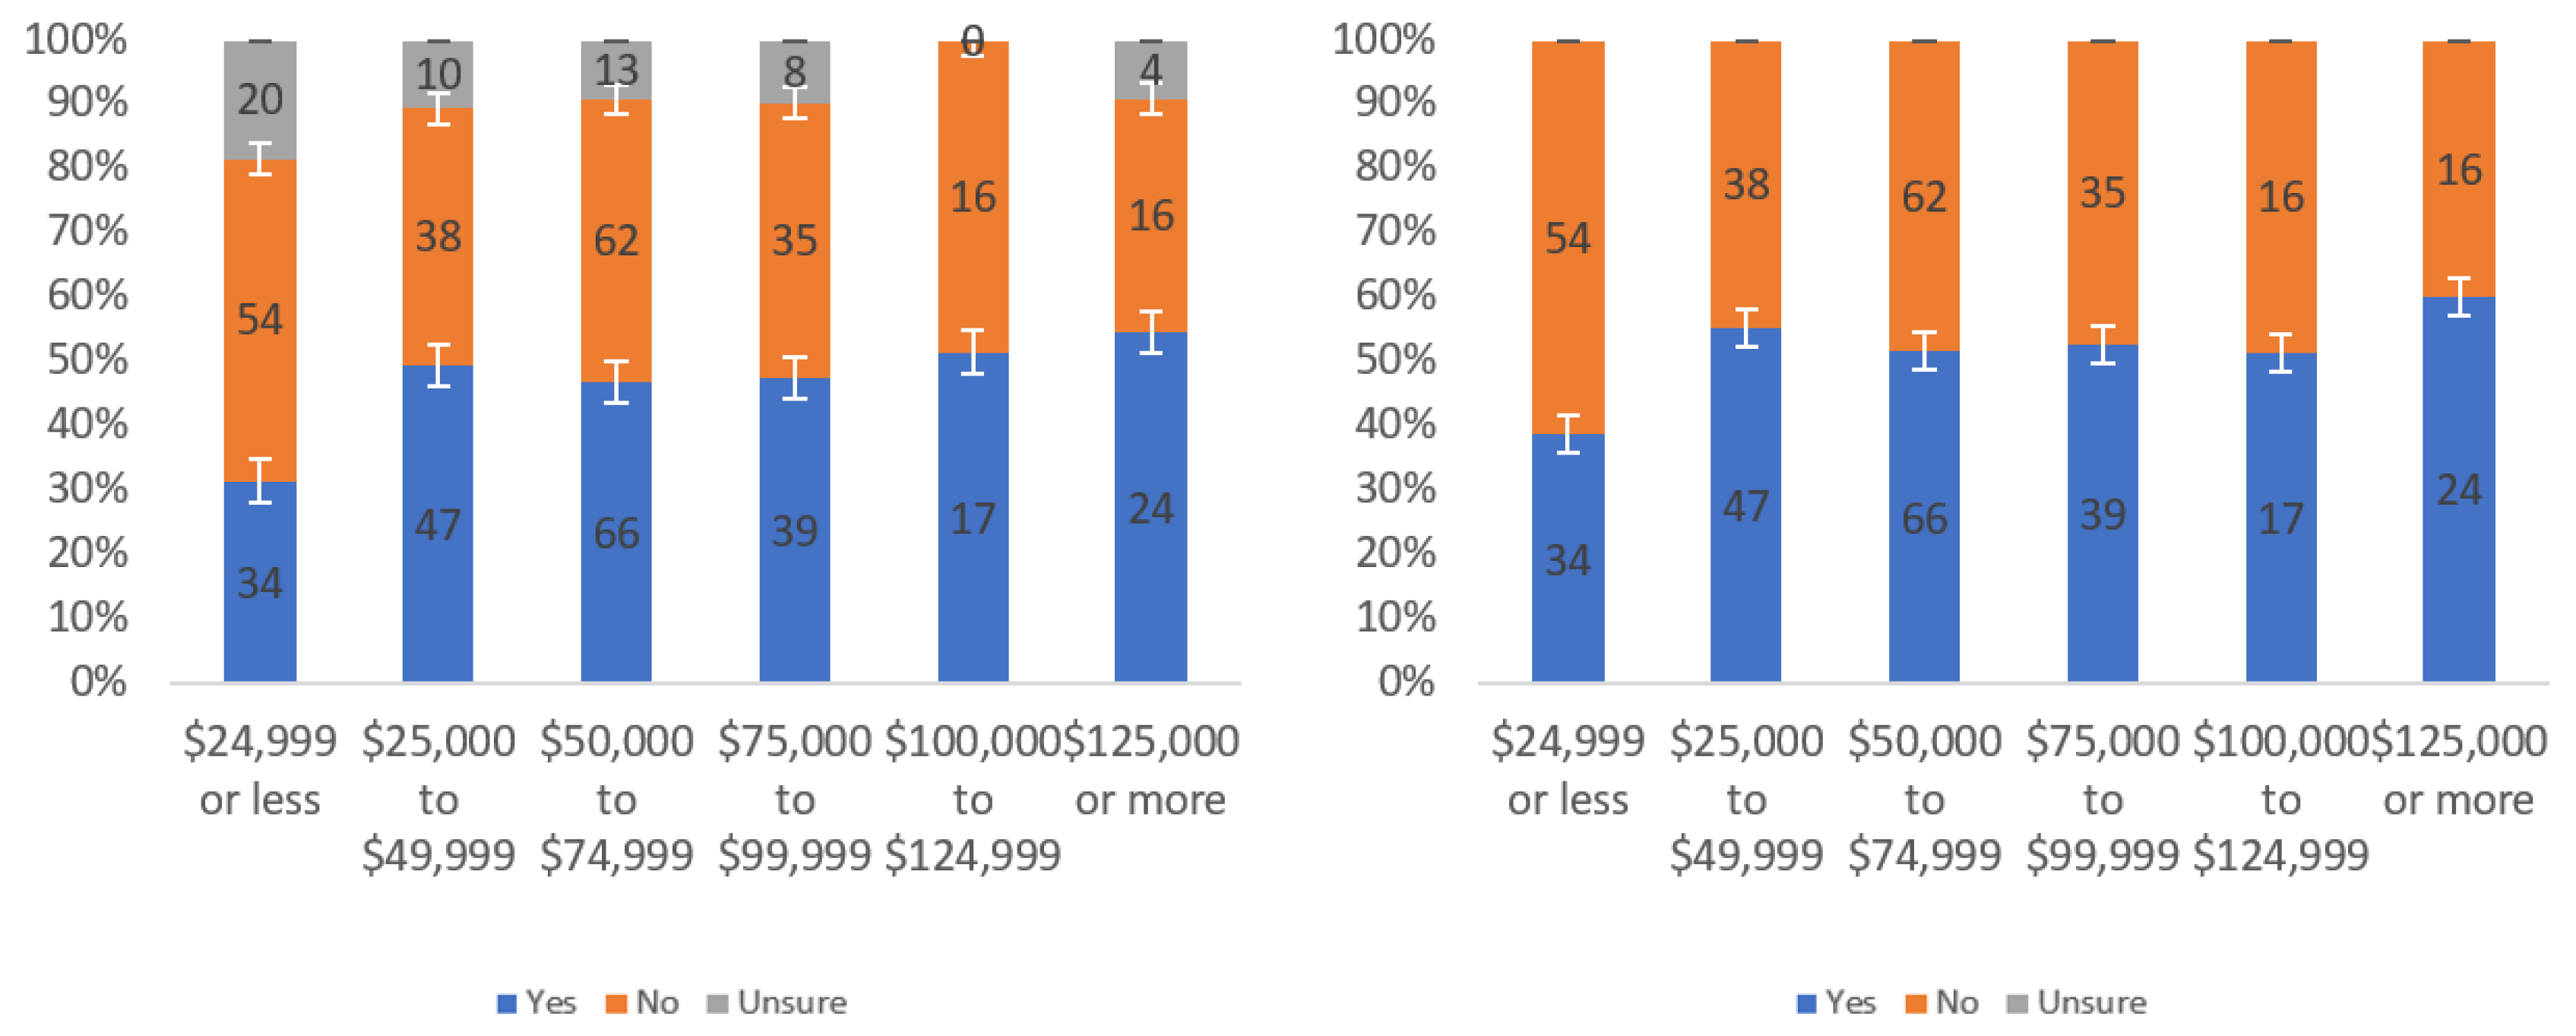
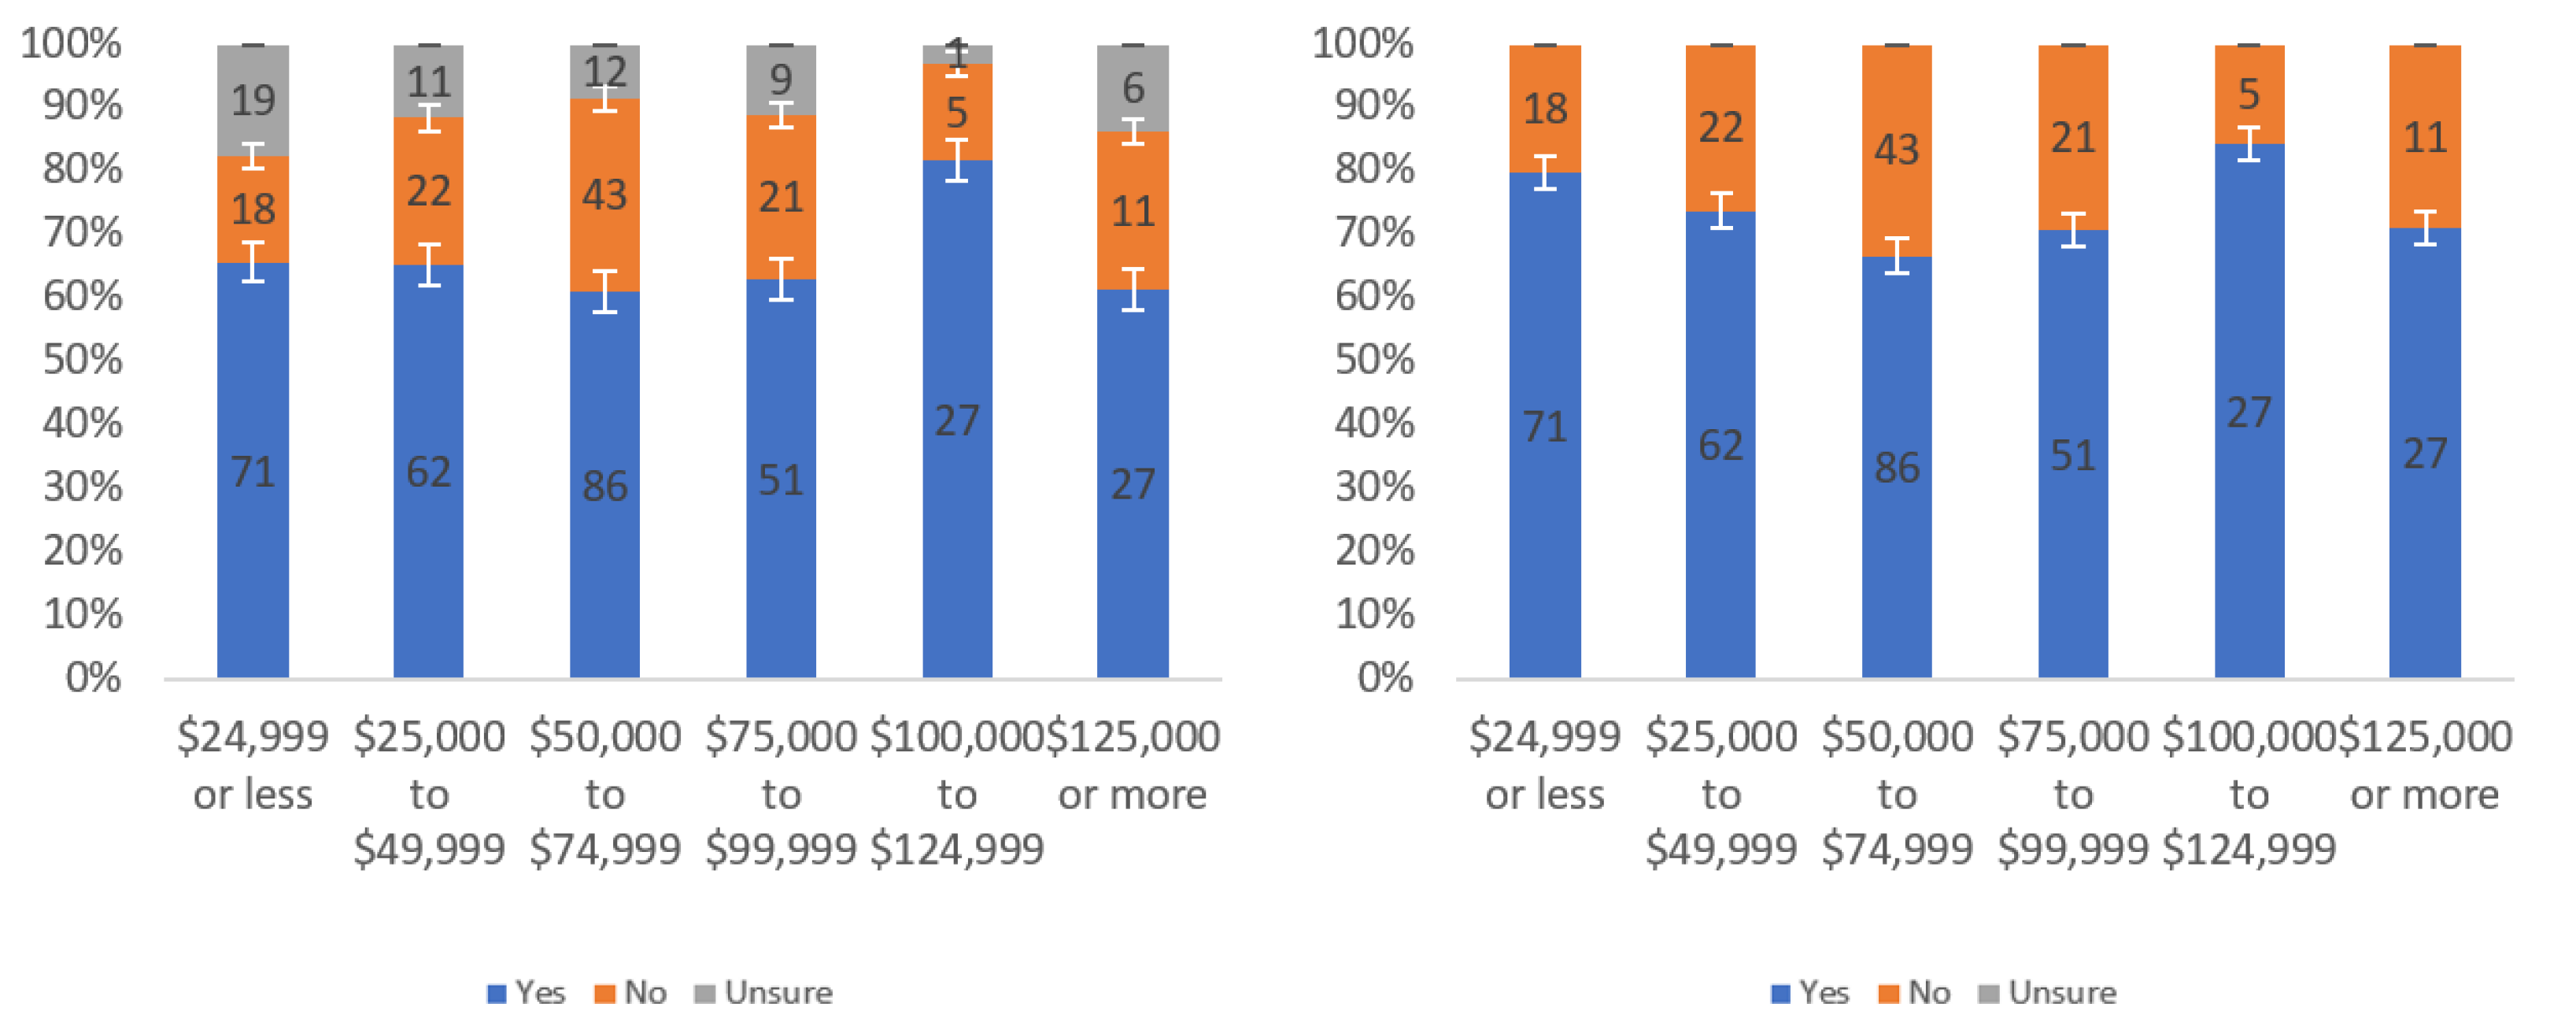
Figure 16.
Responses regarding others’ willingness to review by income level including (left) and excluding (right) unsure responses.
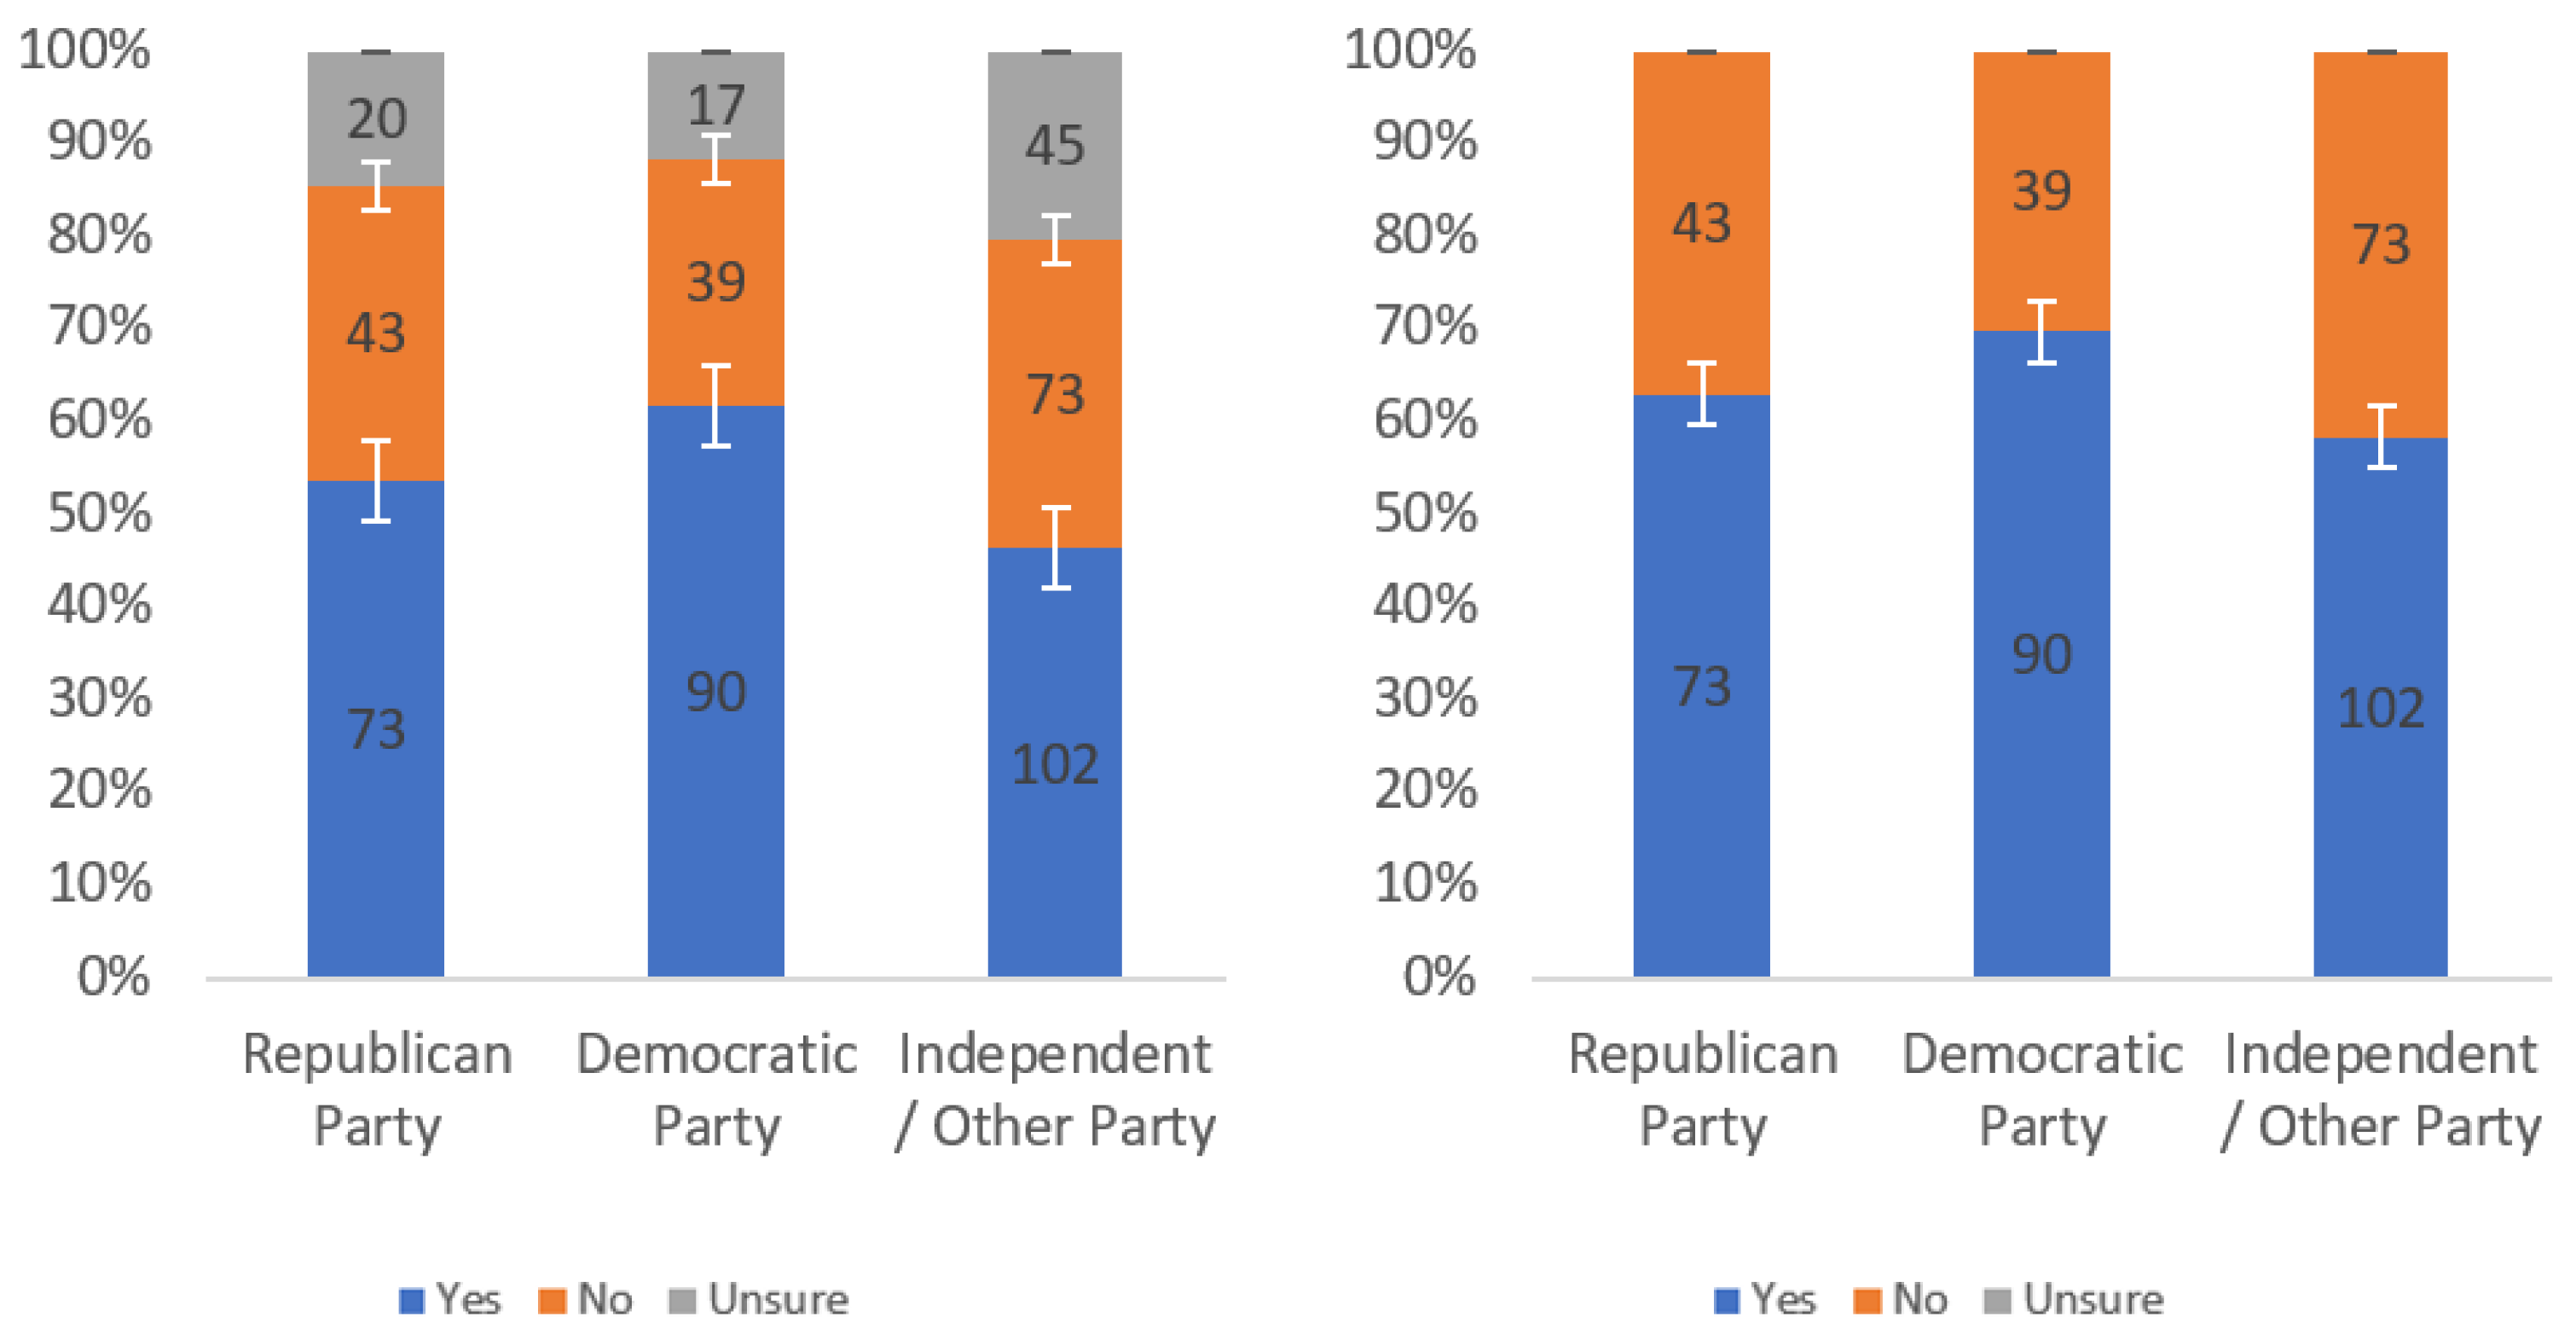
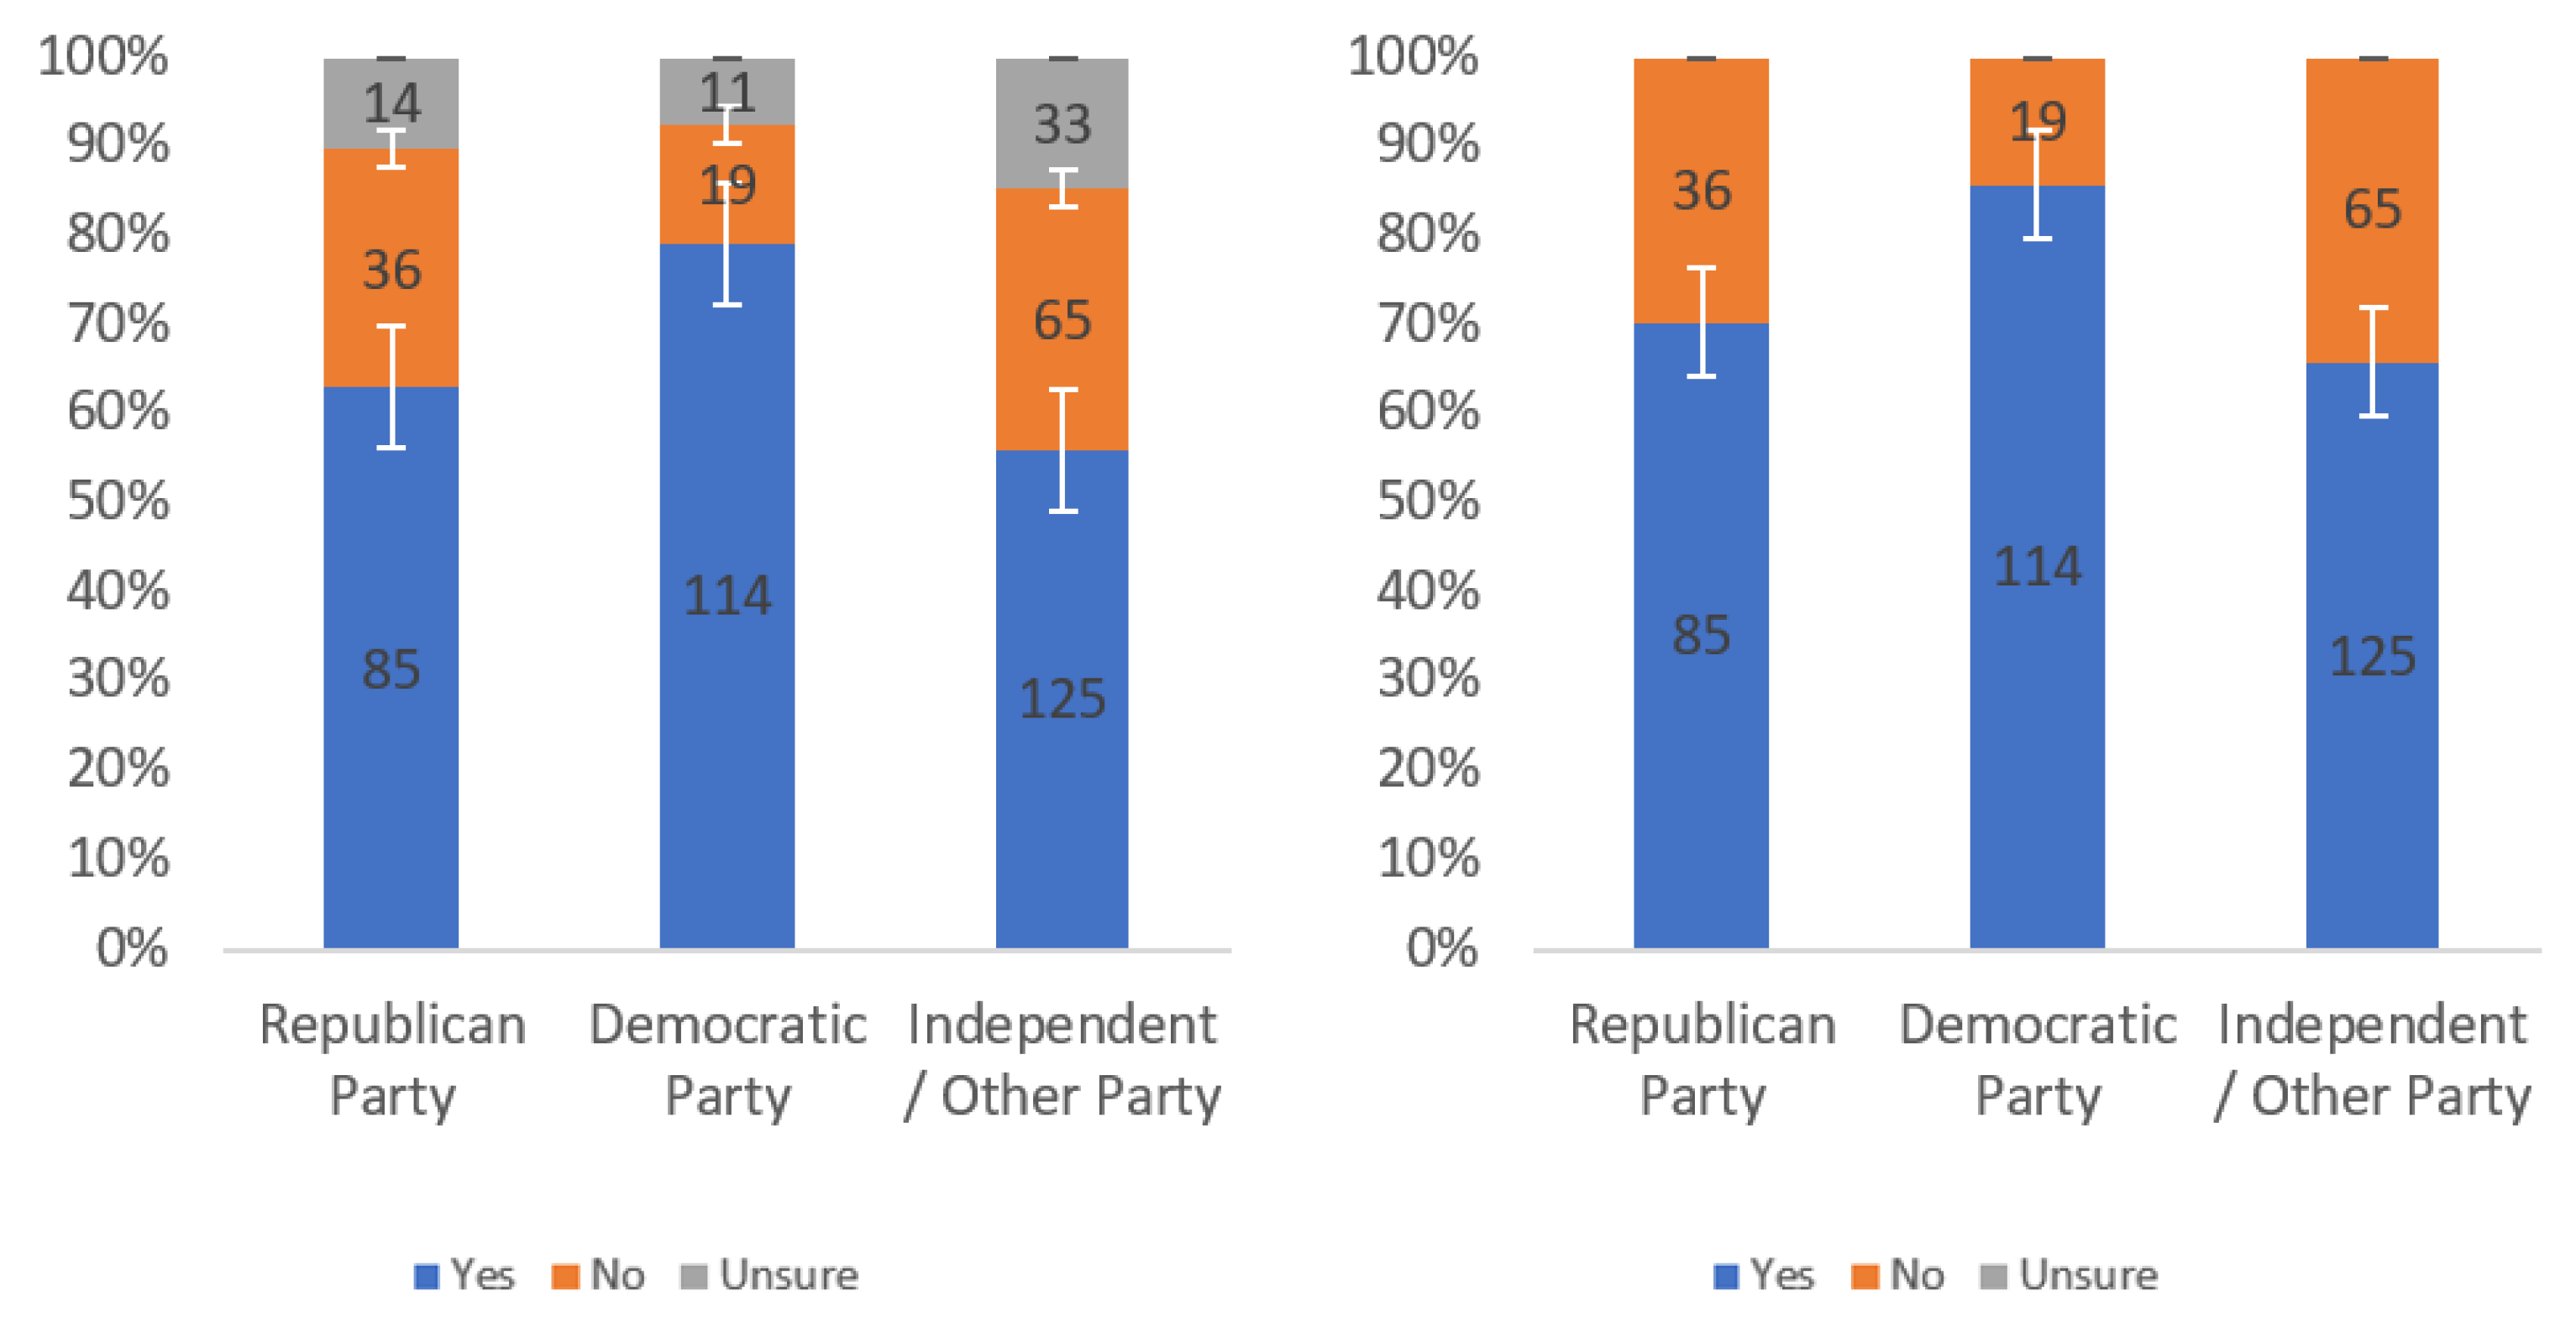
Figure 17.
Responses regarding others’ willingness to review by party affiliation including (left) and excluding (right) unsure responses.
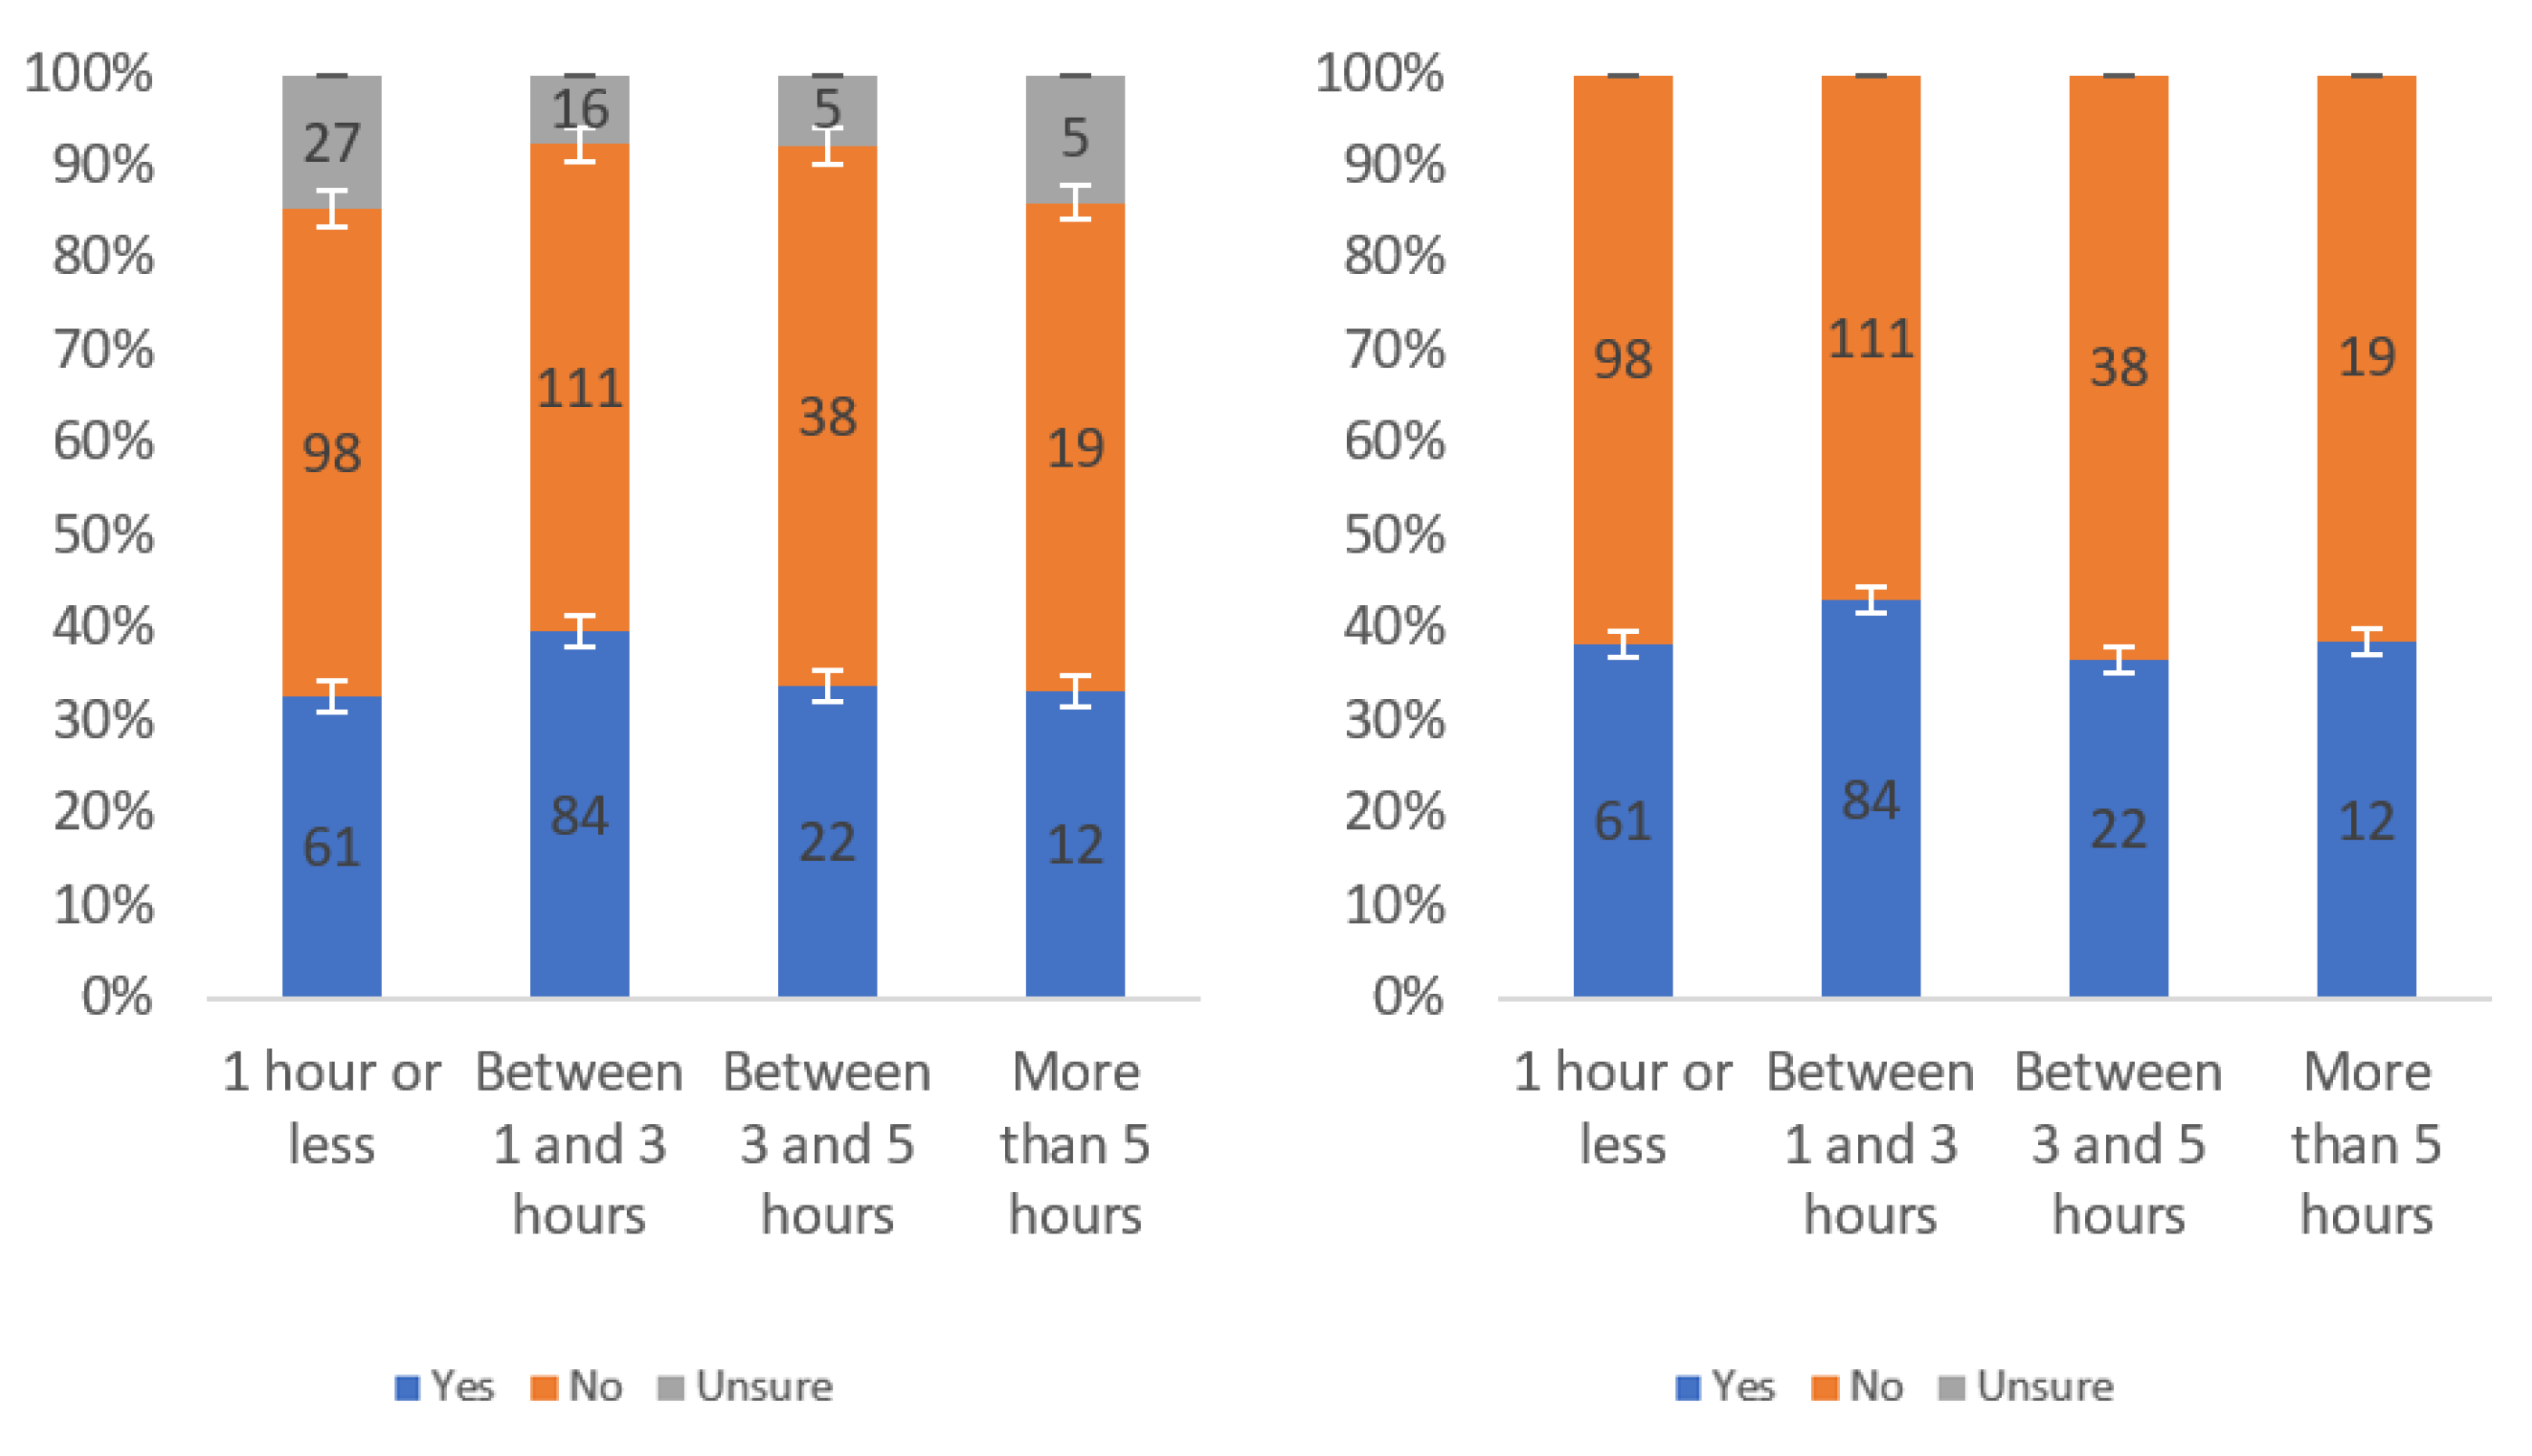
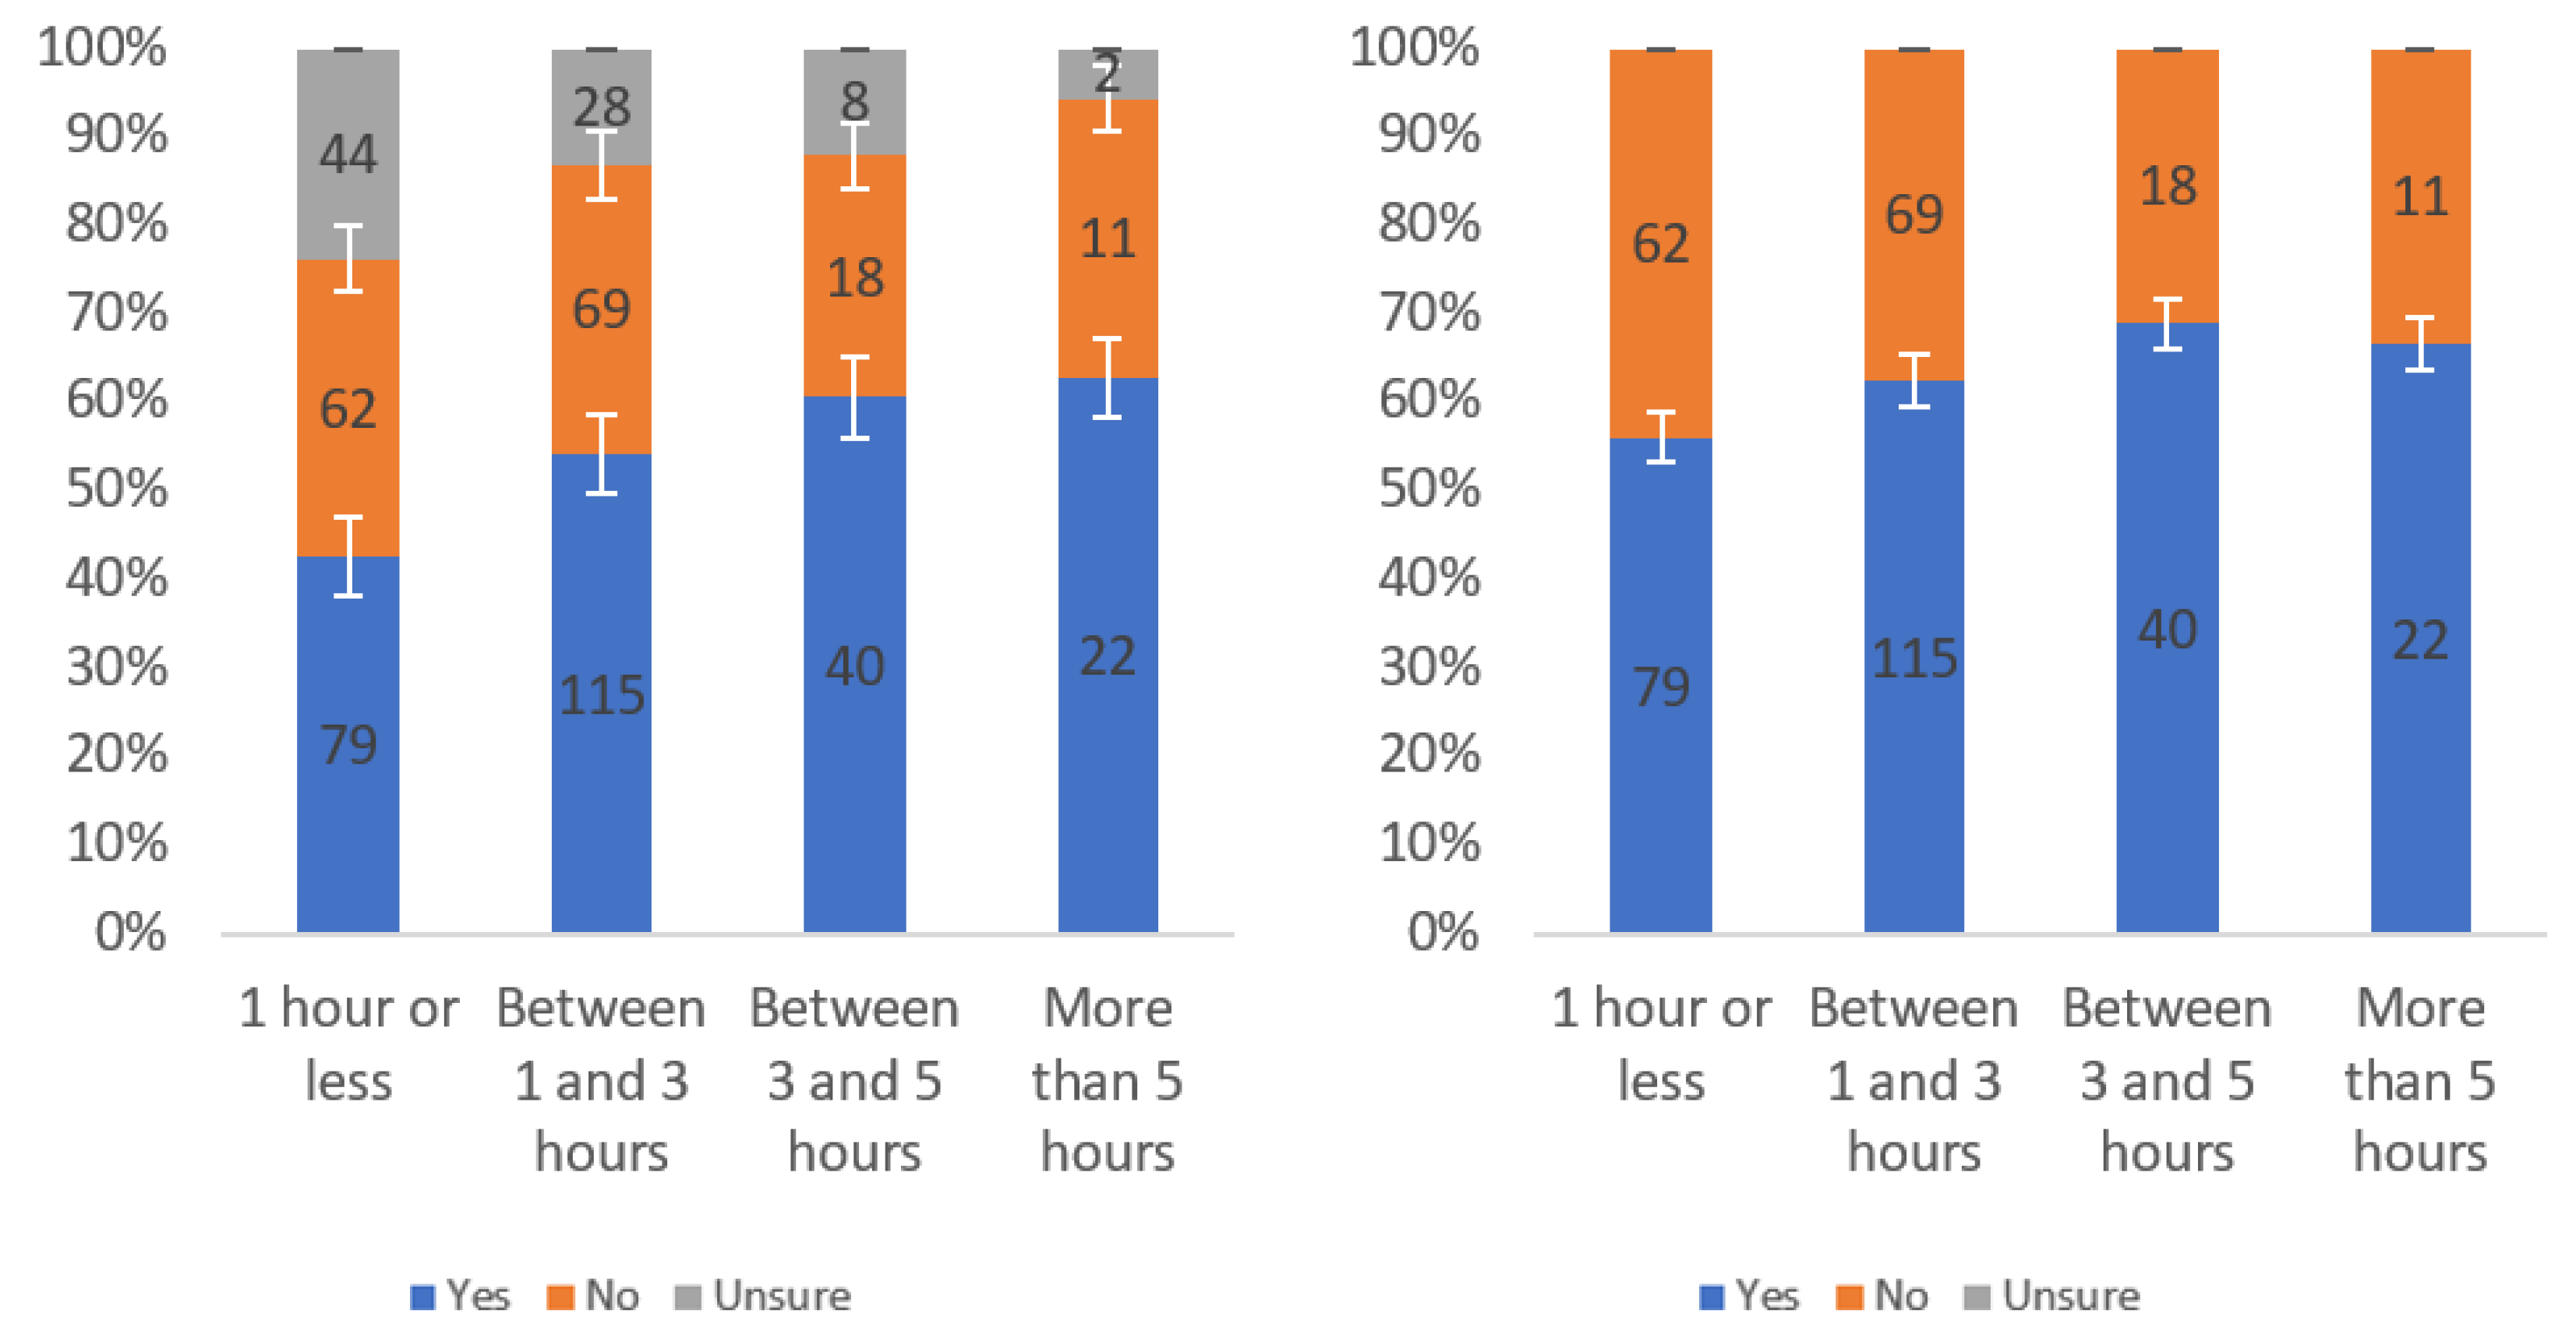
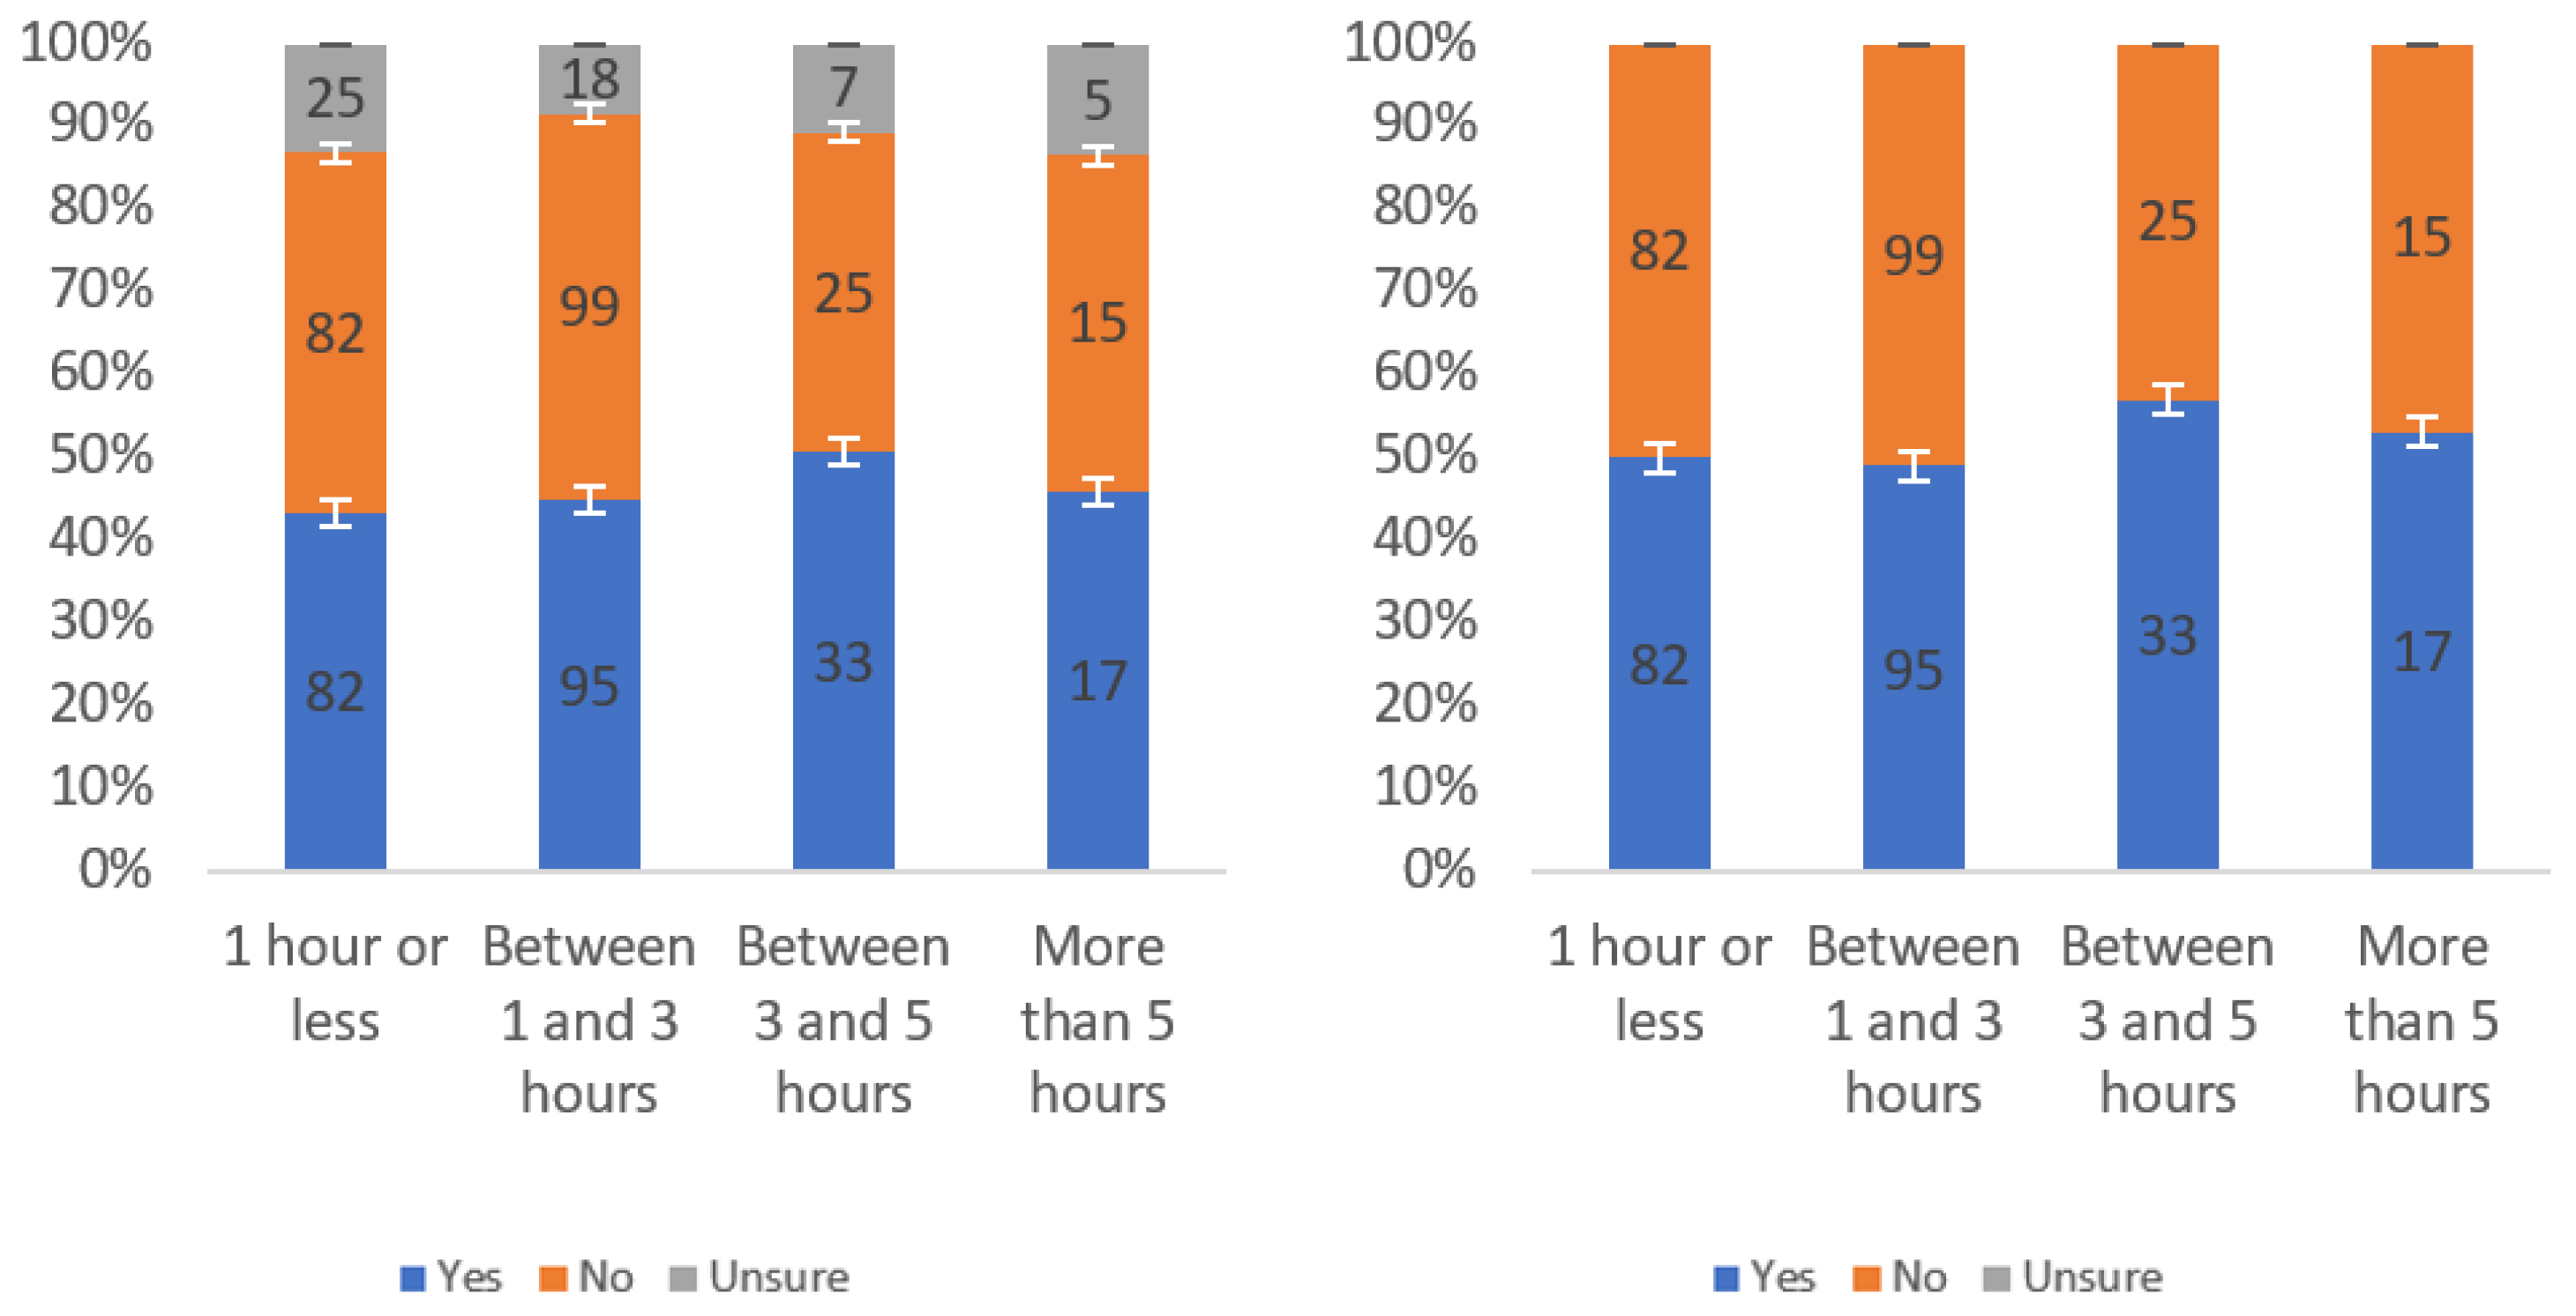
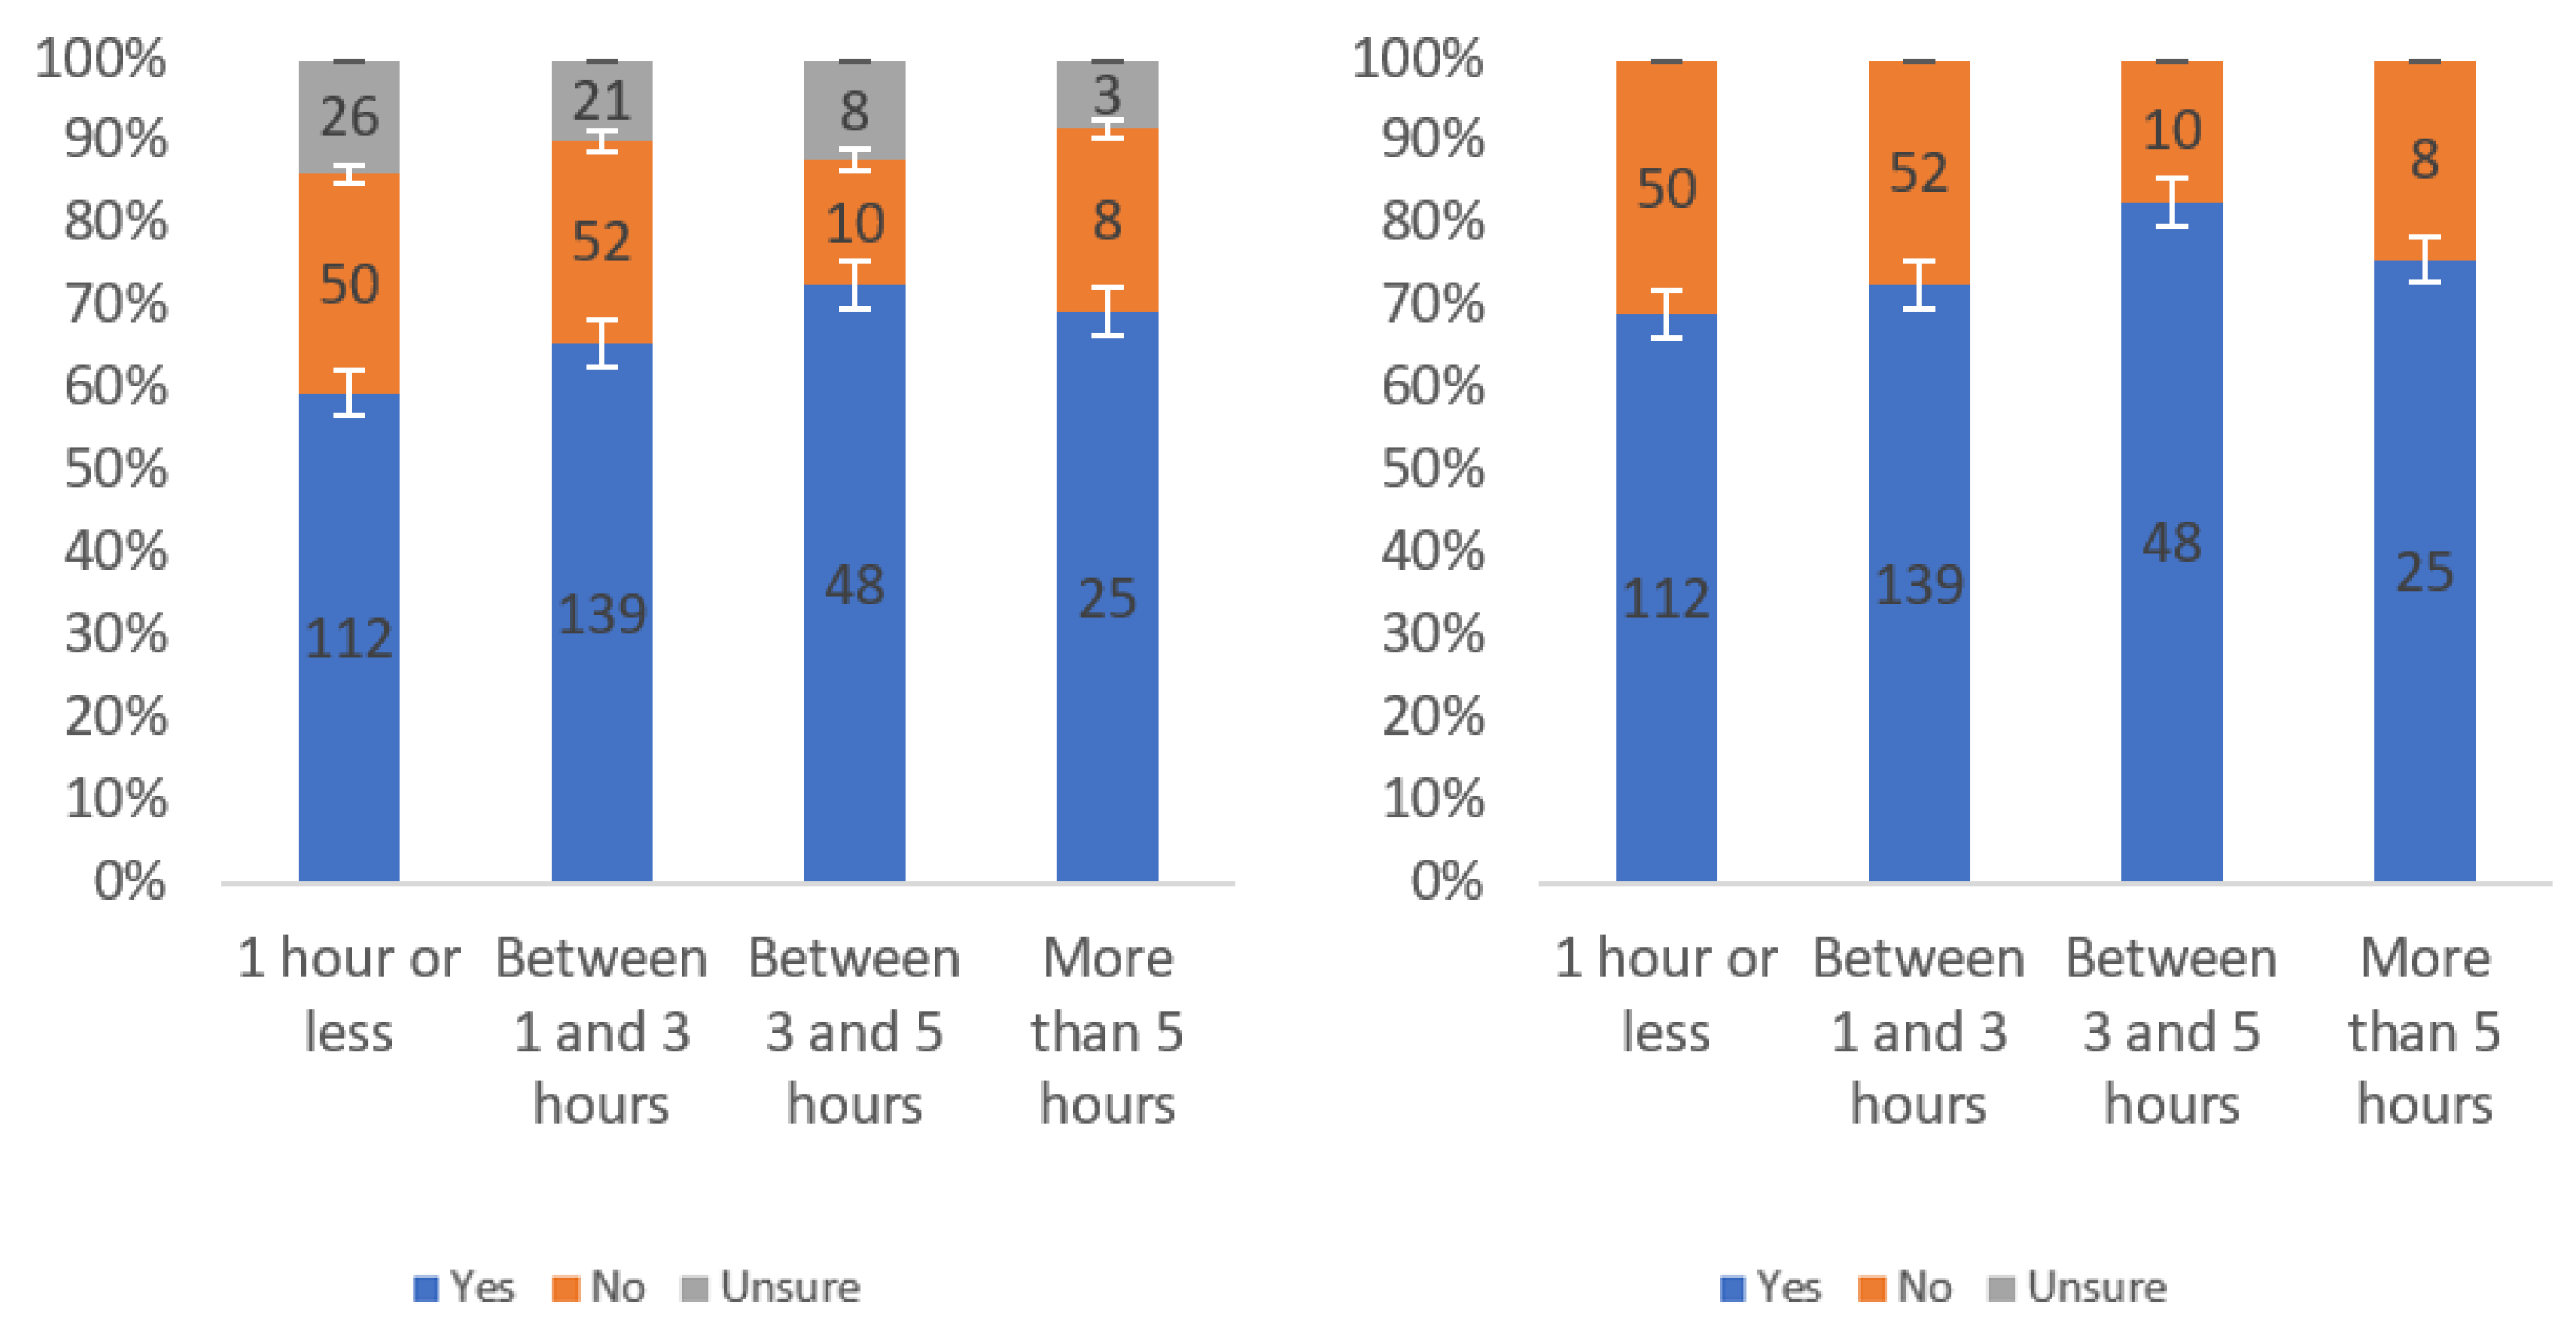
Figure 18.
Responses regarding others’ willingness to review by internet usage level including (left) and excluding (right) unsure responses.
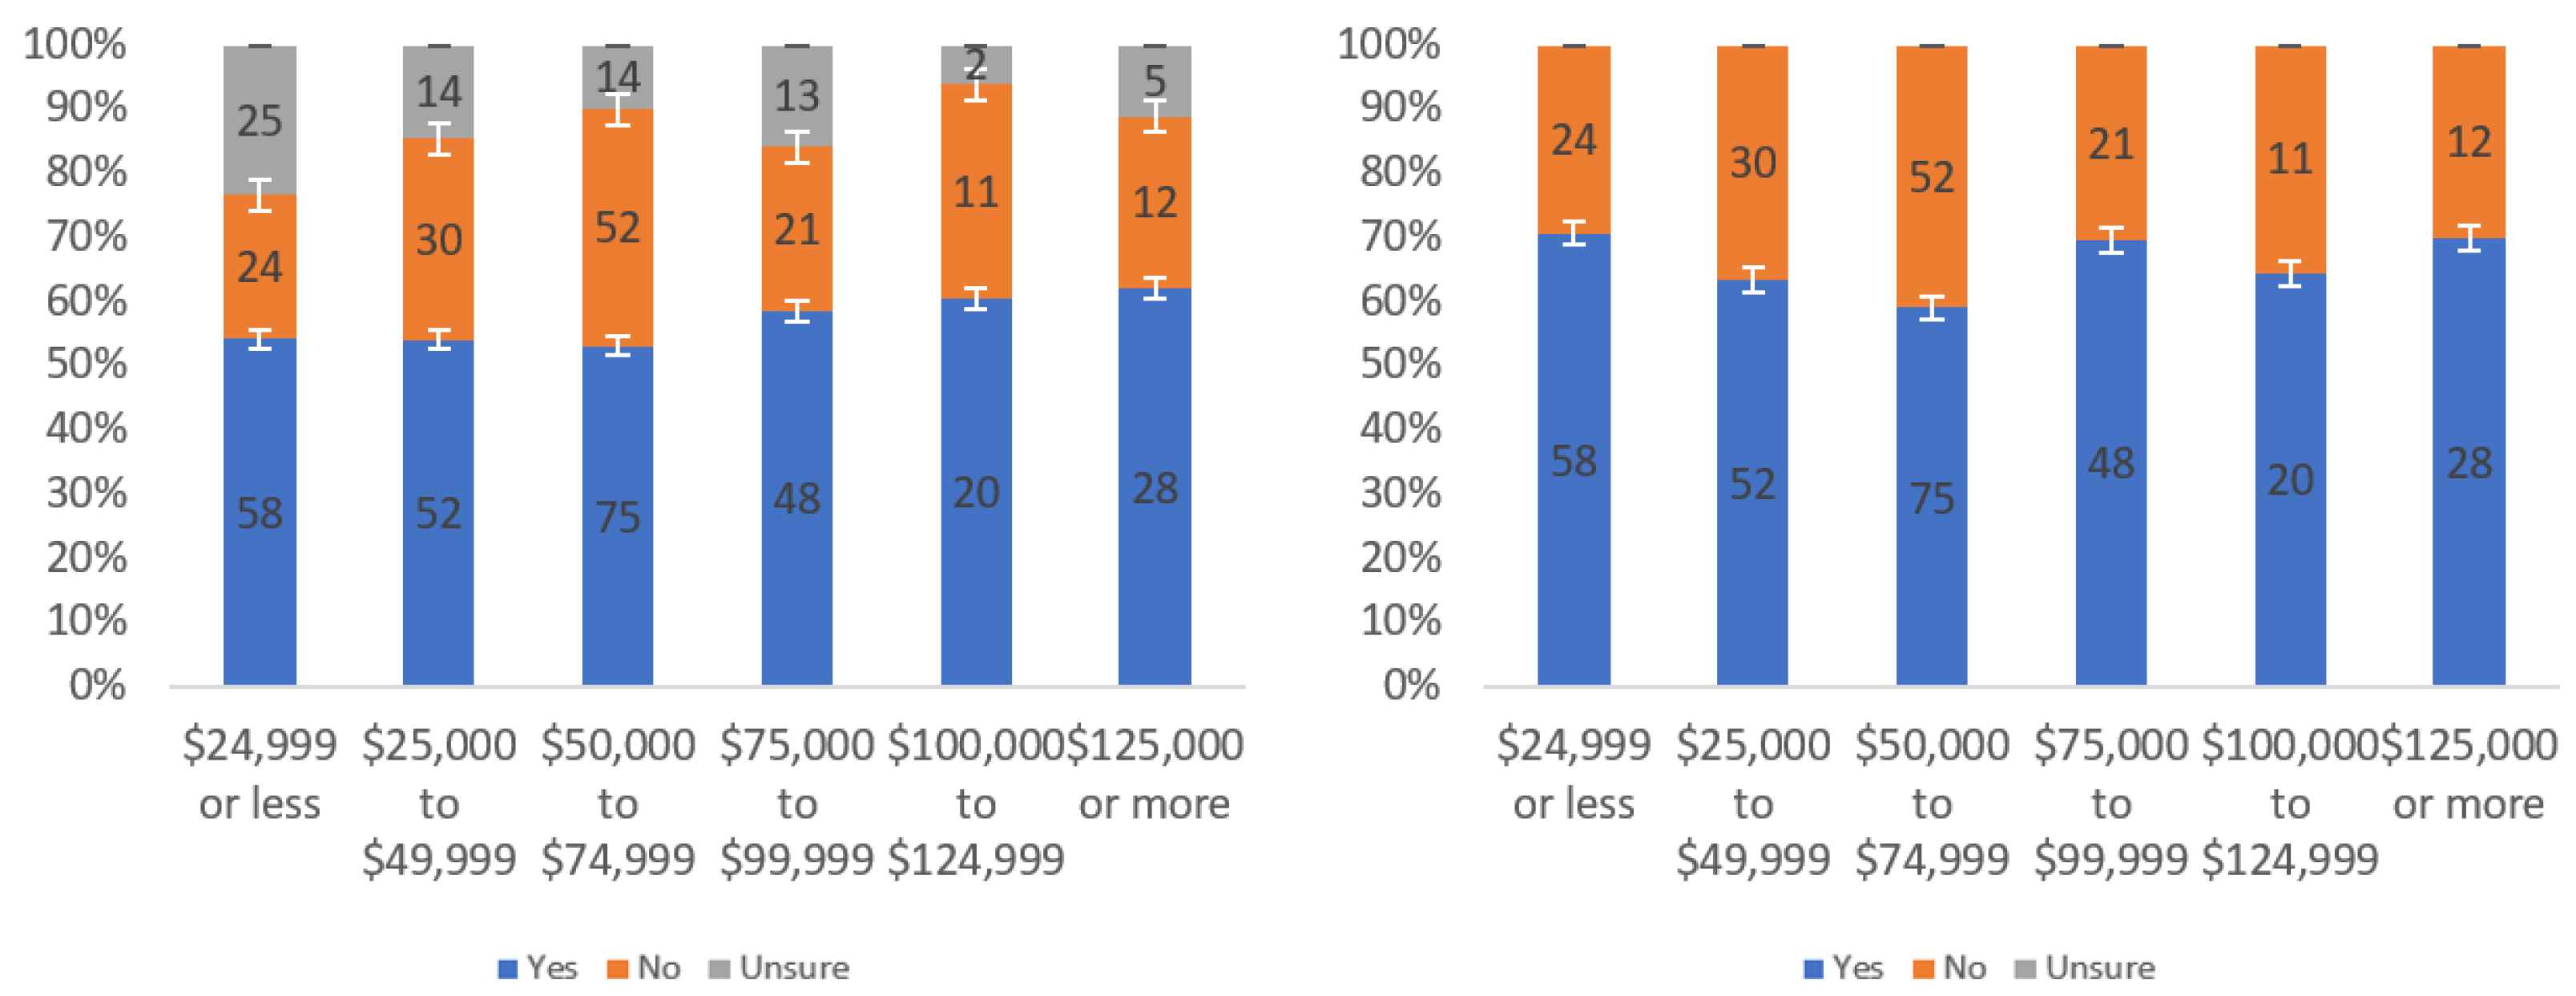
Figure 19.
Responses regarding usefulness in judging trustworthiness by income level including (left) and excluding (right) unsure responses.
Figure 20.
Responses regarding usefulness in judging trustworthiness by party affiliation including (left) and excluding (right) unsure responses.
Figure 21.
Responses regarding usefulness in judging trustworthiness by internet usage level including (left) and excluding (right) unsure responses.
Figure 22.
Warning label with article summary [
76].
Figure 23.
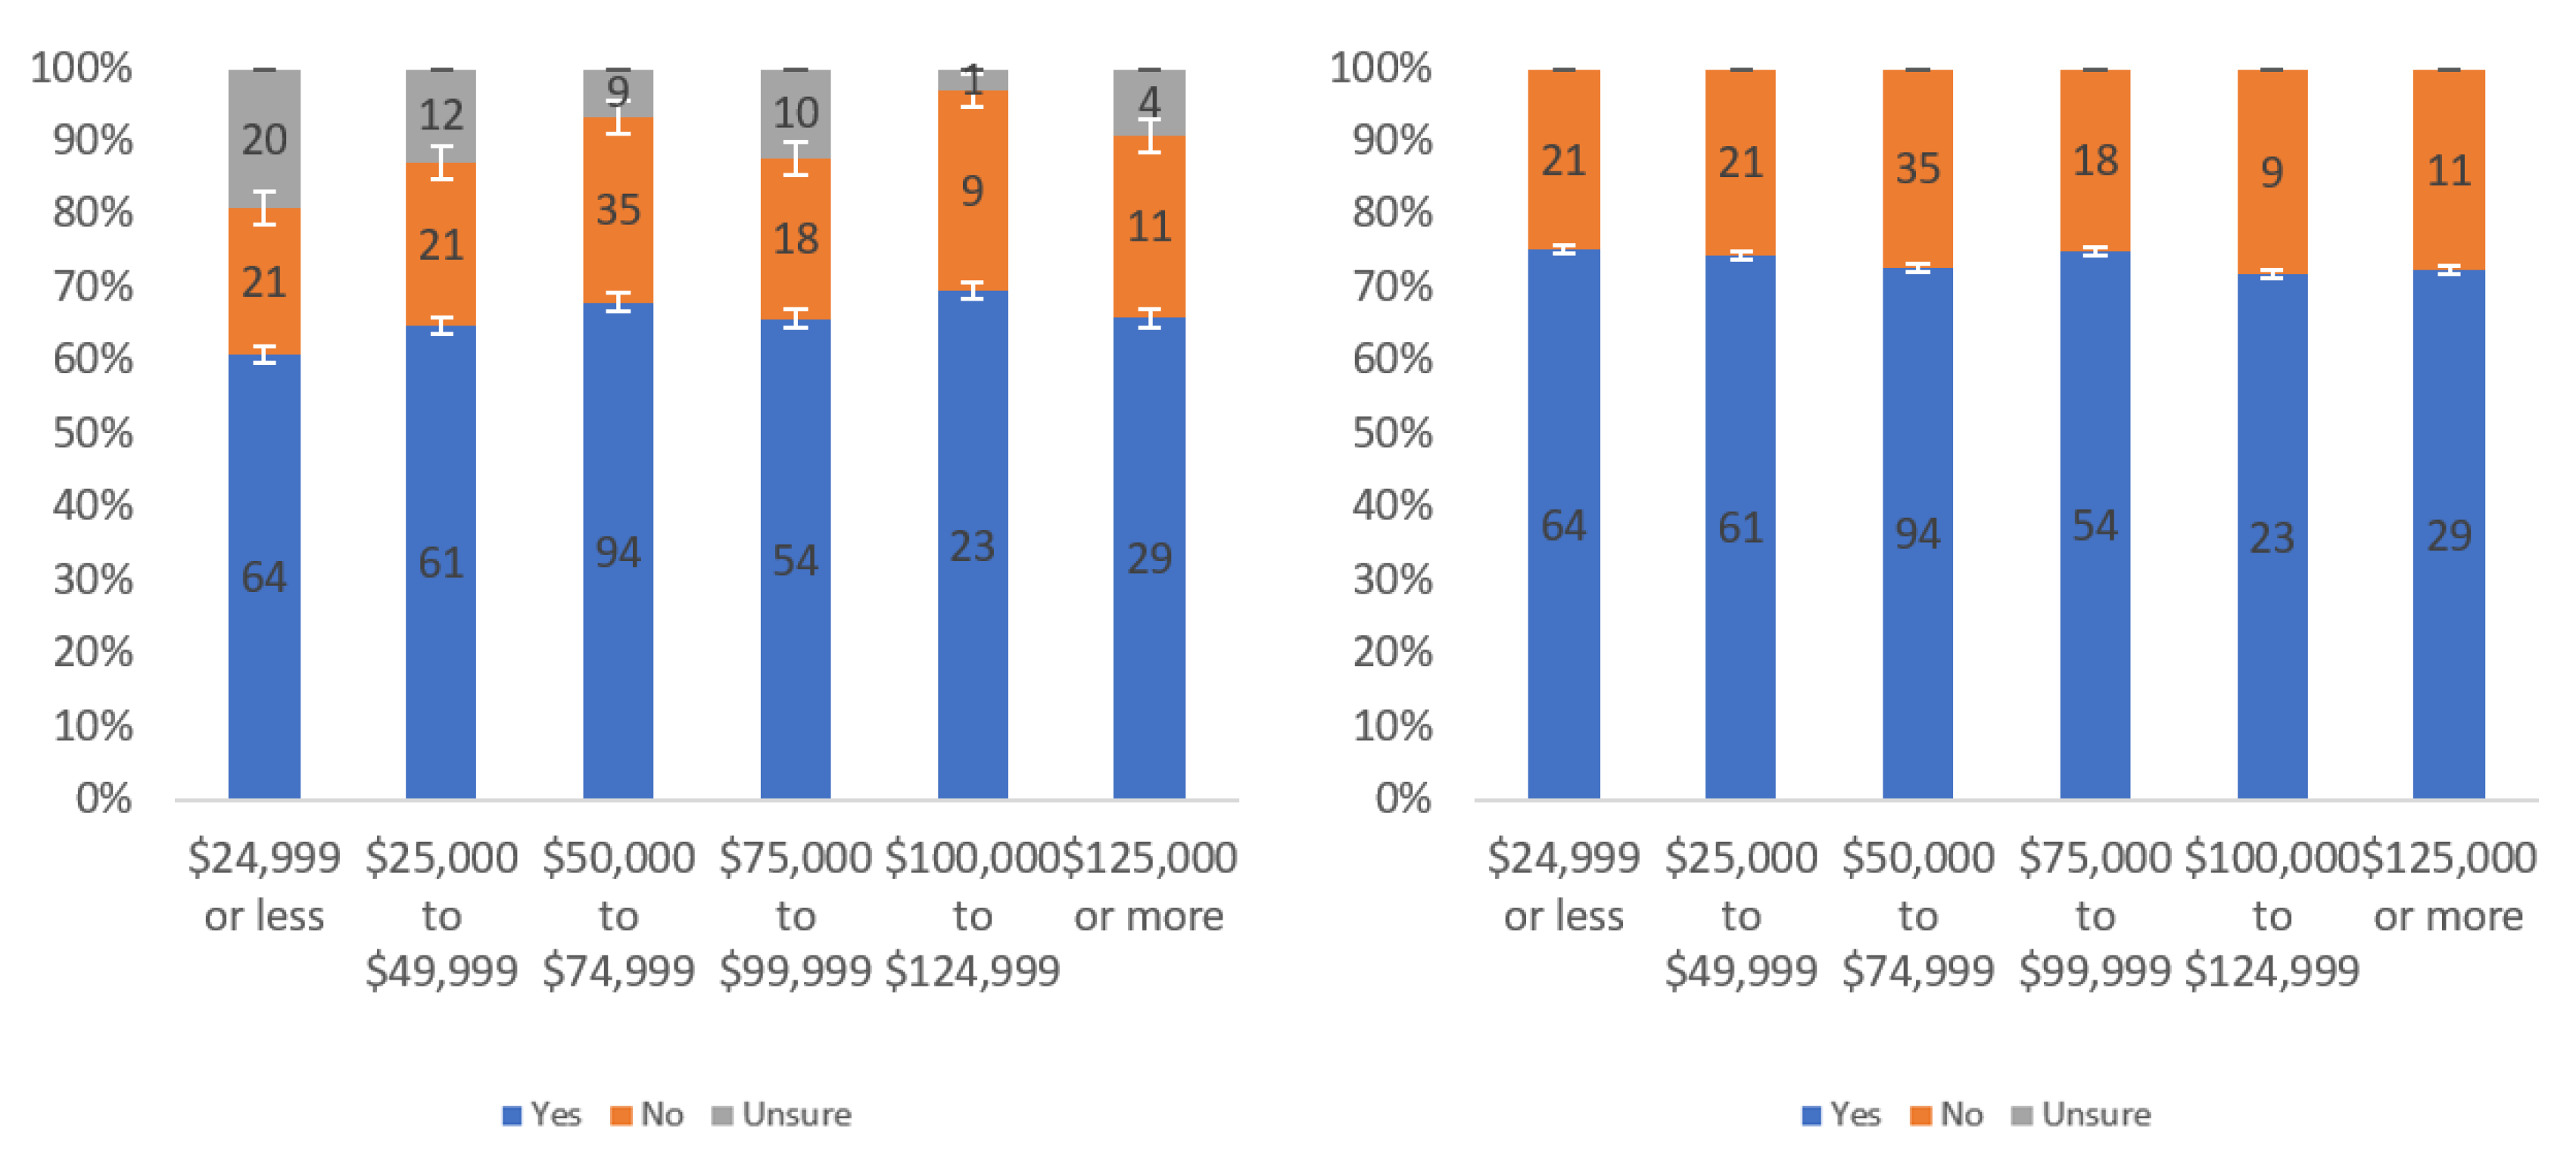
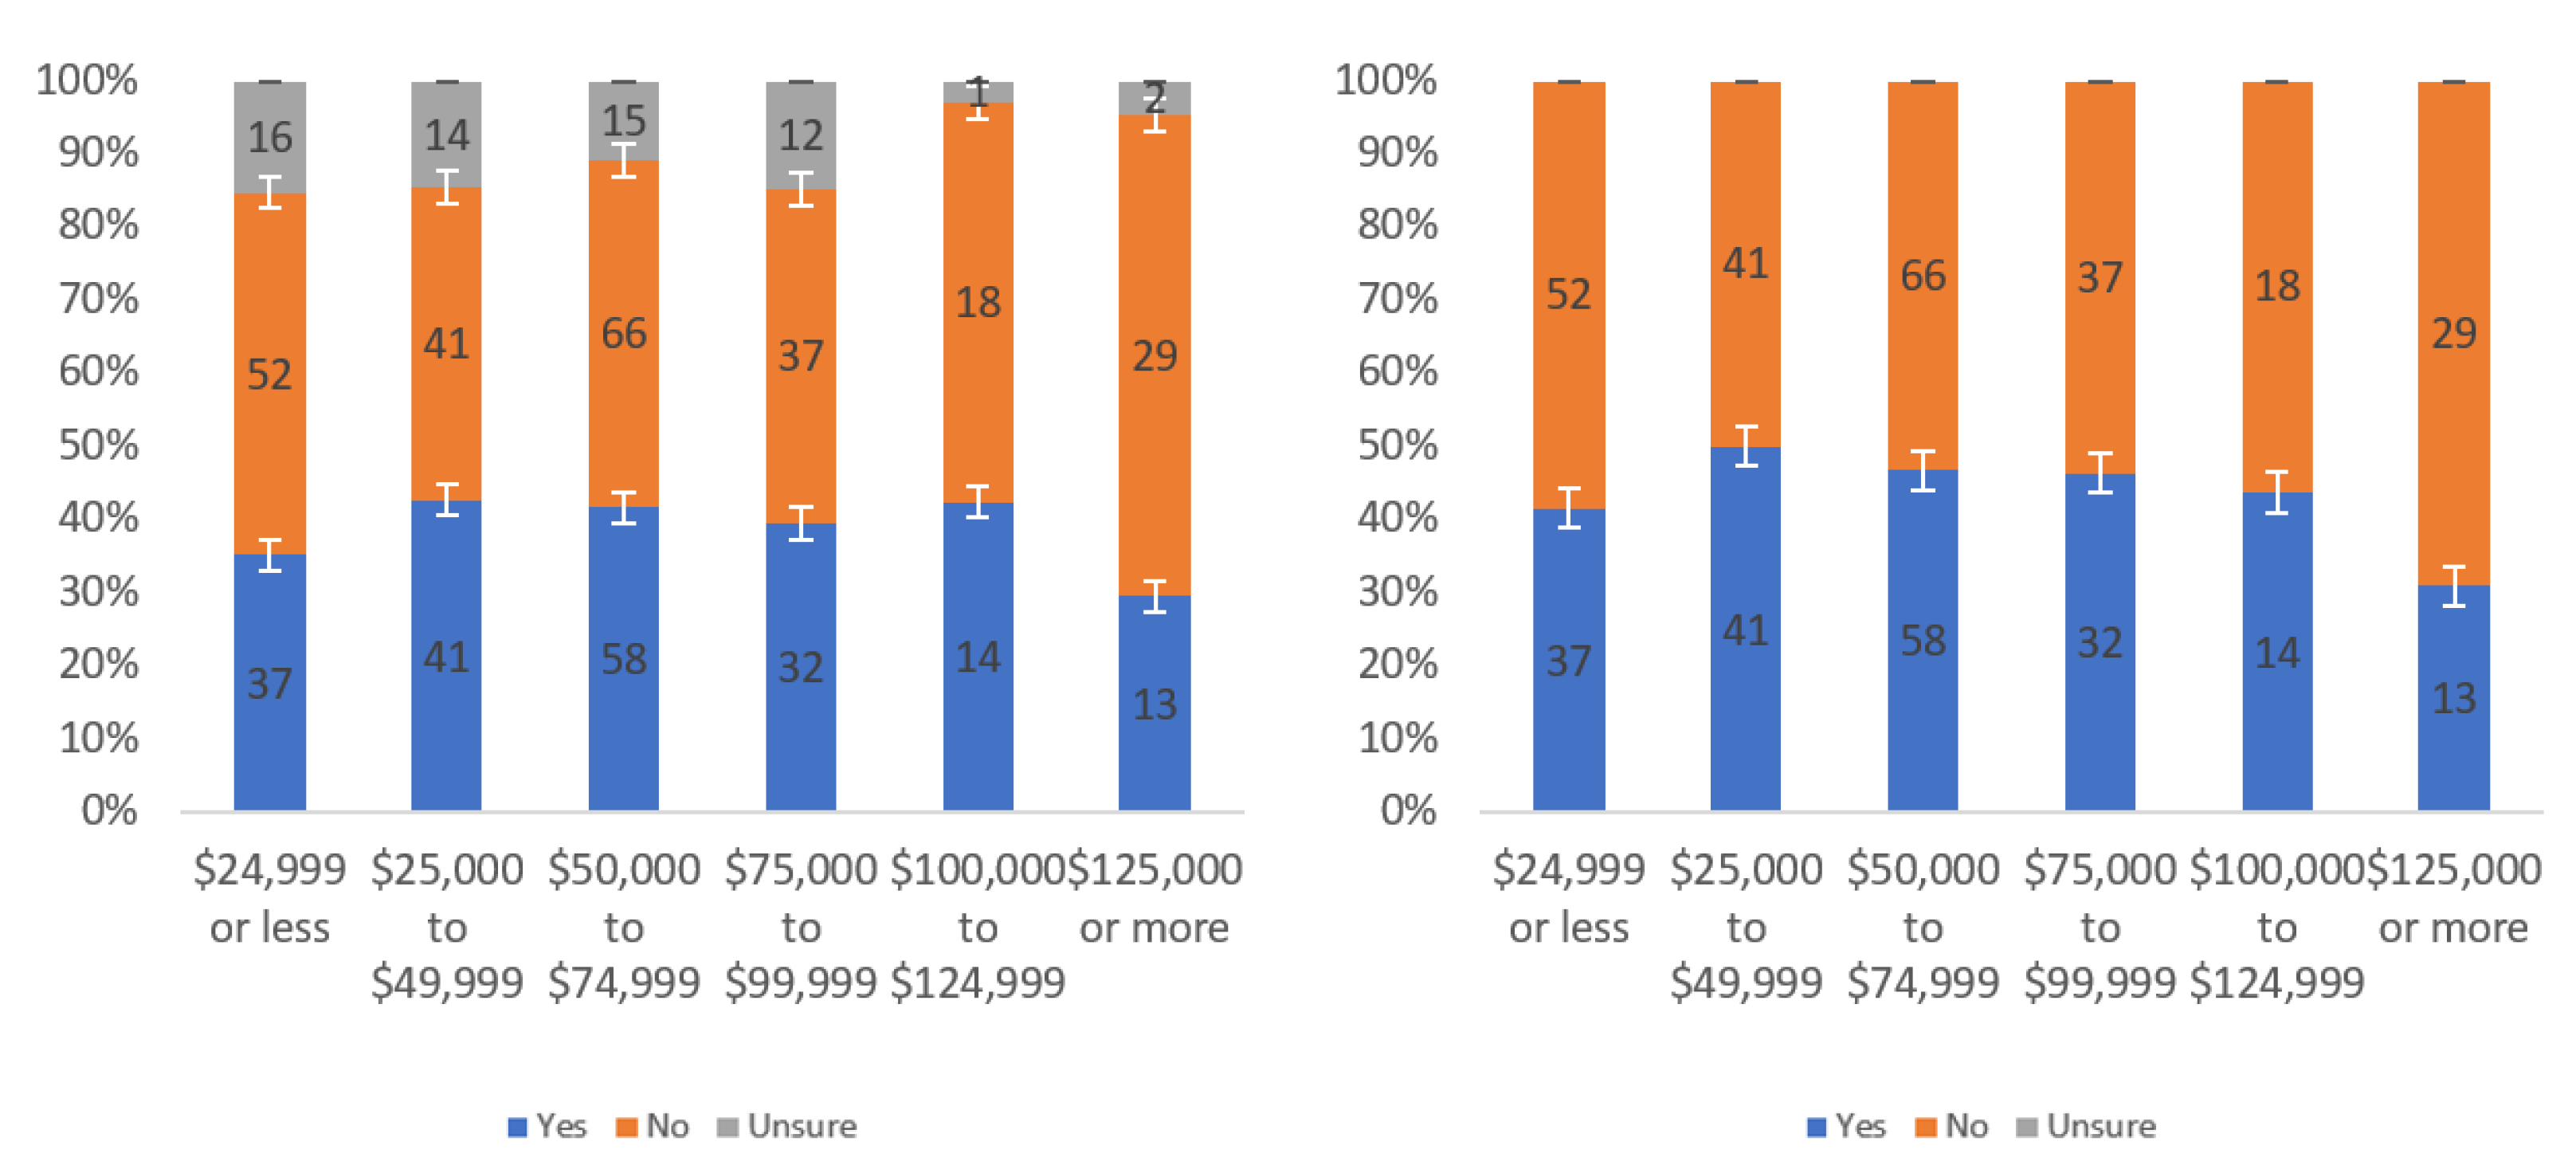
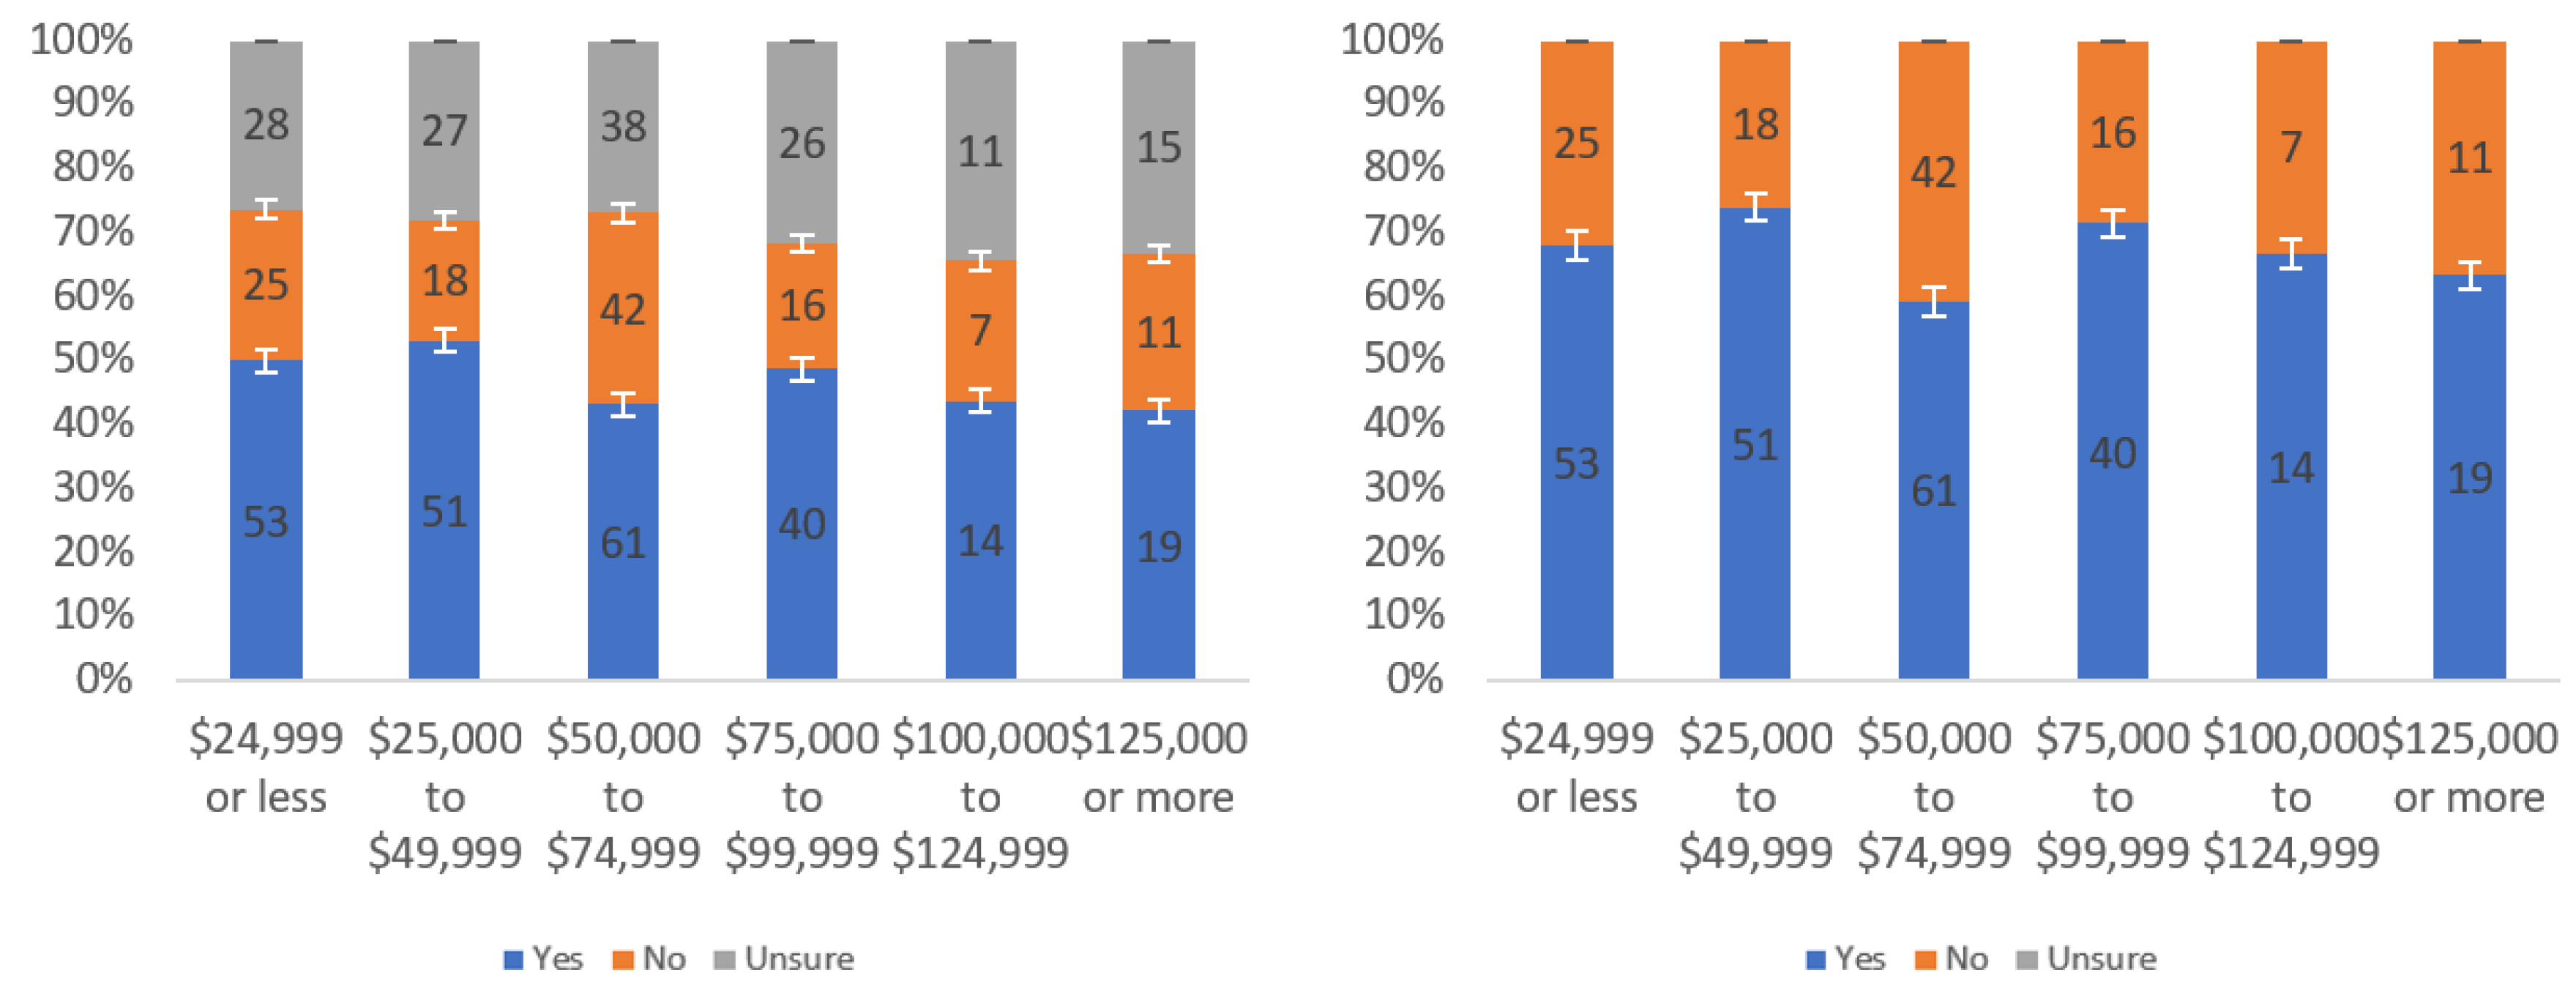
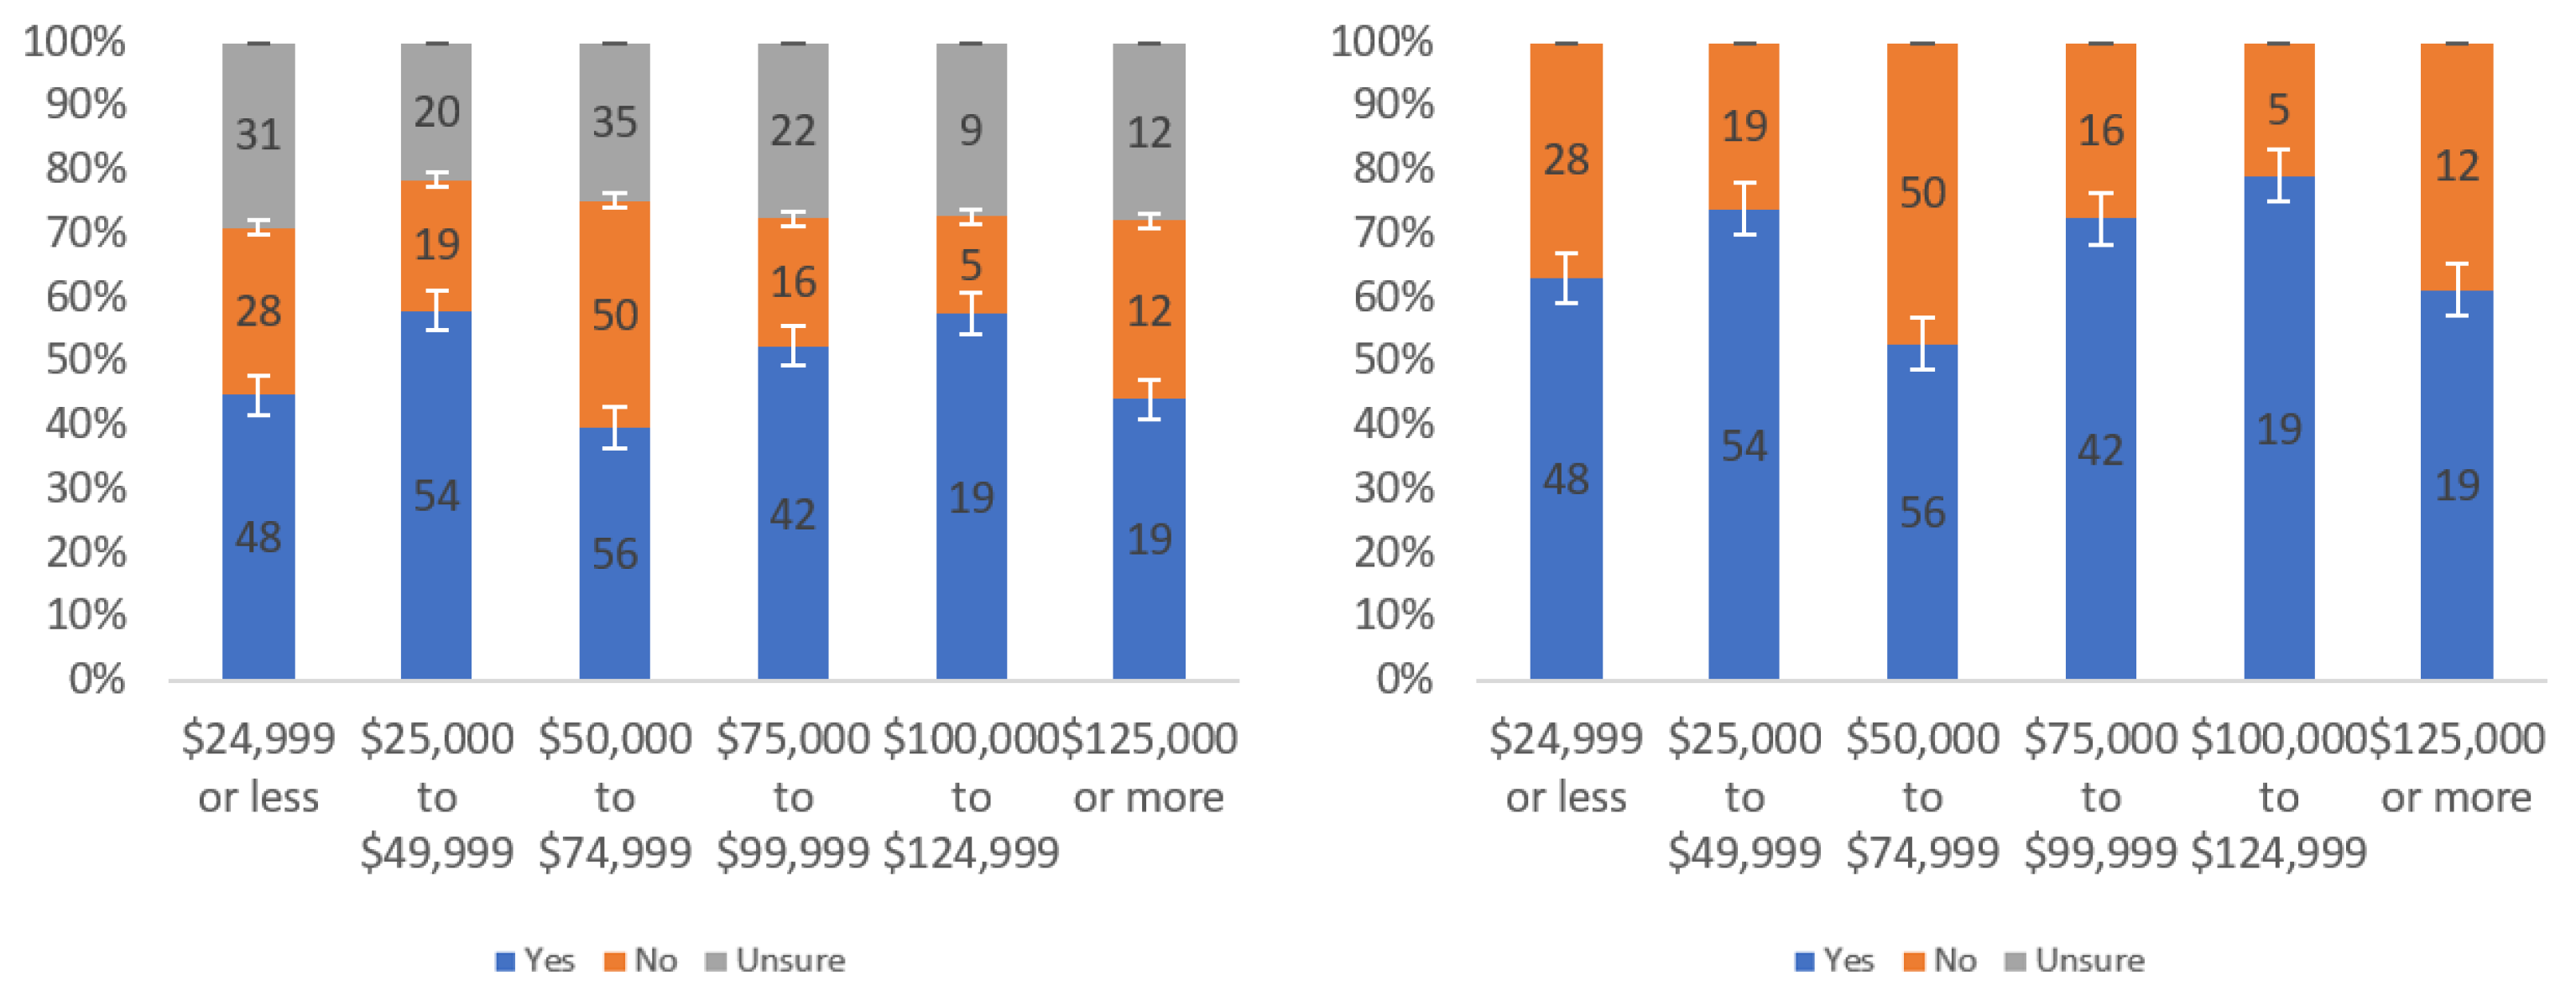
Responses regarding label helpfulness by income level including (left) and excluding (right) unsure responses.
Figure 24.
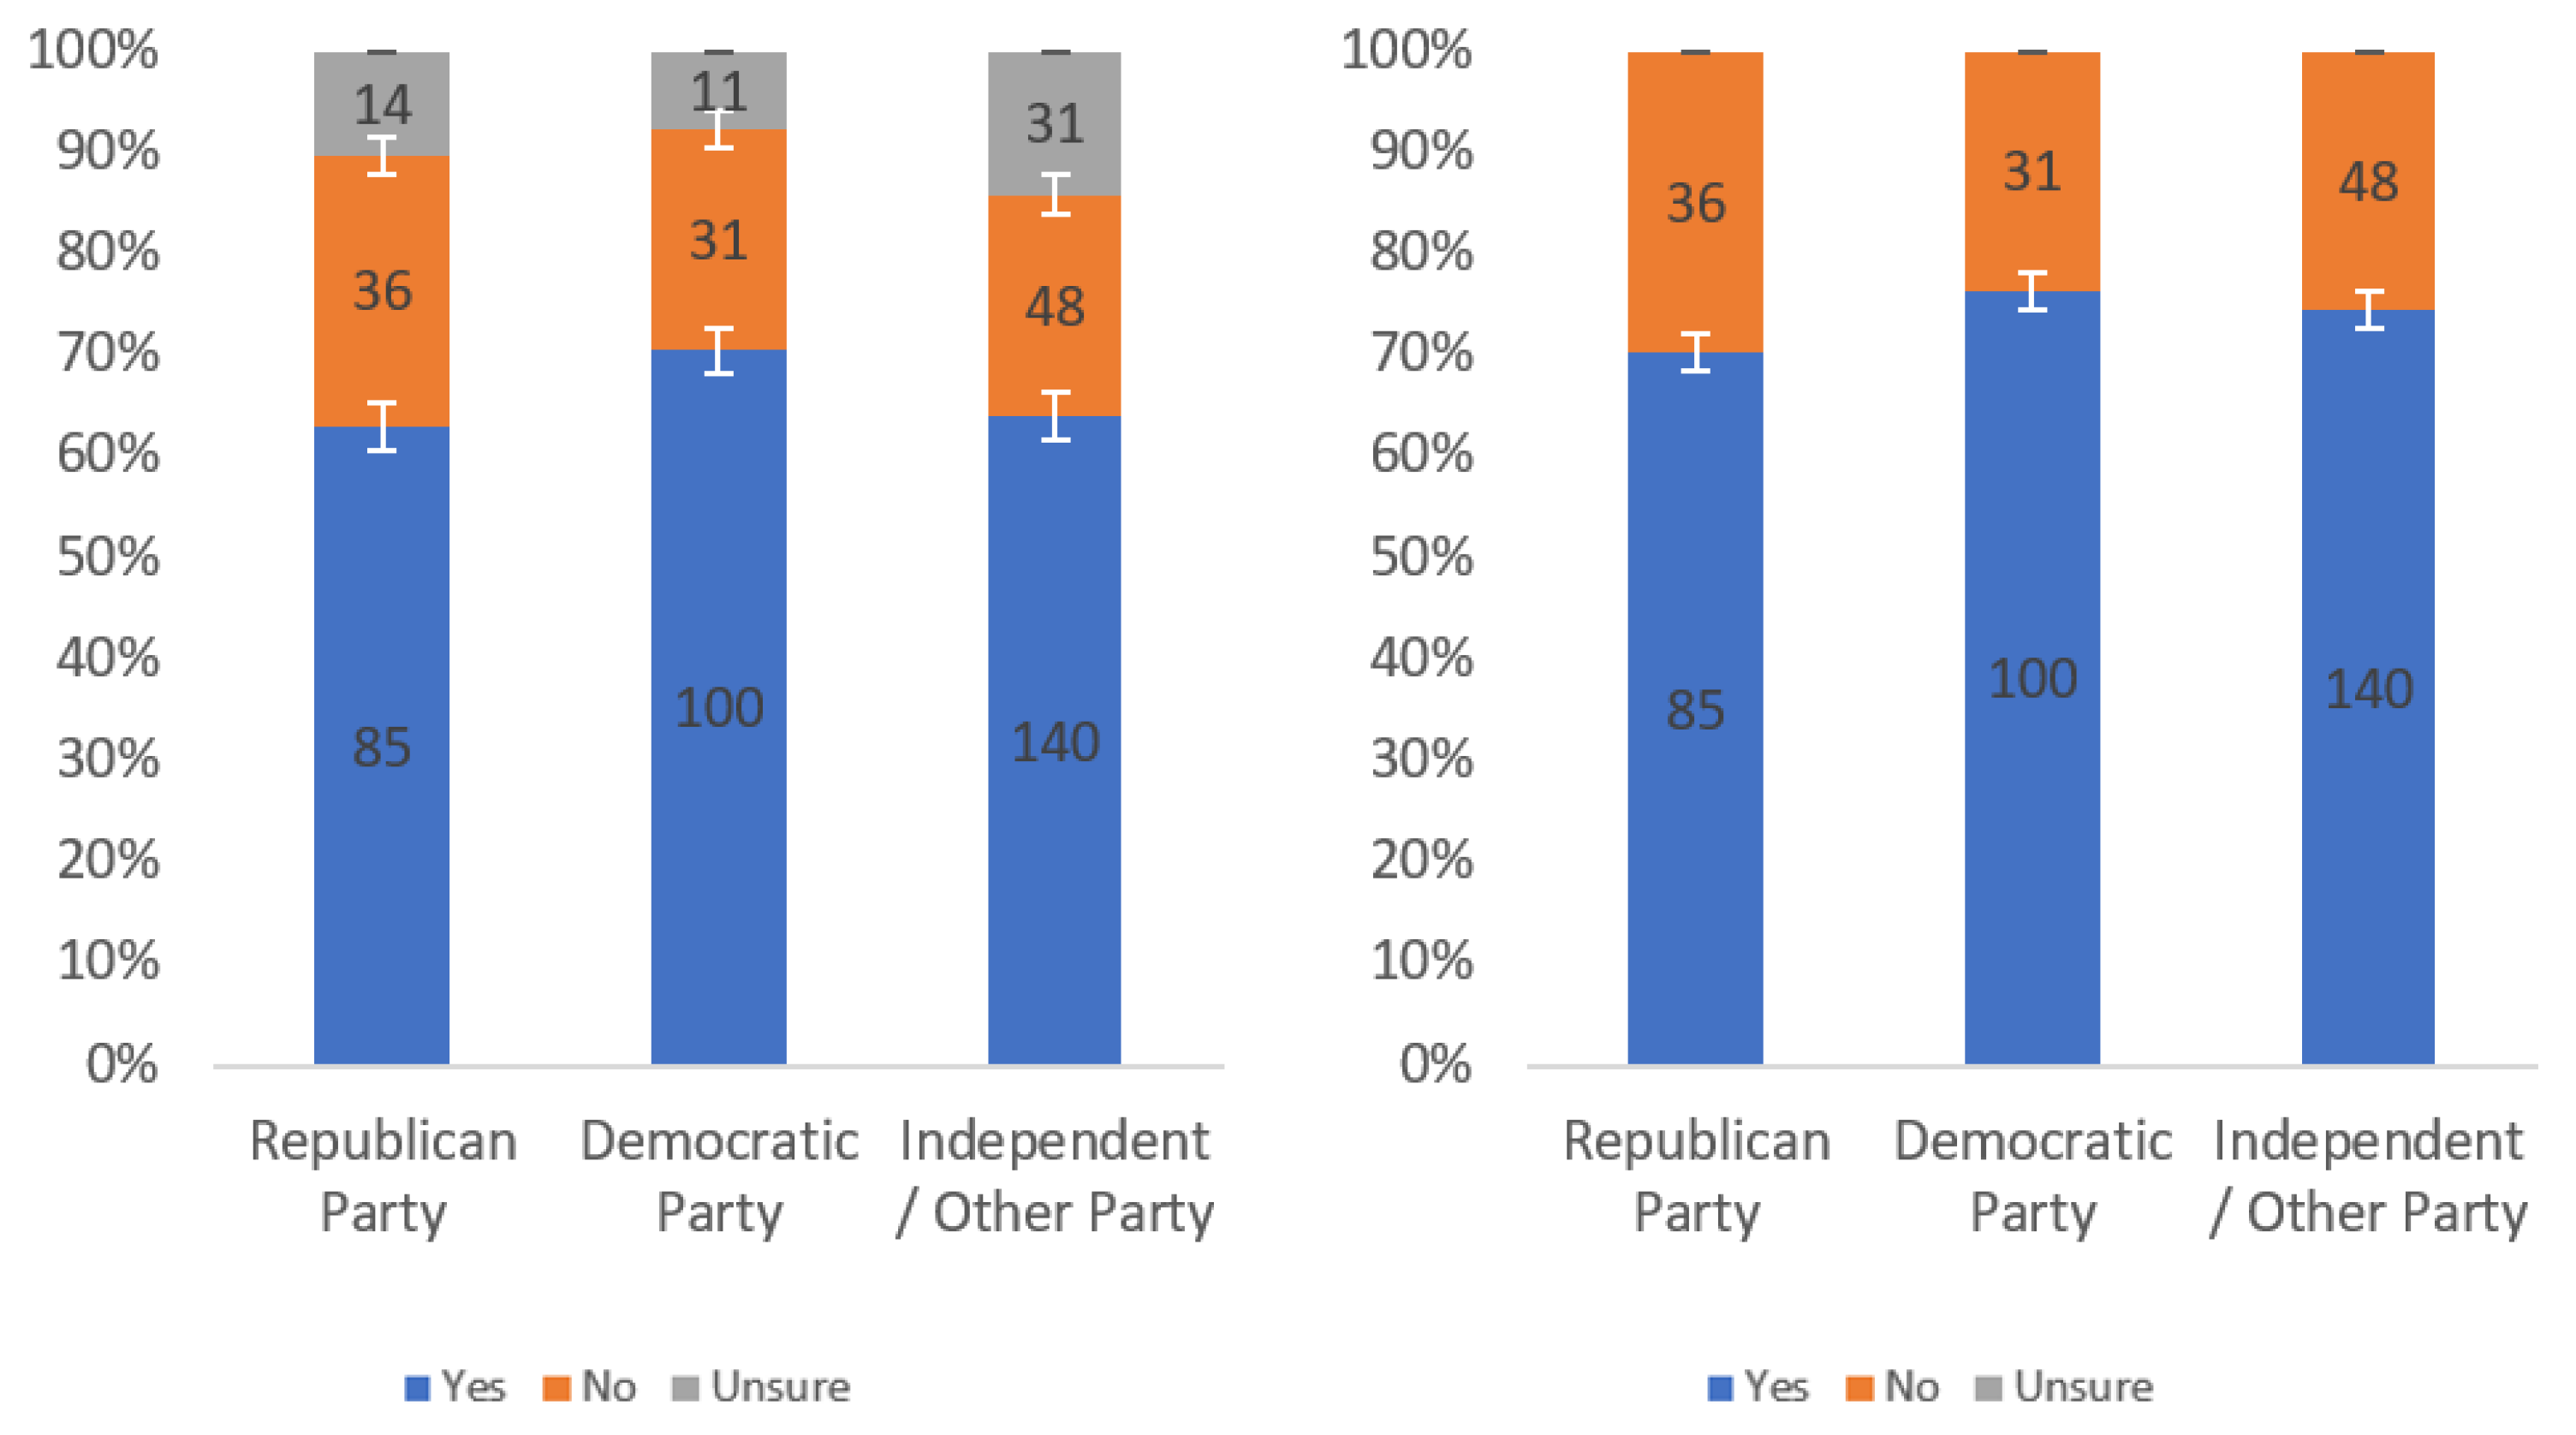
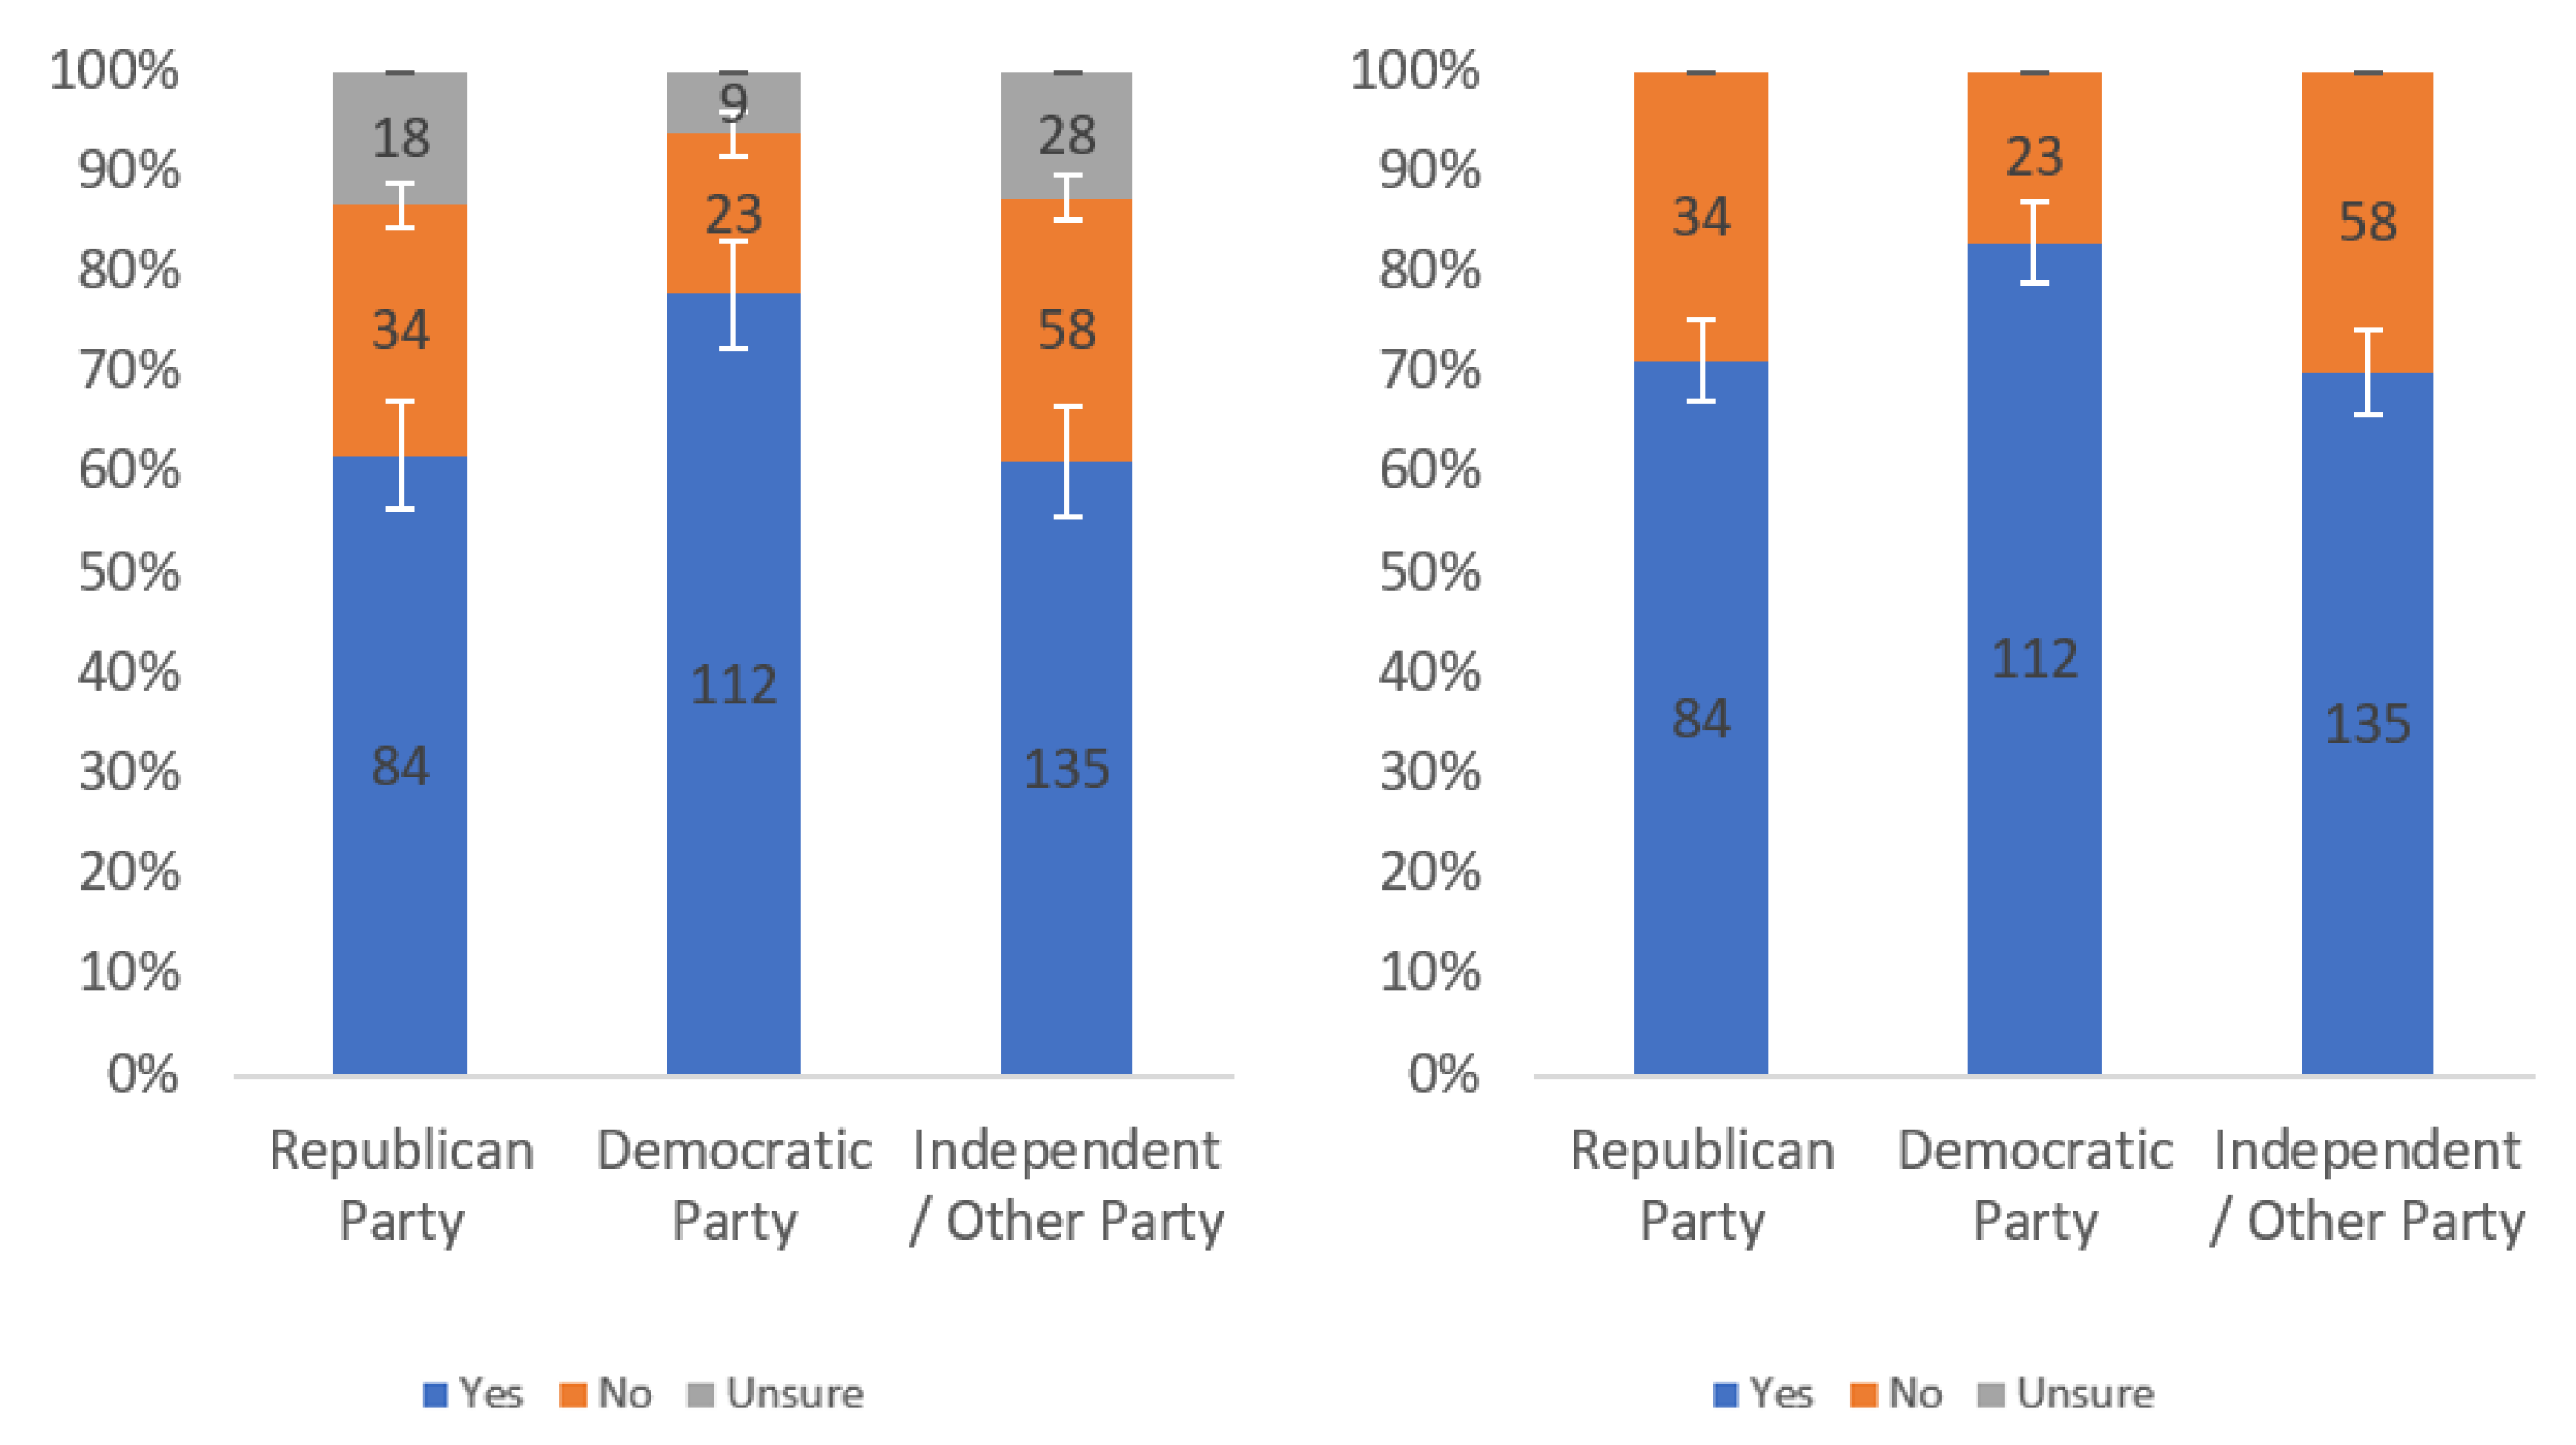
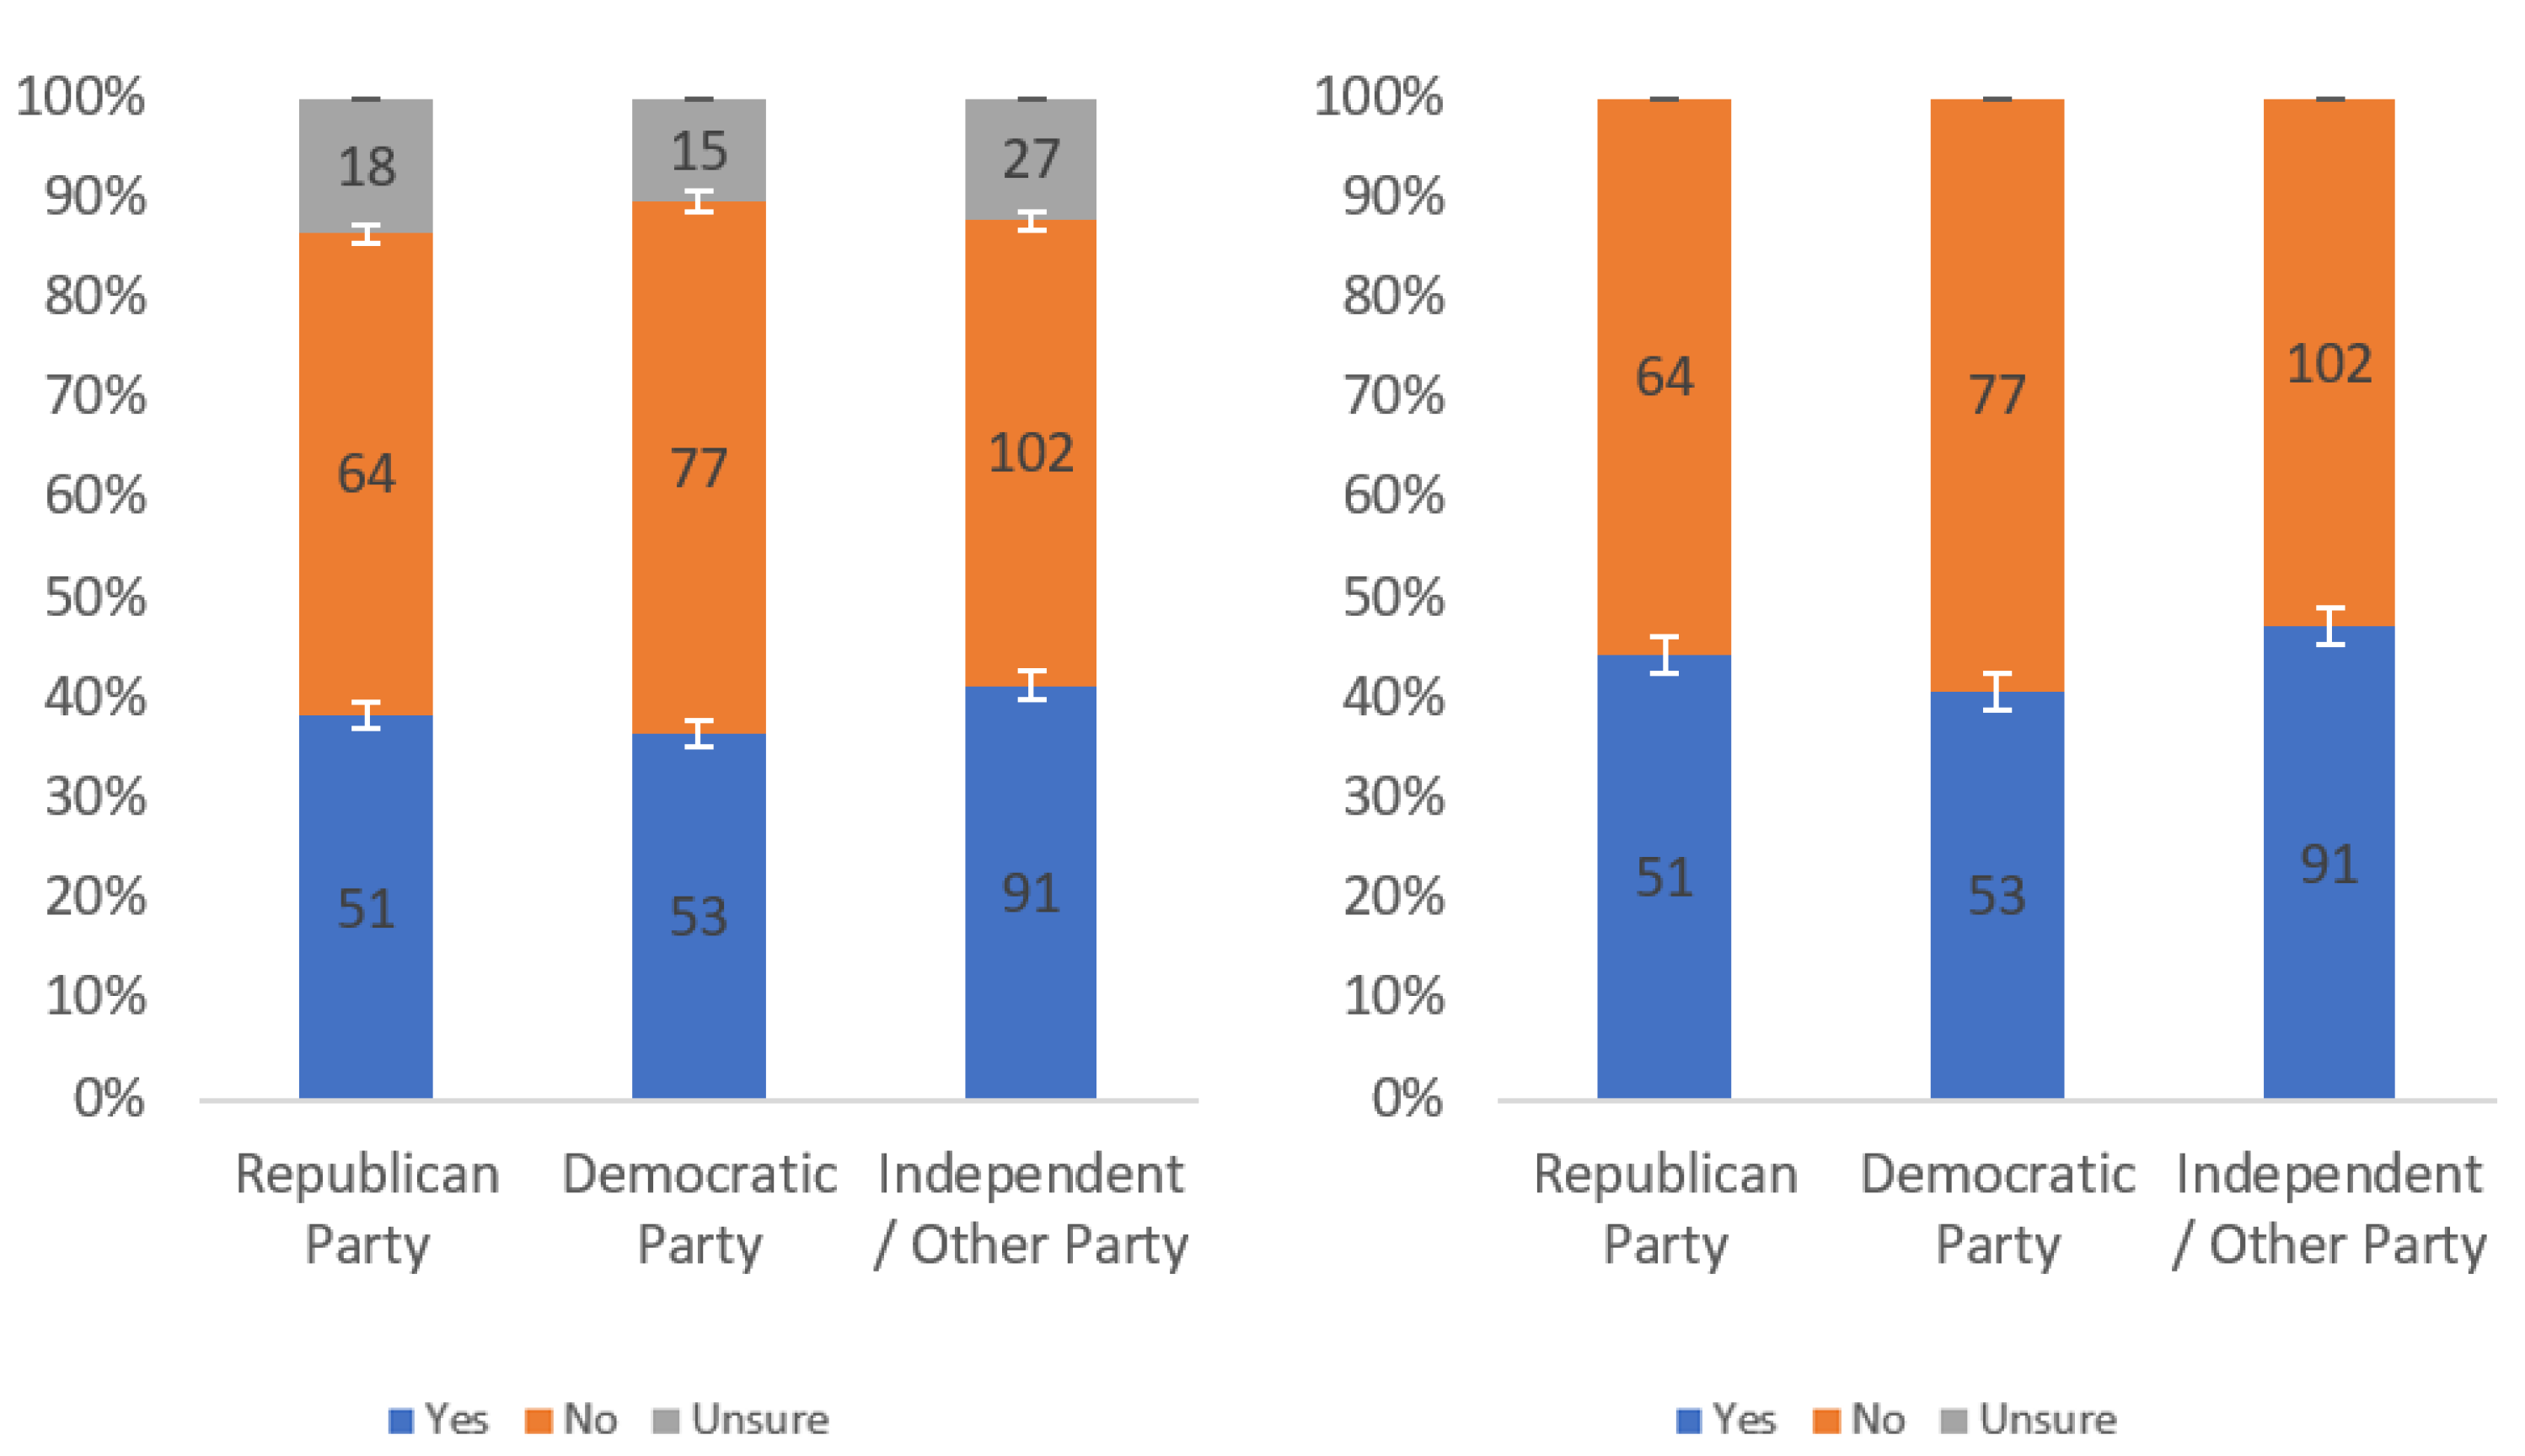
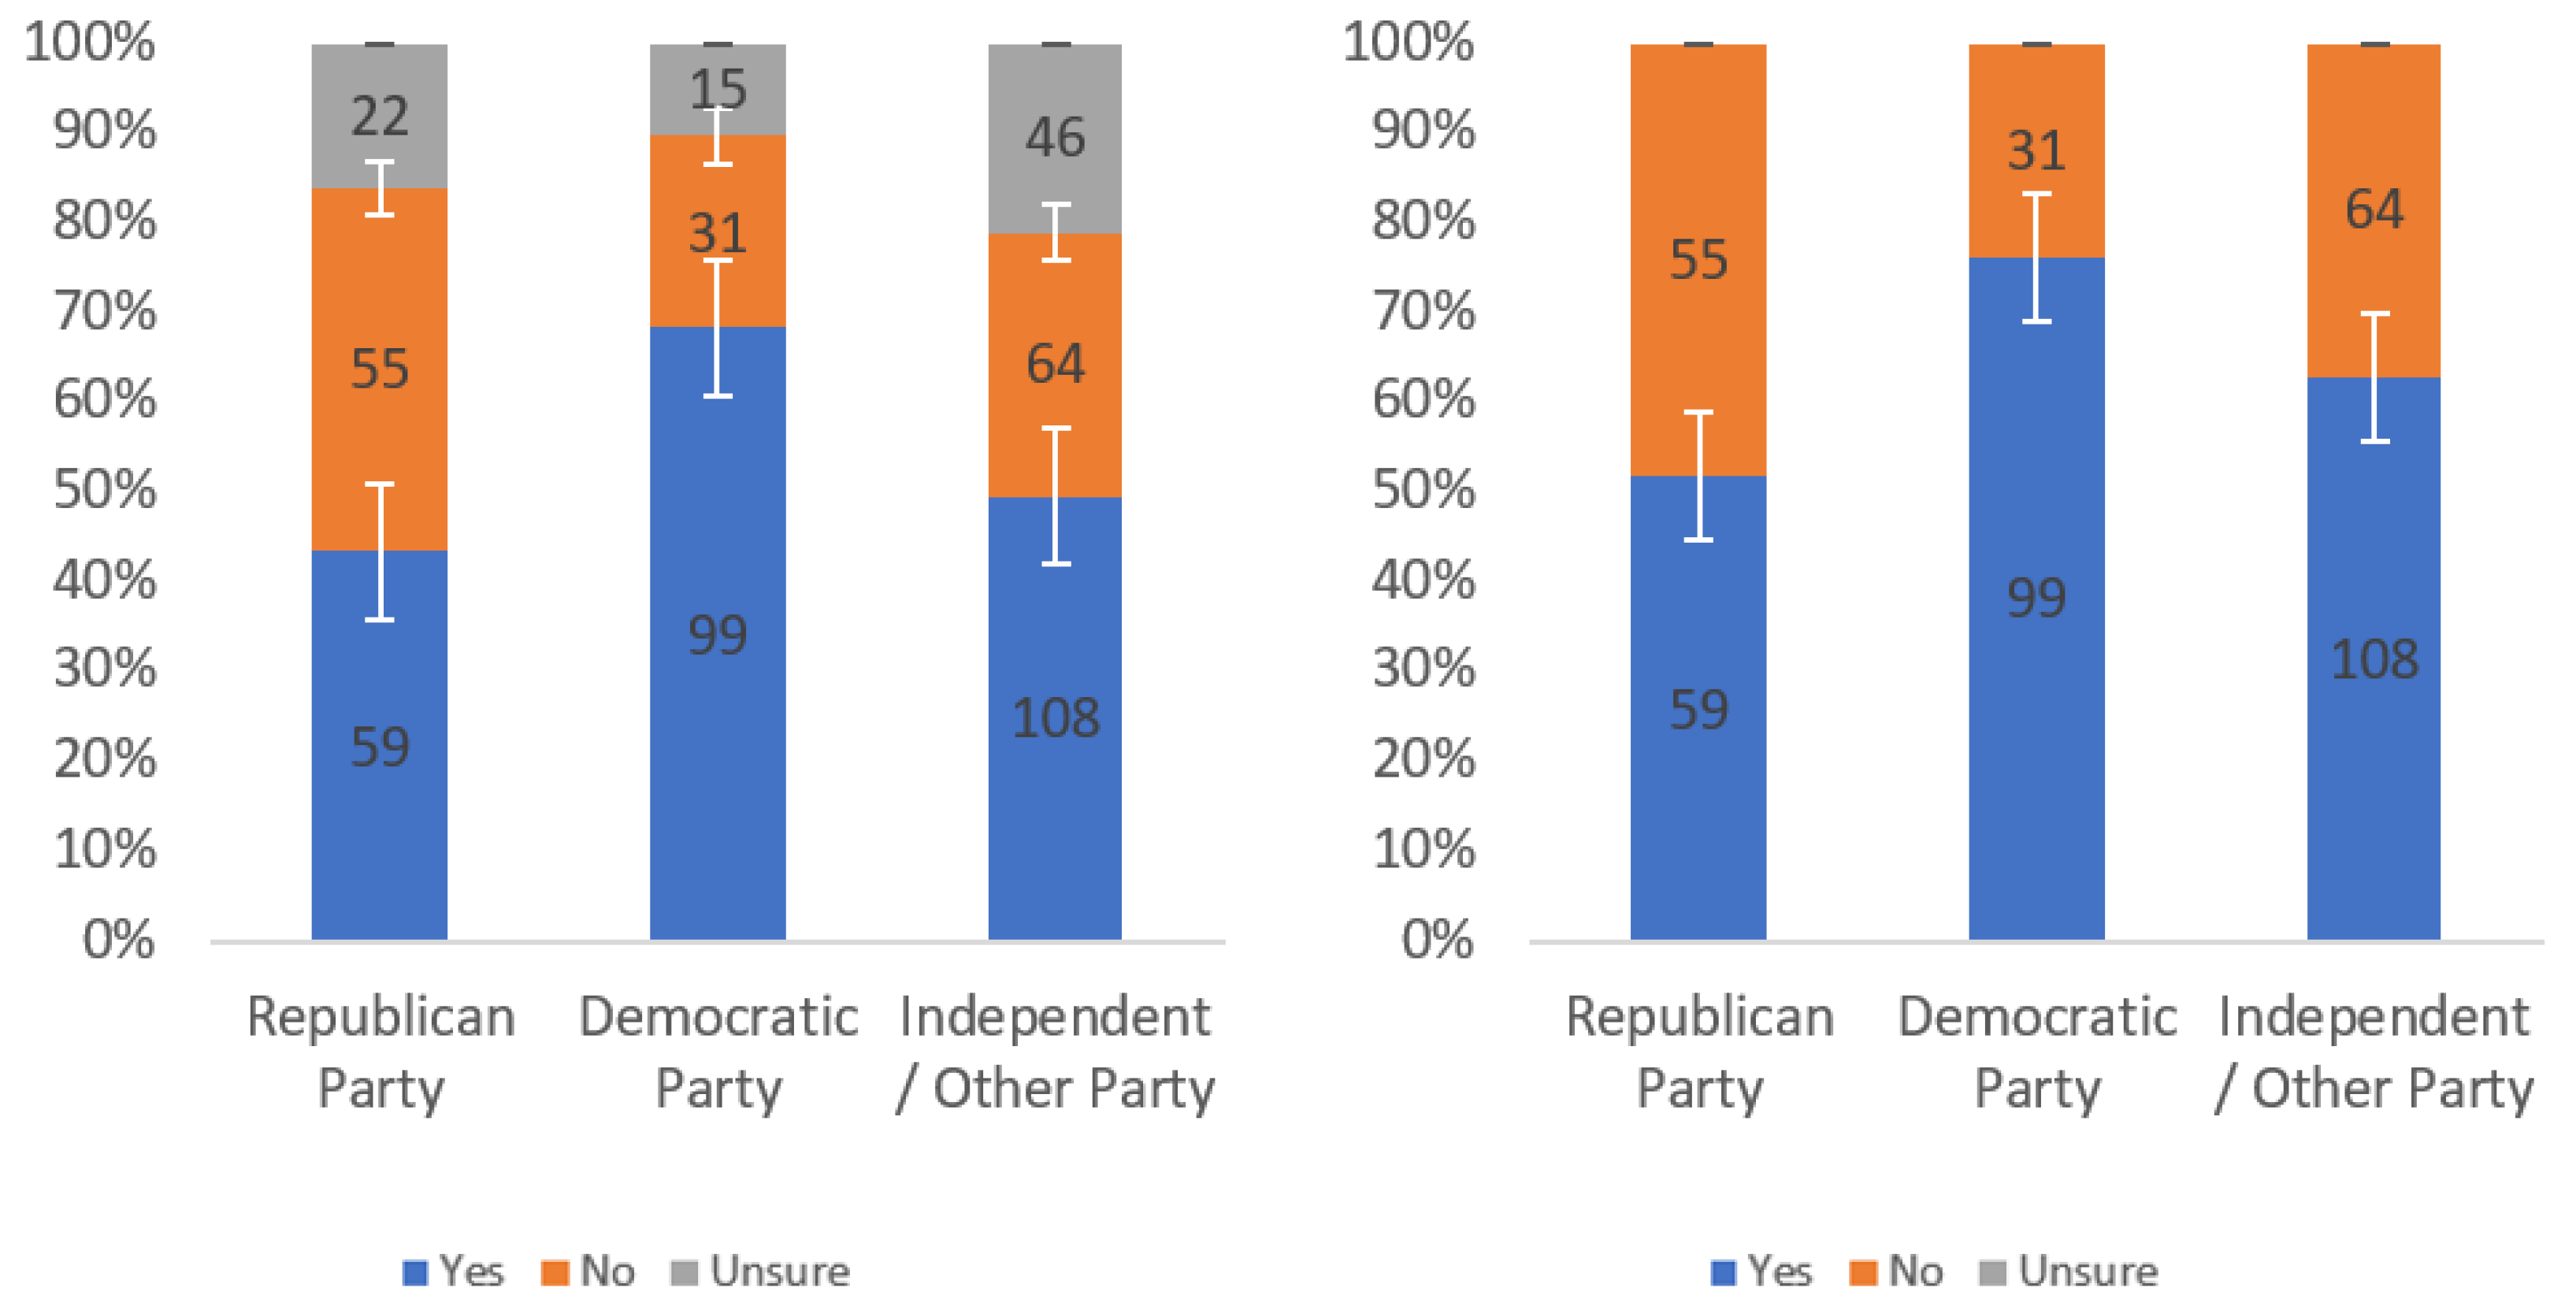
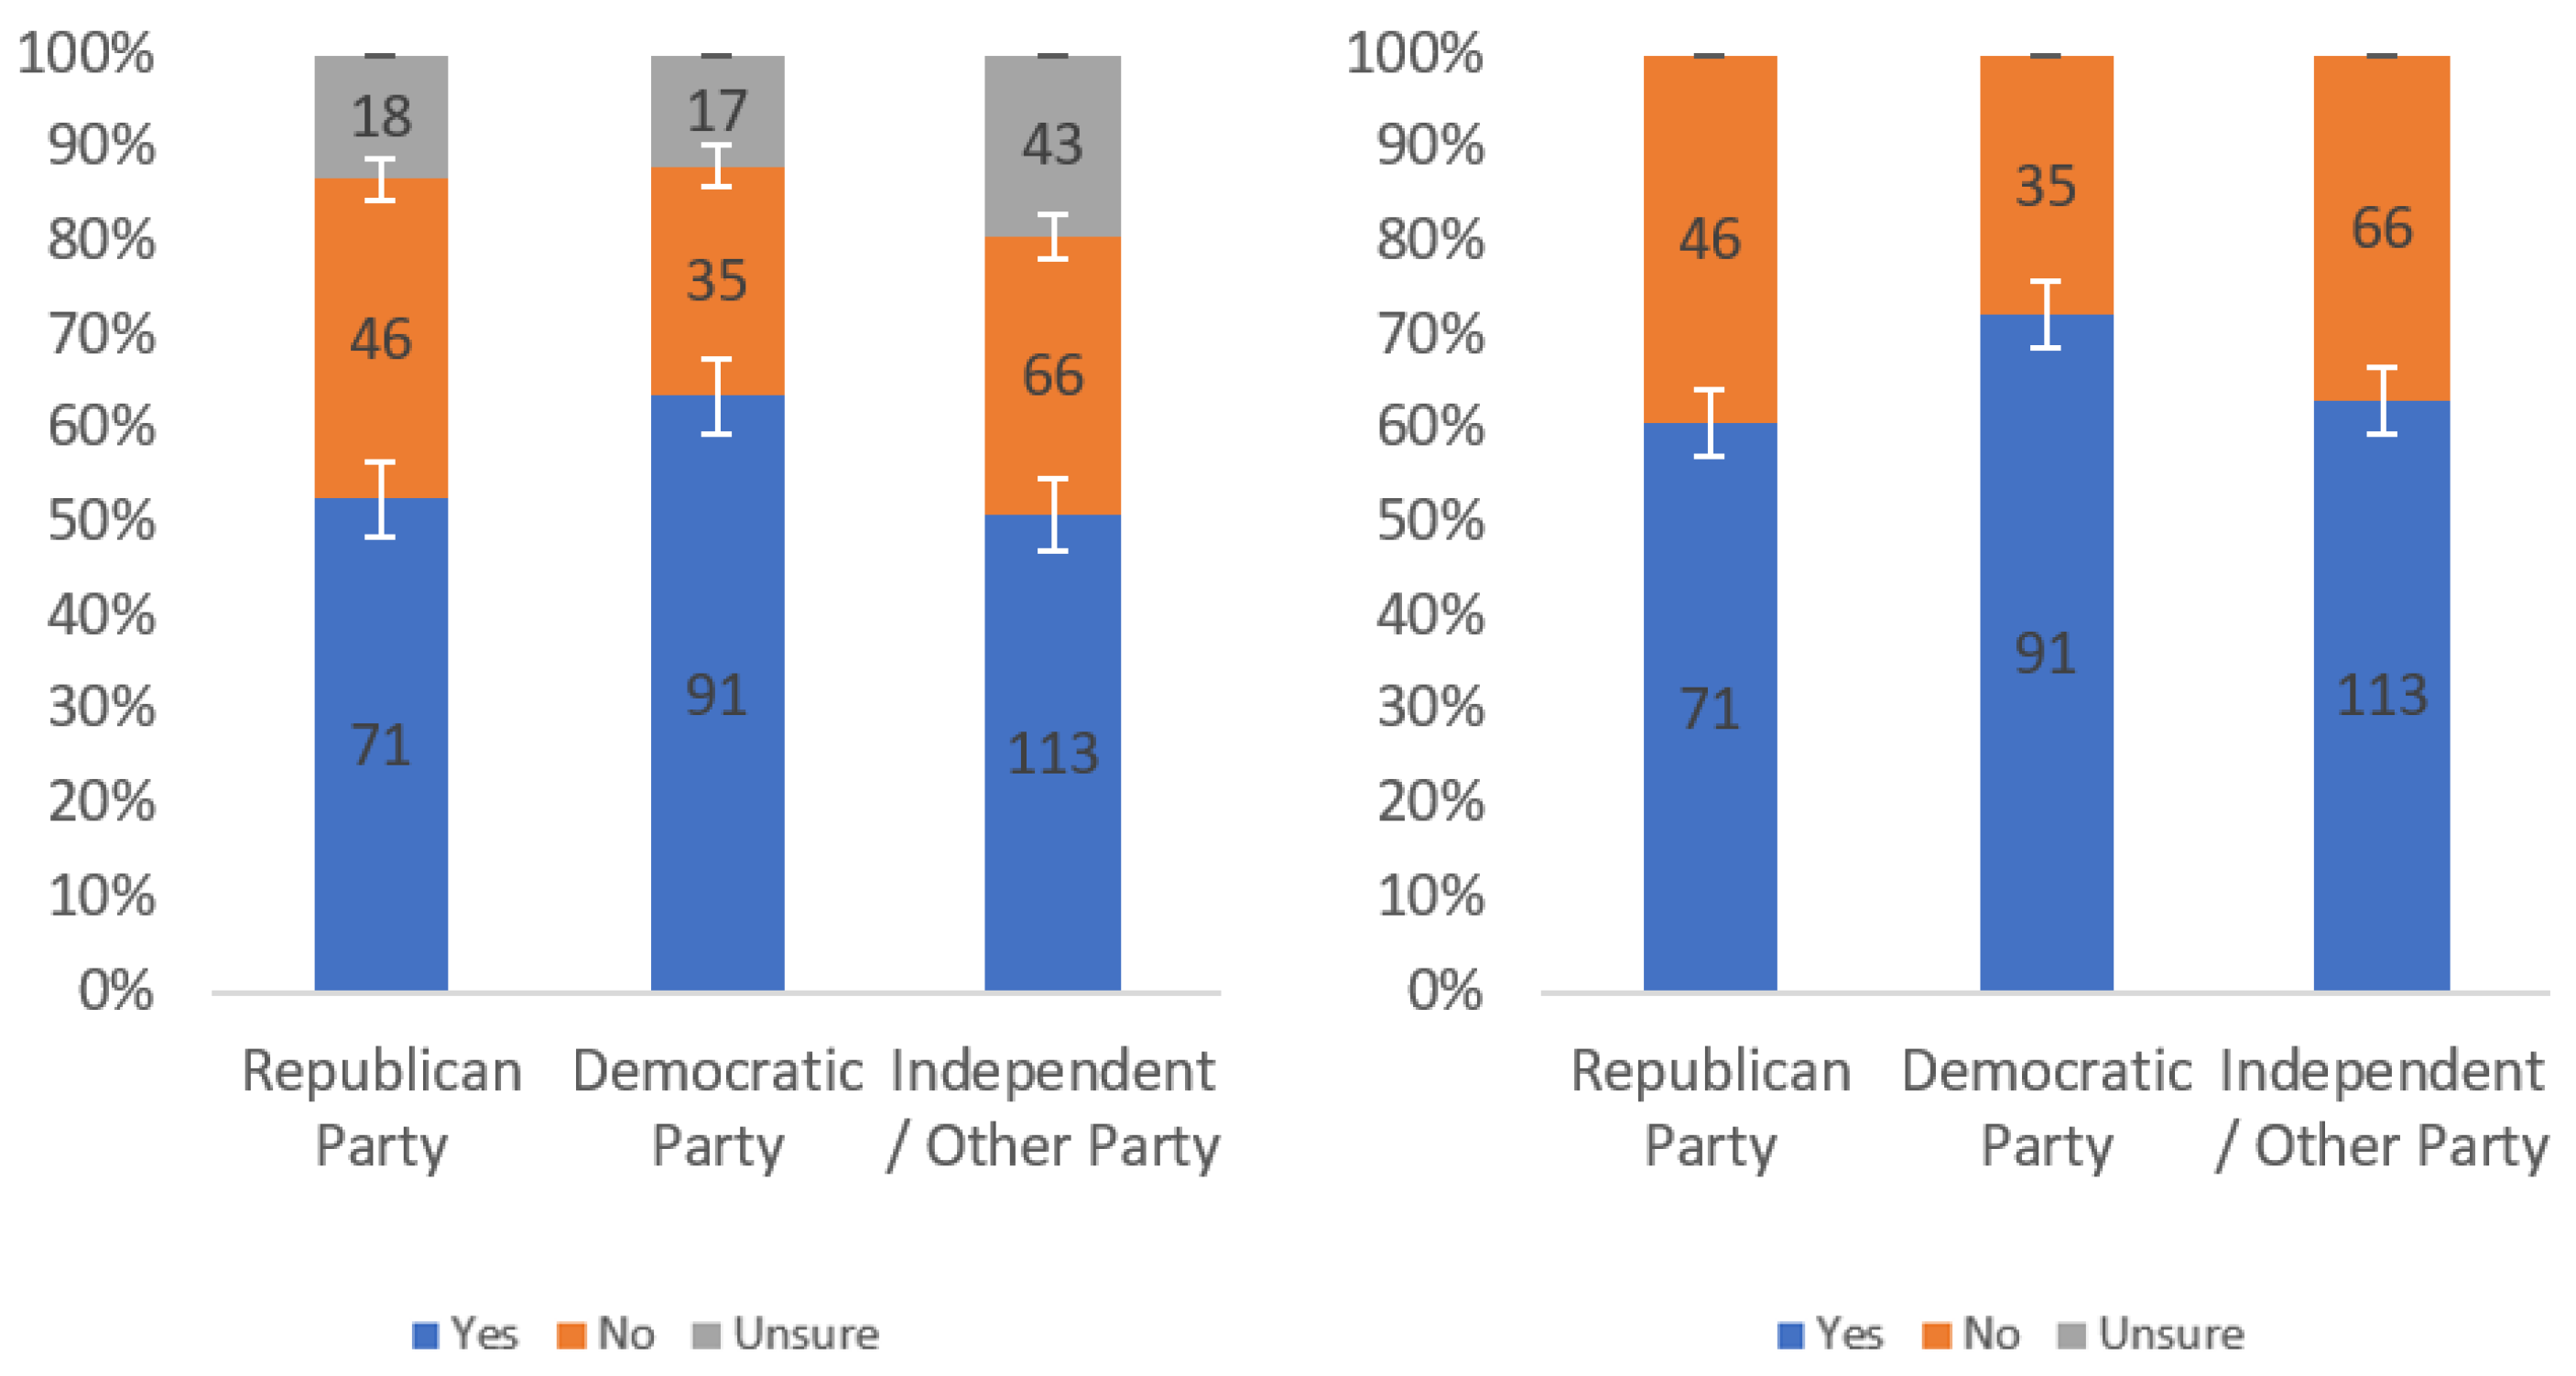
Responses regarding label helpfulness by party affiliation including (left) and excluding (right) unsure responses.
Figure 25.
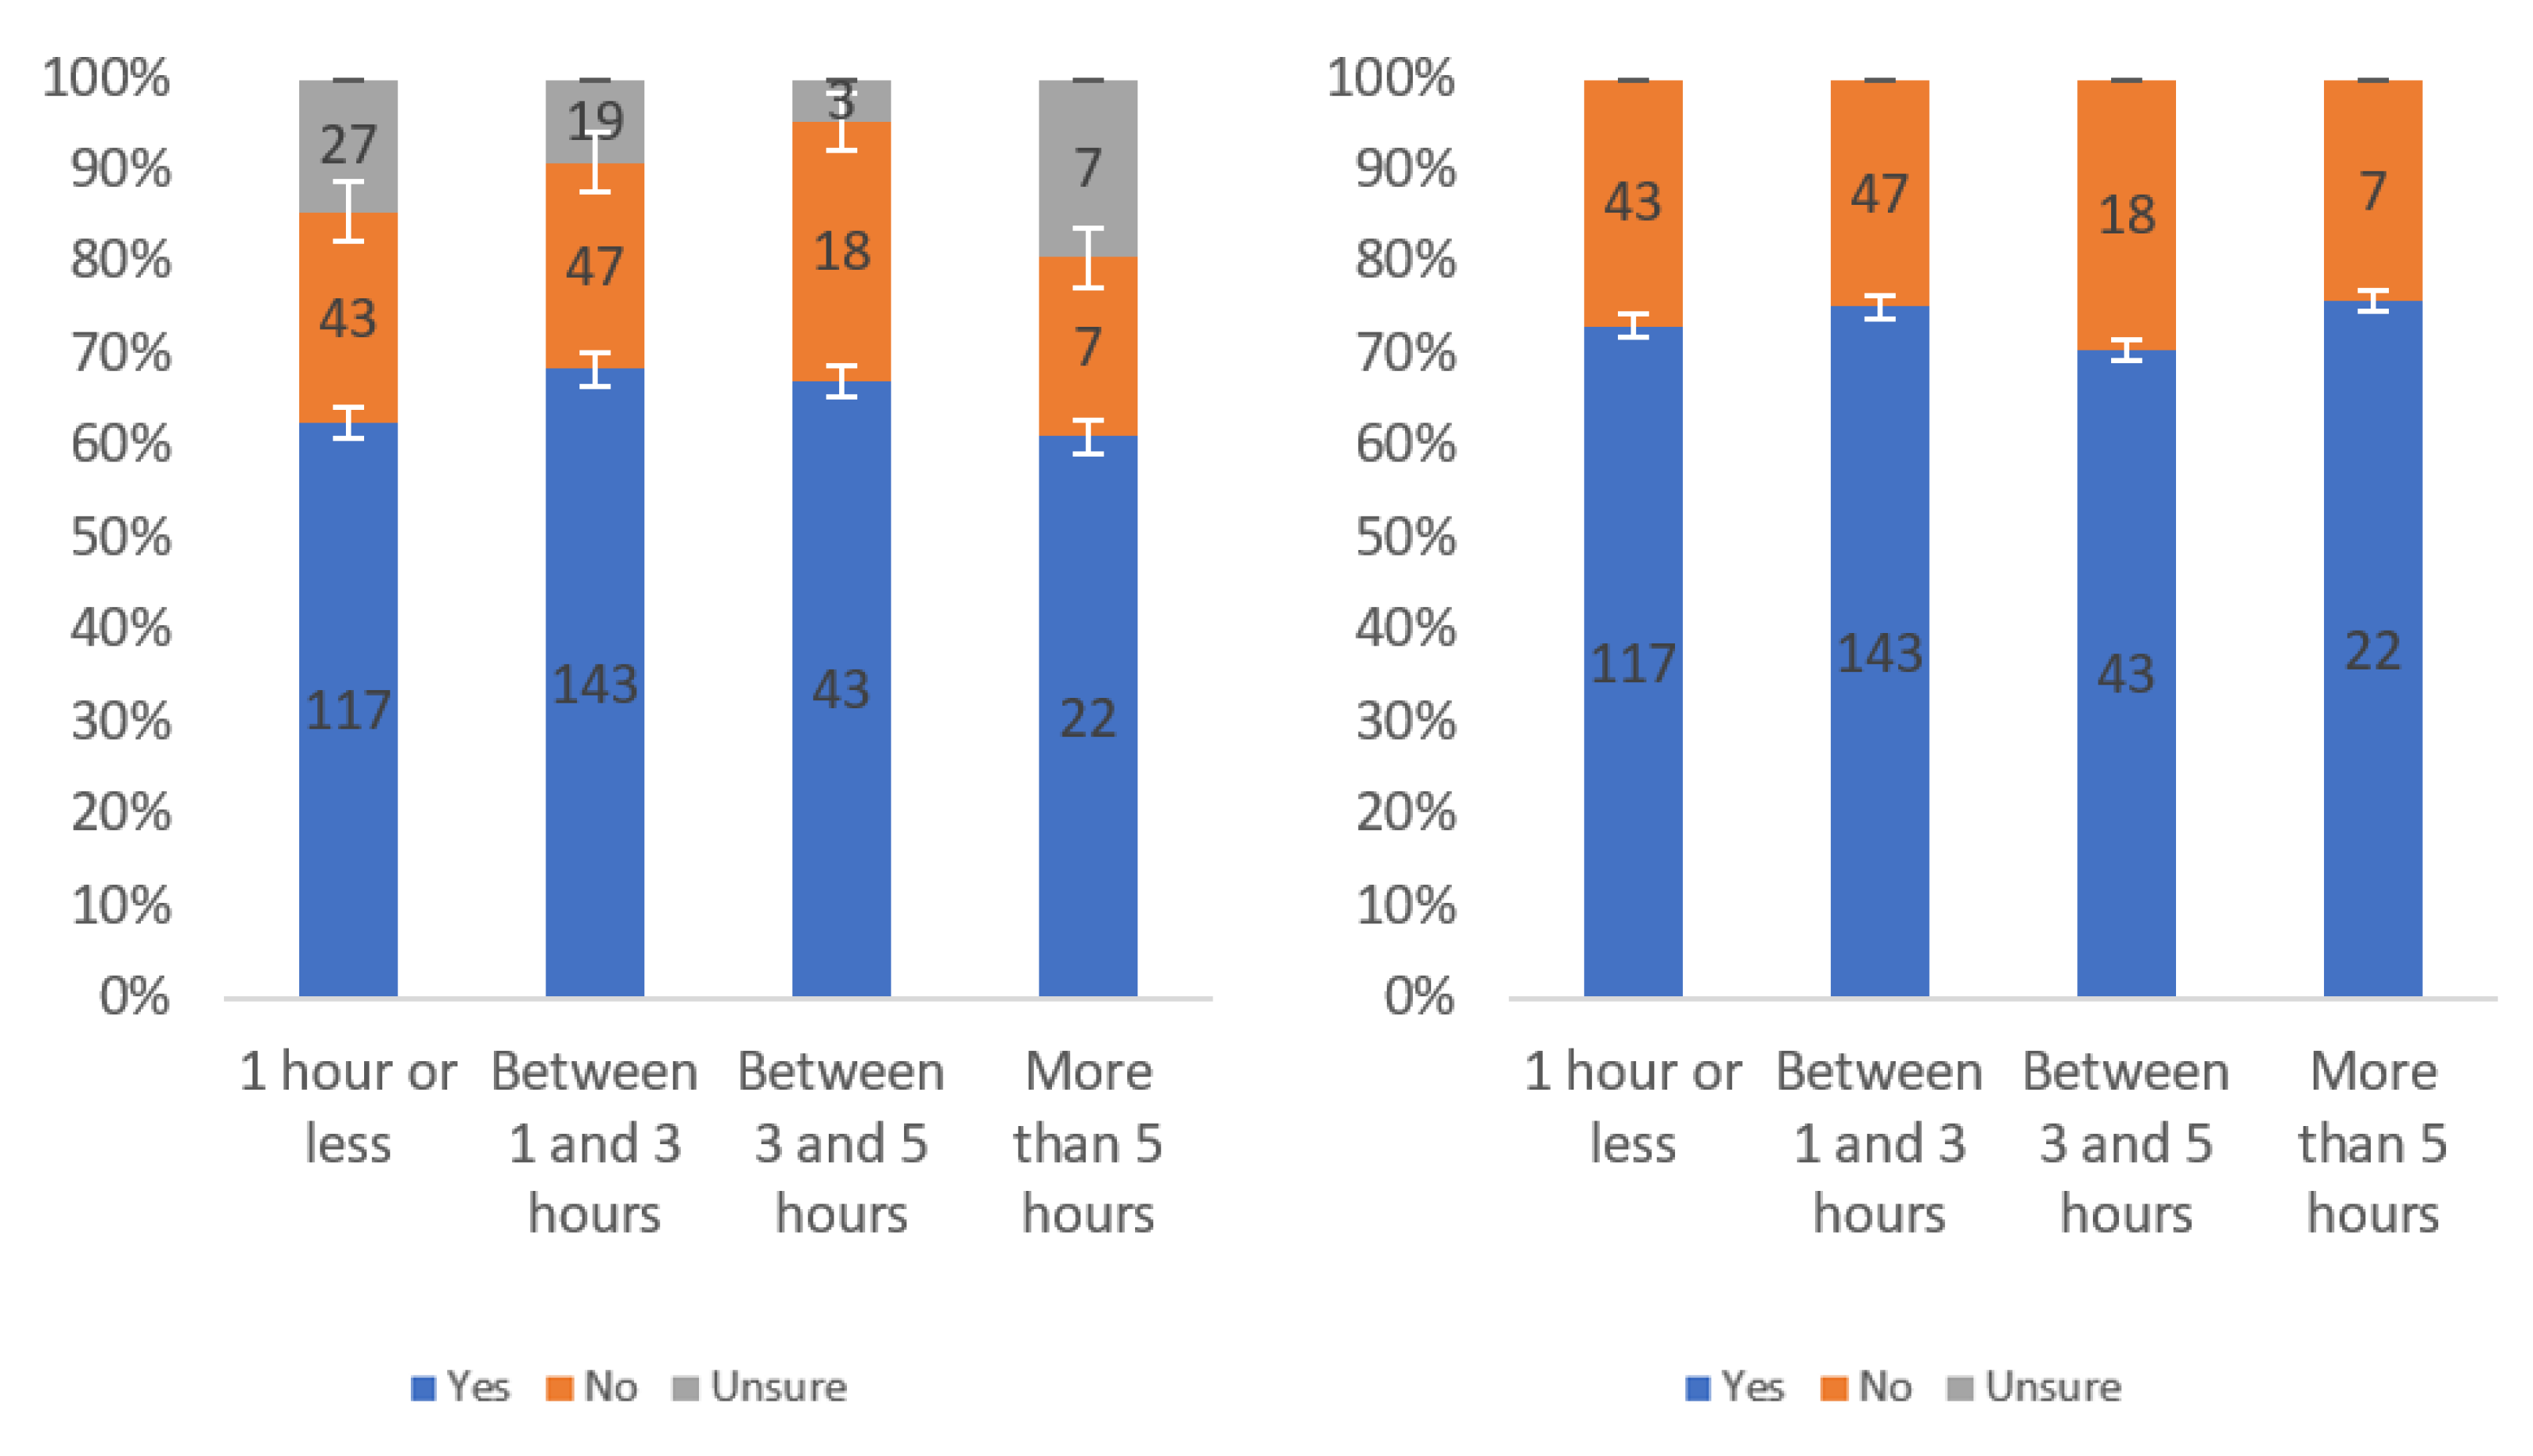
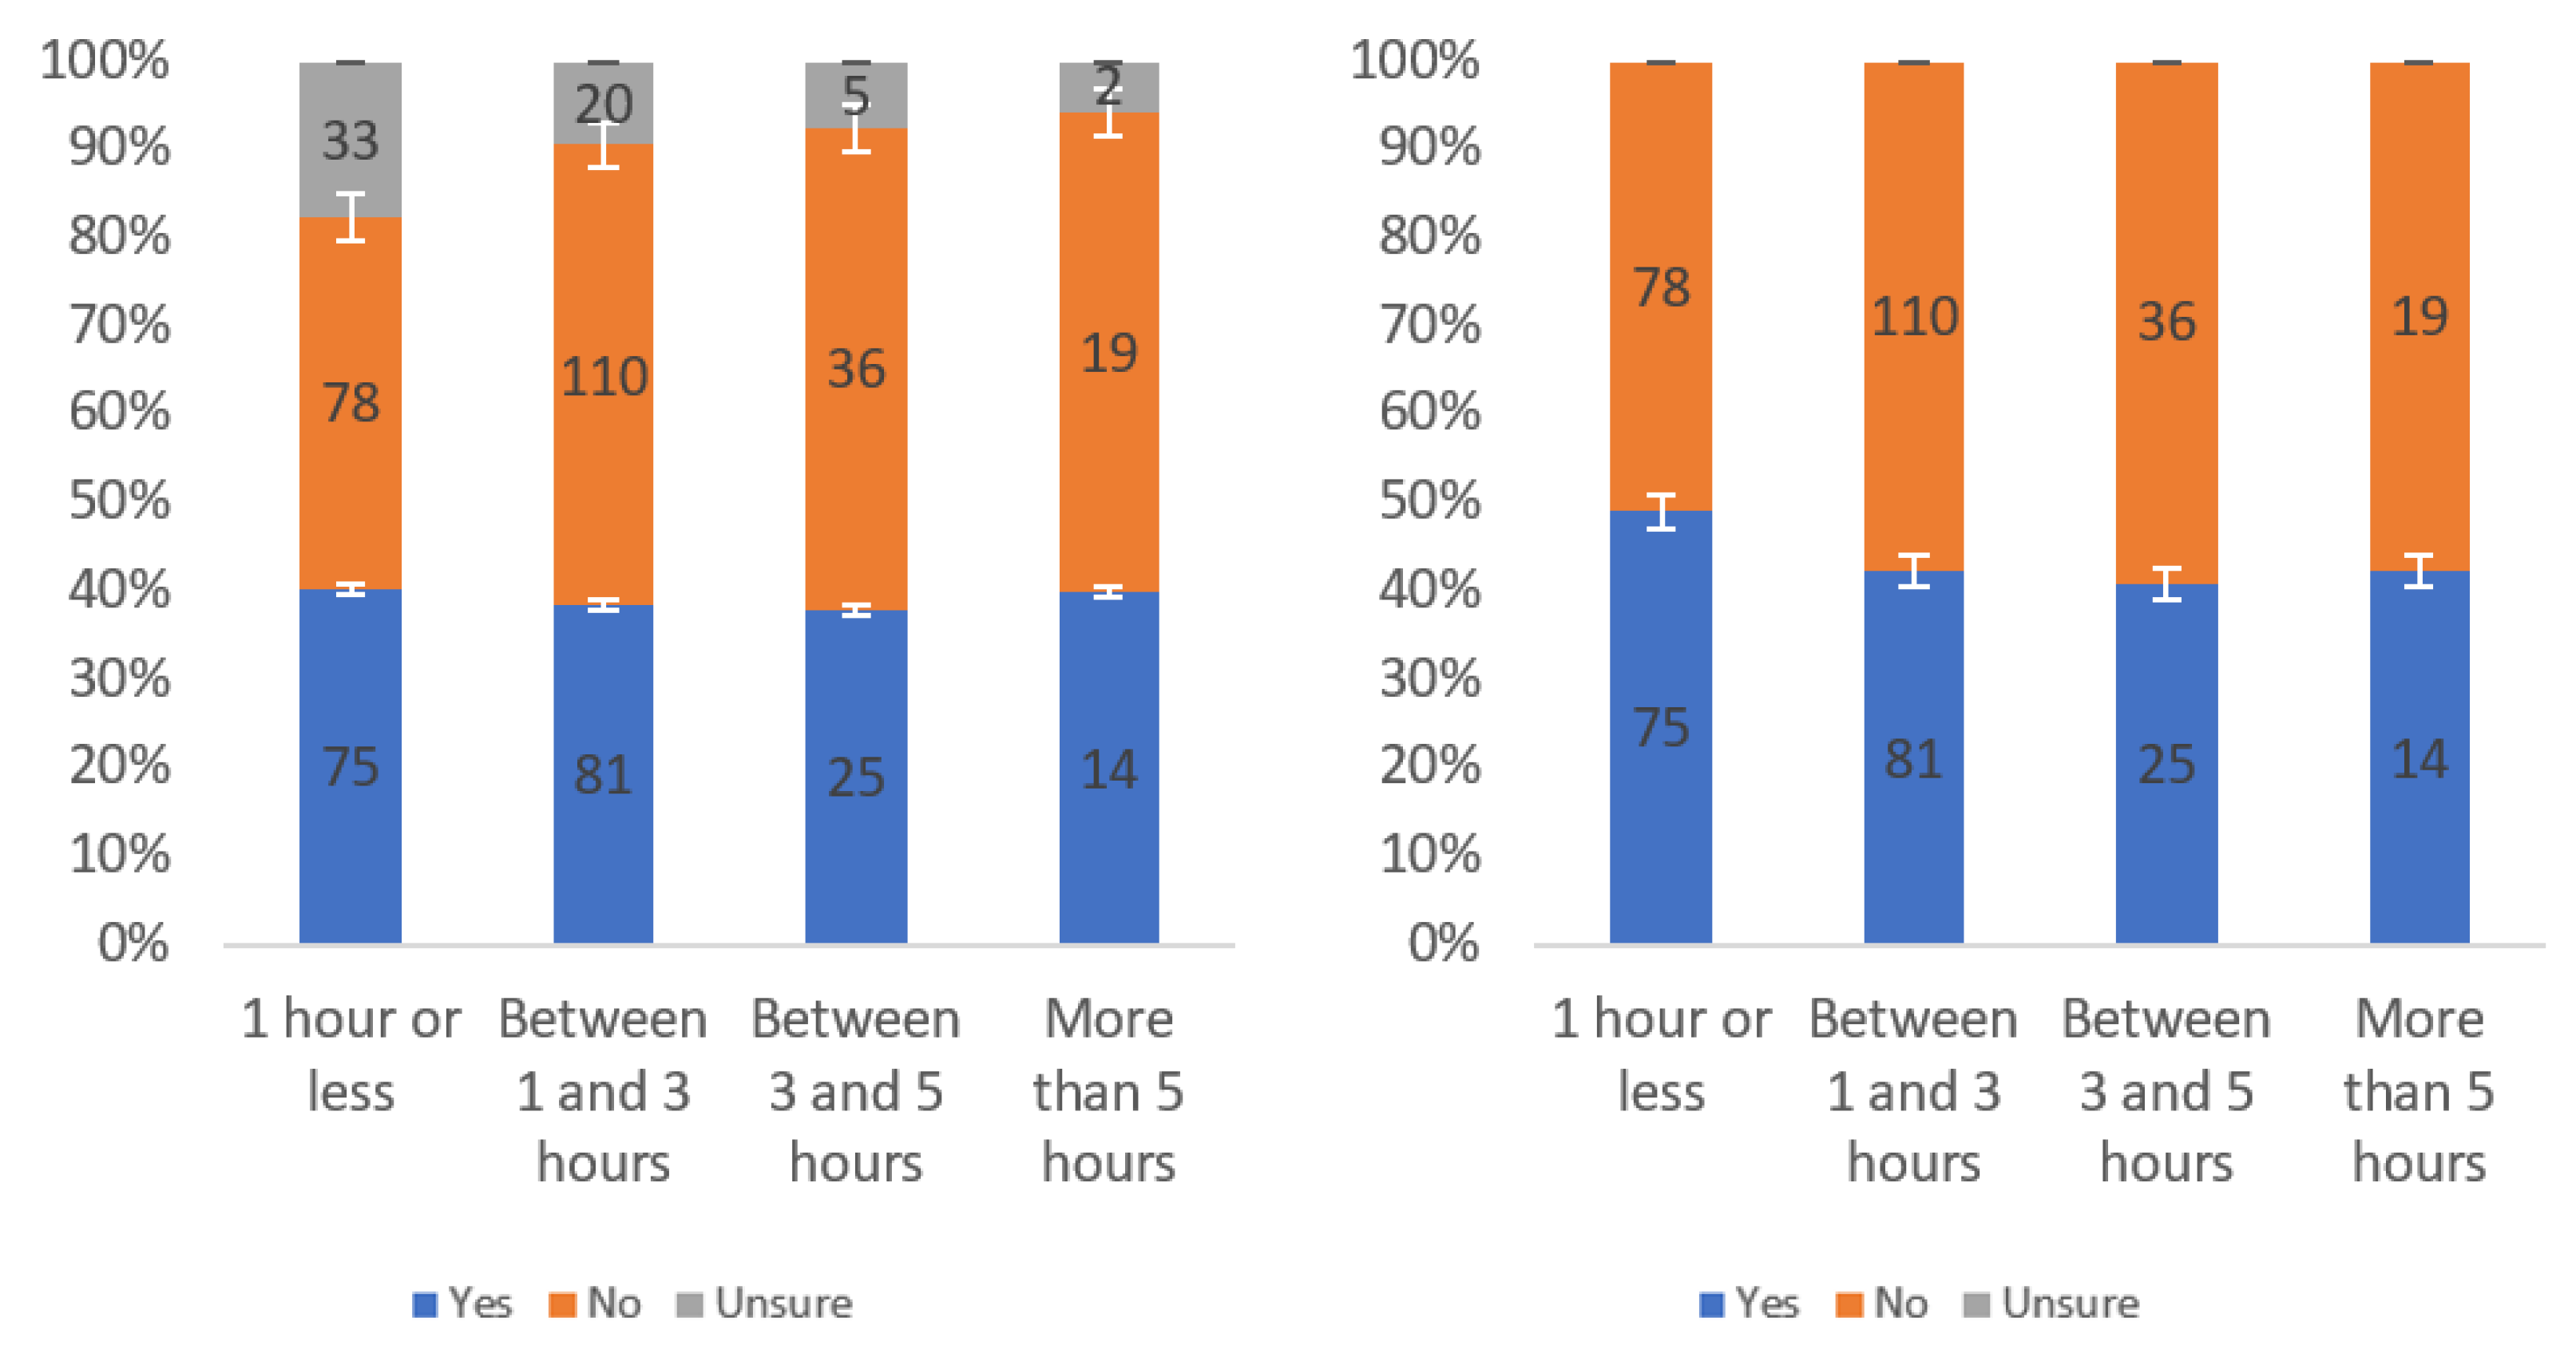
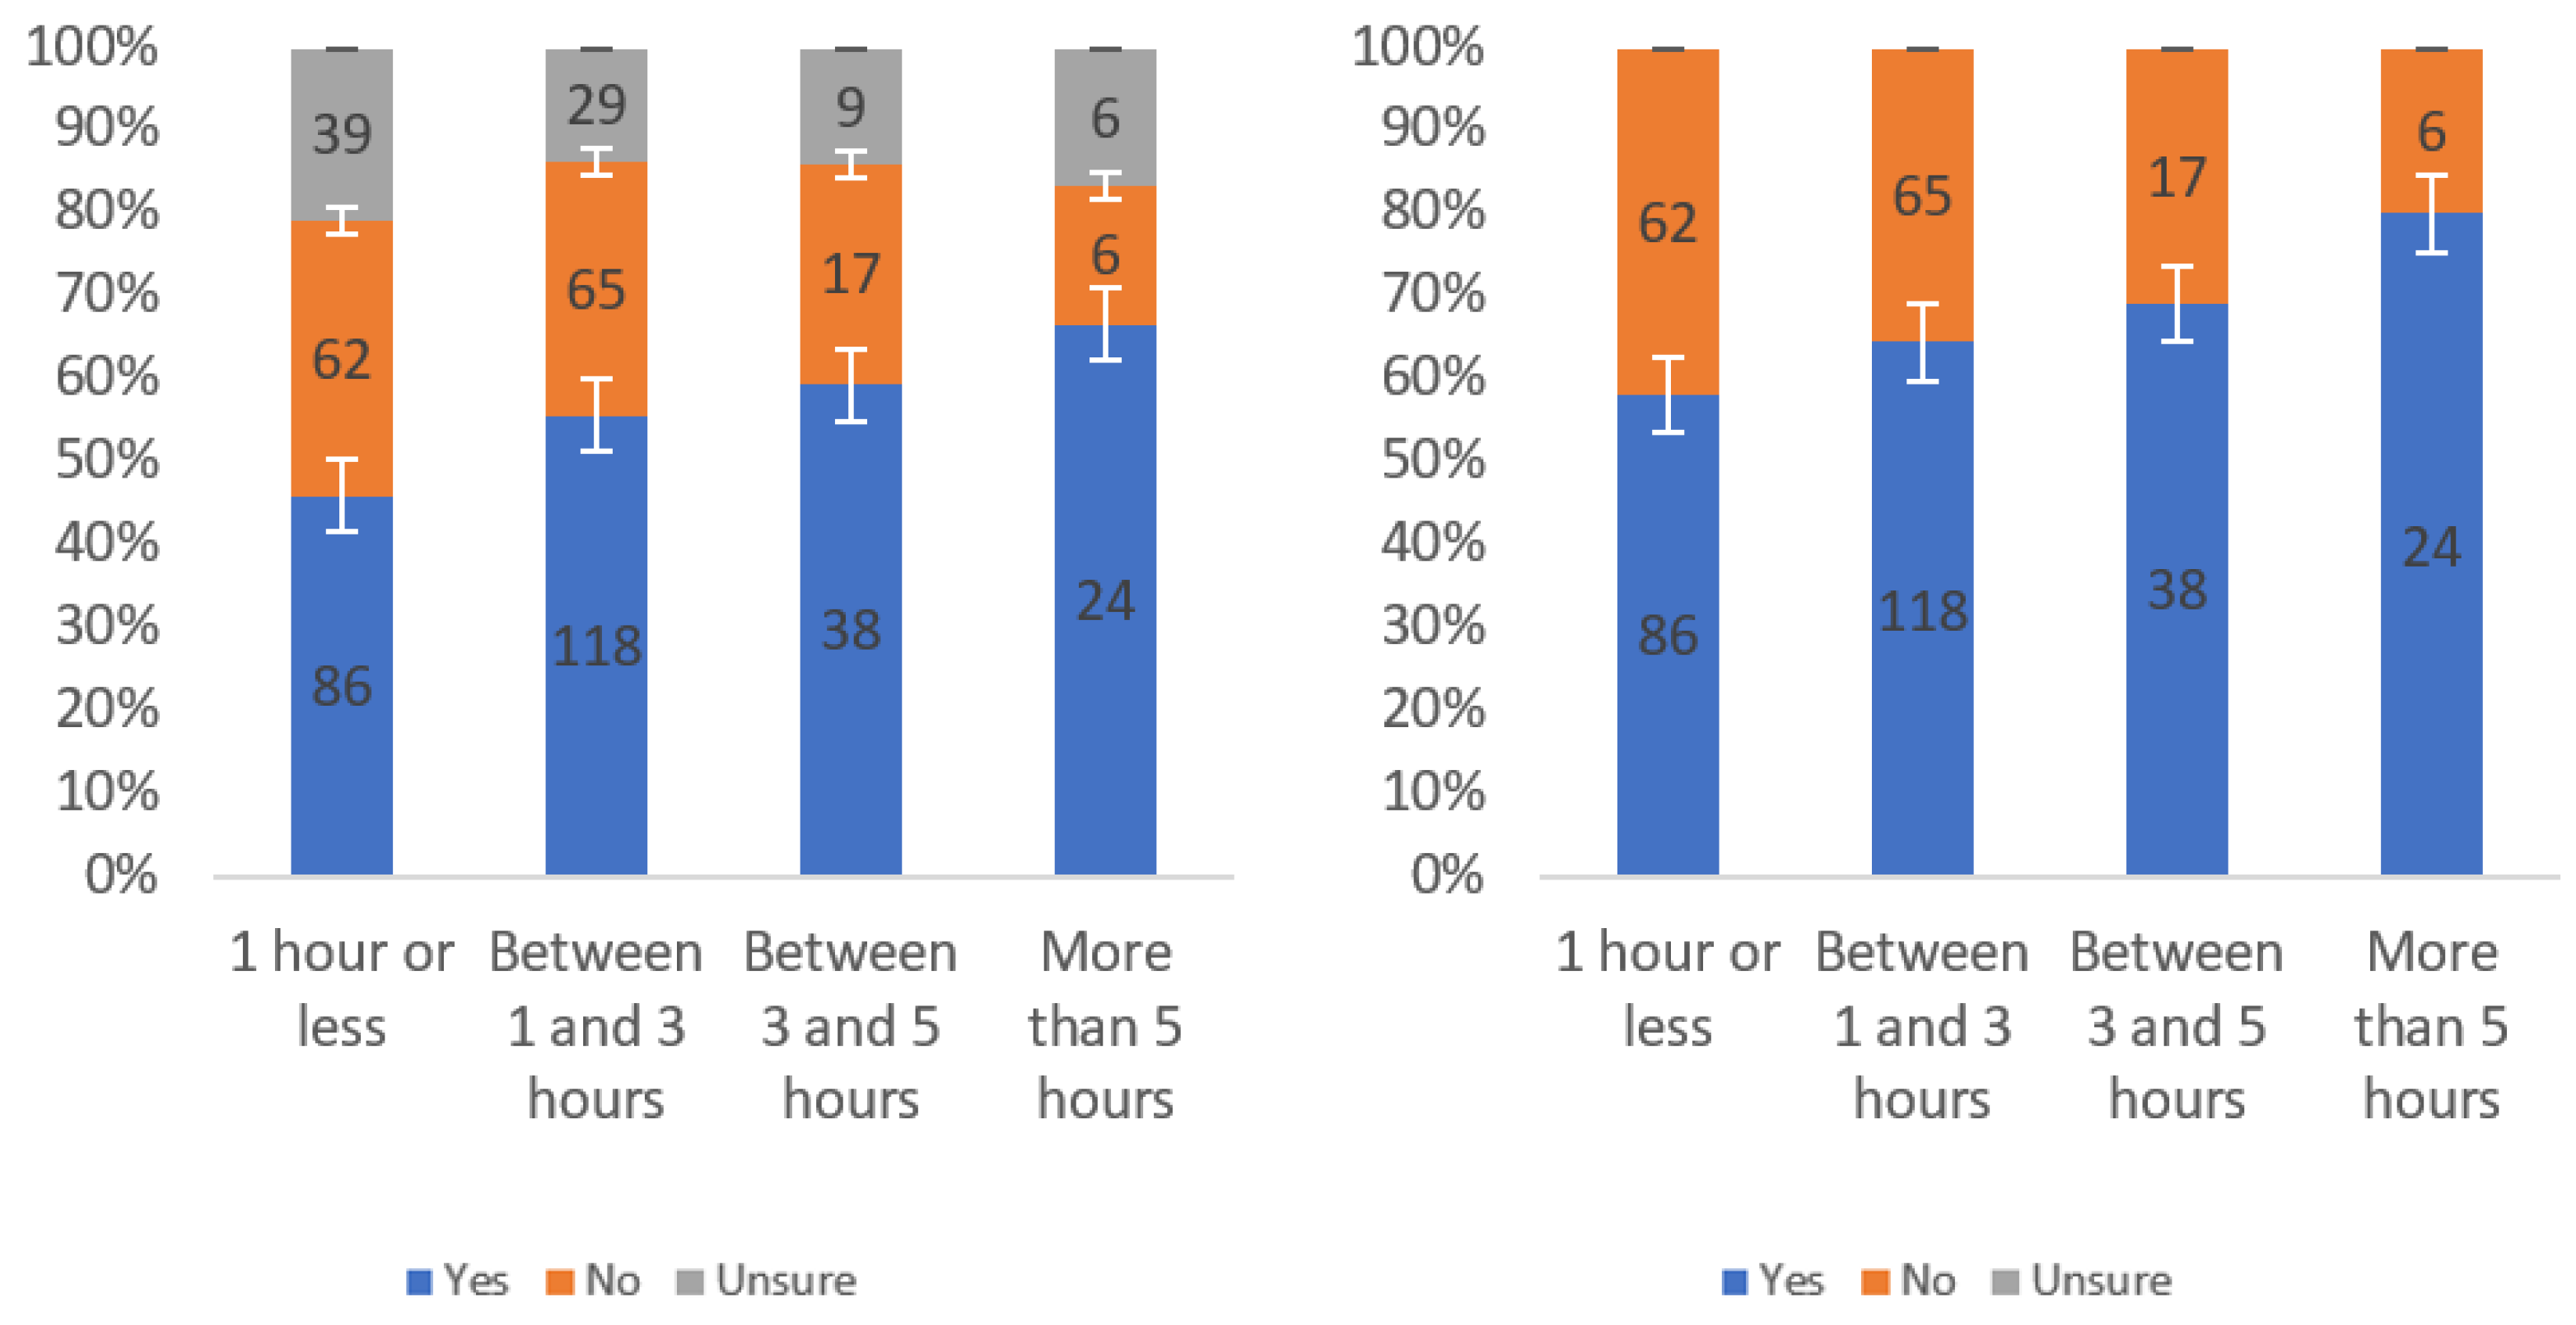
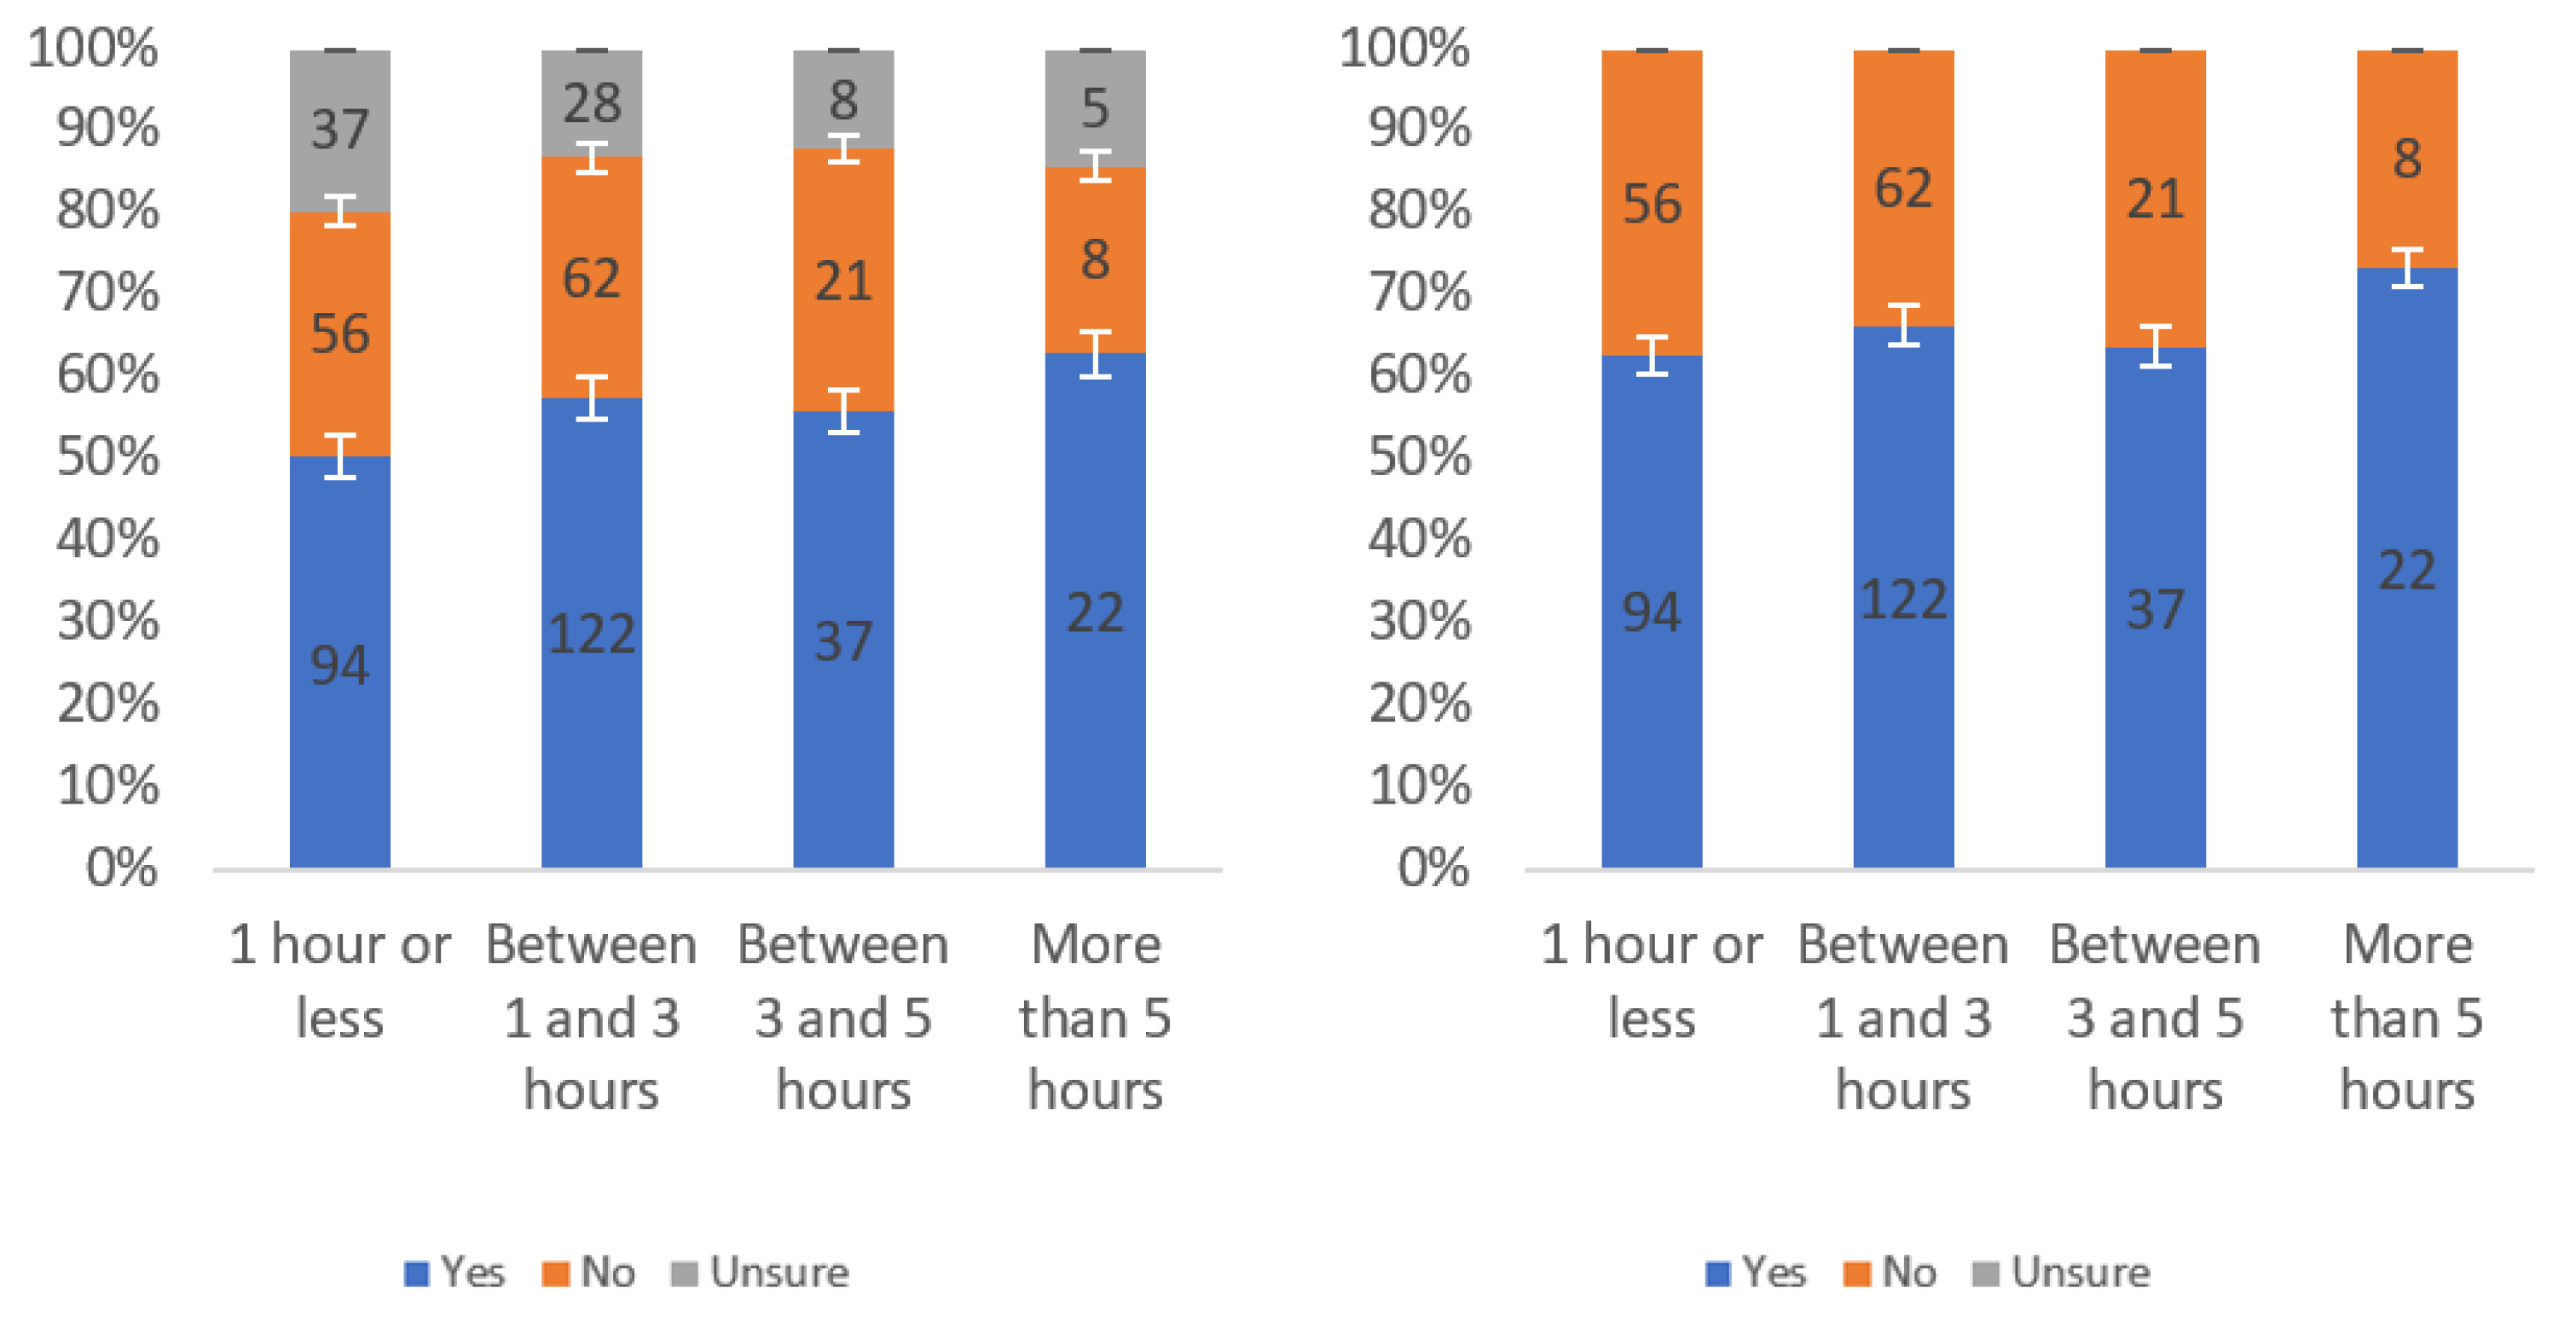
Responses regarding label helpfulness by internet usage level including (left) and excluding (right) unsure responses.
Figure 26.
Responses regarding label annoyingness by income level including (left) and excluding (right) unsure responses.
Figure 27.
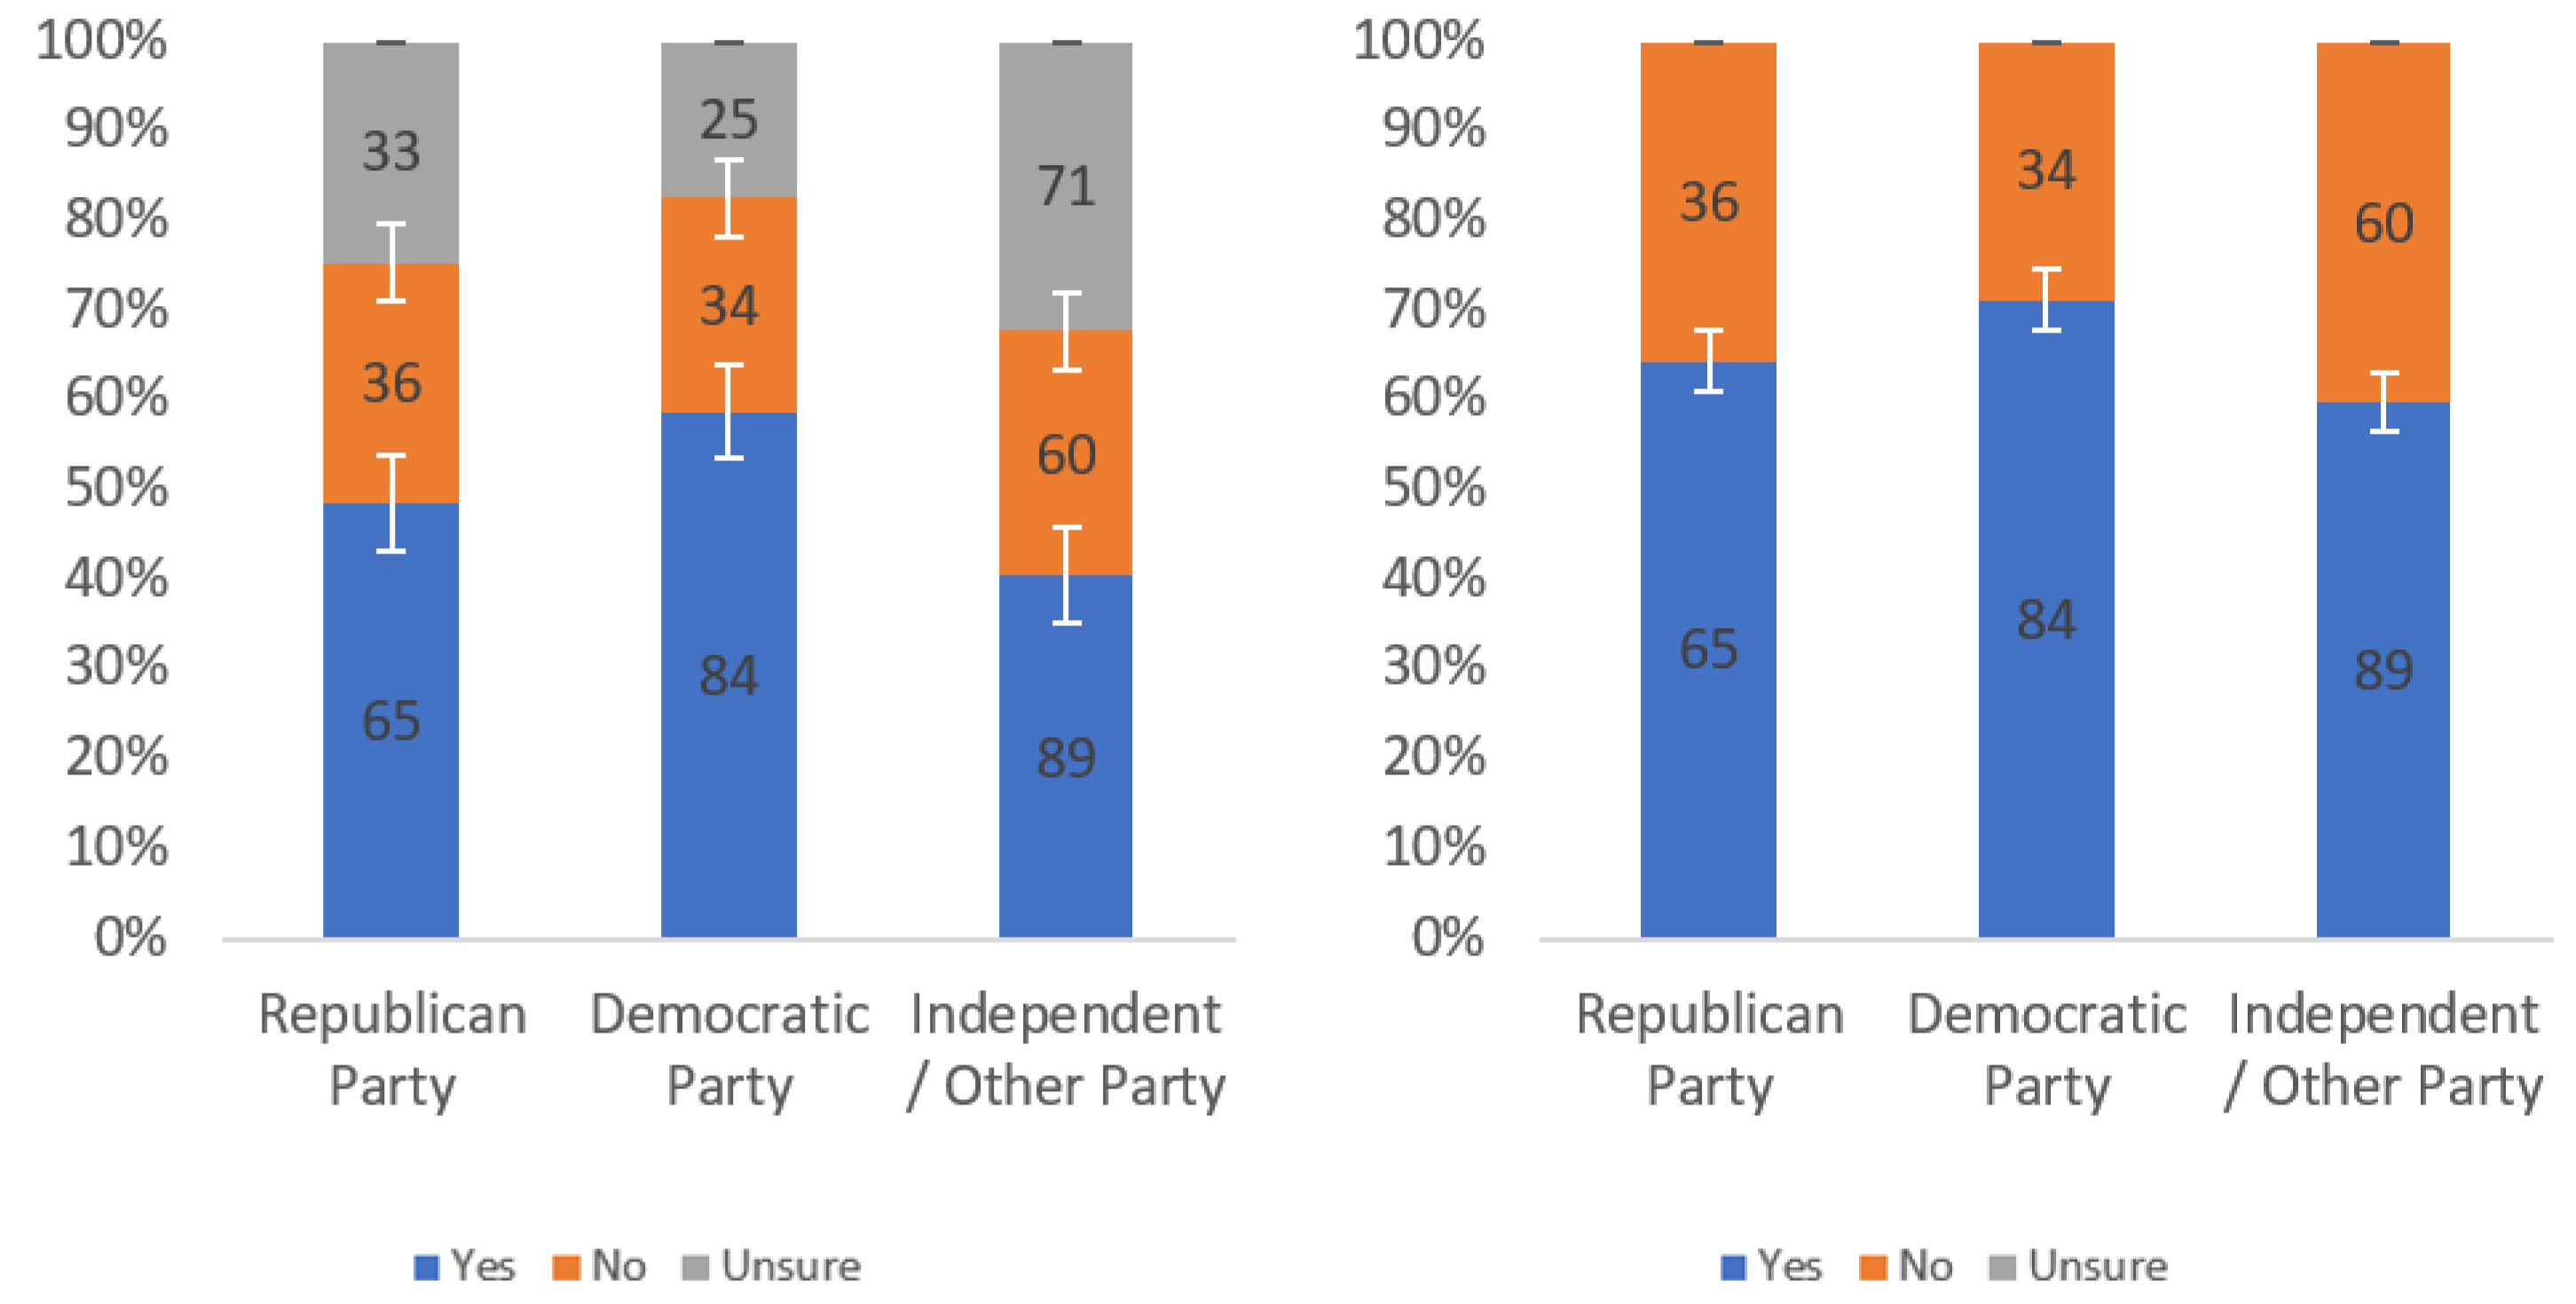
Responses regarding label annoyingness by political affiliation including (left) and excluding (right) unsure responses.
Figure 28.
Responses regarding label annoyingness by internet usage level including (left) and excluding (right) unsure responses.
Figure 29.
Responses regarding respondents’ willingness to review by income level including (left) and excluding (right) unsure responses.
Figure 30.
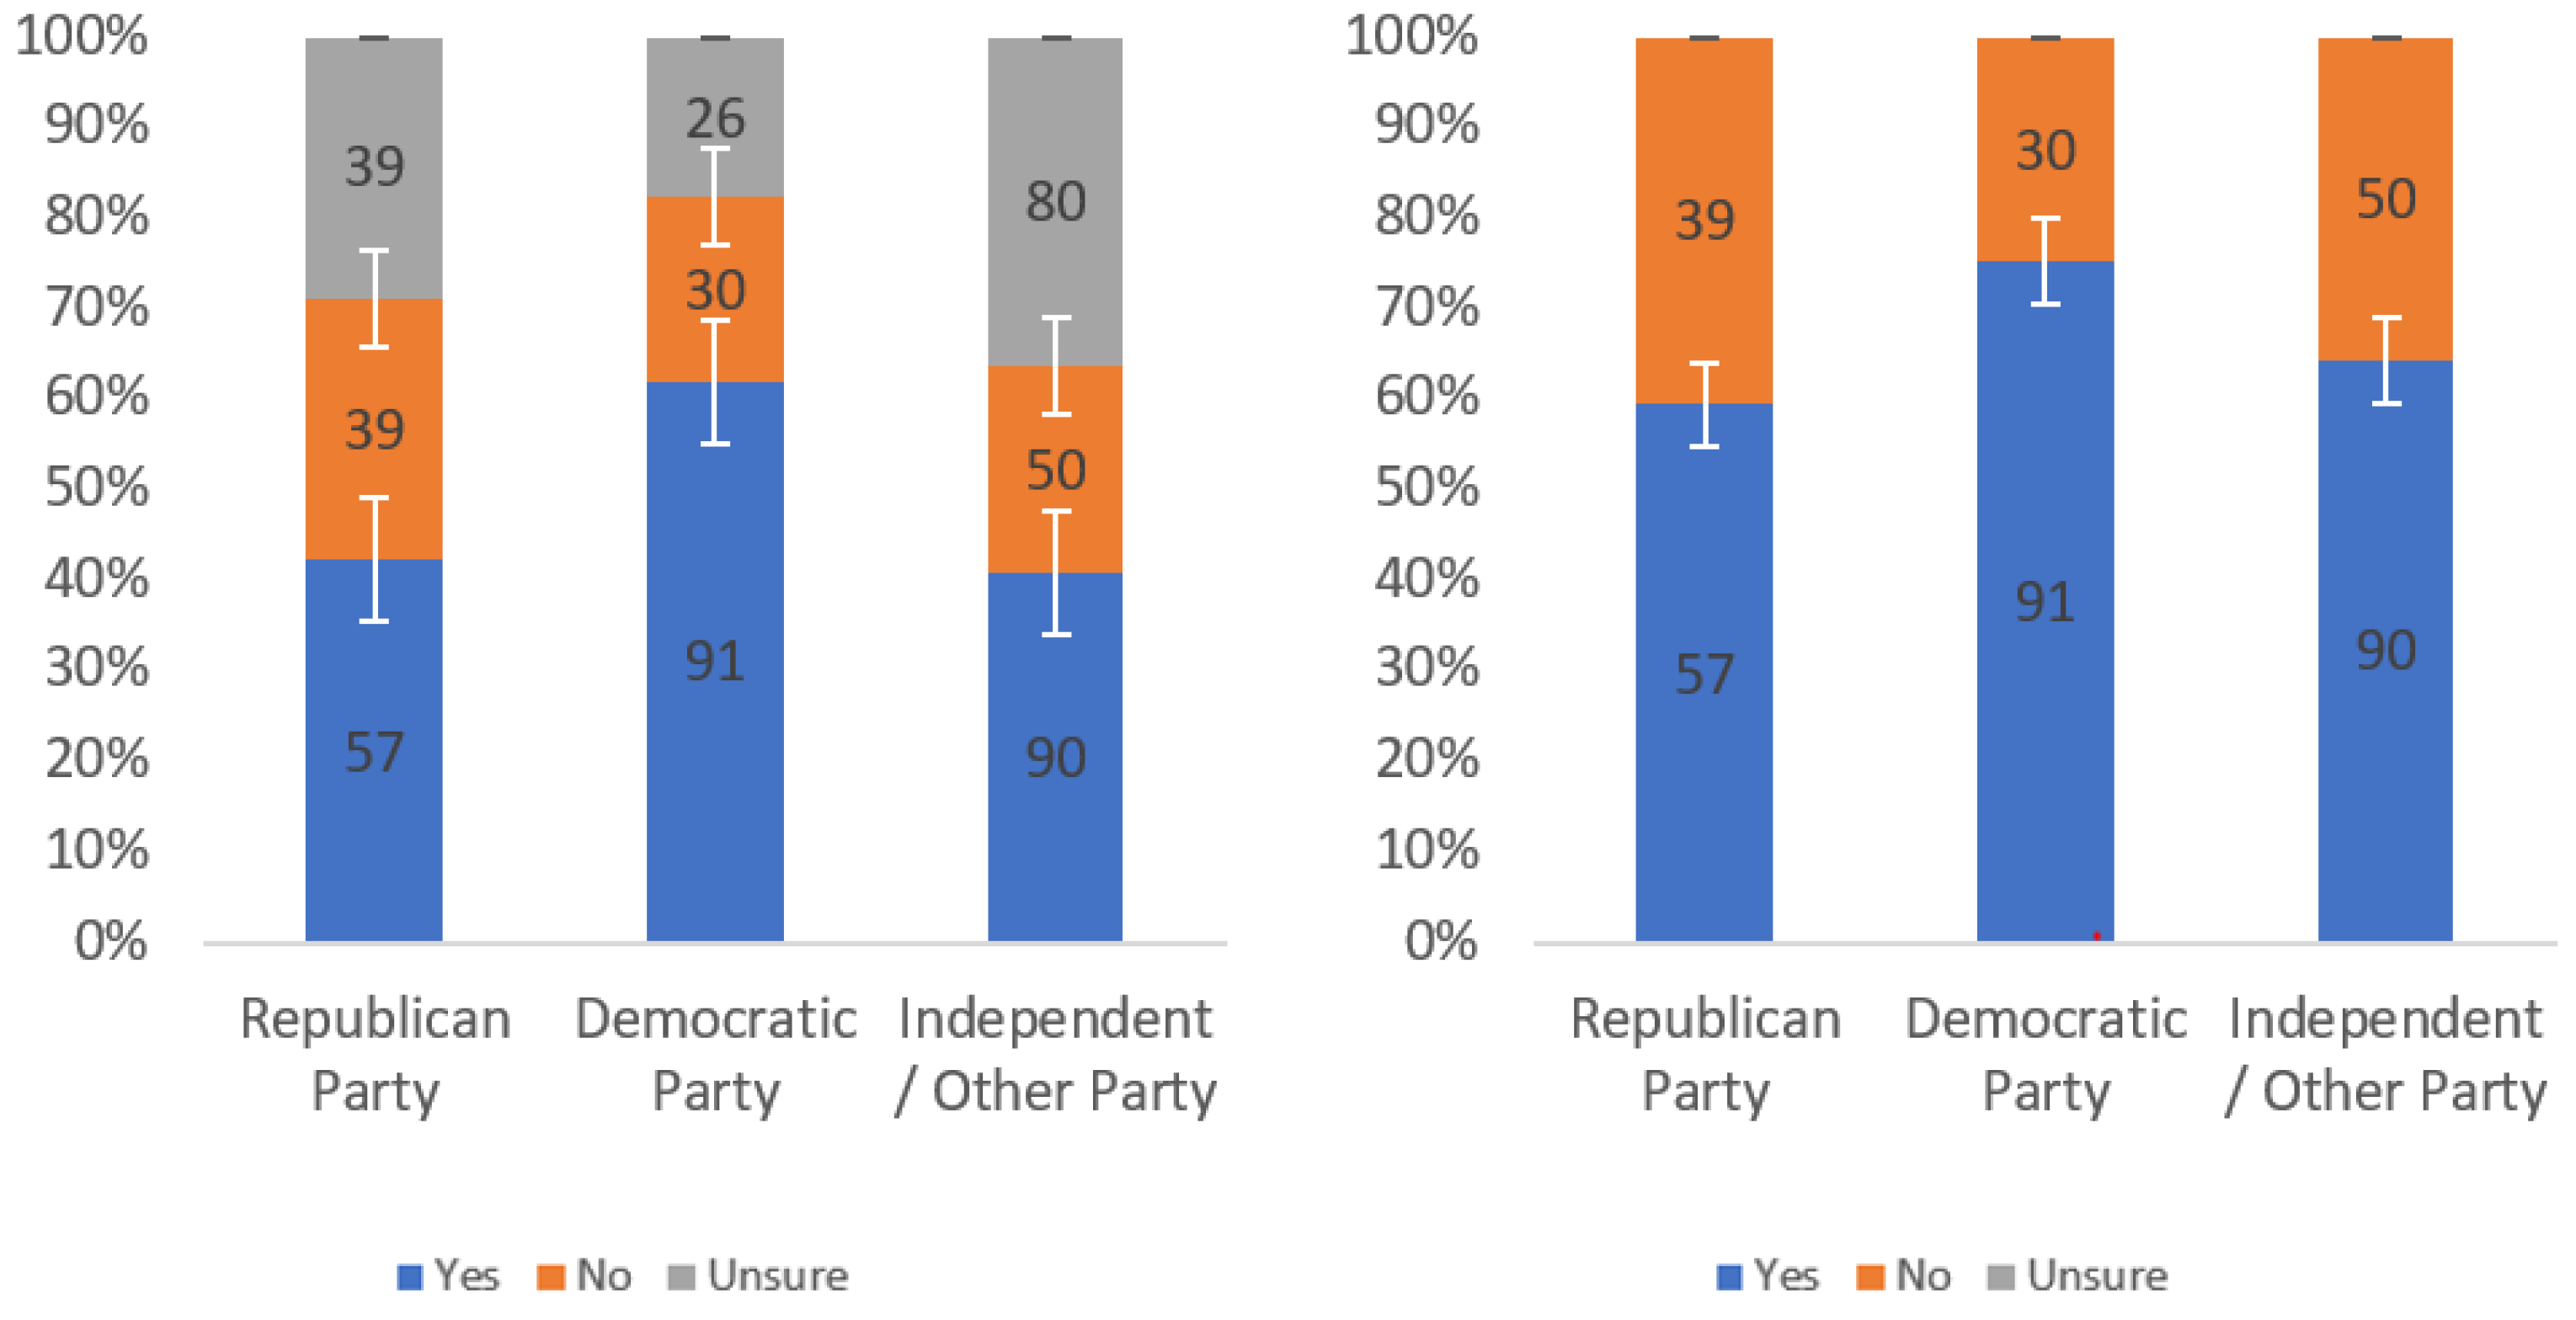
Responses regarding respondents’ willingness to review by party affiliation including (left) and excluding (right) unsure responses.
Figure 31.
Responses regarding respondents’ willingness to review by internet usage level including (left) and excluding (right) unsure responses.
Figure 32.
Responses regarding others’ willingness to review by income level including (left) and excluding (right) unsure responses.
Figure 33.
Responses regarding others’ willingness to review by party affiliation including (left) and excluding (right) unsure responses.
Figure 34.
Responses regarding others’ willingness to review by internet usage level including (left) and excluding (right) unsure responses.
Figure 35.
Responses regarding usefulness in judging trustworthiness by income level including (left) and excluding (right) unsure responses.
Figure 36.
Responses regarding usefulness in judging trustworthiness by party affiliation including (left) and excluding (right) unsure responses.
Figure 37.
Responses regarding usefulness in judging trustworthiness by internet usage level including (left) and excluding (right) unsure responses.
Figure 38.
Blocking warning label [
76].
Figure 39.
Responses regarding label helpfulness by income level including (left) and excluding (right) unsure responses.
Figure 40.
Responses regarding label helpfulness by party affiliation including (left) and excluding (right) unsure responses.
Figure 41.
Responses regarding label helpfulness by internet usage level including (left) and excluding (right) unsure responses.
Figure 42.
Responses regarding label annoyingness by income level including (left) and excluding (right) unsure responses.
Figure 43.
Responses regarding label annoyingness by party affiliation including (left) and excluding (right) unsure responses.
Figure 44.
Responses regarding label annoyingness by internet usage level including (left) and excluding (right) unsure responses.
Figure 45.
Responses regarding respondents’ willingness to review by income level including (left) and excluding (right) unsure responses.
Figure 46.
Responses regarding respondents’ willingness to review by party affiliation including (left) and excluding (right) unsure responses.
Figure 47.
Responses regarding respondents’ willingness to review by internet usage level including (left) and excluding (right) unsure responses.
Figure 48.
Responses regarding others’ willingness to review by income level including (left) and excluding (right) unsure responses.
Figure 49.
Responses regarding others’ willingness to review by political affiliation including (left) and excluding (right) unsure responses.
Figure 50.
Responses regarding others’ willingness to review by internet usage level including (left) and excluding (right) unsure responses.
Figure 51.
Responses regarding usefulness in judging trustworthiness by income level including (left) and excluding (right) unsure responses.
Figure 52.
Responses regarding usefulness in judging trustworthiness by party affiliation including (left) and excluding (right) unsure responses.
Figure 53.
Responses regarding usefulness in judging trustworthiness by internet usage level including (left) and excluding (right) unsure responses.
Figure 54.
“Learn more” additional information label [
76].
Figure 55.
Responses regarding label helpfulness by income level including (left) and excluding (right) unsure responses.
Figure 56.
Responses regarding label helpfulness by party affiliation including (left) and excluding (right) unsure responses.
Figure 57.
Responses regarding label helpfulness by internet usage level including (left) and excluding (right) unsure responses.
Figure 58.
Responses regarding label annoyingness by income level including (left) and excluding (right) unsure responses.
Figure 59.
Responses regarding label annoyingness by party affiliation including (left) and excluding (right) unsure responses.
Figure 60.
Responses regarding label annoyingness by internet usage level including (left) and excluding (right) unsure responses.
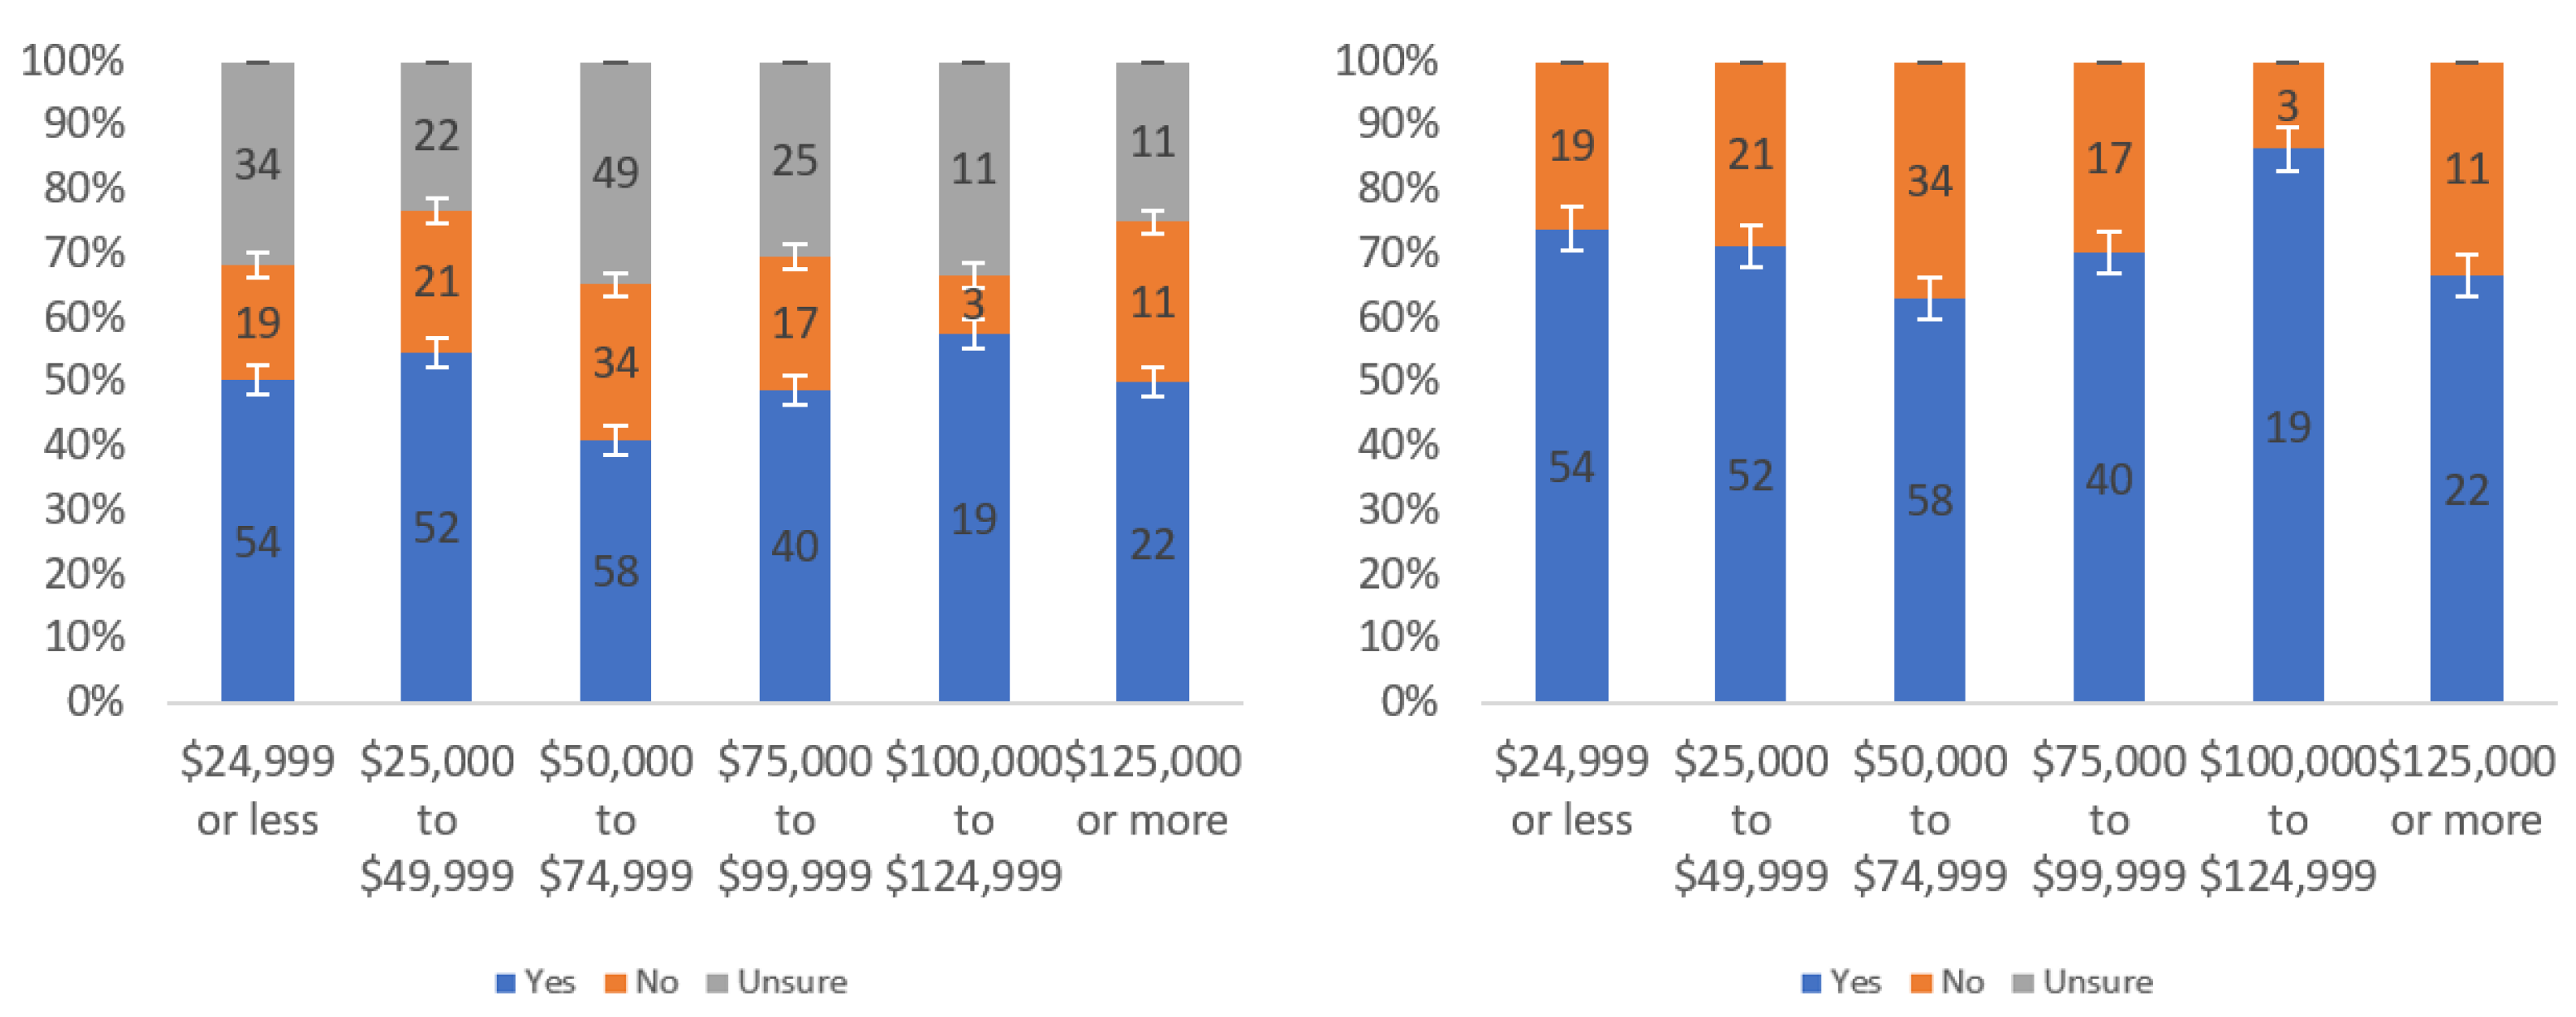
Figure 61.
Responses regarding respondents’ willingness to review by income level including (left) and excluding (right) unsure responses.
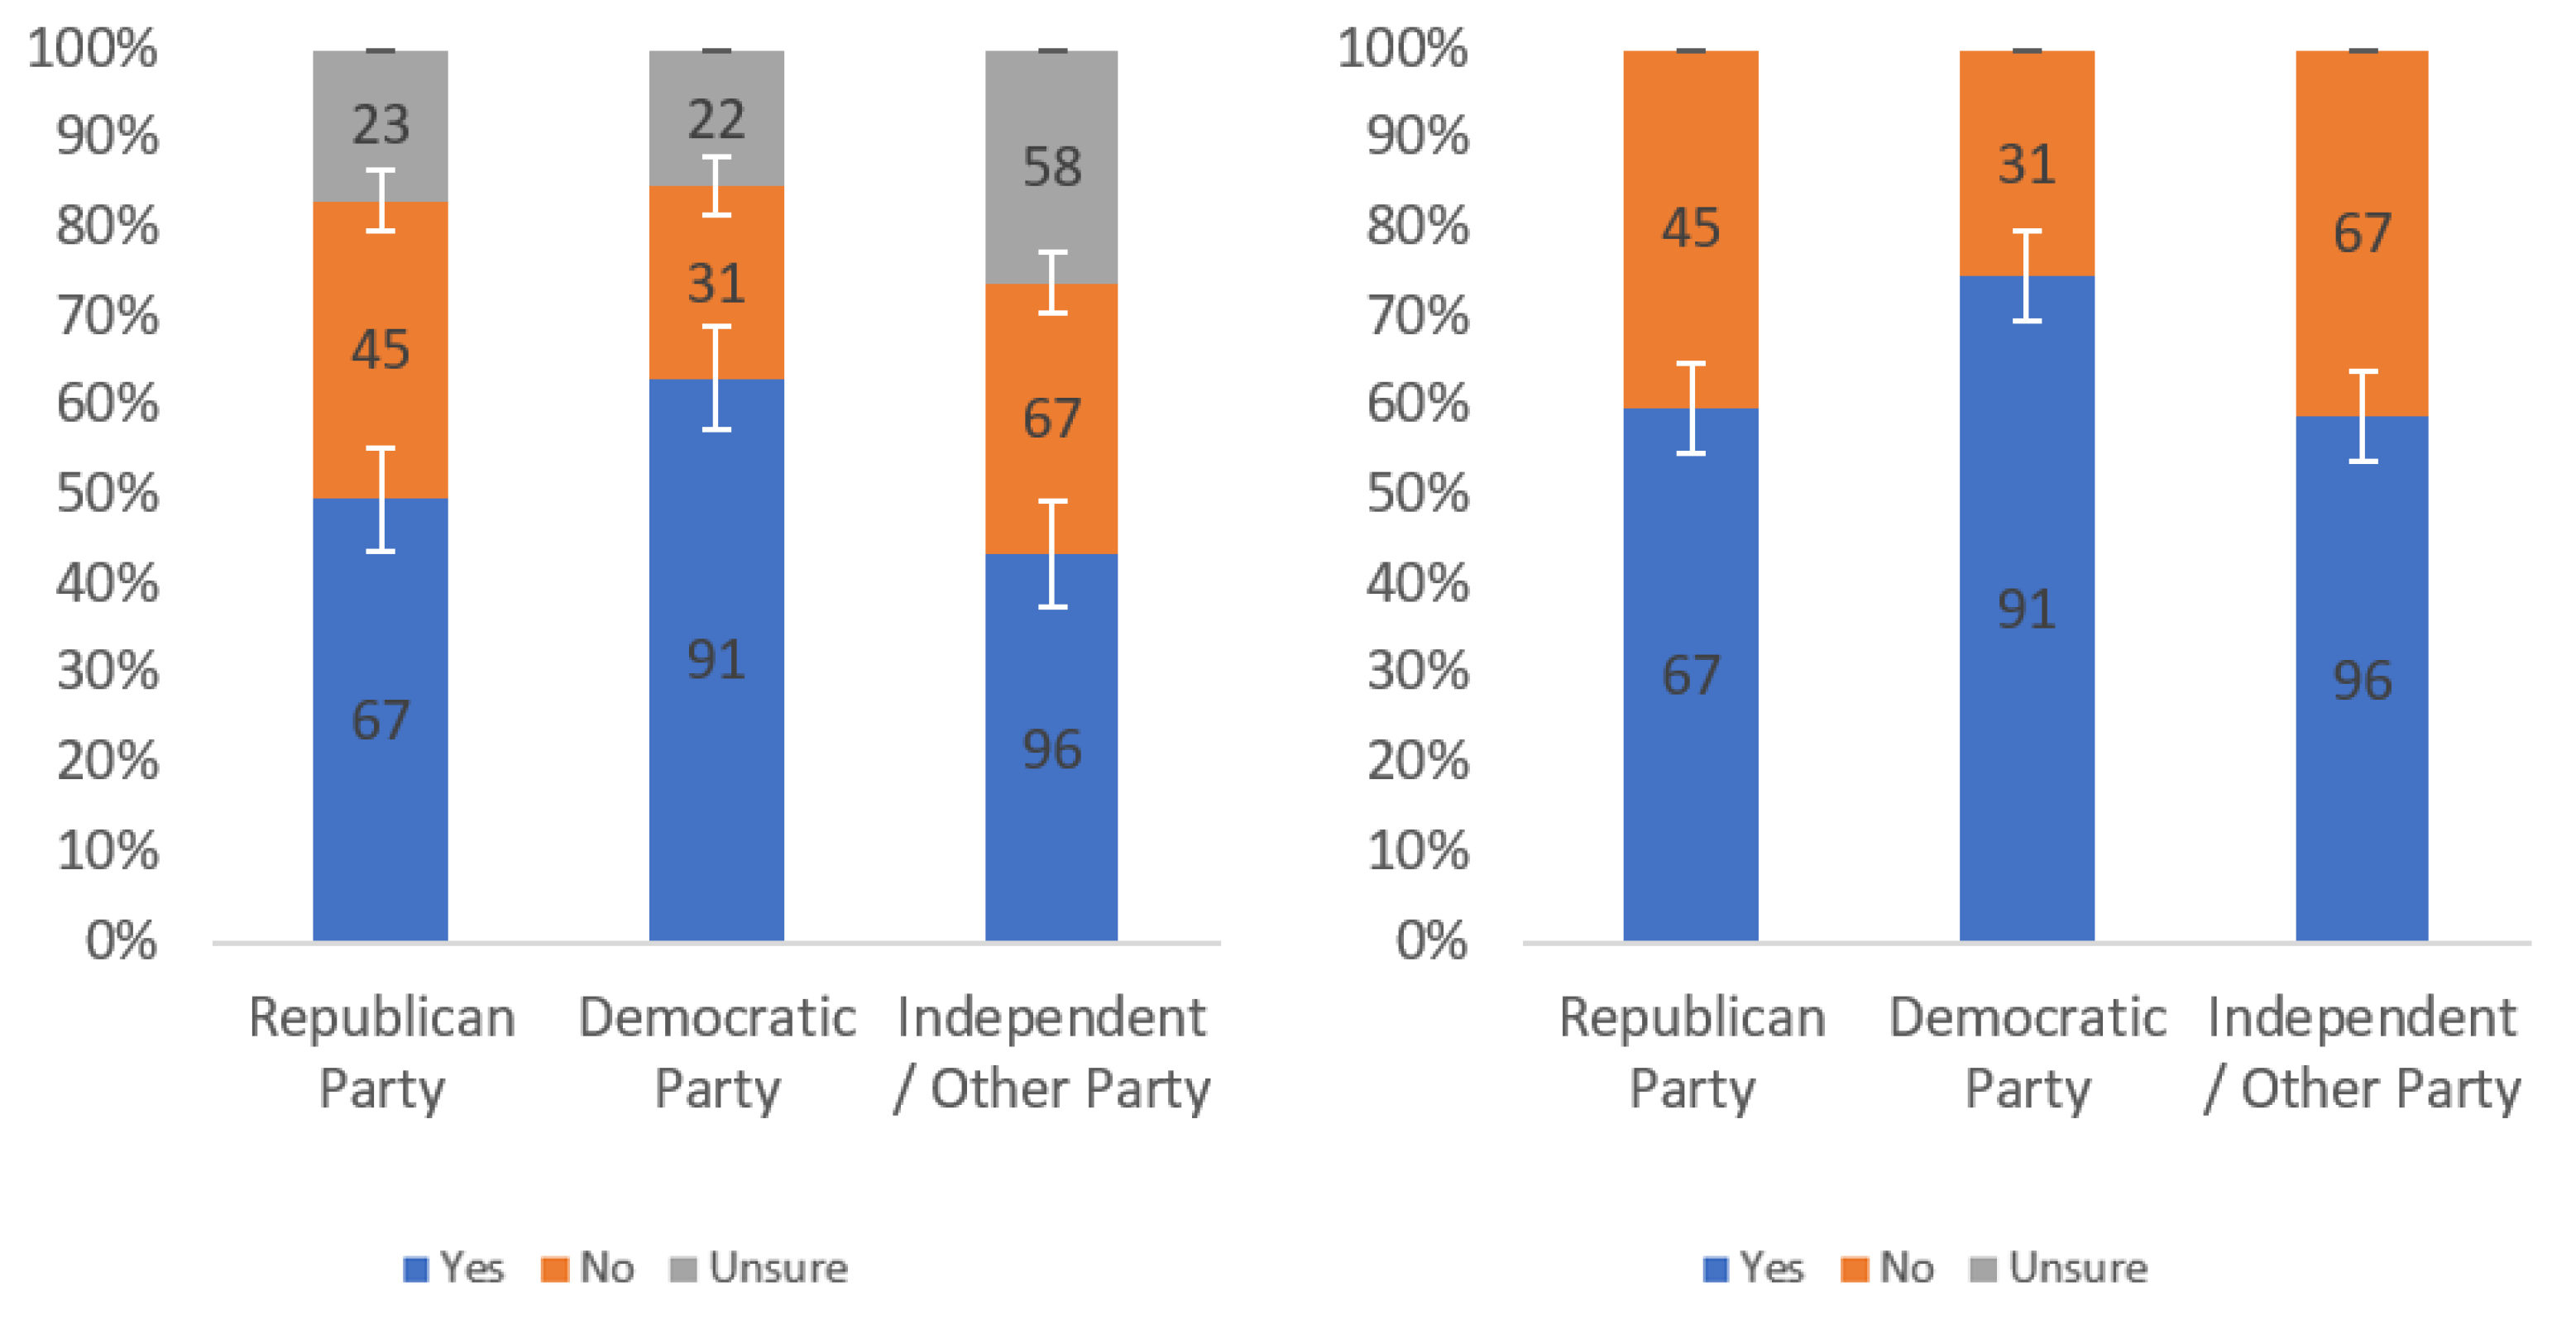
Figure 62.
Responses regarding respondents’ willingness to review by party affiliation including (left) and excluding (right) unsure responses.
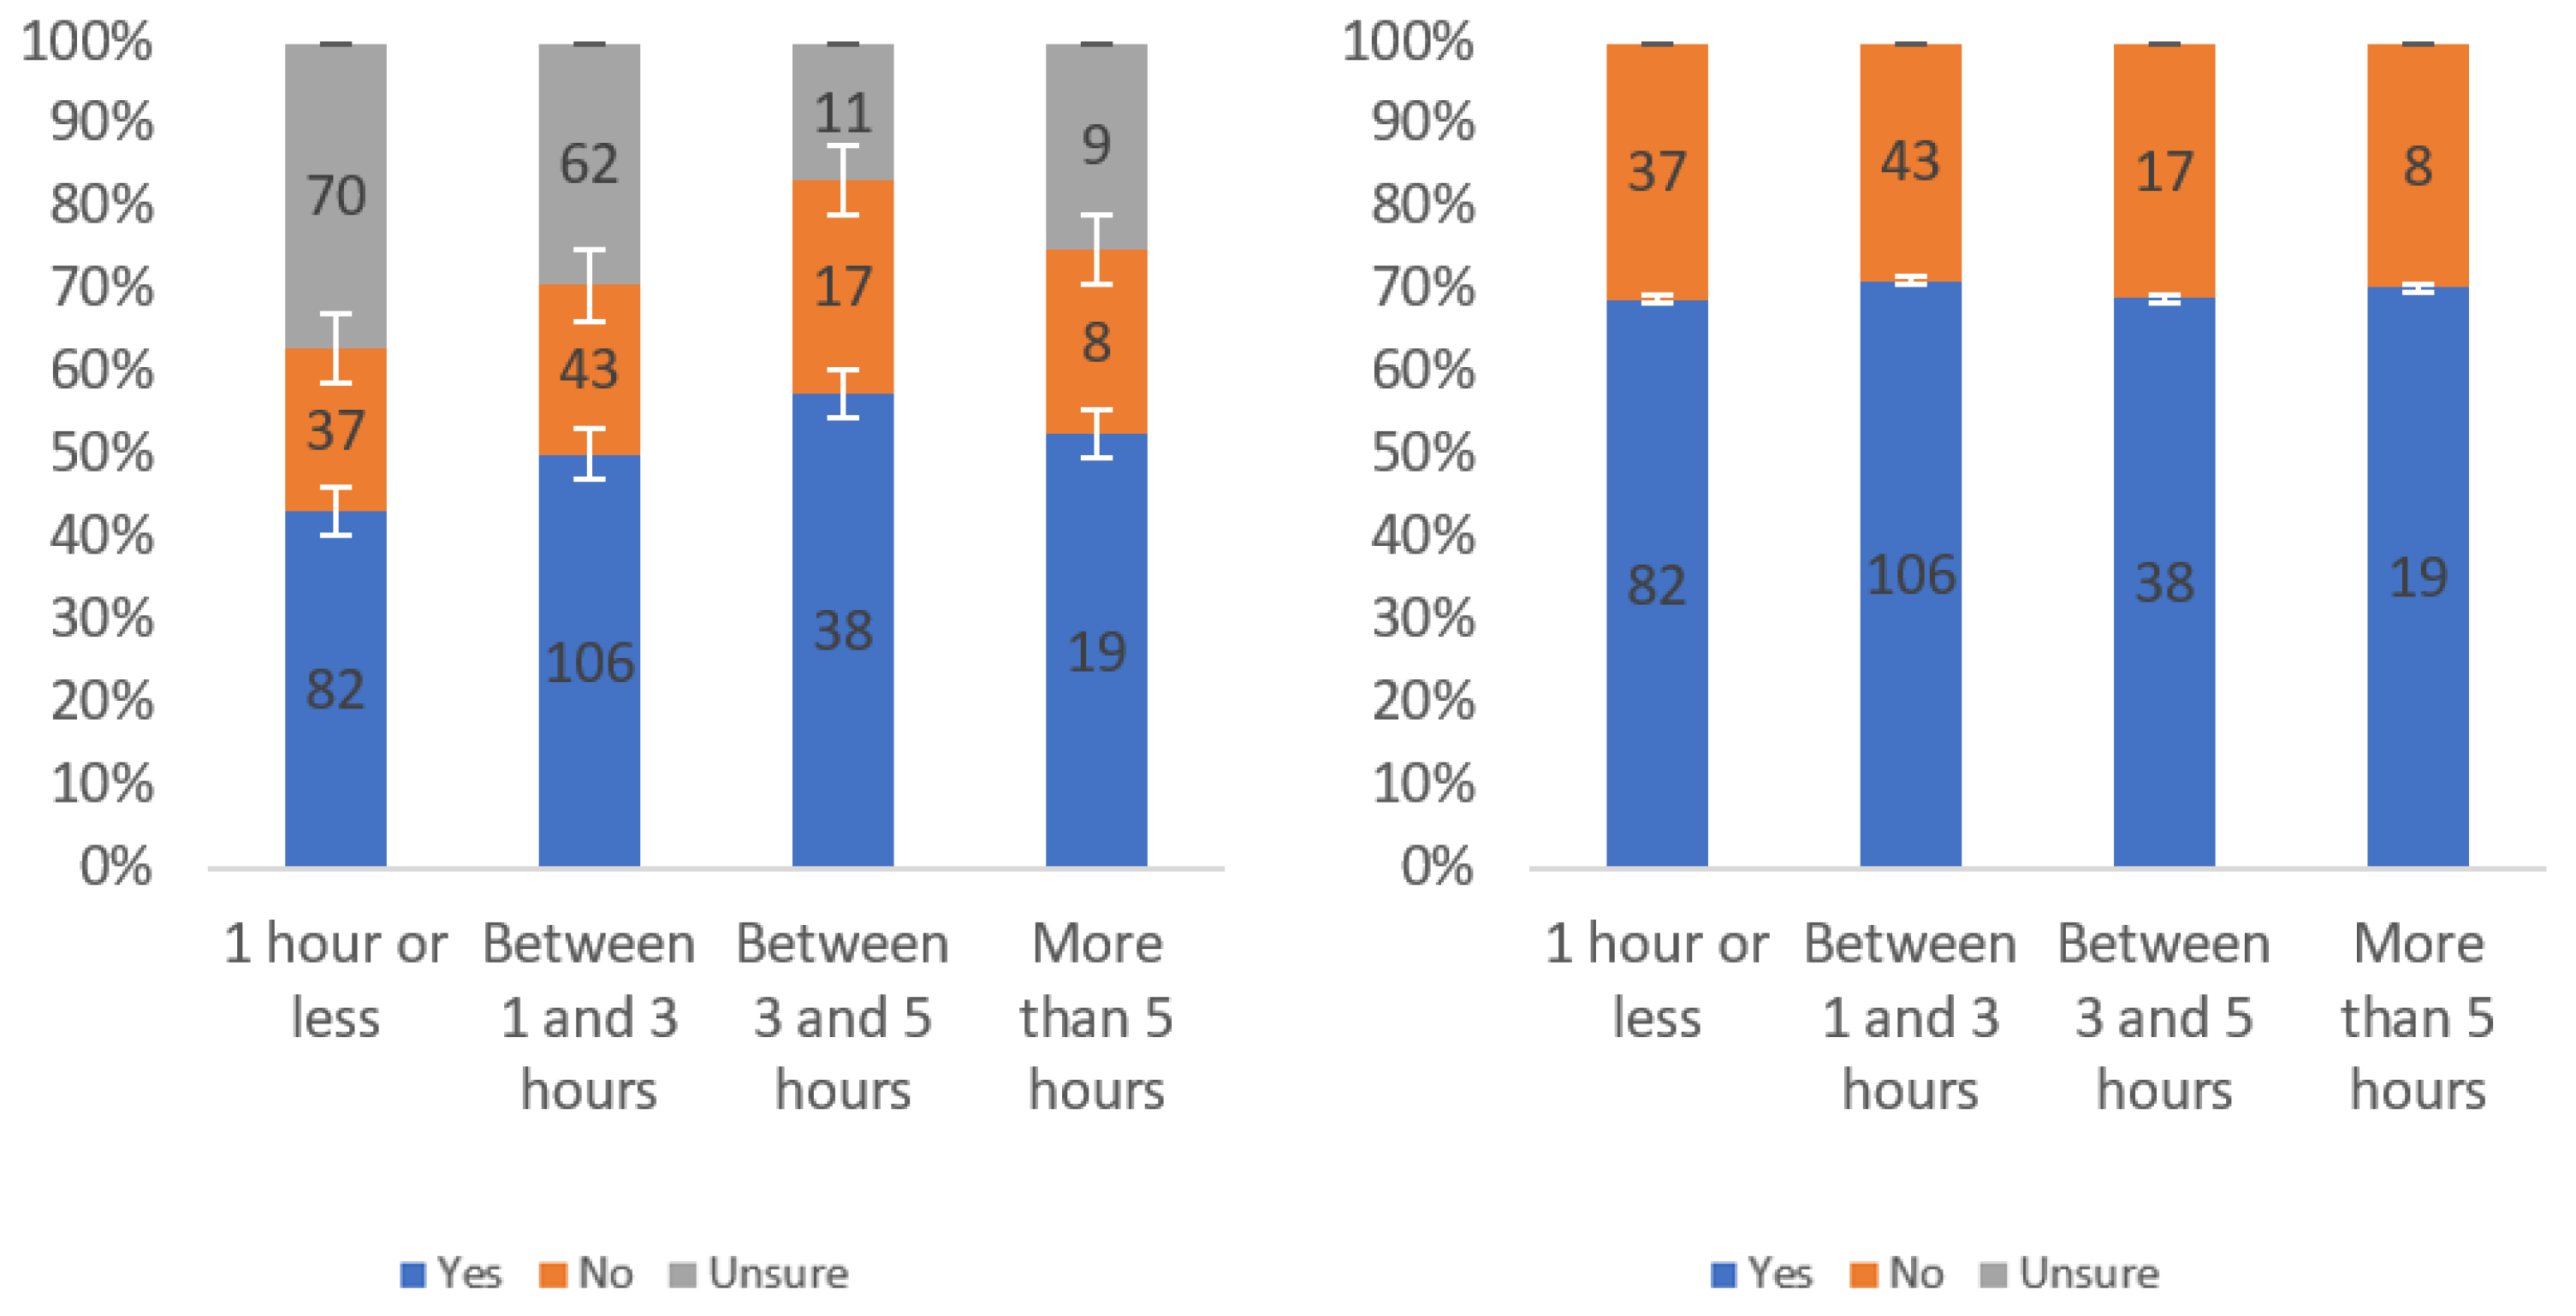
Figure 63.
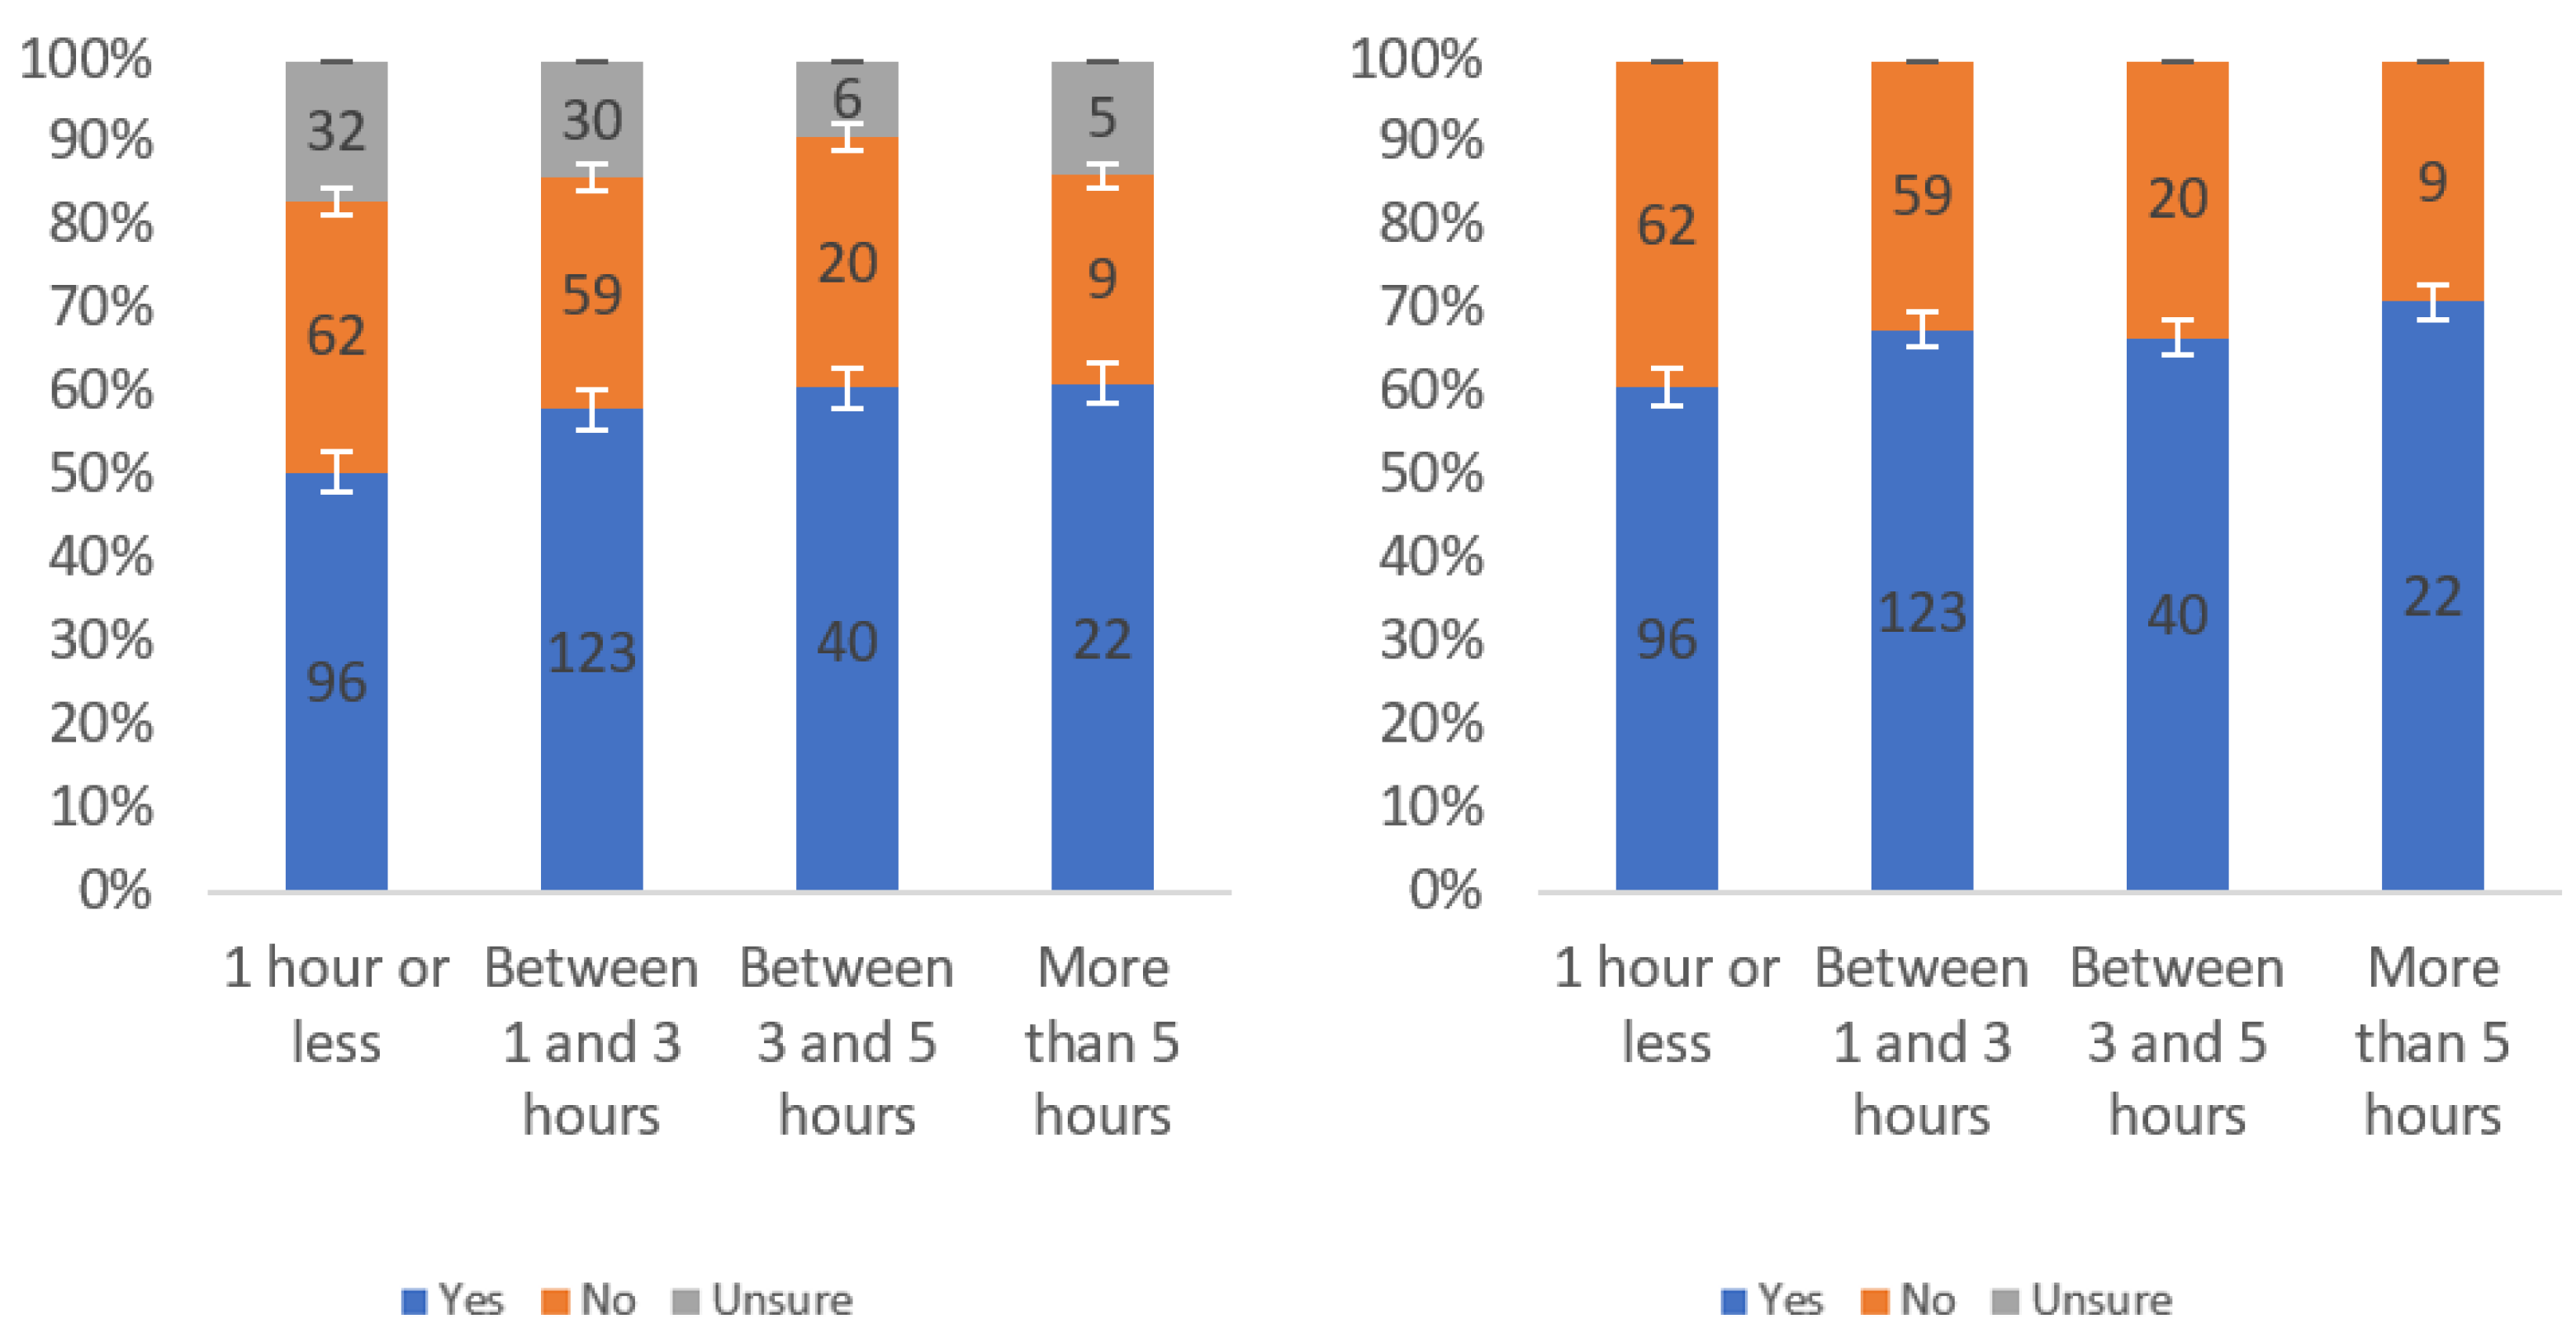
Responses regarding respondents’ willingness to review by internet usage level including (left) and excluding (right) unsure responses.
Figure 64.
Responses regarding others’ willingness to review by income level including (left) and excluding (right) unsure responses.
Figure 65.
Responses regarding others’ willingness to review by party affiliation including (left) and excluding (right) unsure responses.
Figure 66.
Responses regarding others’ willingness to review by internet usage level including (left) and excluding (right) unsure responses.
Figure 67.
Responses regarding usefulness in judging trustworthiness by income level including (left) and excluding (right) unsure responses.
Figure 68.
Responses regarding usefulness in judging trustworthiness by party affiliation including (left) and excluding (right) unsure responses.
Figure 69.
Responses regarding usefulness in judging trustworthiness by internet usage level including (left) and excluding (right) unsure responses.
Table 1.
Trends for label types for income level data.
| | Metric | Uncertainty |
|---|
| Informational Label 1 | | |
| Helpfulness | Two negatives | Partial negative |
| Annoyingness | Partial negative | Fluctuates |
| Self-Willingness | Slightly negative | Slightly negative |
| Others’ Willingness | Partial negative | Partial positive |
| Judging Trustworthiness | Negative | Partial negative |
| Informational Label 2 | | |
| Helpfulness | Two negatives | Not notable |
| Annoyingness | Slightly positive | Negative |
| Self-Willingness | Partial negative | Partial negative |
| Others’ Willingness | Not notable | Not notable |
| Judging Trustworthiness | Partial negative | Not notable |
| Informational Label 3 | | |
| Helpfulness | Conflicting trends | Partial negative |
| Annoyingness | Conflicting trends | Negative |
| Self-Willingness | Not notable | Not notable |
| Others’ Willingness | Not notable | Not notable |
| Judging Trustworthiness | Partial positive | Partial slight negative |
| Warning Label 1 | | |
| Helpfulness | Slightly negative | Slightly negative |
| Annoyingness | Not notable | Slightly negative |
| Self-Willingness | Slightly negative | Negative |
| Others’ Willingness | Partial negative | Partial negative |
| Judging Trustworthiness | Not notable | Negative |
| Warning Label 2 | | |
| Helpfulness | Not notable | Partial negative |
| Annoyingness | Not notable | Partial negative |
| Self-Willingness | Not notable | Not notable |
| Others’ Willingness | Not notable | Not notable |
| Judging Trustworthiness | Marginally Positive | Negative |
| Warning Label 3 (Blocking) | | |
| Helpfulness | Not notable | Not notable |
| Annoyingness | Partial negative | Partial negative |
| Self-Willingness | Partial slight negative | Negative |
| Others’ Willingness | Partial negative | Slightly negative |
| Judging Trustworthiness | Not notable | Not notable |
| Supplemental Info. Label | | |
| Helpfulness | Conflicting trends | Partial slight negative |
| Annoyingness | Partial negative | Partial negative |
| Self-Willingness | Partial positive | Partial negative |
| Others’ Willingness | Not notable | Partial negative |
| Judging Trustworthiness | Not notable | Not notable |
Table 2.
Trends for label types for political affiliation data.
| | Metric | Uncertainty |
|---|
| Informational Label 1 | | |
| Helpfulness | Democrats most helpful | Democrats most sure |
| Annoyingness | Effective tie | Democrats slightly surer |
| Self-Willingness | Democrats most willing | Democrats most sure |
| Others’ Willingness | Democrats most willing | Democrats most sure |
| Judging Trustworthiness | Democrats most useful | Democrats most sure |
| Informational Label 2 | | |
| Helpfulness | Democrats most helpful | Democrats most sure |
| Annoyingness | Democrats slightly less annoying | Democrats slightly surer |
| Self-Willingness | Democrats most willing | Republicans slightly surer |
| Others’ Willingness | Democrats most willing | Democrats most sure |
| Judging Trustworthiness | Democrats most useful | Democrats most sure |
| Informational Label 3 | | |
| Helpfulness | Democrats most helpful | Democrats slightly surer |
| Annoyingness | Democrats less annoying | Democrats most sure |
| Self-Willingness | Democrats most willing | Democrats most sure |
| Others’ Willingness | Democrats most willing | Democrats most sure |
| Judging Trustworthiness | Democrats most useful | Democrats slightly surer |
| Warning Label 1 | | |
| Helpfulness | Democrats most helpful | Democrats slightly surer |
| Annoyingness | Effective tie | Democrats very slightly surer |
| Self-Willingness | Democrats slightly more willing | Democrats slightly surer |
| Others’ Willingness | Independents slightly more willing | Democrats slightly surer |
| Judging Trustworthiness | Democrats slightly more useful | Democrats most sure |
| Warning Label 2 | | |
| Helpfulness | Democrats most helpful | Democrats most sure |
| Annoyingness | Democrats less annoying | Democrats most sure |
| Self-Willingness | Democrats slightly more willing | Democrats most sure |
| Others’ Willingness | Democrats slightly more willing | Democrats most sure |
| Judging Trustworthiness | Democrats most useful | Democrats slightly surer |
| Warning Label 3 (Blocking) | | |
| Helpfulness | Democrats most helpful | Democrats very slightly surer |
| Annoyingness | Effective tie | Democrats very slightly surer |
| Self-Willingness | Democrats slightly more willing | Democrats slightly surer |
| Others’ Willingness | Independents most willing | Democrats most sure |
| Judging Trustworthiness | Democrats most useful | Democrats very slightly surer |
| Supplemental Information Label | | |
| Helpfulness | Democrats most helpful | Democrats surer |
| Annoyingness | Democrats slightly less annoying | Democrats slightly surer |
| Self-Willingness | Democrats most willing | Democrats most sure |
| Others’ Willingness | Democrats most willing | Democrats most sure |
| Judging Trustworthiness | Democrats most useful | Democrats most sure |
Table 3.
Trends for label types for online usage level data.
| | Metric | Uncertainty |
|---|
| Informational Label 1 | | |
| Helpfulness | Slightly positive | Not notable |
| Annoyingness | Partial positive | Partial negative |
| Self-Willingness | Positive | Not notable |
| Others’ Willingness | Not notable | Partial negative |
| Judging Trustworthiness | Partial positive | Partial negative |
| Informational Label 2 | | |
| Helpfulness | Slightly positive | Not notable |
| Annoyingness | Not notable | Not notable |
| Self-Willingness | Slightly positive | Partial negative |
| Others’ Willingness | Not notable | Partial negative |
| Judging Trustworthiness | Slightly negative | Slightly positive |
| Informational Label 3 | | |
| Helpfulness | Partial positive | Not notable |
| Annoyingness | Slightly negative | Not notable |
| Self-Willingness | Partial negative | Positive |
| Others’ Willingness | Slightly negative | Positive |
| Judging Trustworthiness | Slightly positive | Negative |
| Warning Label 1 | | |
| Helpfulness | Partial negative | Partial positive |
| Annoyingness | Not notable | Not notable |
| Self-Willingness | Not notable | Partial negative |
| Others’ Willingness | Not notable | Slightly negative |
| Judging Trustworthiness | Negative | Slightly negative |
| Warning Label 2 | | |
| Helpfulness | Not notable | Not notable |
| Annoyingness | Not notable | Partial negative |
| Self-Willingness | Partial negative | Partial positive |
| Others’ Willingness | Partial negative | Partial positive |
| Judging Trustworthiness | Not notable | Negative |
| Warning Label 3 (Blocking) | | |
| Helpfulness | Partial slight positive | Slightly negative |
| Annoyingness | Not notable | Negative |
| Self-Willingness | Partial negative | Partial negative |
| Others’ Willingness | Slightly negative | Negative |
| Judging Trustworthiness | Not notable | Slightly negative |
| Supplemental Info. Label | | |
| Helpfulness | Partial positive | Partial negative |
| Annoyingness | Partial slight negative | Negative |
| Self-Willingness | Positive | Slightly negative |
| Others’ Willingness | Positive | Partial negative |
| Judging Trustworthiness | Partial positive | Negative |
Table 4.
Comparison of self and others’ willingness to use labels by income level.
| | USD 24,999 or Less | USD 25,000–49,999 | USD 50,000–74,999 | USD 75,000–99,999 | USD 100,000–124,999 | USD 125,000 or Higher |
|---|
| Informational Label 1 | | | | | | |
| Self-Willingness | 67.9% | 62.8% | 61.7% | 67.6% | 56.7% | 64.1% |
| Others’ Willingness | 67.9% | 73.9% | 59.2% | 71.4% | 66.7% | 63.3% |
| Informational Label 2 | | | | | | |
| Self-Willingness | 70.7% | 63.4% | 59.1% | 69.6% | 64.5% | 70.0% |
| Others’ Willingness | 74.0% | 71.2% | 63.0% | 70.2% | 86.4% | 66.7% |
| Informational Label 3 | | | | | | |
| Self-Willingness | 65.1% | 67.5% | 60.8% | 68.2% | 71.9% | 64.1% |
| Others’ Willingness | 63.2% | 74.0% | 52.8% | 72.4% | 79.2% | 61.3% |
| Warning Label 1 | | | | | | |
| Self-Willingness | 75.3% | 74.4% | 72.9% | 75.0% | 71.9% | 72.5% |
| Others’ Willingness | 73.4% | 74.7% | 67.9% | 80.3% | 77.8% | 75.7% |
| Warning Label 2 | | | | | | |
| Self-Willingness | 69.5% | 70.6% | 65.6% | 73.6% | 87.1% | 70.0% |
| Others’ Willingness | 64.4% | 78.6% | 61.8% | 73.2% | 84.6% | 69.7% |
| Warning Label 3 (Blocking) | | | | | | |
| Self-Willingness | 67.1% | 65.5% | 61.6% | 67.6% | 54.5% | 70.0% |
| Others’ Willingness | 63.2% | 63.5% | 59.4% | 72.9% | 69.2% | 63.9% |
| Supplemental Information Label | | | | | | |
| Self-Willingness | 65.9% | 65.0% | 50.0% | 54.5% | 65.6% | 66.7% |
| Others’ Willingness | 61.3% | 72.0% | 53.9% | 56.6% | 70.8% | 69.7% |
Table 5.
Comparison of self- and others’ willingness to use labels by party affiliation.
| | Republican Party | Democratic Party | Independent/Other Party |
|---|
| Informational Label 1 | | | |
| Self-Willingness | 51.8% | 76.2% | 62.8% |
| Others’ Willingness | 59.4% | 75.2% | 64.3% |
| Informational Label 2 | | | |
| Self-Willingness | 58.8% | 75.2% | 62.6% |
| Others’ Willingness | 64.0% | 79.5% | 66.7% |
| Informational Label 3 | | | |
| Self-Willingness | 60.7% | 72.2% | 63.1% |
| Others’ Willingness | 64.4% | 71.2% | 59.7% |
| Warning Label 1 | | | |
| Self-Willingness | 70.2% | 76.3% | 74.5% |
| Others’ Willingness | 73.5% | 71.8% | 75.3% |
| Warning Label 2 | | | |
| Self-Willingness | 70.2% | 74.8% | 67.9% |
| Others’ Willingness | 66.3% | 73.0% | 69.3% |
| Warning Label 3 (Blocking) | | | |
| Self-Willingness | 64.1% | 68.5% | 62.2% |
| Others’ Willingness | 60.6% | 64.7% | 66.2% |
| Supplemental Information Label | | | |
| Self-Willingness | 63.2% | 67.7% | 51.1% |
| Others’ Willingness | 61.8% | 68.4% | 57.4% |
Table 6.
Comparison of self- and others’ willingness to use labels by online usage level.
| | 1 h or Less | Between 1 and 3 h | Between 3 and 5 h | More than 5 h |
|---|
| Informational Label 1 | | | | |
| Self-Willingness | 58.1% | 64.5% | 69.1% | 80.0% |
| Others’ Willingness | 64.6% | 69.0% | 62.0% | 72.0% |
| Informational Label 2 | | | | |
| Self-Willingness | 60.8% | 67.6% | 66.7% | 71.0% |
| Others’ Willingness | 68.9% | 71.1% | 69.1% | 70.4% |
| Informational Label 3 | | | | |
| Self-Willingness | 62.7% | 66.3% | 63.8% | 73.3% |
| Others’ Willingness | 59.8% | 69.6% | 57.7% | 71.4% |
| Warning Label 1 | | | | |
| Self-Willingness | 73.1% | 75.3% | 70.5% | 75.9% |
| Others’ Willingness | 71.9% | 77.4% | 66.7% | 75.9% |
| Warning Label 2 | | | | |
| Self-Willingness | 65.6% | 71.7% | 78.0% | 75.0% |
| Others’ Willingness | 64.8% | 71.8% | 72.7% | 74.1% |
| Warning Label 3 (Blocking) | | | | |
| Self-Willingness | 68.2% | 63.8% | 58.1% | 64.5% |
| Others’ Willingness | 65.7% | 64.7% | 61.4% | 60.0% |
| Supplemental Information Label | | | | |
| Self-Willingness | 52.7% | 62.8% | 59.6% | 71.0% |
| Others’ Willingness | 54.0% | 62.1% | 74.1% | 75.0% |
Table 7.
Do respondents see labels as more valuable to self or others, by income level.
| | USD 24,999 or Less | USD 25,000–49,999 | USD 50,000–74,999 | USD 75,000–99,999 | USD 100,000–124,999 | USD 125,000 or More |
|---|
| Informational Label 1 | Others | Others | Self | Others | Others | Self |
| Informational Label 2 | Others | Others | Others | Others | Others | Self |
| Informational Label 3 | Self | Others | Self | Others | Others | Self |
| Warning Label 1 | Self | Others | Self | Others | Others | Others |
| Warning Label 2 | Self | Others | Self | Self | Self | Self |
| Warning Label 3 (Blocking) | Self | Self | Self | Others | Others | Self |
| Supplemental Information Label | Tie | Others | Others | Others | Others | Others |
Table 8.
Whether respondents saw labels as more valuable to self or others by party affiliation.
| | Republican Party | Democratic Party | Independent/Other Party |
|---|
| Informational Label 1 | Others | Self | Others |
| Informational Label 2 | Others | Others | Others |
| Informational Label 3 | Others | Self | Self |
| Warning Label 1 | Others | Self | Others |
| Warning Label 2 | Self | Self | Others |
| Warning Label 3 (Blocking) | Self | Self | Others |
| Supplemental Informational Label | Self | Others | Others |
Table 9.
Do respondents see labels as more valuable to self or others, by online usage level.
| | 1 h or Less | Between 1 and 3 h | Between 3 and 5 h | More than 5 h |
|---|
| Informational Label 1 | Others | Others | Self | Self |
| Informational Label 2 | Others | Others | Others | Self |
| Informational Label 3 | Self | Others | Self | Self |
| Warning Label 1 | Self | Others | Self | Others |
| Warning Label 2 | Self | Others | Self | Self |
| Warning Label 3 (Blocking) | Self | Others | Others | Self |
| Supplemental Information Label | Others | Self | Others | Others |


