Article

Molecular Simulation of Shale Gas Adsorption and Diffusion in Clay Nanopores

School of Petroleum Engineering, China University of Petroleum, Qingdao, Shandong 266580, China
*
Author to whom correspondence should be addressed.
Submission received: 24 August 2015 / Revised: 7 December 2015 / Accepted: 8 December 2015 / Published: 11 December 2015
(This article belongs to the Special Issue Advances in Modeling Flow and Transport in Porous Media)

Abstract

:
The present work aims to study the adsorption behavior and dynamical properties of CH4 in clay slit pore with or without cation exchange structures at sizes of 1.0 nm–4.0 nm using grand canonical Monte Carlo (GCMC) and molecular dynamics (MD) methods. The adsorption isotherms of CH4 have been investigated by GCMC simulations at different temperatures and various pore sizes. In the montmorillonite (MMT) clays without a cation exchange structure, from the density profile, we find the molecules preferentially adsorb onto the surface, and only an obvious single layer was observed. The general trend within slit pores is that with increasing pore width, the adsorbed amount will increase. However, the larger pores exhibit lower excess density and the smaller pores exhibit higher excess density. The preloaded water will reduce CH4 sorption. The in plane self-diffusion coefficient of CH4 which is investigated by MD simulations combined with Einstein fluid equation increases rapidly with the pore size increasing at low pressure. Under these given conditions, the effect of temperature has little influence on the in-plane self-diffusion coefficient. In the MMT clays with cation exchange structure, cation exchange has little effect on CH4 adsorption and self-diffusion.

1. Introduction

As unconventional gas resources, shale gas is a hydrocarbon usually found within the source rock of the shale reservoir, with great reserves throughout the world. Due to advances in multi-staged hydraulic fracturing and horizontal drilling technology [1], most shale-gas production worldwide occurs in North America [2], but it is also being extensively explored in other areas in recent years, such as Australia, China and Europe [3]. Even though thousands of shale gas wells are in production around the world, shale gas thermodynamics properties are still poorly understood [4].
As an unconventional reservoir, shale gas reservoirs are very complex and heterogeneous [5], and which are mainly composed of organic matter known as kerogen distributed in inorganic matrix (mainly made of quartz, clays and carbonates) [6]. Kerogen in shale will increase the porosity [7], and the porosity of kerogen can make up to 50% of the total porosity [8]. Research by Ross et al. [9] shows that the organic matter may significantly affect CH4 storage capacity in reservoirs. There is a strong link between adsorbed CH4 and the organic matter in organic matter rich shale reservoirs [9,10,11]. The increase in the amount of micropores leads to a higher ratio of CH4 adsorption in thermally mature kerogen to immature kerogen [7].
The clay mineral and its micro-pore structure will enhance shale gas adsorption [12,13,14], because clay minerals have more micro-pore and meso-pore and its surface area is said to be 10–25 m2/g [15]. For gas adsorption, the amount of gas adsorbed in clay-rich shale could be comparable with total-organic shale [16,17,18]. Also, the shale rocks’ surface area is about 5–50 m2/g [9], which is comparable to the clay minerals’ surface area. It is inaccurate to estimate gas at a location not considering the clay minerals in clay rich shale gas reservoirs. Experiments [19] prove that clay minerals have a large surface area, and their 1–2 nm width pores provide more gas adsorption sites.
Molecular simulations have been extensively conducted to study gas adsorption in clay minerals. Jin et al. [20] used the grand canonical Monte Carlo (GCMC) method with a grand canonical (µVT) ensemble to study the influence of chemical heterogeneity and pore structure on CH4 and CO2 adsorption in clay slit pores. The results show the CH4 sorption is a function of surface area. Charge affects the CO2 orientation near the wall surface and plays an important role in CO2 sorption, but its effect on CH4 orientation and adsorption is very small. Jin et al. [21] also researched the influence of H2O on CH4 and CO2 sorption in clay minerals by GCMC simulations. The results show that H2O can greatly reduce CH4 and CO2 adsorption in clay minerals.
The diffusion mechanism is more complex due to the complexity and heterogeneity of the pore system within the shale gas reservoir [22,23]. Within shale pores, we may, in general, distinguish three fundamentally different types of diffusion mechanisms: Fickian diffusion, Knudsen diffusion and surface diffusion [24]. Comparing experimental approaches [25], molecular simulation methods are more convenient to predict the diffusion coefficient. Molecular dynamics [26] simulation provides a dynamic view of microscopic systems, and is usually performed to study the thermodynamic properties of CH4 in micropores, such as self-diffusion, flow behavior and displacement processes. Many researchers have investigated pore size, temperature and pressure effect on the self-diffusion coefficient of confined fluid.
Yang and Zhang [27] performed molecular dynamics (MD) simulations to study the dense CO2 fluid structure and diffusion properties in clay slit pore, and found that the CO2 confined fluid form obvious layers close to the pore wall. Botan et al. [28] used GCMC and MD simulations to research the dynamical, thermodynamical and structural properties of CO2 in hydrated sodium montmorillonite pores. Sharma et al. [29] used MD and GCMC methods to research the CH4 and C2H6 structural and dynamical properties in montmorillonite (MMT) pores of different size from 1–3 nm, and they found the pure CH4 and C2H6 adsorption isotherms follow the Langmuir isotherm and the CH4 and C2H6 diffusion coefficient in the pores is up to a magnitude of 10−6 m2/s. As the pressure increases, the diffusion coefficient will decrease. The composition, structure and pore size of shale affect CH4 adsorption and storage in shale gas reservoirs [9,30]. The greatest challenges in shale gas reservoirs are well productivity and shale gas storage calculation [31,32].
In this work, GCMC simulations were used to predict the adsorption isotherm for clay slit pores of a given width and temperature. MD was employed to calculate the self-diffusion coefficients of the CH4-pores system. The aim of this research is to describe the effect of pore width, temperature and pressure on CH4 adsorption, and the relationships between diffusivity, pressure, temperature and pore size were also studied.

2 Models and Methodology
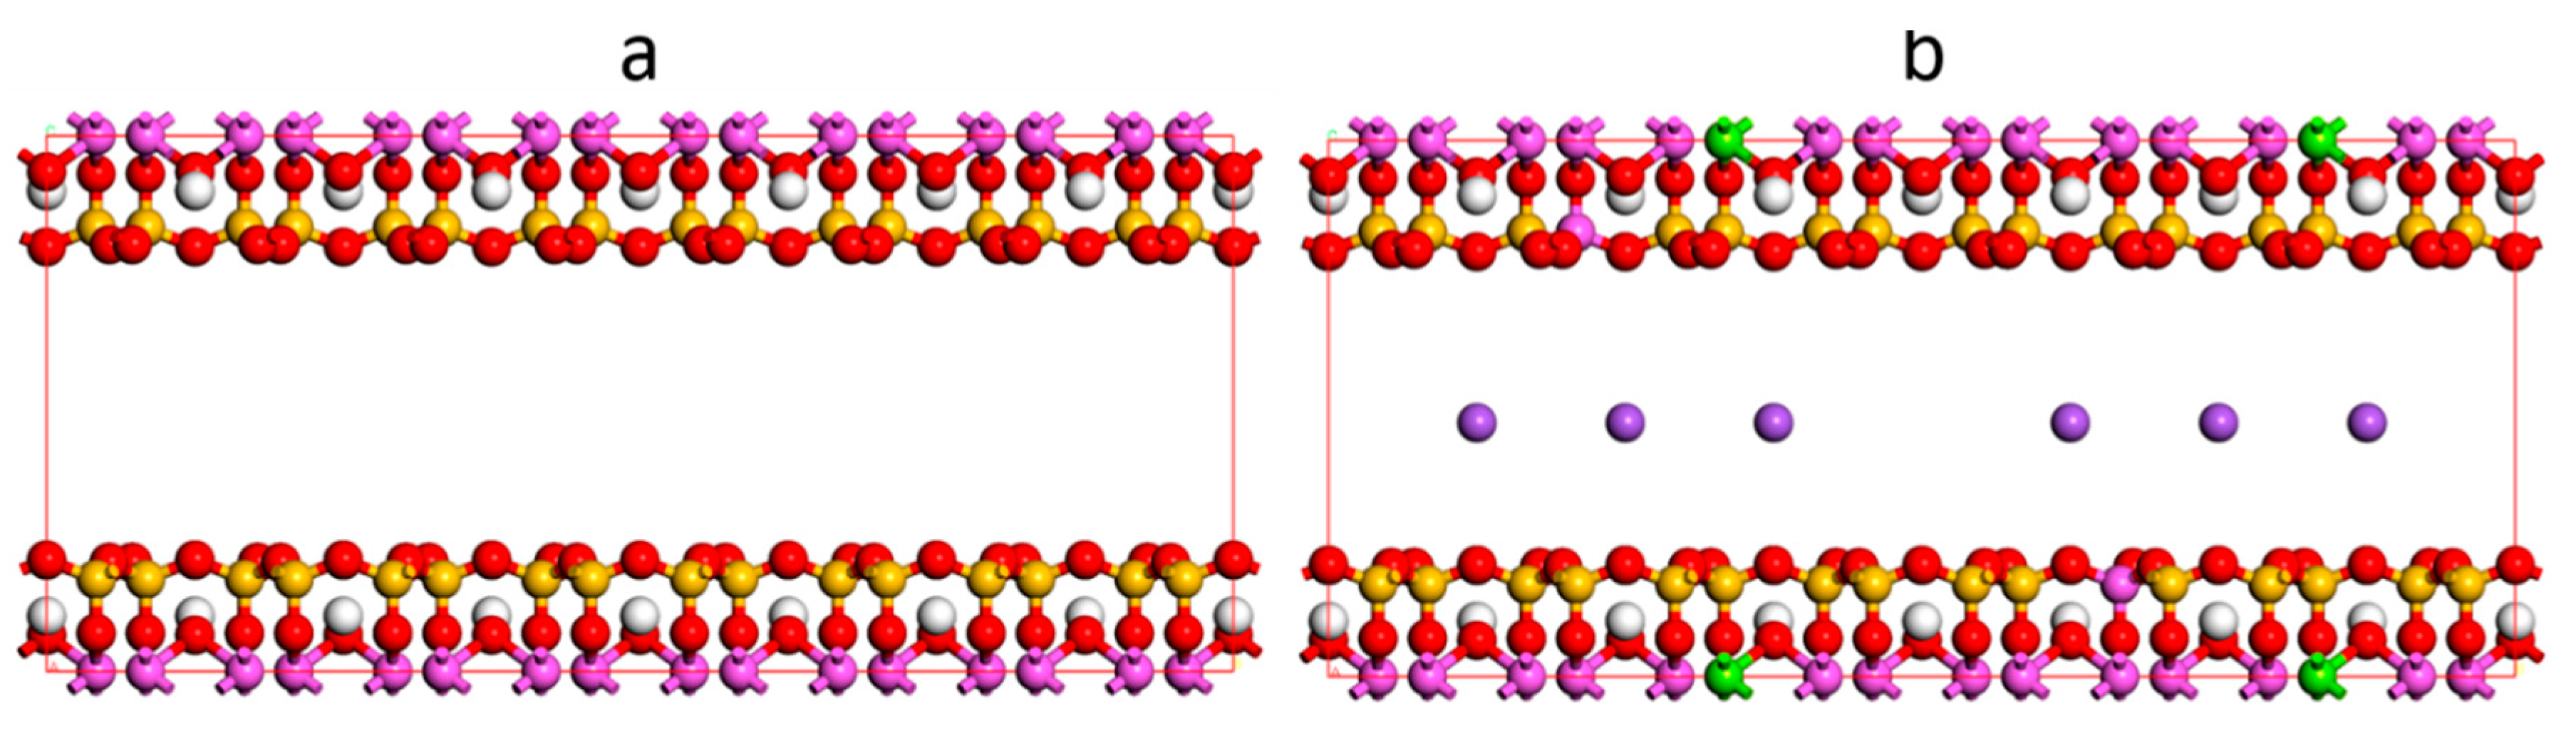
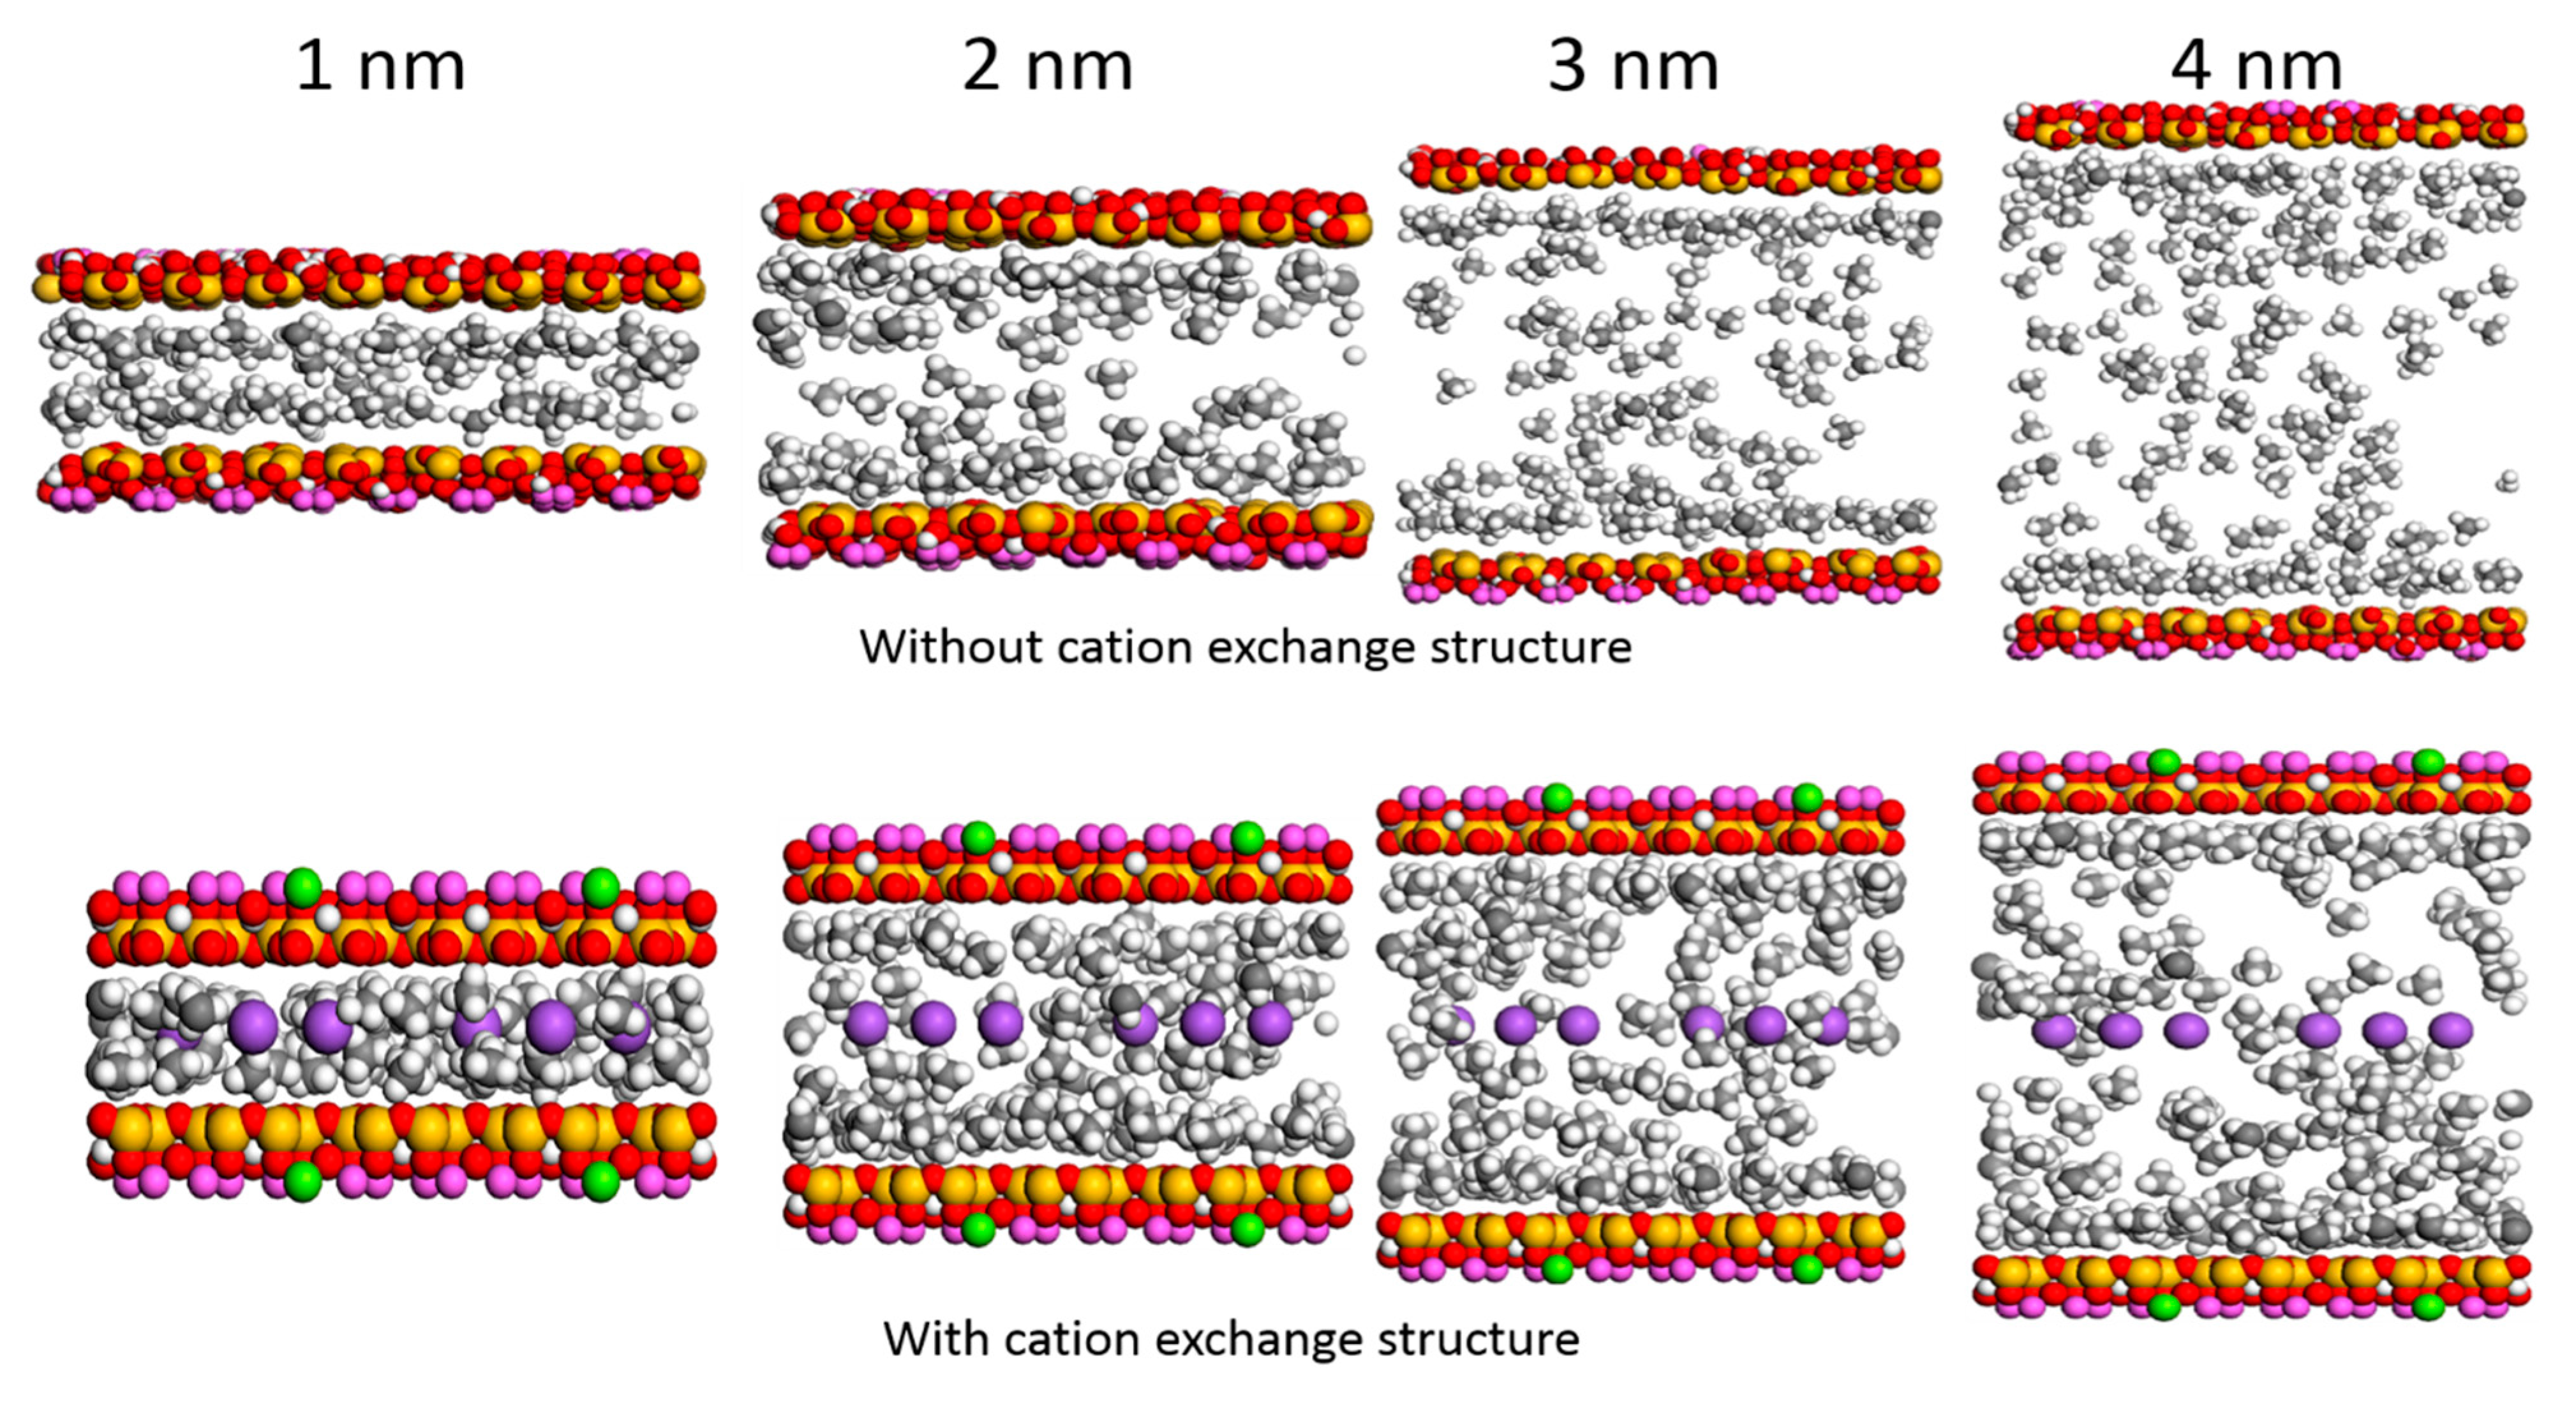
2.1. Model

In this work, the idealized montmorillonite (MMT) structure, not only because of the inclusion of tetrahedral substitutions but also due to the regularity of the substitutions, was used to model clay minerals with the unit cell formula was Na0.75(Si7.75Al0.25)(Al3.5Mg0.5)O20(OH)4 [33] to investigate CH4 adsorption and transport properties in clay materials. There were two 32-unit cells forming a clay patch with dimensions of 4.224 nm and 3.656 nm in x and y directions. In order to study the effect of clay on shale gas storage, both MMT without cation exchange structure (strictly speaking, pyrophillite) and MMT with cation exchange structure were considered. For MMT with cation exchange, each of our clay sheets had 16 divalent Mg atoms replacing trivalent Al atoms, eight trivalent Al atoms replacing tetravalent Si atoms, and 24 Na+ (with a point charge) were used to compensate valent in the interlayer region, see Figure 1. Table S1 (Supplementary Information) shows the charges and positions of each atom in the unit cell [34]. Several researchers [20,21,27,35] used a similar model to perform molecular simulations to study CH4, CO2 and H2O adsorption and diffusion behavior in clay minerals which can prove its wide application. All models were constructed by amorphous cell modules in Materials Studio (MS) of Biovia Inc., San Diego, CA, USA.

2.2. Grand Canonical Monte Carlo (GCMC)

In this work, GCMC method was performed to study the CH4 adsorption behavior. The method is carried out by the sorption module in Materials Studio software. For each MC simulation cycle, the moves constituting exchange, conformation, rotation and translation were set as 40%, 20%, 20% and 20%. We completed 500,000 runs for equilibrium and 1,000,000 runs for production in this simulation.
The condensed-phase optimized molecular potential for atomistic simulation studies (COMPASS) force field is adopted in this simulation [36]. This force field enables rigorous parameterization, where parameters are derived from high level first principle calculations to address the compatibility for the considered model. The detailed total potential is described in the Supplementary Information. The Dreiding force field [37] and CLAYFF force field [38] are also commonly used to study clay minerals. We also perform simulations using the two force fields and compared the results to estimate the CH4 adsorption behavior. The Dreiding force field does not include the parameter for the Mg atom. We assigned Mg the same LJ parameter as Al, and with the charges of +2e. As see in Figure S1, the CH4 adsorption amounts follow the order Dreiding > CLAYFF > COMPASS in the MMT pores without a cation exchange structure and with a cation exchange structure.
In this work, the vdW interactions are calculated within a cut-off distance of 0.95 nm by the atom-based method, and the electrostatic interactions are described by the Ewald method. In molecular simulations, the fugacity rather than pressure was used for predicting adsorption, densities and other thermodynamics properties. In this work, the Peng–Robinson equation of state [39] was used to calculate the fugacity.
Figure 1. Molecular simulation unit cell. (a) Without cation exchange structure and (b) with cation exchange structure, the red, white, yellow, pink and green spheres are O, H, Si, Al and Mg atoms, respectively, and the purple spheres are Na+ ions.
Computation 03 00687 g001

2.3. Molecular Dynamic (MD)

The MD method was performed by the Forcite module in Materials Studio software to study density and diffusion behavior of CH4 in MMT clay, and partial data were extracted by self-programming. For this work, in the MD simulations, the equilibrium configuration was obtained from GCMC simulations. The COMPASS force field was also adopted in this MD simulation. All the MD simulations were performed under canonical ensemble (NVT) with a dynamics time of 1.0 ns and a time step of 1.0 fs. The Andersen thermostat with a coupling constant of 0.1 ps was applied to control the temperature, in which the first 100 ps was used to balance the structure, and last 900 ps was used for the calculation of material properties. The generated configurations were stored for every 100 steps and used to estimate density profiles and self-diffusion coefficient of CH4 in montmorillonite pores.

3. Results and Discussions

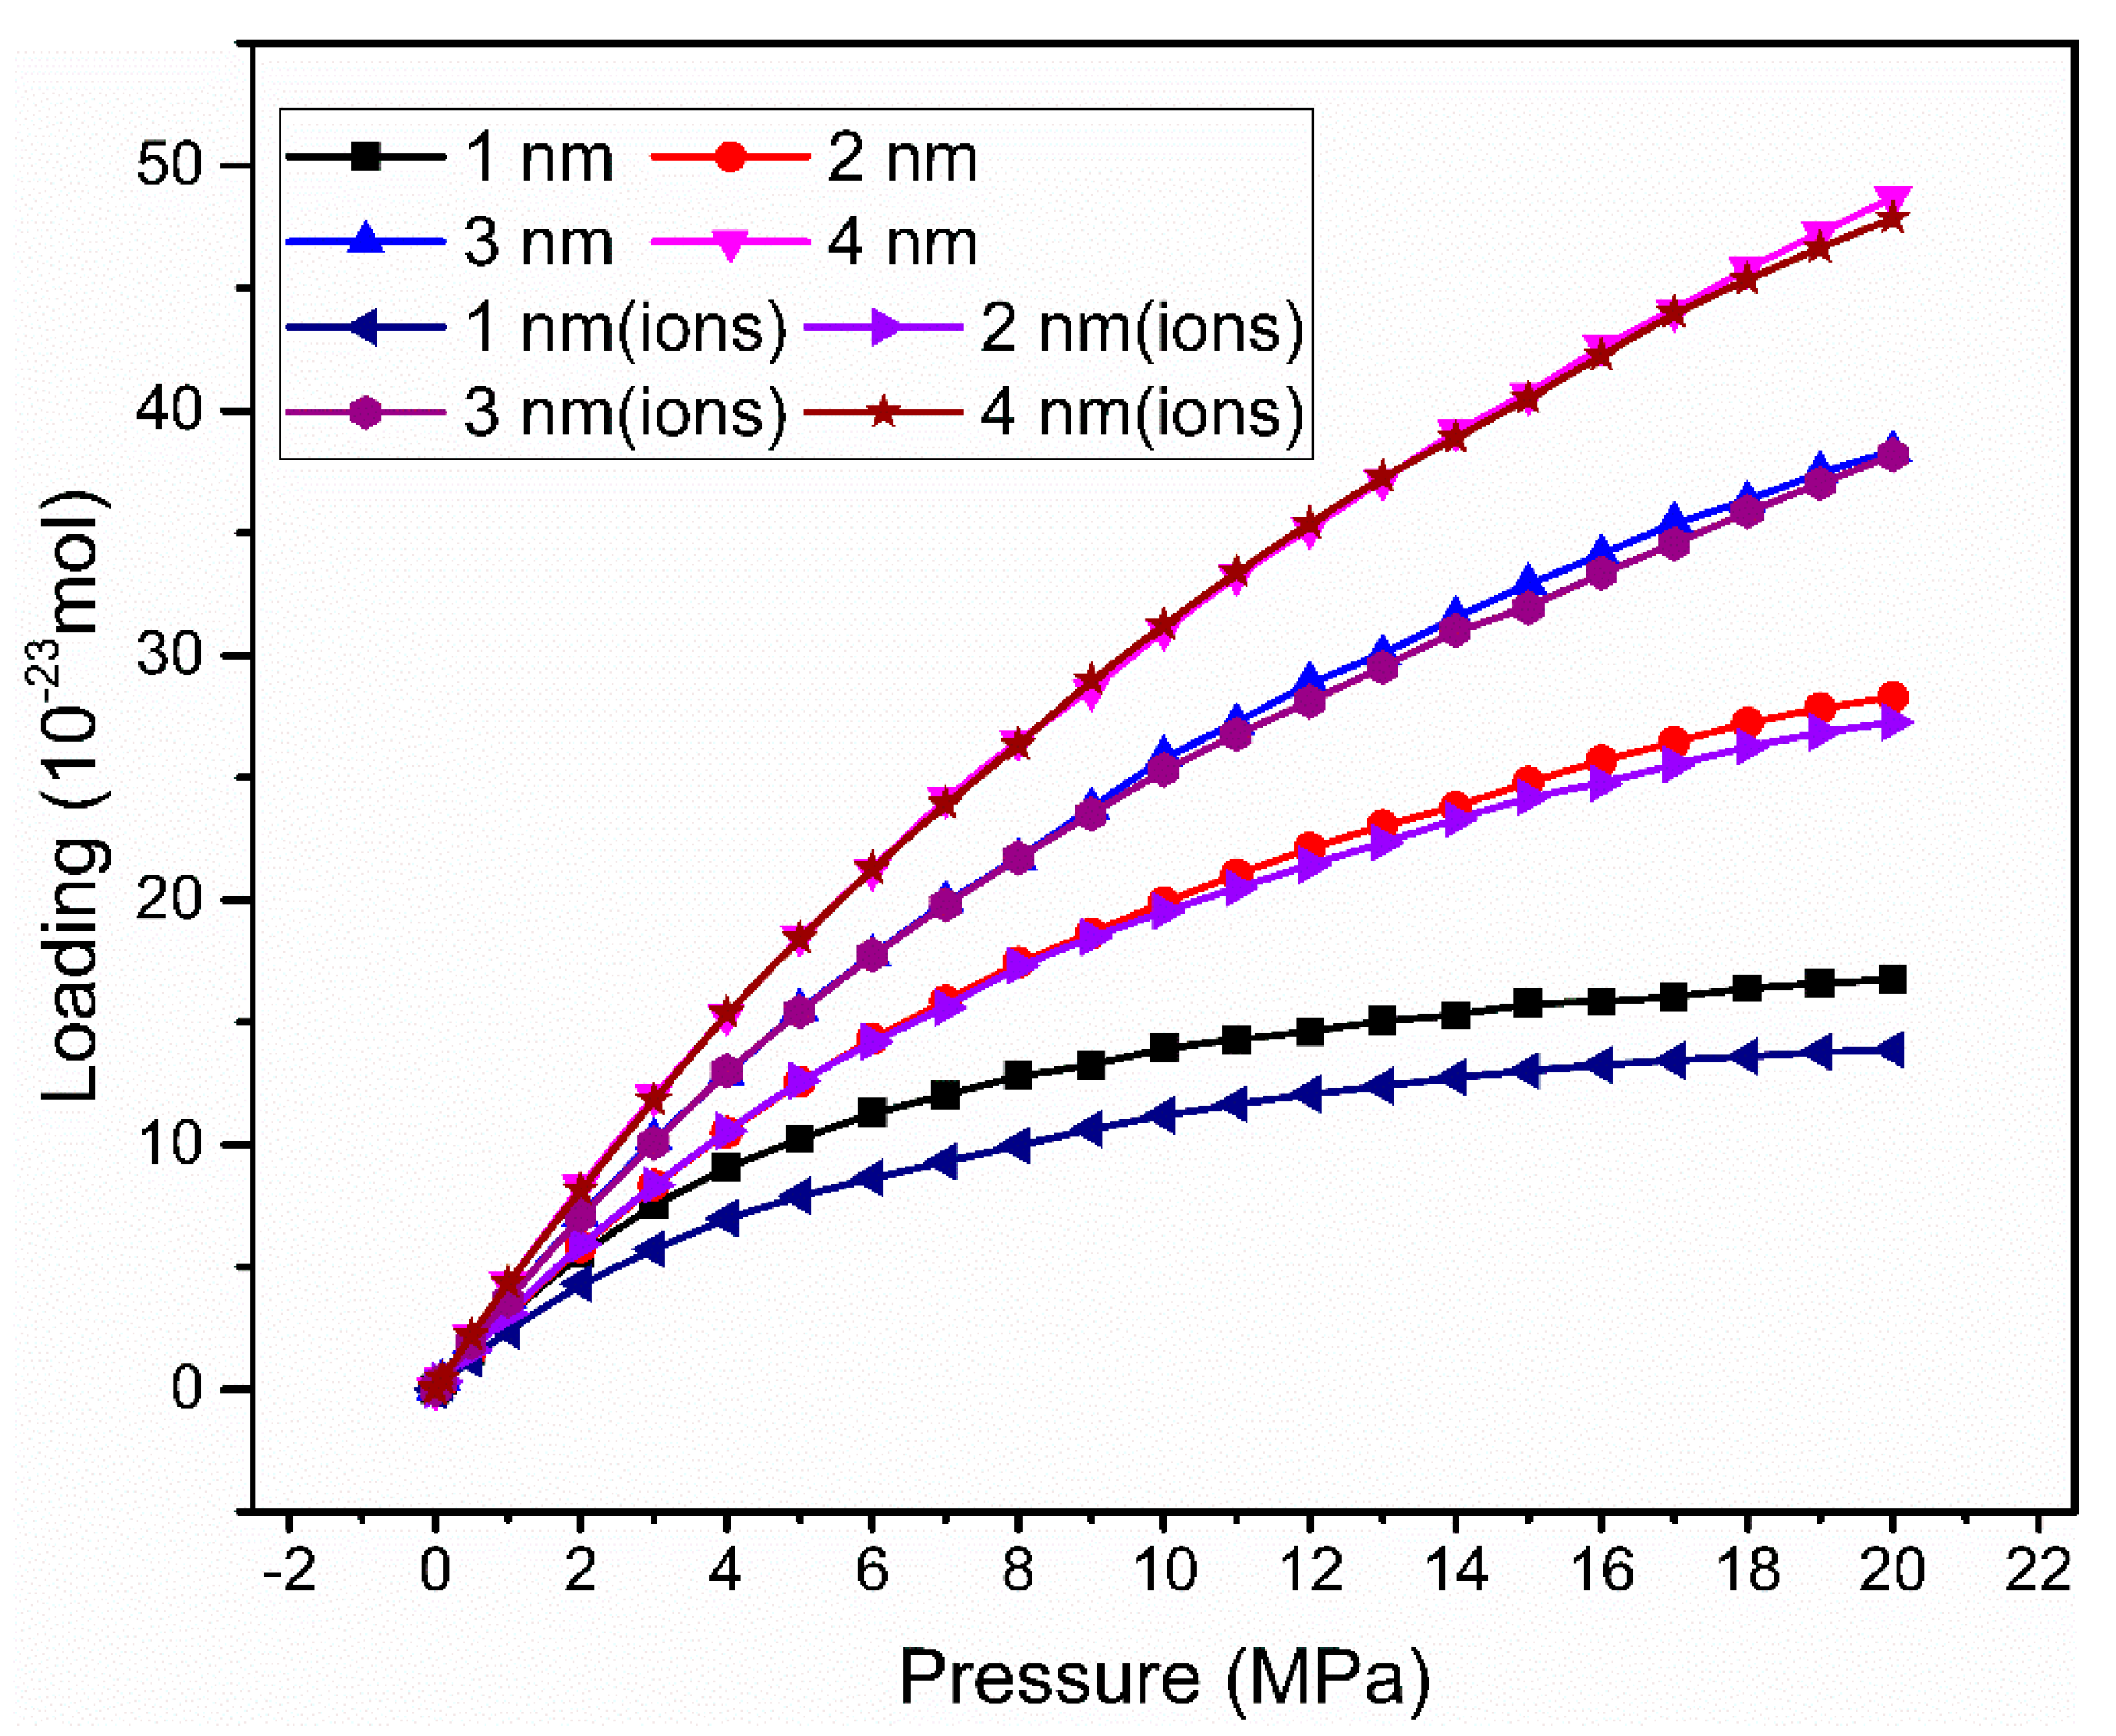
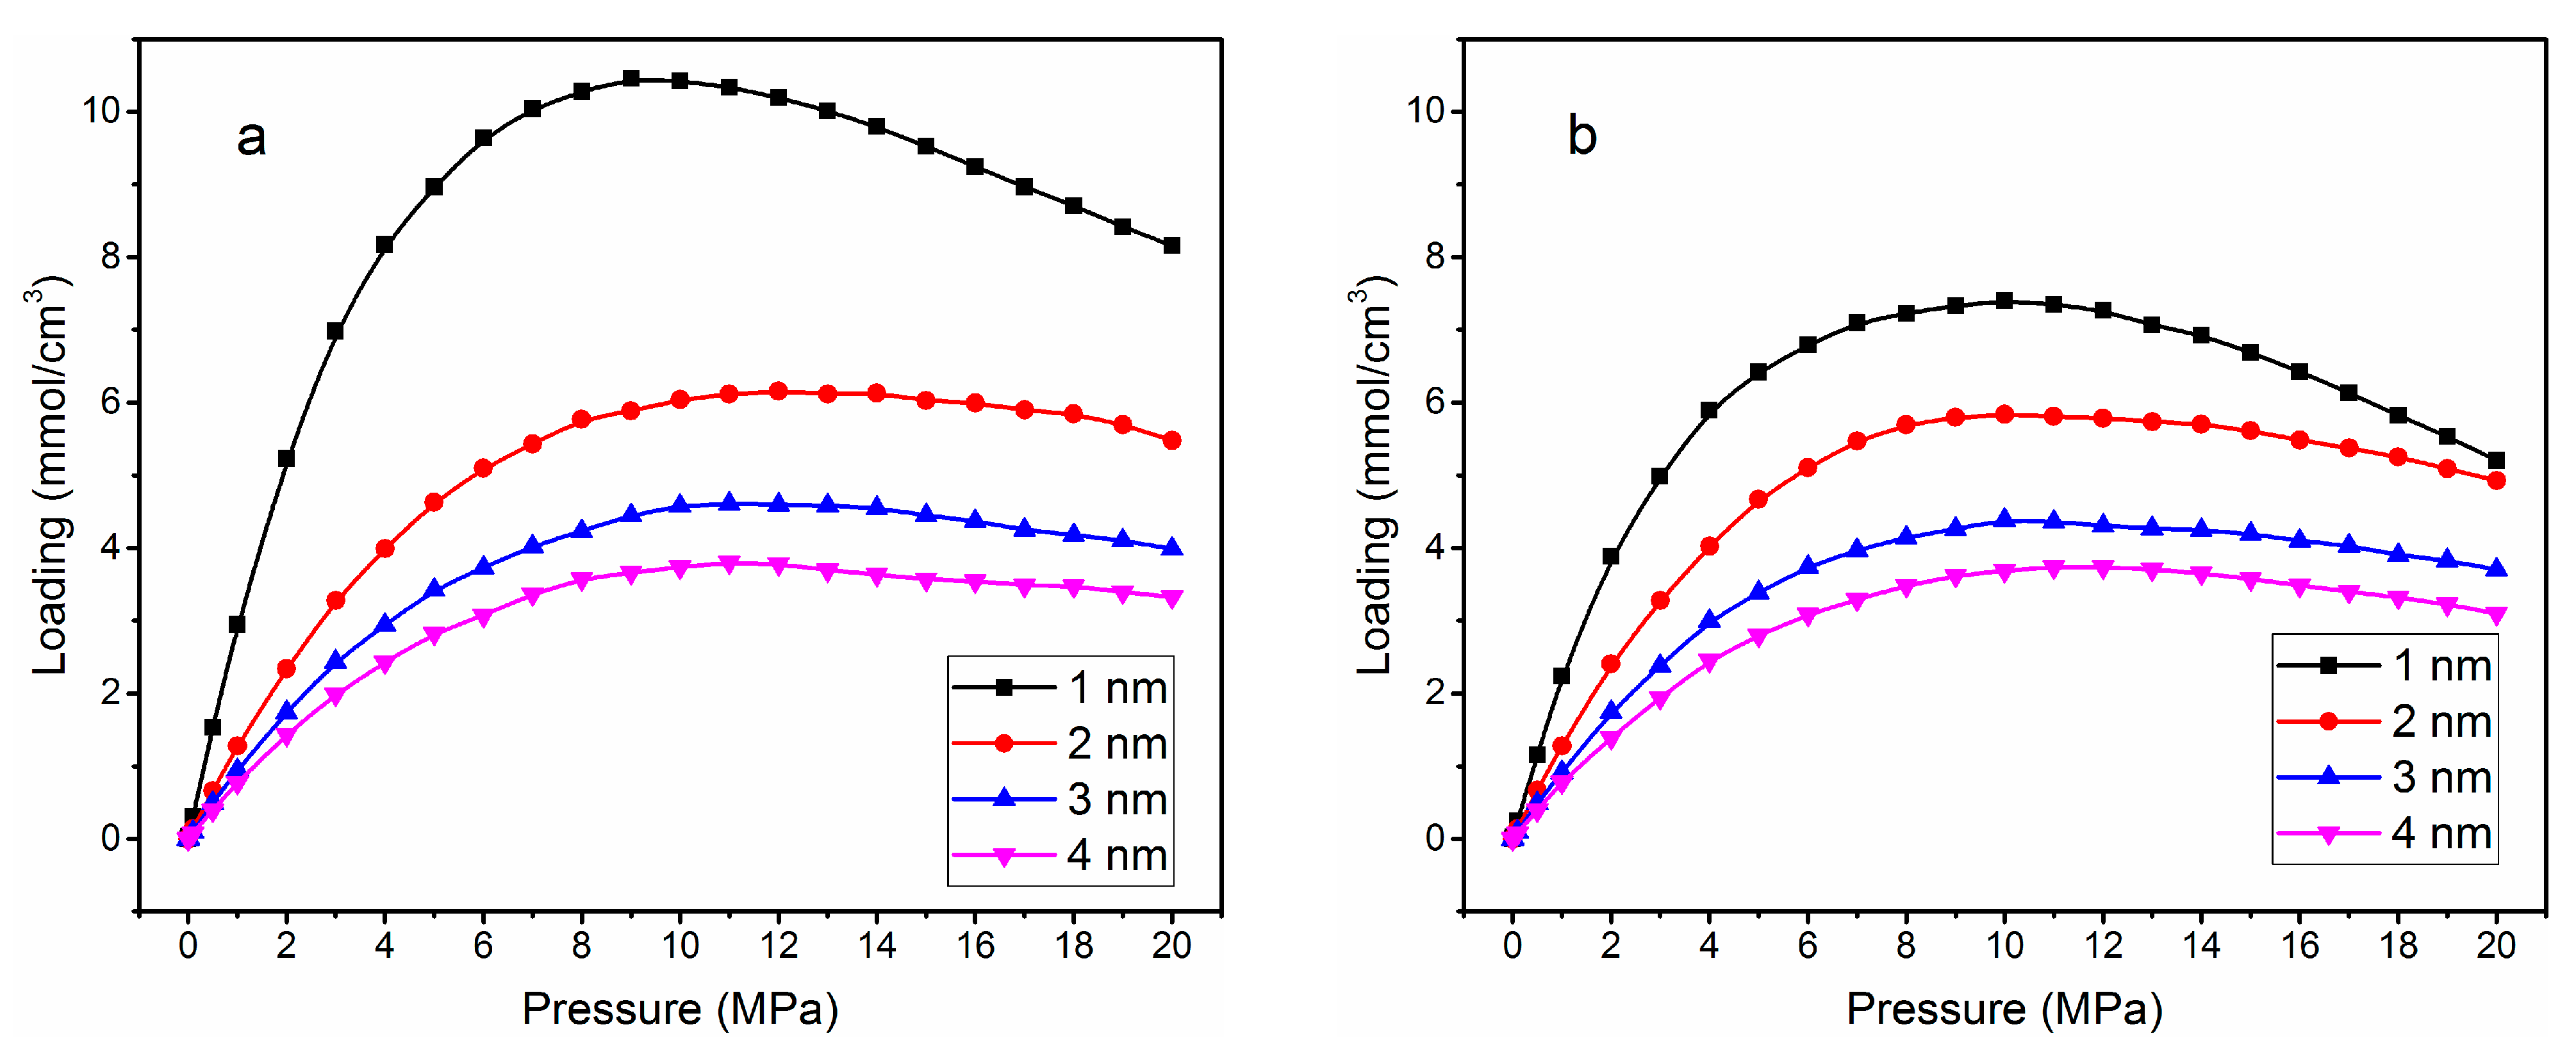
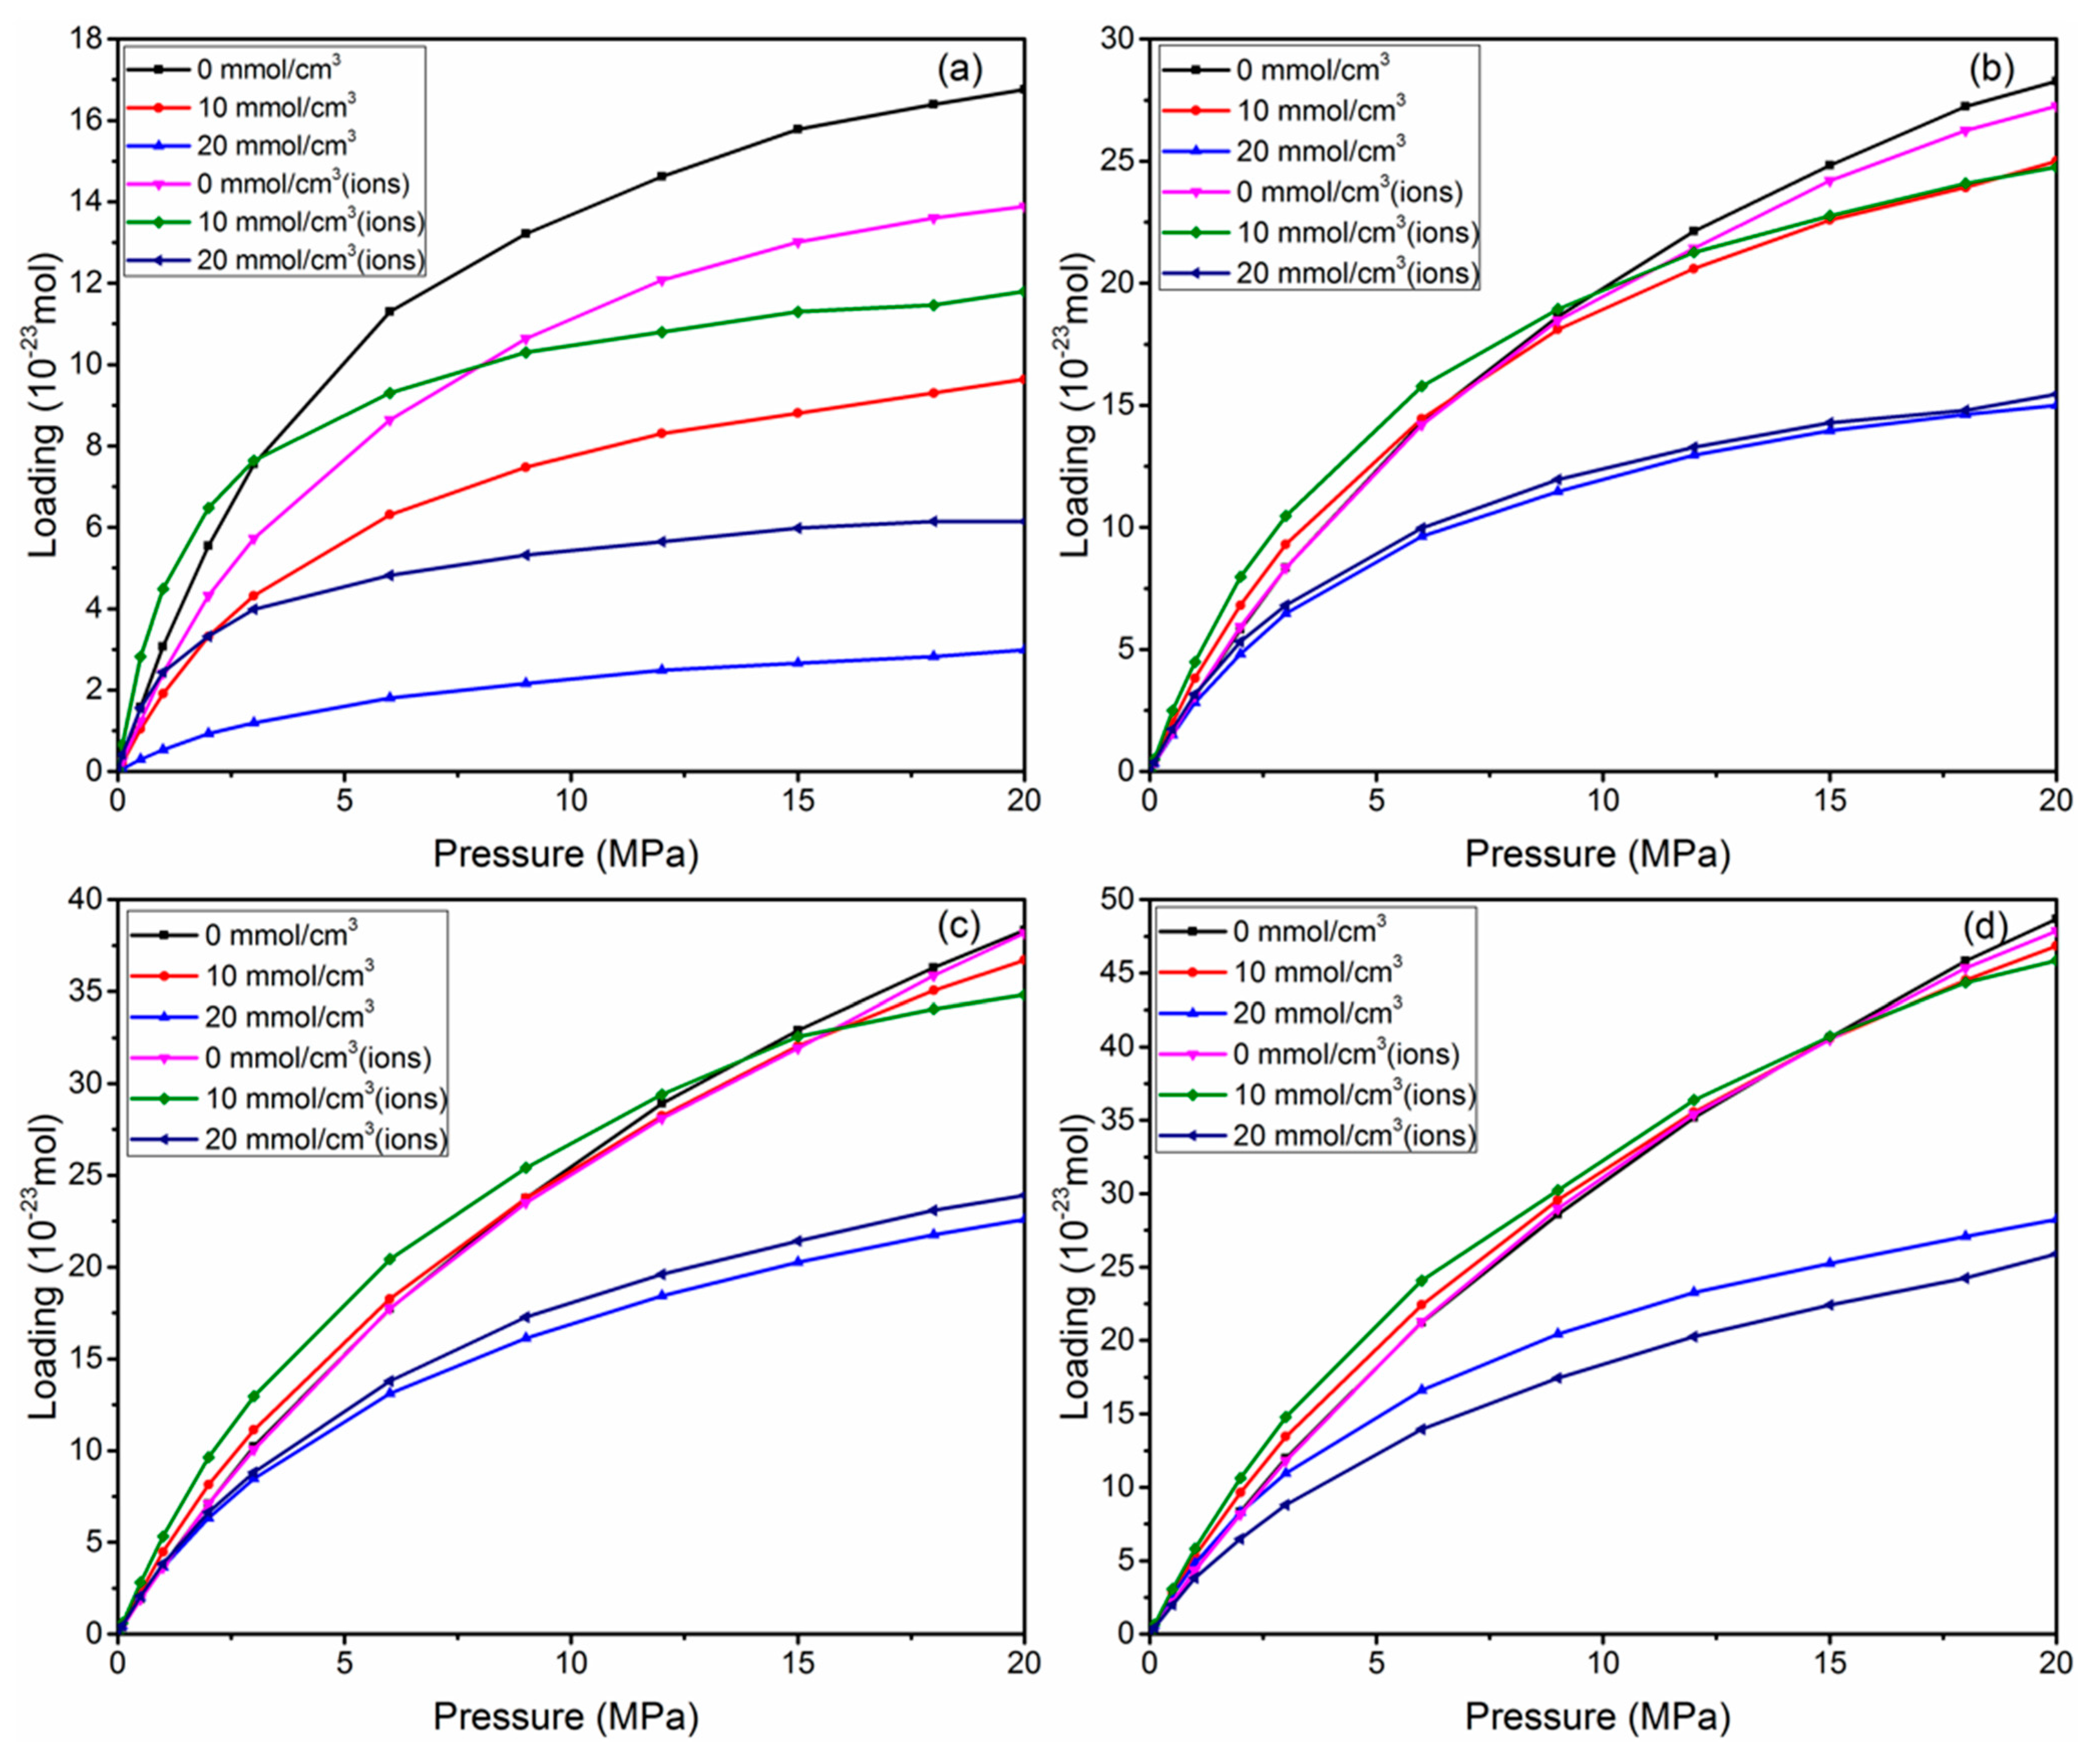
3.1. Adsorption Isotherm

The GCMC simulations were performed to predict the CH4 adsorption isotherm at 298 K and the pressure from 0.01 MPa–20 MPa, with 1.0 nm, 2.0 nm, 3.0 nm and 4.0 nm slit pore sizes. Figure 2 shows the CH4 adsorption isotherms for different MMT pore sizes. It can be found that the isotherms in this work exhibit type-I Langmuir adsorption behavior, which is a typical characteristic of nanoporous materials [40]. As expected, the total CH4 uptakes increase with the increases in pressure due to the fact that the bigger MMT slit pores having more space can accommodate more CH4 molecules.
The effect of the two MMT models without a cation exchange structure and with a cation exchange on CH4 adsorption shows that the MMT structure models without cation exchange can adsorb slightly more CH4. This means, in MMT slit pores, ions can reduce CH4 sorption, because ions occupy some space and hinder the CH4 adsorption. This effect on smaller MMT pores is more obvious. CH4 is a charge neutral molecule, with a zero dipole moment and zero quadrupole moment, so there is no interaction between the ion and CH4 molecule, and the interactions between CH4-clay and CH4–ion are non-electrostatic interactions. To sum up, the presence of ions will cause CH4 adsorption to slightly decrease, and the shapes of adsorption isotherms of CH4 with or without ions are similar.
Figure 2. The adsorption isotherm of methane in MMT pores with sizes of 1.0 nm, 2.0 nm, 3.0 nm and 4.0 nm.
Computation 03 00687 g002
Figure 3 shows the excess adsorption isotherm of CH4 in both MMT models with pore sizes of 1.0–4.0 nm. Excess adsorption, derived from total gas content, is used to predict the sorption capacity. All the excess adsorption isotherms in the MMT slit pores show the similar trend, namely the adsorption amount in the MMT slit pores increases as pressure increases, up to a maximum, and then deceases as the pressure continues to increase. There is a maximum adsorption for each pore, which suggests there exists an optimum pressure for maximum CH4 storage in specific slit pores (see in Table 1). This is of great significance for gas storage. The smaller pores have a dominant peak at low pressure whereas the larger pores’ peak is flatter and indeterminate at higher pressures. Several interesting features and patterns are apparent from these isotherms, under the given conditions: The corresponding curves of all pores are relatively flat, and the larger the slit pores, the flatter the curve. Another feature is that the smaller pores have a larger excess adsorption compared with the bigger pores, this is because the wall effects on the CH4 will lead to the unit volume having more CH4 molecules in the smaller MMT pores.
Figure 3. The excess adsorption isotherm of methane in MMT pores with sizes of 1.0 nm, 2.0 nm, 3.0 nm and 4.0 nm. (a) Without cation exchange structure and (b) with cation exchange structure.
Computation 03 00687 g003
Table 1. Optimum pressure for maximum methane storage at different pore sizes.
Without Cation Exchange StructureWith Cation Exchange Structure
Pore size
(nm)
1.02.03.04.01.02.03.04.0
Loading
(mmol/cm3)
10.466.154.613.787.405.834.383.73
Pressure
(MPa)
8111213891011

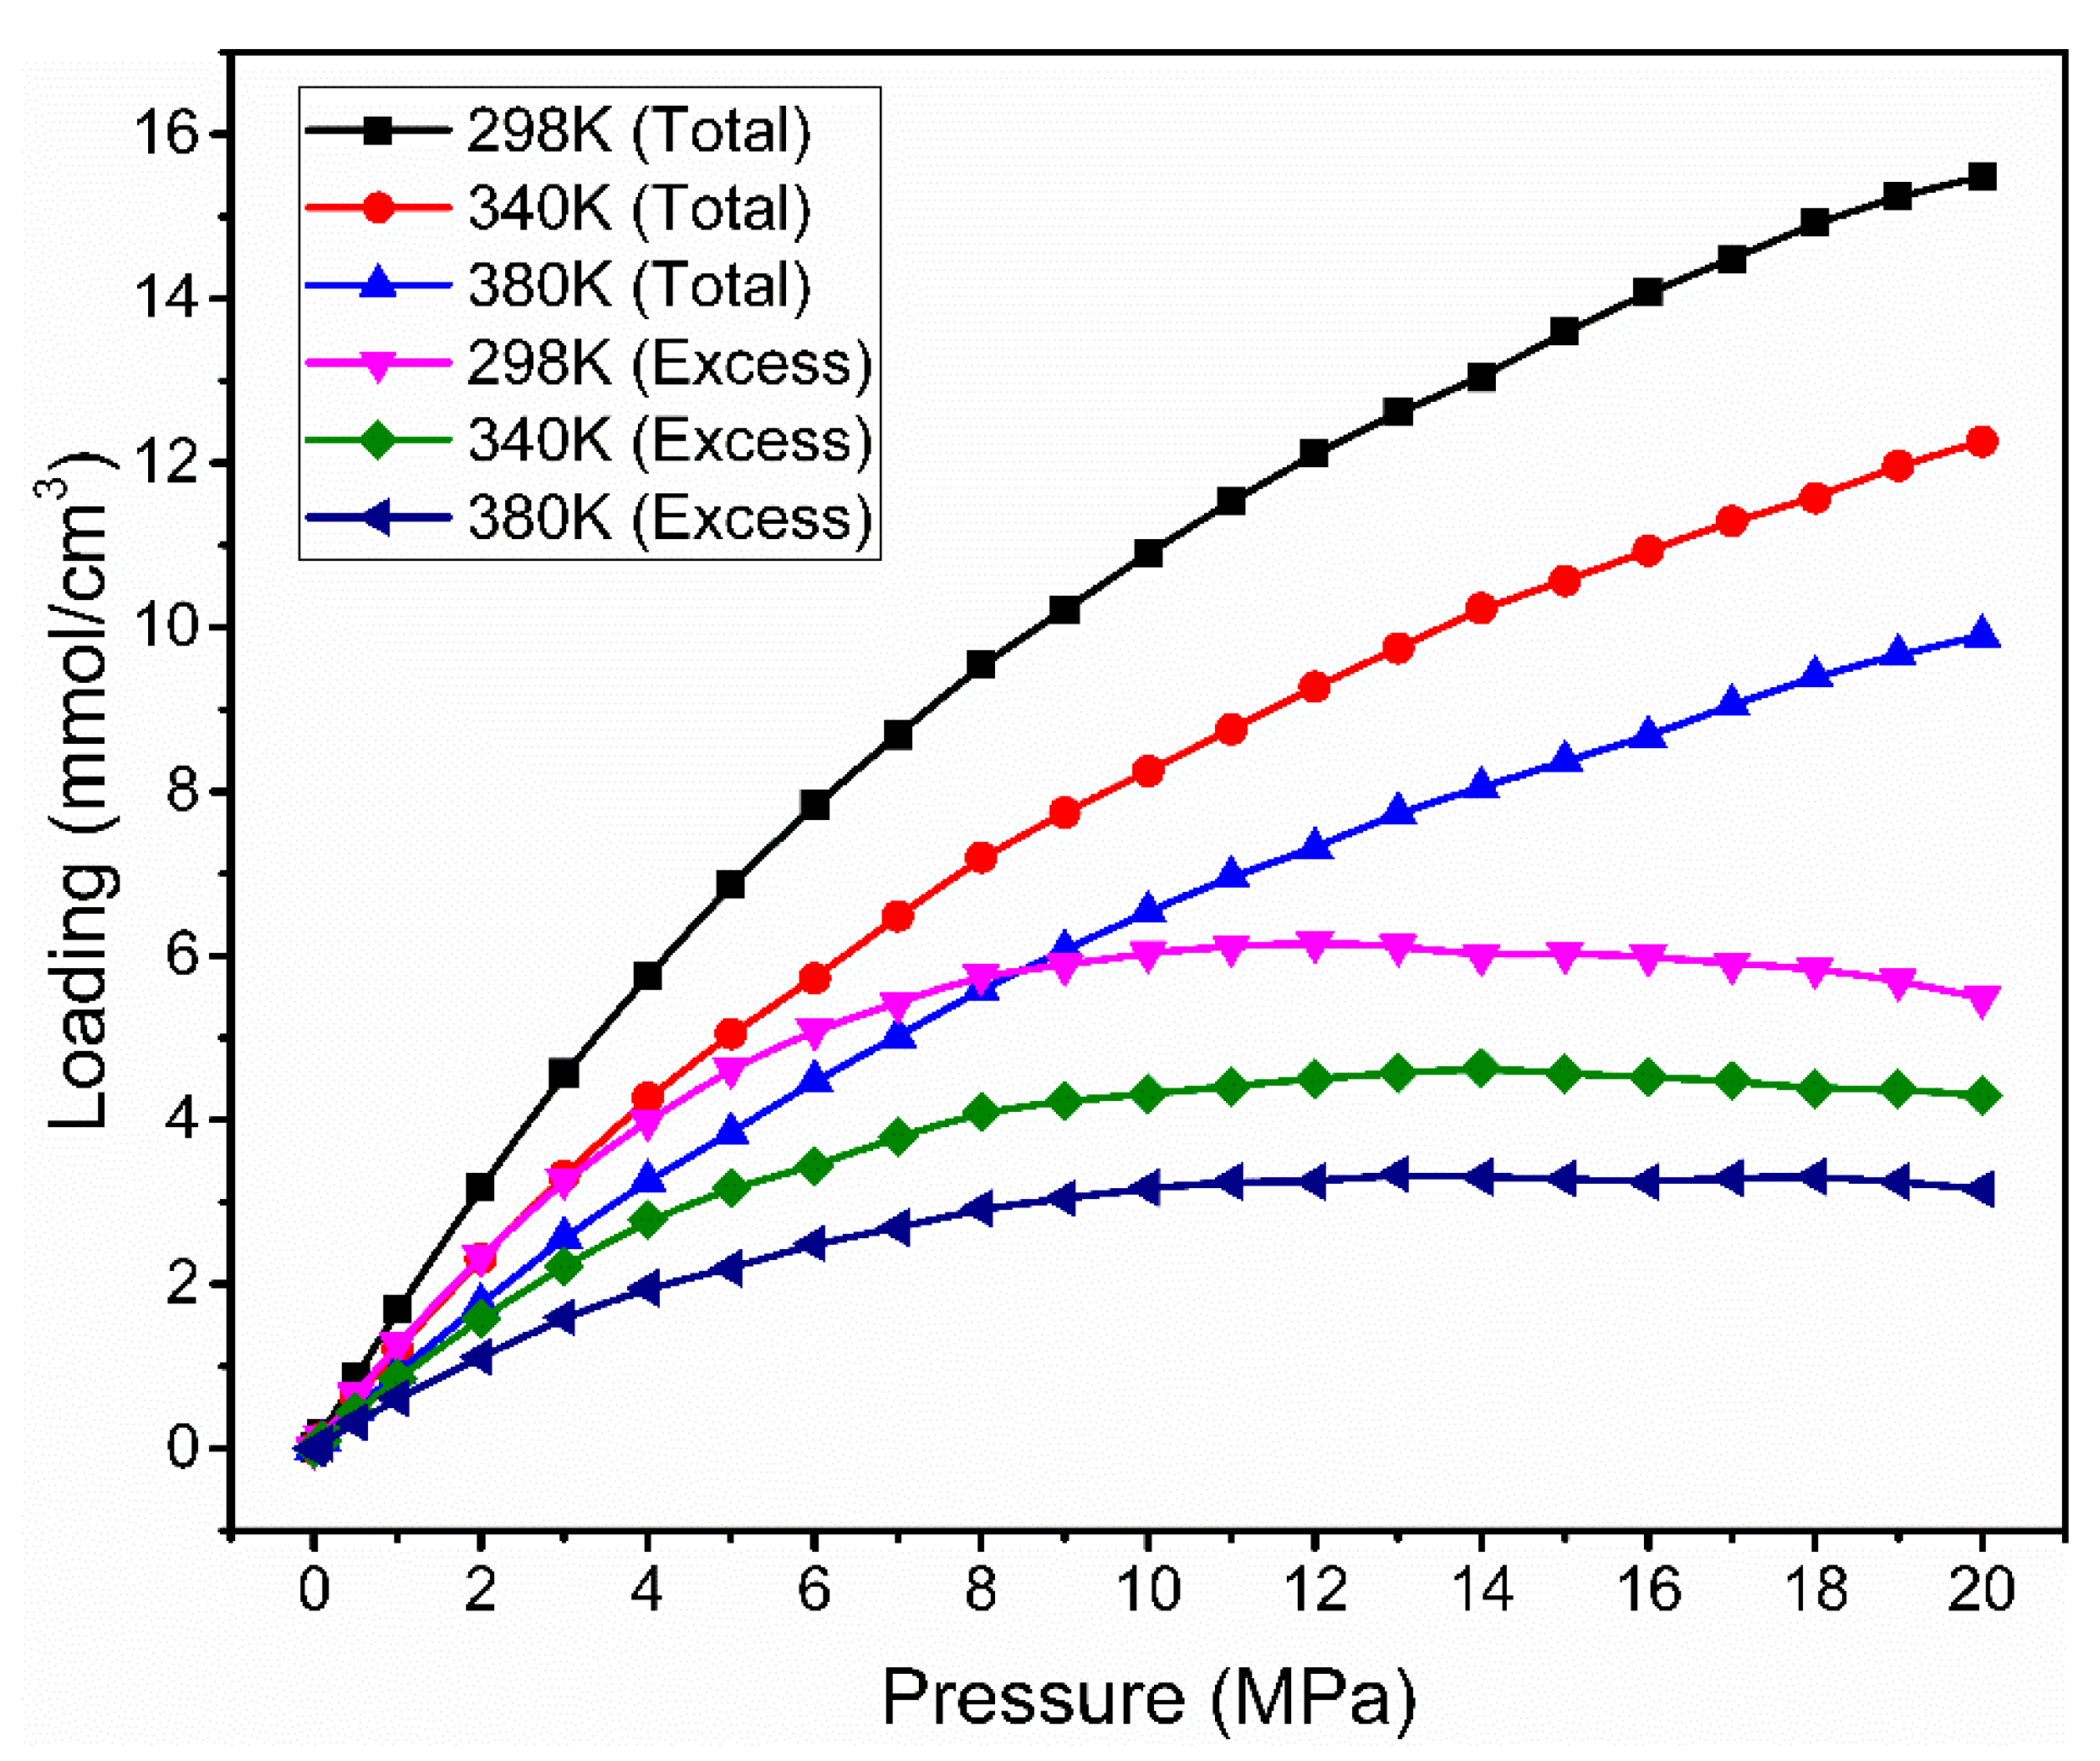
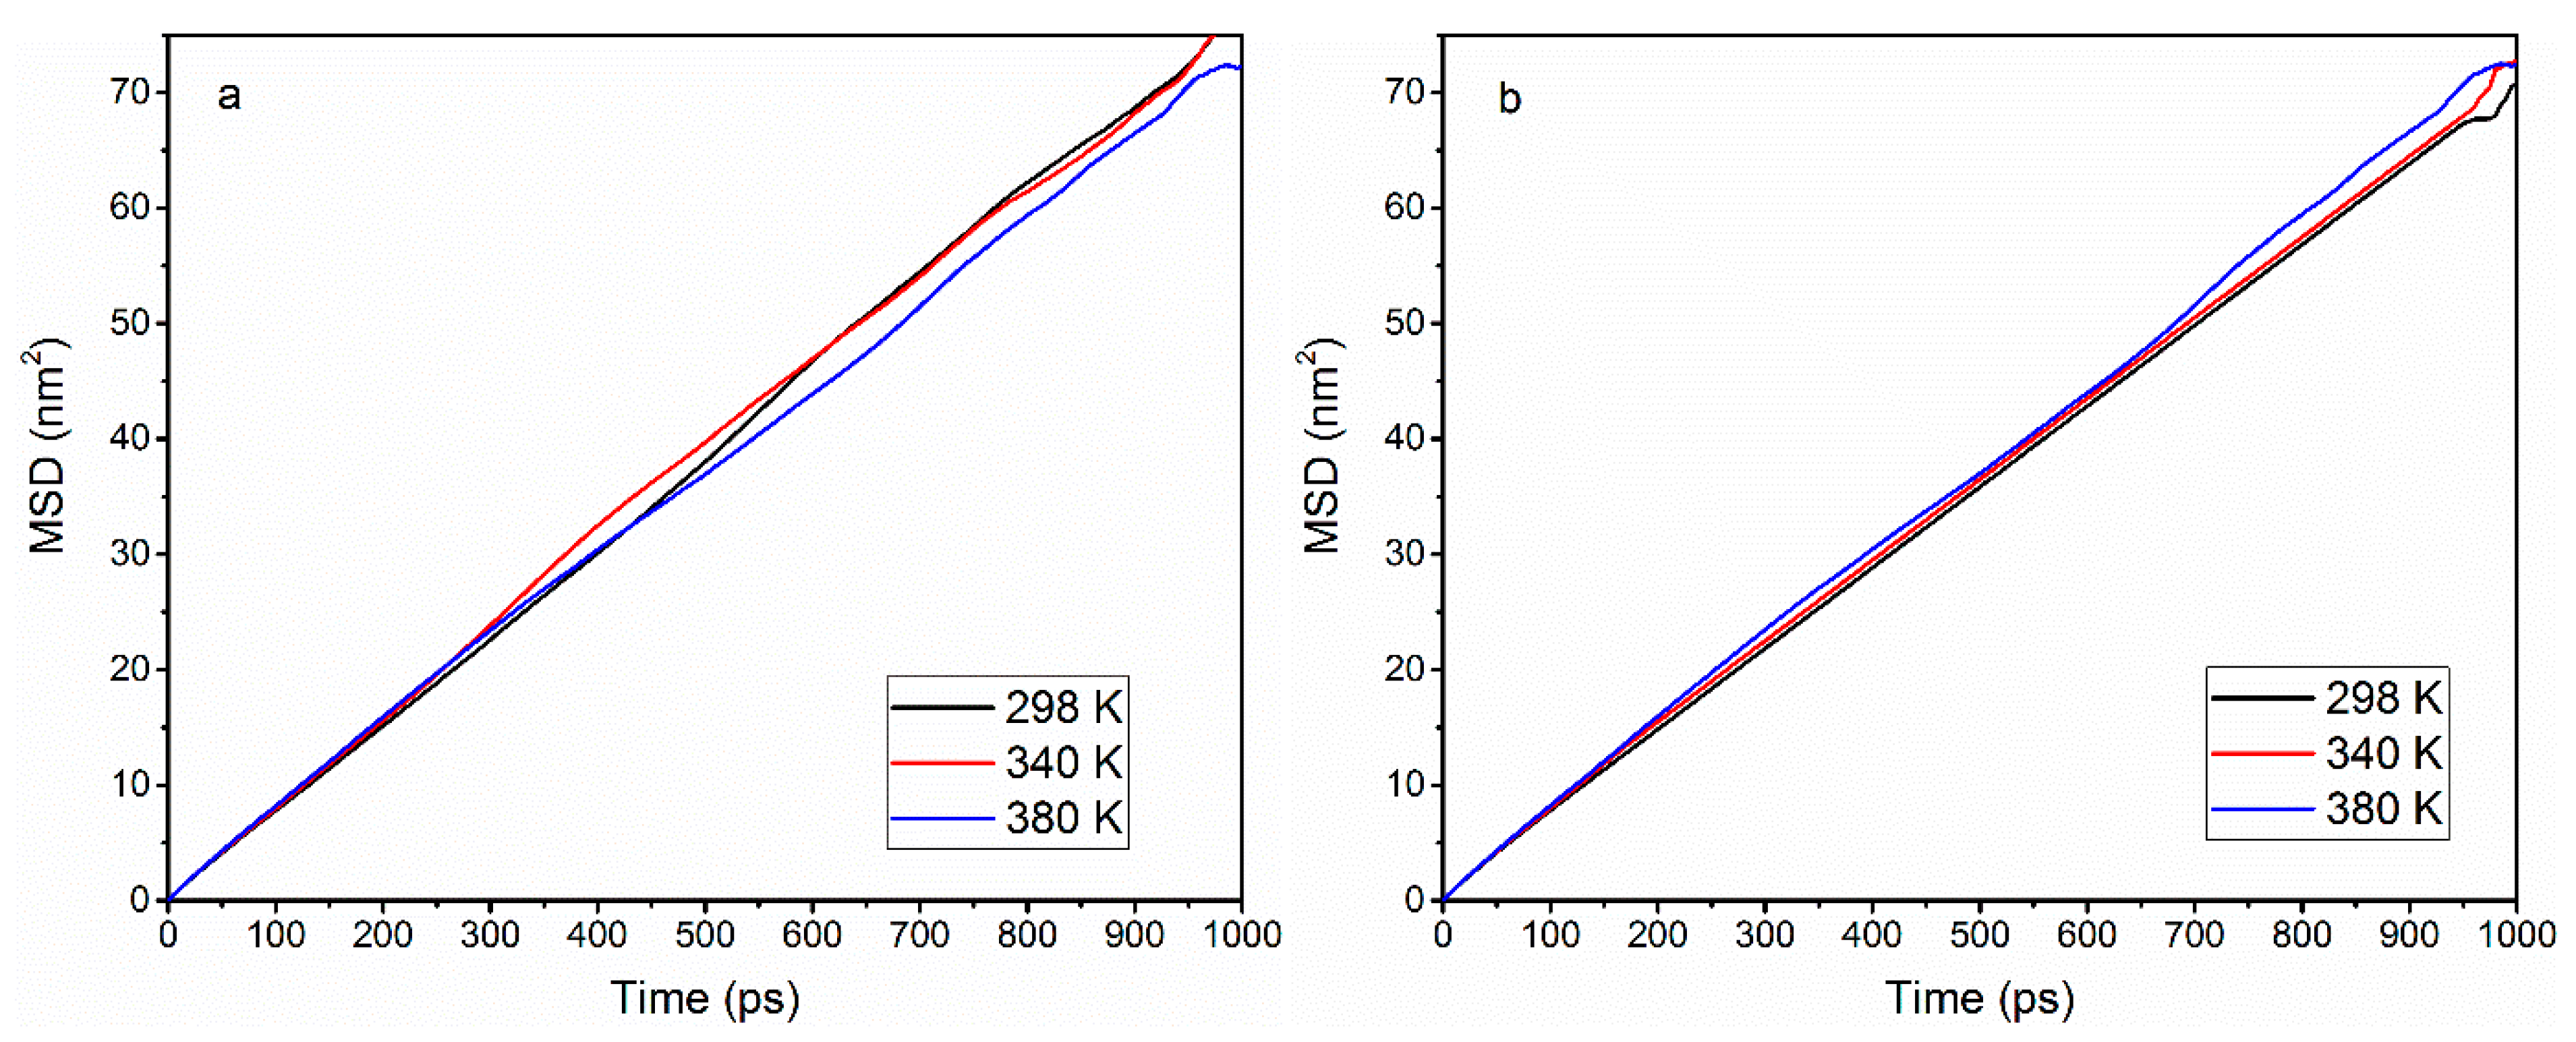
3.2. Effect of Temperature

In order to study the temperature effect on CH4 adsorption in MMT slit pores, the typical pore size H = 2.0 nm without cation exchange structure was chosen and the temperatures 298 K, 340 K and 380 K were used to predict the isotherms of CH4 adsorption (see in Figure 4). It can be found that, at the same pressures, the higher temperature can reduce total loading of CH4. The reason is that as the temperature increases, the kinetic energy of the molecules will increase and the distance between the molecules becomes large. The excess adsorption isotherms show some interesting features. For instance, as the pressure increases, the difference in excess loading corresponding to different temperatures will increase, peaking at 9 MPa. With the increase of pressure, the difference will be smaller.
This result proves that, in addition to the effect of the wall, the temperature and pressure have an influence on the adsorption. Moreover, at low pressures, temperature plays a major role in the CH4 adsorption; when the pressure is high, the pressure effect is more pronounced.
Figure 4. Adsorption isotherms of methane in a 2 nm pore without cation exchange structure at temperatures of 298 K, 340 K and 380 K.
Computation 03 00687 g004

3.3. Density of Methane in Slit Pores

It is difficult to directly examine the CH4 density in MMT pores by experiments. Molecular dynamics technique can be convenient to observe the CH4 positions in the given MMT slit pores, as well as recording the density and layers of the CH4.
Figure 5. The snapshot of methane in different MMT pore sizes at 8 MPa and 298 K.
Computation 03 00687 g005
Figure 5 shows the snapshots and Figure 6 is the corresponding, predicted density profiles for CH4 confined to nanopores without and with ions at different pores size at 8 MPa. It can be found that the density is not uniform across the pores, and the density profiles in all MMT pores exhibit the obvious peak near the pores’ wall where adsorption takes place, and at a platform region around the center. Maximum density of the adsorbed layer will decrease as pore size increases. This is because in smaller pores, the two walls effect are superimposed and enhances CH4 sorption. As the pore size increasing, the superimposed effect becomes smaller or vanish, the adsorbed layer density keep a constant and furthermore the CH4 density in the center of the pores reaches the bulk limit.
Figure 6. Density profiles of methane at different MMT pore sizes at 8 MPa and 298 K. (a) 1.0 nm, (b) 2.0 nm, (c) 3.0 nm and (d) 4.0 nm.
Computation 03 00687 g006

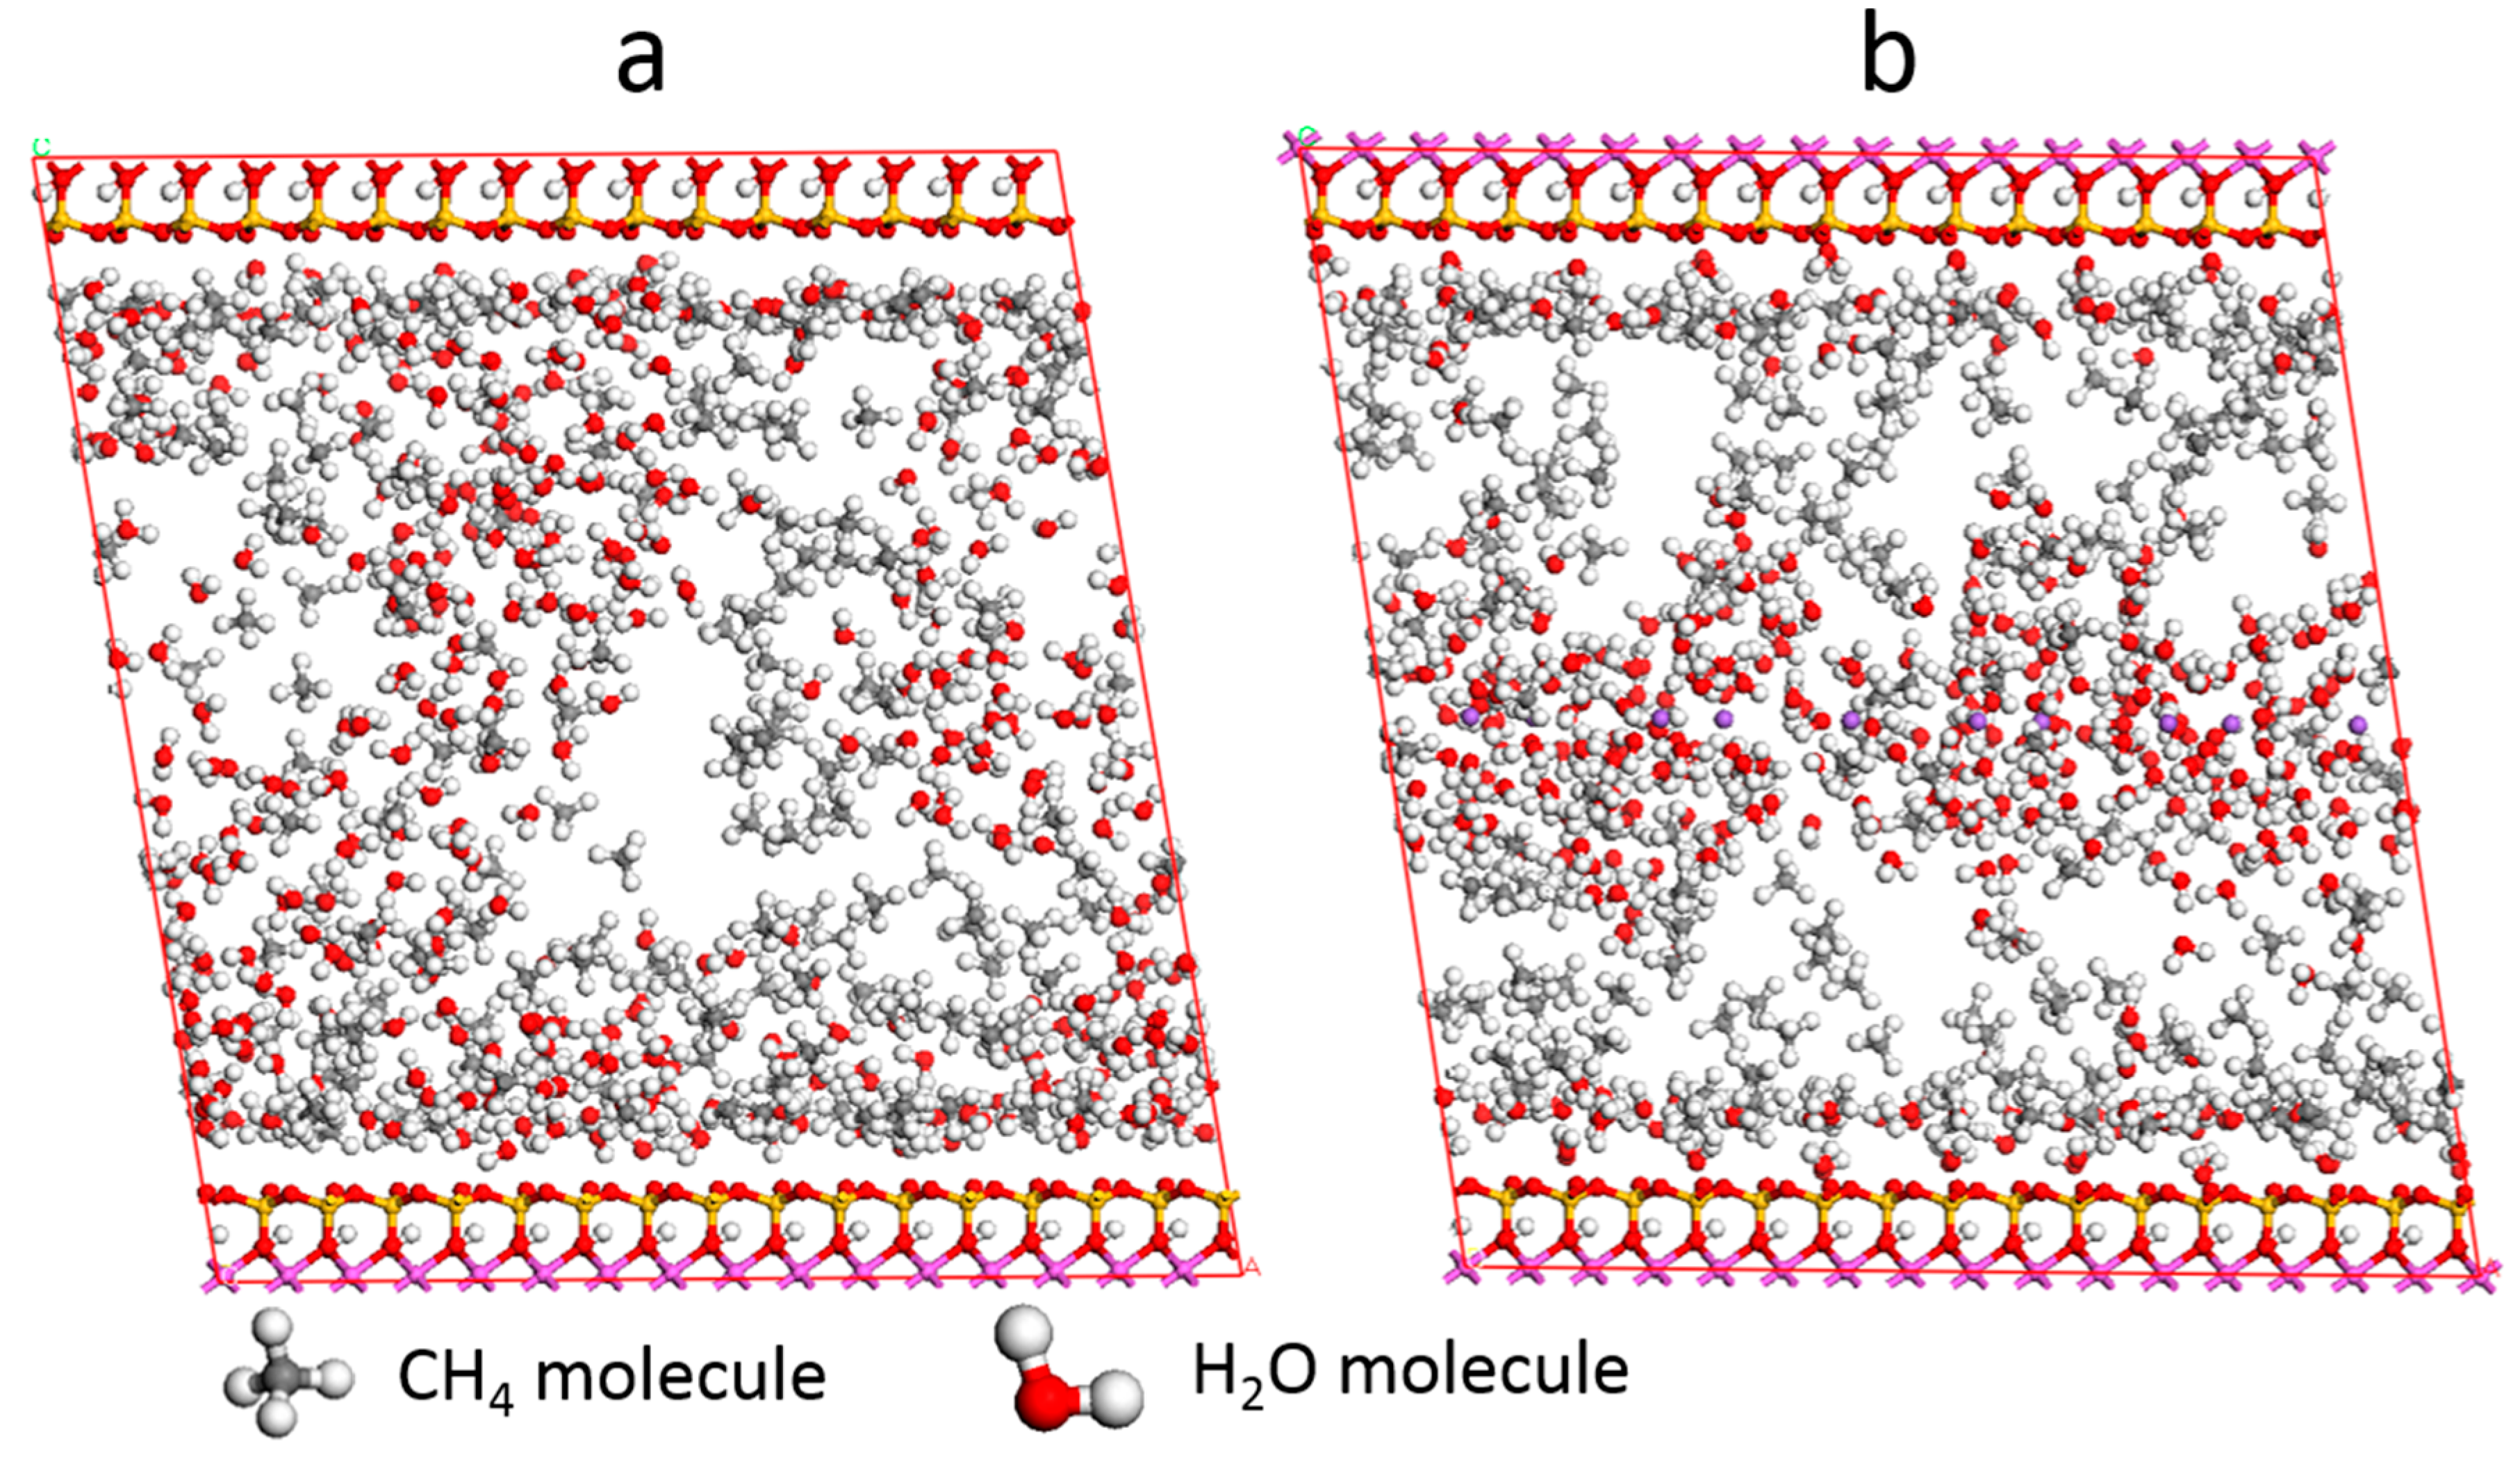
3.4. Effect of Water
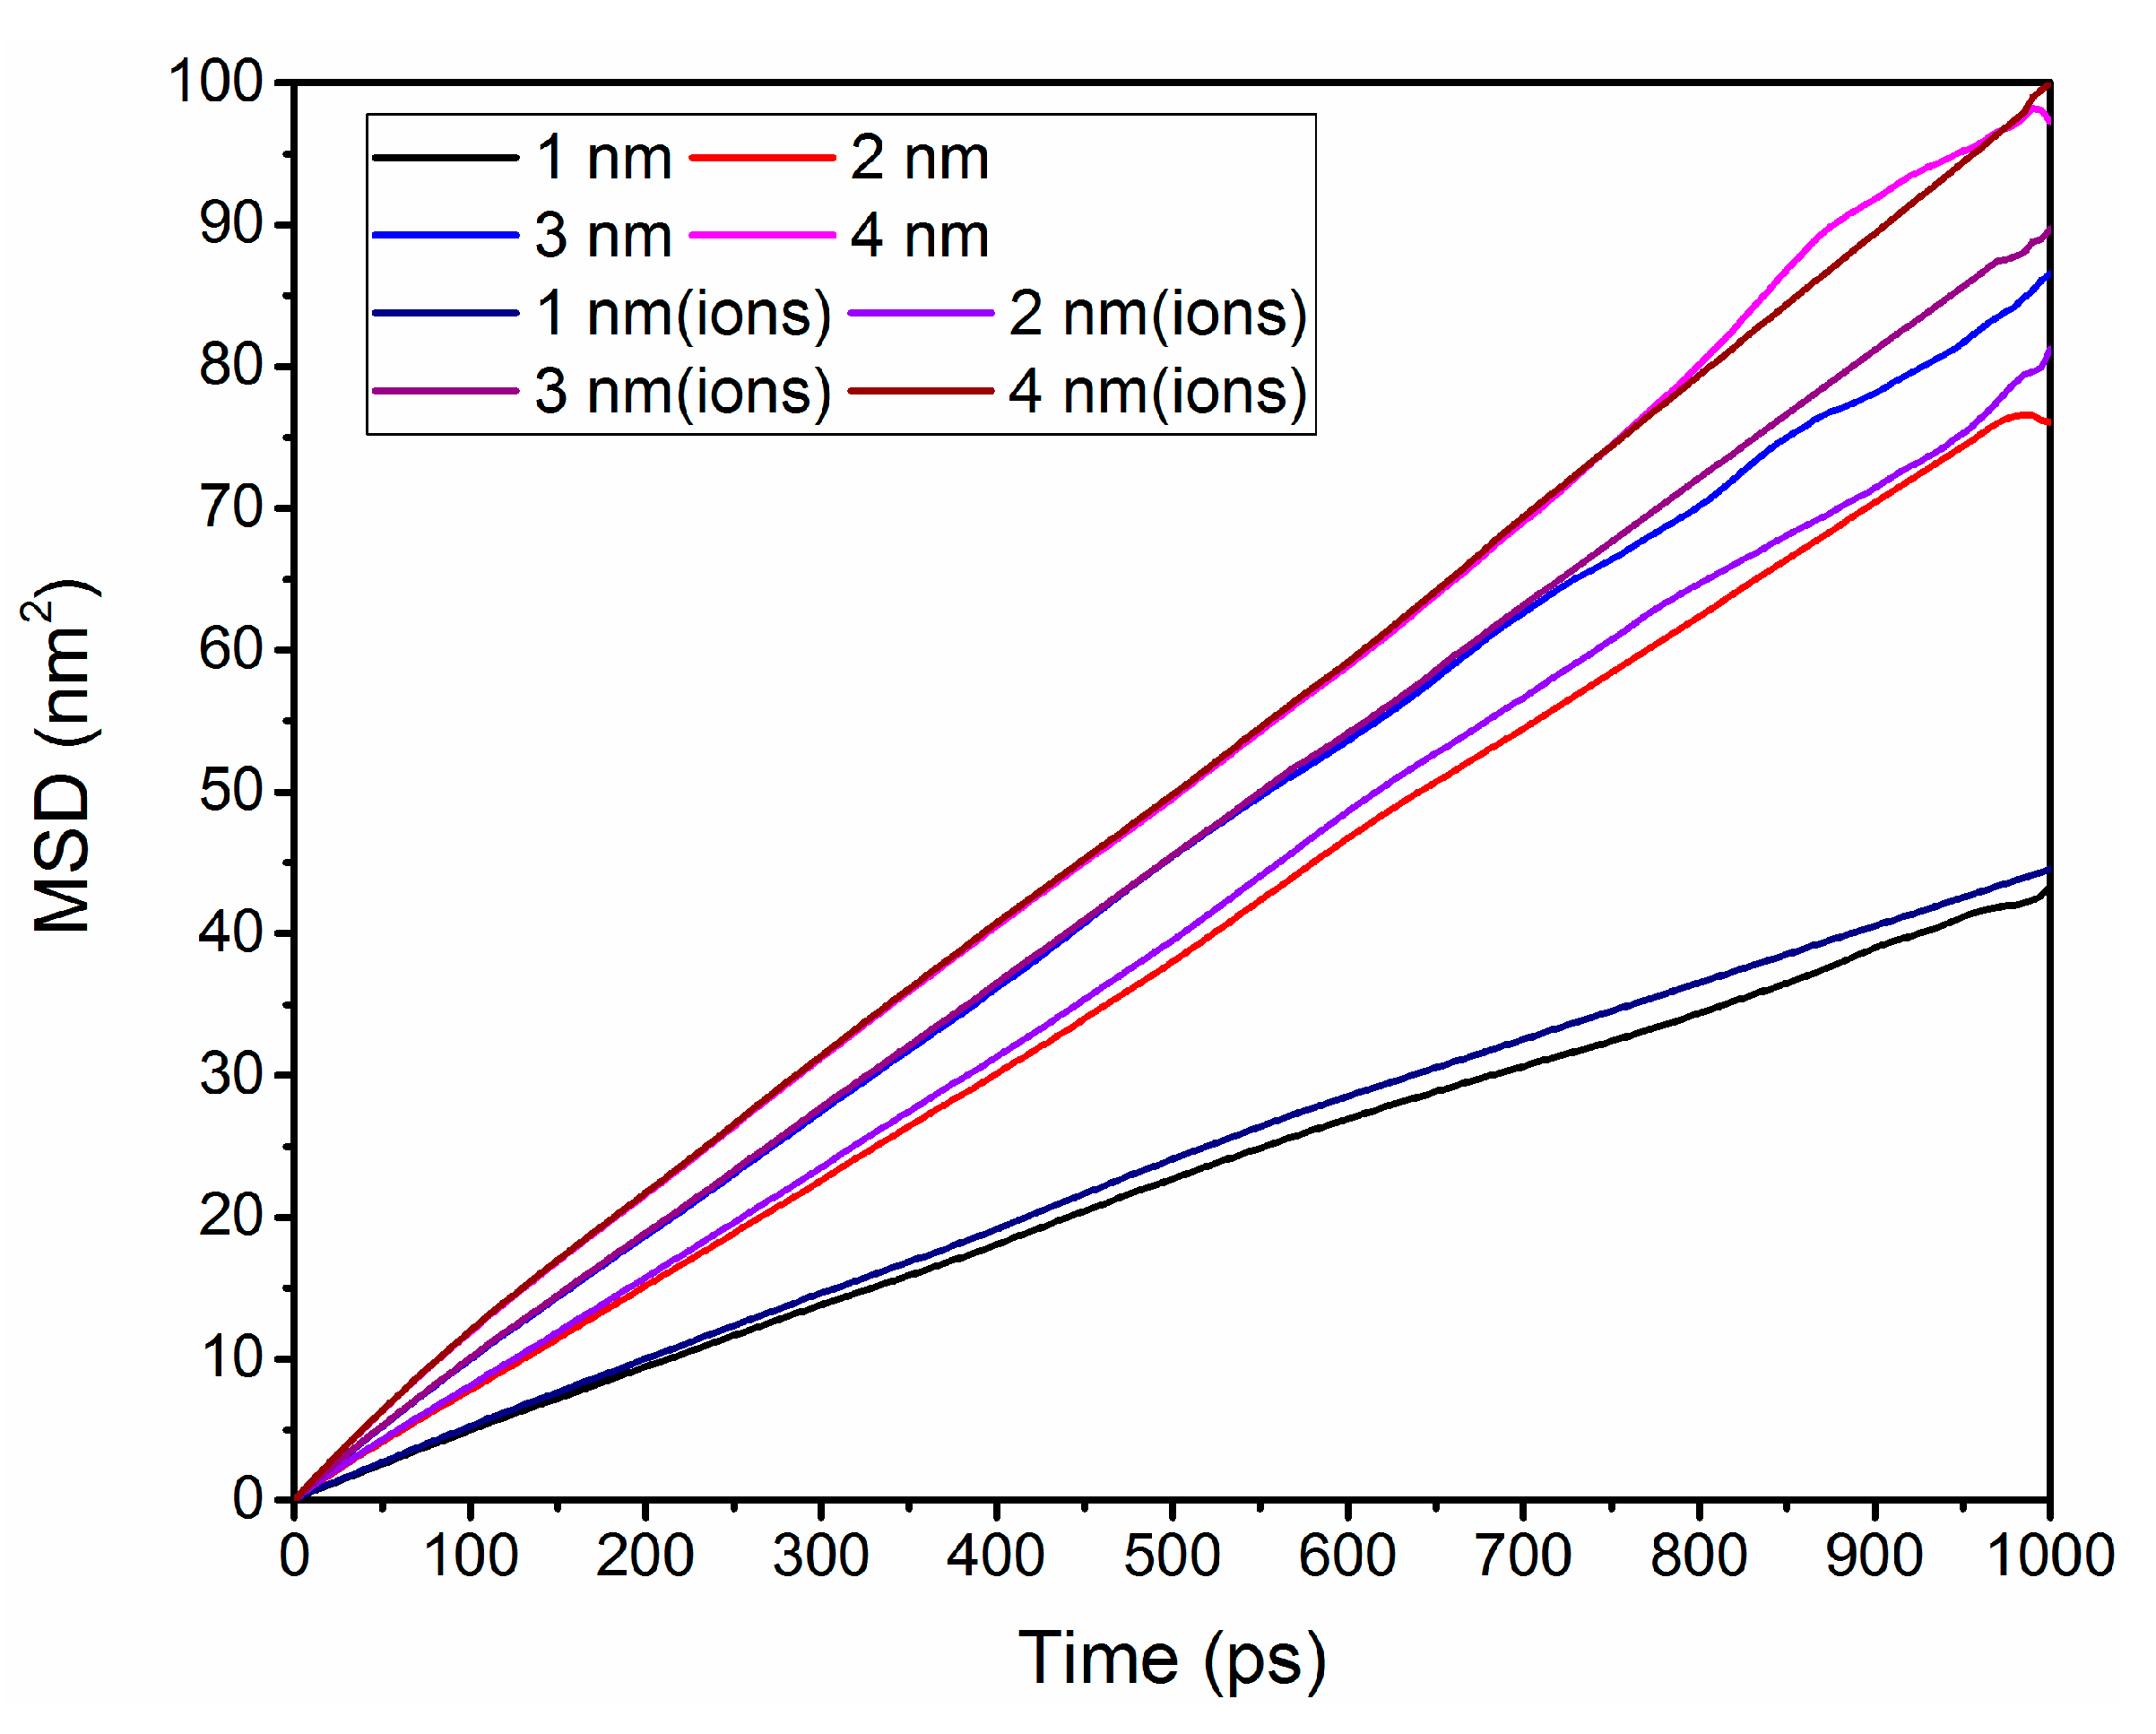
The effect of water on CH4 adsorption behavior in clay nanopores for different pore sizes and pressures with varying amounts of preloaded water is studied at 298 K. In this work, there are two (10 mmol/cm3, 20 mmol/cm3) quantities of water molecules preloaded in the MMT pores to research the effect of water on CH4 adsorption behavior. Figure 7 shows the effect of water on CH4 adsorption isotherm in MMT pores with or without ions. As seen in Figure 7, CH4 sorption decreases significantly as the water increases. CH4 can be reduced ~6, 2, 1.6 and 1.6 times and ~2.2, 1.7, 1.5 and 1.8 times without and with a cation exchange structure for 1.0 nm, 2.0 nm, 3.0 nm and 4.0 nm MMT pores with 20 mmol/cm3 water molecules at 15 MPa. When water content is 10 mmol/cm3, the amount of CH4 adsorption in MMT with cation exchange structure is higher than that in MMT without cation exchange structure at low pressure (<15 MPa). A similar result was obtained when the water content was 20 mmol/cm3, except in 4.0 nm MMT pores.
Figure 7. The effect of water on methane adsorption isotherm in MMT pores with or without ions at 298 K. (a) 1.0 nm, (b) 2.0 nm, (c) 3.0 nm and (d) 4.0 nm.
Computation 03 00687 g007
The snapshots of MC simulations for configurations of CH4 molecules in the MMT pores without and with a cation exchange structure for 4.0 nm with 10 mmol/cm3 water molecules is displayed in Figure 8. As shown in Figure 8a, for MMT pores without a cation exchange structure, the water molecules occupy more space and reduce CH4 sorption, CH4 is hydrophobic, and CH4 molecules do not spread within water molecules and the water molecules accumulate together because of water–water interaction. In MMT pores with a cation exchange structure, we found water molecules are adsorbed on the clay surface and accumulate together around Na+ ions because water has a strong dipole moment and can be adsorbed to the negatively charged clay sheets and positively charged Na+ ions. CH4 molecules are distribute in other spaces in the pores.
Figure 8. The snapshots of methane molecules in the MMT pores without and with a cation exchange structure for 4.0 nm with 10 mmol/cm3 water molecules. (a) Without cation exchange structure and (b) with cation exchange structure.
Computation 03 00687 g008

3.5. Self-Diffusion

The mean square displacement (MSD), which describes an average distance of a given particle traveling in a system, is usually used to depict the alkane molecules’ diffusion behavior. The self-diffusion coefficient, related to the MSD function, can be calculated as follows by the Einstein equation.
D = 1 4 lim t d d t i = 1 N | r i ( t ) r ( 0 ) | 2
where D is the self-diffusion coefficient of species i, | r i ( t ) r ( 0 ) | 2 is the mean square displacement (MSD) of molecules relative to the initial coordinates at time t. ri and r0, respectively, representing the spatial position vectors of molecules at time t and initial time. Note that, in this work, we study the two-dimensional diffusion corresponding to this equation, since the diffusion coefficient normal for the pore walls is too small at about zero. The self-diffusion coefficients can be calculated from the slope by MSD which is proportional to the self-diffusivity through the Einstein equation. Figure 9 depicts the MSD of CH4 at a temperature of 298 K and with different width slit pores from 1.0 nm–4.0 nm. The MSD curves were linear, and the diffusion coefficients were calculated according to Equation (4). With the slit pore size increasing, the slope of the MSD increases and the CH4 self-diffusion coefficients proportional to the MSD will increase. As the width of the slit pore becomes large, the large space corresponds to the smaller density, despite a large amount of adsorption. Therefore, CH4 molecules have a larger space to move within, and a greater self-diffusion coefficient. Figure 10 demonstrates the changes over time of MSD of the CH4 molecules in 2.0 nm slit pores with a specific simulation time at different temperatures. We can find the difference in diffusion coefficients is small at different temperatures in the given conditions. The reason may be that the temperatures of 340 K and 380 K are above the critical temperature of CH4, and this will affect the CH4 thermodynamic properties. We will conduct further studies on this matter. The CH4 self-diffusion coefficients in different nanopores are shown in Table 2.
Figure 9. MSD of methane with different pore sizes at 8 MPa and 298 K.
Computation 03 00687 g009
Figure 10. MSD of methane with different temperatures in 2.0 nm pore at 8 MPa. (a) Without cation exchange structure and (b) with cation exchange structure.
Computation 03 00687 g010
Table 2. Self-diffusion coefficient of methane with different spacing and temperatures at 8 MPa.
WidthTemperatureDwithout ions (10−8 m2/s)Dwith ions (10−8 m2/s)
(nm)(K)(8 MPa)(8 MPa)
1.02980.7060.710
2.02981.2361.234
2.03401.2641.261
2.03801.2881.284
3.02981.4311.432
4.02981.6381.637

4. Conclusion

It is important study CH4 adsorption and diffusion behaviors in shale gas reservoirs for shale gas production. In this work, the adsorption and self-diffusion behavior of CH4 in various clay pores were studied by GCMC and MD simulations. The studies show that the dispersive interactions will determine CH4 sorption in MMT pores, and the adsorption mainly occurs near the MMT wall. This is because the dispersive interactions are short-ranged. The density of the CH4 in the pores is not uniform, and the density profiles show the obvious layer near the pore walls due to the walls’ effect, as well as a platform region around the center. Under the given temperatures, higher temperature leads to a lower total loading of CH4, suggesting that higher temperature will reduce CH4 loading at the same pressures. The preloaded water will reduce CH4 sorption, as CH4 molecules do not spread within water molecules because CH4 is hydrophobic. MD simulations have been utilized as an effective route to understand the diffusion behavior of a system at a molecular level. We found the self-diffusion coefficient increases rapidly with increases in the pore size. Under these given conditions, the effect of temperature has little influence on the in-plane self-diffusion coefficient. Similar results were obtained in the clay mineral with cation exchange, which will reduce CH4 adsorption under the same pressure and temperature conditions.

Supplementary Files

Supplementary File 1

Acknowledgement

We would like to express appreciation to the following financial support: the National Natural Science Foundation of China (No. 51304232, 51490654, 51234007), the Major Programs of Ministry of Education of China (No. 311009), Program for Changjiang Scholars and Innovative Research Team in University (IRT1294) and China Postdoctoral Science Foundation (No. 2015M580621).

Author Contributions

Calculations were carried out by Hongguang Sui. The bulk of the manuscript writing was done by Hongguang Sui, with significant contributions of Jun Yao and Lei Zhang. All the authors have contributed to the data analysis and preparation of the manuscript.

Conflicts of Interest

The authors declare no conflict of interest.

References

  1. Howarth, R.W.; Ingraffea, A.; Engelder, T. Natural gas: Should fracking stop? Nature 2011, 477, 271–275. [Google Scholar] [CrossRef] [PubMed]
  2. Hughes, J.D. Energy: A reality check on the shale revolution. Nature 2013, 494, 307–308. [Google Scholar] [CrossRef] [PubMed]
  3. McGlade, C.; Speirs, J.; Sorrell, S. Unconventional gas—A review of regional and global resource estimates. Energy 2013, 55, 571–584. [Google Scholar] [CrossRef]
  4. Gouth, F.; Collell, J.; Galliero, G.; Wang, J. Molecular Simulation to Determine Key Shale Gas Parameters, and Their Use in a Commercial Simulator for Production Forecasting; Society of Petroleum Engineers: Richardson, TX, USA, 2013. [Google Scholar]
  5. Chen, S.; Zhu, Y.; Wang, H.; Liu, H.; Wei, W.; Fang, J. Shale gas reservoir characterisation: A typical case in the southern sichuan basin of china. Energy 2011, 36, 6609–6616. [Google Scholar] [CrossRef]
  6. Bustin, A.M.M.; Bustin, R.M. Importance of rock properties on the producibility of gas shales. Int. J. Coal Geol. 2012, 103, 132–147. [Google Scholar] [CrossRef]
  7. Zhang, T.; Ellis, G.S.; Ruppel, S.C.; Milliken, K.; Yang, R. Effect of organic-matter type and thermal maturity on methane adsorption in shale-gas systems. Org. Geochem. 2012, 47, 120–131. [Google Scholar] [CrossRef]
  8. Sondergeld, C.H.; Ambrose, R.J.; Rai, C.S.; Moncrieff, J. Micro-Structural Studies of Gas Shales; Society of Petroleum Engineers: Richardson, TX, USA, 2010. [Google Scholar]
  9. Ross, D.J.K.; Marc Bustin, R. The importance of shale composition and pore structure upon gas storage potential of shale gas reservoirs. Mar. Pet. Geol. 2009, 26, 916–927. [Google Scholar] [CrossRef]
  10. Ross, D.J.; Bustin, R.M. Characterizing the shale gas resource potential of devonian–mississippian strata in the western canada sedimentary basin: Application of an integrated formation evaluation. AAPG Bull. 2008, 92, 87–125. [Google Scholar] [CrossRef]
  11. Weniger, P.; Kalkreuth, W.; Busch, A.; Krooss, B.M. High-pressure methane and carbon dioxide sorption on coal and shale samples from the paraná basin, Brazil. Int. J. Coal Geol. 2010, 84, 190–205. [Google Scholar] [CrossRef]
  12. Ji, L.; Zhang, T.; Milliken, K.L.; Qu, J.; Zhang, X. Experimental investigation of main controls to methane adsorption in clay-rich rocks. Appl. Geochem. 2012, 27, 2533–2545. [Google Scholar] [CrossRef]
  13. Wang, C.C.; Juang, L.C.; Lee, C.K.; Hsu, T.C.; Lee, J.F.; Chao, H.P. Effects of exchanged surfactant cations on the pore structure and adsorption characteristics of montmorillonite. J. Colloid Interface Sci. 2004, 280, 27–35. [Google Scholar] [CrossRef] [PubMed]
  14. Aringhieri, R. Nanoporosity characteristics of some natural clay minerals and soils. Clays Clay Miner. 2004, 52, 700–704. [Google Scholar] [CrossRef]
  15. Volzone, C.; Thompson, J.G.; Melnitchenko, A.; Ortiga, J.; Palethorpe, S.R. Selective gas adsorption by amorphous clay-mineral derivatives. Clays Clay Miner. 1999, 47, 647–657. [Google Scholar] [CrossRef]
  16. Lu, X.C.; Li, F.C.; Watson, A.T. Adsorption studies of natural gas storage in devonian shales. SPE Form. Evaluation 1995, 10, 109–113. [Google Scholar] [CrossRef]
  17. Schettler, P., Jr.; Parmely, C. Contributions to total storage capacity in devonian shales. In Proceedings of the SPE Eastern Regional Meeting, Lexington, KY, USA, 22–25 October 1991; Society of Petroleum Engineers: Richardson, TX, USA, 1991. [Google Scholar]
  18. Busch, A.; Alles, S.; Gensterblum, Y.; Prinz, D.; Dewhurst, D.N.; Raven, M.D.; Stanjek, H.; Krooss, B.M. Carbon dioxide storage potential of shales. Int. J. Greenh. Gas Control 2008, 2, 297–308. [Google Scholar] [CrossRef]
  19. Cheng, A.L.; Huang, W.L. Selective adsorption of hydrocarbon gases on clays and organic matter. Org. Geochem. 2004, 35, 413–423. [Google Scholar] [CrossRef]
  20. Jin, Z.; Firoozabadi, A. Methane and carbon dioxide adsorption in clay-like slit pores by monte carlo simulations. Fluid Phase Equilibria 2013, 360, 456–465. [Google Scholar] [CrossRef]
  21. Jin, Z.; Firoozabadi, A. Effect of water on methane and carbon dioxide sorption in clay minerals by monte carlo simulations. Fluid Phase Equilibria 2014, 382, 10–20. [Google Scholar] [CrossRef]
  22. Fathi, E.; Akkutlu, I.Y. Nonlinear Sorption Kinetics and Surface Diffusion Effects on Gas Transport in Low-Permeability Formations; Society of Petroleum Engineers: Richardson, TX, USA, 2009. [Google Scholar]
  23. Darabi, H.; Ettehad, A.; Javadpour, F.; Sepehrnoori, K. Gas flow in ultra-tight shale strata. J. Fluid Mech. 2012, 710, 641–658. [Google Scholar] [CrossRef]
  24. Krishna, R.; Wesselingh, J.A. The maxwell-stefan approach to mass transfer. Chem. Eng. Sci. 1997, 52, 861–911. [Google Scholar] [CrossRef]
  25. Yuan, W.; Pan, Z.; Li, X.; Yang, Y.; Zhao, C.; Connell, L.D.; Li, S.; He, J. Experimental study and modelling of methane adsorption and diffusion in shale. Fuel 2014, 117, 509–519. [Google Scholar] [CrossRef]
  26. Cracknell, R.F.; Nicholson, D.; Gubbins, K.E. Molecular dynamics study of the self-diffusion of supercritical methane in slit-shaped graphitic micropores. J. Chem. Soc. Faraday Trans. 1995, 91, 1377–1383. [Google Scholar] [CrossRef]
  27. Yang, X.; Zhang, C. Structure and diffusion behavior of dense carbon dioxide fluid in clay-like slit pores by molecular dynamics simulation. Chem. Phys. Lett. 2005, 407, 427–432. [Google Scholar] [CrossRef]
  28. Botan, A.; Rotenberg, B.; Marry, V.; Turq, P.; Noetinger, B. Carbon dioxide in montmorillonite clay hydrates: Thermodynamics, structure, and transport from molecular simulation. J. Phys. Chem. C 2010, 114, 14962–14969. [Google Scholar] [CrossRef]
  29. Sharma, A.; Namsani, S.; Singh, J.K. Molecular simulation of shale gas adsorption and diffusion in inorganic nanopores. Mol. Simul. 2015, 41, 414–422. [Google Scholar] [CrossRef]
  30. Lu, X.C.; Li, F.C.; Watson, A.T. Adsorption measurements in devonian shales. Fuel 1995, 74, 599–603. [Google Scholar] [CrossRef]
  31. Gasparik, M.; Ghanizadeh, A.; Bertier, P.; Gensterblum, Y.; Bouw, S.; Krooss, B.M. High-pressure methane sorption isotherms of black shales from the netherlands. Energy Fuels 2012, 26, 4995–5004. [Google Scholar] [CrossRef]
  32. Ambrose, R.J.; Hartman, R.C.; Diaz-Campos, M.; Akkutlu, I.Y.; Sondergeld, C.H. Shale gas-in-place calculations part i: New pore-scale considerations. SPE J. 2012, 17, 219–229. [Google Scholar] [CrossRef]
  33. Chávez-Páez, M.; van Workum, K.; de Pablo, L.; de Pablo, J.J. Monte carlo simulations of wyoming sodium montmorillonite hydrates. J. Chem. Phys. 2001, 114, 1405–1413. [Google Scholar] [CrossRef]
  34. Skipper, N.; Chang, F.R.C.; Sposito, G. Monte carlo simulation of interlayer molecular structure in swelling clay minerals. I: Methodology. Clays Clay Miner. 1995, 43, 285–293. [Google Scholar] [CrossRef]
  35. Cygan, R.T.; Romanov, V.N.; Myshakin, E.M. Molecular simulation of carbon dioxide capture by montmorillonite using an accurate and flexible force field. J. Phys. Chem. C 2012, 116, 13079–13091. [Google Scholar] [CrossRef]
  36. Sun, H. COMPASS: An ab initio force-field optimized for condensed-phase applications overview with details on alkane and benzene compounds. J. Phys. Chem. B 1998, 102, 7338–7364. [Google Scholar] [CrossRef]
  37. Smirnov, K.S.; Bougeard, D. A Molecular dynamics study of structure and short-time dynamics of water in kaolinite. J. Phys. Chem. B 1999, 103, 5266–5273. [Google Scholar] [CrossRef]
  38. Cygan, R.T.; Liang, J.J.; Kalinichev, A.G. Molecular models of hydroxide, oxyhydroxide, and clay phases and the development of a general force field. J. Phys. Chem. B 2004, 108, 1255–1266. [Google Scholar] [CrossRef]
  39. Reid, R.C.; Prausnitz, J.M.; Poling, B.E. The Properties of Gases and Liquids; McGraw-Hill Book Company: New York, NY, USA, 1987. [Google Scholar]
  40. Brunauer, S.; Deming, L.S.; Deming, W.E.; Teller, E. On a theory of the van der waals adsorption of gases. J. Am. Chem. Soc. 1940, 62, 1723–1732. [Google Scholar] [CrossRef]

