Article

Contact Angle Effects on Pore and Corner Arc Menisci in Polygonal Capillary Tubes Studied with the Pseudopotential Multiphase Lattice Boltzmann Model

1
Laboratory of Multiscale Studies in Building Physics, EMPA (Swiss Federal Laboratories for Materials Science and Technology), Dübendorf 8600, Switzerland
2
Chair of Building Physics, ETH Zürich (Swiss Federal Institute of Technology in Zürich), Zürich 8093, Switzerland
3
Earth and Environment Sciences Division (EES-16), Los Alamos National Laboratory, Los Alamos, NM 87545, USA
4
Key Laboratory of Thermo-Fluid Science and Engineering of MOE, School of Energy and Power Engineering, Xi’an Jiaotong University, Xi’an 710049, China
*
Author to whom correspondence should be addressed.
Submission received: 30 November 2015 / Revised: 9 February 2016 / Accepted: 12 February 2016 / Published: 20 February 2016
(This article belongs to the Special Issue Advances in Modeling Flow and Transport in Porous Media)

Abstract

:
In porous media, pore geometry and wettability are determinant factors for capillary flow in drainage or imbibition. Pores are often considered as cylindrical tubes in analytical or computational studies. Such simplification prevents the capture of phenomena occurring in pore corners. Considering the corners of pores is crucial to realistically study capillary flow and to accurately estimate liquid distribution, degree of saturation and dynamic liquid behavior in pores and in porous media. In this study, capillary flow in polygonal tubes is studied with the Shan-Chen pseudopotential multiphase lattice Boltzmann model (LBM). The LB model is first validated through a contact angle test and a capillary intrusion test. Then capillary rise in square and triangular tubes is simulated and the pore meniscus height is investigated as a function of contact angle θ. Also, the occurrence of fluid in the tube corners, referred to as corner arc menisci, is studied in terms of curvature versus degree of saturation. In polygonal capillary tubes, the number of sides leads to a critical contact angle θc which is known as a key parameter for the existence of the two configurations. LBM succeeds in simulating the formation of a pore meniscus at θ > θc or the occurrence of corner arc menisci at θ < θc. The curvature of corner arc menisci is known to decrease with increasing saturation and decreasing contact angle as described by the Mayer and Stoewe-Princen (MS-P) theory. We obtain simulation results that are in good qualitative and quantitative agreement with the analytical solutions in terms of height of pore meniscus versus contact angle and curvature of corner arc menisci versus saturation degree. LBM is a suitable and promising tool for a better understanding of the complicated phenomena of multiphase flow in porous media.

1. Introduction

Capillary flow is a common phenomenon of multiphase flow in porous media with various applications, such as in the built environment, textile dyeing industry, oil recovery and ink printing. Although capillary flow is ubiquitous and has been studied theoretically and experimentally for a long time, the determination of vapor/liquid interface configurations in complex porous media remains a challenging problem. Those configurations depend on the pore geometry and connectivity, the liquid properties and the surface wettability. Previous work often assumed simple pore geometry, modeling pores as cylindrical tubes or parallel plates. Such simplifications prevent capturing significant unsaturated phenomena such as corner flow. Therefore, to estimate liquid distributions in porous media accurately and more realistically, corner flow at the edges of pores also has to be taken into account. A common method to experimentally study capillary flow in complex pores is the use of n-sided regular polygonal tubes resulting in different cross-section geometries, such as triangle, square, hexagon, etc. In a n-sided, partially filled polygonal tube, the liquid surface forms a hemisphere, the configuration of which depends on the wetting or contact angle between the liquid and the solid material, as shown in Figure 1. Concus and Finn [1] identified the existence of a critical contact angle, θc = π/n, in n-sided polygonal tubes based on the Rayleigh-Taylor interface instability. When the contact angle θ is between π/2 and the critical contact angle, i.e., θc (= π/n) ≤ θ <π/2, the liquid wets the tube walls and the liquid meniscus spans the total tube, resulting in a configuration named the pore meniscus. In contrast, if the contact angle is smaller than the critical contact angle, i.e., θ < θc (= π/n), in addition to the pore meniscus, the liquid also invades the edges or corners of the polygonal tube, forming corner arc menisci [1,2]. Corner arc menisci occur at each corner and move upward as a result of a capillary pressure gradient [3,4].
Princen proposed a model for capillary rise in triangular and square tubes for a zero contact angle [5,6]. The Princen model predicts the total mass of liquid W in a square tube from the balance between capillary force and gravity considering both the liquid column under the pore meniscus and the liquid columns in the corner arc menisci of infinite height.
W = ρ g h L 2 + 4 ρ g h ( 1 π / 4 ) r a r c 2 ( z ) d z
where ρ is the fluid density, g is the gravitational acceleration, h is the height of the liquid column under the pore meniscus, L is the size of the side of the rectangular polygon, z is the coordinate along the height and rarc is the radius of curvature of the corner arc meniscus. In this equation, full wetting conditions with contact angle θ = 0° are assumed. The Mayer and Stowe-Princen (MS-P) model [5,6,7,8] predicts the curvature radius of the arc meniscus as a function of the effective area and perimeter of the non-wetting phase (gas), resulting in a better estimation of the interfacial area as shown by [9] using experimental data. Ma et al. [10] investigated capillary flow in polygonal tubes during imbibition and drainage and suggested a relationship between liquid saturation and the curvature of arc menisci in corners based on the MS-P model. In recent work, Feng and Rothstein [11] studied the pore meniscus height as a function of the contact angle for polygonal capillary tubes for contact angles higher than the critical contact angle. Furthermore, they considered different geometries with either sharped or rounded corners, showing the effect of rounded corners and contact angle on meniscus height, and compared their simulation results using Surface Evolver, which is an open-source code for surface energy minimization.
In computational fluid dynamics (CFD) studies, multiphase flow has often been studied by either the Volume of Fluid (VOF) [12] or level set [13] methods to capture or track the interface. When these methods are applied on complex geometries or small-scale problems, significant mass conservation problems arise near the interface and more complicated algorithms have been required [14,15].
The lattice Boltzmann method (LBM), which is based on microscopic models and mesoscopic equations, is a powerful technique for simulating multiphase flow involving interfacial dynamics and complex geometries, especially in porous media [16,17,18]. Several LB models have been developed for multiphase flow simulation including the color gradient-based LB method by Gunstensen et al. [19], the free-energy model by Swift et al. [20], the mean-field model by He et al. [21] and the pseudopotential model by Shan and Chen [22,23]. The pseudopotential model is the most popular LB multiphase model due to its simplicity and versatility. This model represents microscopic molecular interactions at mesoscopic scale using a pseudopotential depending on the local density [22,23]. With such interactions, a single component fluid spontaneously segregates into high and low density phases (e.g., liquid and gas), when the interaction strength (or the temperature) is below the critical point [22,23]. The automatic phase separation is an attractive characteristic of the pseudopotential model, as the phase interface is no longer a mathematical boundary and no explicit interface tracking or interface capturing technique is needed. The location of the phase interface is characterized through monitoring of the shift (jump) of the fluid density from gas to liquid. The pseudopotential model captures the essential elements of fluid behavior, namely it follows a non-ideal equation of state (EOS) and incorporates a surface tension force. Due to its remarkable computational efficiency and clear representation of the underlying microscopic physics, this model has been used as an efficient technique for simulating and investigating multiphase flow problems, particularly for these flows with complex topological changes of the interface, such as deformation, coalescence and breakup of the fluid phase, or fluid flow in complex geometries [24]. Recently, Chen et al. [25] thoroughly reviewed the theory and application of the pseudopential model and we refer to their publication for more details.
Capillary flow has been studied effectively using the Shan-Chen pseudopotential LB model. Sukop and Thorne [26] performed a two-dimensional capillary rise simulation using the pseudopotential LBM and compared their results with the theoretical capillary rise equation, i.e., the balance between a pressure differential from the Young-Laplace equation and the gravitational force. Raiskinmaki et al. [26,27] investigated capillary rise in a three-dimensional cylindrical tube using multiphase LBM. The effects of contact angle, tube radius and capillary number were studied with or without taking into account gravity. Their study provided a useful benchmark for other LBM studies of capillary rise by comparing it with the Washburn solution. Although previous studies showed interesting LBM works in capillary flow, such as [28,29], only the interface of the capillary column, i.e., the meniscus in cylindrical tubes or between two parallel plates, has been investigated without considering other phenomena such as corner flow.
In the present study, capillary flow in three-dimensional polygonal tubes with varying contact angle is investigated using the Shan-Chen pseudopotential LB model. The height of the pore meniscus and the radius of the corner arc meniscus are studied for different contact angles, and the latter results are compared with the theoretical values derived from the MS-P model. Given that the characteristic length used here is below capillary length, surface tension effects are more dominant and gravitational effects can be neglected. Also, contact angle hysteresis is not accounted for.
The paper is organized as follows: in Section 2, we briefly describe the pseudopotential multiphase LB model with the Carnahan-Starling (C-S) EOS and forcing scheme; in Section 3, a validation test is presented; the computational set-up and the boundary conditions used in the LB simulations are presented in Section 4; the capillary rise simulation results are compared with analytical solutions in Section 5; we draw conclusions in Section 6.

2. Numerical Model

A three-dimensional, single component, two-phase LB model is implemented for solving capillary rise phenomena. The LBM considers flow as a collective behavior of pseudoparticles residing on a mesoscopic level and solves the Boltzmann equation using a small number of velocities adapted to a regular grid in space. Fluid motion is represented by a set of particle distribution functions. The LB equation with the Bhantagar-Gross-Krock (BGK) collision operator is written as:
f i ( x + c e i Δ t , t + Δ t ) f i ( x , t ) = 1 τ [ f i ( x , t ) f i e q ( x , t ) ]
where fi(x,t) is the density distribution function and fieq(x,t) is the equilibrium distribution function in the ith lattice velocity direction, where × denotes the position and t is the time. A relaxation time τ is introduced, which relates to the kinematic viscosity as v = cs2(τ − 0.5)Δt. The lattice sound speed cs is equal to c/ 3 , where the lattice speed c is equal to Δx/Δt, with Δx as the grid spacing and Δt as the time step. In this study, both grid spacing and time step are set equal to 1. The equilibrium distribution function for the D3Q19 lattice model is of the form:
f i e q = w i ρ [ 1 + 3 c 2 ( e i u ) + 9 2 c 4 ( e i u ) 2 3 2 c 2 u 2 ]
For the D3Q19 lattice model [30,31], the lattice weighing factors wi are:
w i = { 12 / 36 , i = 0 ; 2 / 36 , i = 1 , , 6 ; 1 / 36 , i = 7 , , 18 .
where the discrete velocity ei is given by:
e i = { ( 0 , 0 , 0 ) , i = 0 ; ( ± 1 , 0 , 0 ) , ( 0 , ± 1 , 0 ) , ( 0 , 0 , ± 1 ) , i = 1 , , 6 ; ( ± 1 , ± 1 , 0 ) , ( ± 1 , 0 , ± 1 ) , ( 0 , ± 1 , ± 1 ) , i = 7 , , 18 .
The macroscopic parameters, the fluid density ρ, and the fluid velocity u are calculated as:
ρ = i f i
ρ u = i f i e i .
In the Shan-Chen pseudopotential LB model, the forcing scheme, incorporating the interactive forces, greatly affects the numerical accuracy and stability of the simulation. The original Shan-Chen LB model results in an inaccurate prediction of the surface tension, dependent on the chosen density ratio and relaxation time. When combining this model with a proper forcing scheme, the model can give an accurate surface tension prediction independent of the relaxation time and density ratio. In recent studies, different forcing schemes for the Shan-Chen LB model are compared by Li et al. [32] and Huang et al. [33]. Based on these studies, the exact-difference method (EDM) developed by Kupershtokh et al. [34] is considered as the forcing scheme in our study. For a high density ratio with a relaxation range of 0.5 < τ ≤ 1, this method shows better numerical stability [32]. In EDM, a source term Δfi is added into the right term of the equilibrium distribution function in Equation (2) and is defined as:
Δ f i = f i e q ( ρ , u + Δ u ) f i e q ( ρ , u )
The increment of the velocity Δu is defined as:
Δ u = F t o t a l Δ t ρ
where Ftotal equals the sum of the total forces. By averaging the moment force before and after a collision step, the real fluid velocity is calculated as:
u r = u + F t o t a l Δ t 2 ρ
In the single component multiphase LB model, a cohesive force Fm between liquid particles is needed and this force causes phase separation [26]. The force is defined as:
F m = G ψ ( x ) i N ω ( | e i | 2 ) ψ ( x + e i ) e i
According to the interaction values, the discrete velocity is | e i | 2 = 1 at the four nearest neighbors or | e i | 2 = 2 at the next-nearest neighbors. The weight factors ω( | e i | 2 ) have the following values: ω(1) = 1/3 and ω(2) = 1/12. The parameter G reflects the interaction strength and controls the surface tension [22,23,27]. For G < 0, the attraction between particles increases and the force is strong. Thus, the cohesive force of the liquid phase is stronger than the force of the gas phase, leading to surface tension phenomena [26]. The adhesive force Fa between fluid and solid particles is obtained as follows [30]:
F a = w ψ ( x ) i N ω ( | e i | 2 ) s ( x + e i ) e i
where w is an indicator of the wetting behavior and reflects the interactive force between fluid and solid phases, called the solid-fluid interaction parameter. The LB model does not explicitly include the contact angle [29]. By adjusting w, we can obtain different contact angles. The wall density s has a value equal to 0 and 1 for fluid nodes and solid nodes, respectively. In Equations (11) and (12), the effective mass ψ(x) is obtained by choosing an equation of state (EOS) [35]. The EOS describes the relation between the density of the gas and liquid phases for a given pressure and temperature [35,36]. The choice of a suitable EOS is based on different criteria [35,37]. The first criterion is the choice of the maximum density ratio between liquid and gas phases. The second criterion is to avoid the appearance of spurious currents at the interface of different phases. Spurious currents are present in most multiphase models and higher density ratios promote larger spurious currents. The appearance of large spurious currents makes a numerical simulation unstable and leads to divergence. It is important in a LBM with a high density ratio to reduce the appearance of these spurious currents as much as possible. The third criterion relates to the choice of the temperature ratio Tmin/Tc, where Tc is the critical temperature. According to the Maxwell equal area construction rule, T < Tc leads to the coexistence of two phases. At a lower temperature ratio, spurious currents appear and the simulation becomes less stable. The last criterion relates to the agreement between a mechanical stability solution and thermodynamic theory. Choosing a proper EOS model reduces the appearance of spurious currents and leads to a thermodynamically consistent behavior [35]. Recently, Yuan and Schaefer [35] investigated the incorporation of various EOS models in a single component multiphase LB model and, based on their study, we apply the Carnahan-Starling (C-S) EOS. The C-S EOS generates lower spurious currents and applies to wider temperature ratio ranges. The EOS is given below:
p = ρ R T 1 + b ρ / 4 + ( b ρ / 4 ) 2 ( b ρ / 4 ) 3 ( 1 b ρ / 4 ) 3 a ρ 2
where P is the pressure, T is the temperature and R is the ideal gas constant equal to 1 in the LB model. The attraction parameter a = 0.4963(RTc)2/pc is chosen equal to 1 and the repulsion parameter b = 0.1873RTc/pc is chosen equal to 4, with Tc = 0.094 and pc = 0.13044. The effective mass ψ is calculated by:
ψ ( ρ ) = 2 ( p c s 2 ρ ) G c o
Substituting Equation (13) into Equation (14), we get:
ψ = 2 ( ρ R T 1 + b ρ / 4 + ( b ρ / 4 ) 2 ( b ρ / 4 ) 3 ( 1 b ρ / 4 ) 3 a ρ 2 ρ 3 ) G c 0
where c0 equals 1 and G equals –1 to obtain a positive value inside the square root of Equations (14) and (15).

3. Validation and Parametrization

As validation, dynamic capillary rise is studied and compared with the analytical solution. Since the multiphase LB model does not provide an explicit relation for surface tension and contact angle [29], the contact angle as a function of the solid-fluid interaction parameter w is determined.

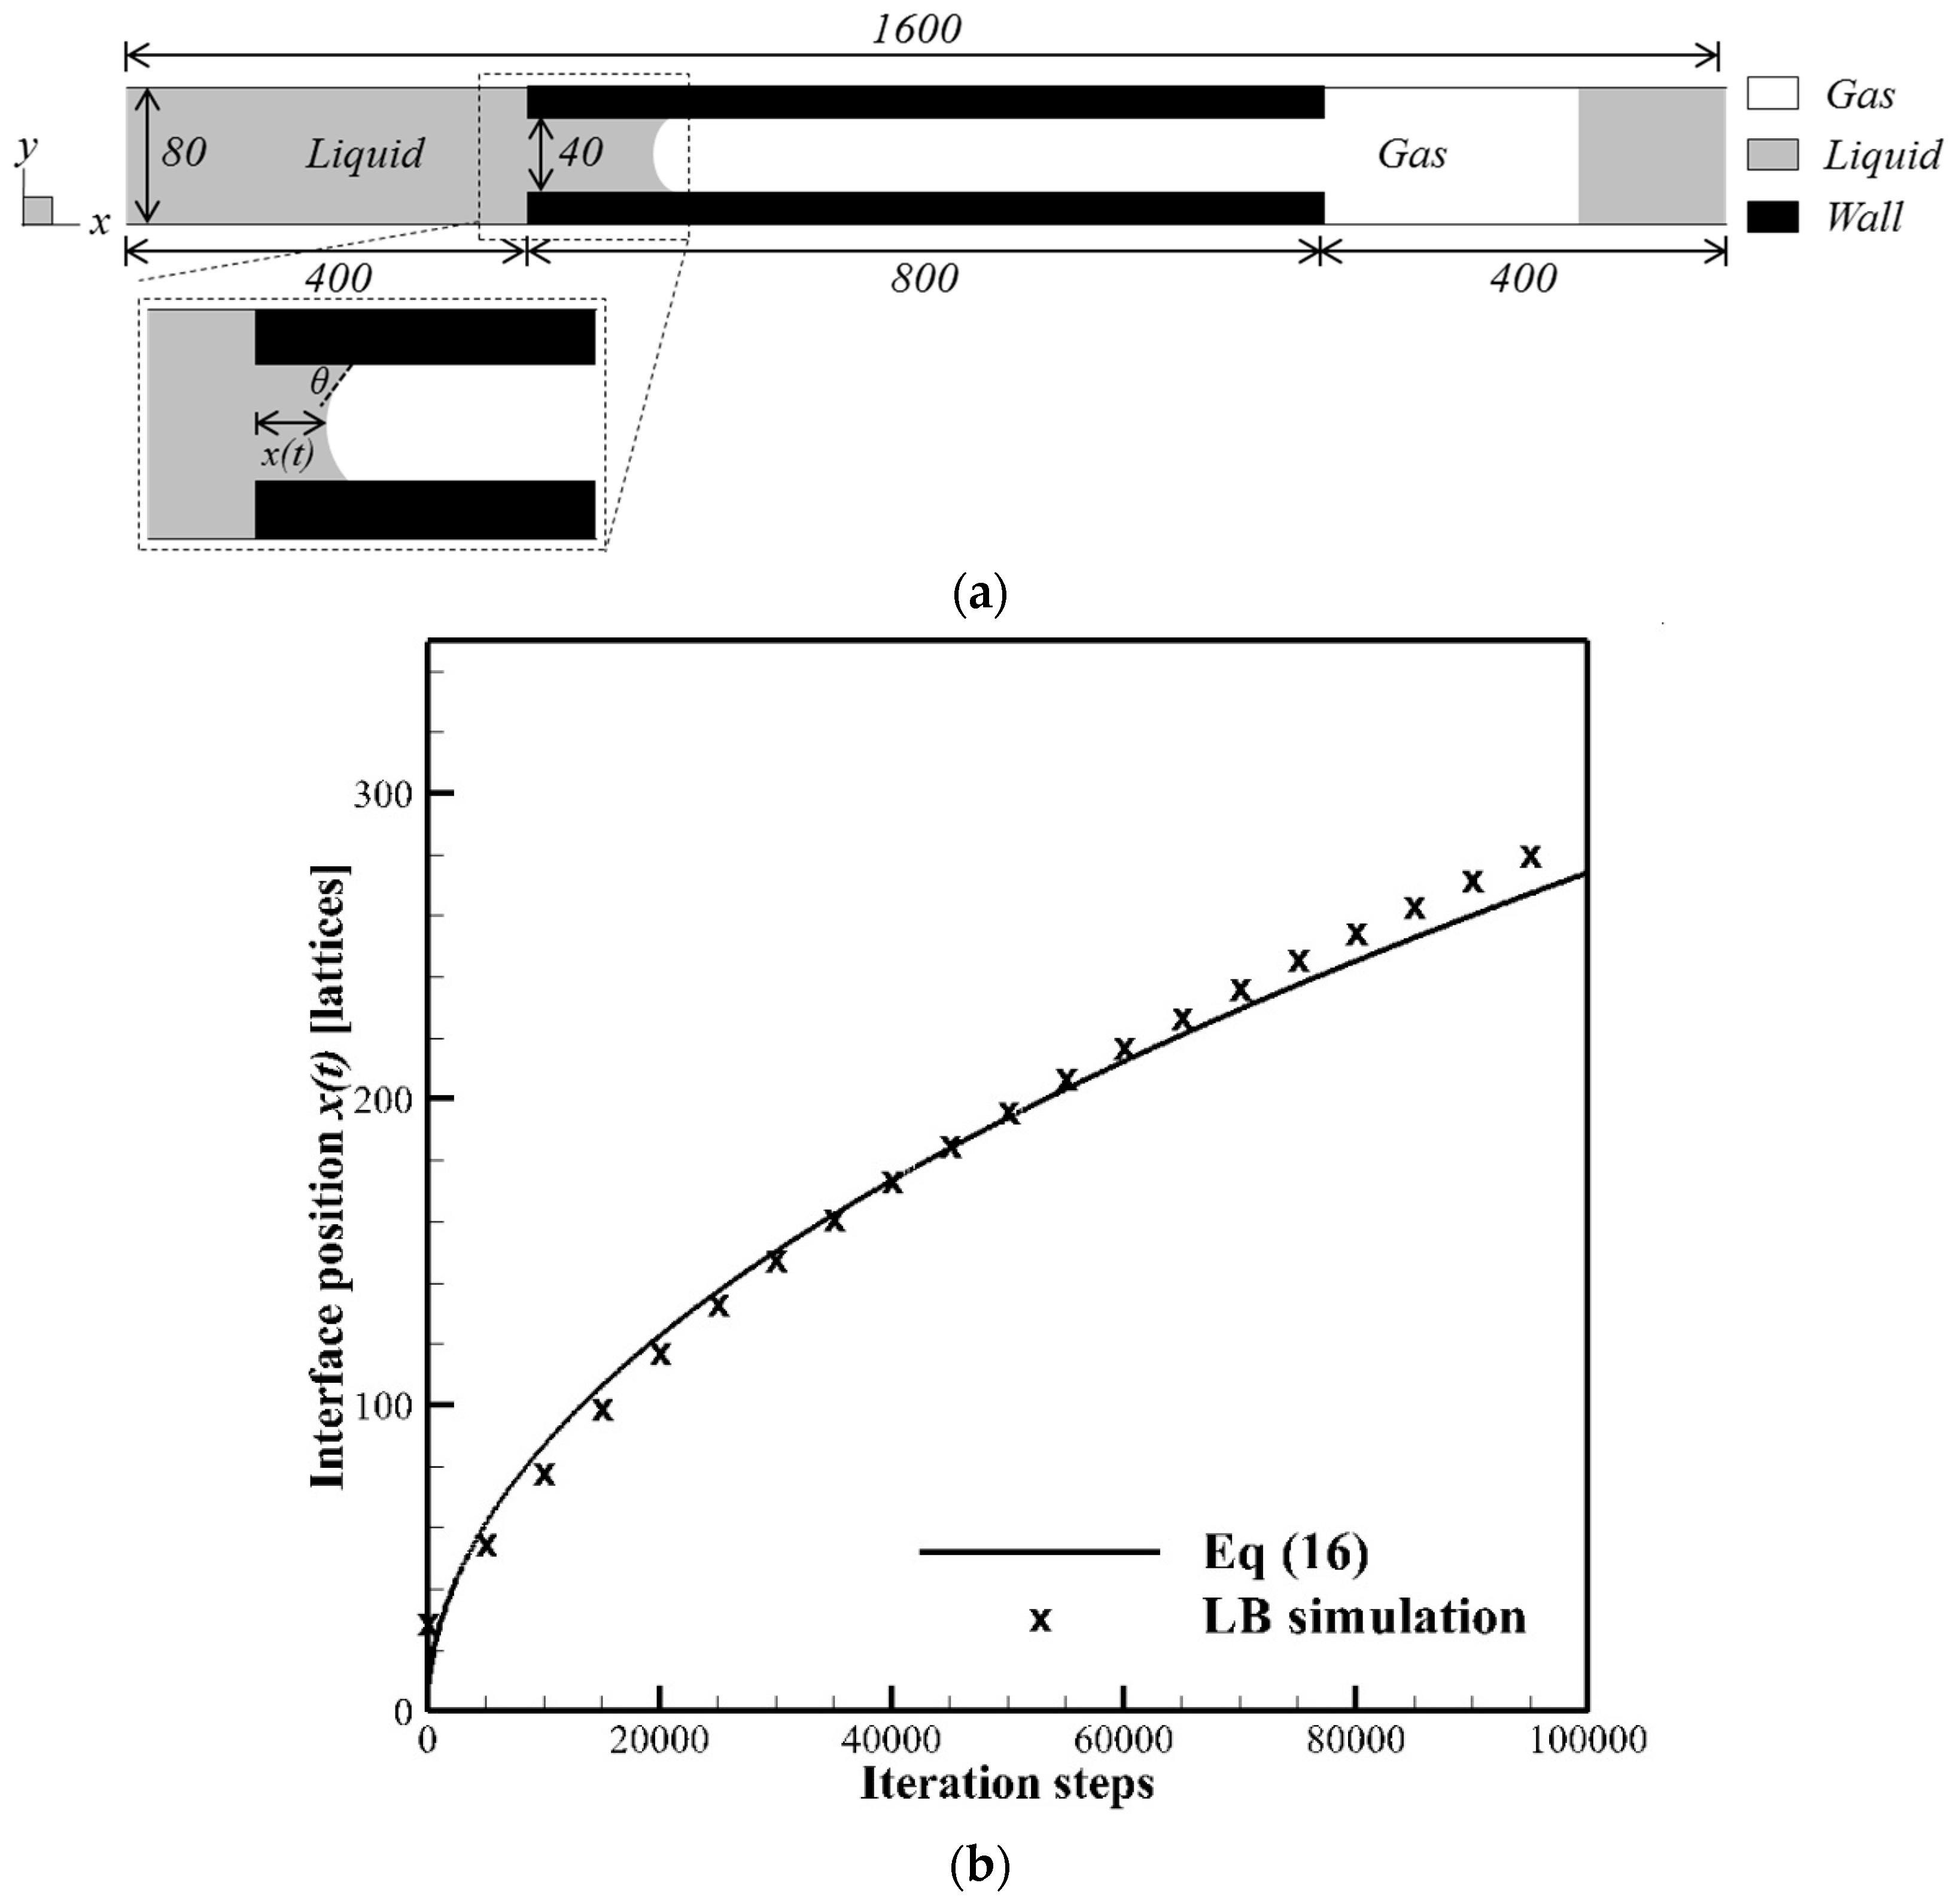
3.1. Dynamic Capillary Intrusion
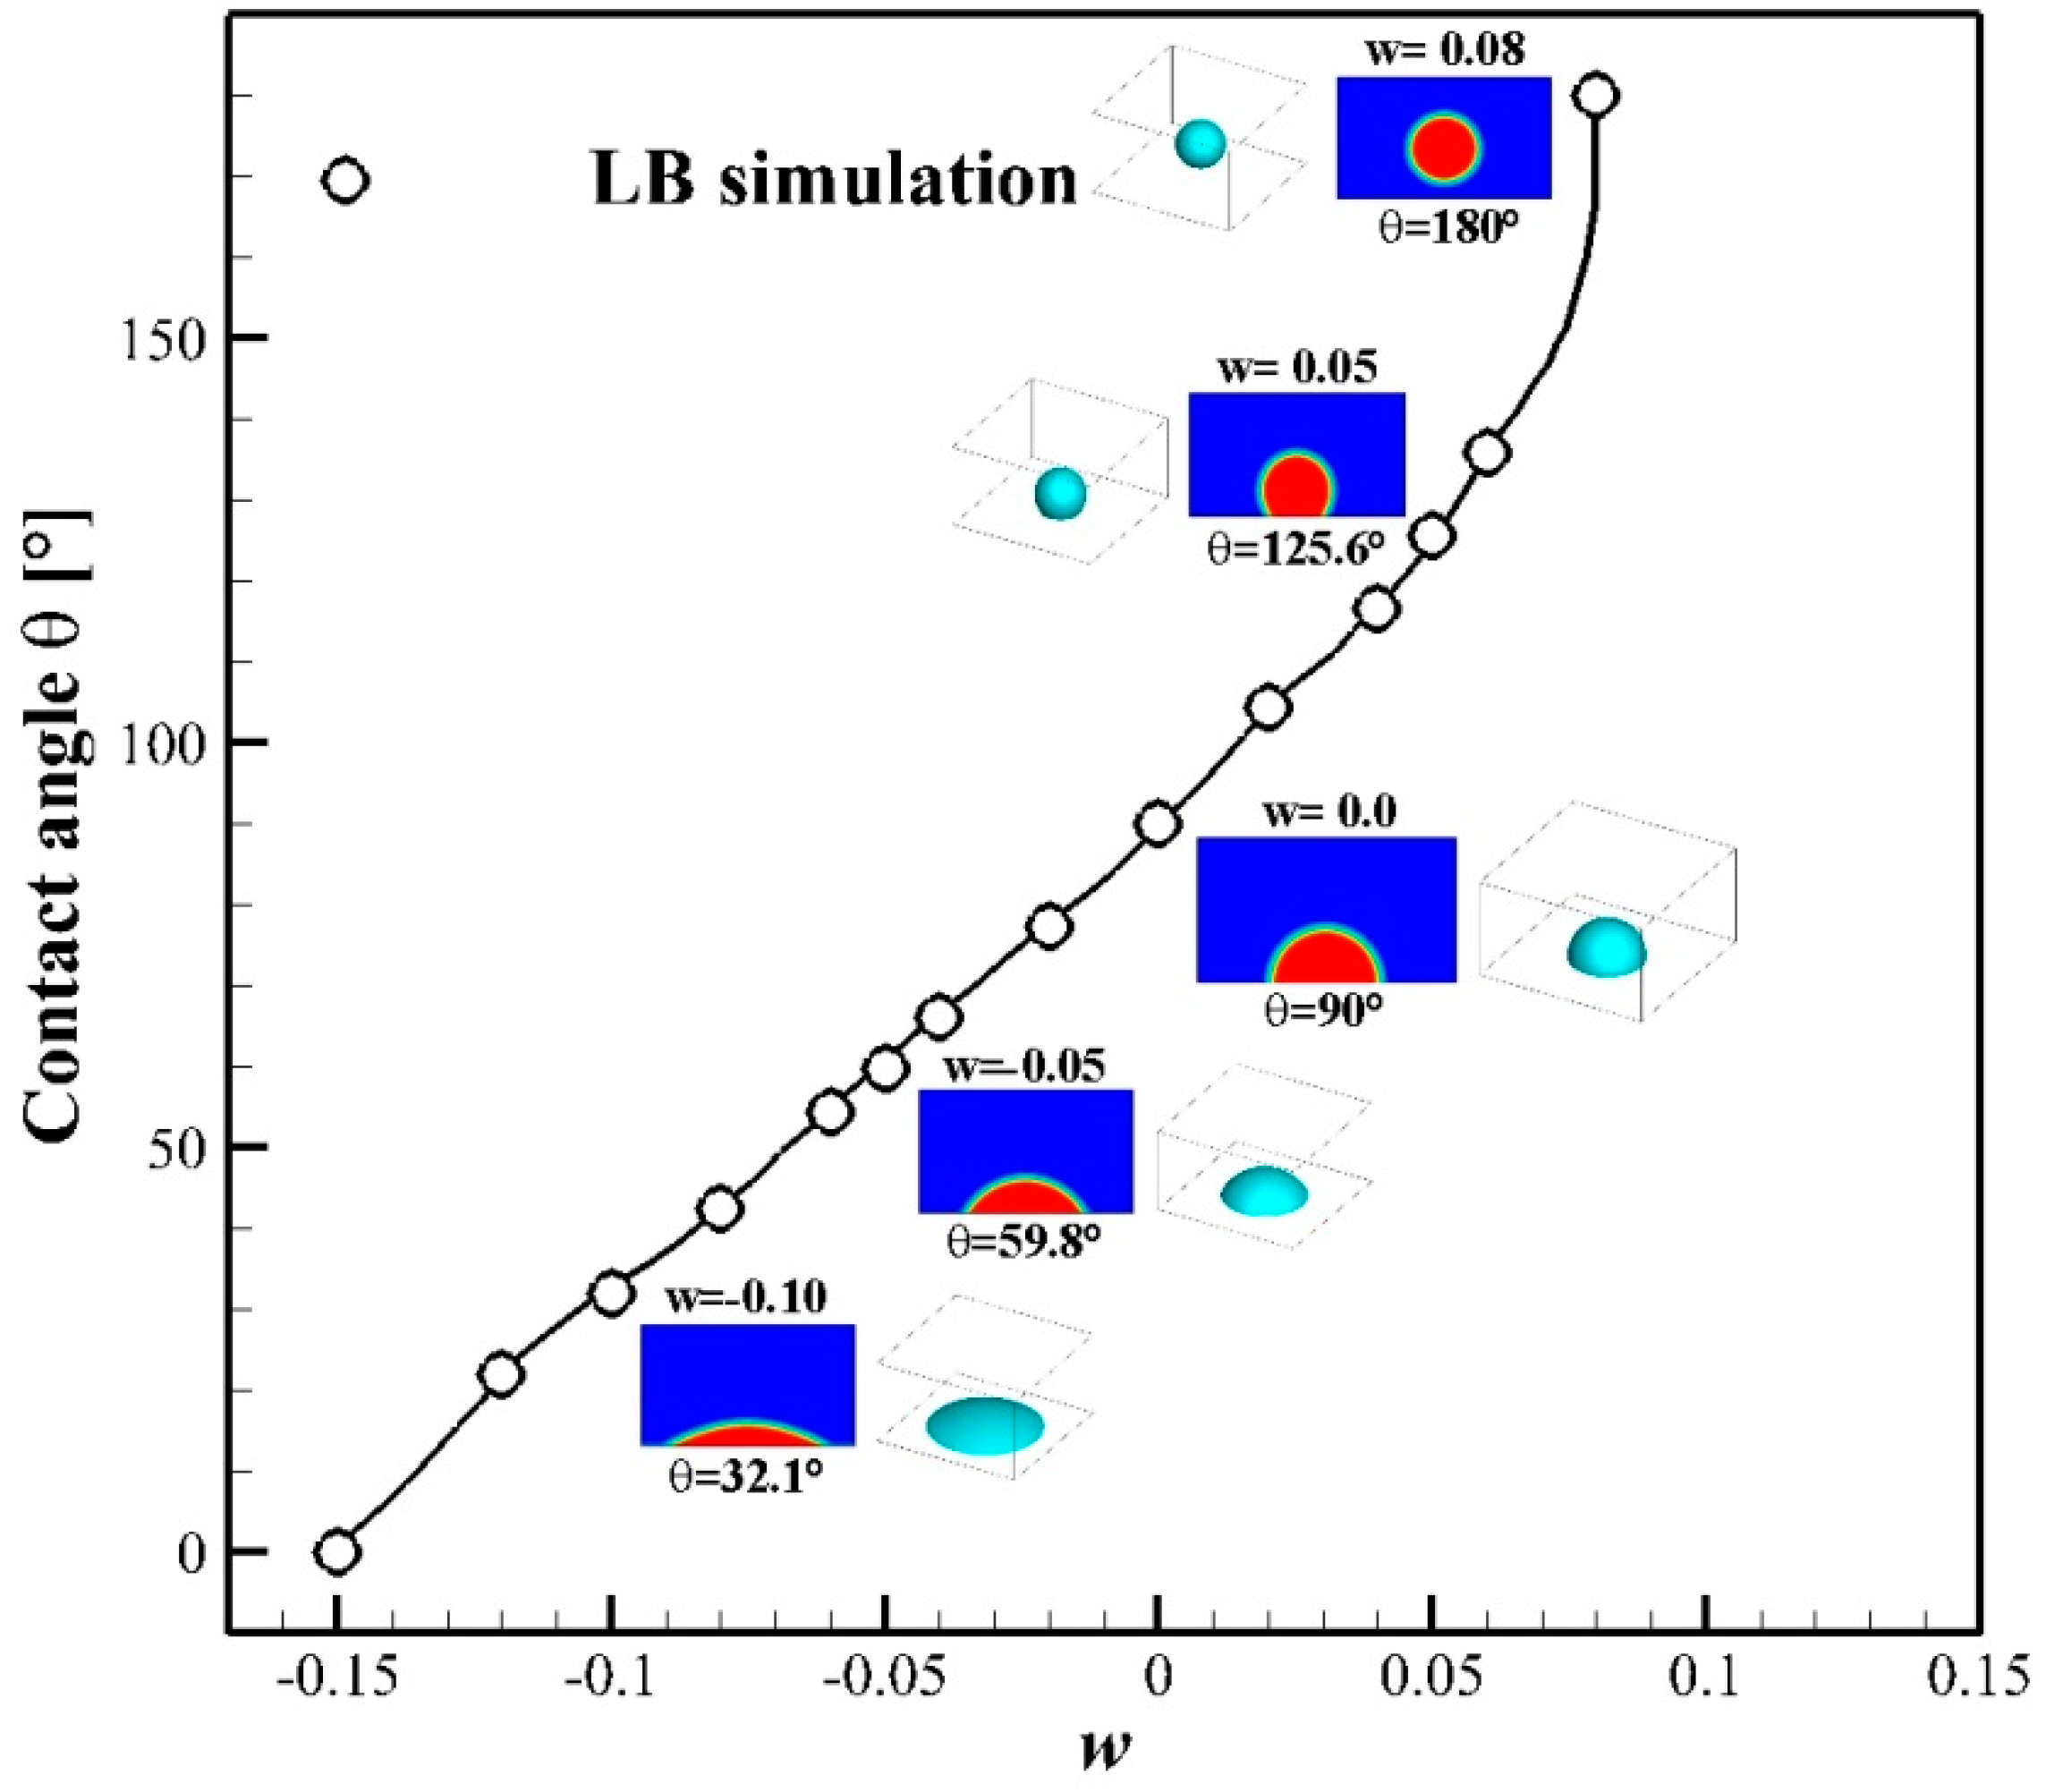
A capillary intrusion test is chosen to assess the capacity of the pseudopotential model to simulate a moving contact line problem governed by capillary forces [38]. The velocity of a liquid intruding two-dimensional parallel plates, shown in Figure 2b, results from the balance between the pressure difference across the phase interface and the viscous force experienced by the intruding liquid. Neglecting the influence of the viscosity of gas, gravity and inertial forces, the force balance results in [39,40]:
σ cos ( θ ) = 6 D μ L x d x d t
where θ is the equilibrium contact angle between liquid and solid, D is the width between plates, μL is the dynamic viscosity of the liquid and × is the position of the interface. The surface tension σ in Equation (16) is determined from the Laplace law describing the pressure difference across the interface of a spherical droplet [41]. The dynamic viscosity is defined as the product of the kinematic viscosity ν and the liquid density, μL = ν × ρ, with ν = 1/6 lattice units. Figure 2a illustrates the two-dimensional computational domain of 1600 × 80 lattices used for the capillary intrusion test. Periodic boundary conditions are imposed on all boundaries of the computational domain. The parallel plates of the capillary are positioned between lattices 400 to 1200 of the domain. The boundaries of the plates are treated as walls and are represented by thick black lines in Figure 2a. They have an equilibrium contact angle of 50°, equivalent to a solid-fluid interaction parameter w = −0.06. The density ratio equals ρ/ρc = 9.4 at T/Tc = 0.85. The time evolution of the interface position as obtained from the LBM shows a good agreement with Equation (16), as shown in Figure 2b. Based on this dynamic capillary intrusion test, we conclude that the Shan-Chen pseudopotential LB model is adequate to simulate capillary-driven flow.

3.2. Contact Angle

The equilibrium contact angle of a liquid droplet on a flat solid surface is studied by changing the solid-fluid interaction parameter w. At negative value, w < 0, the surface is hydrophilic with a contact angle θ < 90° and the droplet spreads on the surface. On the contrary, at w > 0, the solid surface is hydrophobic and a liquid droplet forms a contact angle θ > 90°. A series of simulations are carried out in which an initially three-dimensional hemisphere droplet is placed on a horizontal solid surface. The simulations are performed in a 200 × 200 × 200 lattice domain with the top and bottom boundaries modeled as solid walls and the left, right, front and back boundaries as periodic boundaries. The radius of the liquid droplet is chosen to be 30 lattices at T/Tc = 0.85. After reaching steady state, the contact angle is measured using the method LB-ADSA in Image J [42].
The equilibrium contact angle in the function of w is illustrated by the inserted snapshots of three-dimensional iso-surfaces and cross-sections in Figure 3. With increasing values of the solid-fluid interaction parameter w, the adhesive force decreases and the surface become more and more hydrophobic. Inversely, when w is negative, the surface is hydrophilic and the droplet spreads on the surface. This relation between the solid-fluid interaction parameter and contact angle will be used in the study of pore and corner arc menisci in polygonal tubes.

4. Setup and Boundary Conditions

Two different polygonal tubes are simulated: square (n = 4) and triangular (n = 3). The cross-sections are circumscribed by a circle with a radius of r = 100 lattices for the square tube and a radius of r = 200 lattices for the triangular tube, as shown in Figure 4a,b.
Two cases are considered. The first case is when the contact angle is between π/2 and the critical contact angle θc = π/n (45° for square, 60° for triangular tube) and only a pore meniscus is built. The second case is when the contact angle is smaller than the critical contact angle and both pore and corner arc menisci are formed.
For the square tube, the domain size is 142 × 142 × 300 lattices for the pore meniscus case and 142 × 142 × 500 lattices for the corner arc menisci case. The spatial resolution Δx is 1 µm per lattice. This resolution has been chosen based on a mesh grid sensitivity for the corner arc menisci case, which is presented below in the result section.
For the triangular tube, the regular lattice grid results in a zigzag boundary, at least for two boundaries when the mesh is aligned to one side. This zigzag boundary introduces an artificial roughness, which in combination with the full bounce-back boundary condition produces some mesh-dependent results, as will be shown below. The bounce-back boundary condition represents a no-slip boundary condition with zero velocity at the wall. To improve the quality of the results, two measures are taken in this study. First the spatial resolution is increased: Δx equals 0.5 µm per lattice. As a result, the domain consists of 292 × 290 × 600 lattices for the pore meniscus case and 292 × 290 × 1000 lattices for the corner arc meniscus case. Second, the mesh is turned with an angle of 15° to decrease the side roughness (see Figure 4c). However, even when applying these measures, the corners show some roughness, especially corner 1.
An alternative would be to apply different boundary conditions, such as the curved, the half bounce-back or the moving boundary conditions, as these three methods allow tracking the interface independently from the mesh [43,44], but such investigation was considered out of the scope of this study.
The polygonal tube is initially filled by liquid to a height of 100 lattices from the bottom, as shown in Figure 4a,b. The redistribution of the liquid is then calculated by the LB method. Liquid and gas densities are 0.28 and 0.0299 lattice units, respectively corresponding to a density ratio ρ/ρc = 9.4 at T/Tc = 0.85. Different contact angle ranges are applied. For the square tube, the contact angle ranges from 42.6° to 136.5° as related to a solid-fluid interaction parameter w ranging from −0.08 to 0.06. For the triangular tube, the contact angle ranges from 59.8° to 125.6° as related to a solid-fluid interaction parameter w ranging from −0.05 to 0.05. As shown in Figure 4a,b, bounce-back boundary conditions are imposed on all sides, except for the top 100 lattices on the three or four vertical sides where periodic boundary conditions are imposed to simulate an open capillary tube.
As mentioned above, gravity is neglected given the capillary length, Lcap, defined at standard temperature and pressure to be [11,45]
L c a p = σ ρ g
and equal to 2 mm for water. The characteristic length of our system equals the radius of the circumscribed circle shown in Figure 4a,b, thus 100 and 200 µm, which is smaller than the capillary length. Therefore, surface tension effects are dominant and the gravitational effect can be neglected.
All numerical simulations are run by parallel computing based on MPI (Message Passing Interface) at Los Alamos National Laboratory (LANL) high performance computing cluster. The cluster aggregate performance is 352 TF/s with 102.4 TB of memory for 38,400 cores. Each simulation is run on 120 or 200 processor cores for pore meniscus or corner arc meniscus simulations in square tubes and on 400 or 800 processor cores for pore meniscus or corner arc meniscus simulations in the triangular tubes, and requires 16 h to run 20,000 or 40,000 time steps, respectively.

5. Results and Discussion
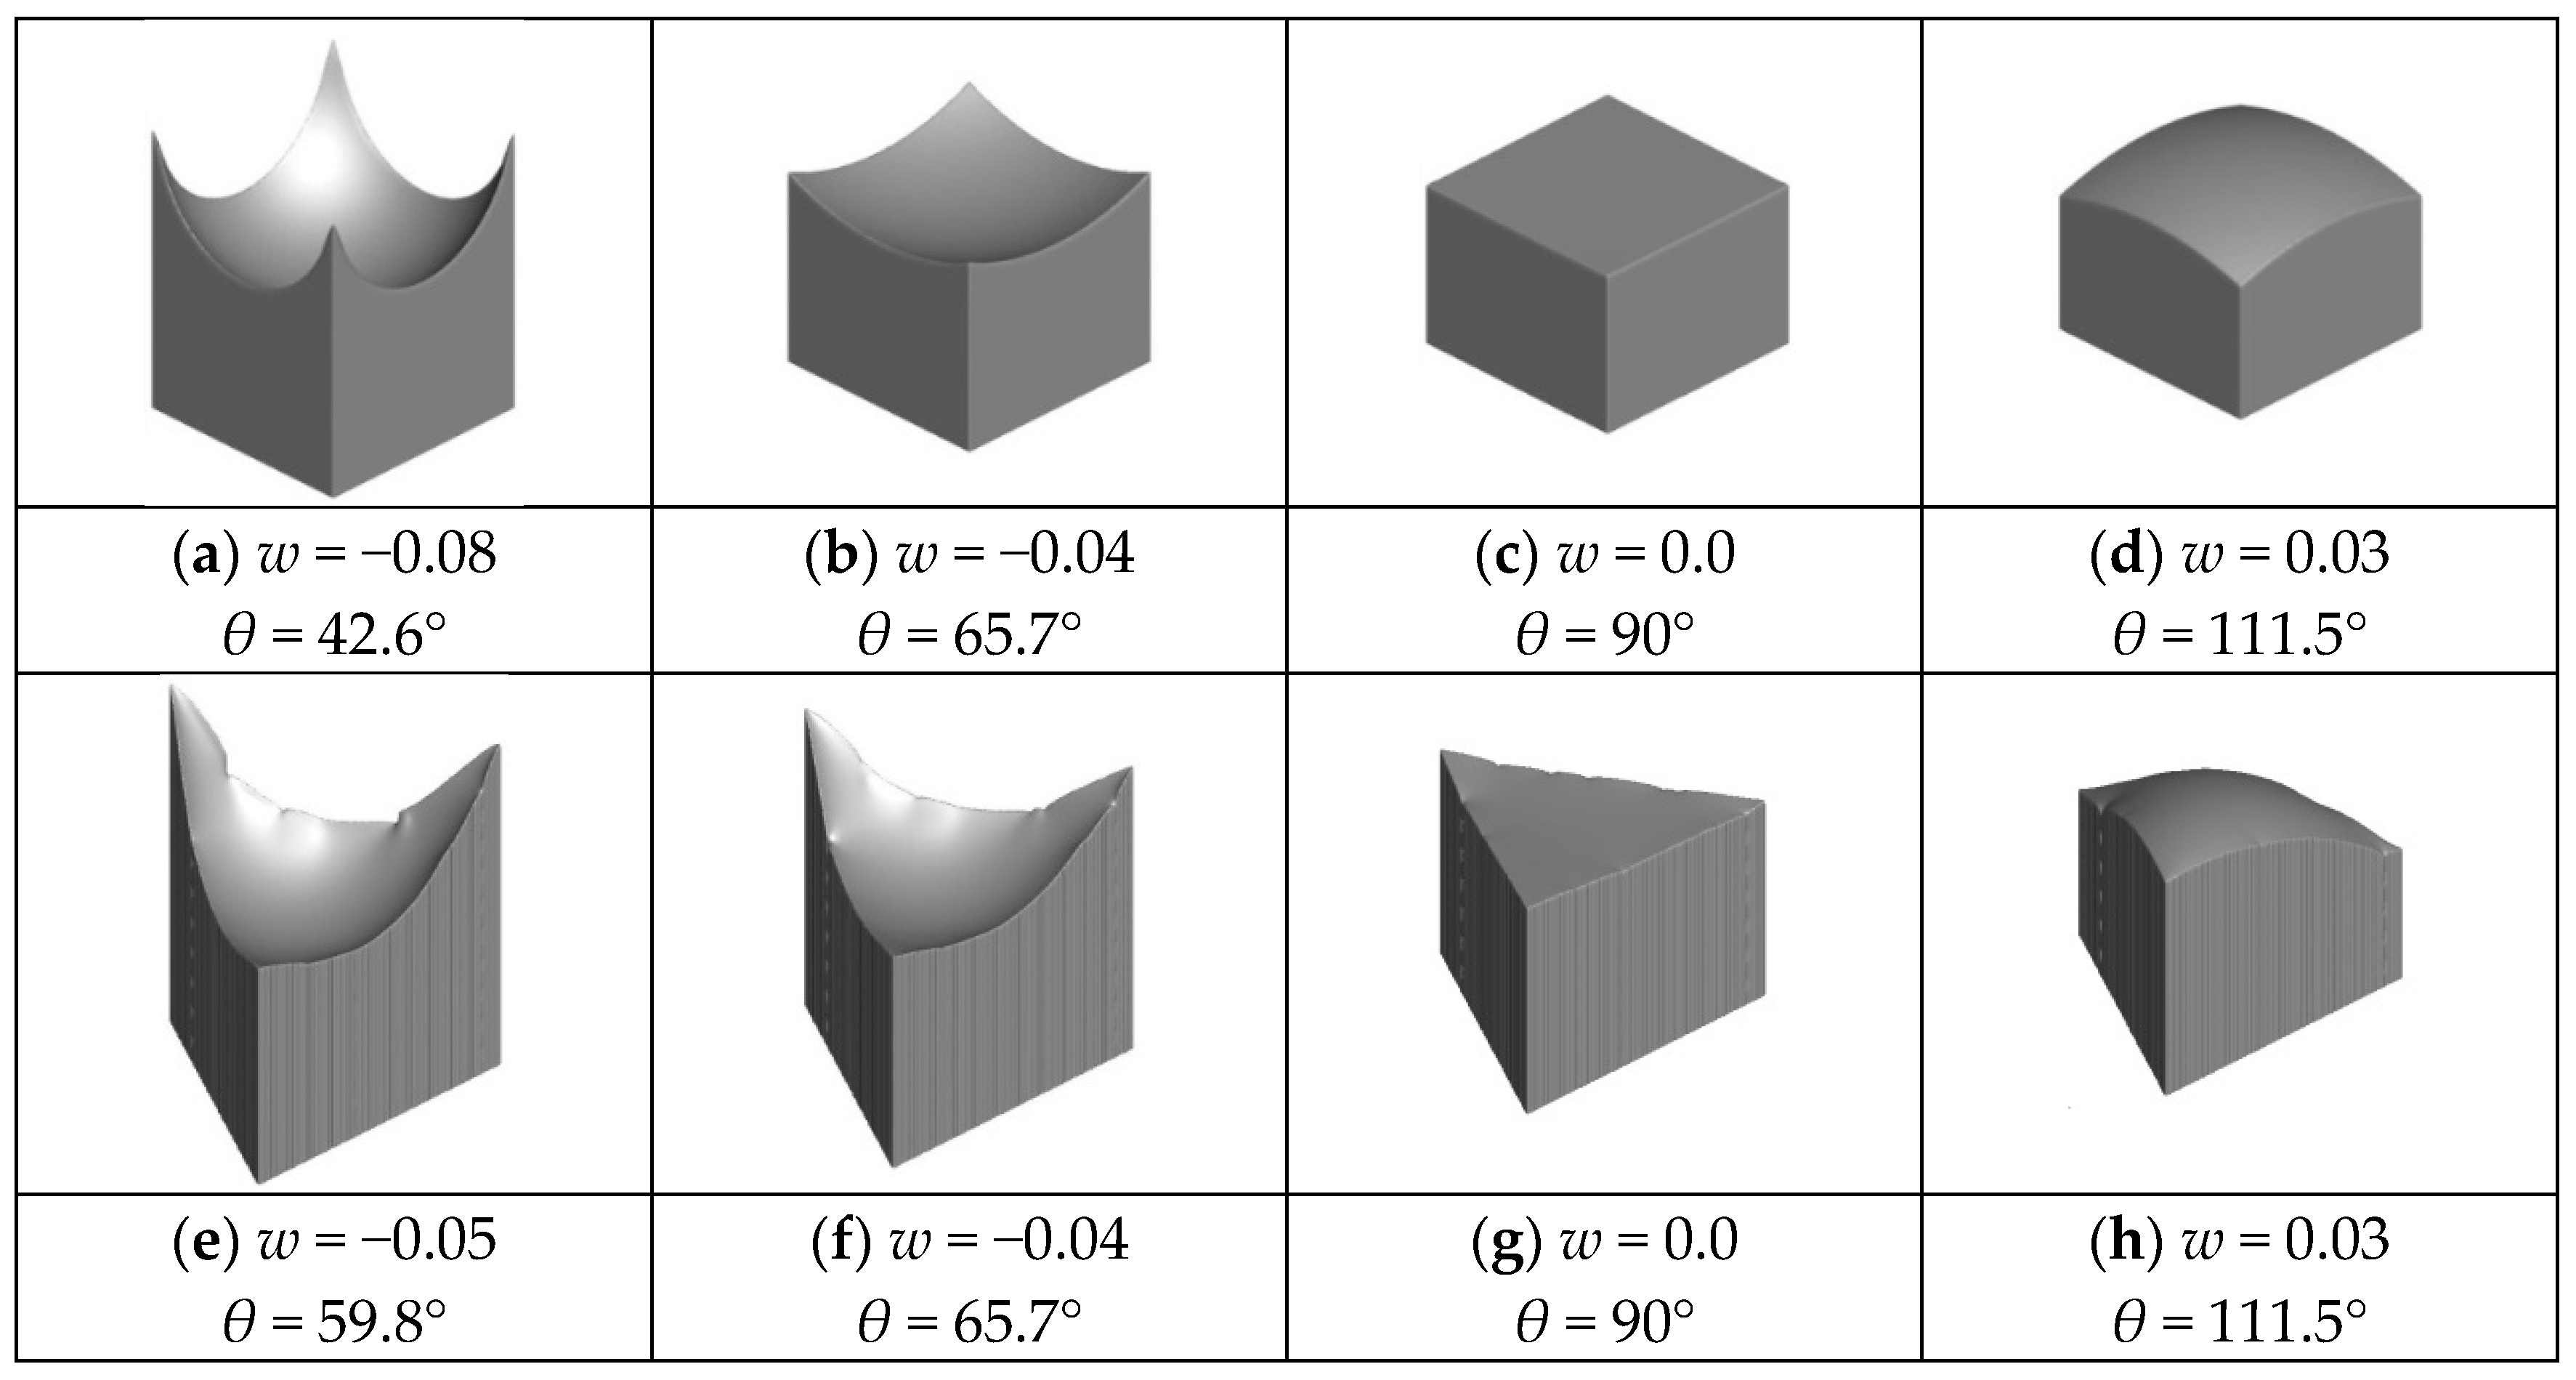
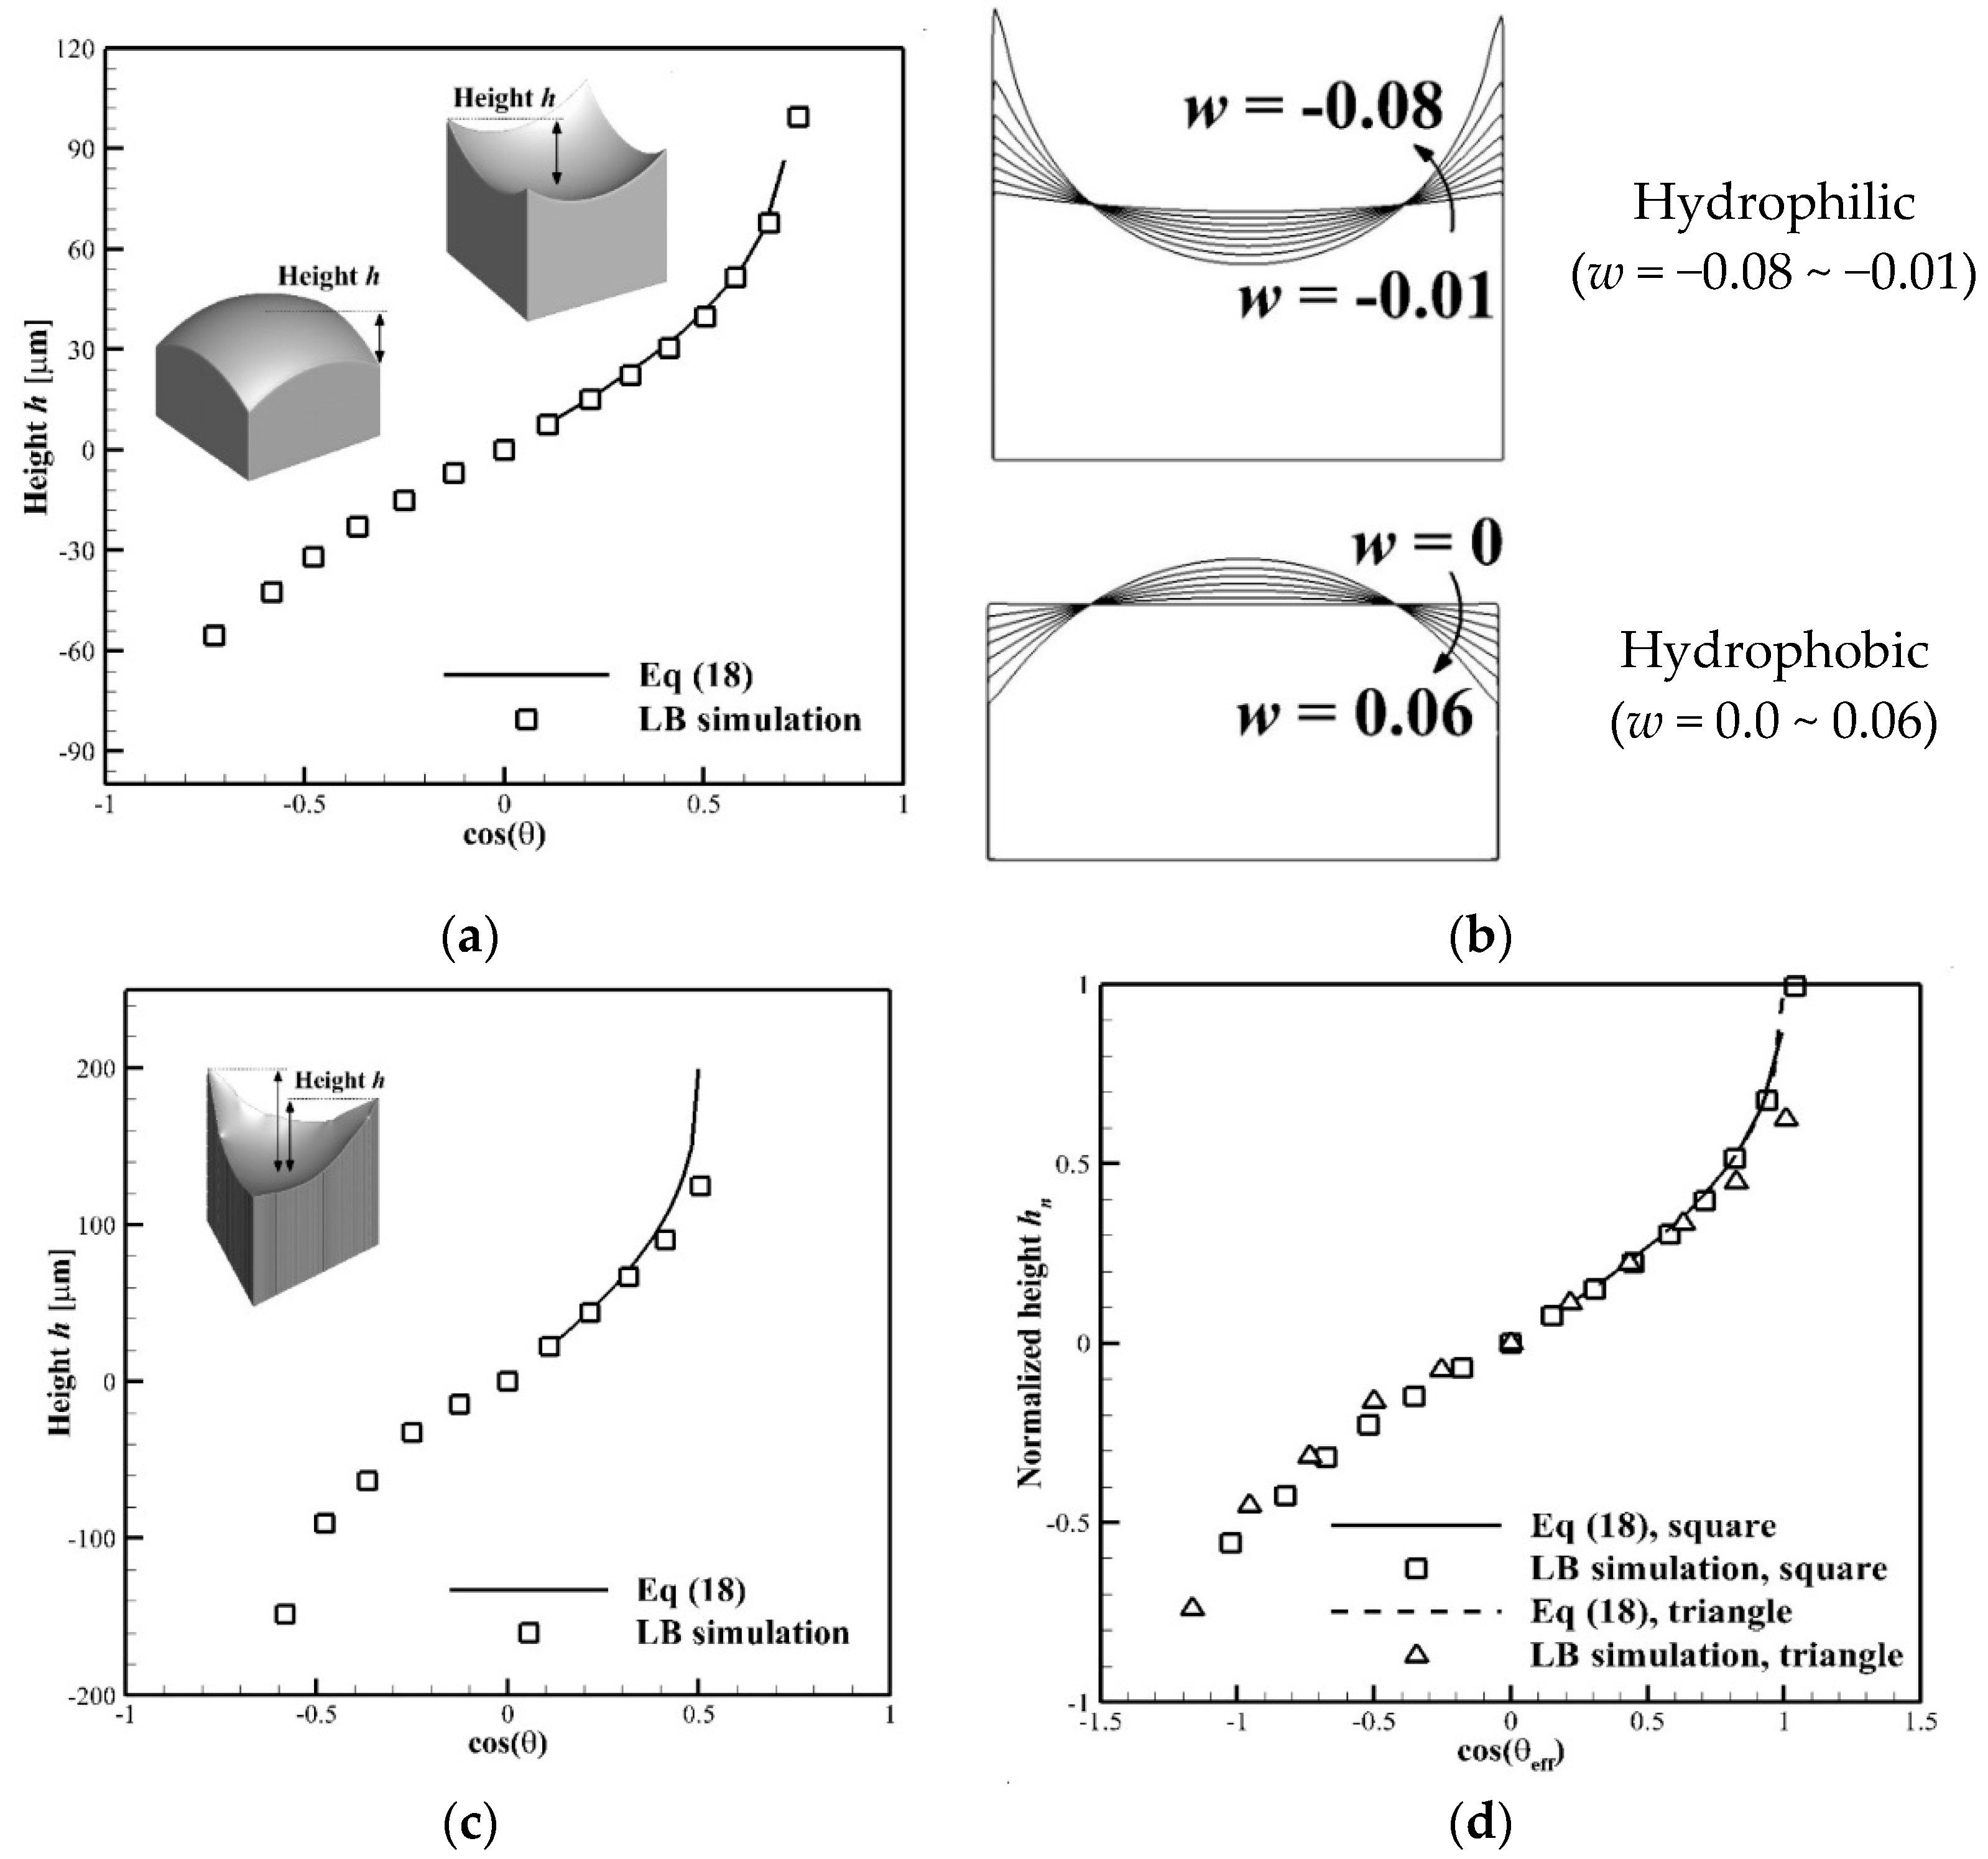
5.1. Pore Meniscus

When the contact angle is larger than the critical contact angle, θ ≥ θc, the liquid wets the tube walls and a pore meniscus is formed in the tube. Figure 5 shows, as an example, snapshots of pore menisci for square and triangular tubes with hydrophilic and hydrophobic surfaces after reaching steady state. For the square configuration, the meniscus is regular (Figure 5a–d), while for the triangular configuration (Figure 5e,f) the pore menisci show different heights at each corner, especially at a small contact angle (hydrophilic case). This observation is explained by the artificially introduced wall roughness for the triangular tube, as also observed by other authors such as Dos Santos et al. [28]. We found that corner 1 in Figure 4c, which has the highest roughness, shows the lowest height, while corners 2 and 3 show the same height.
Results are presented in terms of height of pore meniscus versus cosine of the contact angle after reaching equilibrium. The height is defined as the difference between the bottom and the top of the meniscus (see insets of Figure 6a,c). Since the height for the triangular tube is not equal in all corners, the average of the heights in the different corners of the tube is used. Figure 6b shows, for the square tube, diagonal profiles of the pore meniscus as a function of the solid-fluid interaction parameter w. With increasing cos θ (more hydrophilic), the height increases. This can be explained by the fact that with increasing cos θ or decreasing contact angle, the adhesive force Fa between solid and fluid in Equation (12) increases and the pressure difference to maintain hydrostatic equilibrium increases, resulting in an increase of the height. At very high (low) contact angles, the height increases (decreases) even more, resulting in an S-shape curve.
An analytical solution for the height h for a n-sided polygonal tube in the hydrophilic case (θ < π/2) is given by [11]:
h = r sin α [ 1 1 ( cos θ / sin α ) 2 ] / cos θ
where α is the half of the corner angle:
α = ( n 2 ) π / ( 2 n )
For the square tube, the LBM heights are in good agreement with the analytical solution. For the triangular tube, the simulated average height is lower than the analytical solution for higher values of cosθ (more hydrophilic). This difference is explained by the zigzag boundary and the artificially introduced roughness. Since the height is under-predicted in one corner, the average value is also too low. This is in agreement with the observations of Quéré [46], showing that hydrophilicity of the surface increases with roughness.
Equation (18) can be rewritten in a normalized form as:
h r = 1 cos θ e f f [ 1 1 ( cos θ e f f ) 2 ]
with cosθeff = cosθ/sinα and θeff as the equivalent contact angle. Figure 6d shows the normalized height h/r versus cosine of the equivalent contact angle. We observe that the analytical solutions and LB results for square and triangular tubes collapse onto a single curve. This shows that the LB results for the triangular tube, although suffering from the artificial roughness introduced, agree well over the total hydrophobic and hydrophilic range with the results of the square tube, which does not suffer from an artificial roughness.

5.2. Corner Arc Menisci

When the contact angle is smaller than the critical contact angle, θ < θc, the liquid invades the corners, forming corner arc menisci. We consider two contact angles of 22° and 32° (w = −0.12 and −0.10), both lower than the critical contact angle for the square and triangular tubes, in order to study the influence of the hydrophilic character of the surface in more detail. Figure 7a,b show snapshots of the pore and corner arc menisci as a function of time (iteration step) for the square and triangular tubes. Figure 7c shows diagonal profiles of the menisci over the height and cross-sections of the meniscus at one corner as a function of time for the square tube. For both tubes, at the early stage, the liquid invades the corners at a small thickness and reaches the top of the tube in a short time. With increasing time, the corner arc menisci thicken while their curvature decreases. At the same time, the pore menisci at the bottom evolve from a more flat shape to a concave shape. This process continues until equilibrium is reached. For the triangular tube, corner arc menisci develop only at two corners, while one corner does not show the presence of a corner arc meniscus, or it does so only at a late time. As mentioned before, this observation is attributed to the artificial roughness introduced by the zigzag surfaces, which is higher in corner 1 than in corners 2 and 3 (see Figure 4c), where the former corner is not invaded. The profiles in Figure 7c show that the thickness of the corner arc menisci is not constant over the height, since at the bottom its thickness is influenced by the pore meniscus, and at the top by the edge of the tube. We remark that the thickness of the corner arc meniscus at equilibrium depends on the initial liquid volume present in the tube. In the case of an infinite reservoir, the corner arc menisci of two adjacent corners join. The cross-sections show that the thickness and curvature for the more hydrophilic surface (θ = 22°) are higher compared to the less hydrophilic case (θ = 32°) at the same time step.
Figure 8a,b show the time evolution of the degree of saturation for the square and triangular tubes for the contact angles of 22° and 32° in a log-log plot. The degree of saturation is defined as the ratio of the cross-area occupied by liquid at corners to the area of the full cross-section of the tube and is calculated at the mid-height of the corner arc menisci. The curves for the two geometries and two contact angles show a similar shape. The results show that the corner filling process is faster at an early time and then slows down somewhat. As expected, the degree of saturation at a lower contact angle (more hydrophilic) is higher compared to the degree of saturation at a higher contact angle. However, this influence of contact angle is smaller when the corner angle is smaller (triangular tube).
Further, we determined the curvature of the corner arc menisci. The normalized curvature Cn is given by [10]:
C n = ( L / 2 ) cos ( α + θ ) L c o n t a c t sin α
where L is the side length of the tube, α is the half corner angle dependent on the side parameter n, θ is the contact angle and Lcontact is the side length of the corner arc meniscus wetting the side of the tube. The contact length Lcontact is determined from the LBM results at mid-height of the corner arc menisci. We note that the phase interface in LBM is not sharp but gradually decreases from liquid to gas density over three to five lattices. The position of a phase interface is evaluated at the average density between liquid and gas. Therefore, there is an uncertainty on the contact length Lcontact of around two lattices [26].
Figure 9a shows the curvature versus degree of saturation for the two contact angles 32°and 22° for the square tube. The results for the triangular tube are not represented, since the contact length could not be determined unambiguously due to the artificial roughness problem of the wall, as mentioned above. An analytical solution for the degree of saturation Sw in the function of the curvature is given by [10]:
S w = tan α C n 2 [ cos θ sin α cos ( α + θ ) π 2 ( 1 α + θ 90 ) ]
In Figure 9a, the LB simulation results are compared with the analytical solution in a log-log plot and an overall good agreement is observed. At a low degree of saturation, the LB results over-predict the curvature slightly, which is attributed to the uncertainty (error) in determining the contact length Lcontact. At a small contact length, an error of two lattices can have a non-negligible effect, as the length Lcontact appears in Equation (21) in the denominator. Based on these, we suspect that the contact length is slightly underestimated.
Finally, we report our mesh sensitivity study. Three meshes were selected for the square tube with a contact angle θ = 22° below the critical angle to study the most critical case of corner arc meniscus formation. The meshes each differ in resolution with a factor of 2: a coarser mesh of 72 × 72 × 250 lattices (Δx = 2 µm/lattice), a reference mesh of 142 × 142 × 500 lattices (Δx = 1 µm/lattice) and a finer mesh of 284 × 284 × 1000 lattices (Δx = 0.5 µm/lattice). Figure 9b gives the curvature versus degree of saturation for the three meshes and compares these LBM results with the analytical solution. An overall good agreement is obtained, which convinced us that the reference mesh is fine enough to produce mesh-insensitive results for the square case. For the triangular tube, the results are more mesh-sensitive since the resolution also determines the artificial roughness introduced. This is the reason why, for the triangular tube, we chose the finest mesh, which is a compromise between calculation time and accuracy.

6. Conclusions

In this study, capillary rise in polygonal tubes is investigated, taking into account the appearance of a pore meniscus and corner arc menisci, the presence of which depends on the contact angle. Lattice Boltzmann (LB) simulations are performed using the Shan-Chen pseudopotential multiphase LB model. This multiphase LB model is validated by a dynamic capillary intrusion test. A contact angle test is performed to obtain the relation between the contact angle and the solid-fluid interaction parameter used in the LBM. The multiphase LB model is used to study capillary rise in square and triangular tubes with different contact angles and the LB results are compared with analytical solutions and an overall good agreement is obtained. This validated LB model for corner flow will be further used to analyze the effect of corner flow in more complex porous configurations.
The main conclusions of the present study are as follows:
  • When the contact angle is larger than the critical contact angle, θ ≥ θc, only a pore meniscus develops and its height increases with the decreasing contact angle for both square and triangular tubes. The LB simulation results show good agreement with the analytical solution. At a very low contact angle in the triangular tube, the height is under-predicted due to the artificial roughness introduced. The LB heights normalized with the circumscribed radius for hydrophobic and hydrophilic surfaces as a function of the effective contact angle collapse into a single S-shaped curve for square and triangular tubes.
  • When the contact angle is smaller than the critical contact angle, θ < θc, LB simulations predict that the liquid invades the corners, forming corner arc menisci. The relation between the degree of saturation and the curvature of the corner arc menisci follows the Mayer and Stoewe-Princen (MS-P) model. The study of the time-dependence of the degree of saturation shows corners filling faster at an early stage and corner arc menisci thickening at a later stage.
In this study, the characteristic length is below the capillary length of water and, thus, the surface tension force is more dominant than the gravitational force. Therefore, the gravitational effect is not taken into account in our LB simulation. However, at a larger scale, gravity effects become dominant and should be considered. Furthermore, a full bounce-back boundary condition is applied, demonstrating its limitations when modeling polygonal tubes where the regular meshing is not aligned with the tube sides, leading to zigzag surfaces and the introduction of an artificial surface roughness. To describe the capillary rise in angled or curved geometries, alternative boundary conditions should be considered, such as the curved boundary condition, the half bounce-back boundary condition or the moving boundary, allowing the interface between solid and fluid to be independent of the mesh. This work illustrates that the LBM is a suitable and promising tool for further studies for a better understanding of capillary flow phenomena in angled pore geometry in porous media.

Acknowledgments

This work has been supported by Swiss National Science Foundation project no. 200021-143651. Li Chen and Qinjun Kang acknowledge the support from LANL’s LDRD Program and Institutional Computing Program.

Author Contributions

Soyoun Son, Dominique Derome and Jan Carmeliet conceived and designed the research plan; Soyoun Son, Li Chen and Qinjun Kang implemented the model, Soyoun Son performed the simulations; Soyoun Son, Dominique Derome and Jan Carmeliet analyzed the data; all authors participated in writing the paper.

Conflicts of Interest

The authors declare no conflict of interest.

References

  1. Concus, P.; Finn, R. On capillary free surfaces in the absence of gravity. Acta Math. 1974, 132, 177–198. [Google Scholar] [CrossRef]
  2. Concus, P.; Finn, R. Dichotomous behavior of capillary surfaces in zero gravity. Microgravity Sci. Technol. 1990, 3, 87–92. [Google Scholar]
  3. Wong, H.; Morris, S.; Radke, C. Three-dimensional menisci in polygonal capillaries. J. Colloid Interface Sci. 1992, 148, 317–336. [Google Scholar] [CrossRef]
  4. Dong, M.; Chatzis, I. The imbibition and flow of a wetting liquid along the corners of a square capillary tube. J. Colloid Interface Sci. 1995, 172, 278–288. [Google Scholar] [CrossRef]
  5. Princen, H. Capillary phenomena in assemblies of parallel cylinders: I. Capillary rise between two cylinders. J. Colloid Interface Sci. 1969, 30, 69–75. [Google Scholar] [CrossRef]
  6. Princen, H. Capillary phenomena in assemblies of parallel cylinders: II. Capillary rise in systems with more than two cylinders. J. Colloid Interface Sci. 1969, 30, 359–371. [Google Scholar] [CrossRef]
  7. Mayer, R.P.; Stowe, R.A. Mercury porosimetry—Breakthrough pressure for penetration between packed spheres. J. Colloid Sci. 1965, 20, 893–911. [Google Scholar] [CrossRef]
  8. Princen, H. Capillary phenomena in assemblies of parallel cylinders: III. Liquid columns between horizontal parallel cylinders. J. Colloid Interface Sci. 1970, 34, 171–184. [Google Scholar] [CrossRef]
  9. Bico, J.; Quéré, D. Rise of liquids and bubbles in angular capillary tubes. J. Colloid Interface Sci. 2002, 247, 162–166. [Google Scholar] [CrossRef] [PubMed]
  10. Ma, S.; Mason, G.; Morrow, N.R. Effect of contact angle on drainage and imbibition in regular polygonal tubes. Colloids Surf. A Physicochem. Eng. Asp. 1996, 117, 273–291. [Google Scholar] [CrossRef]
  11. Feng, J.; Rothstein, J.P. Simulations of novel nanostructures formed by capillary effects in lithography. J. Colloid Interface Sci. 2011, 354, 386–395. [Google Scholar] [CrossRef] [PubMed]
  12. Hirt, C.W.; Nichols, B.D. Volume of fluid (VOF) method for the dynamics of free boundaries. J. Comput. Phys. 1981, 39, 201–225. [Google Scholar] [CrossRef]
  13. Sussman, M.; Fatemi, E.; Smereka, P.; Osher, S. An improved level set method for incompressible two-phase flows. Comput. Fluids 1998, 27, 663–680. [Google Scholar] [CrossRef]
  14. Tryggvason, G.; Esmaeeli, A.; Lu, J.; Biswas, S. Direct numerical simulations of gas/liquid multiphase flows. Fluid Dyn. Res. 2006, 38, 660–681. [Google Scholar] [CrossRef]
  15. Owkes, M.; Desjardins, O. A computational framework for conservative, three-dimensional, unsplit, geometric transport with application to the volume-of-fluid (VOF) method. J. Comput. Phys. 2014, 270, 587–612. [Google Scholar] [CrossRef]
  16. Chen, S.Y.; Doolen, G.D. Lattice Boltzmann methode for fluid flows. Annu. Rev. Fluid Mech. 1998, 30, 329–364. [Google Scholar]
  17. Aidun, C.K.; Clausen, J.R. Lattice-Boltzmann method for complex flows. Annu. Rev. Fluid Mech. 2010, 42, 439–472. [Google Scholar] [CrossRef]
  18. Chen, L.; Kang, Q.; Carey, B.; Tao, W.Q. Pore-scale study of diffusion-reaction processes involving dissolution and precipitation using the lattice Boltzmann method. Int. J. Heat Mass Transf. 2014, 75, 483–496. [Google Scholar] [CrossRef]
  19. Gunstensen, A.K.; Rothman, D.H.; Zaleski, S.; Zanetti, G. Lattice Boltzmann model of immiscible fluids. Phys. Rev. A 1991, 43, 4320. [Google Scholar] [CrossRef] [PubMed]
  20. Swift, M.R.; Orlandini, E.; Osborn, W.; Yeomans, J. Lattice Boltzmann simulations of liquid-gas and binary fluid systems. Phys. Rev. E 1996, 54, 5041. [Google Scholar] [CrossRef]
  21. He, X.; Chen, S.; Zhang, R. A lattice Boltzmann scheme for incompressible multiphase flow and its application in simulation of Rayleigh-Taylor instability. J. Comput. Phys. 1999, 152, 642–663. [Google Scholar] [CrossRef]
  22. Shan, X.; Chen, H. Lattice Boltzmann model for simulating flows with multiple phases and components. Phys. Rev. E 1993, 47, 1815–1819. [Google Scholar] [CrossRef]
  23. Shan, X.; Chen, H. Simulation of nonideal gases and liquid-gas phase transitions by the lattice Boltzmann equation. Phys. Rev. E 1994, 49, 2941. [Google Scholar] [CrossRef]
  24. Chen, L.; Luan, H.B.; He, Y.L.; Tao, W.Q. Pore-scale flow and mass transport in gas diffusion layer of proton exchange membrane fuel cell with interdigitated flow fields. Int. J. Thermal Sci. 2012, 51, 132–144. [Google Scholar] [CrossRef]
  25. Chen, L.; Kang, Q.; Mu, Y.; He, Y.-L.; Tao, W.-Q. A critical review of the pseudopotential multiphase lattice Boltzmann model: Methods and applications. Int. J. Heat Mass Transfer 2014, 76, 210–236. [Google Scholar] [CrossRef]
  26. Thorne, D.T.; Michael, C. Lattice Boltzmann Modeling An Introduction for Geoscientists and Engineers; Springer: Miami, FL, USA, 2006. [Google Scholar]
  27. Raiskinmäki, P.; Shakib-Manesh, A.; Jäsberg, A.; Koponen, A.; Merikoski, J.; Timonen, J. Lattice-Boltzmann simulation of capillary rise dynamics. J. Stat. Phys. 2002, 107, 143–158. [Google Scholar] [CrossRef]
  28. Dos Santos, L.O.; Wolf, F.G.; Philippi, P.C. Dynamics of interface displacement in capillary flow. J. Stat. Phys. 2005, 121, 197–207. [Google Scholar] [CrossRef]
  29. Lu, G.; Wang, X.-D.; Duan, Y.-Y. Study on initial stage of capillary rise dynamics. Colloids Surf. A Physicochem. Eng. Asp. 2013, 433, 95–103. [Google Scholar] [CrossRef]
  30. Martys, N.S.; Chen, H. Simulation of multicomponent fluids in complex three-dimensional geometries by the lattice Boltzmann method. Phys. Rev. E 1996, 53, 743–750. [Google Scholar] [CrossRef]
  31. Hecht, M.; Harting, J. Implementation of on-site velocity boundary conditions for D3Q19 lattice Boltzmann simulations. J. Stat. Mech.: Theory Exp. 2010, 2010, P01018. [Google Scholar] [CrossRef]
  32. Li, Q.; Luo, K.H.; Li, X.J. Forcing scheme in pseudopotential lattice Boltzmann model for multiphase flows. Phys. Rev. E 2012, 86, 016709. [Google Scholar] [CrossRef] [PubMed]
  33. Huang, H.; Krafczyk, M.; Lu, X. Forcing term in single-phase and Shan-Chen-type multiphase lattice Boltzmann models. Phys. Re. E 2011, 84, 046710. [Google Scholar] [CrossRef] [PubMed]
  34. Kupershtokh, A.; Medvedev, D.; Karpov, D. On equations of state in a lattice Boltzmann method. Comput. Math. Appl. 2009, 58, 965–974. [Google Scholar] [CrossRef]
  35. Yuan, P.; Schaefer, L. Equations of state in a lattice Boltzmann model. Phys. Fluids 2006, 18, 042101. [Google Scholar] [CrossRef]
  36. Azwadi, C.N.; Witrib, M.A. Simulation of multicomponent multiphase flow using lattice Boltzmann method. In Proceedings of the 4th International Meeting of Advances in Thermofluids (IMAT 2011); AIP Publishing: Melaka, Malaysia, 2012. [Google Scholar]
  37. Chen, L.; Kang, Q.; Robinson, B.A.; He, Y.-L.; Tao, W.-Q. Pore-scale modeling of multiphase reactive transport with phase transitions and dissolution-precipitation processes in closed systems. Phys. Rev. E 2013, 87, 043306. [Google Scholar] [CrossRef] [PubMed]
  38. Liu, H.; Valocchi, A.; Kang, Q.; Werth, C. Pore-Scale Simulations of Gas Displacing Liquid in a Homogeneous Pore Network Using the Lattice Boltzmann Method. Transport Porous Media 2013, 99, 555–580. [Google Scholar] [CrossRef]
  39. Diotallevi, F.; Biferale, L.; Chibbaro, S.; Lamura, A.; Pontrelli, G.; Sbragaglia, M.; Succi, S.; Toschi, F. Capillary filling using lattice Boltzmann equations: The case of multi-phase flows. Eur. Phys. J. Spec. Top. 2009, 166, 111–116. [Google Scholar] [CrossRef]
  40. Pooley, C.; Kusumaatmaja, H.; Yeomans, J. Modelling capillary filling dynamics using lattice Boltzmann simulations. Eur. Phys. J.-Spec. Top. 2009, 171, 63–71. [Google Scholar] [CrossRef]
  41. Son, S.; Chen, L.; Derome, D.; Carmeliet, J. Numerical study of gravity-driven droplet displacement on a surface using the pseudopotential multiphase lattice Boltzmann model with high density ratio. Comput. Fluids 2015, 117, 42–53. [Google Scholar] [CrossRef]
  42. Stalder, A.F.; Melchior, T.; Müller, M.; Sage, D.; Blu, T.; Unser, M. Low-bond axisymmetric drop shape analysis for surface tension and contact angle measurements of sessile drops. Colloids Surf. A Physicochem. Eng. Asp. 2010, 364, 72–81. [Google Scholar] [CrossRef]
  43. Mei, R.; Luo, L.-S.; Shyy, W. An accurate curved boundary treatment in the lattice Boltzmann method. J. Comput. Phys. 1999, 155, 307–330. [Google Scholar] [CrossRef]
  44. Mei, R.; Shyy, W.; Yu, D.; Luo, L.-S. Lattice Boltzmann method for 3-D flows with curved boundary. J. Comput. Phys. 2000, 161, 680–699. [Google Scholar] [CrossRef]
  45. De Gennes, P.G. Wetting: Statics and dynamics. Rev. Modern Phys. 1985, 57, 827. [Google Scholar] [CrossRef]
  46. Quéré, D. Rough ideas on wetting. Phys. A: Stat. Mech. Appl. 2002, 313, 32–46. [Google Scholar] [CrossRef]
Figure 1. Schematic representation of the two liquid configurations in a square tube: (a) pore meniscus when the contact angle is larger than the critical contact angle, θ ≥ θc; and (b) co-occurrence of pore and corner arc menisci when the contact angle is smaller than the critical contact angle, θ < θc.
Computation 04 00012 g001
Figure 2. LBM validation of dynamic capillary intrusion test for T/Tc= 0.85: (a) computational domain; and (b) comparison between the LB simulation results and analytical solution of the position of phase interface as a function of time (iteration step).
Computation 04 00012 g002
Figure 3. LBM results of contact angle test: equilibrium contact angles θ as function of solid-fluid interaction parameter w for T/Tc = 0.85.
Computation 04 00012 g003
Figure 4. Schematic geometries of polygonal tubes: (a) computational domains for pore meniscus case, (b) computational domains for corner arc menisci case; and (c) computational mesh details for the triangular tube at different corners.
Computation 04 00012 g004
Figure 5. Liquid configurations in square and triangular tubes for different contact angles after reaching steady state.
Computation 04 00012 g005
Figure 6. Height of the pore meniscus h as a function of cosine of contact angle θ. Comparison between simulation results and analytical solution: (a) square tube; (b) diagonal profiles for square tube, for different solid-fluid interaction value w; (c) triangular tube. (d) Normalized height of the pore meniscus as a function of cosine of effective contact angle θeff for square and triangular tubes and comparison with analytical solutions.
Computation 04 00012 g006
Figure 7. Liquid configuration versus time (iteration count) for θ = 22°: (a) square tube; (b) triangular tube; and (c) diagonal profiles and cross-sections of a corner arc menisci for square tube at different iteration steps for θ = 22° and 32°.
Computation 04 00012 g007aComputation 04 00012 g007b
Figure 8. Log-log plot of degree of saturation Sw versus time for contact angles θ = 22° and 32° for square and triangular tubes.
Computation 04 00012 g008
Figure 9. Log-log plot of curvature Cn versus degree of saturation Sw for square tube and comparison with analytical solution: (a) for different contact angles θ = 22° and 32°; (b) Grid sensitivity analysis for coarse, reference and fine mesh.
Computation 04 00012 g009

