Review

A Review of Numerical Modelling of Multi-Scale Wind Turbines and Their Environment

1
Department of Architecture and Built Environment, University of Nottingham, Nottingham NG7 2JA, UK
2
Department of Mechanical Engineering, University of Sheffield, Sheffield S10 2TN, UK
3
Faculty of Civil Engineering, Universiti Teknologi Malaysia, UTM, Skudai 81310, Malaysia
*
Authors to whom correspondence should be addressed.
Submission received: 14 January 2018 / Revised: 28 February 2018 / Accepted: 2 March 2018 / Published: 5 March 2018
(This article belongs to the Special Issue Computational Methods in Wind Engineering)

Abstract

:
Global demand for energy continues to increase rapidly, due to economic and population growth, especially for increasing market economies. These lead to challenges and worries about energy security that can increase as more users need more energy resources. Also, higher consumption of fossil fuels leads to more greenhouse gas emissions, which contribute to global warming. Moreover, there are still more people without access to electricity. Several studies have reported that one of the rapidly developing source of power is wind energy and with declining costs due to technology and manufacturing advancements and concerns over energy security and environmental issues, the trend is predicted to continue. As a result, tools and methods to simulate and optimize wind energy technologies must also continue to advance. This paper reviews the most recently published works in Computational Fluid Dynamic (CFD) simulations of micro to small wind turbines, building integrated with wind turbines, and wind turbines installed in wind farms. In addition, the existing limitations and complications included with the wind energy system modelling were examined and issues that needs further work are highlighted. This study investigated the current development of CFD modelling of wind energy systems. Studies on aerodynamic interaction among the atmospheric boundary layer or wind farm terrain and the turbine rotor and their wakes were investigated. Furthermore, CFD combined with other tools such as blade element momentum were examined.

1. Introduction

Over the last decade, the production of renewable energy has rapidly increased and this development is expected to continue. Wind energy generation contributed a great share to this expansion and has attracted institutional investors. Wind resource is one of the most used sources of energy and about 50 GW have been installed in the year 2014 [1]. The global warming effect, increasing price of fossil products, instability of the energy market, and desire for clean-smart cities are the main drivers for increasing awareness in renewable technologies. Creating an environment which is clean and sustainable for the future is one of the greatest challenges of our time. As conventional sources like coal, oil, and other fossil fuels are limited and continue to be depleted, it is very important to search for renewable energy sources and develop technologies [2]. Researchers continue to develop and optimise wind turbines to eliminate the drawbacks associated with these devices. Due to all of these issues, the trend of increasing production from wind power resulted in wind farm constructions in locations with highly complex orography and, therefore, predicting its performance using simplified and linear models may not be adequate or accurate enough. The installation of wind turbines in complex terrain landscapes represents a major challenge due to the combination of uncertain wind resources and the flow accelerations from the surrounding terrain and wake effects from other turbines [3]. Another example is the installation of wind turbines in buildings or building-integrated wind turbines (BIWT), where the wind resource and condition are uncertain due to the surrounding buildings.
The profitability of energy production from wind resource is dependent on the turbine productivity, price of energy and generation costs, taking into account the total cost over the entire lifetime [4,5]. Micro-siting or the selection of the most efficient and effective type of wind turbine and exact location are very important factors that should be considered during the planning stage of a wind energy project. A lot of present tools/methods are not sufficient to completely predict the wind flow multifaceted and complex settings where the estimation of acceleration–deceleration wind effects is challenging. The error associated with the energy data presents a growing issue as the accuracy concerning the quantity of the energy which could be commercialised is even greater. Recent studies have shown that the integration of numerical Computational Fluid Dynamics (CFD) modelling with other tools such as wind tunnel or field measurements could provide a solution for the assessment of wind power in complex conditions [6,7]. Complex conditions, specifically in urban areas, presents substantial challenges for the integration of wind turbines. Also, there is lack of understanding and uncertainty concerning the impact of turbulence on the effectiveness of wind turbines in urban areas.
Figure 1 shows the different sizes and capacities of wind turbines [7]. A number of exhaustive studies have been made in small and medium scale wind turbine blades and most of them have used CFD and traditional BEM or blade element momentum to design the blades and compute the forces that act on it. Many studies on searching the optimum chord lengths have been prepared using different evolutionary optimising strategies. Issues including high turbulence, low wind velocity, and frequent direction of the wind change can affect the performance of HAWT or Horizontal-Axis Wind Turbine. Some VAWT or Vertical-Axis Wind Turbine designs can operate well in complex operating conditions however many possess low power coefficient [8,9].
Buildings or roofs integrated with micro-wind turbines are also creating great attention for decentralised power production and promising low cost renewable energy devices in populated areas, but, there is an uncertainty concerning the viability of these wind turbines. In high density urban/suburban areas, the installation of wind turbines is fairly limited because of problems including high turbulence intensity, low wind speeds, and possibly of greater levels of noise produced by the turbine. In order to make use of the application of micro-small renewable-energy production, particularly smaller turbines, allowing for tower heights that permits max utilisation of the accessible wind resource is important [10]. Between the different classifications of wind systems, small-scale VAWT showed the greatest potential for the generation of power in off-grid locations [11]. But the wind turbines are mostly being utilised in wind power farms or high-rise buildings where the wind with high speed is available. Few studies focus on the micro-wind utilisation in low-rise buildings due to the bottleneck i.e., wind speed cannot meet the minimal speed requirement of small wind turbines.
Recently, the optimisation of wind farms using CFD has received much attention in literature. For uniform terrains, the wind farm layout optimisation has been addressed through many works using various strategies; but currently, optimising the layout of wind farm on non-uniform/complex terrains is a challenge because of the absence of accurate and computationally tractable wake models for the assessment of the layout of wind farm. CFD modelling solutions such as actuator-disk and -line were established to predict the interaction with non-uniform terrains and phenomena of wake though these methods are computationally expensive particularly during the process of optimisation.
There is an ongoing debate on the health effects of wind turbines, especially in terms of aerodynamic noise, coming from the rotational motion of the blades of these devices. Therefore, set-back distances have been reported globally in order to avoid or minimise possible criticisms or impacts from the population located nearby the turbines [12]. The noise coming from the wind turbine has been an issue for years which resulted in barrier to widespread the use of wind turbines [13]. It is one of the most typical obstacles to the application of wind turbines, it is necessary to design the wind turbine rotors as quiet as possible. Currently, there is limited work available to examine the sources of noise for these devices, in particular, smaller wind turbines. The noise can create a negative influence on people nearby wind turbine [14]. In addition, these devices can also have adversative impact on animals, specifically by collision with the turbine blades [15].
Large scale wind turbines were found to affect the local climatic conditions and the atmosphere, while smaller wind turbines can provide a good possibility for providing power that could be sufficient for local demands without changing the local conditions. The growing attention on the installation of sustainable energy systems has led to a wide range of micro-wind turbine methods introduced in the market. Though most of the commercially used wind turbines are the HAWT, vertical axis is recognised to have a potential technology for the future. The application of micro-small-scale wind turbine is increasing with also the legislation and support encouraging further development [16].
It is known that the environmental impacts produced in the operational process of wind turbines are lower compared to the ones produced by fossil fuels-based systems [17], however, the overall contribution of smaller wind turbines may be limited. The environmental effects of small-micro turbines and their capability to contribute to climate change targets in the UK was examined by [18]. Installation of small wind turbines in the domestic sector would only save around 0.6–1% of greenhouse emissions of 2009. So, its potential to contribute to the climate change targets of the UK is limited.
CFD modelling has been used by several researchers to predict the wind energy systems’ performance over the last few decades. With the growing computing capacity of modern computers, CFD modelling has developed to a substantial tool to numerically assess the wind conditions within the investigated site or environment [19,20,21]. Current developments in wind turbine using CFD simulation have shown progress from flow modelling of flow around two-dimensional aerofoils to ABL or atmospheric boundary layer flow by arrangements of turbines or wind farms. The velocity profile of the wind depends on the boundary layer based on a complex terrain layout that varies significantly on the roughness of surface and local Reynolds number. Accuracy of CFD simulations of wind flow is important for choosing wind farm locations and the design of suitable wind turbines. The rising computational resource and power in the past few years permitted the CFD simulation of the sites containing the wind turbines.
To respond to the challenges associated with the modelling of wind turbines in various scales, this study will review the state of the art and most recent literature (2010–2018) on the CFD modelling of wind turbine energy systems. Different types of wind turbine categories will be investigated: micro to small-scale, building mounted, and large-scale wind turbines based on the analysis of performance of these devices using CFD simulations. To identify articles for this review, a computerised literature search using terms such as “Wind Turbine”, “Micro to Small Wind Turbine”, “Building Mounted with Wind Turbine”, “Wind Turbine installed in Wind Farm”, and “CFD” in the Sciencedirect, Researchgate, and Springer database for publications available to date. These databases include scientific books, journals, articles, and papers from conference proceedings. Several publications were removed due to duplicates or unrelated to the CFD simulation. Moreover, only articles that were written in English were selected.

2. Micro-Small Scale

Decentralised or on-site energy generation by exploiting various types of energy resources has the prospective to deliver extensively applicable low carbon electricity generation at the urban or built environment level [22,23]. Generation of power at the point of use can minimise the energy loss associated with the transmission of electricity. Due to these, micro to small-scale renewables such as solar panels and wind turbines have gained increasing attention. Small micro-wind turbines are generally classified based on swept area (<25 m2) and have rated power of up to 6 kW [24,25]. Different types of small micro wind turbine are shown in Figure 2. This section will review the recent studies that assess the wind energy systems in the micro-small scale using CFD and addresses the challenges associated with its applications, including design, optimisation, low velocity and high turbulence of urban wind, vibration and noise problems.
De-Santoli et al. [26] conducted CFD and experimental analysis of an AM300 vertical axis micro-wind turbine with an electrical power of 3.7 kW. The study assessed the viability and energy generation in low wind speed locations. The initial energy results demonstrated that the electricity production of the prototype was higher than that generated by a typical generator with the same technical features. Hence, a lower cut in wind speed for the power curve was achieved. The CFD analysis highlighted that adding the convergent duct to the H-rotor Darrieus turbine (see Figure 3) improved its energy generation. The percentage of power rises at roughly 125% for wind speed equal to 8 m/s. Although the CFD model was able to evaluate the speed amplification effect due to the convergent duct, experiments were conducted to assess the power increase.
A similar study by El-Zahaby et al. [27] used a 2-D axisymmetric CFD model based on standard k-ε turbulence model to investigate a micro wind turbine contained in a diffuser with flanges to enhance power generation. The work focused on the influence of flange’s angles on velocity at diffuser entrance. The verification of the present model showed good agreement among earlier published experimental data. The numerical results demonstrated the vortices which were generated at the leeward side of the flange which caused a drop in pressure and increased the diffuser’s flow rate. The work concluded that the right flange with 15° angle was the most effective in terms of accelerating the flow at the inlet of diffuser. The work only focused on the diffuser geometry and did not consider the rotor of the turbine.
Several recent studies have focused on optimizing the blades of micro scale wind turbines using CFD modelling. A 3D CFD analysis of the performance of a lotus shape wind turbine based on the Savonius type VAWT was studied by Wang and Zhan [28]. Using CFD based on unsteady continuity RANS with realisable k-ε turbulence model, three types of configurations were compared as shown in Figure 4; wind turbine with semi-circular blades, Savonius type with helically-twisted blades or semi-cylindrical. Its rotation was simulated using the sliding mesh method in CFD. The results showed that the performance of the semi-circular blade configuration was equivalent to that of the semi-cylindrical configuration and was lower as compared to the helically-twisted type. The study, however, ignored the influence of the guide blades on the systems performance.
Mohamed et al. [29] used CFD based on the SST k-ω and Realisable k-ε models in order to investigate 25 different types of blade aerofoil sections and blade pitch angles (−10–10°) of a small H-rotor Darrieus turbine. The results showed that LS (1)-0413 aerofoil had a power coefficient 10% higher than the NACA 0018. In another study [30], the same author compared the performance of 20 different symmetrical and unsymmetrical aerofoil shapes (Figure 5) to maximise the power and torque coefficient. The results indicated that the S-1046 aerofoil section led to a 27% increase in maximum power output coefficient compared to the standard symmetrical NACA aerofoils. Elkhoury et al. [31] used CFD based on LES or large eddy simulation with the dynamic SGS or Smagorinsky–Subgrid scale model to investigate the micro VAWT’s performance with variable-pitch. The variable-pitch mechanism was simulated using the sliding mesh method. The results showed that thicker aerofoils had improved performance for the studied high-solidity ratio fixed pitch wind turbine. Furthermore, good consistency was seen among the LES numerical model and experimental results, both for the variable and fixed pitch mechanisms as detailed in Figure 6.
VAWTs such as H-Darrieus rotor can be effective in low wind speed conditions but since blades with symmetrical profiles are generally used, it had poor self-starting capabilities. Its starting performance can be improved by using high solidity cambered or unsymmetrical blades. Bausas and Danao [32] used CFD modelling to study the overall performance of a camber-bladed VAWT under varying wind conditions. The CFD analysis highlighted that variable wind causes a negative effect on the VAWT’s performance with up to 9% drop in pressure coefficient. In addition, the camber slightly improved VAWT’s performance. Similarly, Sengupta et al. [33] also conducted a CFD investigation to evaluate the self-starting features and efficiency of a H-Darrieus turbine with unsymmetrical blades under low wind conditions. The study concluded that the unsymmetrical blades had a higher power and static and dynamic torque coefficient than the evaluated symmetrical blades. Li et al. [34] conducted 3D transient CFD analysis of a straight-bladed turbine to assess the influence of near-wake and thrust coefficient. The results showed that the momentum amount is minimum at the tip of blade and maximum at the centre of the blade. Furthermore, the CFD model based on the k-epsilon SST transport model provided reasonable predictions as compared to the experimental results. In another study, Li et al. [35] predicted the aerodynamic performance of the same VAWT model in the span-wise direction. Based on the evaluation of the experimental and CFD data, it was seen that the fluid force reduced as the spanwise position increased.
The study of Abdalrahman et al. [36] focused on investigating an intelligent controller for blade pitch of a small H-type VAWT for optimising its power production. CFD was used to examine the performance at various tip speed ratios. The flow was investigated using two methods: sliding mesh and MRF or multiple reference frame method. The power coefficient was solved for each configuration and validated with available experimental data. Due to the complexity related to the dynamic response modelling of the turbine rotor, the numerical data was used for mapping the rotor’s variable- and fixed-pitch angle system models using an artificial neural network. Results showed that the proposed technique improved the output by up to 25%, as compared to a fixed blade configuration.
One of the benefits of the VAWT is its capability to extract wind power from any wind angle or direction and hence it does not require costly pitch and yaw system [37]. Although this also results in deceleration because of the torque (negative) on the returning blades, which then decreases performance. To address this, Stout et al. [38] examined the efficiency improvement of a small VAWT as a result of the addition of an upstream deflector or guide vanes. A 2D VAWT was simulated using ANSYS Fluent CFD to calculate the unsteady Navier–Stokes equation and the k-epsilon RNG model. At the initial process, the performance was enhanced by modifying the pitch angle and orientation, before assessing the impact on increasing wind velocity had on the turbine efficiency. Results showed that it reached 19% maximum efficiency and employed as the design for open rotor. Installed deflectors redirected the fluid flow from the returning turbine blade, thus minimising the negative torque on the device. Moreover, deflectors with width angles between 36 and 45° were observed to enhance the performance of the turbine by up to 1.27%.
CFD simulations were conducted by Arpino et al. [39] to examine the optimal formation of straight-blade Darrieus type VAWT, particularly designed for energy conversion at low wind velocities. The system consisted of three aerofoilpairs, composed of primary and secondary blades with various chord lengths. Analyses were conducted using CFD OpenFOAM, taking into account various turbulence models and using the moving mesh method. The simulation data were compared to the results gathered from the experimental wind tunnel tests of a scaled model and it was concluded that the most accurate model for the analysis of the investigated turbine was the Spalart–Allmaras one equation model.
Various numerical models were developed over the years to accurately simulate the aerodynamic performance of VAWTs. The numerical models can be categorised into the main types, stream-tube, vortex method and CFD modelling. The study of Delafin et al. [40] compared the RANS CFD modelling method with other two low order aerodynamic models (double multiple streamtube model and free-wake vortex mode) based on the prediction of VAWT’s performance, examined by Sandia National Laboratories. The models were assessed based on the prediction of the power coefficient, power, thrust, lateral force and instantaneous turbine torque. All the models agreed well with the test at the optimum tip speed ratio (see Figure 7), but away from the optimal value, the stream tube model greatly differs from other numerical models and experimental data. The RANS CFD model results compared well with the conducted tests, but to some extent underestimating the power coefficient values.
Accurate prediction of the performance of turbines by means of CFD necessitates an adequately fine grid or mesh resolution and azimuthal increment in order to capture important flow details. The size of the computational domains also requires to be adequately large to minimise the impact of blockage caused by the device in the domain. The work of Rezaeiha et al. [41] examined the effect of the aforementioned computational parameters on a small two-bladed VAWT operating at 4.5 tip speed ratio using CFD with the uRANS or unsteady Reynolds averaged Navier–Strokes. Figure 8 shows the sizing of the computational domain. The study highlighted that a distance from the turbine center to the domain inlet di and outlet do of 10 D (10 × diameter of turbine) each, a 20D domain width W and a diameter of the rotating core dc of 1.5D were seen to be safe choices to reduce the effects of blockage and uncertainty in the boundary conditions on the results. Klein et al. [42] used CFD modelling to investigate the impact of blockage on the blade performance. The study compared the results of the CFD code with a LLFVW or Lifting Line Free Vortex Wake code and wind tunnel experiment. Good comparison was observed between the numerical and wind tunnel data.
In the study of Chowdhury et al. [43], a parametric investigation of turbulence models, time step, and mesh independence were conducted for accurate simulation of an upright and tilted small VAWT. Based on the results, the Spalart–Allmaras turbulence model had the worst performance in regards to vortices capturing. While the SST k-omega modelled the vortices in wake better compared to Spalart–Allmaras and RNG k-epsilon turbulence models. The analysis proved that CFD was better as compared to BEM in terms of aerodynamic feature predictions. Furthermore, the tilted VAWT configuration produced better downwind torque than the upright VAWT configuration.
Yang et al. [44] examined the effect of tip vortex on small VAWT wake using CFD simulations based on the k omega SST or shear-stress transport model at various TSRs. To accurately study the tip vortex formation, the grid which had a substantial effect on the vortex evolution was concentrated in the rotor blade area, as shown in Figure 9. The vortex structure distribution was more complex with the span wise direction at a lower TSR and the tip vortex had an extended dissipation distance at a high TSR. Moreover, the average wind velocity results demonstrated a small value beside the blade and large value behind the blade tip, due to the vortex effect.
Small VAWTs can be easily integrated into urban areas for decentralised power generation. Due to its size, it is generally considered to be sufficiently quiet assuming that its utilisation in urban environments means that the noise output will hardly exceed that of the surroundings, hence only a small number of work has studied its noise output. However, it is still important to conduct noise prediction during the early stage turbine design so that its integration into urban environments can be approved. Botha et al. [45] developed on optimised technique for calculating aerodynamically produced noise by a small VAWT. This technique enhances the current prediction of noise and integrates currently established aerofoil prediction models. The self-noise methods and inflow turbulence were considered. Time-dependent CFD simulations were conducted to calculate or the aerodynamic solution and noise predictions were reliant on the input data. The analytical flow approaches were also compared against the CFD results to quantity errors in the previous method. The results showed that the dominant source of noise was the inflow turbulence. The work concluded that the integration with CFD enhanced the prediction accuracy when compared with analytic methods. While Ghasemian and Nejat [46] and Wasala et al. [47] also employed CFD but using LES to predict the flow field in combination with FW-H or Ffowcs Williams and Hawkings method to predict the generated noise by a wind turbine at different tip speed ratios.
Several recent studies (Bremseth and Duraisamy [48], Dabiri [49], Giorgetti et al. [50]) suggested that unlike HAWTs, VAWTs demand less stringent spacing requirements and optimising the positioning and rotation (co-/counter-rotating) of the closely spaced multi VAWT arrangement, could lead to improved performance. Giorgetti et al. [50] used CFD to investigate the enhancement in power that can be achieved by setting medium to high solidity and thus low TSR Darrieus micro turbines in close proximity. CFD simulations were conducted to assess the aerodynamic interferences in two- and four-rotor formations as shown in Figure 10. In addition, the performance of counter-rotating and co-rotating arrangements was compared. The results of the simulations demonstrated a rise in production of around 10% as compared to an isolated turbine. The study concluded that acceleration of the freestream flow among the turbines was the reason of the improvement of power extraction through re-energisation and contraction of the turbine wakes.
A similar CFD study was conducted by Zanforlin and Nishino [51] to investigate the enhancement of power generation due to the pairing of counter-rotating VAWTs. They concluded that two main mechanisms contribute to the power increase of a side by side counter-rotating VAWTs: (1) modification of lateral velocity in the windward pathway due to the existence of the adjacent wind turbine and (2) wake contraction in the downwind path. Ghasemian et al. [52] emphasised that the grouping of VAWTs results in distributed flows downwind of rotors with reduced wind speed and the optimum arrangement can enhance the power generation.
Table 1 summarises the different CFD studies on wind turbines in the micro to small scale including augmentation using guide vanes and shrouds, blade profile modification optimisation, wind turbine wake interaction, aeroacoustics of wind turbines, unsteady wind flow conditions and self-starting characteristics. The effects of different geometrical and operating parameters including tip speed ratio, blade number and blade shapes, wind speed, solidity on the wind turbine performance and self-starting characteristics were investigated. Several studies highlighted the importance of CFD in accelerating the design process of micro to small scale wind turbines and bringing down the overall cost of design. Many research on micro to small scale wind turbines have used CFD for designing the blades and computing the forces acting on it. Various numerical models were established over the years to accurately simulate the aerodynamic performance of micro to small scale wind turbines. The numerical models can be mainly categorised into stream-tube, vortex method and CFD modelling. Many of the CFD studies carried out used low order models including the k-epsilon, SST k-ω, or Spalart–Allmaras models and few investigations used models such as LES and Reynolds Stress Transport models. Few studies have studied the noise output of small scale wind turbines. Several studies have employed CFD to predict the turbulent flow field in combination with analytical method to accurately predict the noise generation by a wind turbine.

3. Building Scale

There has been renewed interest by architects, built environment engineers, developers and governments regarding the installation of wind turbines into urban or built environments due to their capability to provide delocalised power which could provide a solution to the increasing urbanisation and renewable energy demand and interest in low energy and sustainable buildings [53,54]. Wind turbines positioned at the rooftop of a tall building to extract wind energy, in theory, could take advantage of a higher area of the wind velocity profile (see Figure 11) which is not significantly affected by the surface roughness [55,56]. Prominent examples include, the World Trade Centre in Bahrain, Strata Tower in London, and Pearl River Tower in Guangzhou which have building-integrated wind turbines [57].
Currently, there are several challenges to installing wind turbines in urban areas, particularly turbines near an urban environment. The main challenge is the availability of adequate wind resource in these environments. The wind conditions in urban areas are highly complex due to surface roughness and the presence of obstacles, i.e., buildings and structures, characterised by low wind speed and high turbulence which are not desirable regarding power production by WTs [58,59]. Furthermore, the wind turbines in buildings also raise other concerns such as aesthetic dissatisfaction, vibration and aerodynamic noise [60].
Several researchers have employed CFD modelling to establish the feasibility of building integrated turbines. CFD can investigate how the wind flows over a building, the effect of the speed, direction and turbulence of flow and the interference effects of surrounding buildings or structures. It is important to carefully assess the position of the WT on a building so that the great volume of power can be gathered. Figure 12 illustrates examples of the incorporation of large scale wind turbines (roof, between buildings, within the structure) and small-scale wind turbines into buildings.
Ayhan and Sağlam [20] conducted an investigation of wind turbine installations in buildings using CFD modelling. The wind flows and aerodynamics were examined according to the local meteorological data and local buildings features. To achieve the greatest potential resource of wind energy and prevent turbulent places, CFD was used to simulate the annual wind flows with buildings to assist in locating, analysing, and designing wind turbines around and on buildings. The work highlighted that the height of mounted WT was essential as wind can be extremely strong at rooftop height. Moreover, smaller VAWTs are more advisable to use in urban areas. The typical Darrieus WT was not suitable because it was observed to be too noisy, while the Savonious rotor has the drawback of low power levels. Through improvement of the initial design of Darrieus by decreasing the TSR, the noise can be minimised.
The size of WTs for building integration is constrained by the available space. To highlight this issue, a number of studies have tried to increase power by forcing air through a duct with a turbine which accelerates velocity and increases the kinetic energy of the air. This acceleration can also be attained by locating the wind turbine between two buildings. These increases in wind velocity occurring between two buildings are also known as the Venturi effects [61] or building augmented wind turbine (BAWT) [62]. Heo et al. [63] conducted CFD analysis of a 110-kW BAWT with different reference wind speed and flow angles. Figure 13 shows the structure of the wind turbine and sky bridge on the buildings. The turbulence model used was the RANS-SST. Results showed that aerodynamic power production of 110 kW BAWT was more compared to 110 kW stand-alone WT because of the concentration effect produced by the wind acceleration among buildings when flow angle is between −30 and 15°. Because of the steady rotational direction of the WT, the impact of flow angle showed unsymmetrical nature.
A similar study by Chaudhry et al. [64] also used CFD to analyse the efficiency of BAWT but focused on the shape or structural morphology of the building. The performance of the turbines integrated into buildings with triangular, square and circular cross-sections (see Figure 14) was analysed and compared with a benchmark model which was based on the Bahrain Trade Centre. Based on the simulated conditions, the results showed that the circular building shape was the most effective orientation, particularly in the areas with a dominant wind direction. Wang et al. [65] established the relationship between potential of wind energy and two perpendicular building configurations (converging and diverging) by conducting CFD analysis. The results showed that, in a converging configuration, the wind energy potential at the rooftop normally increased when the corner separation became bigger, while in a separating configuration, it decreased gradually with corner enlargement. Veena et al. [66] conducted research on the optimal sitting of wind turbines with high rise buildings using CFD simulations. Two configurations were compared: wind turbines in between twin towers and building with roof top wind turbines. The use of realistic wind profiles gathered from a weather projection model was the focus of the study. Results have shown that for a standalone high-rise building, there was a substantial fraction on which winds were enough to be used in wind power production. In the case of twin buildings, WTs wind can be positioned also in between the buildings and not only at the roof top. The velocity of 2 m/s can be achieved for a separation distance of fraction 0.2 and 2–2.8 m/s for 0.5.
Locating a roof-mounted wind turbines where there is a significant separated zone will subject the WT to low wind velocity and positioning it where there is high turbulence intensity could cause early blade failure. Hence, CFD simulation of the wind flow around the building rooftop with wind turbines could help mitigate the issues during the early stages of the design. Ledo et al. [10] studied the wind flow characteristics around three typical suburban roof profiles including flat, pyramidal, pitched roofs.
The wind flow in such areas was simulated using CFD based on SST k-ω turbulence model and to search the most effective and efficient turbine place of installation. Findings showed that power outputs of WT installed on flat roofs were more consistent and with higher power as compared to some roof profiles. The work of Balduzzi et al. [55,67] presented a comprehensive CFD analysis of the suitability of rooftop installation of Darrieus wind. The effects of geometric proportion, roof shape, and building height on the performance were evaluated. Padmanabhan [68] used CFD to investigate the feasibility of wind turbines on an adjustable roof to increase power production and wind velocity of small WTs positioned in urban environments.
A CFD study was conducted by Abohela et al. [69,70] to investigate wind flow on top of six different roof shapes including vaulted, flat, gabled, wedged, domed, and pyramidal roofs, to identify the most efficient location of the WT and the most efficient roof shape for installing WTs, as shown in Figure 15. Results showed that the vaulted roof was the most effective roof shape as the WT generated 56% more electricity compared to a stand-alone WT at the exact place with similar flow settings. In contrary, the wedged roof showed the least accelerating effect on wind on top of it. The Tabrizi et al. [71] study also investigated the performance of a WT installation on a rooftop of a warehouse using CFD. The analysis also included the surrounding buildings to a radius of 200 m.
Although many studies [72,73,74,75] have shown that Large Eddy Simulation (LES) presents better agreement with experiments than RANS in particular when predicting the behaviour of the separated flows around buildings, its computational cost for modelling full scale geometries is very high. Hence RANS models are still widely used. Toja-Silva et al. [72] performed CFD simulations based on several RANS turbulence models of the airflow around different types of roof-mounted wind turbines (HAWT, VAWT and ducted). The focus was to replicate actual measurements data for both airflow velocity and turbulence kinetic energy around the roof of a building. The work provided guidelines on the optimum positioning of wind turbines on top of an isolated building model. Mohamed and Wood [73] modified the standard k-ε model by developing new formulation of the eddy viscosity and compared with previous modifications designed for stagnation regions around buildings. The results showed that the developed model provided more accurate k values and displayed comparable results for stream-wise mean velocity predicted by the SST model. Furthermore, combination of the developed model and eddy viscosity model provided the most accurate estimation of the velocities and turbulence. Many of the RANS models showed substantial over estimation of the k or normal stresses at the windward side of the building while other RANS models that accurately reproduced the windward side k or normal stresses showed significant under estimation of the k or normal stresses above the centre or leeward side of the building [74].
Toja-Silva et al. [75] expanded their work by studying the impact of roof solar panels on wind turbines. The solar panels were simulated with tilt angles of 10–30°. The study highlighted that the recirculation vortex among the upstream edge of the roof and the first array of solar panel had the highest velocity and the study recommended to position the Vertical Axis Wind Turbine in a horizontal position inside this vortex.
Wang et al. [76] studied the effect of different forms (flat, trough, double-pitched, gable) of a canopy roof on the airflow over the roof and the potential wind energy generation using CFD simulation. The results showed that under the flat type canopy there is minimal amplification of wind energy amplification. The addition of an overhang to the upstream of the flat canopy slightly improved the wind concentration under the canopy, however, it was disadvantageous for the region above it (no concentration of wind). The trough configuration showed improved wind concentration compared to the flat type mainly under its canopy while the gable configuration mainly above its canopy. The double pitched type with a 20° pitch angle was found to be the best in terms of wind concentration.
CFD was used to evaluate the impacts of heights and simple house shapes on the air flow reaching wind turbines in the study of White and Wakes [77]. Municipal governments in New Zealand have authority to impose height of the building constraint in rural areas, including the WTs. Currently, there is no sufficient information to understand which height limitations may reduce wind resource use by small WTs placed in these areas. The study found that permitted structure height is not high, forcing either acceptance of sub-optimal turbine output or length planning consent process. Municipal governments can minimise the barriers to small wind turbine installation through taking taller towers into account, in the range of 15–20 m. This range is transferrable to all rural area, where a small number of small turbines are recognised for installation near dwellings.
Several studies focused on the impact of surrounding buildings on the performance of BIWT [78,79,80,81,82]. Zhou et al. [19] focused on finding the most efficient and effective design that could accelerate the speed of wind flow for wind turbines in low-rise residential buildings. Figure 16 shows an example of the wind amplification effect of the designed building shape in a sample building. According to the assessment between different building shapes and CFD assessment using Phoenics software, the building shape of composite prism can enable the harvesting of most of the wind power. The tested building shape was later tested in a simulated environment of a residential area in China. The long-term community system, local wind conditions, and the comfort level needed were all considered in the simulation model. The result of the study showed that using wind energy harvesting in low rise residential buildings by adopting the proposed building composite prism shape has a great potential.
Micro sitting of wind turbines installed at the rooftop in an urban environment was investigated in Wang et al. [81] study using CFD simulation to analysed the wind turbulence behaviours on the Engineering and Technology Building (ETB) on campus according to the urban ABL inflow, and the outcomes were validated by lidar measurements. The micrositing method of roof mounted WT was developed based on the CFD simulations that contains accurate and preliminary micrositings. The results suggested that the optimum installation height was 1.51–1.70 times theheight range of building and the best locations were at the front position where the acceleration of the wind reaches the maximum, as the wind direction changes. The methods proposed in this study could offer a viable schem for micrositing of WT installed at the rooftop in urban areas.
Sunderland et al. [6] presented two models which can consider issues such as wind velocity variation and how it affects the turbine and wind velocity variation which are entirely based on the standard deviation within successive 10-min time intervals and observed mean wind speed. These approaches were based on turbulence intensity, appreciation of the standards metric, and in conjunction with the power curve of a 2.5-kW WT. The first method was an adaptation of a model based on the initial results to measure the loss of power performance of turbines with the use of Gaussian probability distribution to stimulate turbulence. The second method overcomes these barriers by the novel application of the Weibull Distribution. The first and second models were assessed at suburban and urban locations in Ireland, where sonic anemometry was installed at around 1.5 times the standard height of the buildings at particular areas. According to the results of the investigation, it was suggested that both methods can replicate this.
Yang et al. [82] developed an assessment methodology based on CFD to identify the potential mounting locations of WTs and calculate the generation while considering the impact of the local terrain. The CFD model was validated with field experiments and the results of the realisable k-ε model agreed well with the experimental data. The authors highlighted the difference between the method they proposed and those recommended in the literature which had flaws in offering optimum mounting locations in small-scale environments.
Several authors [83,84] explored the potential of unconventional methods of incorporation of wind energy systems into the built environment. Park et al. [83] proposed and assessed a BIWT systems incorporated into the building façade which combines a series of guide vanes to re-direct and accelerate the wind into a rotor. The work used CFD to simulate and optimise the system configuration which was also validated by scaled experiments. The results showed that the system can accelerate the wind velocity to satisfactory levels and, therefore, increases power production. Hassanli et al. [84] used CFD modelling to assess the characteristics of the flow in a Double-Skin Façade (DSF) system with openings for harvesting wind energy in high rise buildings. The model was assessed with wind tunnel experiments and a good agreement was found between the results (15% discrepancy). The results showed that the uniformity of the flow improved while the turbulence progressively decays as the flow progressed through the DSF cavity.
Table 2 summarises the different CFD studies on building integrated wind turbines in urban areas. The studies highlighted the complex wind conditions in urban areas which presents major challenges for the installation of WTs. The wind conditions in urban locations are very complex due to surface roughness and the presence of obstacles, i.e., buildings and structures, characterised with low wind speed and high turbulence which are not desirable with regards to power generation by wind turbines. Also, there is uncertainty and limited understanding regarding how the turbulence within urban areas affects the WT effectiveness. Several researchers have employed CFD modelling to establish the feasibility of roof- or building-integrated turbines. CFD was utilised to study how the wind flows on a building or a roof, the effect of the speed, direction and turbulence of flow and the interference effects of surrounding buildings or structures on the wind turbine. Many studies used CFD simulation on WTs integrated in a building to understand the wind flow around the building and use the result to optimise the positioning of the wind turbines and maximise the power generation. Similar to the small-scale wind turbines, many of the CFD studies used low order models and few investigations used models such as LES and Reynolds Stress Transport models.

4. Large Scale

The primary aim of a wind farm is to maximise energy production and at the same time reduce the cost. Power generation of a wind farm is reliant on the wind speed, which is reliant on atmospheric conditions, terrain landscape, and upstream wakes of the turbine. The loss of power production because of the wake intervention of upstream wind turbines, namely wake losses can reduce the yearly energy production of a wind farm by 10–20% [85,86]. CFD simulation is an important tool in wind farm layout optimisation and allows the examination of potential wind turbine sites to be carried out in advance [86]. CFD models such as actuator disk and line have been developed to simulate complex wake phenomena and their interactions with terrain. For the actuator disk and line approach, the modelling of the turbine is carried out by imposing aerodynamic forces through a disk representative of the rotor or lines representative of the blades. A more accurate simulation of the aerodynamic effects is the direct blade modelling approach [87] in which the geometry of the wind turbine is incorporated into the domain. However, these simulations are computationally expensive and must be used sparingly during the wind farm optimisation process. Studies on detailed wind farm-ABL simulation and turbine-wake interactions based on LES have increased over the years. While it is computationally expensive for LES to resolve all the complete flow physics in wind farm simulations, such as the blade boundary layers, it does lead to quite accurate predictions of wakes. However, LES modelling of wind farms involves extensive computational times (several hours to days for a single condition) and, hence, require super-computing. Hence, LES models are not useful for the purpose of wind farm layout optimisation.
Traditionally, wind farm layout is designed based on simple rules that lead to regular, straight-lined layouts, where turbines are often organised in identical rows and separated by a large distance. It is a very challenging task to have several design objectives and constraints due to multiple wake phenomena. Many researches have reported that irregular layouts result in a higher expected energy production than regular grids [86]. There are three main issues that are vital for the wake behaviour, these include the yaw angle, energy extraction, and atmospheric stratification. During evaluations and generalisations of models, knowledge of the behaviour of full-scale turbines plays a significant factor. The blade’s design will create a specific wake that will be unique for every turbine, so the momentum transport in the wake will also be unique. Examinations of the near wake of full-scale turbines are important to simplify the results from far wake measurements on these devices [88].
The cost of onshore wind turbine energy production is amongst the lowest, although it is often positioned in complex terrains where there is uncertainty in terms of the available wind resources due to the surrounding topography [86]. Full-size turbines in a complex topography was studied by Castellani et al. [3] using CFD and experiments. The aim of their research was to test the vibrations at the structure and drive train level. Figure 17 demonstrates the inter-turbine distance and layout of the sub-cluster in in the study. The data was gathered through the on-board situation examining system were assessed and considering wind situations and working constraints gathered by the supervisory control and data acquisition (SCADA) [89,90]. CFD simulation was used, which allowed for better interpretation of the vibration assessment. The most important result was the interpretation of how wakes and flow turbulences appear in the vibration signals, at the structural and drive train levels. Hence, this wind to gear system created links among flow and mechanical phenomena in the aspect of vibrations, indicating an important tool for analysing loads in various working conditions. In another study, Castellani et al. [91] investigated the combined impact of wakes and terrain-driven flow on the performance of WT. The subcluster of four turbines in a very complex terrain was evaluated through CFD simulations and experimental SCADA data mining. Researchers within the Project Wakebench developed a framework for the evaluation of wind farm flow models operating at the micro-scale level. The study [92,93] highlighted the verification and validation method applied to wake models of wind farm including benchmarking and data processing methods for SCADA datasets.
The neutral atmospheric and wind turbine wind flow over complex terrain were examined by Makridis and Chick [94] using CFD Fluent software. An actuator disc model built based on the BEM Theory was used for the model of the rotor effects. The 3D RANS calculations with RSM was used to investigate the atmospheric turbulence. The results have shown that predicted wake deficit was in good agreement with the measurements at hub height. Also, few discrepancies were shown in the vertical velocity deficit profile, it is due to the CFD model overestimating the wake deficit above the turbine axis by the maximum 17.5% and underestimated near the ground by a maximum of 30%. Wake turbulence was also over predicted by 13% to 14% close to the wake centerline by 2.5 and 4D downwind, and 20–23% at 6D and 7.5 downwind.
Yan and Li [95] proposed an integrated CFD/on-site measurement-based method to simulate the spatial changes of wind velocity for different areas with complex terrains. Figure 18 shows the methodology for potential wind energy assessment. The wind resource assessment involved statistical analysis, CFD simulations and on-site measurement. Also, a case study on wind resource assessment for an offshore island with complex terrain structures was equipped with anemometers for long-term wind measurement was implemented. A detailed wind resource map of the offshore island was achieved over the wind data from a single measurement site coupled with the simulations and showed a great use for future wind farm sitting and turbine micro-sitting.
The study of Nedjari et al. [96] focused on the WT wake evolution in a wind farm over complex and flat topography. The aerodynamic, nonlinear interaction among the wind farm terrain and rotor wake was modelled using the Hybrid technique and CFD with the actuator disk model. The initial CFD calculations were carried out for flat topography by changing the WT hub height. For the second arrangement concerning the complex terrain, the suggested hybrid technique was adapted to local wind field greatly disturbed by the topography singularities. The flow field gathered at the hub level was analysed and applied to define the corresponding actuator disk model. The results gathered from different cases provided remarkable information about wind farm layout.
Kuo et al. [84] proposed an algorithm that combines mixed-integer programming (MIP) and Computational Fluid Dynamics (CFD) to optimise wind farm layouts for complex topographies. The MIP solvers’ ability to search solutions was essential for capturing the effects of optimised wake deficit projections on the quality of wind farm layout solutions. The recommended algorithm was used on a wind farm area in Canada. The results have shown that the proposed algorithm can produce great layouts in complex terrains.
Wang et al. [97] proposed a novel computational optimisation strategy to take into account the effect of wind velocity differences on irregular land plot boundary and non-flat terrain (Figure 19). The irregular boundaries were addressed over a novel constraint handling strategy in an open coordinated optimisation formulation. While the standard analytical wake simulations were improved through a wind multiplier, gathered from the simulation software, to account for the effect of variations in altitude. This approach was used for actual wind farms with great different altitude: The Grasmere, Albany and Gokceada Island wind farm. The Grasmere and Albany wind farm demonstrated less reduction in cost of energy on conventional optimisation. This inconsistency can be attributed to the wind behaviour in each site. While the augmented Gokceada wind farm layout showed significant reduction of energy cost when topography was taken into consideration. The Gokceada wind farm has a steady wind direction and the optimisation may use topography to prevent wake interactions. In contrast, the Grasmere and Albany wind farm with unsteady wind directions shows no clear strategy to get rid of wakes when using topography. As a result, this shows that recognising wind farm topography can produce great advantages and the wake interactions can significantly decrease by positioning the wind turbines carefully where strong narrow wind direction is present.
The work of Dhunny et al. [98] investigated the mean wind power predicted through the WindSim tool with on-site computation from nine meteorological positions all over a very complex topography at various heights. The research focused on in depth examination of different computational parameters such as the turbulence models, grid dependency test, the order of the Standard k-ε, k-ε with Yap corrections, RNG k-ε and Modified k-ε and the iterative convergence standards. The results have proven that WindSim is an effective tool to investigate the wind flow in a very complex topography with acceptable accuracy. The model was employed to investigate feasibility of major wind farm hot spots in Mauritius. The tool produced wind maps at various heights which can be applied in the process of farm decision making.
Akin and Kara [99] investigated the potential of wind power in the coastal region in Turkey. The study focused on searching for the feasible location for installing the wind power plants in the shore of Turkey. In order to convince the policy makers and investors for developing wind potential of the area, a wind power plant feasibility research for Gemlik area linked to Bursa was shown through using WindSim CFD tool. The annual production of energy and capacity factor measured, and power and energy curves of chosen wind turbines were obtained as output. The findings showed that through using Vestas V90 WTs in Gemlik Narki area, institution of an economic wind power plant that has forty gigawatt hours per year annual energy production volume was viable.
Troldborg et al. [100] assessed the wake interaction among two turbines in various inflow situations with the actuator line strategy and full Navier–Stokes equation calculations. The work compared the results for changing distances among the WTs. Moreover, simulations were used at various degrees of ambient turbulence intensity presenting laminar, onshore, and offshore situations. The results showed a complicated wake interaction process in which the individual wakes initially were visible with the mixed wake structure, however, further downstream effects were created into what was recognised as a single far wake where the axial velocity follows a nearly Gaussian shape. Therefore, the simulations showed potential in providing more understanding about the wake interaction phenomenon and in what way it affects the exterior aerodynamic loads on WTs.
Schulz et al. [101] investigated various methods of incorporating a WT including the nacelle, hub, fully meshed blades and tower in a complex topography area as shown in Figure 20. The research focused on the challenges of meshing the WT in a complex terrain and how to overcome them. The simulation process started with a benchmark flat terrain model with uniform flow and then was increasingly made complex by increasing atmospheric turbulence to a model of a spinning three-dimensional WT. The complex terrain showed three major effects including a mean wind speed increase and as a result load and power increase, a correlation between the inclination angle and load and power behaviour and increase of turbulence and consequently of load and power fluctuations.
Schmidt and Stoevesandt [102] examined the flow over several types of hill geometries using RANS CFD models. The results for every hill studied were transformed into numerical models that converted arbitrary uninterrupted inlet flow behaviour by rescaling the obstacle effects. The result of these models were analysed by comparing them to the full results of CFD; initially for the ABL flow and later a single WT wake in the presence of a hill. The incorporation of such models into the flapFOAM wind farm software was investigated, developing their inclusion to a complete modular wind farm layout optimisation procedure.
The effect of atmospheric stability on a WT wake was investigated numerically and experimentally in the study of Machefaux et al. [103]. The modelling was conducted using the actuator disk rotor and large eddy simulation. The model was validated using data obtained from full-size experiments based on pulsed lidar calculations of the wake flow ground of a stall with 500 kW WT and a reasonable agreement was observed between the results. A spectral tensor model with buoyancy effects was developed and employed to adapt turbulence interaction of the approaching wind flow to the thermal stratification. Discrepancies were studied for future model advancement.
Liu et al. [104] examined a wind farm in southwest China in a mountainous area using numerical CFD modelling. A newly developed actuator disk technique using rotor data which includes blade geometry data, pitch and attack angle was employed to examine the flow behaviour of the wind farm, specifically the developing wake beside the WTs. When comparing the in situ measurements and actuator disk technique, the newly developed actuator disk method demonstrated better agreement with the measurements. The results showed that the stable simulation integrated with optimised actuator disk method was capable of evaluating the wind resource very well and provided better balance among accuracy and efficiency compared to costly computation methods including actuator-line/actuator-surface transient models, or a less accurate approach including the linear velocity reduced wake model.
Politis et al. [105] used CFD methods to estimate the full wind farms production in complex topography and investigate the development and patterns of wake flow. The work used two types of solvers; in-house developed CRES–flowNS and FLUENT’s CFDWake and CFD Navier–Stokes solvers to evaluate the large wind farm performance. Without any wind turbines, similar results were obtained from both models while significant variances increase when wind turbine modelling was presented. The prediction of CFD wake was satisfactory, although the method was only possible when the direction of wind is almost upright to the wind turbine rows. The CRES–flowNS employed two types of approximations for estimating the reference wind velocity which needs a single calculation for the full wind farm.
A study of wind farm layout optimisation on a Gaussian hill was presented in Feng and Shen [106] research. Jensen wake model and CFD simulation were combined and an RS algorithm was employed to optimise the power production of a wind farm, taking account of wind farm boundary restraint and minimal distance constraint among any two wind turbines. It was shown in the case study that the optimised approach had a promising performance in various conditions. While in practice, it is usual to apply an expert guess layout for improvement of a wind farm that is highly based on wind resource and not on appropriate wake modelling. This study concluded that layout development issues in complex topography must be examined through further realistic problem formulation and effective numerical computations. The Jensen Wake model also required further adjustments and validations.
Parada et al. [107] focused on the approach of designing highly efficient wind farms, which was further compared to different arrangements of standard arrayed layout considering a number of wind turbines and different spacing. This method maximises the wind farm power and efficiently integrates the use of real wind data and irregular terrain boundaries. It was found that standard arrayed wind farms were sub optimal and can produce high wake losses, especially for some wind directions. For this approach, 4.09% and 2.18% higher efficiencies were gathered compared to staggered and aligned layouts.
Table 3 summarises different CFD studies on the simulation and optimisation of large size WT and wind farms. The wind farm layout optimisation on terrains has been addressed by many studies through a number of strategies; but currently, optimising wind farm layouts on complex topographies is very difficult because of missing computationally manageable and accurate wake models to assess the wind farm layouts. CFD models such as actuator line and disk have been used to simulate the interaction with challenging topographies and wake occurrences although these methods are computationally expensive and must be used economically during the process of optimisation. Methods proposed for large wind farms were able to see wake width to a certain level and reduction of power output around the wind farm. In spite of few uncertainties, it showed a very promising approach which allows to consider the slowdown in large wind farms. It was also seen that simple methods of location assessment make it possible to remove estimations of the future WT behaviour. Complex topography conditions showed great effects such as turbulence increase and, as a result, load of power fluctuation, a mean wind speed increase and, consequently, power and load rise, and relation among the power behaviour and inclination angle. Moreover, the research about wind farm layouts obtained using guess methods from the experts were very different compared to the optimum ones that result in a great area of improvement for wind farm layout optimisation. The turbulence intensity and velocity behaviour depend on the complex terrain, which creates a more reliable experimental assessment important to validate the micrositing layout. The losses of power production due to the wake effects simply reach 20%of the overall power. The turbulence and atmospheric inflow turbulence produced in orographic variations and interaction among atmospheric turbulence and WT in the case of wind farm concerns. Further study in improving the novel approach for Wind Farm Layout coupled with mathematical programming with CFD simulations of the wake behaviour is necessary to examine the scalability of the algorithm to greater issues concerning wind farms with more potential wind turbine sites.

5. Summary and Conclusions

Wind power is one of the most rapidly growing renewable sources of energy and with the decreasing costs due to advancements in technology and manufacturing, the rising concerns over energy security and environmental issues, the trend is expected to continue. CFD modelling has been widely used by several researchers to predict the wind energy systems’ performance over the last few decades. With the growing computing capacity of modern computers, CFD modelling became a significant tool to numerically investigate the wind flow within the investigated site conditions. As a result, tools and methods to measure and optimise the performance of new innovative sources of wind energy must also continue to advance. Current developments in wind turbines using CFD simulation have shown progress from flow modelling of flow around two-dimensional aerofoils to ABL flow by wind turbine arrangements or wind farms.
This paper reviewed recently published studies (2010–2018) on CFD simulations of micro to small wind turbines, buildings integrated with wind turbines, and wind turbines positioned in a wind farm. Guidelines and recommendations were investigated for numerical schemes and algorithms, computational domain size, turbulence modelling, and spatial and temporal discretisation. Current development of CFD simulation of wind turbine systems and different variables affecting its performance such as wind turbine wake interaction in wind farms, blade profile, augmentation using guide vanes, dynamic stall control and self-starting characteristics were discussed.
Although current CFD models already perform well in predicting and optimising the performance of small scale wind turbines (much better than simpler methods) the complex nature of turbulent flow means that continuous improvement of models would be an ongoing challenge. Several studies have highlighted the importance of CFD in accelerating the design process of small scale wind turbines and bringing down the overall cost of design. Different numerical models were developed over the years to accurately predict the aerodynamic performance of small scale wind turbines. Many of the CFD studies used low order models including SST k-ω, k-epsilon, or Spalart–Allmaras models and few investigations used models such as LES, DES and Reynolds Stress Transport models. Complexity and computational cost are still noted as the main obstacles when using high-fidelity models, hence, RANS models are still widely used. For the simulation of wind turbine in buildings, many of the RANS models showed substantial over estimation of the k or normal stresses at the windward side of the building while other RANS models that accurately reproduced the windward side k or normal stresses showed significant under estimation of the k or normal stresses above the centre or leeward side of the building. More research should also be focused on conducting and validating unsteady and transient simulations of wind turbines which also requires additional computational effort.
Studies have shown that the integration of CFD modelling with other tools such as wind tunnel or field measurements could provide a solution for the assessment of wind power in complex conditions. Combining CFD with other tools like blade element momentum has also proved effective for investigating the wind turbine performance. Most of the micro to small wind turbine used the traditional BEM theory for designing the blades and computing the forces acting on it. Complex conditions, specifically in urban areas, present great challenges for the installation of small turbines. The wind conditions in urban locations are very complex due to surface roughness and the presence of obstacles i.e., buildings and structures, characterised with low wind speed and high turbulence which are not desirable with regards to power generation by wind turbines. Also, there is uncertainty and lack of understanding regarding how turbulence under urban areas which contribute to the effectiveness of the wind turbine. Several researchers have employed CFD modelling to establish the feasibility of roof- or building-integrated wind turbines. CFD was utilised to examine the effect of the speed, direction and turbulence of wind flow and the interference of surrounding buildings or structures on the wind turbine’s performance. Although many studies have shown that Large Eddy Simulation (LES) presents better agreement with experiments than RANS when predicting the behaviour of the separated flows around buildings, its computational cost for modelling full scale geometries is very high. Hence, RANS models are still widely used. Many of the RANS models showed substantial over estimation of the turbulence kinetic energy or normal stresses at the windward side of the building while other RANS models that accurately reproduced the windward side turbulence kinetic energy or normal stresses showed significant under estimation of the k or normal stresses above the centre or leeward side of the building. More research should also be focused on conducting and validating unsteady and transient simulations of wind turbines which also requires additional computational effort. The lack of available experimental data for wind turbines installed in urban areas makes it difficult to validate the CFD modelling and compare the viability of different BIWT. Although some small-scale wind turbines already show good results, it should be further optimised for urban applications. Power augmentation concepts around standard wind turbines promise performance increase and, hence, should be further investigated. Furthermore, more research should be focused on the noise output of small scale wind turbines. Several studies have employed CFD to predict the turbulent flow field in combination with analytical methods to predict the noise generation by a wind turbine.
Methods proposed for large wind farms were capable of capturing wake width to some level and reduction of power production within the wind farm. In spite of few uncertainties, it showed a very promising approach which allows to consider the slowdown in large wind farms. It was also been seen that simple methods of location assessment make it possible to extract estimations on later behaviour of the turbines. The complex topography conditions showed main effects such as turbulence intensity increase and as a result load of power fluctuation, a mean wind speed increase and consequently power and load rise, and connection among angle of inclination and power behaviour. Moreover, research about the layouts gathered using expert guess methods were far from the optimal ones, which leaves large areas of improvement for wind farm layout optimisation. The turbulence intensity and velocity profiles vary over the complex terrain, which makes an accurate experimental assessment important to validate the micrositing layout.
The optimisation of wind farms using CFD has received much attention in the literature. The wind farm layout optimisation on terrains has been addressed by many works through a number of strategies; but currently, optimising wind farm layouts in a complex topography is complicated because of the absence of tractable computations and accurate wake simulations to assess wind farm layouts. CFD models such as actuator line and actuator disk have been developed to investigate the interaction with complex terrains and wake occurrences though these methods are computationally expensive and must be used economically during the process of optimisation. Studies on detailed wind farm-ABL simulation and turbine-wake interactions based on LES have increased over the years. While it is computationally expensive for LES to resolve all the complete flow physics in wind farm simulations, it does lead to accurate predictions of wakes. However, LES modelling of wind farms involves extensive computational times (several hours to days for a single condition) and hence, require super-computing. Hence, LES models are not useful for the purpose of wind farm layout optimisation. However, as computing resource and power increase and as wind turbine modelling further develops, it is expected that LES will become more feasible and continue its transition from academic environment towards the wind industry and research and development laboratories. With improved and more accurate tools, operators of wind farms will maximise their investments, optimally design wind turbines and minimise the upstream turbines’ turbulent wakes.
Future research on the CFD modelling of wind turbines and wind farms should quantify the computational uncertainties associated with the predictions, which is not only a result of errors with discretisation and turbulence modelling but the variables, assumptions and set boundary conditions such as the blade and topography geometry, atmospheric inflow, stratification, etc. This would enable the fair comparison with experiments and show the areas that require improvement. Furthermore, future work should provide more details on the required computational cost for the different optimisation methods and wind farm dimensions. In addition, more research should be focused on the calculation of the energy production of wind farms in complex terrains.

Author Contributions

All the authors have contributed extensively to the presented investigation. K.C. conducted a comprehensive literature review on small scale and building scale wind turbines and participated in writing. A.A. and F.J. conducted the comprehensive literature review of large scale wind farms and participated in writing. P.N., B.R.H. and J.K.C. participated in the writing of the review.

Conflicts of Interest

The authors declare no conflict of interest.

Abbreviations

ABLAtmospheric Boundary Layer
ANNArtificial Neural Network
BEMBlade Element Momentum
BIWTBuilding Integrated Wind Turbines
CFDComputational Fluid Dynamic
GWGigawatt
DSFDouble-Skin Façade
HAWTHorizontal Axis Wind Turbine
IEAInternational Energy Agency
k-εk-epsilon
k-ωk-omega
kWKilowatt
LESLarge Eddy Simulation
LLFVLifting Line Free Vortex
MRFMultiple Reference Frame
RANSReynolds-averaged Navier–Stokes equations
RNGRe-Normalisation Group
RSMReynolds stress model
SCADASupervisory Control and Data Acquisition
SSTShear Stress Transport
TSRTip Speed Ratio
URANSUnsteady Reynolds-averaged Navier–Stokes equations
VAWTVertical Axis Wind Turbine
WTWind Turbine
2DTwo-dimensional
3DThree-dimensional

References

  1. Global Wind Energy Council (CWEC). Global Wind Report: Annual Market Update; GWEC: Brussels, Belgium, 2014. [Google Scholar]
  2. Gupta, R.K.; Warudkar, V.; Purohit, R.; Rajpurohit, S.S. Modeling and Aerodynamic Analysis of Small Scale, Mixed Airfoil Horizontal Axis Wind Turbine Blade. Mater. Today Proc. 2017, 4, 5370–5384. [Google Scholar] [CrossRef]
  3. Castellani, F.; Marco, B.; Davide, A.; Gianluca, D.; Giorgio, D.; Terzi, L. Wind Turbine Loads Induced by Terrain and Wakes: An Experimental Study through Vibration Analysis and Computational Fluid Dynamics. Energies 2017, 10, 1839. [Google Scholar] [CrossRef]
  4. Pieralli, S.; Ritter, M.; Odening, M. Efficiency of wind power production and its determinants. Energy 2015, 90, 429–438. [Google Scholar] [CrossRef]
  5. Fletcher, T.M. Wind Energy Engineering: A Handbook for Onshore and Offshore Wind Turbine; Academic Press: London, UK, 2017. [Google Scholar]
  6. Sunderland, K.; Woolmington, T.; Blackledge, J.; Conlon, M. Small wind turbines in turbulent (urban) environments: A consideration of normal and Weibull distributions for power prediction. J. Wind Eng. Ind. Aerodyn. 2013, 121, 70–81. [Google Scholar] [CrossRef]
  7. Tummala, A.; Velamati, R.K.; Sinha, D.K.; Indraja, V.; Hari Krishna, V. A review on small scale wind turbines. Renew. Sustain. Energy Rev. 2016, 56, 1351–1371. [Google Scholar] [CrossRef]
  8. Aquino, A.; Calautit, J.K.; Hughes, B.R. Urban Integration of Aeroelastic Belt for Low-Energy Wind Harvesting. Energy Procedia 2017, 105, 738–743. [Google Scholar] [CrossRef]
  9. Chong, W.T.; Wong, K.H.; Wang, C.T.; Gwani, M.; Chu, Y.J.; Chia, W.C.; Poh, S.C. Cross-Axis-Wind-Turbine: A Complementary Design to Push the Limit of Wind Turbine Technology. Energy Procedia 2017, 105, 973–979. [Google Scholar] [CrossRef]
  10. Ledo, L.; Kosasih, P.B.; Cooper, P. Roof mounting site analysis for micro-wind turbines. Renew. Energy 2011, 36, 1379–1391. [Google Scholar] [CrossRef]
  11. Pearson, C. Vertical Axis Wind Turbine Acoustics. Ph.D. Thesis, Cambridge University Engineering Department, Cambridge, UK, 2014. [Google Scholar]
  12. Knopper, L.D.; Ollson, C.A. Health effects and wind turbines: A review of the literature. Environ. Health 2011, 10, 78. [Google Scholar] [CrossRef] [PubMed]
  13. Taylor, J.; Eastwick, C.; Lawrence, C.; Wilson, R. Noise levels and noise perception from small and micro wind turbines. Renew. Energy 2013, 55, 120–127. [Google Scholar] [CrossRef]
  14. Lee, S.; Lee, S. Numerical and experimental study of aerodynamic noise by a small wind turbine. Renew. Energy 2014, 65, 108–112. [Google Scholar] [CrossRef]
  15. Lombardi, L.; Mendecka, B.; Carnevale, E.; Wojciech, S. Environmental impacts of electricity production of micro wind turbines with vertical axis. Renew. Energy 2017. [Google Scholar] [CrossRef]
  16. Greening, B.; Azapagic, A. Environmental impacts of micro-wind turbines and their potential to contribute to UK climate change targets. Energy 2013, 59, 454–466. [Google Scholar] [CrossRef]
  17. Carrete, M.; Sánchez-Zapata, J.A.; Benítez, J.R.; Lobón, M.; Donázar, J.A. Large scale risk-assessment of wind-farms on population viability of a globally endangered long-lived raptor. Biol. Conserv. 2009, 142, 2954–2961. [Google Scholar] [CrossRef] [Green Version]
  18. Peacock, A.D.; Jenkins, D.; Ahadzi, M.; Berry, A.; Turan, S. Micro wind turbines in the UK domestic sector. Energy Build. 2008, 40, 1324–1333. [Google Scholar] [CrossRef]
  19. Zhou, H.; Lu, Y.; Liu, X.; Chang, R.; Wang, B. Harvesting wind energy in low-rise residential buildings: Design and optimization of building forms. J. Clean. Prod. 2017, 167, 306–316. [Google Scholar] [CrossRef]
  20. Aquino, A.; Calautit, J.K.; Hughes, B.R. Integration of aero-elastic belt into the built environment for low-energy wind harnessing: Current status and a case study. Energy Convers. Manag. 2017, 149, 830–850. [Google Scholar] [CrossRef]
  21. Aquino, A.; Calautit, J.K.; Hughes, B.R. Evaluation of the integration of the Wind-Induced Flutter Energy Harvester (WIFEH) into the built environment: Experimental and numerical analysis. Appl. Energy 2017, 207, 61–77. [Google Scholar] [CrossRef]
  22. Aquino, A.; Calautit, J.K.; Hughes, B.R. A Study on the Wind-Induced Flutter Energy Harvester (WIFEH) Integration into Buildings. Energy Procedia 2017, 142, 321–327. [Google Scholar] [CrossRef]
  23. Chaudhry, H.N.; Calautit, J.K.; Hughes, B.R. Design and aerodynamic investigation of dynamic architecture. Innov. Infrastruct. Solut. 2016, 1, 7. [Google Scholar] [CrossRef]
  24. Ayhan, D.; Sağlam, S. A technical review of building-mounted wind power systems and a sample simulation model. Renew. Sustain. Energy Rev. 2012, 16, 1040–1049. [Google Scholar] [CrossRef]
  25. Department for Business, Energy & Industrial Strategy. Energy and Climate Change: Evidence and Analysis; BEIS: London, UK, 2013.
  26. De-Santoli, L.; Albo, A.; Garcia, D.A.; Bruschi, D.; Cumo, F. A preliminary energy and environmental assessment of a micro wind turbine prototype in natural protected areas. Sustain. Energy Technol. Assess. 2014, 8, 42–56. [Google Scholar] [CrossRef]
  27. El-Zahaby, A.; Kabeel, A.E.; Elsayed, S.S.; Obiaa, M.F. CFD analysis of flow fields for shrouded wind turbine’s diffuser model with different flange angles. Alexandra Eng. J. 2017, 56, 171–179. [Google Scholar] [CrossRef]
  28. Wang, Y.F.; Zhan, M.S. 3-Dimensional CFD simulation and analysis on performance of a micro-wind turbine resembling lotus in shape. Energy Build. 2013, 65, 66–74. [Google Scholar] [CrossRef]
  29. Mohamed, M.H.; Ali, A.M.; Hafiz, A.A. CFD analysis for H-rotor Darrieus turbine as a low speed wind energy converter. Eng. Sci. Technol. Int. J. 2015, 18, 1–13. [Google Scholar] [CrossRef]
  30. Mohamed, M.H. Performance investigation of H-rotor Darrieus turbine with new airfoil shapes. Energy 2012, 47, 522–530. [Google Scholar] [CrossRef]
  31. Elkhoury, M.; Kiwata, T.; Aoun, E. Experimental and numerical investigation of a three-dimensional vertical-axis wind turbine with variable-pitch. J. Wind Eng. Ind. Aerodyn. 2015, 139, 111–123. [Google Scholar] [CrossRef]
  32. Bausas, M.; Danao, L.A. The aerodynamics of a camber-bladed vertical axis wind turbine in unsteady wind. Energy 2015, 93, 1155–1164. [Google Scholar] [CrossRef]
  33. Sengupta, A.R.; Biswas, A.; Gupta, R. Studies of some high solidity symmetrical and unsymmetrical blade H-Darrieus rotors with respect to starting characteristics, dynamic performances and flow physics in low wind streams. Renew. Energy 2016, 93, 536–554. [Google Scholar] [CrossRef]
  34. Li, Q.; Maeda, T.; Kamada, Y.; Murata, J.; Kawabata, T.; Shimizu, K.; Ogasawara, T.; Nakai, A.; Kasuya, T. Wind tunnel and numerical study of a straight-bladed vertical axis wind turbine in three-dimensional analysis (Part I: For predicting aerodynamic loads and performance). Energy 2016, 106, 443–452. [Google Scholar] [CrossRef]
  35. Li, Q.; Maeda, T.; Kamada, Y.; Murata, J.; Kawabata, T.; Shimizu, K.; Ogasawara, T.; Nakai, A.; Kasuya, T. Wind tunnel and numerical study of a straight-bladed Vertical Axis Wind Turbine in three-dimensional analysis (Part II: For predicting flow field and performance). Energy 2016, 104, 295–307. [Google Scholar] [CrossRef]
  36. Abdalrahman, G.; Melek, W.; Lien, F.S. Pitch angle control for a small-scale Darrieus vertical axis wind turbine with straight blades (H-Type VAWT). Renew. Energy 2017, 114, 1353–1362. [Google Scholar] [CrossRef]
  37. Howell, R.; Qin, N.; Edwards, J.; Durrani, N. Wind tunnel and numerical study of a small vertical axis wind turbine. Renew. Energy 2010, 35, 412–422. [Google Scholar] [CrossRef]
  38. Stout, C.; Islam, S.; White, A.; Arnott, S.; Kollovozi, E.; Shaw, M.; Droubi, G.; Sinha, Y.; Bird, B. Efficiency Improvement of Vertical Axis Wind Turbines with an Upstream Deflector. Energy Procedia 2017, 118, 141–148. [Google Scholar] [CrossRef]
  39. Arpino, F.; Cortellessa, G.; Dell-Isola, M.; Scungio, M.; Focanti, V.; Profili, M.; Rotondi, M. CFD simulations of power coefficients for an innovative Darrieus style vertical axis wind turbine with auxiliary straight blades. J. Phys. Conf. Ser. 2017, 923, 012036. [Google Scholar] [CrossRef]
  40. Delafin, P.L.; Kolios, N.; Wang, L. Comparison of low-order aerodynamic models and RANS CFD for full scale 3D vertical axis wind turbines. Renew. Energy 2017, 109, 564–575. [Google Scholar] [CrossRef]
  41. Rezaeiha, A.; Kalkman, I.; Blocken, B. CFD simulation of a vertical axis wind turbine operating at a moderate tip speed ratio: Guidelines for minimum domain size and azimuthal increment. Renew. Energy 2017, 107, 373–385. [Google Scholar] [CrossRef]
  42. Klein, A.C.; Bartholomay, S.; Marten, D.; Lutz, T.; Pechlivanoglou, G.; Nayeri, C.N.; Paschereit, C.O.; Krämer, E. About the suitability of different numerical methods to reproduce model wind turbine measurements in a wind tunnel with high blockage ratio. Wind Energy Sci. 2017. [Google Scholar] [CrossRef]
  43. Chowdhury, A.M.; Akimoto, H.; Hara, Y. Comparative CFD analysis of Vertical Axis Wind Turbine in upright and tilted configuration. Renew. Energy 2016, 85, 327–337. [Google Scholar] [CrossRef]
  44. Yang, Y.; Guo, Z.; Zhang, Y.; Ho, J.; Li, Q. Numerical Investigation of the Tip Vortex of a Straight-Bladed Vertical Axis Wind Turbine with Double-Blades. Energies 2017, 10, 1721. [Google Scholar] [CrossRef]
  45. Botha, J.D.M.; Shahroki, A.; Rice, H. An implementation of an aeroacoustic prediction model for broadband noise from a vertical axis wind turbine using a CFD informed methodology. J. Sound Vib. 2017, 410, 389–415. [Google Scholar] [CrossRef]
  46. Ghasemian, M.; Nejat, A. Aero-acoustics prediction of a vertical axis wind turbine using Large Eddy Simulation and acoustic analogy. Energy 2015, 88, 711–717. [Google Scholar] [CrossRef]
  47. Wasala, S.; Storey, R.; Norris, S.; Cater, J. Aeroacoustic noise prediction for wind turbines using Large Eddy Simulation. J. Wind Eng. Ind. Aerodyn. 2015, 145, 17–29. [Google Scholar] [CrossRef]
  48. Bremseth, J.; Duraisamy, K. Computational analysis of vertical axis wind turbine arrays Theory. Comput. Fluid Dyn. 2016, 30, 387–401. [Google Scholar] [CrossRef]
  49. Dabiri, J. Potential order-of-magnitude enhancement of wind farm power density via counter-rotating vertical-axis wind turbine arrays. J. Renew. Sustain. Energy 2011, 3, 043104. [Google Scholar] [CrossRef]
  50. Giorgetti, S.; Pellegrini, G.; Zanforlin, S. CFD Investigation on the Aerodynamic Interferences between Medium-solidity Darrieus Vertical Axis Wind Turbines. Energy Procedia 2015, 81, 227–239. [Google Scholar] [CrossRef]
  51. Zanforlin, S.; Nishino, T. Fluid dynamic mechanisms of enhanced power generation by closely spaced vertical axis wind turbines. Renew. Energy 2016, 99, 1213–1226. [Google Scholar] [CrossRef]
  52. Ghasemian, M.; Ashrafi, N.; Sedaghat, A. A review on computational fluid dynamic simulation techniques for Darrieus vertical axis wind turbines. Energy Convers. Manag. 2017, 149, 87–100. [Google Scholar] [CrossRef]
  53. Li, Q.S.; Shu, Z.R.; Chen, F.B. Performance assessment of tall building-integrated wind turbines for power generation. Appl. Energy 2016, 165, 777–788. [Google Scholar] [CrossRef]
  54. Cao, J.; Man, X.; Liu, J.; Liu, L.; Shui, T. Preliminary assessment of the wind power resource around the thousand-meter scale megatall building. Energy Build. 2017, 142, 62–71. [Google Scholar] [CrossRef]
  55. Balduzzi, F.; Bianchini, A.; Carnevale, E.; Ferrari, L.; Magnani, S. Feasibility analysis of a Darrieus vertical-axis wind turbine installation in the rooftop of a building. Appl. Energy 2012, 97, 921–929. [Google Scholar] [CrossRef]
  56. Walker, S.L. Building mounted wind turbines and their suitability for the urban scale—A review of methods of estimating urban wind resource. Energy Build. 2011, 43, 1852–1862. [Google Scholar] [CrossRef]
  57. Neofytou, P.; Venetsanos, A.G.; Vlachogiannis, D.; Bartzis, J.G.; Scaperdas, A. CFD simulations of the wind environment around an airport terminal building. Environ. Model. Softw. 2006, 21, 520–524. [Google Scholar] [CrossRef]
  58. Chaudhry, H.N.; Calautit, J.K.S.; Hughes, B.R. Computational Analysis to Factor Wind into the Design of an Architectural Environment. Model. Simul. Eng. 2015, 2015, 234601. [Google Scholar] [CrossRef]
  59. Mithraratne, N. Roof-top wind turbines for microgeneration in urban houses in New Zealand. Energy Build. 2009, 41, 1013–1018. [Google Scholar] [CrossRef]
  60. James, P.A.B.; Sissons, M.F.; Bradford, J.; Myers, L.E.; Bahaj, A.S.; Anwar, A.; Green, S. Implications of the UK field trial of building mounted horizontal axis micro-wind turbines. Energy Policy 2010, 38, 6130–6144. [Google Scholar] [CrossRef]
  61. Sharpe, T.; Proven, G. Crossflex: Concept and early development of a true building integrated wind turbine. Energy Build. 2010, 42, 2365–2375. [Google Scholar] [CrossRef]
  62. Petković, D.; Shamshirband, S.; Ćojbašić, Ž.; Nikolić, V.; Anuar, N.B.; Sabri, A.Q.M.; Akib, S. Adaptive neuro-fuzzy estimation of building augmentation of wind turbine power. Comput. Fluids 2014, 97, 188–194. [Google Scholar] [CrossRef]
  63. Heo, Y.G.; Choi, N.K.; Choi, K.H.; Ji, H.S.; Kim, K.C. CFD study on aerodynamic power output of a 110 kW building augmented wind turbine. Energy Build. 2016, 129, 162–173. [Google Scholar] [CrossRef]
  64. Chaudhry, H.N.; Calautit, J.K.S.; Hughes, B.R. The influence of structural morphology on the efficiency of building integrated wind turbines (BIWT). AIMS Energy 2014, 2, 219–236. [Google Scholar] [CrossRef]
  65. Wang, B.; Cot, L.D.; Adolphe, L.; Geoffroy, S.; Morchain, J. Estimation of wind energy over roof of two perpendicular buildings. Energy Build. 2015, 88, 57–67. [Google Scholar] [CrossRef]
  66. Veena, K.; Asha, V.; Shameem, C.A.; Venkatesh, T.N. CFD analysis for siting of wind turbines on high-rise buildings. J. Phys. Conf. Ser. 2017, 822, 012013. [Google Scholar] [CrossRef]
  67. Balduzzi, F.; Bianchini, A.; Ferrari, L. Microeolic turbines in the built environment: Influence of the installation site on the potential energy yield. Renew. Energy 2012, 45, 163–174. [Google Scholar] [CrossRef]
  68. Padmanabhan, K.K. Study on increasing wind power in buildings using TRIZ Tool in urban areas. Energy Build. 2013, 61, 344–348. [Google Scholar] [CrossRef]
  69. Abohela, I.; Hamza, N.; Dudek, S. Effect of roof shape, wind direction, building height and urban configuration on the energy yield and positioning of roof mounted wind turbines. Renew. Energy 2013, 50, 1106–1118. [Google Scholar] [CrossRef]
  70. Abohela, I.; Hamza, N.; Dudek, S. Effect of Roof Shape on Energy Yield and Positioning of Roof Mounted Wind Turbines. In Proceedings of the Building Simulation 2011, 12th Conference of International Building Performance Simulation Association, Sydney, Australia, 14–16 November 2011. [Google Scholar]
  71. Tabrizi, A.B.; Whale, J.; Lyons, T.; Urmee, T. Performance and safety of rooftop wind turbines: Use of CFD to gain insight into inflow conditions. Renew. Energy 2014, 67, 242–251. [Google Scholar] [CrossRef]
  72. Toja-Silva, F.; Peralta, C.; Lopez-Garcia, O.; Navarro, J.; Cruz, I. Roof region dependent wind potential assessment with different RANS turbulence models. J. Wind Eng. Ind. Aerodyn. 2015, 142, 258–271. [Google Scholar] [CrossRef]
  73. Mohamed, M.A.; Wood, D.H. Modifications to Reynolds-averaged Navier–Stokes turbulence models for the wind flow over buildings. Int. J. Sustain. Energy 2017, 36, 225–241. [Google Scholar] [CrossRef]
  74. Kono, T.; Kogaki, T.; Kiwata, T. Numerical Investigation of Wind Conditions for Roof-Mounted Wind Turbines: Effects of Wind Direction and Horizontal Aspect Ratio of a High-Rise Cuboid Building. Energies 2016, 9, 907. [Google Scholar] [CrossRef]
  75. Toja-Silva, F.; Peralta, C.; Lopez-Garcia, O.; Navarro, J.; Cruz, I. Effect of roof-mounted solar panels on the wind energy exploitation on high-rise buildings. J. Wind Eng. Ind. Aerodyn. 2015, 145, 123–138. [Google Scholar] [CrossRef]
  76. Wang, B.; Cot, L.D.; Adolphe, L.; Geoffroy, S. Estimation of wind energy of a building with canopy roof. Sustain. Cities Soc. 2017, 35, 402–416. [Google Scholar] [CrossRef]
  77. White, L.V.; Wakes, S.J. Permitting best use of wind resource for small wind-turbines in rural New Zealand: A micro-scale CFD examination. Energy Sustain. Dev. 2014, 21, 1–6. [Google Scholar] [CrossRef]
  78. Toja-Silva, F.; Colmenar-Santos, A.; Castro-Gil, M. Urban wind energy exploitation systems: Behaviour under multidirectional flow conditions—Opportunities and challenges. Renew. Sustain. Energy Rev. 2013, 24, 364–378. [Google Scholar] [CrossRef]
  79. Ishugah, T.F.; Li, Y.; Wang, R.Z.; Kiplagat, J.K. Advances in wind energy resource exploitation in urban environment: A review. Renew. Sustain. Energy Rev. 2014, 37, 613–626. [Google Scholar] [CrossRef]
  80. Wang, Q.; Wang, J.; Hou, Y.; Yuan, R.; Luo, K.; Fan, J. Micrositing of roof mounting wind turbine in urban environment: CFD simulations and lidar measurements. Renew. Energy 2018, 115, 1118–1133. [Google Scholar] [CrossRef]
  81. Yang, A.S.; Su, Y.M.; Wen, C.Y.; Juan, Y.H.; Wang, W.S.; Cheng, C.H. Estimation of wind power generation in dense urban area. Appl. Energy 2016, 171, 213–230. [Google Scholar] [CrossRef]
  82. Park, J.; Jung, H.J.; Lee, S.W.; Park, J. A New Building-Integrated Wind Turbine System Utilizing the Building. Energies 2015, 8, 11846–11870. [Google Scholar] [CrossRef]
  83. Hassanli, S.; Hu, G.; Kwok, K.C.S.; Fletcher, D. Utilizing cavity flow within double skin façade for wind energy harvesting in buildings. J. Wind Eng. Ind. Aerodyn. 2017, 167, 114–127. [Google Scholar] [CrossRef]
  84. Kuo, J.Y.J.; Romero, D.; Beck, J.; Amon, C. Wind farm layout optimization on complex terrains—Integrating a CFD wake model with mixed-integer programming. Appl. Energy 2016, 178, 404–414. [Google Scholar] [CrossRef]
  85. Gaumond, M.; Réthoré, P.E.; Ott, S.; Pena, A.; Bechmann, A.; Hansen, K.S. Evaluation of the wind direction uncertainty and its impact on wake modeling at the Horns Rev offshore wind farm. Wind Energy 2014, 17, 1169–1178. [Google Scholar] [CrossRef] [Green Version]
  86. Göçmen, T.; van der Laan, P.; Réthoré, P.; Diaz, A.P.; Larsen, G.; Ott, S. Wind turbine wake models developed at the technical university of Denmark: A review. Renew. Sustain. Energy Rev. 2016, 60, 752–769. [Google Scholar] [CrossRef] [Green Version]
  87. Mo, J.; Choudhry, A.; Arjomandi, M.; Lee, Y. Large eddy simulation of the wind turbine wake characteristics in the numerical wind tunnel model. J. Wind Eng. Ind. Aerodyn. 2013, 112, 11–24. [Google Scholar] [CrossRef]
  88. Da-Costa, L.; Castro, F.A.; Palma, J.M.L.M.; Stuart, P. Computer simulation of atmospheric flows over real forests for wind energy resource evaluation. J. Wind Eng. Ind. Aerodyn. 2006, 94, 603–620. [Google Scholar] [CrossRef]
  89. Astolfi, D.; Castellani, F.; Terzi, L. A study of wind turbine wakes in complex terrain through RANS simulation and SCADA data. J. Sol. Energy Eng. 2018, 140, 031001. [Google Scholar] [CrossRef]
  90. Castellani, F.; Astolfi, D.; Piccioni, E.; Terzi, L. Numerical and experimental methods for wake flow analysis in complex terrain. J. Phys. Conf. Ser. 2015, 625, 012042. [Google Scholar] [CrossRef]
  91. Castellani, F.; Astolfi, D.; Mana, M.; Piccioni, E.; Becchetti, M.; Terzi, L. Investigation of terrain and wake effects on the performance of wind farms in complex terrain using numerical and experimental data. Wind Energy 2017, 20, 1277–1289. [Google Scholar]
  92. Rodrigo, J.; Gancarski, P.; Arroyo, R.; Moriarty, P.; Chuchfield, M.; Naughton, J.; Hansen, K.; Machefaux, E.; Koblitz, T.; Maguire, E.; et al. IEA-Task 31 WAKEBENCH: Towards a protocol for wind farm flow model evaluation. Part 1: Flow-over-terrain models. J. Phys. Conf. Ser. 2014, 524, 012105. [Google Scholar] [CrossRef]
  93. Moriarty, P.; Rodrigo, J.; Gancarski, P.; Chuchfield, M.; Naughton, J.; Hansen, K.; Machefaux, E.; Maguire, E.; Castellani, F.; Terzi, L.; et al. IEA-Task 31 WAKEBENCH: Towards a protocol for wind farm flow model evaluation. Part 2: Wind farm wake models. J. Phys. Conf. Ser. 2014, 524, 012185. [Google Scholar] [CrossRef]
  94. Makridis, A.; Chick, J. Validation of a CFD model of wind turbine wakes with terrain effects. J. Wind Eng. Ind. Aerodyn. 2013, 123, 12–29. [Google Scholar] [CrossRef]
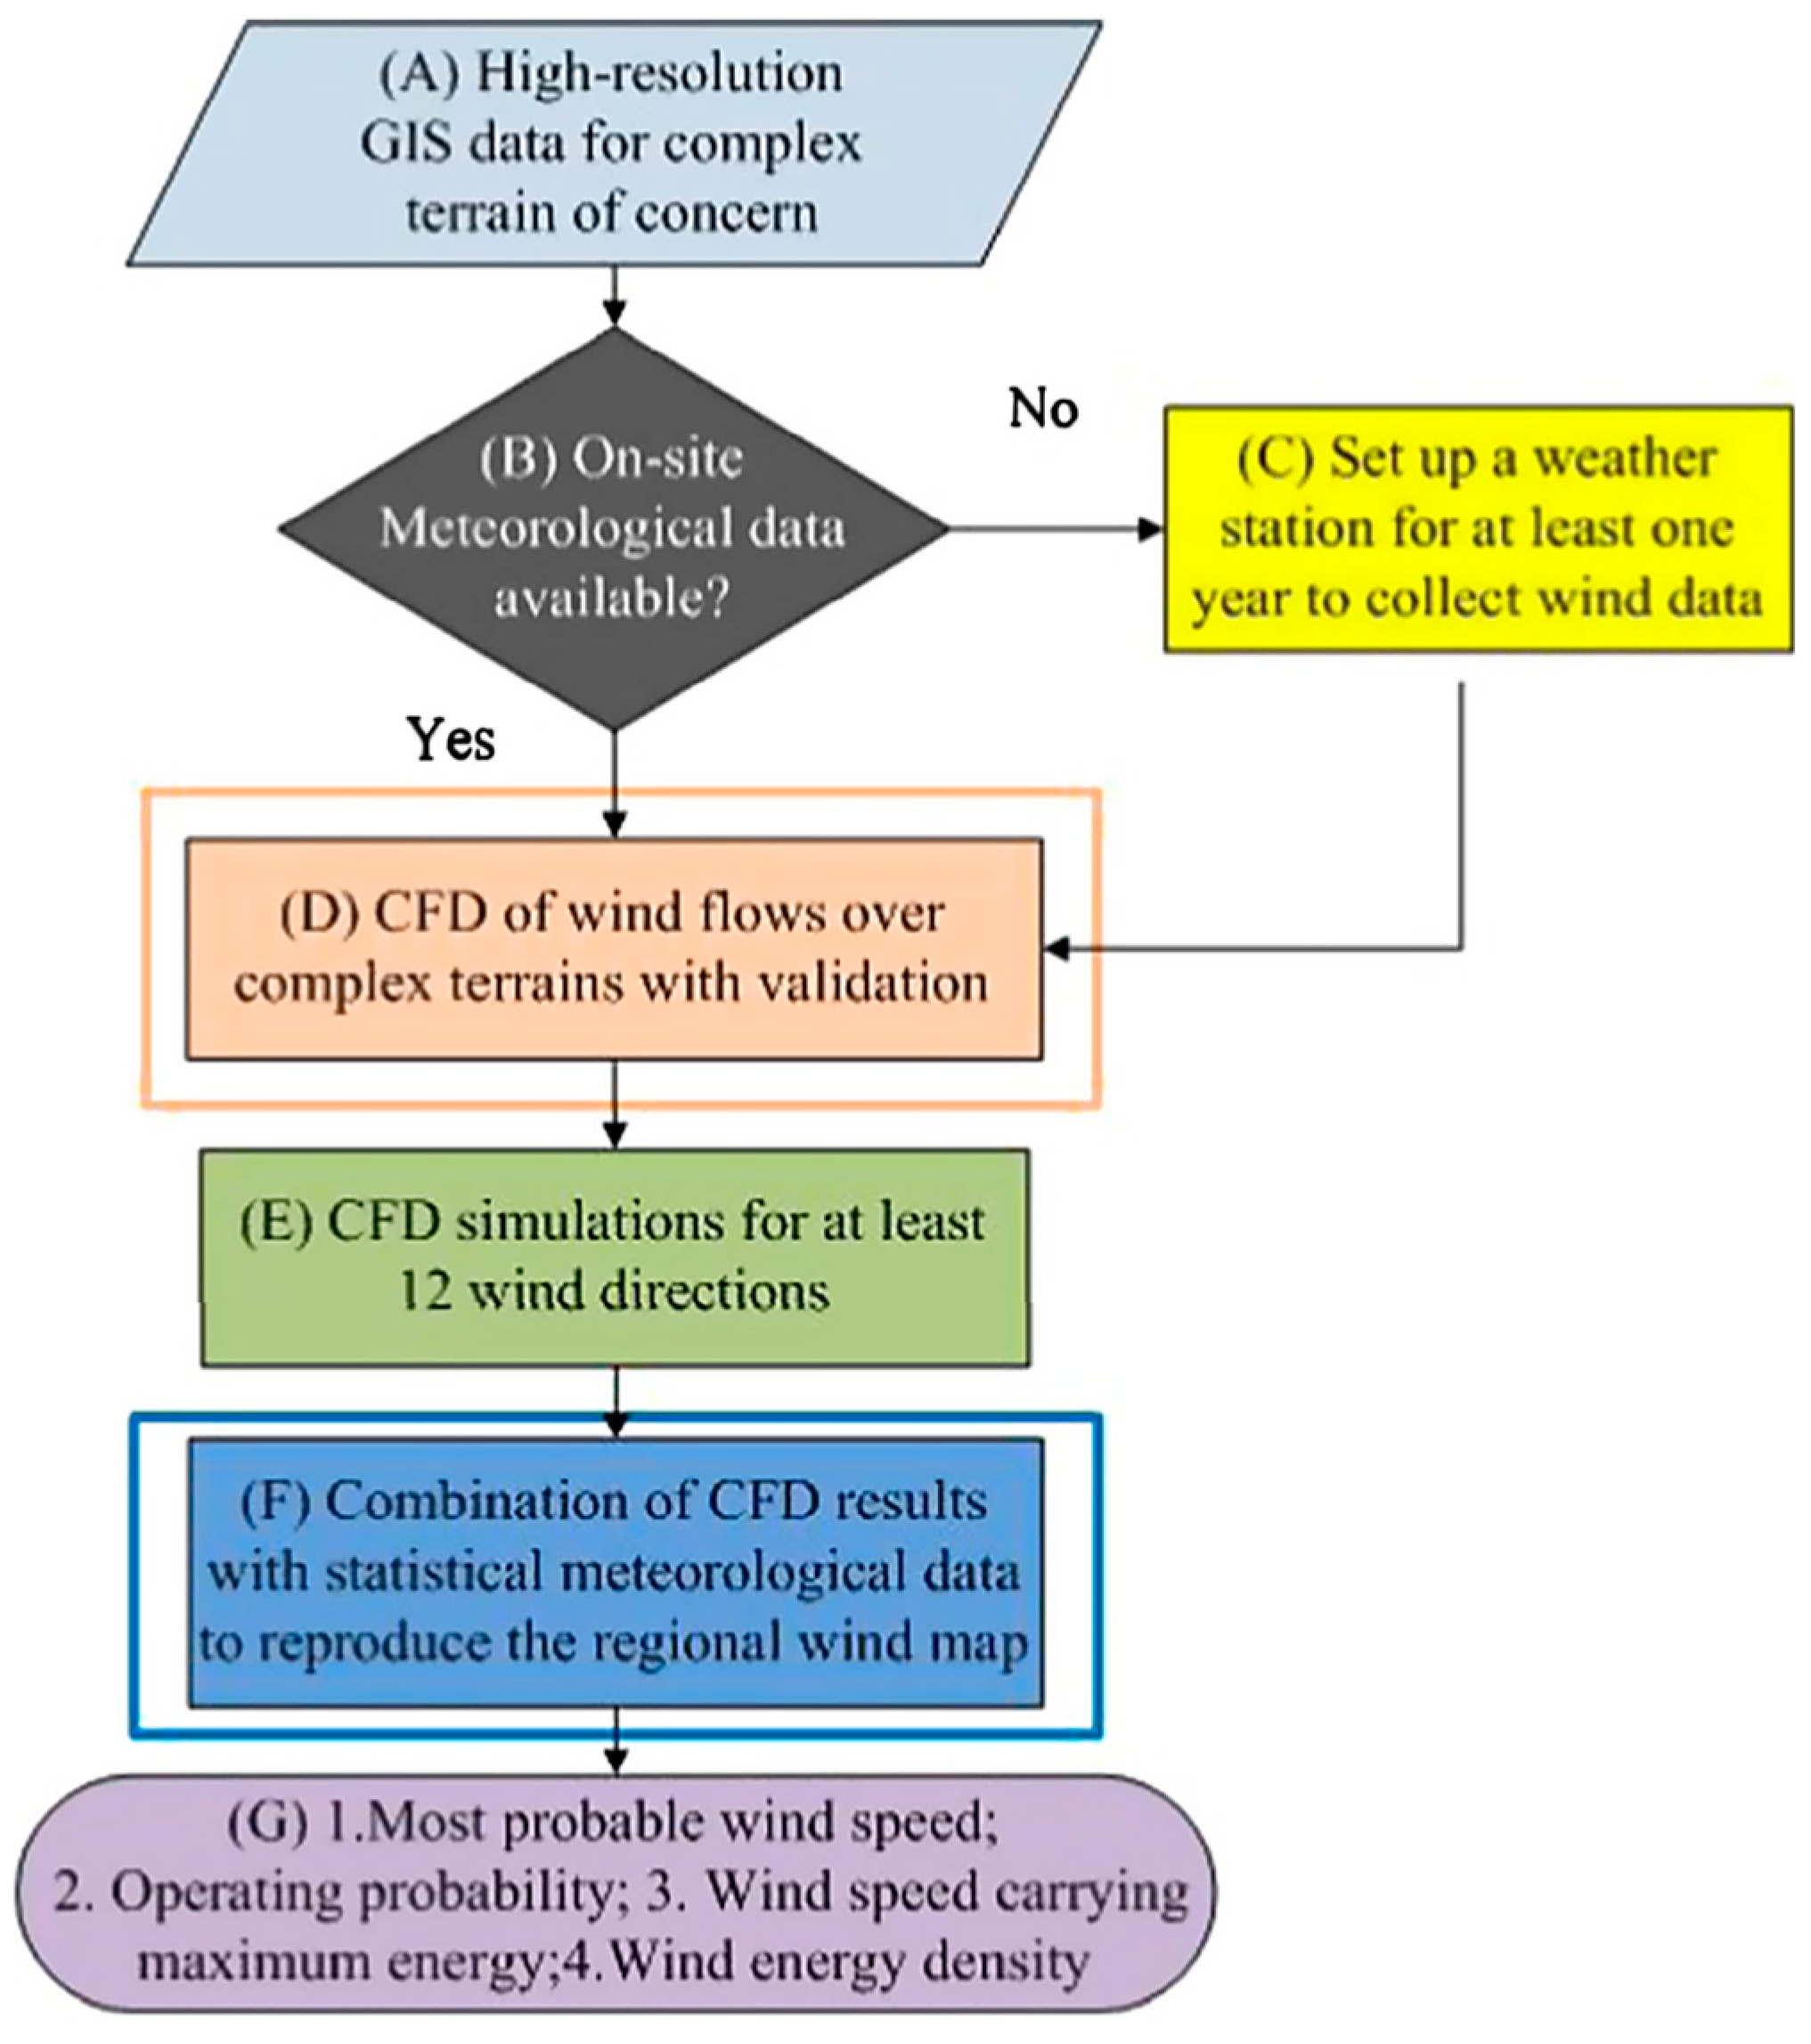
  95. Yan, B.W.; Li, Q.S. Coupled on-site measurement/CFD based approach for high-resolution wind resource assessment over complex terrains. Energy Convers. Manag. 2016, 117, 351–366. [Google Scholar] [CrossRef]
  96. Nedjari, H.D.; Guerri, O.; Saighi, M. CFD wind turbines wake assessment in complex topography. Energy Convers. Manag. 2017, 138, 224–236. [Google Scholar] [CrossRef]
  97. Wang, L.; Cholette, M.; Tan, A.C.C.; Gu, Y. A computationally-efficient layout optimization method for real wind farms considering altitude variations. Energy 2017, 132, 147–159. [Google Scholar] [CrossRef]
  98. Dhunny, A.Z.; Lollchund, M.R.; Rughooputh, S.D.D.V. Wind energy evaluation for a highly complex terrain using Computational Fluid Dynamics (CFD). Renew. Energy 2017, 101, 1–9. [Google Scholar] [CrossRef]
  99. Akin, S.; Kara, Y. An Assessment of Wind Power Potential along the Coast of Bursa, Turkey: A Wind Power Plant Feasibility Study for Gemlik Region. J. Clean Energy Technol. 2017, 5, 101–106. [Google Scholar] [CrossRef]
  100. Troldborg, N.; Larsen, G.C.; Madsen, H.A.; Hansen, K.S.; Sørensen, J.N.; Mikkelsen, R. Numerical simulations of wake interaction between two wind turbines at various inflow conditions. Wind Energy 2011, 14, 859–876. [Google Scholar] [CrossRef]
  101. Schulz, C.; Klein, L.; Weihing, P.; Lutz, T.; Krämer, E. CFD Studies on Wind Turbines in Complex Terrain under Atmospheric Inflow Conditions. J. Phys. Conf. Ser. 2014, 524, 012134. [Google Scholar] [CrossRef]
  102. Schmidt, J.; Stoevesandt, B. Modelling complex terrain effects for wind farm layout optimization. J. Phys. Conf. Ser. 2014, 524, 012136. [Google Scholar] [CrossRef]
  103. Machefaux, E.; Larsen, G.C.; Koblitz, T.; Troldborg, N.; Kelly, M.C.; Chougule, A.; Hansen, S.K.; Rodrigo, J.S. An experimental and numerical study of the atmospheric stability impact on wind turbine wakes. Wind Energy 2016, 19, 1099–1824. [Google Scholar] [CrossRef]
  104. Liu, X.; Yan, S.; Mu, Y.; Chen, X.; Shi, S. CFD and Experimental Studies on Wind Turbines in Complex Terrain by Improved Actuator Disk Method. J. Phys. Conf. Ser. 2017, 854, 012028. [Google Scholar] [CrossRef]
  105. Politis, E.S.; Prospathopoulos, J.; Cabezon, D.; Hansen, K.S.; Chaviaropoulos, P.K.; Barthelmie, R.J. Modeling wake effects in large wind farms in complex terrain: The problem, the methods and the issues. Wind Energy 2012, 15, 161–182. [Google Scholar] [CrossRef] [Green Version]
  106. Feng, J.; Shen, W.Z. Wind farm layout optimization in complex terrain: A preliminary study on a Gaussian hill. J. Phys. Conf. Ser. 2014, 524, 012146. [Google Scholar] [CrossRef]
  107. Parada, L.; Herrera, C.; Flores, P.; Parada, V. Assessing the energy benefit of using a wind turbine micro-siting model. Renew. Energy 2017, 118, 591–601. [Google Scholar] [CrossRef]
Figure 1. Different sizes and capacity of wind turbines.
Computation 06 00024 g001
Figure 2. Different types of micro wind turbine: (a) Twisted H-Darrieus VAWT; (b) Three-blade propeller HAWT; (c) Savonius VAWT [24].
Computation 06 00024 g002
Figure 3. Schematic of the AM300: A micro VAWT with convergent duct [26].
Computation 06 00024 g003
Figure 4. Model of the rotors with (a) semi-cylindrical (b) helically-twisted and (c) semi-circular blades [28].
Computation 06 00024 g004
Figure 5. Different symmetric and non-symmetric aerofoils investigated in [30].
Computation 06 00024 g005
Figure 6. Comparison between experiment and CFD LES model prediction of the average power coefficient for an adjustable- and fixed-pitch angle, NACA0018 [31].
Computation 06 00024 g006
Figure 7. Error of the predicted power by CFD, stream-tube, vortex methods from the experiments at several tip speed ratios (TSR) [40].
Computation 06 00024 g007
Figure 8. 2D Computational domain for the analysis of VAWT.
Computation 06 00024 g008
Figure 9. Meshing strategy for the VAWT rotor investigated in [44].
Computation 06 00024 g009
Figure 10. Schematic diagram of close proximity VAWT in (a) inward counter-rotating; (b) outward counter-rotating; (c) 4-rotors configuration.
Computation 06 00024 g010
Figure 11. Wind velocity profile in the internal boundary layer in an urban area.
Computation 06 00024 g011
Figure 12. Building integration of (a) large scale WTs and (b) small scale WTs.
Computation 06 00024 g012
Figure 13. Configuration of the 110-kW wind turbine and buildings with a sky bridge studied in [63].
Computation 06 00024 g013
Figure 14. Integration of wind turbines into buildings with different shapes.
Computation 06 00024 g014
Figure 15. Vertical stream wise velocity path lines along the central plan for the investigated roof shapes [69].
Computation 06 00024 g015
Figure 16. Wind amplification effect of the designed building shape in sample building(s) [19].
Computation 06 00024 g016
Figure 17. The layout and the inter-turbine distance of the sub-cluster investigated [3].
Computation 06 00024 g017
Figure 18. The methodology used for potential wind energy assessment with coupled CFD/on-site measurement [95].
Computation 06 00024 g018
Figure 19. The optimisation process of wind farm layout in flat and non-flat terrains recommended by [97].
Computation 06 00024 g019
Figure 20. Computational domain of a wind turbine in a complex terrain [100].
Computation 06 00024 g020
Table 1. Wind Turbine Assessment—Small Wind Turbine.
AuthorTypeNo of WTCapacityTool/MethodKey Findings
De-Santoli et al. (2014)VAWT Micro WT (AM300)1Nominal electric power of 3.7 kWFLUENT, 3DThe proposed WT’s electricity production is 6000 kWh annually. The electricity generation is improved by 50% with the use of PV array to the device.
Wang and Zhan (2013)Savonius VAWT2-FLUENT, RANS, 3D, Realizable k-εThe wind rotor performance integrated with semi-circular blades was almost similar to the semi-cylindrical wind rotor and slower compared to the shape of spiral twisted wind rotor but the semi-circular wind rotor operates more smoothly.
El-Zahaby et al. (2016)Diffuser augmented wind turbines (DAWT)- FLUENT, 2D, standard k-εExpected power increase level at optimal flange angle reaches a value of 1.953 related to the expected power of standard turbine, whereas the estimated power increase ratio of normal flange reaches 1.903 which means that the improvement in power generation is about 5% due to the optimal flange angle.
Abdalrahman et al. (2017)Darrieus VAWT (H-type VAWT)- FLUENT, 2DBlade pitch angle method increases the power output of the H-type VAWT, an average 25% improvement.
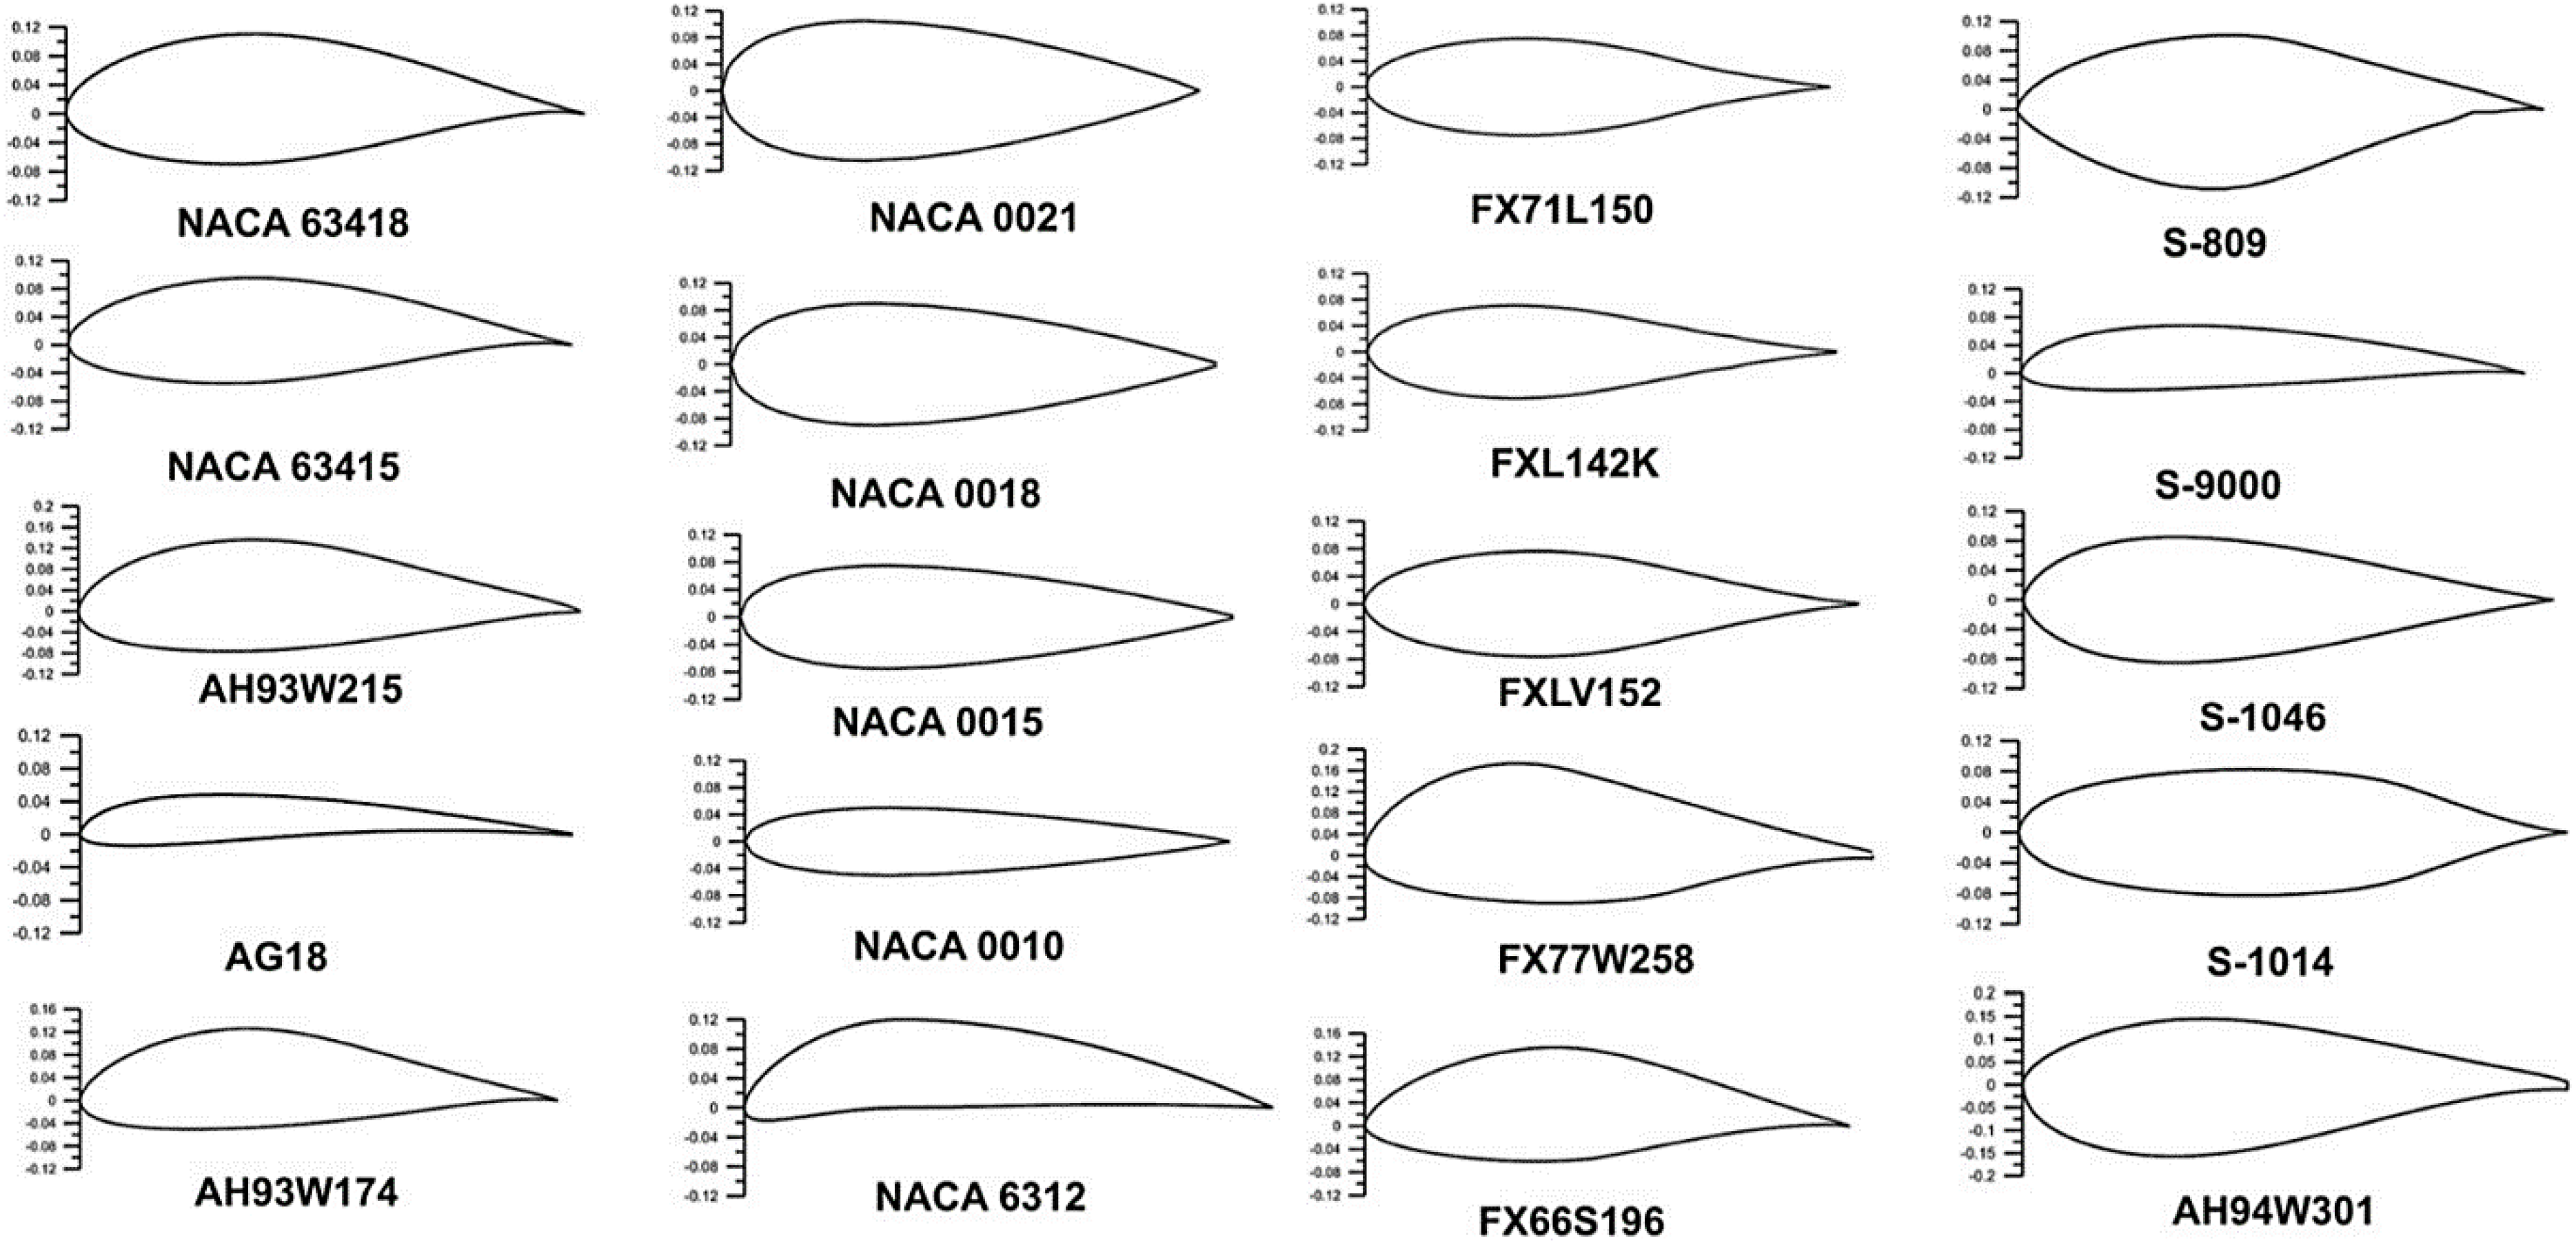
Mohamed (2012)Darrieus turbine (H-rotor VAWT)--FLUENT, URANS, Realizable κk-εThe investigation on aerodynamic was conducted for 20 different aerofoil s (Symmetric and Non-symmetric) by 2-dimensional CFD to maximise output torque and output power coefficient. An improvement of the H-rotor Darrieus turbine performance can be achieved in this method.
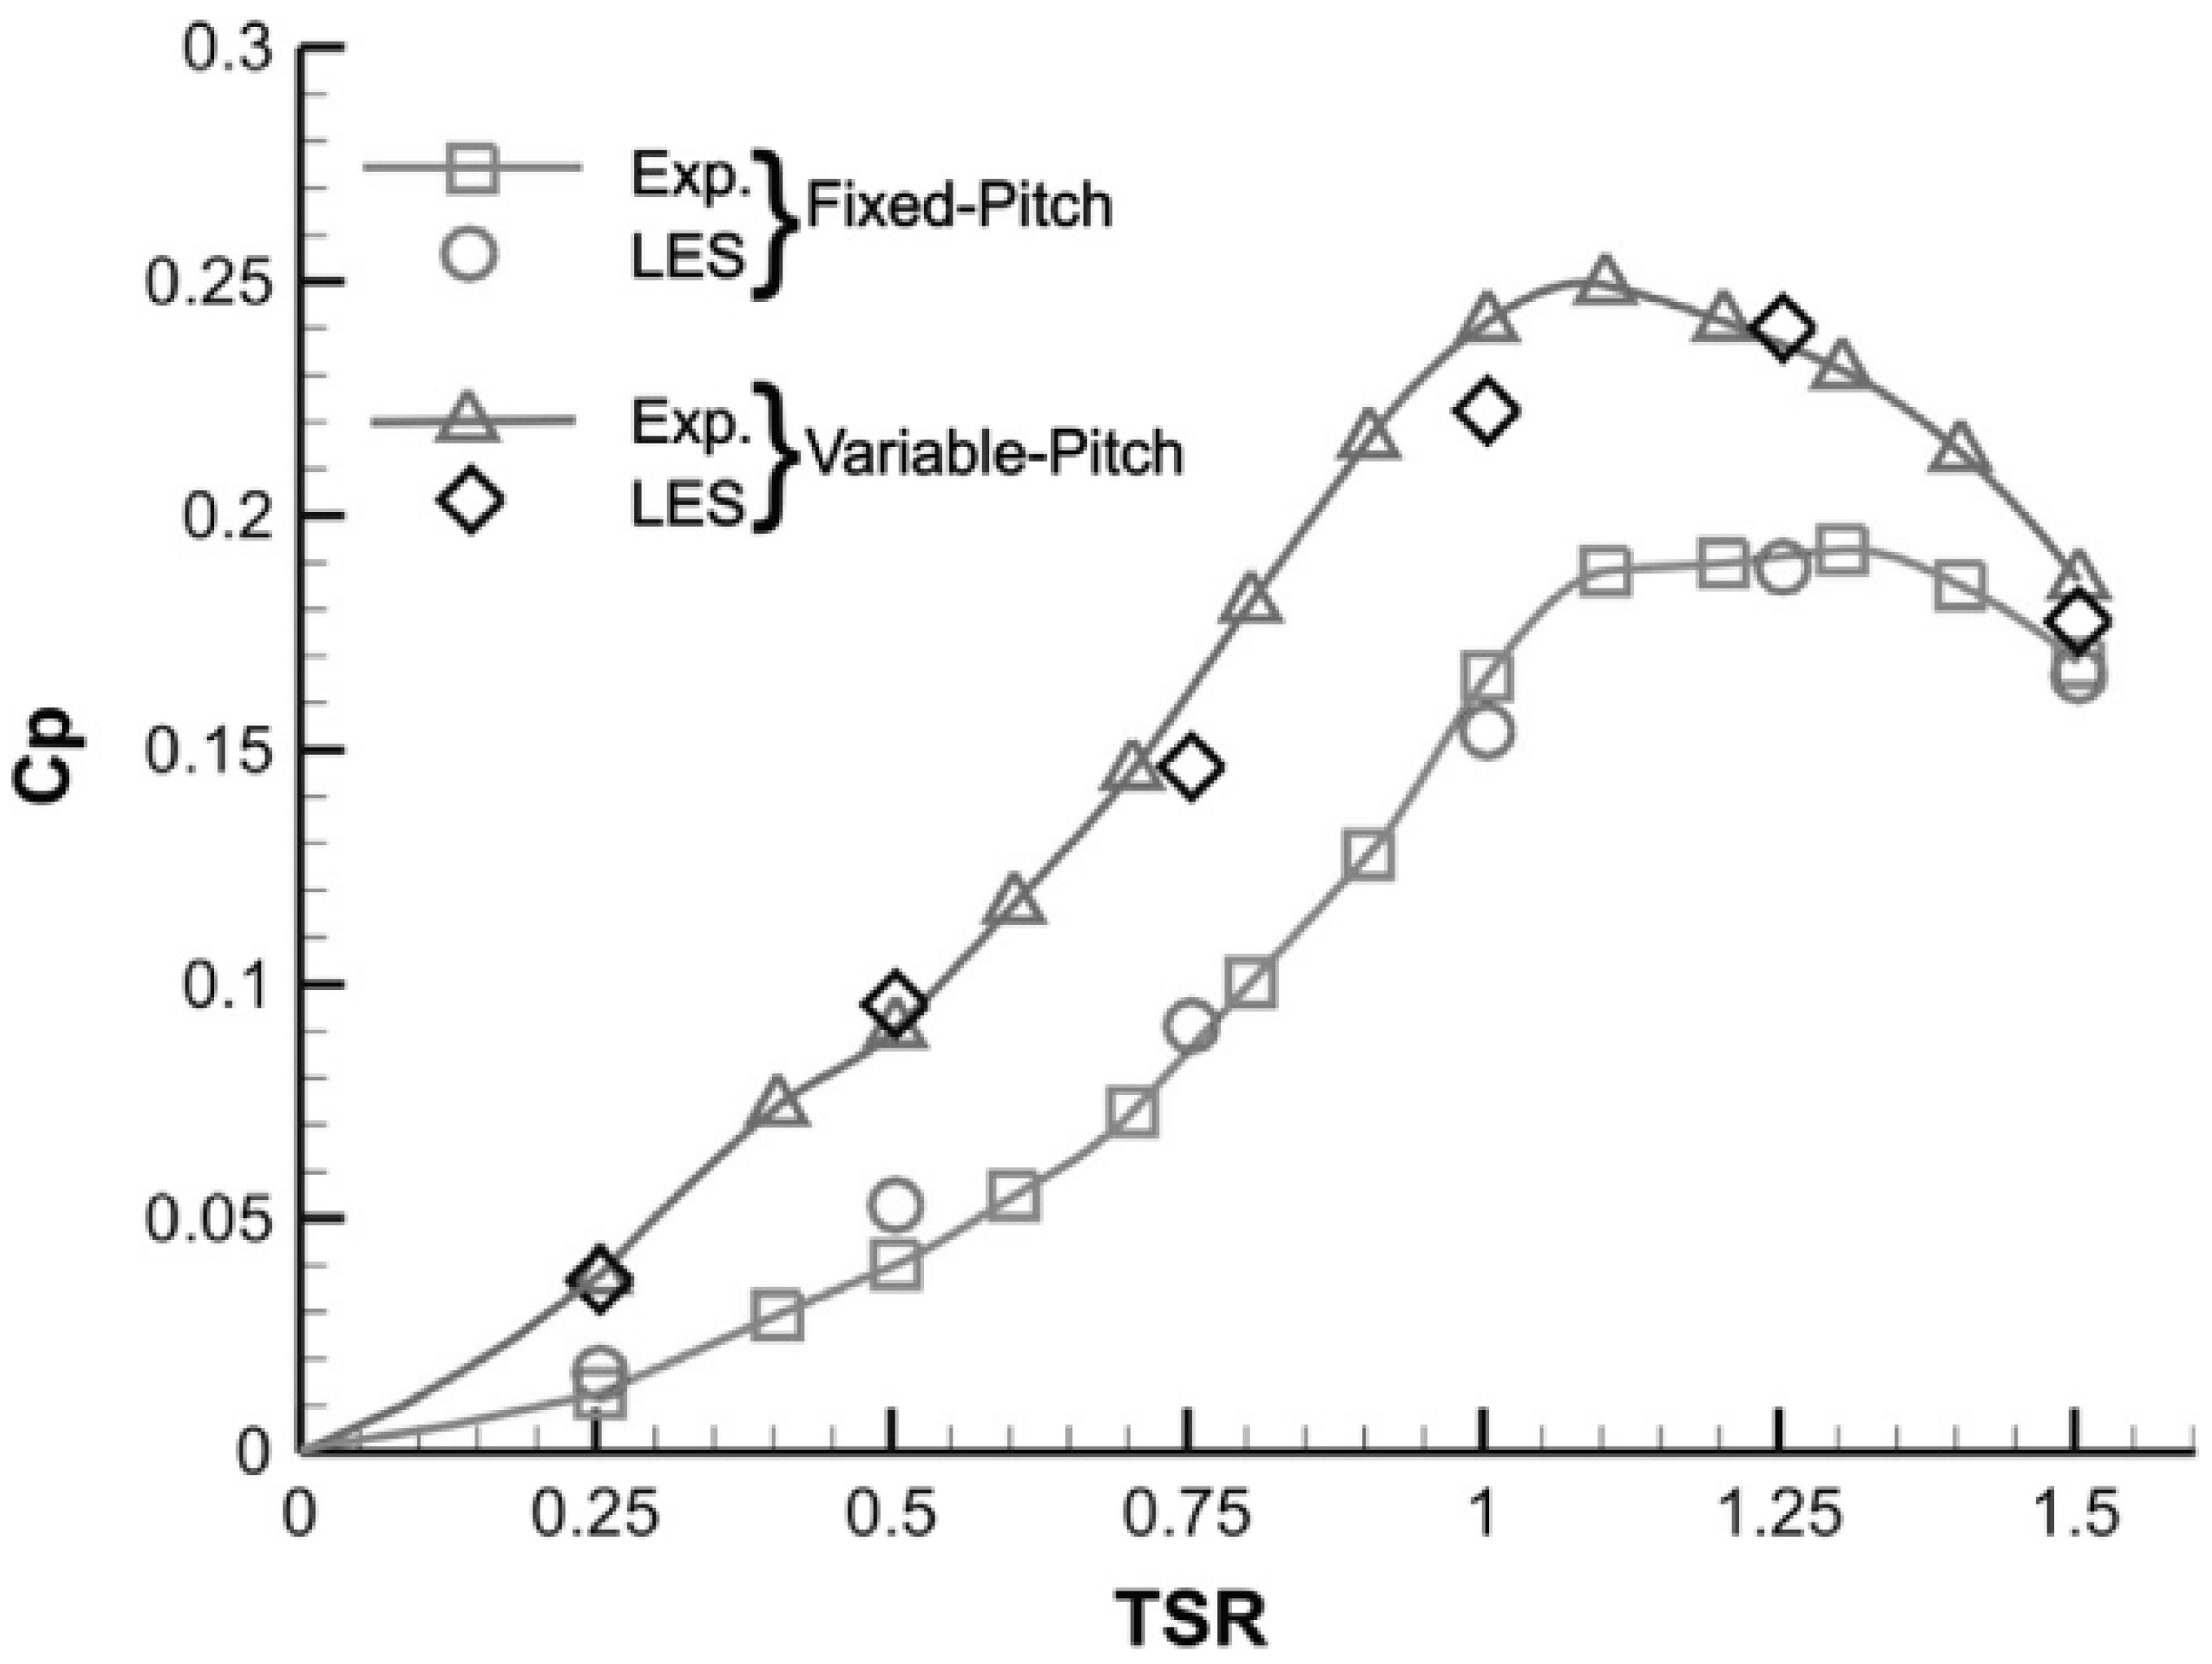
Elkhoury et al. (2015)VAWT with low aspect ratio 3 straight blades with struts--FLUENT, LES, 3DThe greatest power coefficient distribution changes were found in the tests at low level of wind speeds of 6 m/s and 4 m/s for the NACA0018 fixed-pitch and aerofoils NACA 634-221.
Bausas and Danao (2015)VAWT-5kWFLUENT, 2D, standard k-εDespite of the increase in wind energy because of varying wind at 233.13 W in a wind cycle compared to 229.69 W for the stable 5 m/s wind speed, generated power by the camber-bladed VAWT decreased to 74.96 W from the steady 78.32 W wind rotor power.
Sengupta et al. (2016)VAWT (H-Darrieus rotor)--FLUENT, 2D, RNG k-εThe investigation showed that asymmetrical blade rotor had greater vital torque and greater power level compared to the asymmetrical EN0005 and even blade H-Darrieus rotors.
Li et al. (2016)Straight-bladed VAWT--FLUENT, 3D, RANS, SST k-εThe fluid force was reduced with the increase of span wise positions excluding the position of support structure.
Stout et al. (2017)VAWT with an Upstream Deflector2-FLUENT 14.0The application of small, curve upstream deflectors were seen to enhance the turbine performance up to 1.266%; with the WT that requiring decreased rotational speed to offer optimal performance values.
Arpino et al. (2017)VAWT2-Open FOAMThe simulation of the power coefficient-TSR curves of a VAWT and the moving mesh method combined with SpalartAllmaras turbulence model provided acceptable results, in spite of few discrepancies among experimental and numerical data.
Yang et al. (2017)VAWT1-WAsP, LES, RANSThe vortex structure distribution with the span wise direction was more complicated at a lower tip speed ratio and the tip vortex had a longer dissipation distance at a highertip speed ratio. Moreover, the average wind speed demonstrated a higher value near the tip of the blade and a small value close to the blade due to the vortex effect.
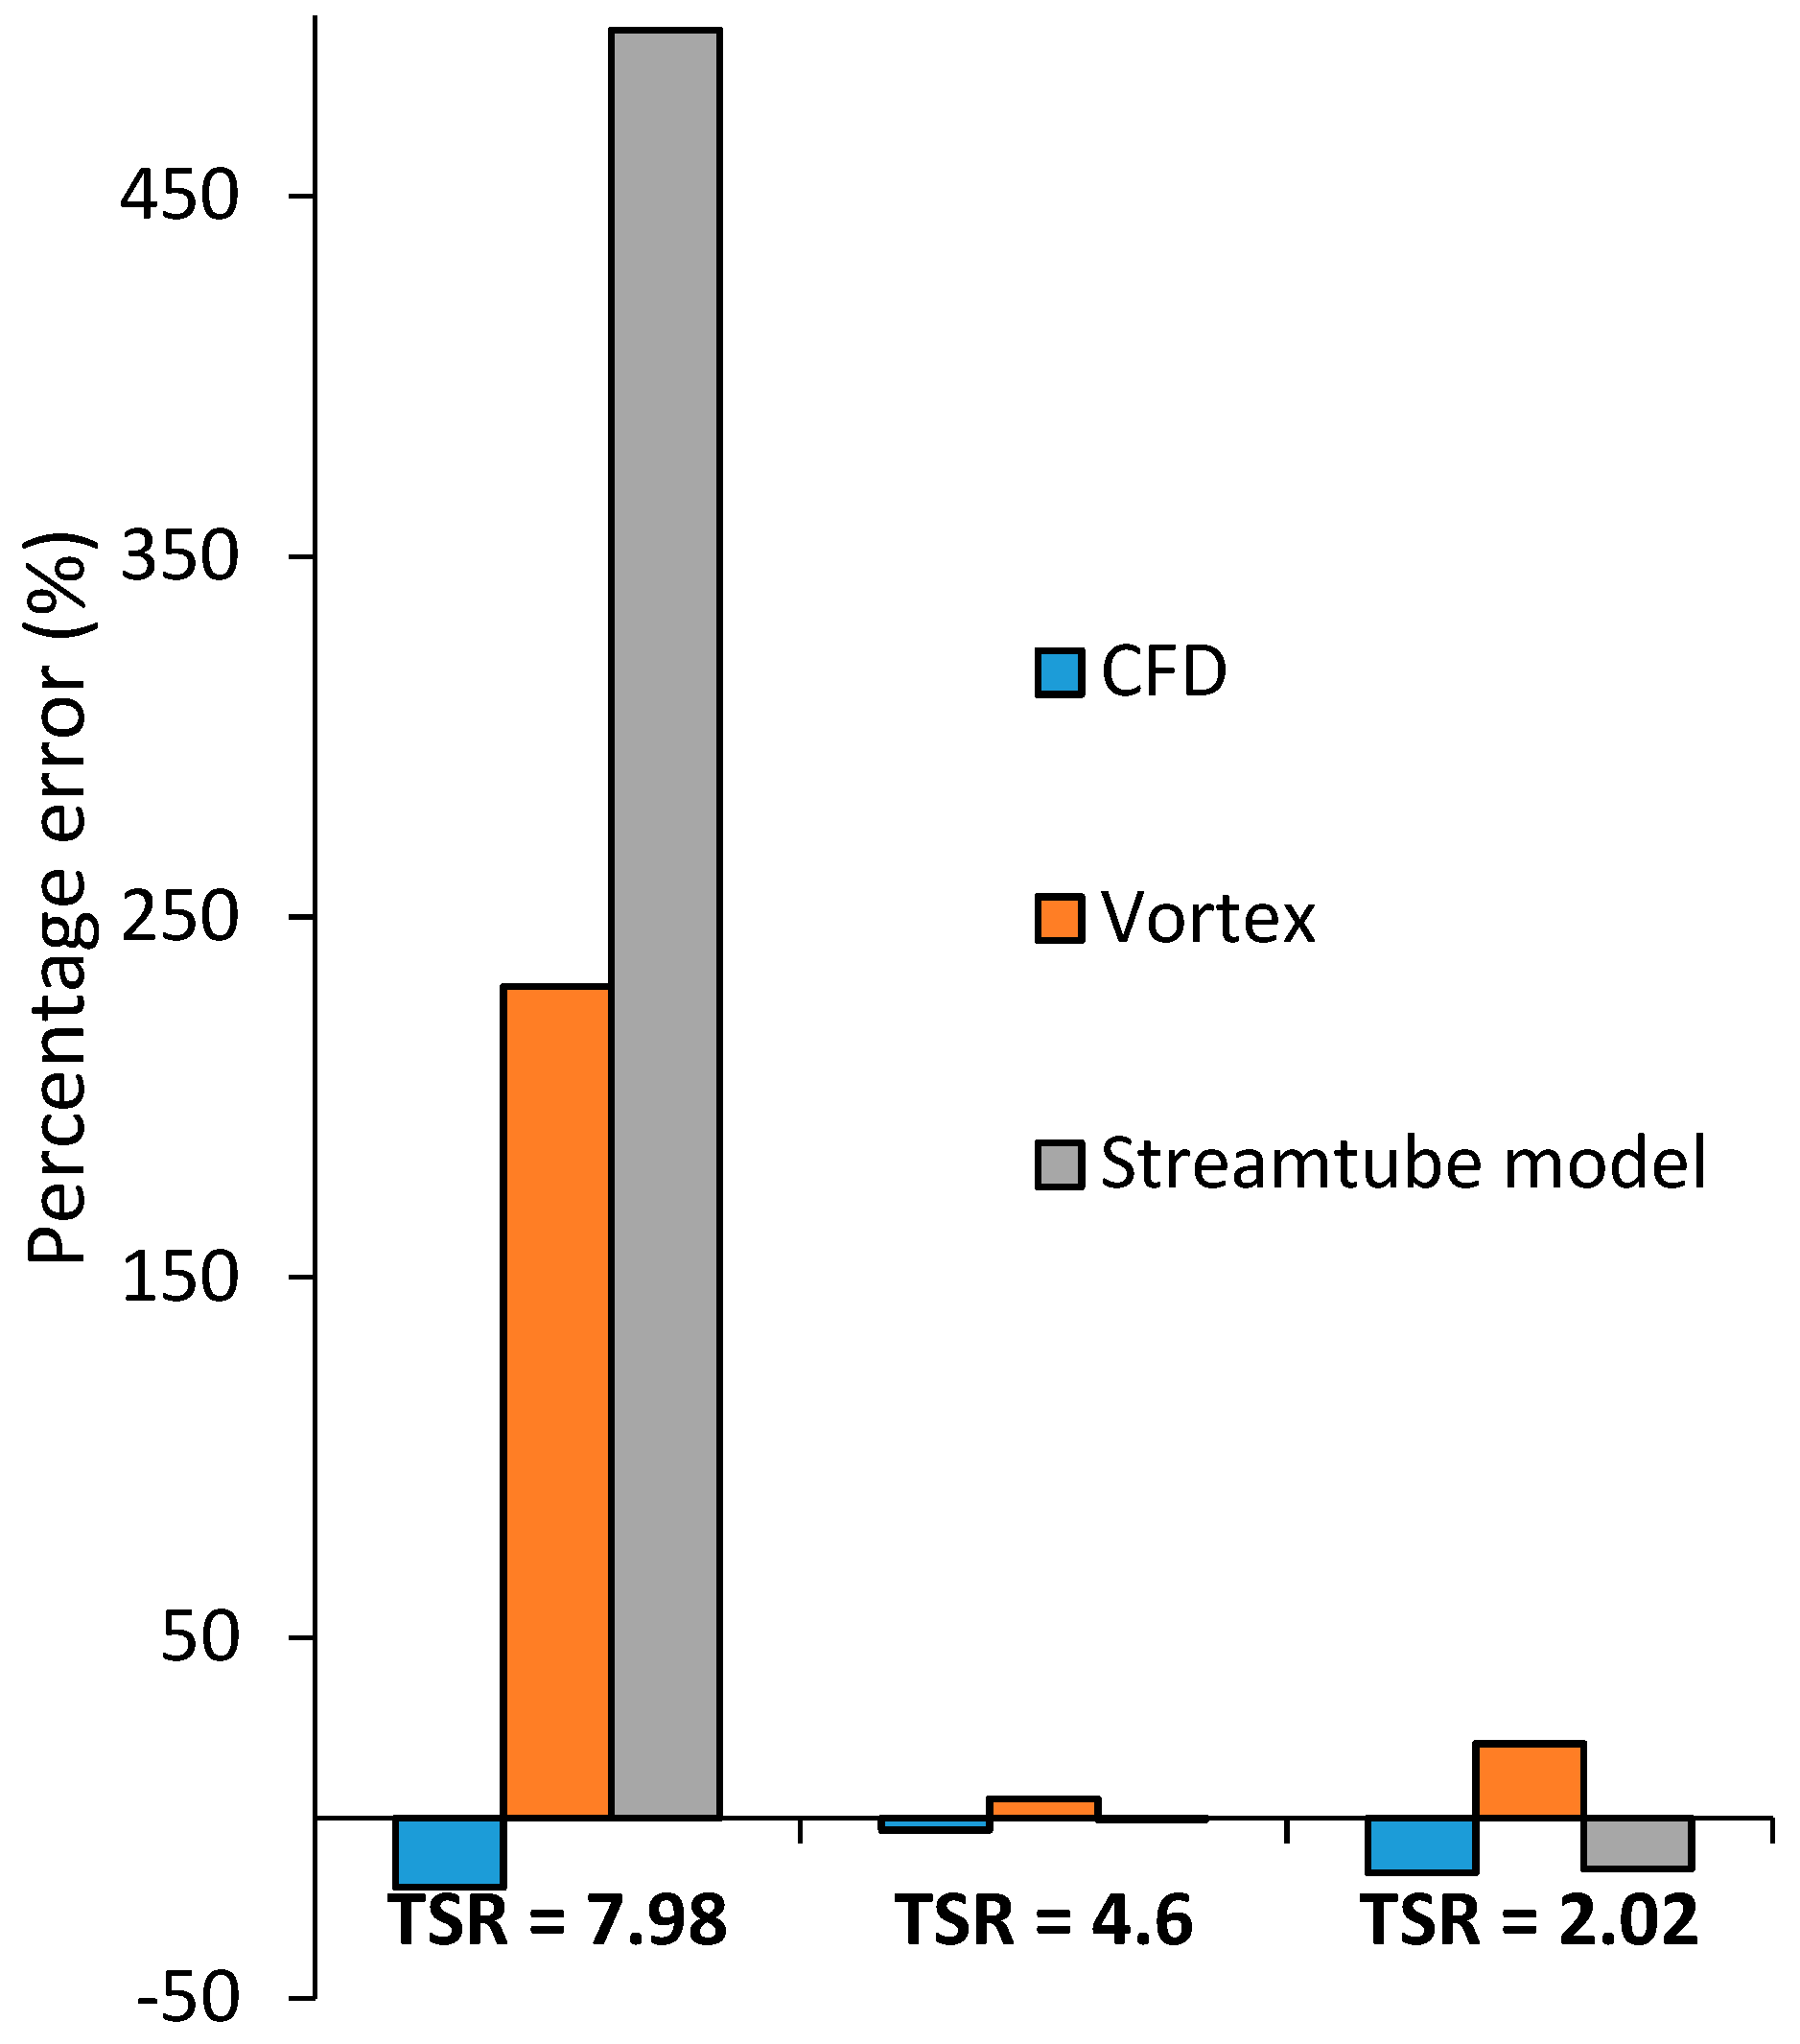
Delafin et al. (2017)VAWT--ANSYS CFX, CACTUS, 3D, RANS
k-omega SST
Double Multi-Streamtube method was seen to be less accurate compared to the vortex method, which itself was seen to be less accurate than the RANS CFD. For all the tip speed ratios tested, the Double Multi-Streamtube method over-predicted the torque amplitude while the RANS CFD gave a good prediction of this amplitude.
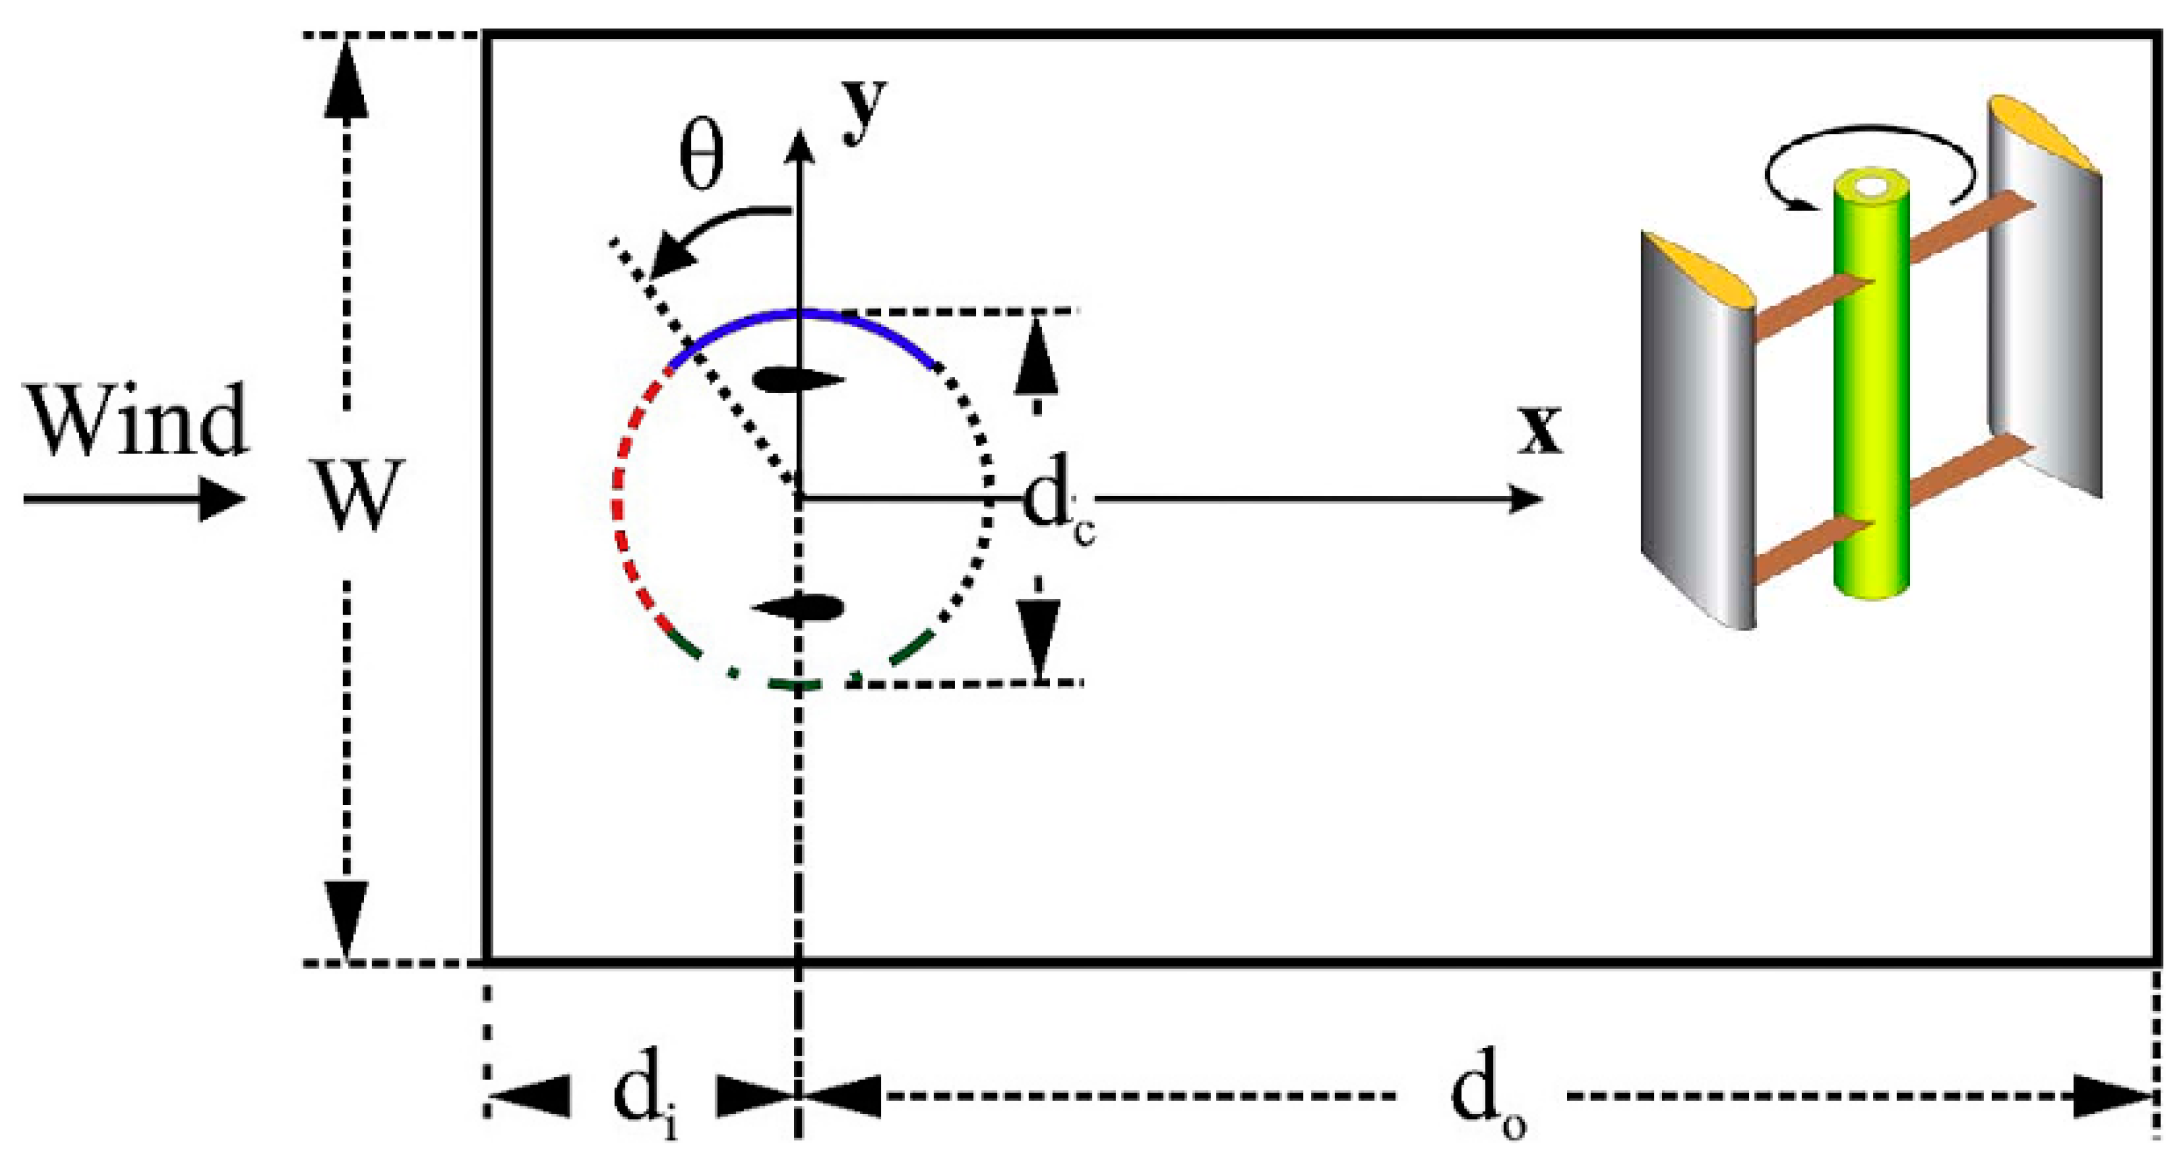
Rezaeiha et al. (2017)VAWT--FLUENT, SIMPLE, 2D URANSA domain width of 20 × diameter and a rotating core of 1.5 × diameter were seen to be safe choices to reduce uncertainty in the boundary conditions and effects of blockage on the results.
Klein et al. (2017)HAWT and VAWT-450 kW fanFLOWer, 3D, URANS, SST turbulenceGood accordance was seen for the flow fields, the on-blade speed and the angle between the line of the chord of an aero foil and relative airflow. Deviations occulted for the bending moments.
Chowdhury et al. (2016)VAWT upright and tilted positions--URANS, SST k-omegaIt was seen that in the situation of tilted structure the wake stream shifts downward. This characteristics of VAWT in tilted state may result into effective sea surface application in floating offshore wind farms.
Botha et al. (2017)VAWT22 and 5 kWFLUENT, 2D, 3D, RANS, DESCalculations from the CFD was found to enhance the accurateness of noise projections when compared to the analytical flow solution; for the inflow-turbulence noise sources, blade produced turbulence dominates the atmospheric inflow turbulence.
Ghasemian and Nejat (2015)H-Darrieus VAWT--Incompressible LESThe study showed direct relation among the strength of the rotational speed and the radiated noise. Moreover, the effect of receiver distance on the Overall Sound Pressure Level was investigated and it was concluded that it varies with a logarithmic trend with the receiver distance.
Wasala et al. (2015)HAWT
CART-2
-660 kWLES, 3DThe study showed that noise evaluations can be achieved with less computational expense as compared to carrying out full WT models, and with greater accurateness compared to using semi empirical noise anticipated codes. Moreover, the study recommended that the expected 0 radial flow was used for computing the farfield noise at high TSR.
Bremseth and Duraisamy (2016)VAWT--OVERTURNS, URANS, e-Spalart–Allmaras turbulenceStudies of VAWT in multiple columns demonstrated that the downstream columns may be more effective than the leading column, a proposition which could result to radical enhancement in productivity of small scale wind farm.
Dabiri (2011)Counter-rotating VAWT6-Numerical SimulationsResults recommended an alternative method to small scale wind farming that could concurrently lessen the cost, size, and environmental effects of wind farms.
Giorgetti et al. (2015)Straight-bladed Darrieus Vertical Axis micro-turbines21.2kW VAWTFluent, 2D, URANS, k-ω SSTThe accelerated free-stream flow between the turbines was the main cause of the power extraction improvement by means of re-energisation and contraction of the turbine wakes. CFD projections of a four-rotor configuration proved this hypothesis, also the wind direction greatly affects the overall efficiency
Zanforlin and Nishino (2016)VAWT21.2 kWUnsteady (URANS), 2DResults demonstrated that the total power of a staggered pair of turbines cannot surpass that of a side-by-side pair of turbines.
Ghasemian et al. (2017)Darrieus vertical axis wind turbines--FLUENT, k-ε turbulence k- ω (SST), RANS-LESPower variation decreased through increasing the blade number. Greater number of blades allows the maximum power coefficient to be reach at lower angular velocities. The guide vane is a good strategy to increase the performance of wind turbines and enhance their self-starting ability specifically at lower level of wind speeds.
Table 2. Wind Turbine Assessment—Building Mounted Wind Turbine.
AuthorType/IntegrationNumber of WTCapacityMethod/ToolKey Findings
Ayhan and Saglam (2012)Building mounted wind power systems-1.4 kWFLUENT, 3D, standard k-εThe typical Darrieus WT was not suitable as it was too noisy. Savonius WT rotor shortcoming was its low per power coefficient.
Decreasing the design TSR and through using blade sweep, noise level can be reduced. Standard dimensions were 10–20% of the characteristic building height.
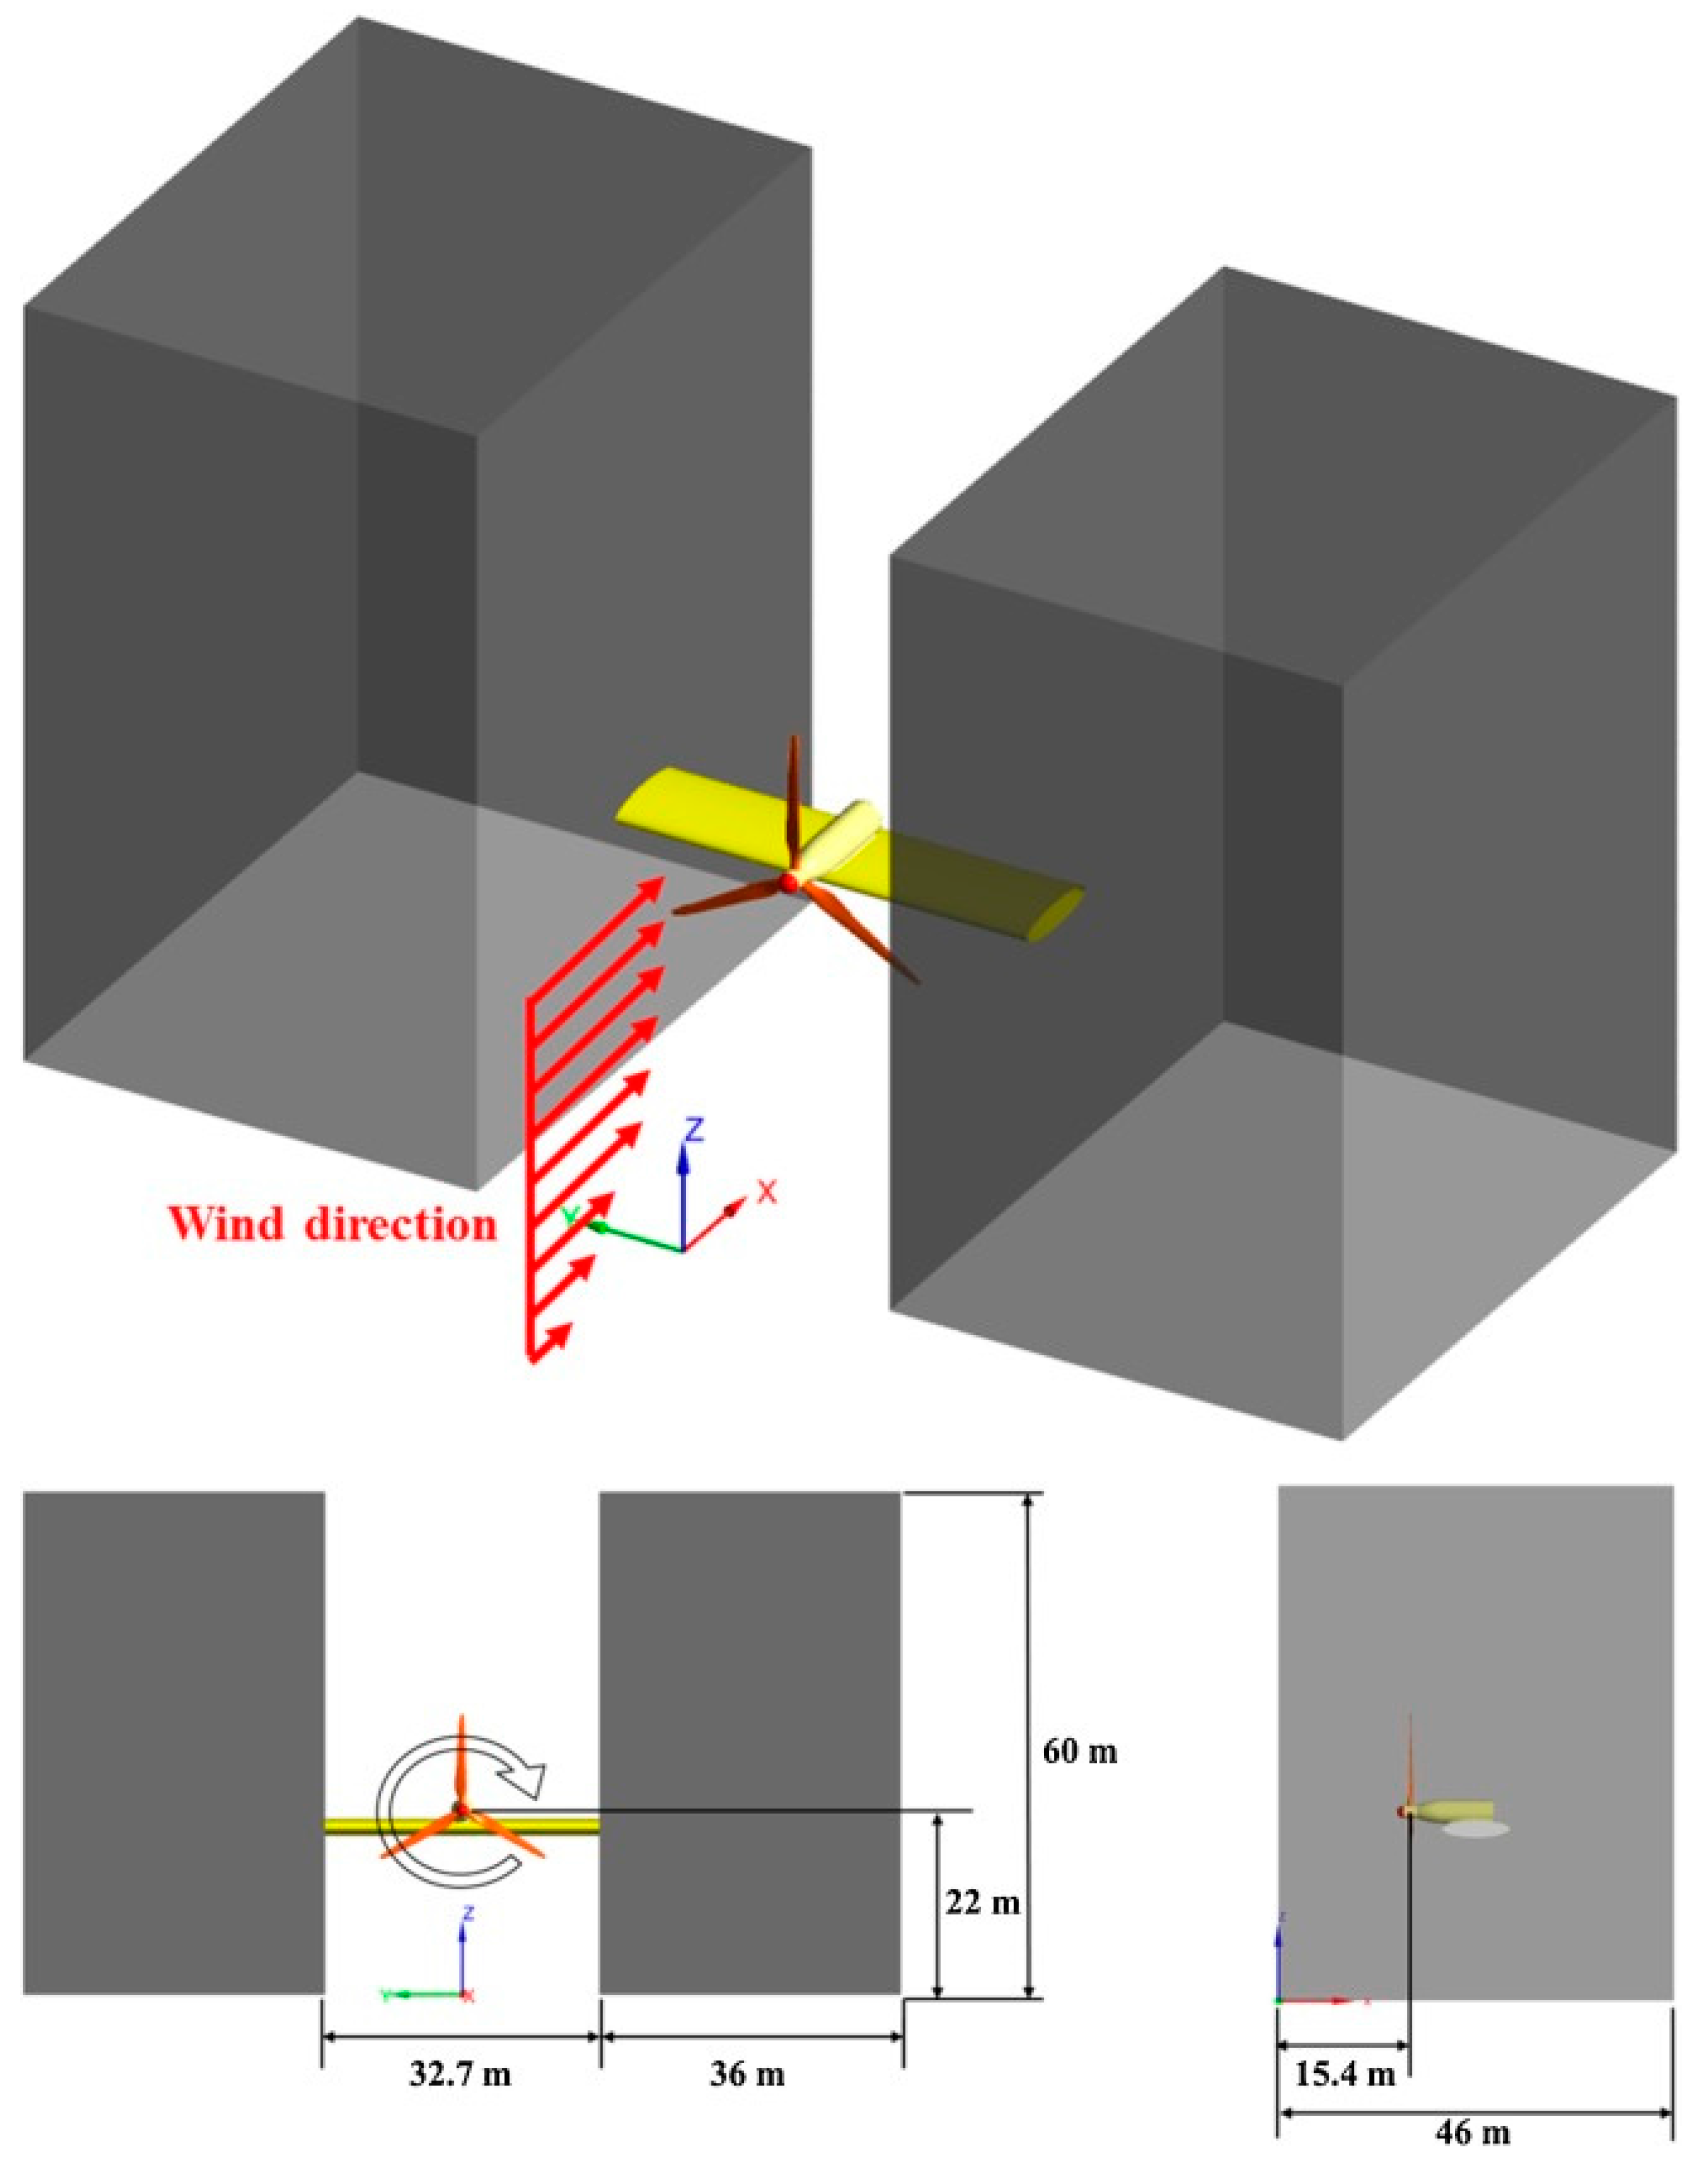
Heo et al. (2016)Between two buildings2110 kWCFX, URANS, 3D, SST k-εThe aerodynamic power production of 110 kW wind turbine installed on a building was higher as compared to a stand-alone 110 kW WT because of the concentration effect caused by the wind speed acceleration between buildings. Moreover, this advantage showed in flow angle between −30 and 15°. Because of the fixed rotational direction of the WT, the effect of flow angle demonstrated asymmetric condition. It is also shown that to exceed Betz limit of 0.593 is possible by the effect of buildings similar to the ducts and shrouds.
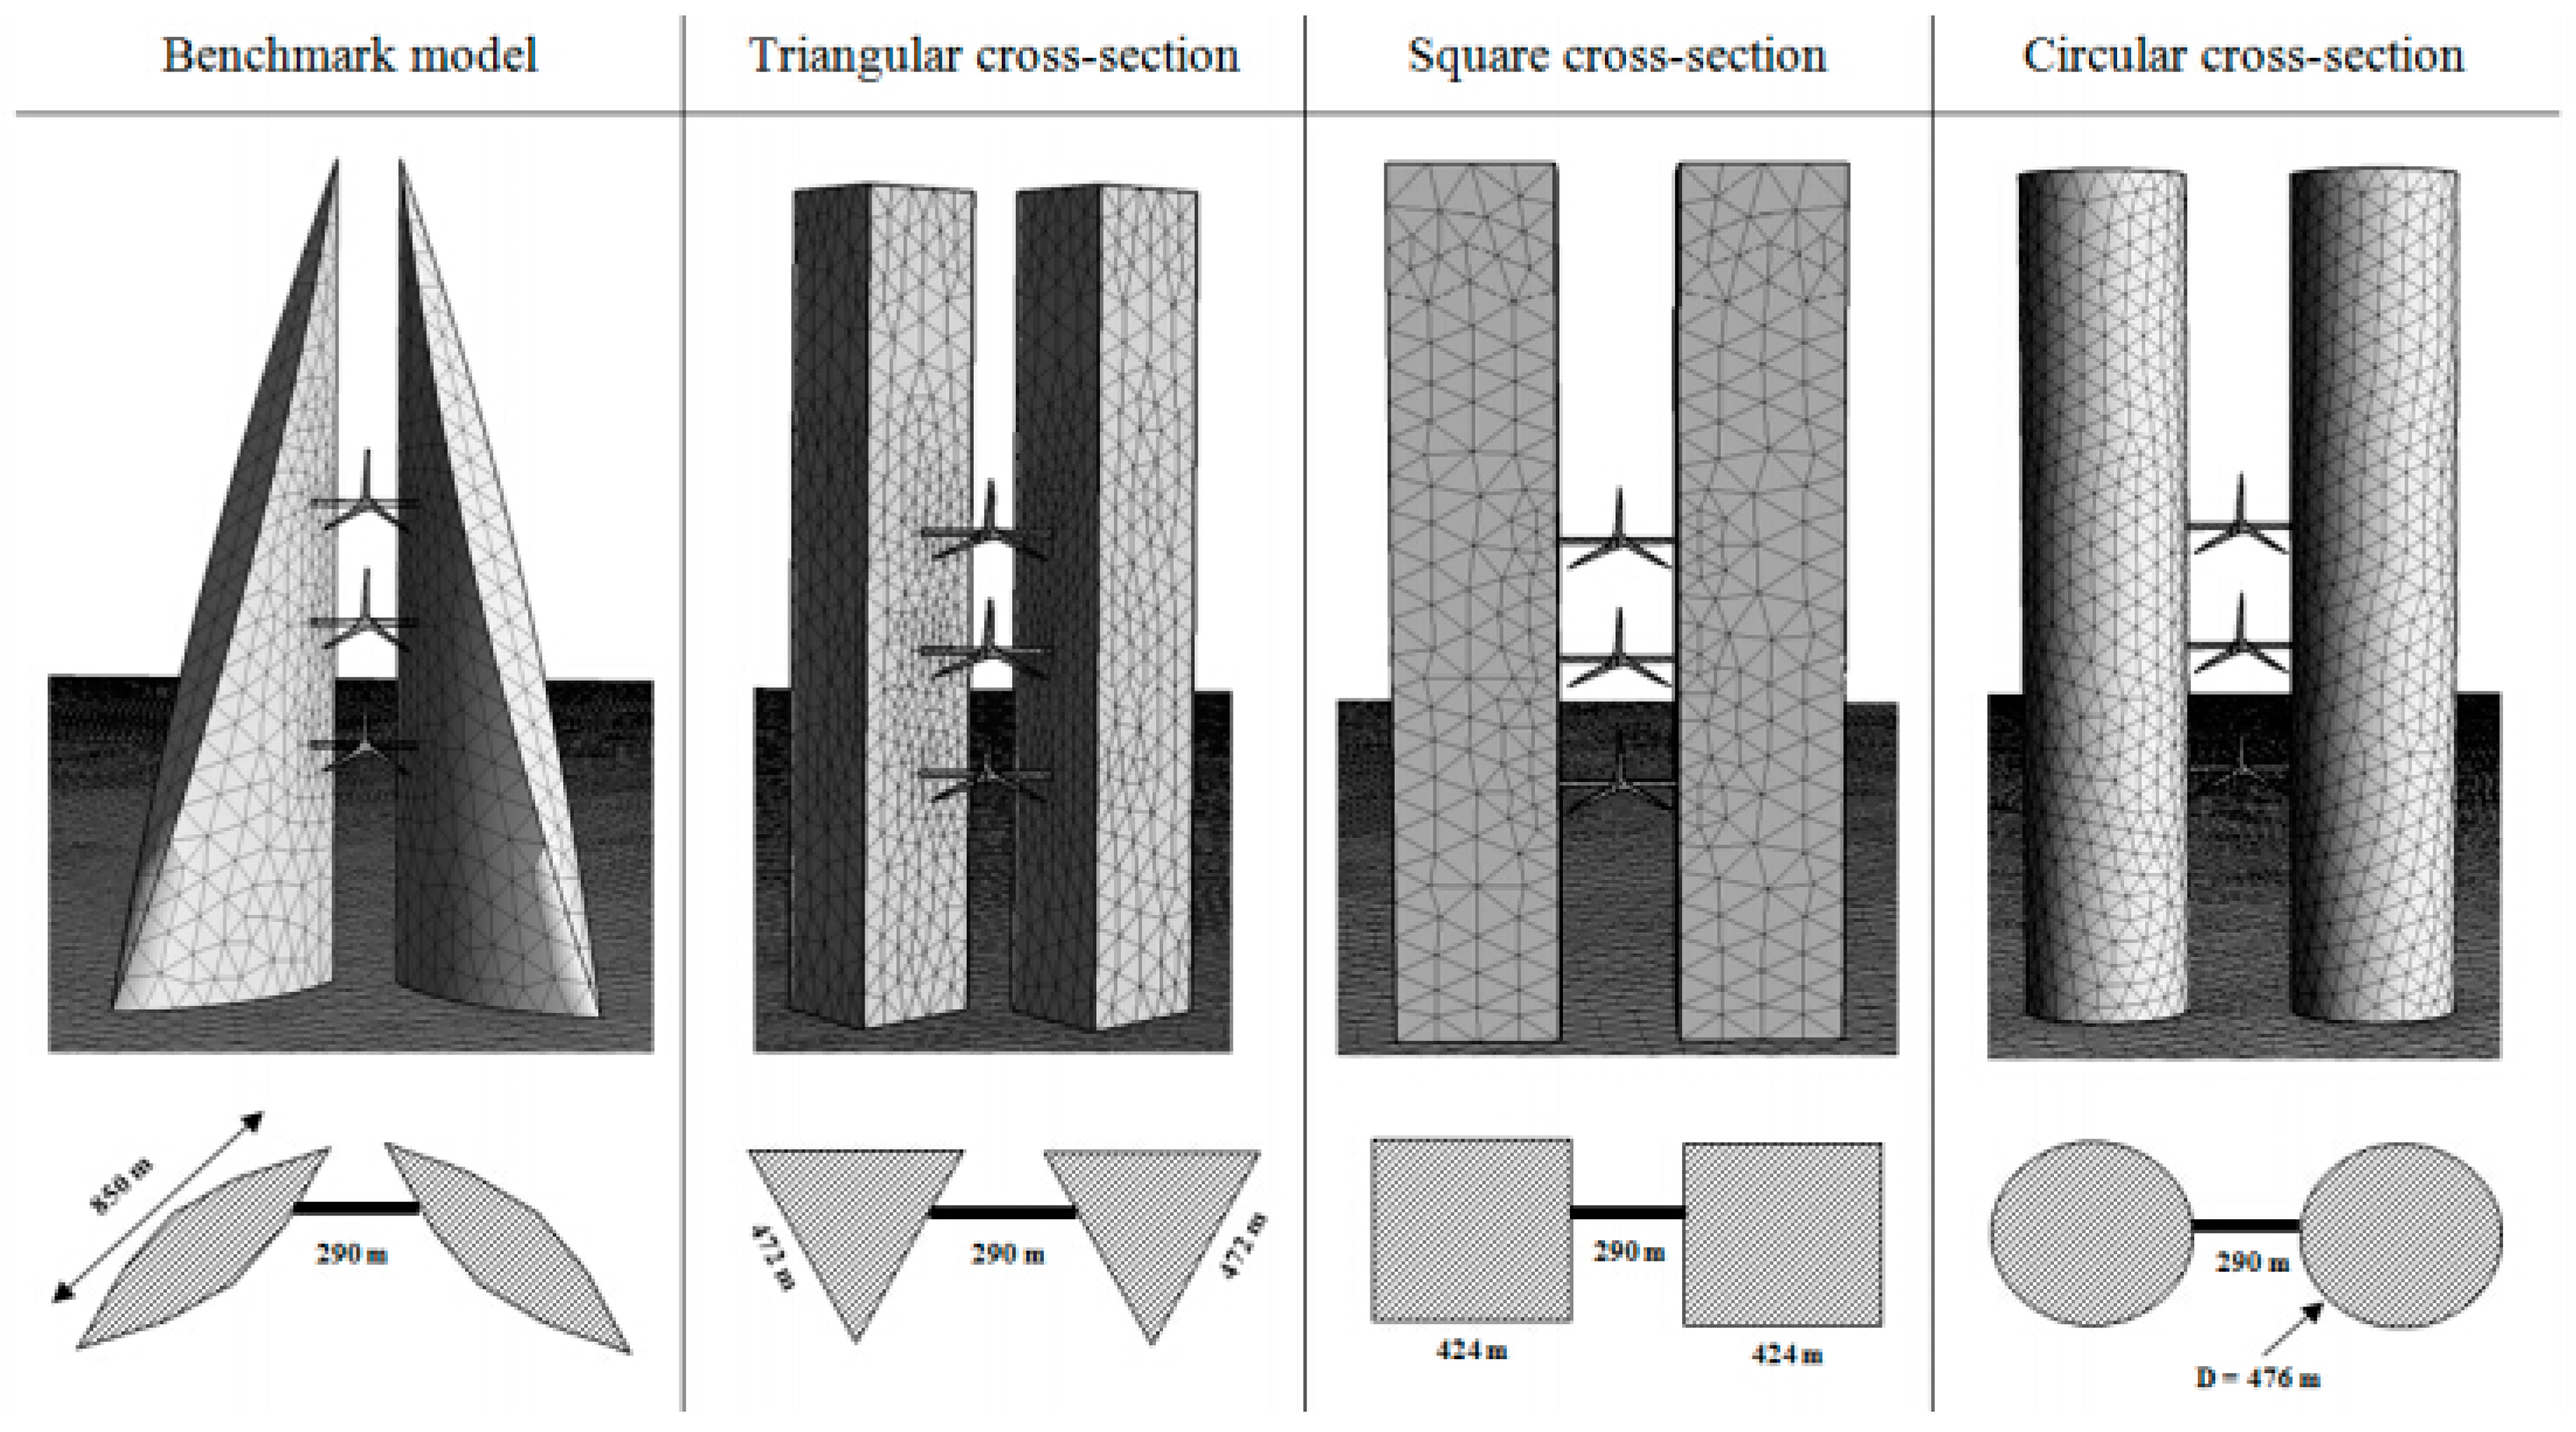
Chaudhry et al. (2014)Between two buildings326.9 kWFLUENT RANS, 3D, standard k-εResults of the investigation showed that circular building morphology was the most effective buildingshape, specifically suitable to areas with a dominant prevailing wind direction.
Wang et al. (2015)Between two buildings2-FLUENT RANS, 3D, standard k-εThe results demonstrated that in converging inlet mode, wind energy potential on the roof rises reasonably as the corner separation becomes larger, whereas in diverging inlet mode it reduces gradually with corner enlargement. When compared with isolated building, most of the corner configurations investigated demonstrated more wind energy density over the roof.
Veena et al. (2013)WT on high rise buildings3-Open FOAM, GAMBITReattachment length decreases on increasing the separation distance. The highest velocity rate on the second building was almost similar to that of the first building for non-dimensional separation distance up to 0.2 while for greater separations, the velocity reduces to 75%.
Zhou et al. (2017)Micro-wind utilisation in low-rise buildings--FLUENT, k-ε turbulenceThe potential of applying wind energy in low-rise residential buildings is enormous through implementing the proposed building shape of composite prism. Results showed great potential for wind energy implementation in built environment.
Balduzzi 2012Darrieus VAWT installed at the rooftop of a building--OpenFOAM, 2D, SIMPLE, Standard ke 3 turbulenceThe study showed 70%notable increase of the capacity factor in the rooftop area of installation building can be reached it was reasonably higher compared to the surrounding buildings and optimum geometric proportions of the building itself with respect to its upwind building were achieved; if not, a continuous detriment of the potential energy was observed.
Tabrizi, 2014Rooftop wind turbines--ANSYS CFX 14, WAsPAnalysis of the model demonstrated that the outcome was mainly sensitive to building height and shape, roof shape, turbine installation height and location, and wind direction.
Toja-Silva, 2015HAWT, VAWT--OpenFOAM LES, RANSThe most practical areas to install HAWT were above z/0.1 H = 9 from the roof surface upstream and above z/0.3 H = 1 downstream. It was suggested to incline the HAWT by 5° downwards at the upstream region below z/0.3 H = 1. The application of VAWT was suggested below these heights. The VAWT installation in horizontal position at the central-upstream area near to the roof surface was also taken into consideration, to make use of the recirculation of the flow.
White and Wakes (2014)Small wind-turbine to be installed on a tower--FLUENTThe existing permitted structure heights are not sufficiently high, hence lengthy planning consent processes and acceptance of sub-optimal turbine output were still needed. It was suggested that the Municipal councils in New Zealand may decrease barriers to small wind-turbine installations by considering taller towers, in the 15–20 m range, acceptable.
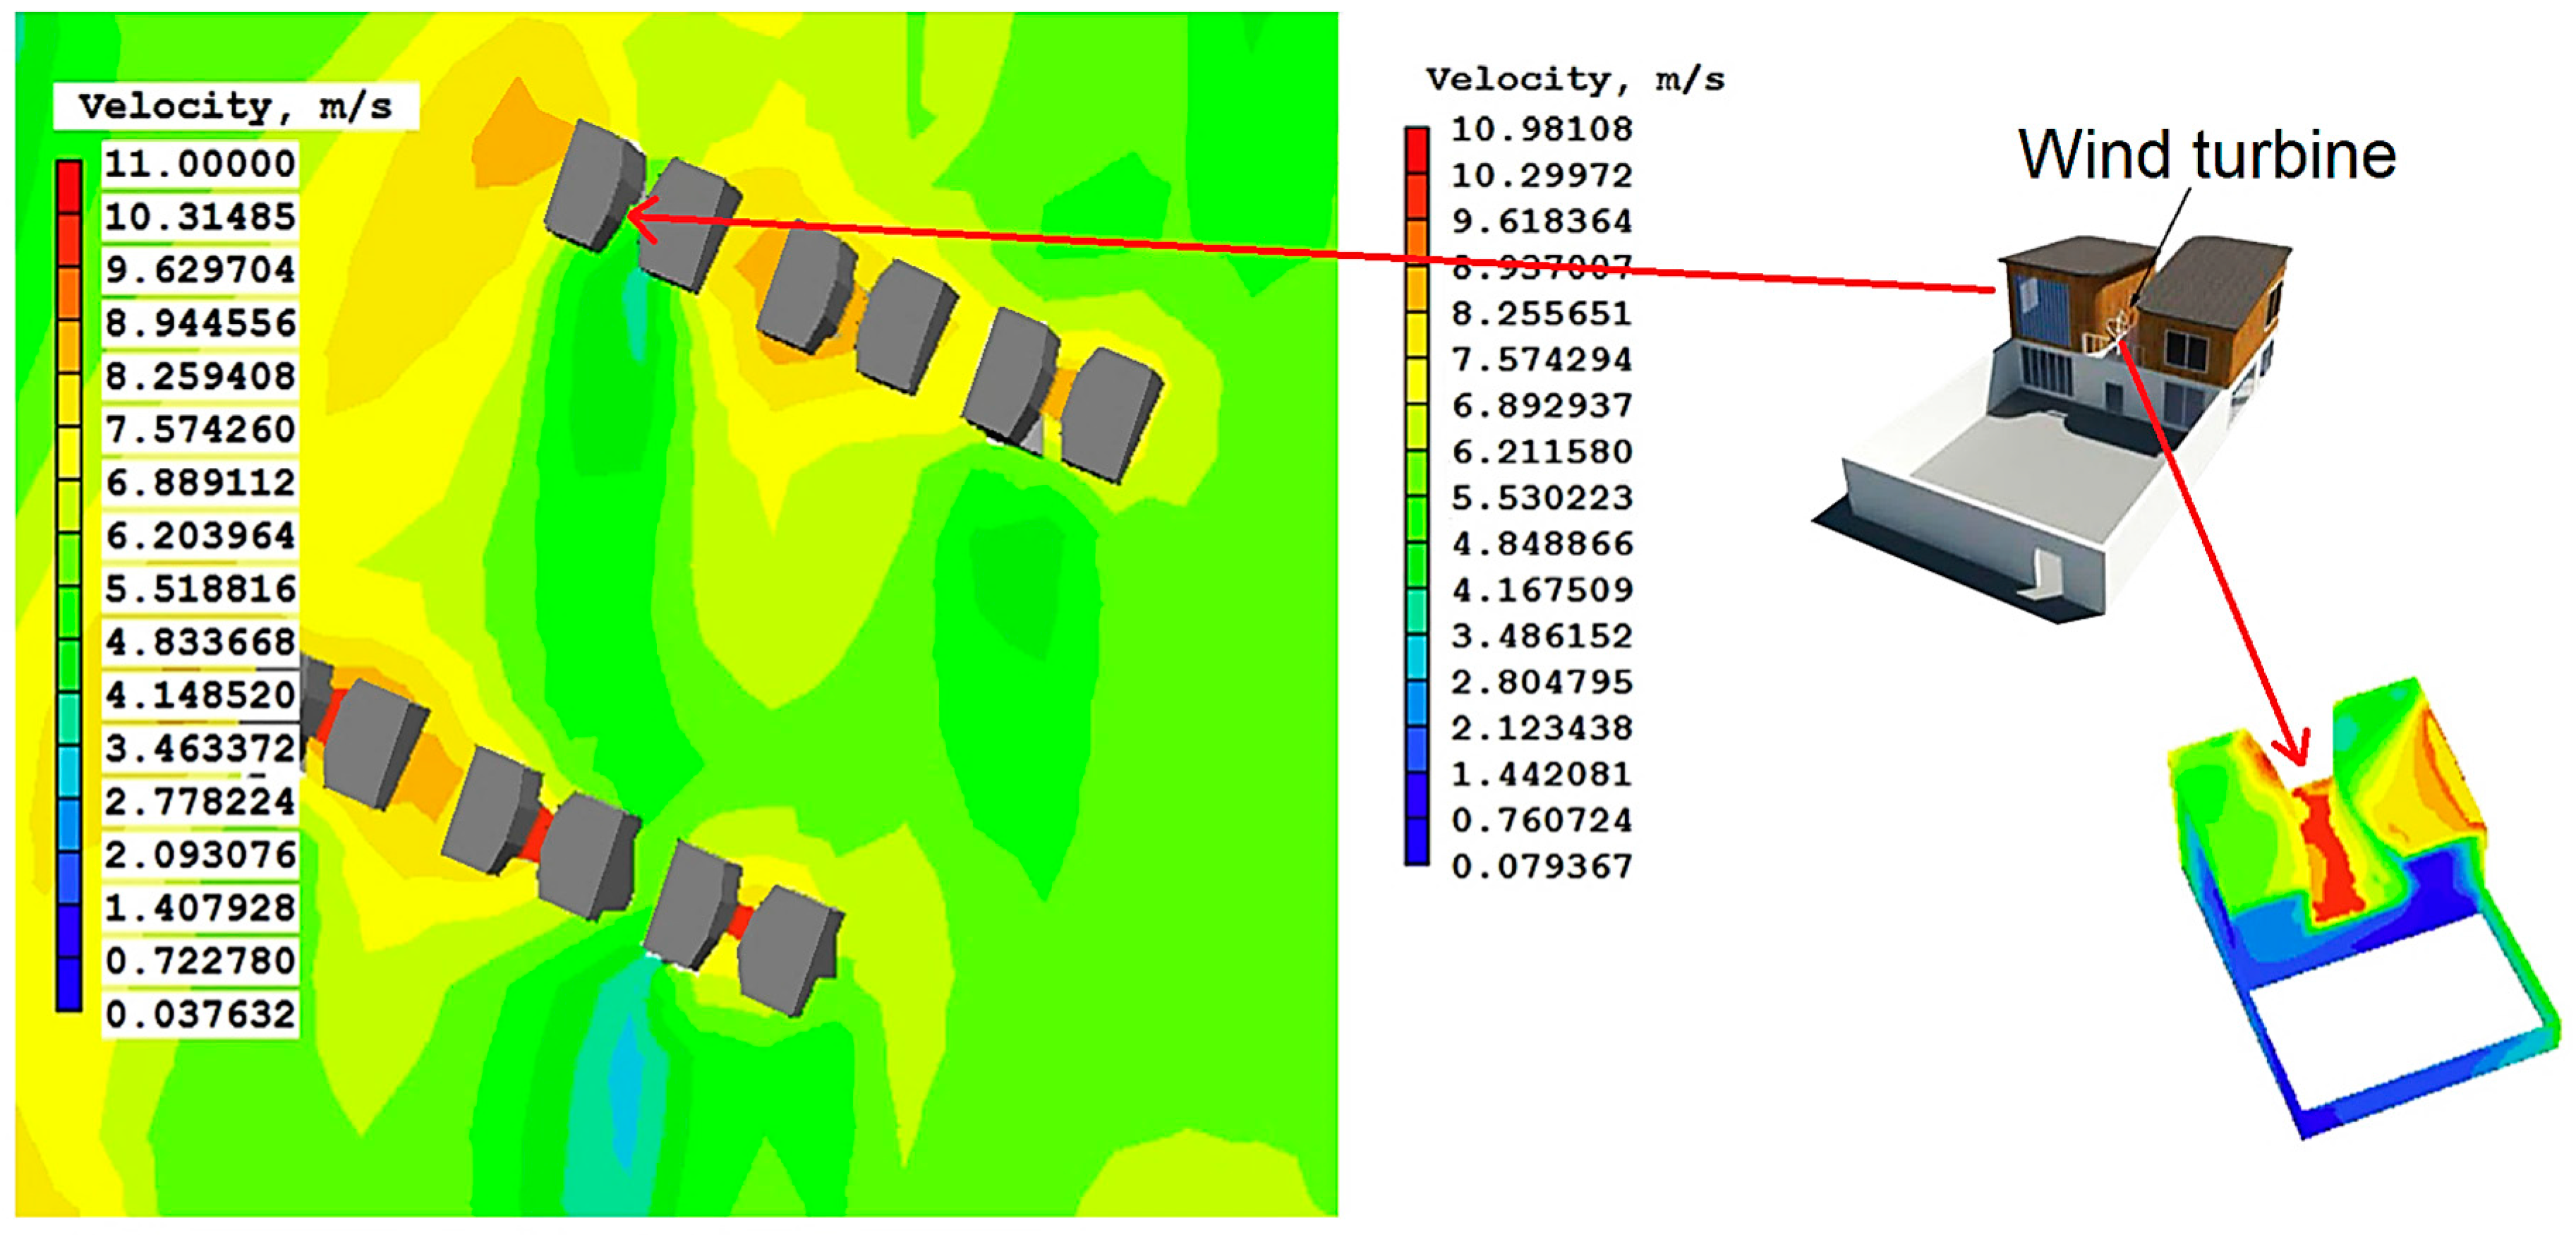
Wang et al. (2018)Roof mounting wind turbine1-FLUENT, k-ε turbulence, SIMPLECOptimal installation height is from 1.51 to 1.79 times the height of building and the best locations are at the forefront where the wind acceleration reaches its highest point, as the wind direction varies.
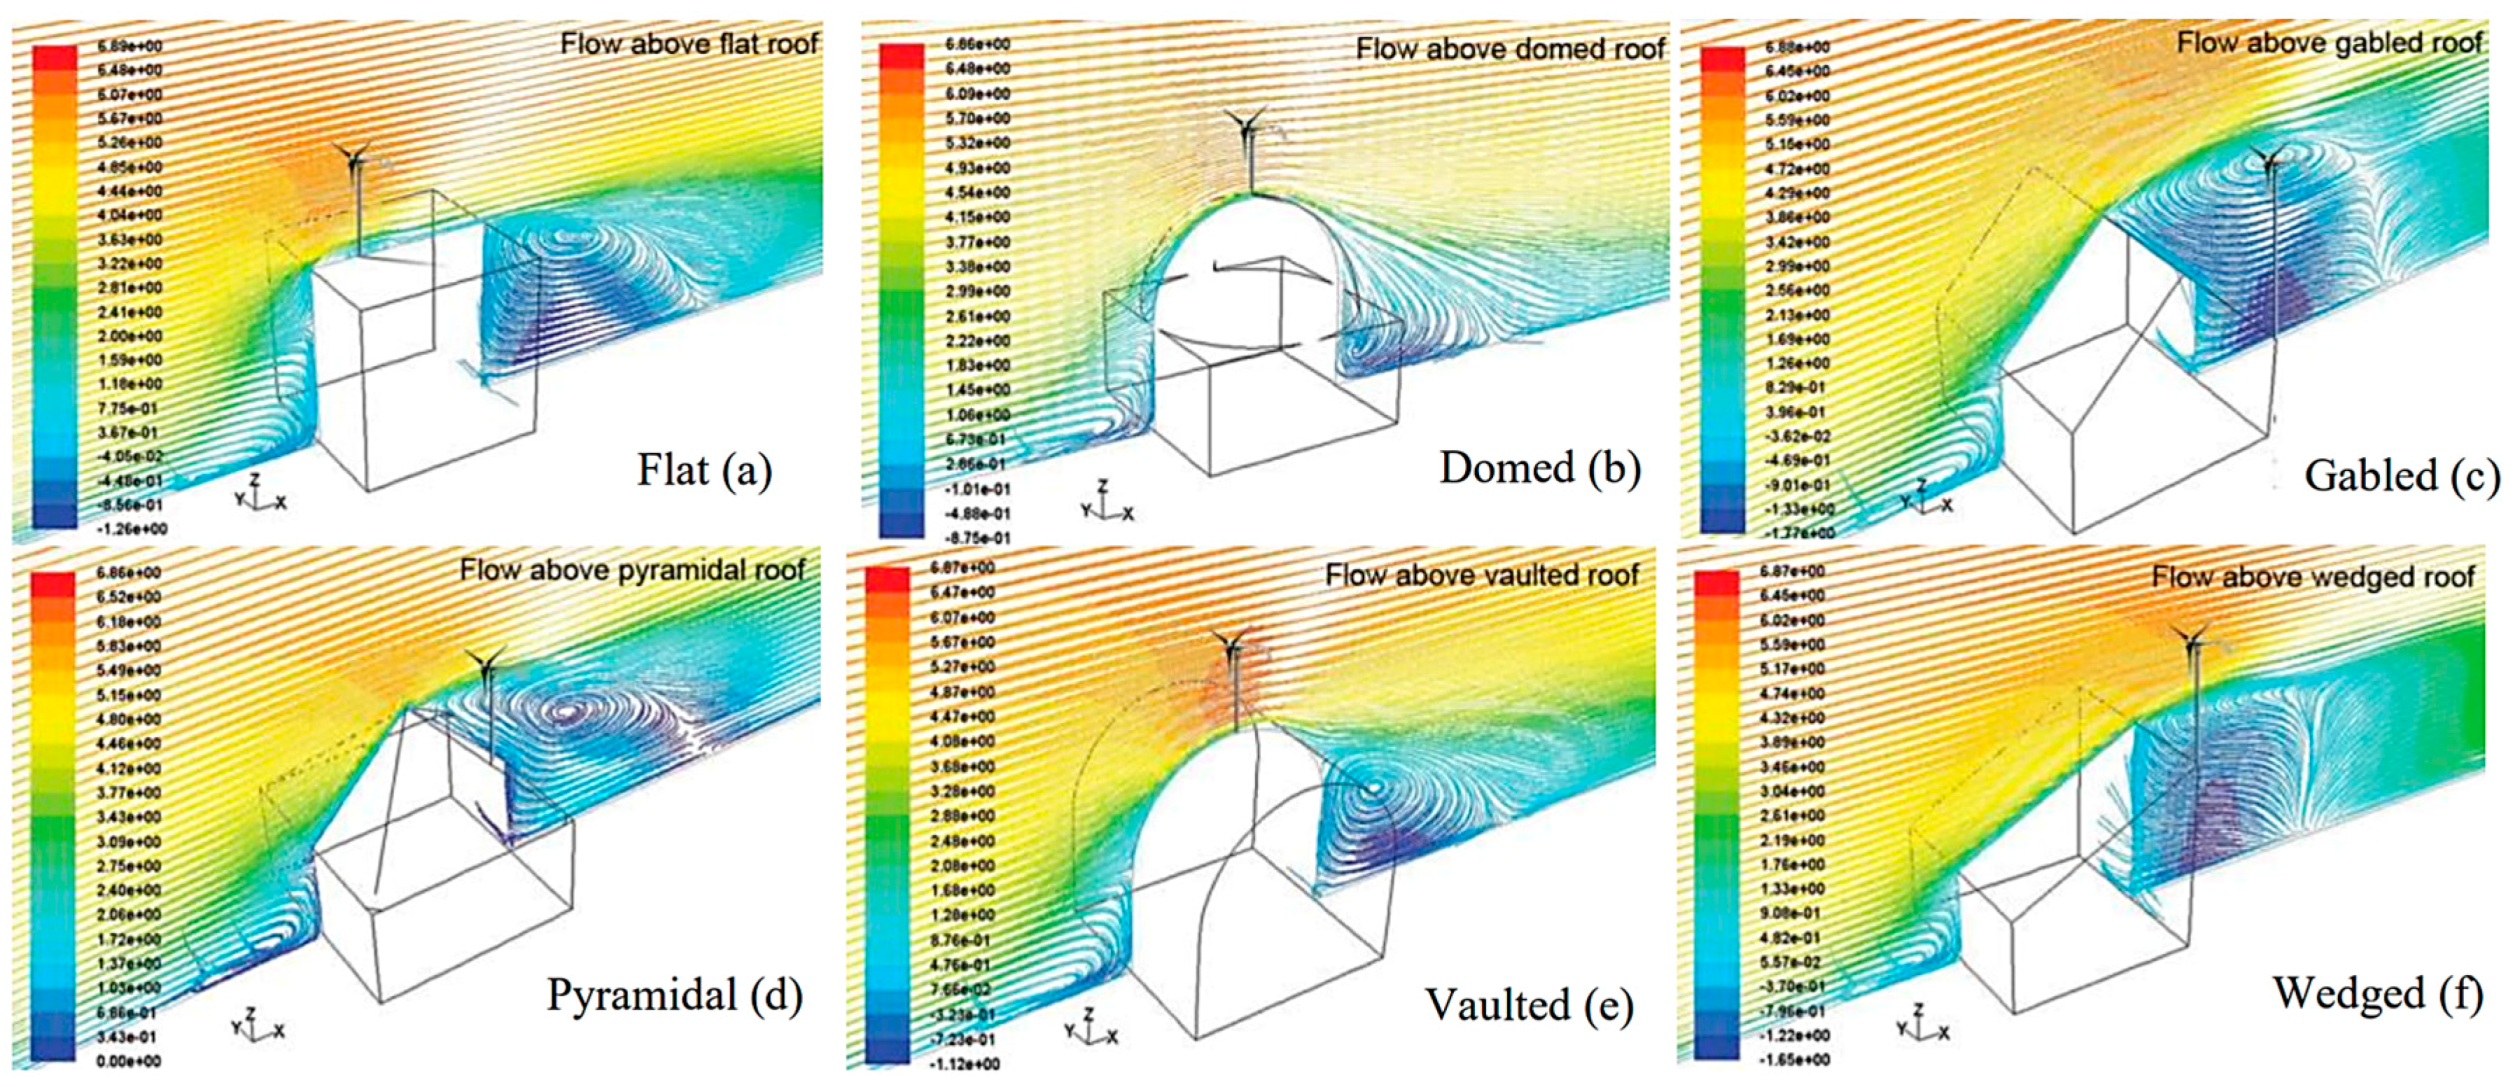
Ledo et al., 2011Building-integrated micro-wind turbines--FLUENTThe study demonstrated how the wind flow features are highly dependent on the shape of the roofs. It was seen that turbines integrated on flat roofs are possibly to produce higher and more steady power for the similar turbine hub elevation than the other roof shapes.
Abohela et al. (2011)Roof Mounted Wind Turbine1-FLUENT 12.1, 3D, RANS, k-ε turbulence,The vaulted roof was the optimum roof shape for wind turbines installed on the rooftop as the WT would generate 56% higher electricity compared to stand alone WT in the similar places under similar flow situations. Whereas the wedged roof showed least performance with regards to the accelerating effect on wind above it.
Toja-Silva et al. (2013)BAWT, HAWT, VAWT--ANSYS FLUENT, 2DThe results demonstrated that HAWT had better performance in flat-terrain installations, while in high-density building surroundings, the dominance of VAWT was shown.
Yang et al. (2016)VAWT--ANSYS/Fluent, 3D, RANS, k-ε modelThe high-rise buildings in the upstream direction of the investigated area have a tendency to block the incoming wind and create greater turbulence intensity on specific areas of the objective building. It was seen to be promising to increase the hub height and place micro turbines on the windward side of the building to obtain greater wind power production.
Park et al. (2015)Facade-integrated wind turbine (BIWT)-0.248 kWh/day for a yearSIMPLE, Navier–Stokes, 2D/Steady, k-omega (Standard), SIMPLEIt was seen from performance assessment that the model with the guide vane design and rotor for the Building Integrated Wind Turbine system accelerated the wind velocity to a satisfactory level and therefore enhances the power coefficient considerably. It was proven that the recommended configuration was promising for the sustainable and renewable energy production for urban areas.
Hassanli et al. (2017)Small-scale wind turbines installed on a building-high with double Skin Façade, VAWT and VAWT--FLUENT, SST-SAS, k-ω is, Eddy-viscosity, defaults to a URANSThe flow became more uniform while the turbulence gradually declines as flow develops through the cavity for all wind directions. Therefore, the areas in the middle of the leading and trailing sides of the cavity were promising locations for installing small-scale, building-mounted wind turbines. Also, the DSF system with a strategic opening can efficiently improve the flow within the cavity for a wide-ranging incident wind angles and can be used for wind energy harvesting purposes.
Table 3. Wind Turbine Assessment—Large Scale Wind Turbine.
AuthorTypeNo of WTCapacityTool/MethodKey Findings
Da-Costa et al. (2006)Wind farm within forests--WAsP, RANS, LES, k-εThe existence of the canopy may increase the levels of turbulence by almost 2 levels of magnitude, when compared to the outcome gathered without the model of canopy.
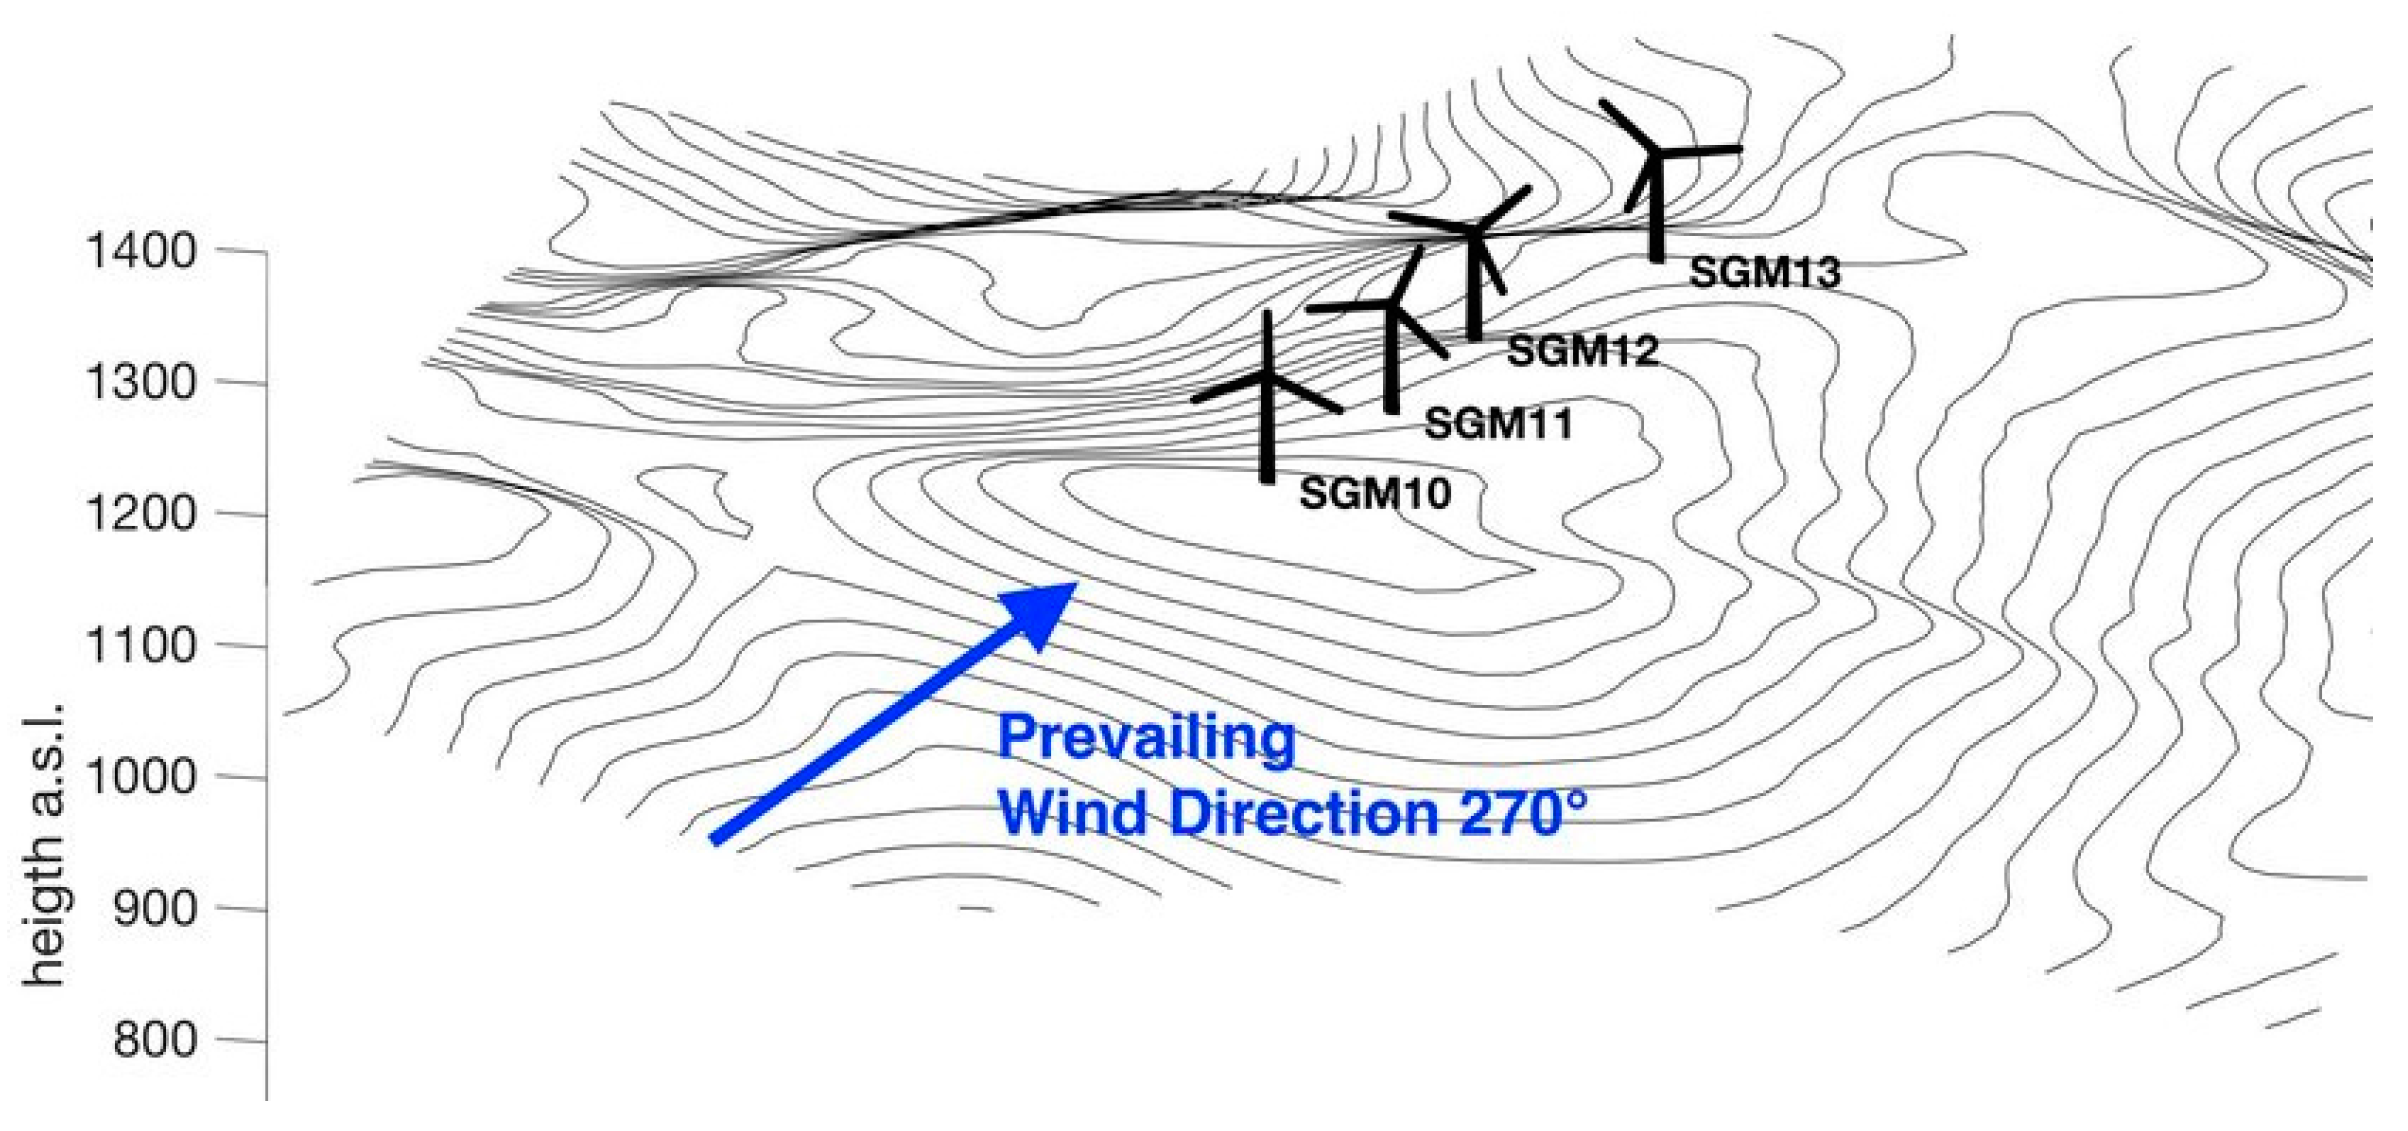
Castellani et al. (2017)Full-scale wind turbines working in a complex topography4-WindSim, RANS, LESThe main purpose of the study is to interpret in what way flow turbulences and wakes appeared in the vibration signals, both at the drive-train and structural level. Hence, this method creates link among mechanical and flow occurrences formed through vibrations, presenting a precious approach for calculating loads in various operating situations.
Palma et al. (2008)Wind turbine micro-siting in complex terrain3-WAsPGust factors and turbulence intensity showed to be unreliable estimators and highly dependent on sampling level and mean time period. Despite of great variances among the average wind speed at each of the 5 areas, the field measurements at one location, after appropriate investigations, added to the confidence in results and improved knowledge of the field of wind flow.
Makridis and Chick (2013)Wind turbine wakes with terrain effects1-WAsP, Fluent, VBMThe assessment of stream wise variations of turbulence and speed demonstrated a better agreement for both the downstream and upstream of the hilltop; the only main discrepancies were an underestimation of the velocity increase at the hilltop which was approximately 13% and an under prediction of the turbulence power at a hill around the lee side which was approximately35%.
Yan and Li (2016)Wake effects of wind turbines--LES, WAsP, RANS, Navier–StokesThe clear characteristics of the wind potential distribution was altitude-dependent and thus more wind energy was anticipated to be harvested with the rising elevation.
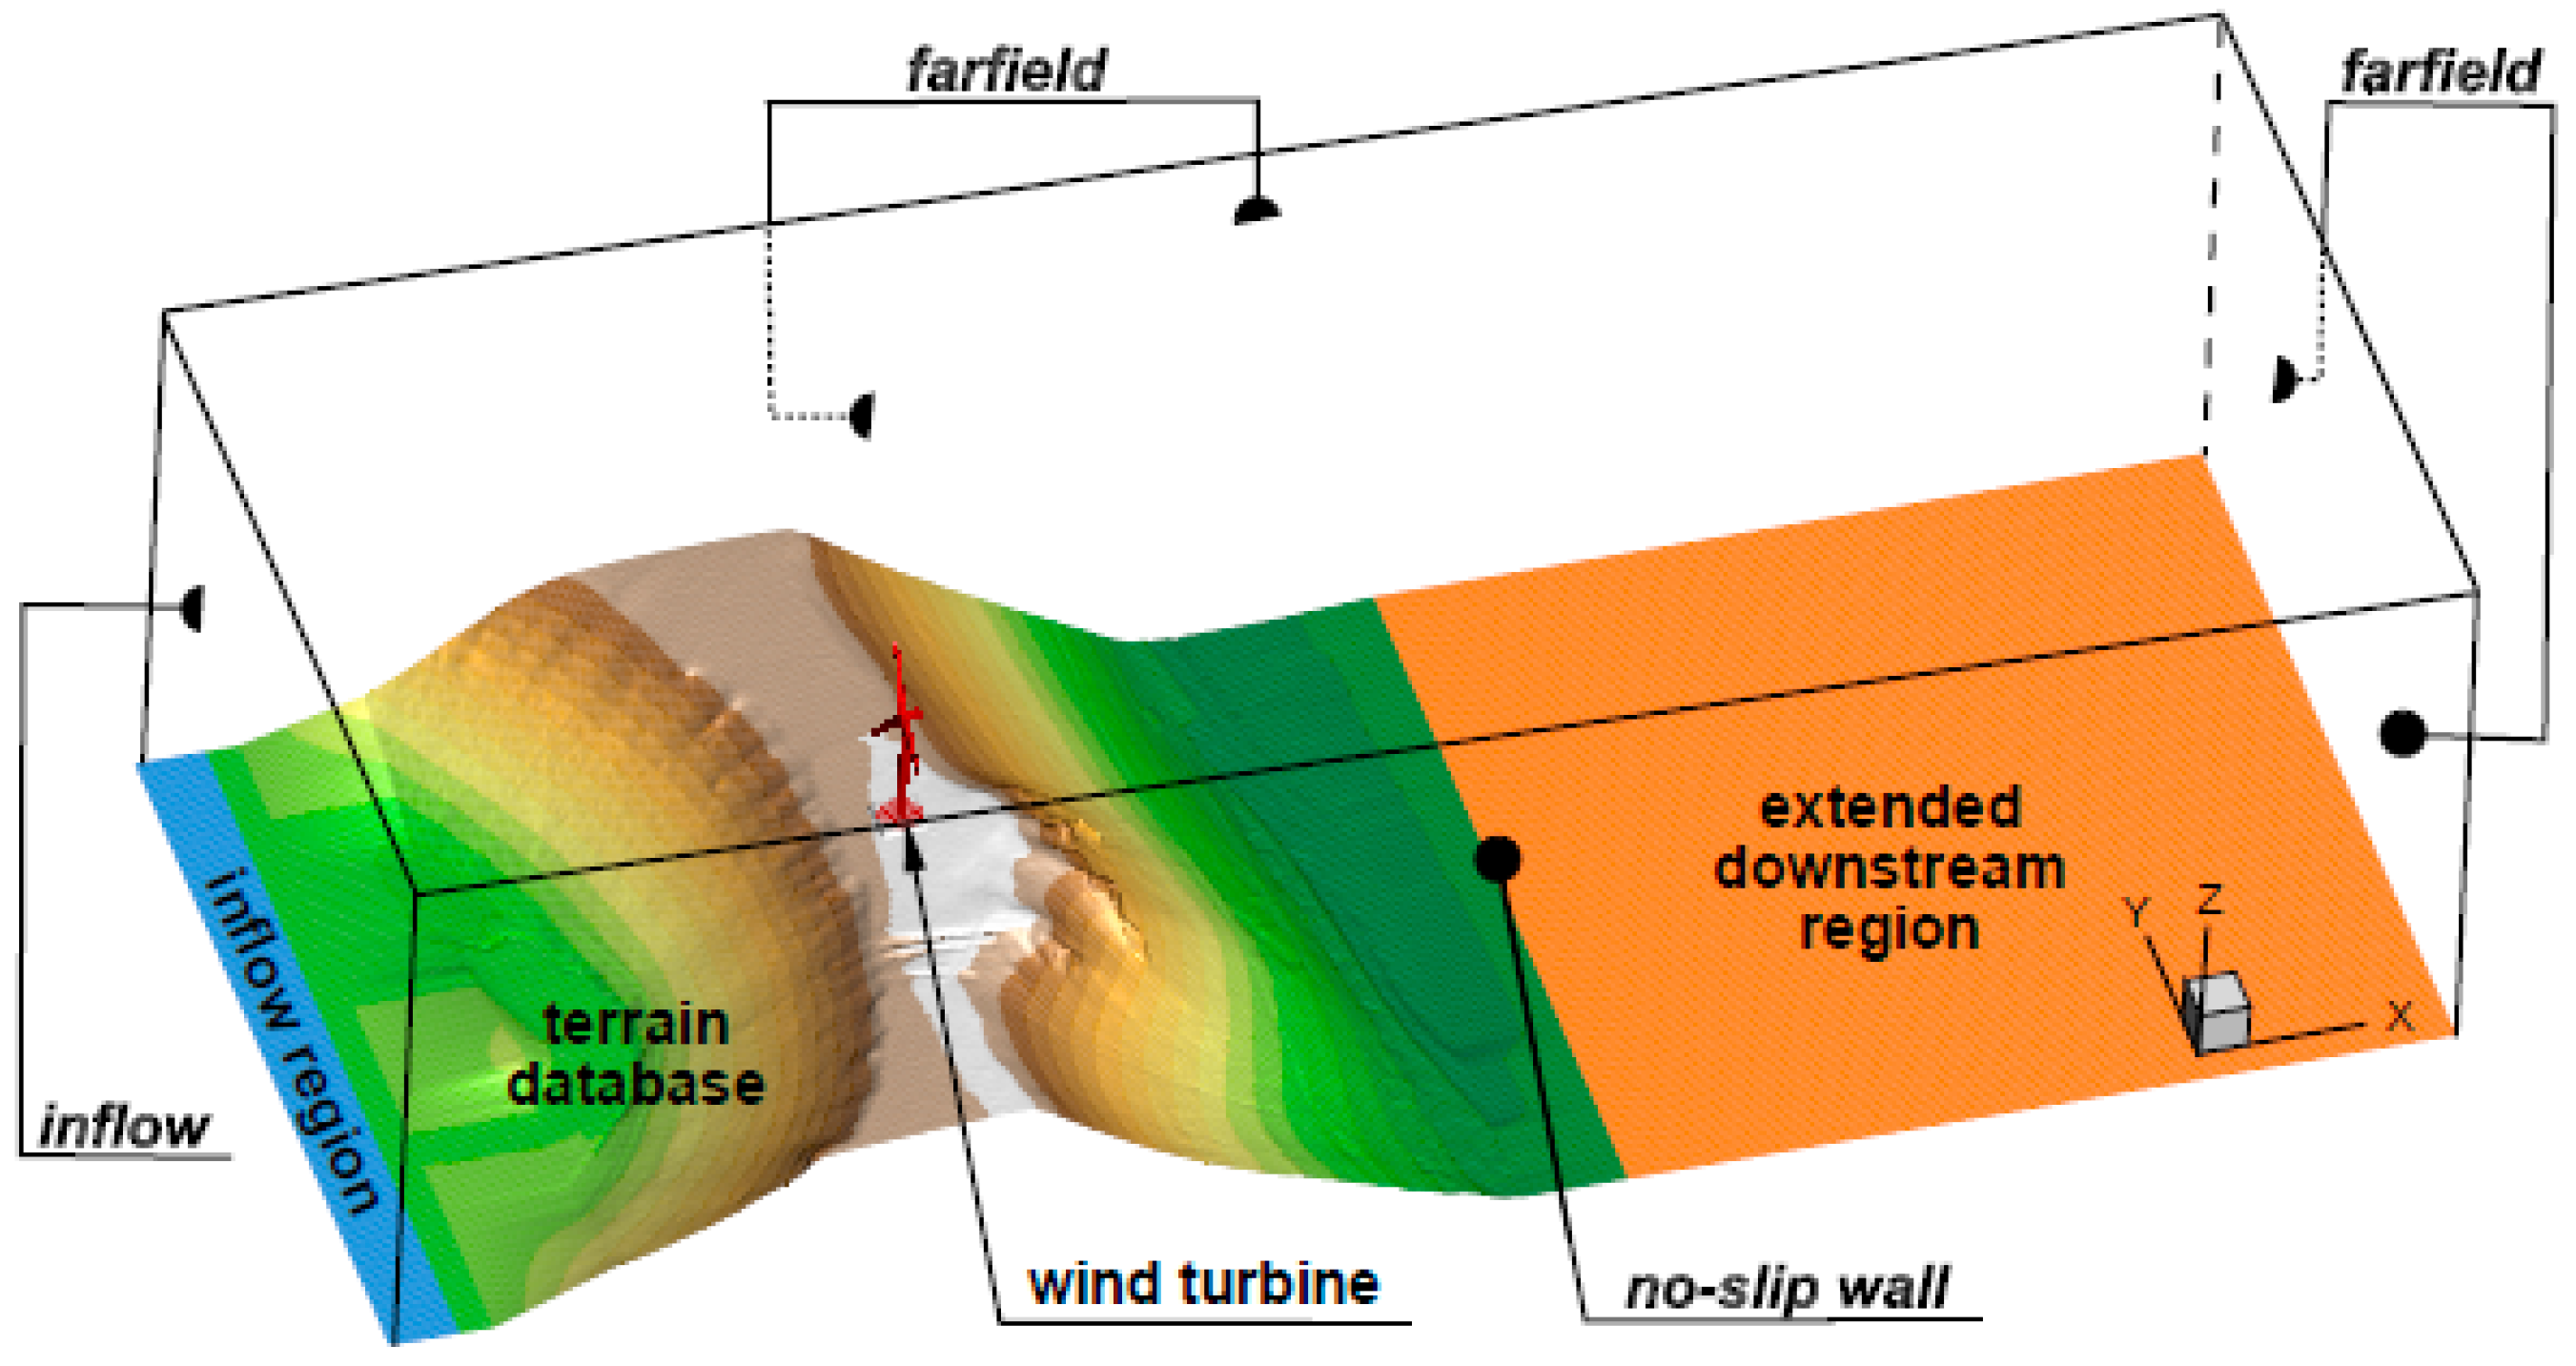
Nedjari et al. (2017)Wind turbine wake growth in farm over flat and complex topography-2 MW horizontal axis wind turbineFLUENT, RANS, 2D, 3DThe wind turbine design including the rotor diameter and mast height applied in the wake ground interaction showed to be an important factor to be considered when identifying the optimum distance in a wind farm.
The effects of the terrain on the wake were decreased at the top hub level with symmetrical wake sizes downwstream the rotor.
Kuo et al. (2016)Wind farm layout optimisation on complex topographies--LES, RANSIncorporating a CFD wake model with mixed-integer programming demonstrated that it can produce optimum layouts in complex terrains.
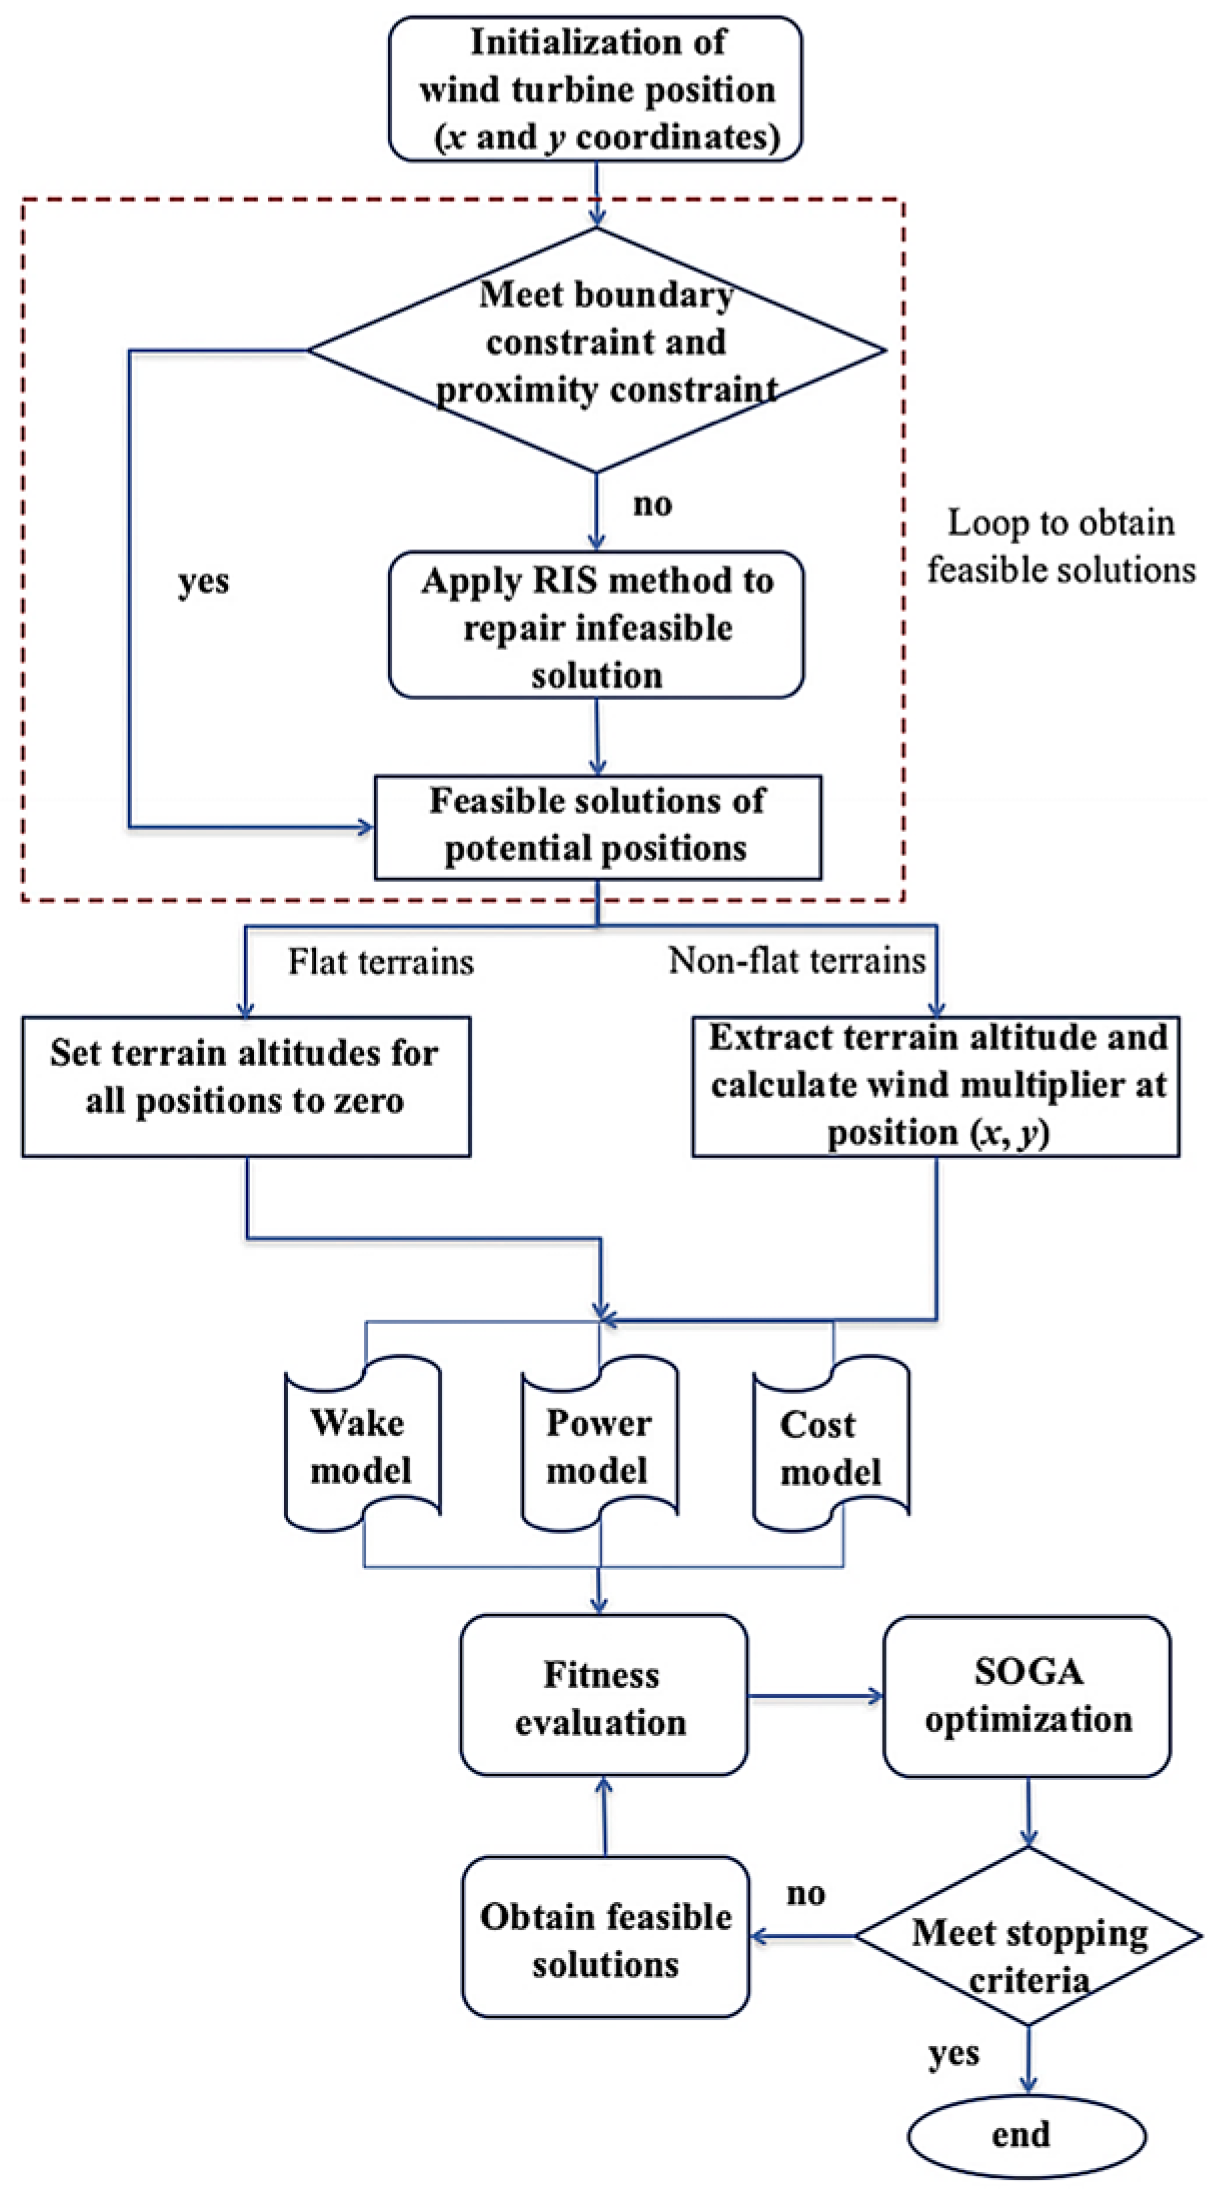
Wang et al. (2017)Wind farm layout-Flat terrain 10.2–11.8 MW Non-flat terrain 10.3–11.9 MWFLUENT, Wind Multiplier, RISConsideration of wind farm topography can generate important advantages and the wake interactions can be highly decreased by carefully positioning of wind turbines in the situations where a narrow wind direction was dominant.
Dhunny et al. (2017)Wind farm for a highly complex terrain-1500–2500 MWh/m2/year at 110 mWindSim, CDS, Standard k-ε, k-ε with Yap corrections, RNG k-ε and Modified k-εThe WindSim was an ideal software to investigate the flow of the wind on a very complex topography like in the studied locations in Mauritius with reasonable accuracy.
Topographical distribution of seasonal wind velocity was highly affected by the local topography.
Li et al. (2016)Wind Turbine Operation with Low Roughness Topography--Fluent, GAMBIT, 3D, SST k-ωturbulence, SIMPLICThe wind-turbine wakes improved the vertical mixing, resulting in changes to the flow. As compared to the original velocity distribution, the wind speed decreased rapidly when passing the wind turbine and then rising slowly, however it still cannot achieve the initial speed at 17 rotor diameters. The distribution of the turbulent kinetic energy after the wind turbines was a bit diverse, particularly at top-tip level near the wind turbines. The turbulent kinetic energy behind the turbine rises rapidly, and later decreases with the extension of the downstream.
Tromeur et al. (2016)Wind Turbine model in a large wind farm--WindFarmer, ECN-Wakefar, WAsP, NTUA, Meteodyn WT, k-εAll the proposed large wind farm models had the ability to capture width of the wake to a degree and the reduced power output moving through the wind farm. In spite of uncertainties, this promising model integration allows to take into account the slowdown in large wind farms.
Schulz et al. (2014)Wind turbine in Complex Topography in Atmospheric Inflow Situations--FLOWer,3D, DES, BEMThe complex terrain condition showed overall three main effects including the rise of turbulence and subsequently of load and power variations, mean wind speed increase and as a result load and power increase, and a correlation among the load and power behaviour and inclination angle.
Schmidt and Stoevesandt (2014)Wind farm layout optimisation in complex terrain642.5 MW nominal powerOpenFOAM, RANS, FLAPFOAM, k-ε EKMThe positioning of turbines was highly constraint for real-life on-shore developments. However, optimisation codes can provide vital input during the design phase, particularly for complex locations where the optimum layout may not always be obvious.
Liu et al. (2017)Onshore wind farm in Southwest China33 site,1.5 MW of assessed powerFLUENT, RANS, SST k-ωStable CFD model with improved actuator disk technique was capable of examining wind resource well and provide better balance among calculating accuracy and efficiency, in contrary to more expensive computation methods including actuator-surface/actuator-line transient model, or fewer accurate approaches including linear speed reduction wake model.
Feng and Shen (2014)Wind farm layout optimisation in complex terrain25–3017.76
19.28
17.76
19.28 MW
WAsP, LES, EllipSys3DWind farm layouts obtained using experts guess methods were very different compared to the optimum ones that result in great area of improvement for wind farm layout optimisation. Random Search algorithm showed many good features including effectiveness in developing primary layouts in several situations, robust in multiple runs.

