Review

Unravelling the Potential of Density Functional Theory through Integrated Computational Environments: Recent Applications of the Vienna Ab Initio Simulation Package in the MedeA® Software

1
Materials Design SARL, 42, Avenue Verdier, 92120 Montrouge, France
2
Materials Design, Inc., 12121 Scripps Summit Drive, Suite 140, San Diego, CA 92131, USA
*
Author to whom correspondence should be addressed.
Submission received: 16 October 2018 / Revised: 15 November 2018 / Accepted: 28 November 2018 / Published: 5 December 2018
(This article belongs to the Special Issue Ab Initio Modelling in Solid State Chemistry)

Abstract

:
The development of density functional theory and the tremendous increase of compute power in recent decades have created a framework for the incredible success of modern computational materials engineering (CME). CME has been widely adopted in the academic world and is now established as a standard tool for industrial applications. As theory and compute resources have developed, highly efficient computer codes to solve the basic equations have been implemented and successively integrated into comprehensive computational environments leading to unprecedented increases in productivity. The MedeA software of Materials Design combines a set of comprehensive productivity tools with leading computer codes such as the Vienna Ab initio Simulation Package (VASP), LAMMPS, GIBBS and the UNiversal CLuster Expansion code (UNCLE), provides interoperability at different length and time scales. In the present review, technological applications including microelectronic materials, Li-ion batteries, disordered systems, high-throughput applications and transition-metal oxides for electronics applications are described in the context of the development of CME and with reference to the MedeA environment.

1. Introduction

Since the turn of the millennium, industrial exploitation of computational materials research has seen a tremendous development. Atomistic simulations have become established as an integral part in research and development processes in many industrial sectors including automotive, aerospace, energy, chemicals, electronics, oil and gas, metals and alloys, glass and ceramics, and polymers. In all these sectors, computations help the process of finding new materials with unprecedented properties as well as tailoring and improving existing materials to make them better suited for their desired purpose. Atomistic simulations complement experimental investigations by providing detailed mechanistic understanding and systematic materials property data, thus reducing the number of candidates in screening studies, by contrasting measured data for mutual checks and by enlarging the databases of materials properties. Of course, the rapid dissemination of theoretical methods is accelerated by the dramatic increase in compute power during the last few decades, which today allows for computations which would have been out of reach just a few years before. The foundations of this success were laid many decades ago when the fundamental theories of modern physics such as quantum theory, statistical mechanics, as well as the theory of relativity were originally established. Clearly, one of the major steps in the development of the theoretical toolbox currently at our disposal was the formulation of density functional theory in the 1960s, which drew the attention to the electron density as the fundamental variable and eliminated the burden of calculating and storing the full many-body wave function. The 1970s and 1980s saw the initial implementation of these new ideas into highly efficient computer codes. Beginning with the 1980s, integrated software environments such as Biosym’s Insight integrating Discover and DMol, Quanta/Charmm of Polygen, ACACS of NEC and Sumitomo Chemical, UniChem of Cray Research and Cerius of Molecular Simulations/Accelrys emerged. Later, these early integrative concepts were further advanced by second generation environments such as the MedeA software of Materials Design [1], combining experimental databases and highly efficient simulation engines with a modern infrastructure for fully automated and high-throughput computations. Related efforts are QuantumATK of Synopsys, the Atomic Simulation Environment (ASE) [2], the Materials Project [3], the Open Quantum Materials Database (OQMD) [4,5], NoMAD [6] and Aiida [7], just to mention a few. These tools are now well established and have a tremendous impact on the daily work of industrial researchers since they free them from routine work and allow them to focus on the scientific and technological problems to be solved. In addition, integrated software environments provide guidance when it comes to use of the underlying computer codes and optimal use of the computational resources. Finally, these software packages lend themselves to broad exploration by allowing, for example, efficient scanning of compounds, crystal structures and their properties, providing thereby insights into structure-property relationships.
The present review article serves a twofold goal: First, by means of several examples from recent research performed with industrial partners we demonstrate the capabilities and strengths of modern computational materials research based on highly efficient computer codes such as the Vienna Ab initio Simulation Package (VASP) and their integration into comprehensive software environments such as the MedeA software. Second, we aim at showing the reader ways to translate such real-life industrial problems into computational tasks, which are accessible to the simulation tools at hand and thereby to arrive at solutions.
Hence, the following sections provide recent applications of the prediction of materials properties using ab initio computations during materials engineering research and development. These applications include published as well as unpublished work. All investigations made use of the wide range of capabilities offered by the modern MedeA software environment [1], which range from building tools for crystalline, amorphous and disordered systems as well as for surfaces, interfaces and defects to analysis tools facilitating the display of vibrational, electronic, magnetic, optical and transport properties and include simulation techniques such as VASP, the Molecular Orbital PACkage (MOPAC), the Large-scale Atomic/Molecular Massive Parallel Simulator (LAMMPS), Gaussian, GIBBS, PHONON and UNCLE.

2. Computational Methods

The applications presented in this article all used the Vienna Ab initio Simulation Package [8,9,10,11] and its efficient implementation of density functional theory (DFT) methods [12,13], which is fully integrated in the MedeA software environment [1]. The single-particle equations were solved using the projector-augmented wave (PAW) method [14]. Exchange-correlation effects were accounted for by two different parametrizations of the generalized-gradient approximation (GGA), namely, either the one by Perdew, Burke and Ernzerhof (PBE) [15] or the PBEsol scheme proposed by Perdew and co-workers [16].
In addition, calculations for vanadium dioxide as described below were performed using the recently developed hybrid functionals. While the local density approximation (LDA) and the generalized gradient approximation have proven to be well suited for describing rather weakly-correlated metals they are known to underestimate or in some cases even miss the optical band gap of semiconductors and insulators. Developments to overcome this weakness led to the so-called hybrid functionals. Specifically, within the framework of the generalized Kohn-Sham scheme [17] hybrid functionals combine the exchange functional as arising from the GGA with the expression known from Hartree-Fock theory. This approach has proven to yield very accurate band gaps for a vast number of semiconductors [18]. In the present context, the functional proposed by Heyd, Scuseria and Ernzerhof (HSE) was used [19]. In this approach, the short-range part of the exchange functional is represented by a combination of the GGA and Hartree-Fock contributions with a fixed ratio, while the long-range part and the correlation functional are described by the GGA alone.

3. Illustrative Cases

3.1. Design of Low-Strain Cathode Materials for Solid-State Li-Ion Batteries

Long-term stability and safety are critical requirements in the search for new battery materials with higher capacities. While the need for safer batteries has initiated the development of solid-state electrolytes, new challenges have emerged regarding the mechanical stability at the interfaces with the electrodes. Since most of the known active materials, employed both as negative and positive electrodes, experience expansion and contraction during operation, cracks form within the electrodes and at the interfaces with the rigid electrolyte causing degradation of the battery performance and limitation of the overall lifetime [20]. While on the anode side Li4Ti5O12 has been shown to operate with nearly zero strain [21], a cathode material with similar properties was sought at the time this study was initiated. Candidate electrode materials as given in Figure 1 show either rather low voltage or large volume change as in the case of the previous benchmark material LiNi0.5Mn1.5O4 [22]. In the following, we describe how ab initio calculations based on density functional theory can be utilized to investigate a class of transition-metal oxides based on the spinel structure for their suitability as low-strain cathode materials [23,24]. Indeed, from these calculations, three low-strain materials have been identified within the class of LiMnxCryMgzO4. The most promising materials have been synthesized and characterized by X-ray diffraction and electrochemical techniques. The results are consistent with the ab initio predictions [23,24].
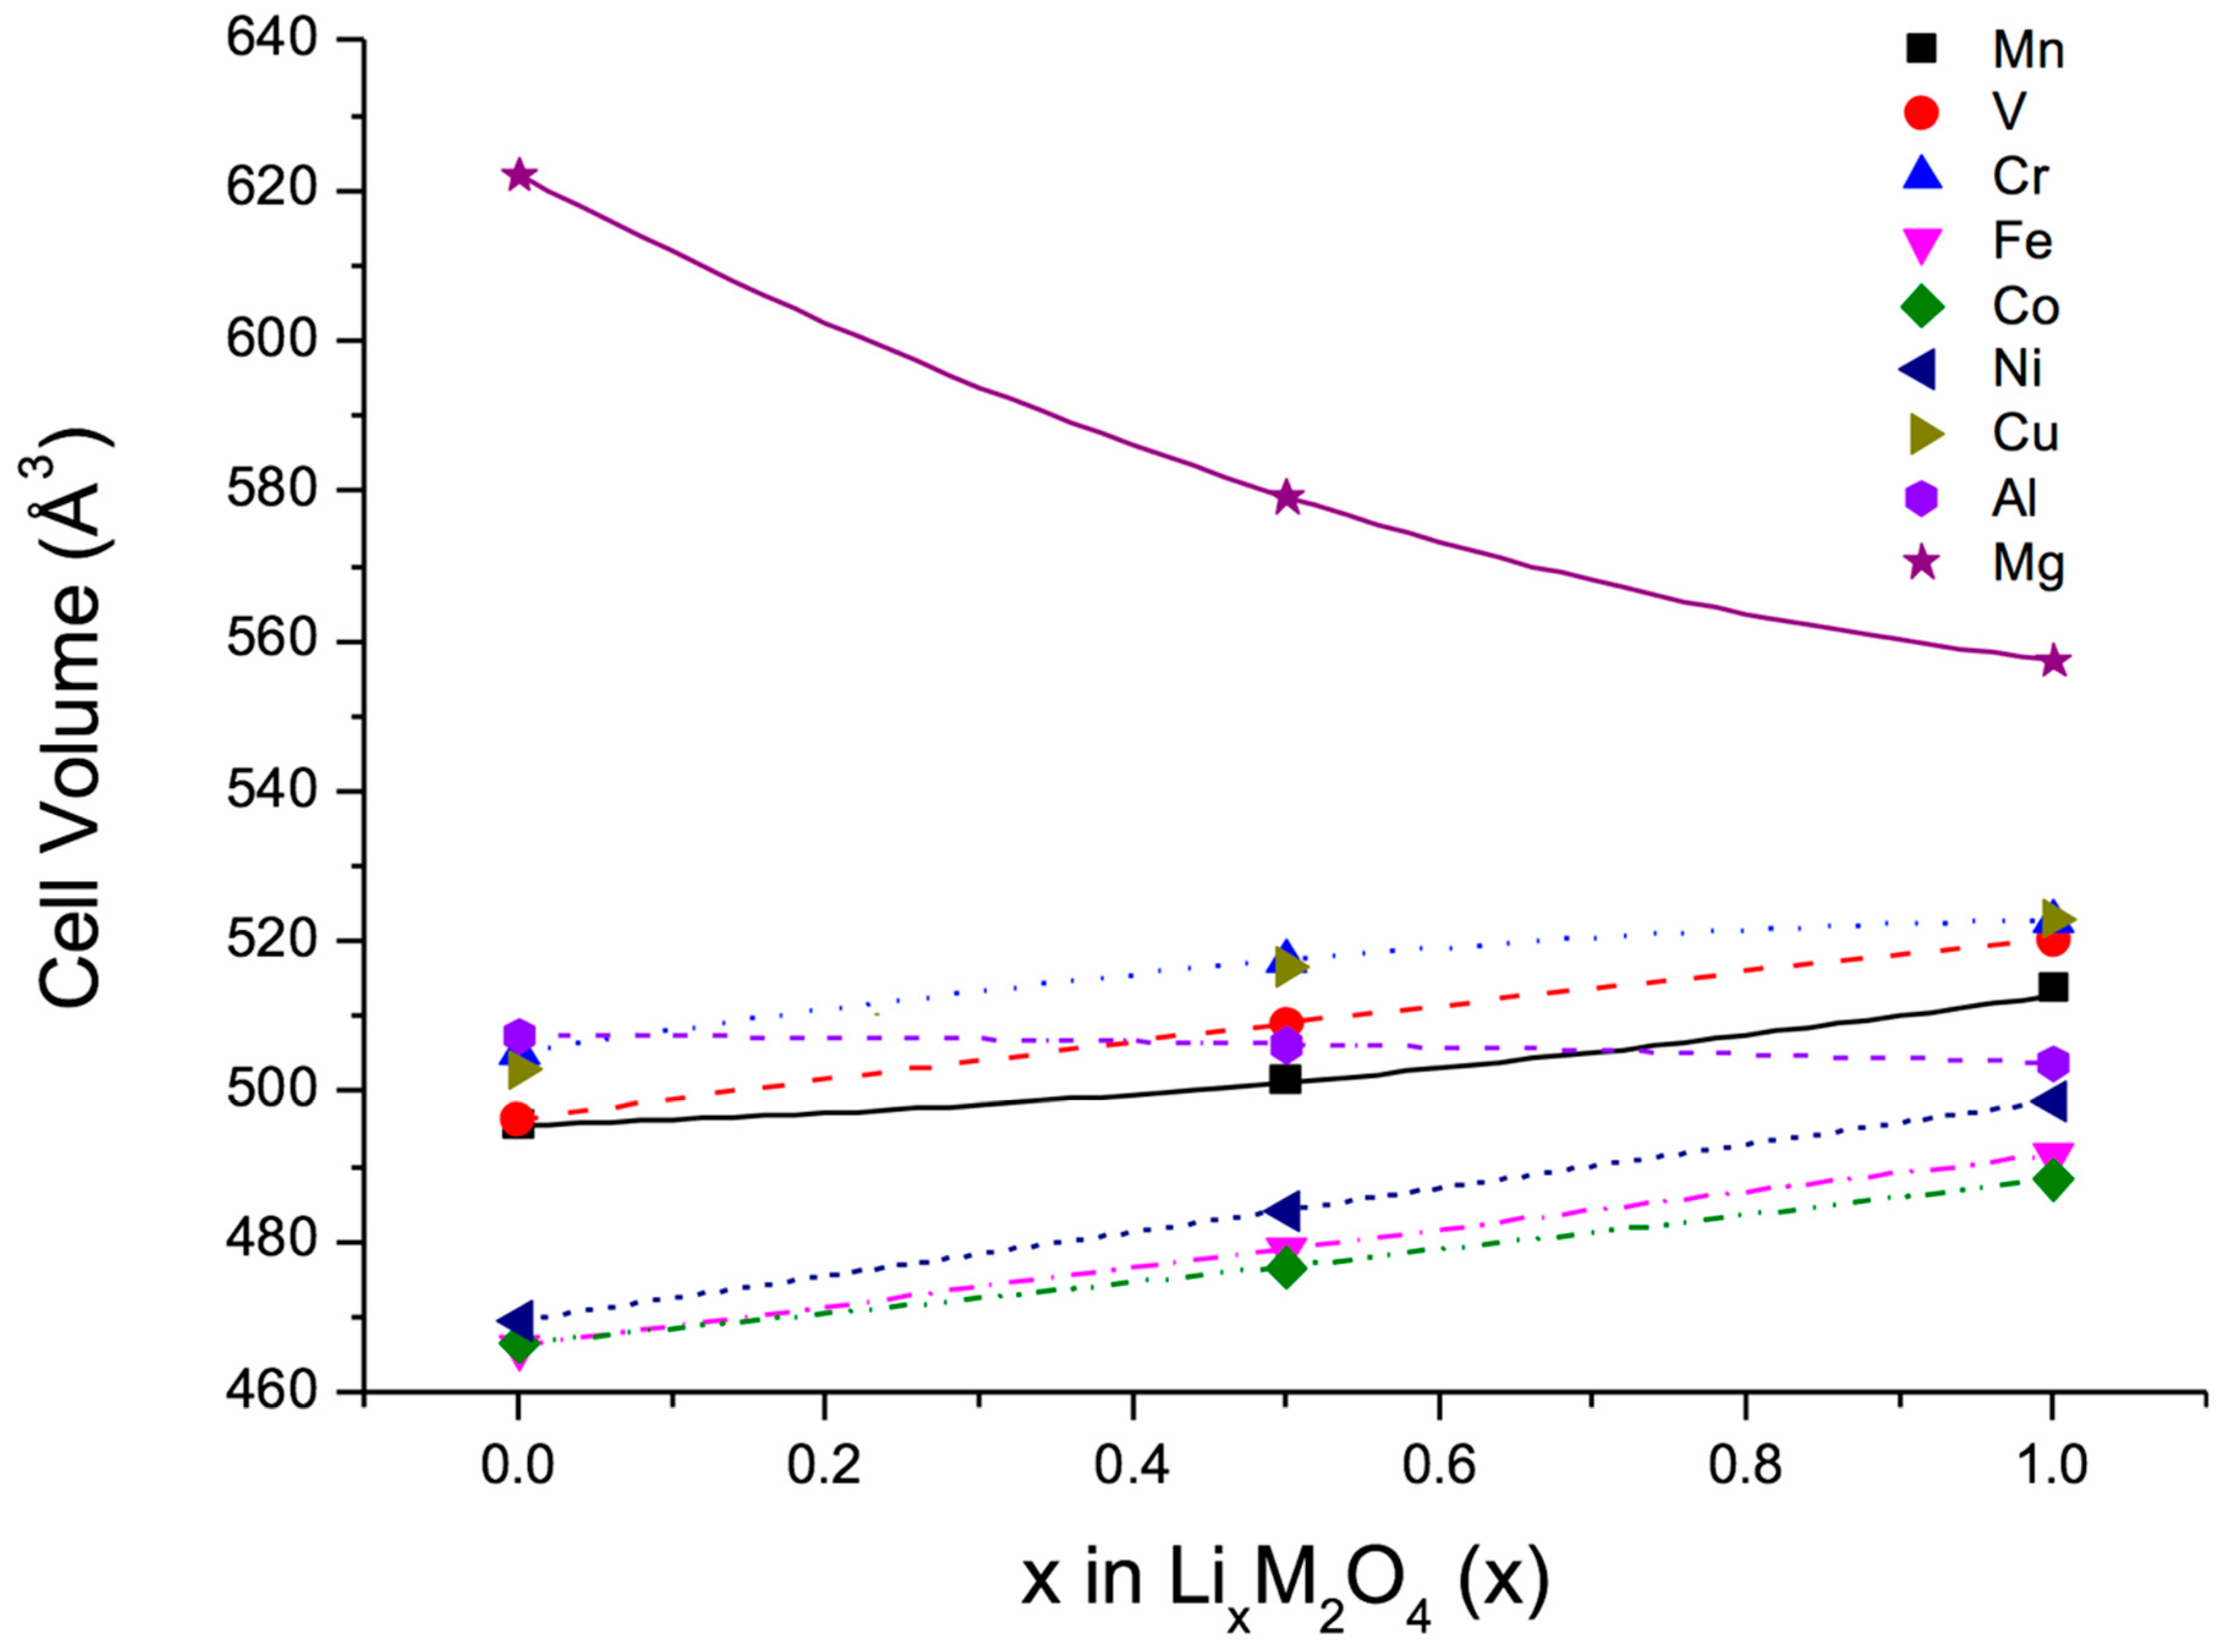
In a first step, a set of calculations was performed to evaluate the volume changes of the spinel-type compounds LixM2O4, where M = Mg, Al, V, Cr, Mn, Fe, Co, Ni, Cu, on lithiation and delithiation. To this end, three different values for the lithium content were considered, namely, x = 0, 0.5, 1.0. All structures were fully relaxed and different spin-structures were taken into account. In addition, deviations from the cubic symmetry underlying the spinel-structure were allowed for. In a second step, the previous results were used to minimize the volume change of the quasi-ternary compounds LiM12-y-zM2yM3zO4 in an approach closely following Vegard’s law [25].
The results of the ab initio calculations for the pure spinel-type compounds are summarized in Figure 2, which shows for each compound the calculated volume at the three Li concentrations mentioned above. The fact that some of these compounds have not yet been observed in nature was irrelevant, rather the calculations illustrate the intrinsic behaviour of proposed cathodic materials. The lines included in Figure 2 were obtained from parabolic fits to the data points. Obviously, all transition metals induce a volume increase with increasing lithium concentration, whereas only Al and Mg cause a decrease of the cell volume, which in case of Mg is particularly strong. As a consequence, any quasi-ternary spinel-type compound must contain a non-negligible fraction of Mg to counterbalance the volume increase of the transition-metal spinels on lithiation. Hence, Mg was the first choice to be inserted into the basic cathode material LiMn2O4. However, since Mg is electrochemically inactive, Cr was selected as a third component in addition to Mn because of the many oxidation states offered by this element.
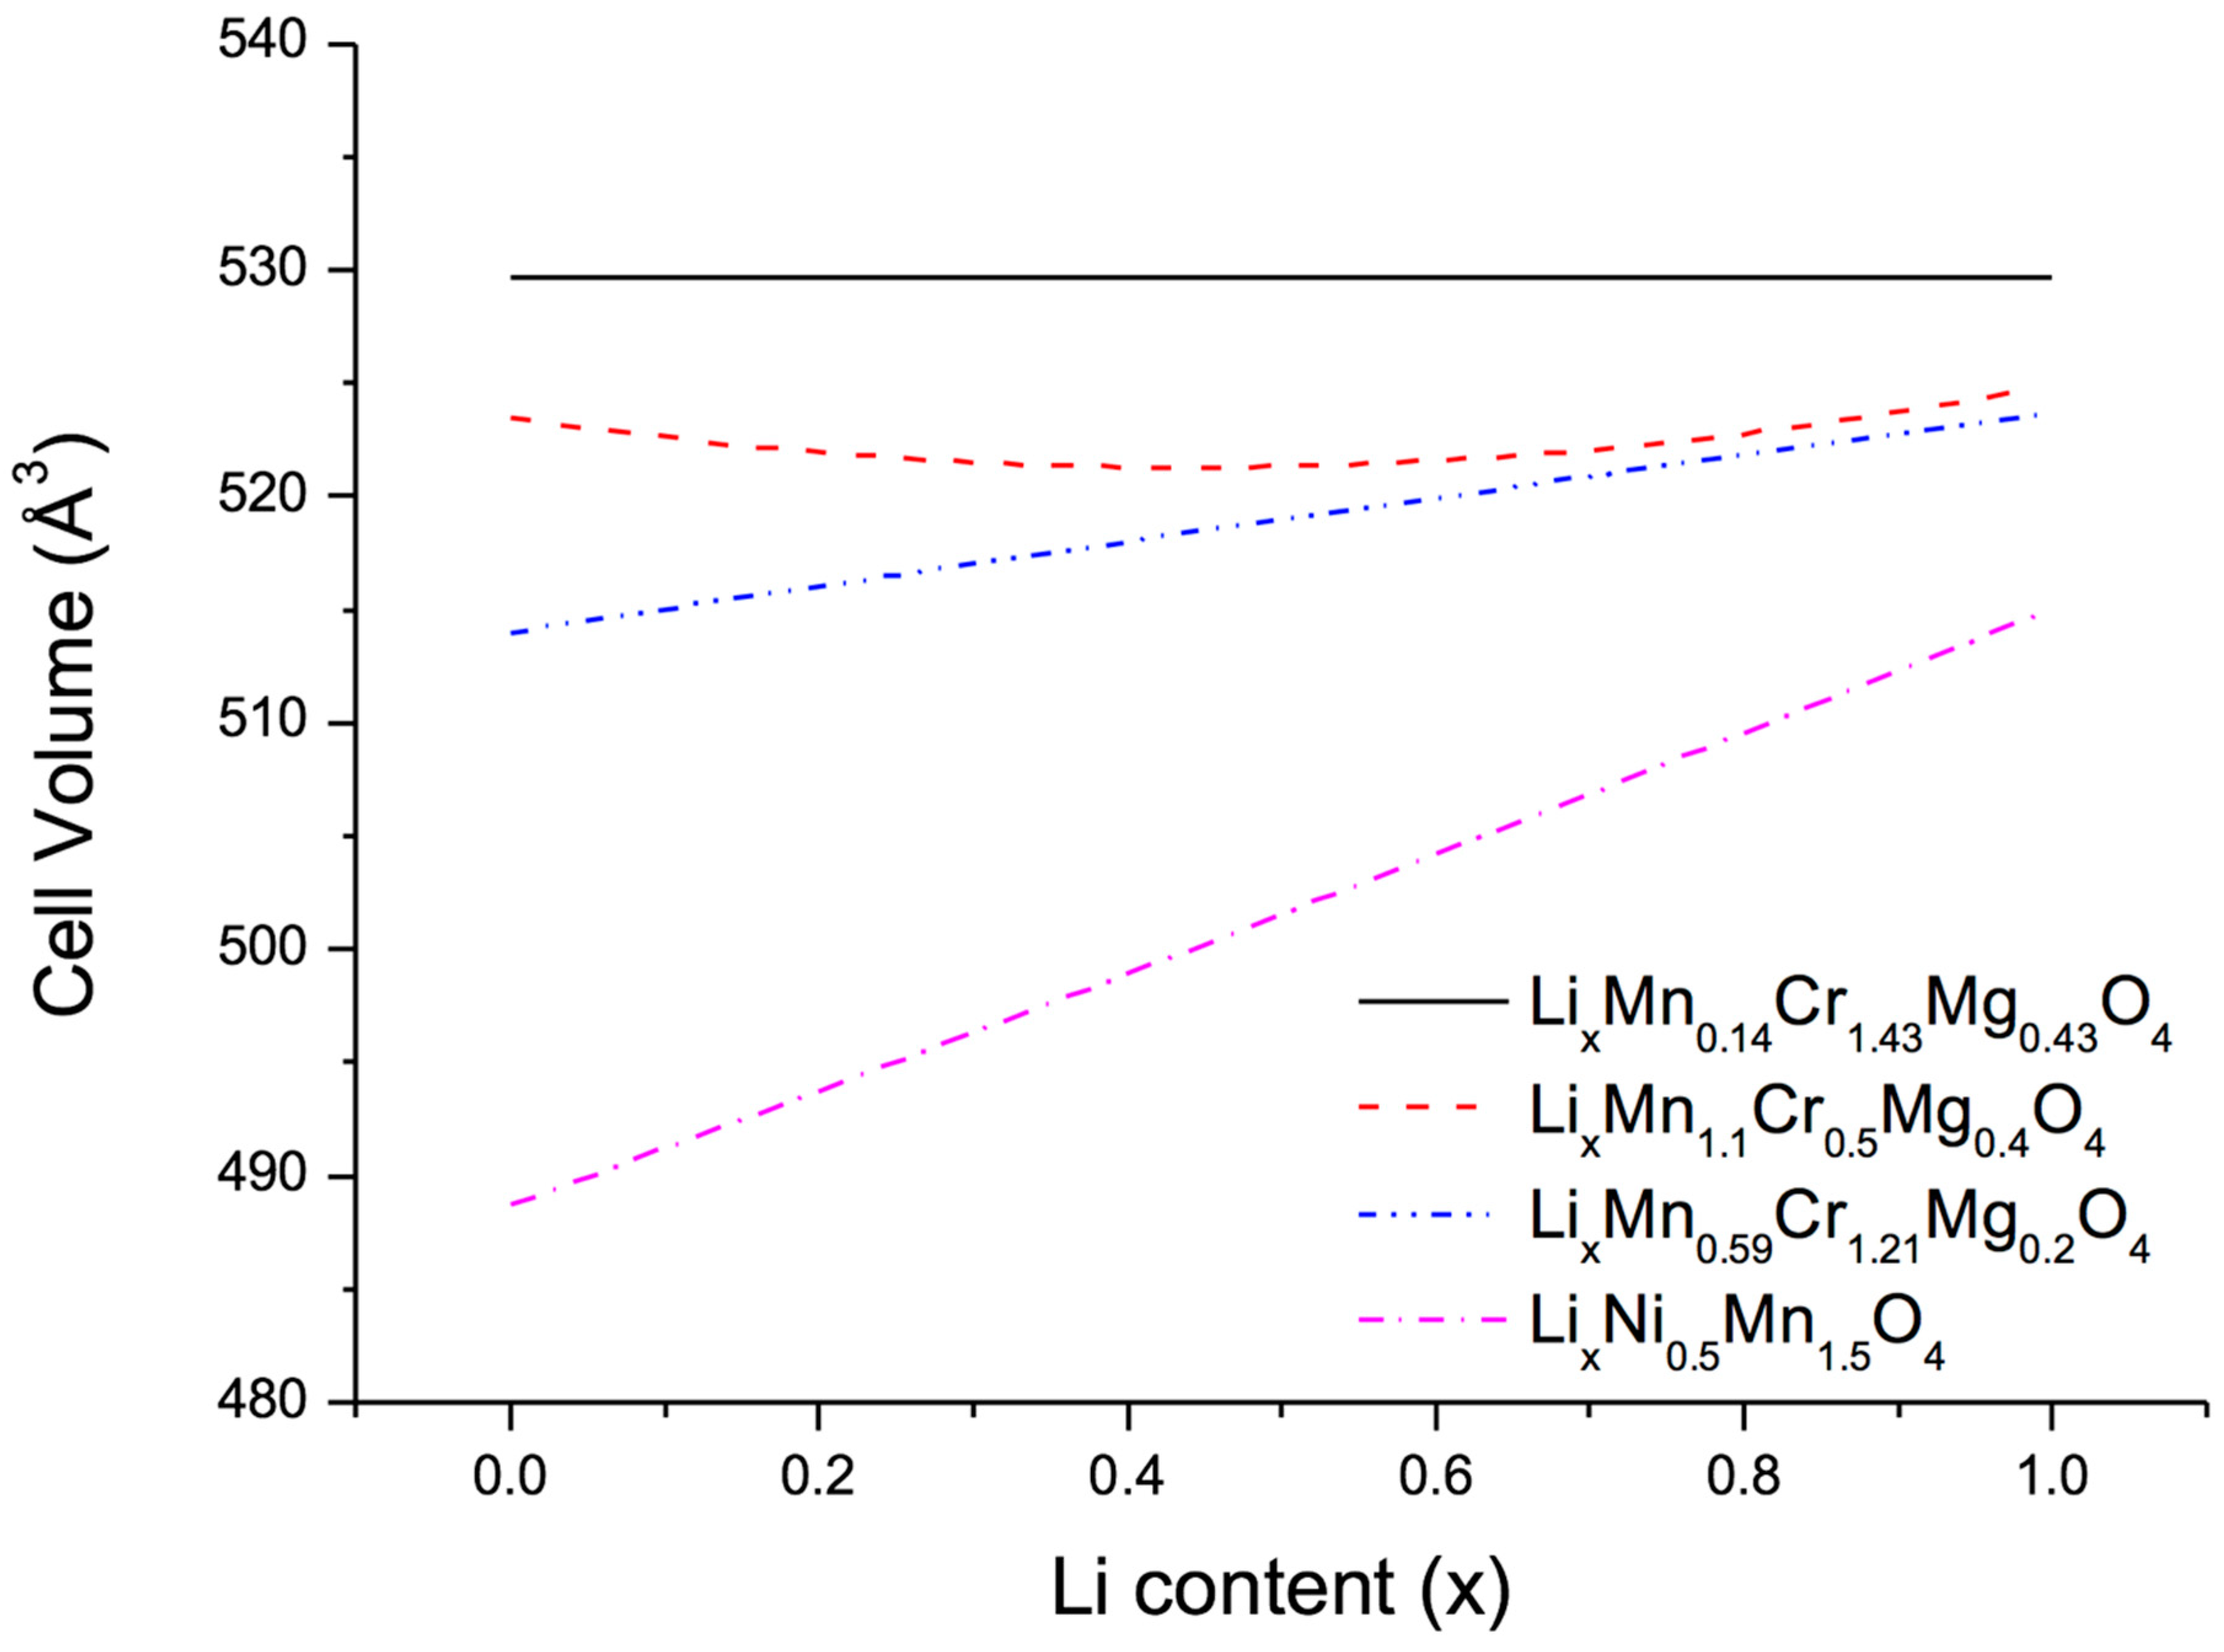
After these preparations the next step consisted in optimizing the relative concentrations at the metal sites of the quasi-ternary compound LiMn2-y-zCryMgzO4 in order to minimize the volume change on lithiation and delithiation. To this end, three different approaches were used, namely, (1) full unconstrained optimization to obtain zero-strain behaviour; (2) constrained optimization to find a low-strain material with Mn content 2-y-z larger than 1 in order to ensure structural stability; and (3) constrained optimization to find a low-strain material with Mg content z smaller than 0.2 in order to reduce the amount of highly oxidized Cr necessary to achieve full charge. The results of these three approaches together with the volume change of the benchmark compounds LiNi0.5Mn1.5O4 are displayed in Figure 3. As expected, unconstrained optimization indeed leads to zero volume change, however, at a very small Mn and large Cr content. More interesting are the two low-strain configurations LiMn1.1Cr0.5Mg0.4O4 and LiMn0.59Cr1.21Mg0.2O4 with volume changes of 0.6% (3 Å3) and 1.6% (8 Å3), respectively, much lower than the value of 6% (30 Å3) obtained for LiNi0.5Mn1.5O4.
In order to confirm the validity of the approach and to compare with existing experimental data, the initial optimizations were complemented with calculations of the volume changes of a set of selected compositions, namely, LiNi0.5Mn1.5O4, LiCu0.25Ni0.25Mn1.5O4, LiCr0.5Mn1.5O4, LiFe0.5Mn1.5O4, LiCo0.16Mn1.84O4 and LiAl0.15Mn1.85O4, which were found in very good agreement with measured values in all cases [23,24].
Powder samples of all three optimized compounds were synthesized at Toyota Motors Europe [23]. However, XRD patterns of the two samples with high Cr concentration revealed the presence of at least two phases, indicating a phase separation induced by the high Cr content. The instability caused by high Cr content is consistent with the fact that LiCr2O4 has not been observed. In contrast, LiMn1.1Cr0.5Mg0.4O4 could be synthesized in almost pure form and was thus used to build electrochemical cells in order to investigate the volume change upon charging and discharging the cells. As a result, ex situ XRD patterns showed a volume change of 0.8% (4 Å3) in very good agreement with the calculations. In addition, charge curves taken for this system revealed a performance comparable to that of the benchmark material LiNi0.5Mn1.5O4.
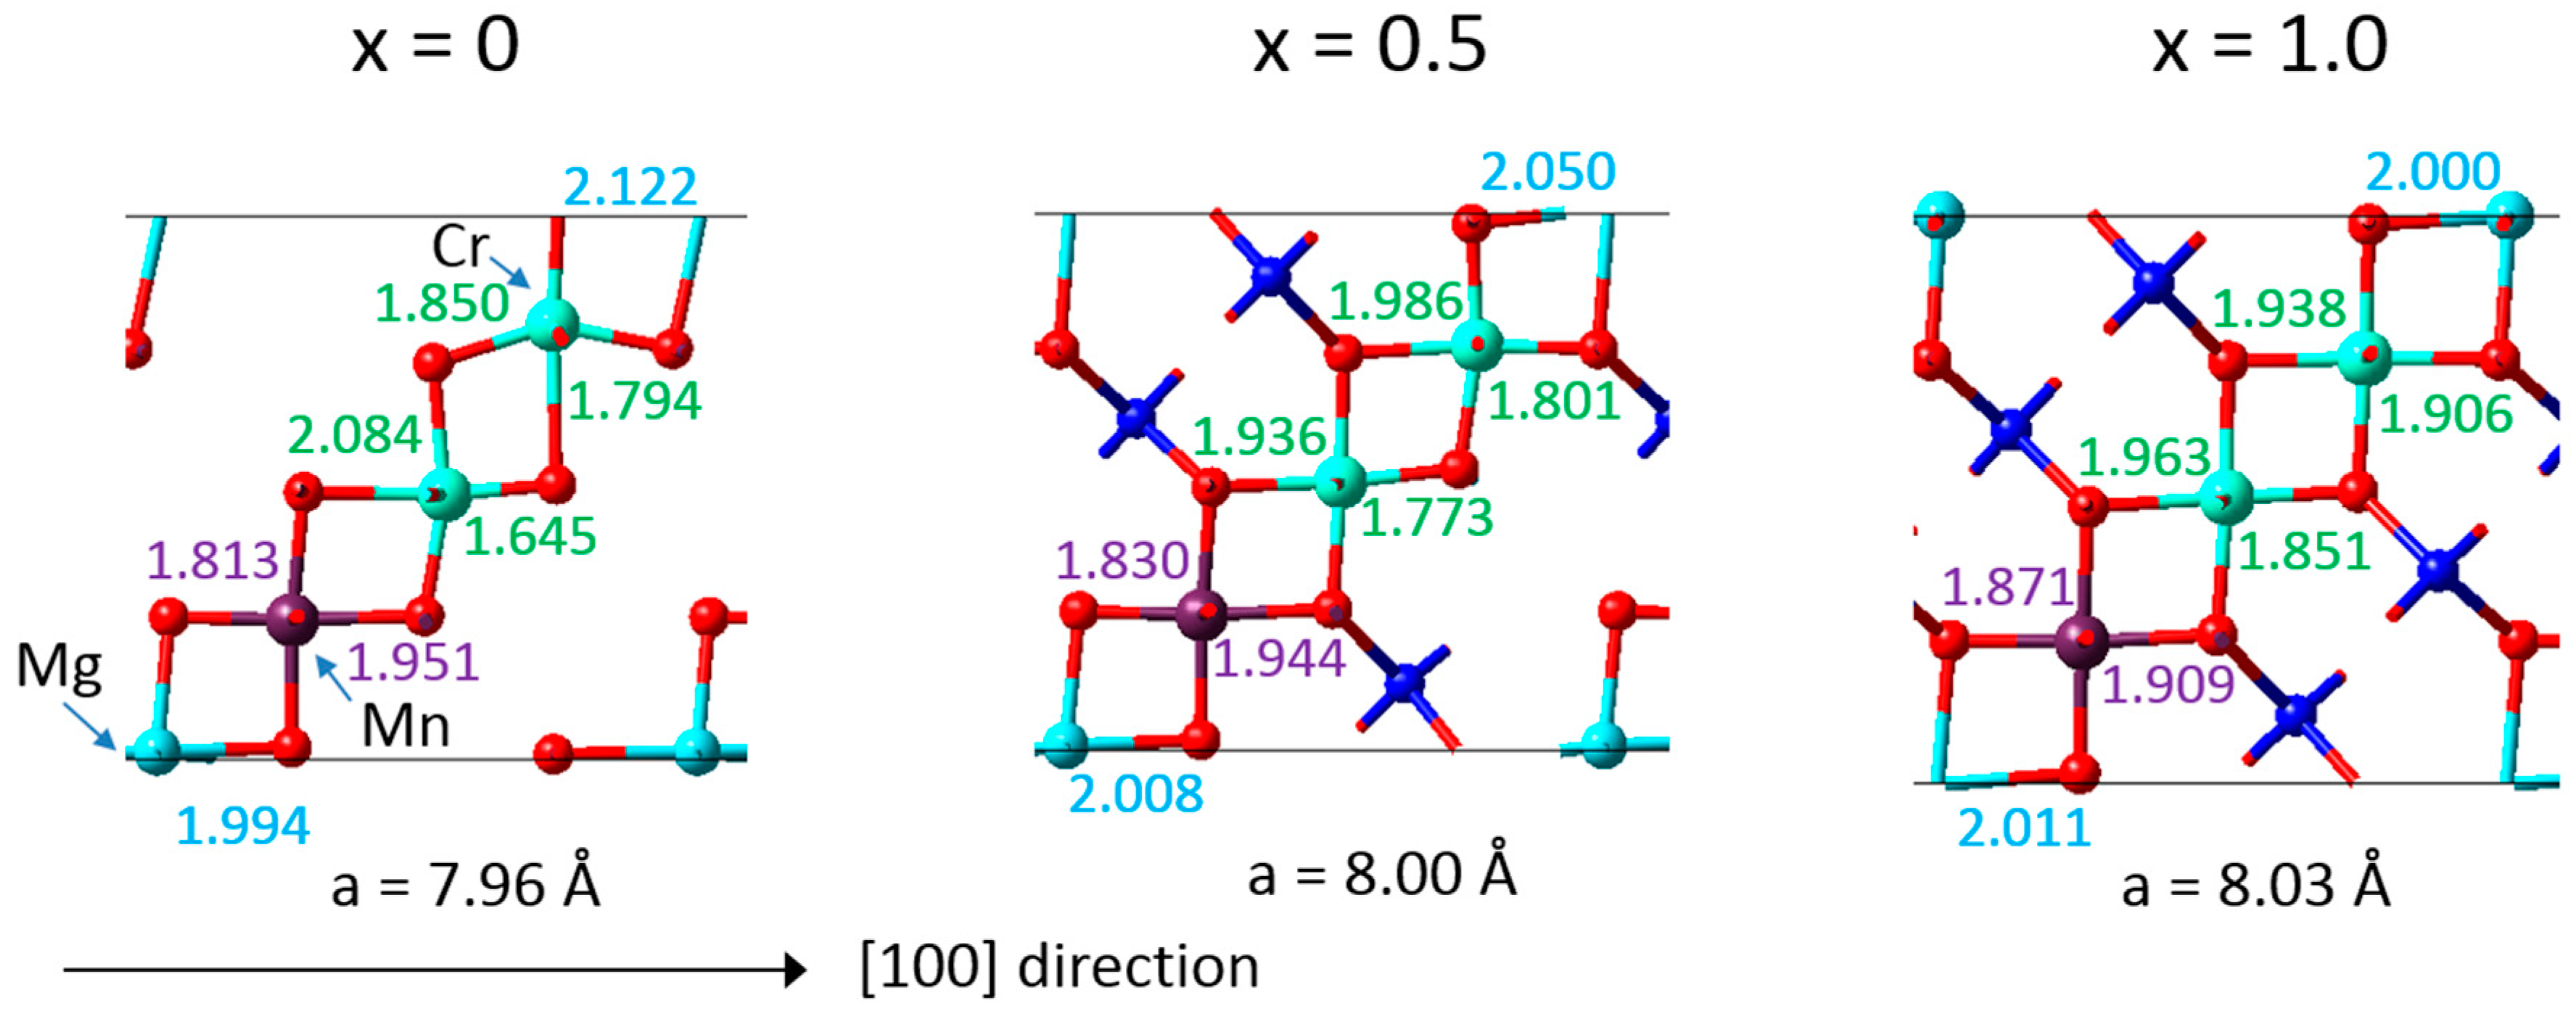
The DFT calculations also provided detailed insight into the mechanisms resulting in a near zero-strain behaviour. A synergistic compensation mechanism underlies the desired property as illustrated in Figure 4, which includes the bond lengths calculated for an eightfold supercell of LixMn1.125Cr0.5Mg0.375O4. With increasing Li concentration, the Mg-O bonds tend to decrease and the Mn-O bonds remain similar, whereas the Cr-O bonds tend to increase. As a result, the overall volume of the crystal structure changes little upon charging and discharging with Li ions. Furthermore, the microscopic analysis reflects the behaviour of the “pure” compounds as displayed in Figure 2. This behaviour is also consistent with observations for the zero-strain mechanism for Li4Ti5O12, where local distortions in the crystal structure similarly allow this material to keep the volume nearly unchanged upon lithium insertion [26].
Here, DFT simulations have been combined with an optimization approach based on Vegard’s law to obtain a spinel-type quasi-ternary compound with small volume change on lithiation and delithiation. The validity of the procedure has been confirmed by comparison to measured volume changes obtained for various compositions. In addition, experiments performed for the best candidate, LiMn1.1Cr0.5Mg0.4O4, found a volume change of 0.8% (4 Å3) in very good agreement with the calculated 0.6% (3 Å3). Finally, analysis of the DFT results provided an explanation for the observed volume changes based on a microscopic compensation mechanism.

3.2. Embrittlement of Cu Micro-Structures

In the race for still smaller structures of semiconductor devices, copper metallization layers have a significant advantage over those made of aluminium, since their much higher electrical and thermal conductivity allows for smaller metal components and less energy consumption. However, long-term stability of the devices requires a high mechanical performance of the metal contacts. Fortunately, the mechanical properties of such microstructures can be controlled and considerably improved by reducing the grain size, which is well known as the Hall-Petch effect [27,28]. Indeed, for electrodeposited Cu thin films it has been demonstrated that additives can cause a reduction of the grain size. However, as revealed by electron backscatter diffraction in a scanning electron microscopy (EBSD/SEM), these additives also cause embrittlement of the microstructures at elevated temperatures [29]. In the present section we describe how ab initio calculations as based on density functional theory can be employed to obtain a deeper understanding of the origin of this failure [29]. Importantly, additional calculations successfully proposed measures to overcome the detrimental behaviour.
In the experiments reported in Ref. [
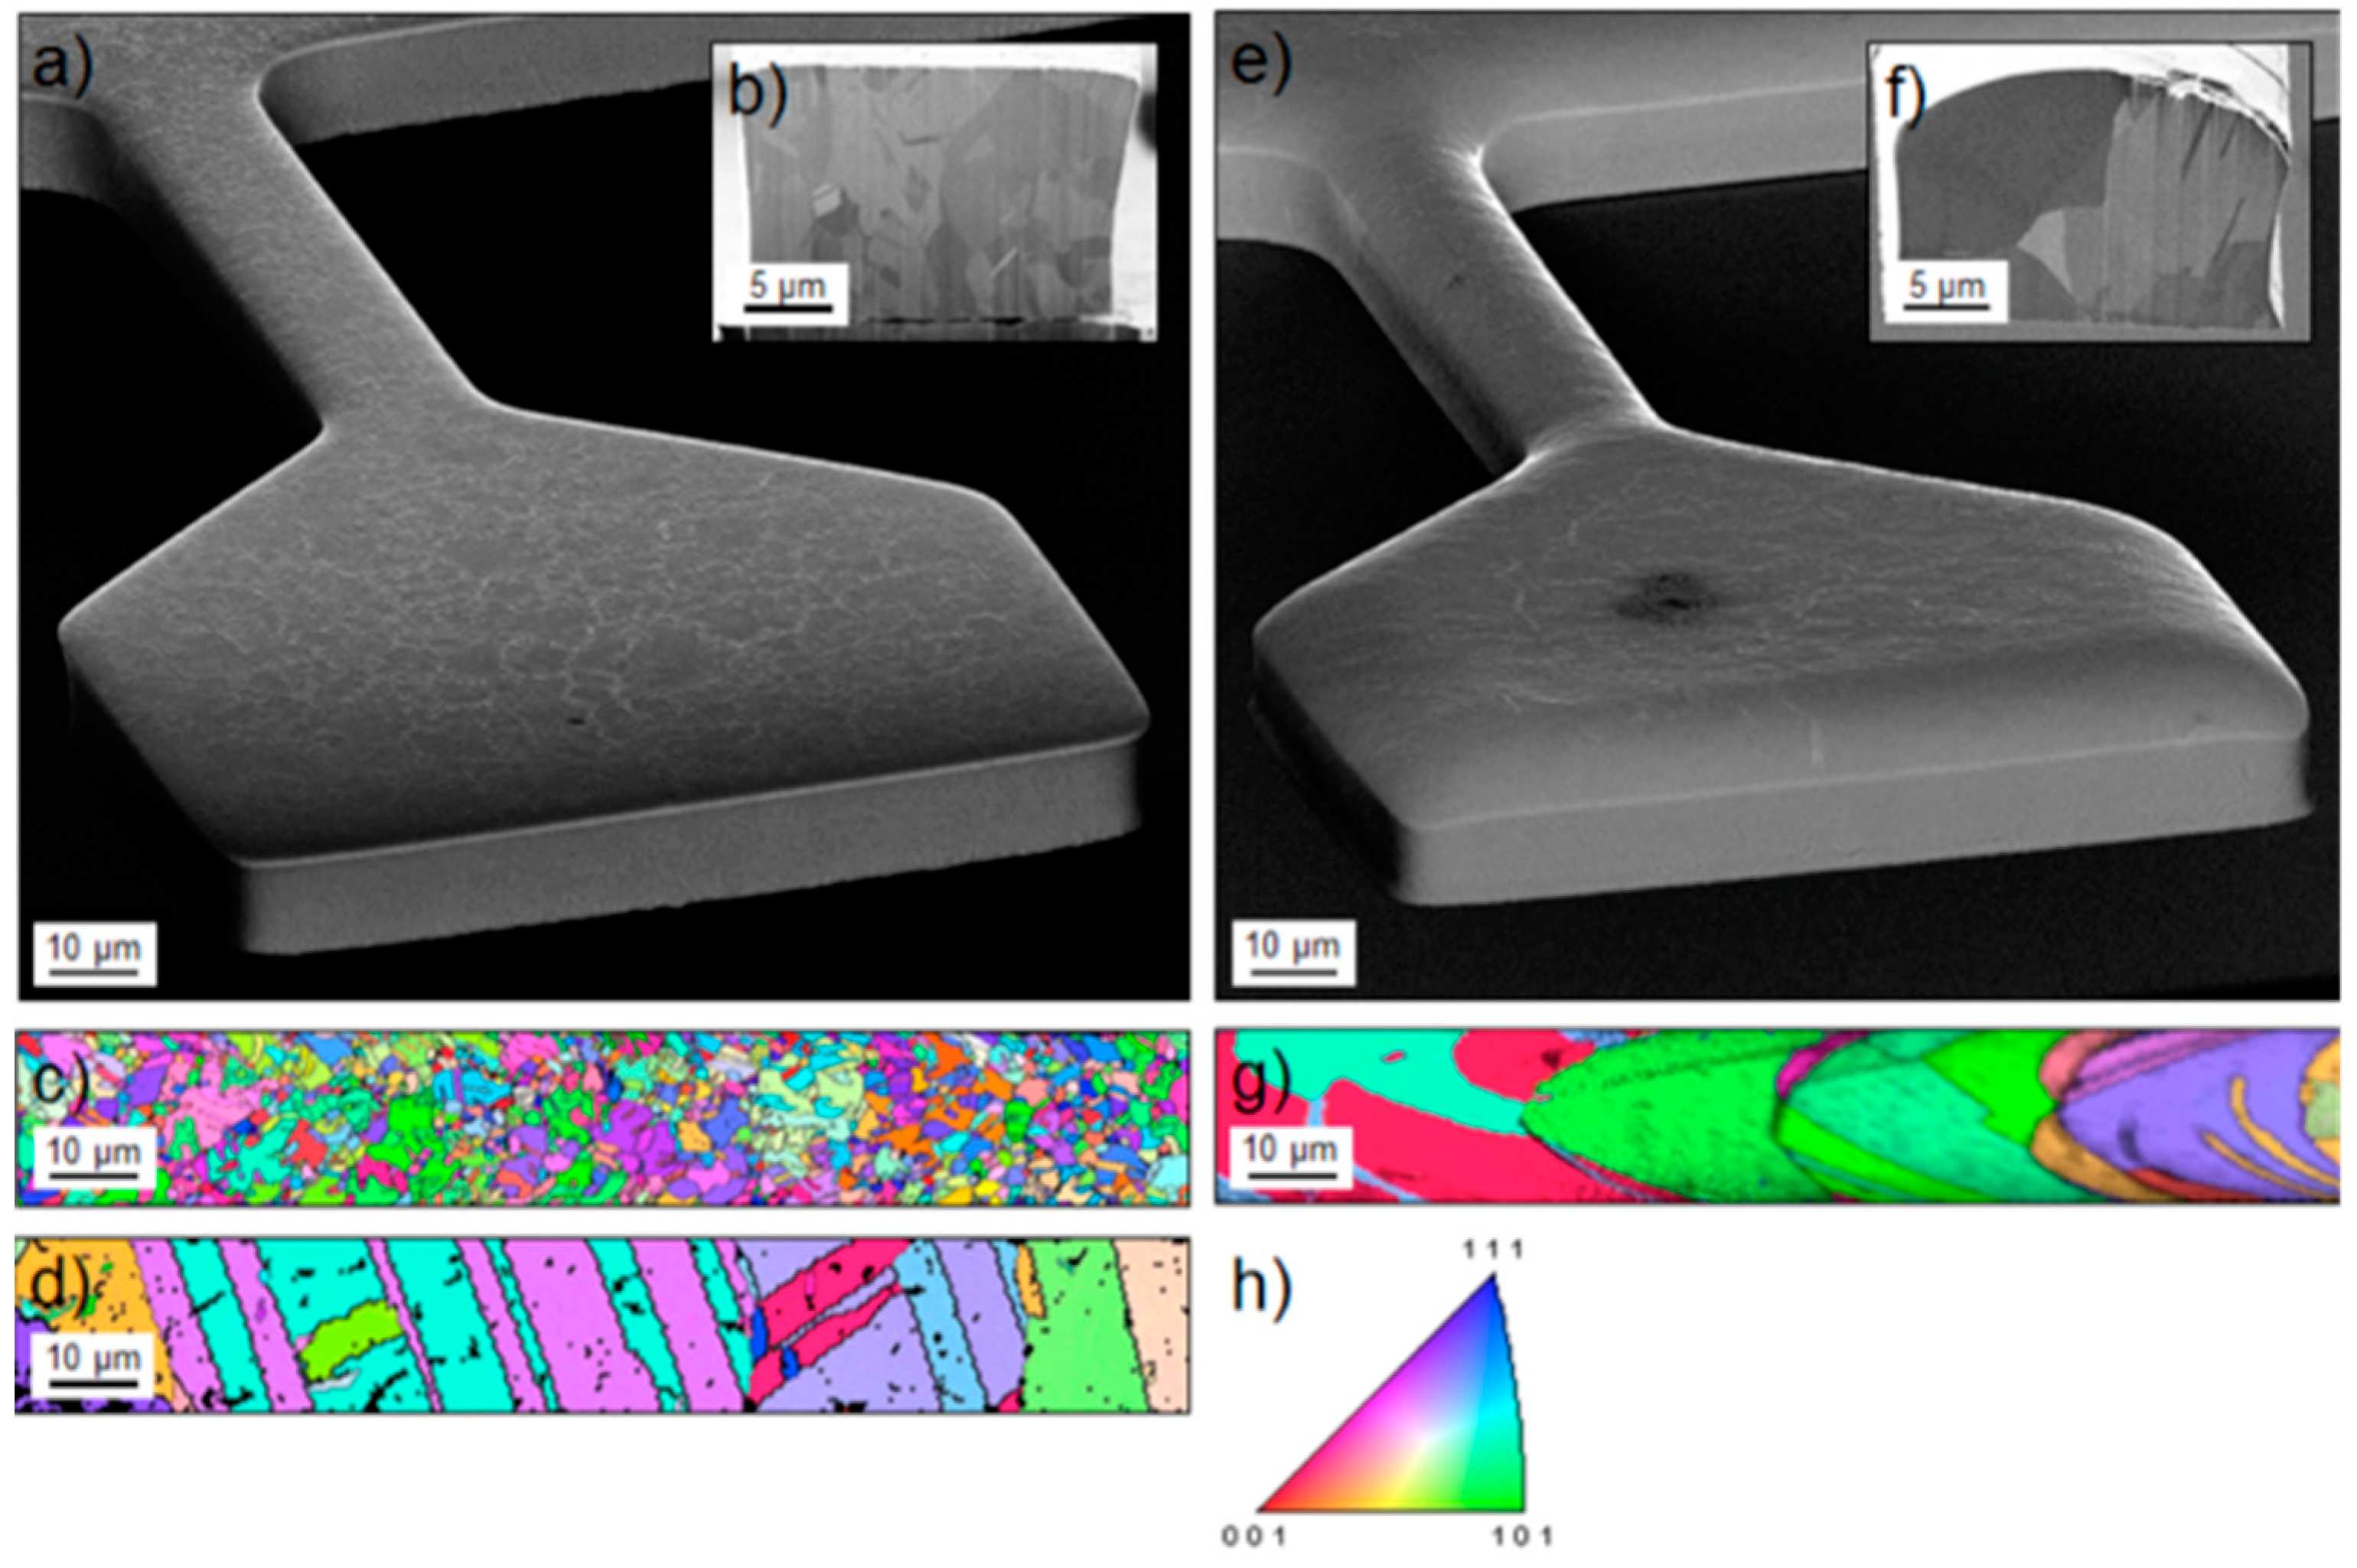
29] Cu thin films were synthesized by electrodeposition using two different additive systems in the electrolyte intended to modify the grain size (sample type A and B). EBSD/SEM images of these films are displayed in Figure 5. Samples of types A and B possess median grain sizes of about 2.7 ± 0.6 μm and 10.1 ± 2.6 μm, respectively. As also shown in Figure 5, the grain size of sample type A increases with additional annealing at 1073 K.
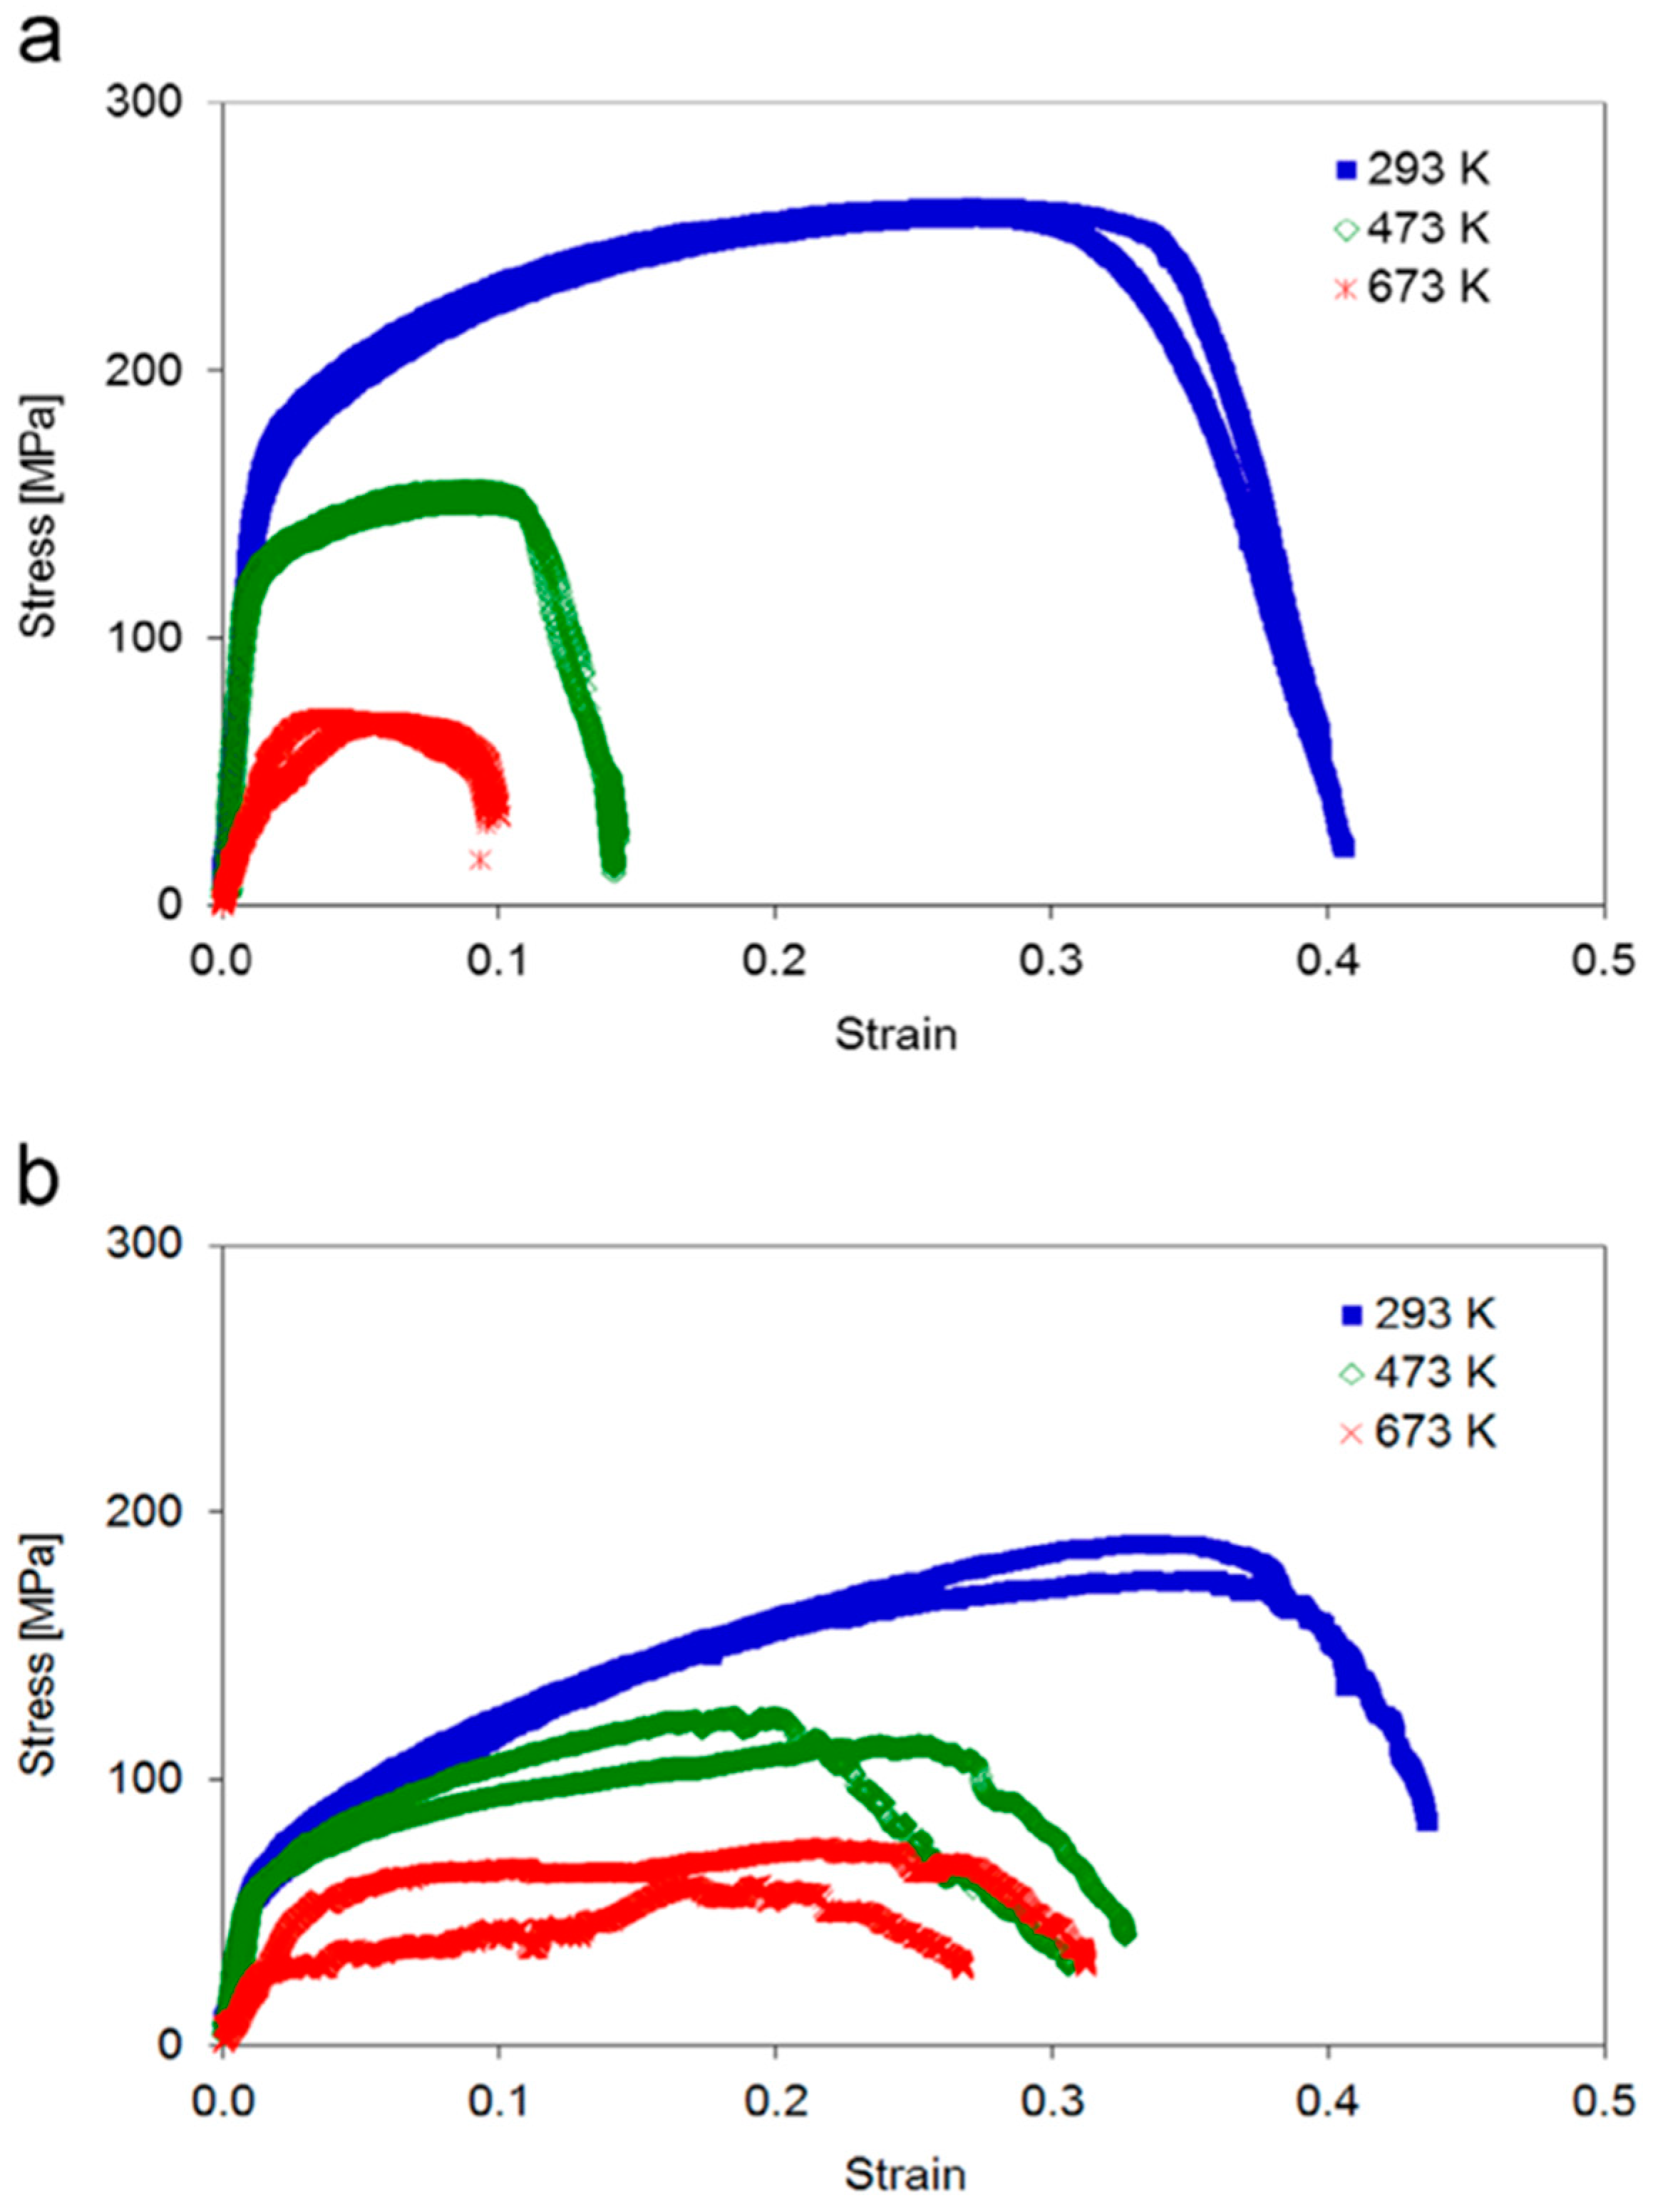
Mechanical testing revealed distinct differences between the two sample types as is obvious from Figure 6. At room temperature sample type A exhibited considerably higher yield strength and ultimate tensile strength as compared to sample type B, as expected from the Hall-Petch effect. This advantage was lost at elevated temperatures, where sample type A showed a drastic reduction in yield strength, ultimate tensile strength and elongation to fracture. In contrast, sample type B showed only a moderate decrease of these values.
SEM images of sample type B taken at 293 K, 473 K and 673 K clearly showed ductile behaviour with intragranular fracture accompanied by the formation of glide steps at all temperatures. In contrast, sample type A showed strong plastic deformation with several grains involved at 293 K, whereas at higher temperatures cracking occurred preferentially along the grain boundaries indicative of grain boundary embrittlement [29].
An indication of the origin of the different behaviour of the two sample types was obtained from chemical analysis, specifically from time-of-flight secondary ion mass spectroscopy (TOF-SIMS), which showed a significantly higher content of both S and Cl in sample type A. In addition, the experiments indicated considerable enrichment of these impurities at the grain boundaries [29].
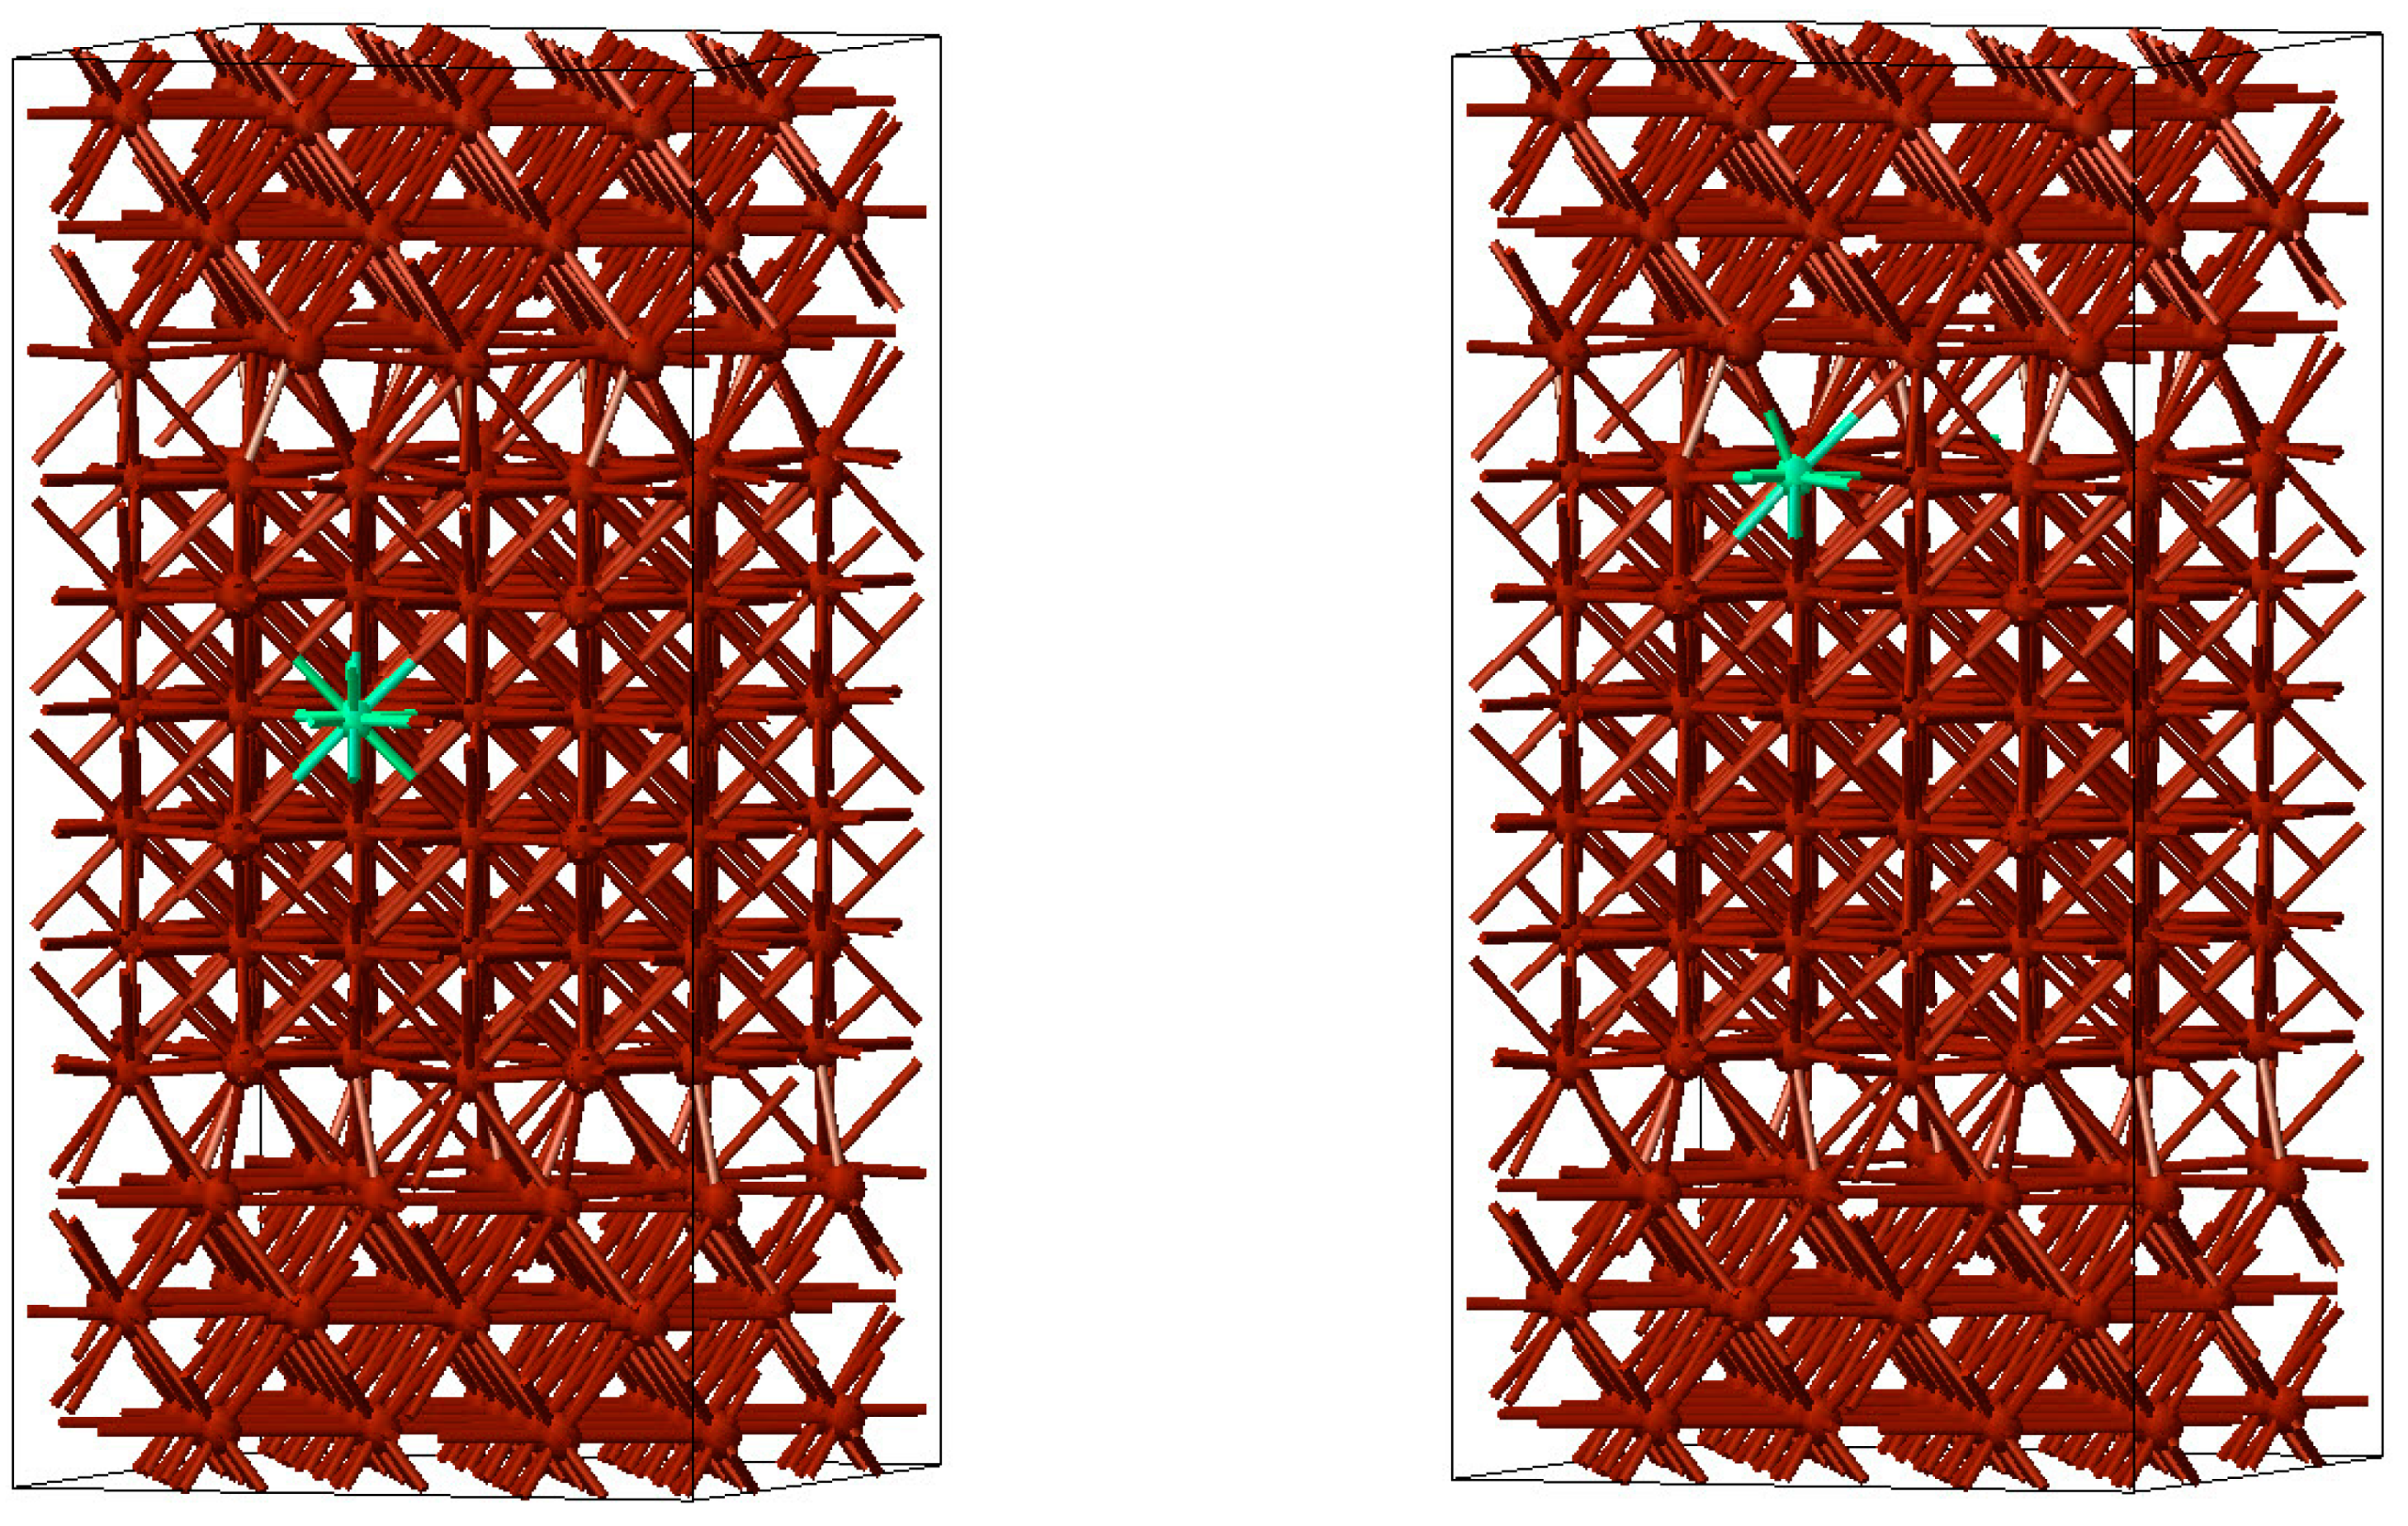
In order to address the possible detrimental behaviour of S and Cl impurities on the mechanical strength of the microstructure, DFT calculations were performed for models of slabs and grain boundaries, respectively, which were then decorated with impurity atoms at selected sites. All structures were fully relaxed yielding energy minimum configurations representing mechanical equilibrium for these atomistic systems.
In a first step, slab models of face-centred cubic Cu were constructed with surfaces perpendicular to the [001] and [111] directions. These slabs were separated by a 10 Å wide vacuum region to simulate free surfaces. Subsequently, the slabs were combined to form Σ5(001) and Σ7(111) twist grain boundaries. As an example, a Σ5(001) twist grain boundary is displayed in Figure 7.
In a second step, S and Cl atoms were inserted first at the centre of the slabs and then at their boundaries (free surfaces or grain boundaries) to estimate the segregation energies of these impurities from the differences in total energy. For a Cl atom at the centre of the grain and at a Σ5(001) grain boundary these situations are displayed in Figure 8.
The calculated segregation energies are given in Table 1 for both S and Cl impurities and for the segregation from the inside of a grain to both the free surfaces and the grain boundaries. Results are given for both the (001) and (111) surfaces and the Σ5(001) and Σ7(111) twist grain boundaries. In all cases negative segregation energies were obtained, that is, in all cases the impurities prefer a position at the surface and grain boundary, respectively. This trend is more pronounced for the free surfaces, where the impurity has more freedom to optimize its bonds with the neighbouring Cu atoms.
Finally, from a comparison of the total energies of the interface systems to those of the slabs with free surfaces the energies of separation were obtained, which gave a measure of the cleavage energy. These separation energies were evaluated with and without impurities to obtain a measure of the detrimental effect of the latter [29]. The results are summarized in the Table 2, which gives the energies of separation for both types of grain boundaries for pure Cu as well as for Cu microstructures with S and Cl impurities at the respective concentrations. Both S and Cl lead to a reduction of the energy of separation for both the Σ5(001) and Σ7(111) twist grain boundaries. While the reduction is of the order of 10% for sulphur, the effect is much more pronounced for chlorine, which induces a drastic weakening of these grain boundaries. The calculations thus explain the experimentally observed fracture of the Cu microstructures at the grain boundaries and assign the failure to chlorine impurities as the main cause.
The DFT simulations thus provide an explanation for the transition from intragranular plastic to intergranular brittle failure in electrodeposited Cu micro-tensile samples at elevated temperatures, which had been observed by electron backscatter diffraction experiments in a scanning electron microscope. While this embrittlement could be tentatively attributed to some additives in the sample, the exact mechanism as well as the role of particular elements was not understood. With the help of the simulations strong preference of the impurities to segregate to the grain boundaries and the free surfaces could be demonstrated, while the calculated cleavage energies revealed strong weakening of the grain boundaries by S and even more so by Cl.
For bulk Cu it had been shown that embrittlement at elevated temperatures could be reduced by addition of small amounts of Ti, V and Zr, whereas B, Nb, Fe and Ag were found to significantly strengthen Cu grain boundaries [29]. More recent investigations have explored the mitigating influence of these additional dopant in detail providing similar quantitative explanations and insights into the origin of physical observations.

3.3. Structure and Bonding of Boron Carbide

Boron carbide, B4C, is one of the hardest materials known, close to diamond and cubic boron nitride. Due to its mechanical properties, B4C is used in many applications as an abrasive or shielding material. In nuclear reactors boron carbide is used to control the neutron flux due to the high neutron absorption of 10B and the radiation hardness and chemical stability of B
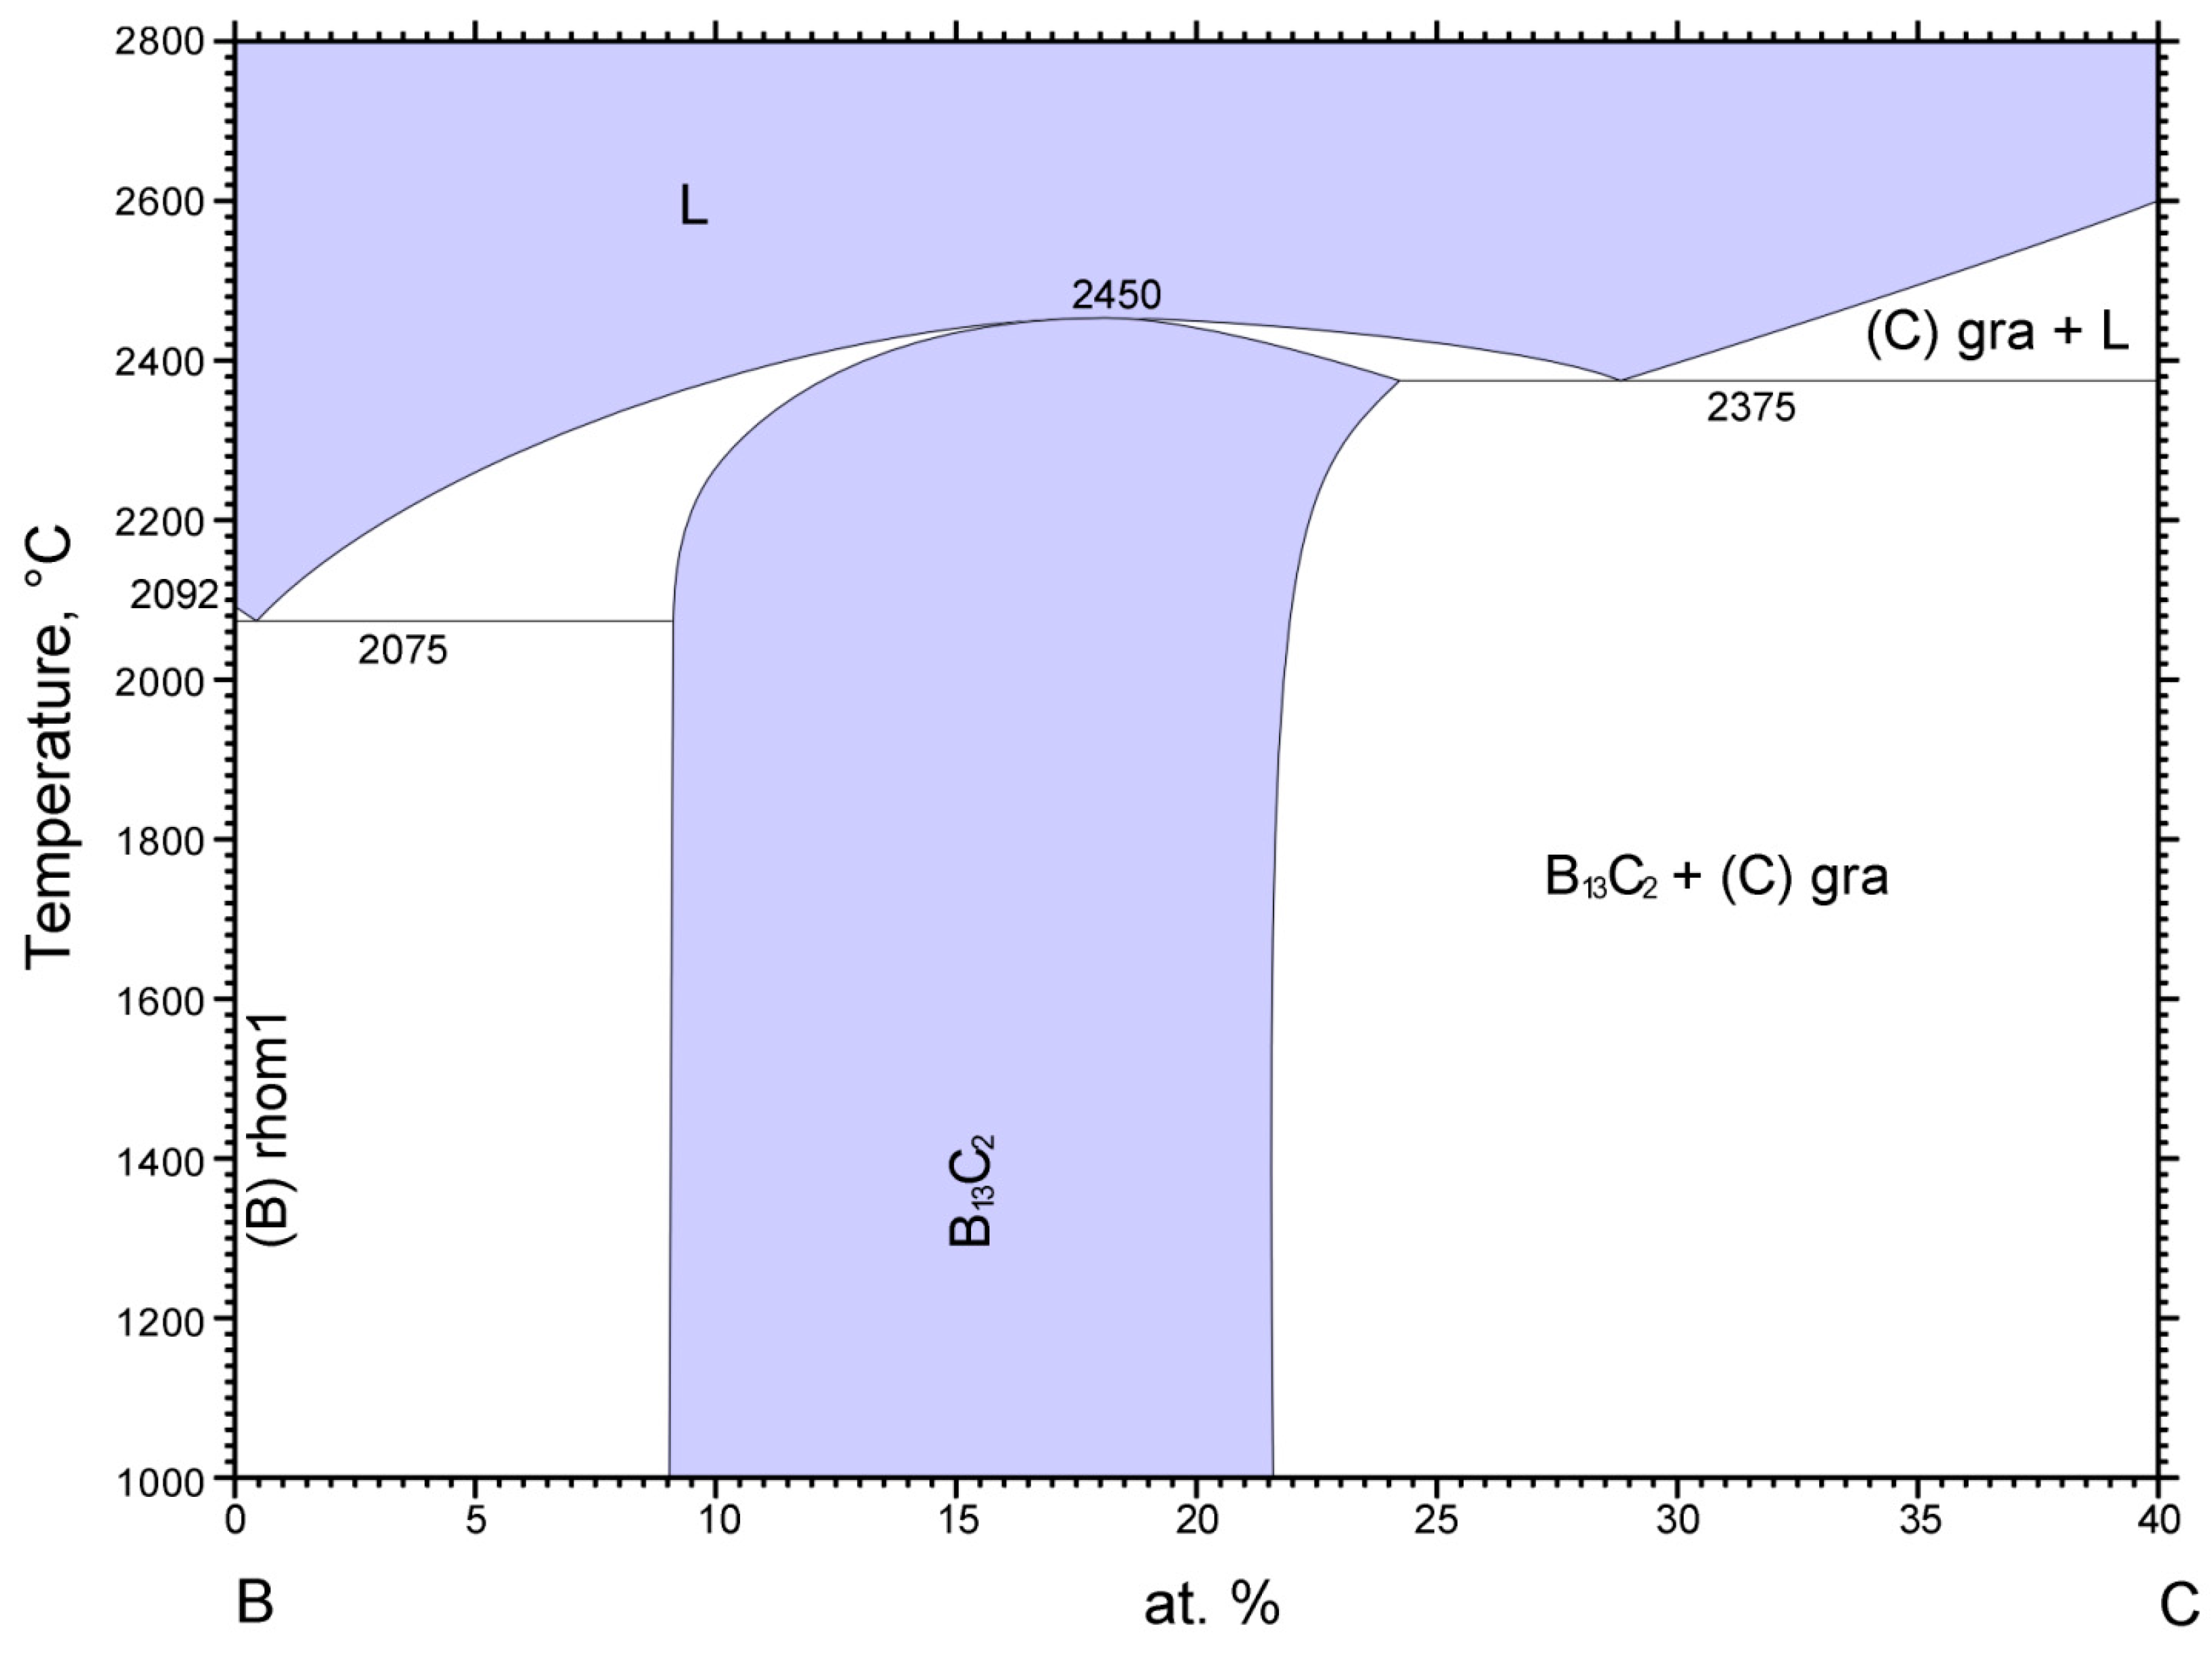
4C. According to the boron-carbon phase diagram displayed in Figure 9, a boron carbide phase exists between approximately 9 at% to 22 at% C with a melting point reaching 2450 °C, which is complemented by carbide phases with excess boron and graphite, respectively, below and above this carbon concentration range [31,32].
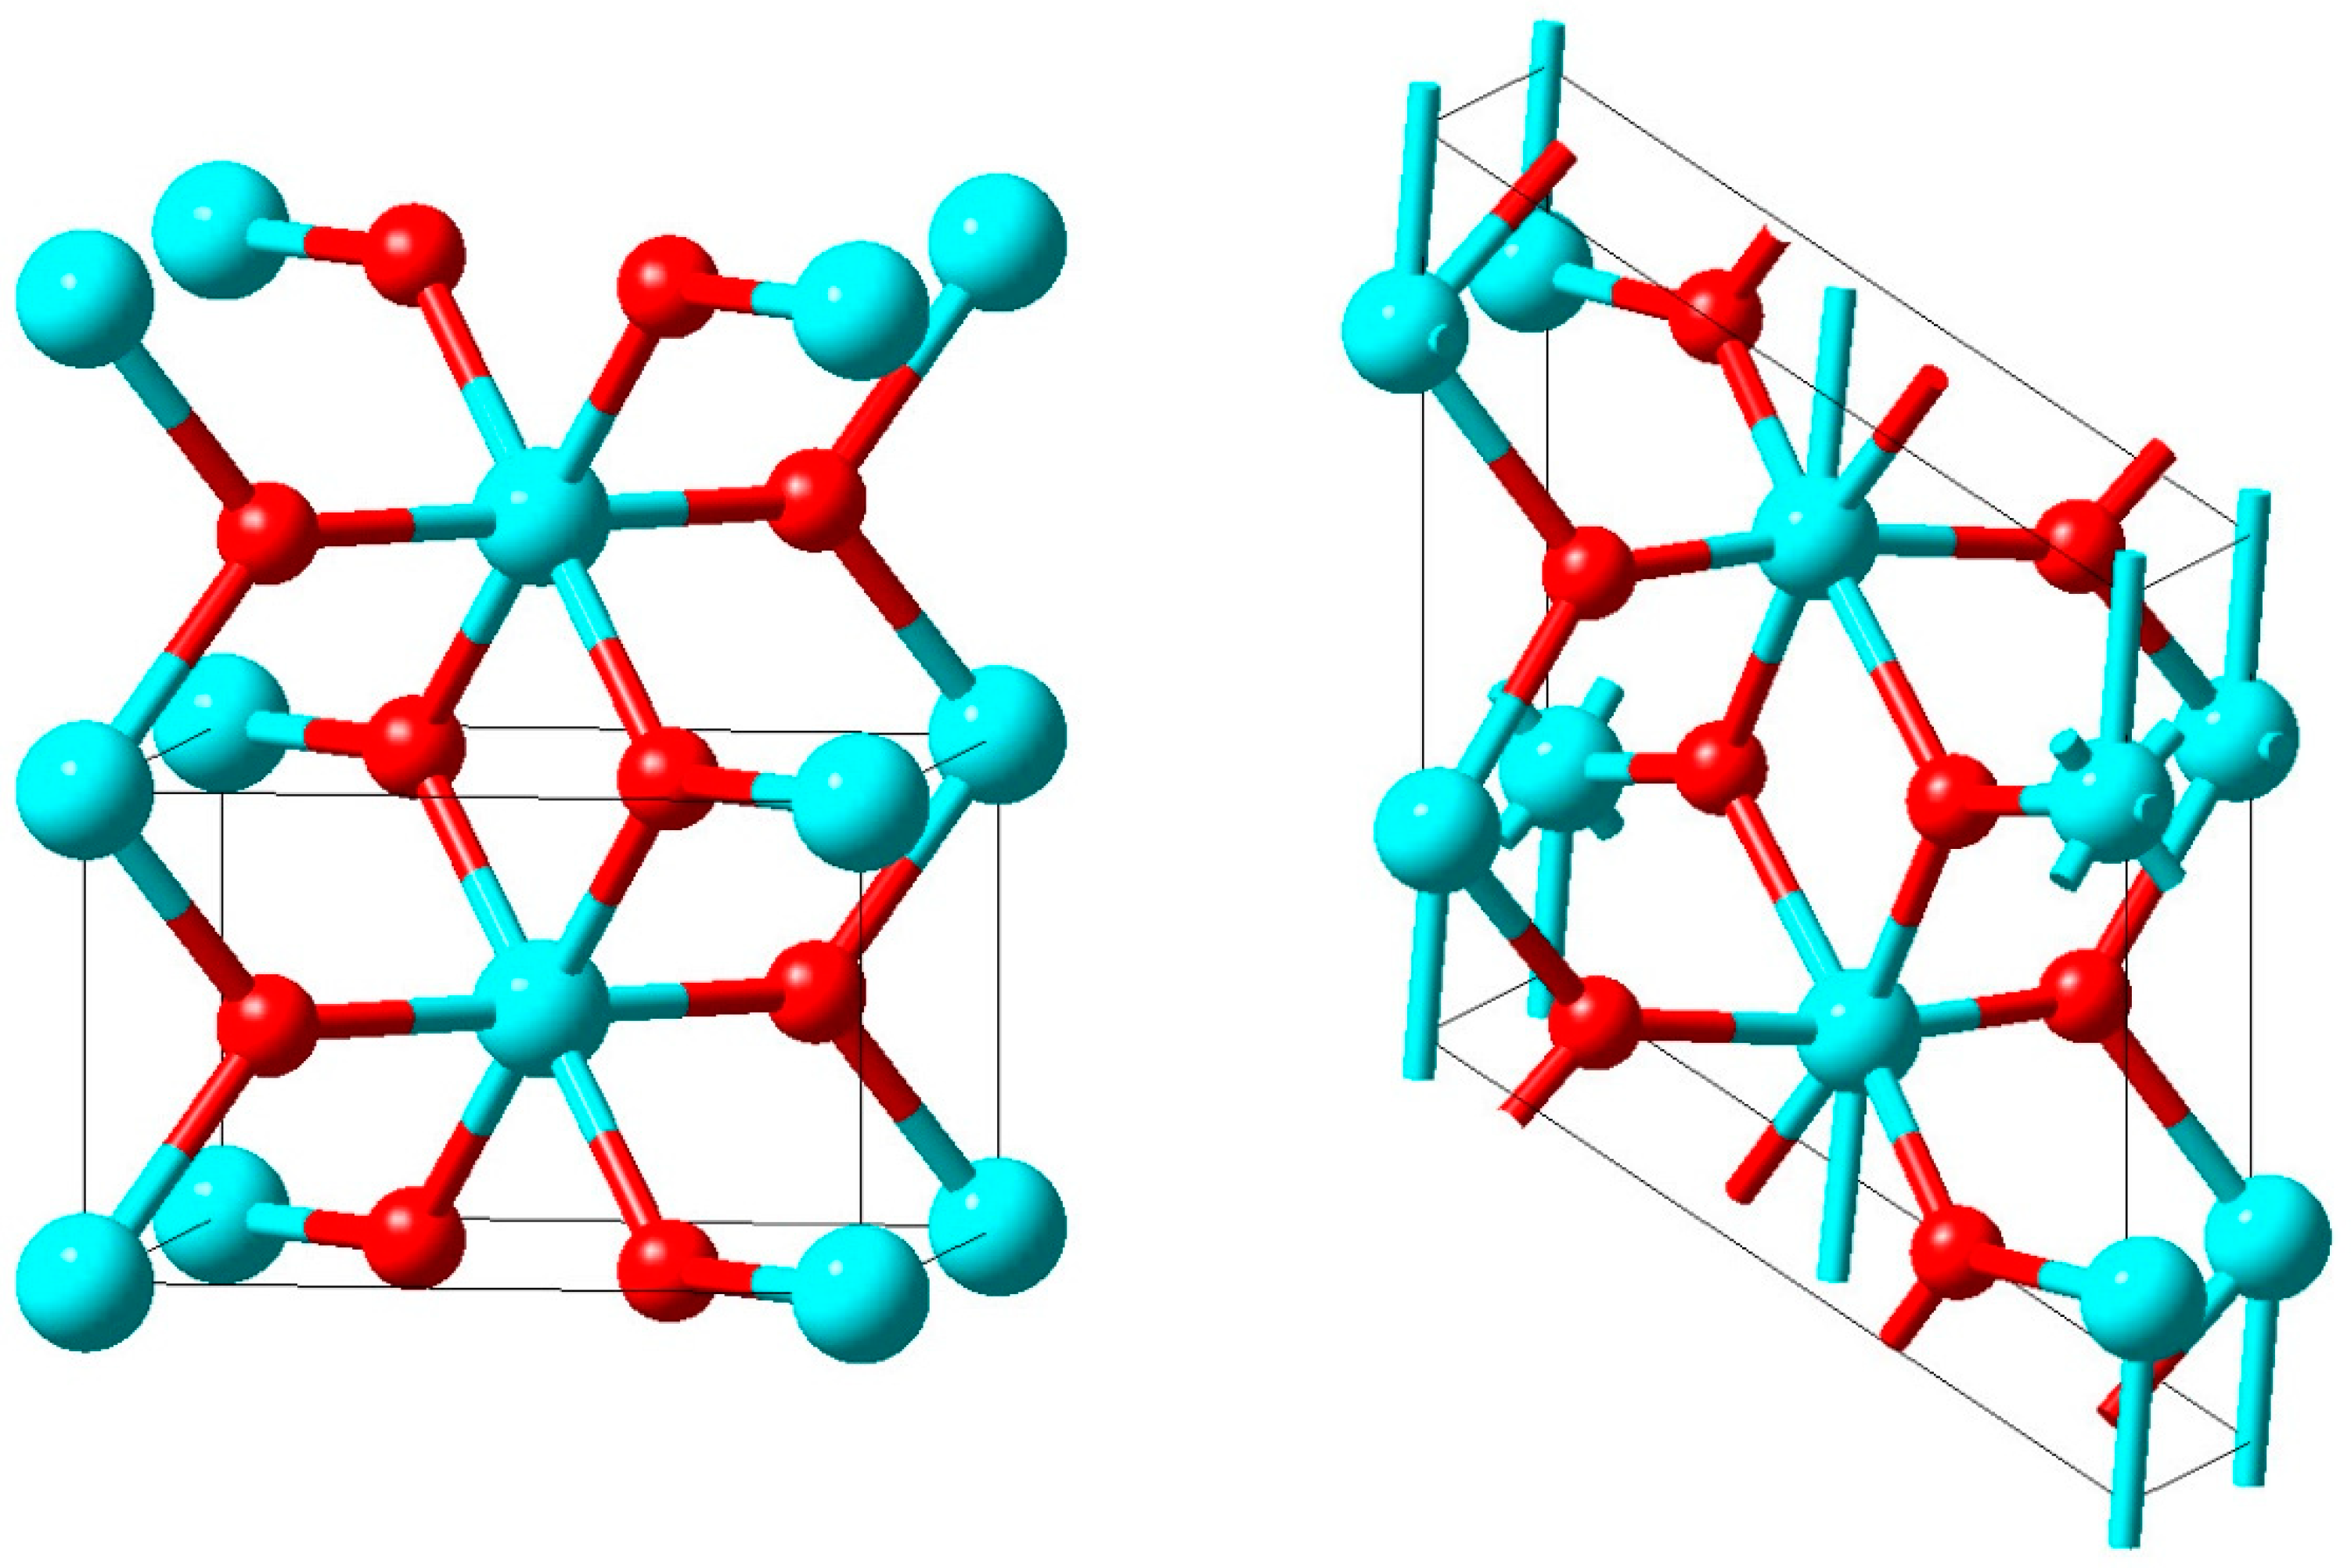
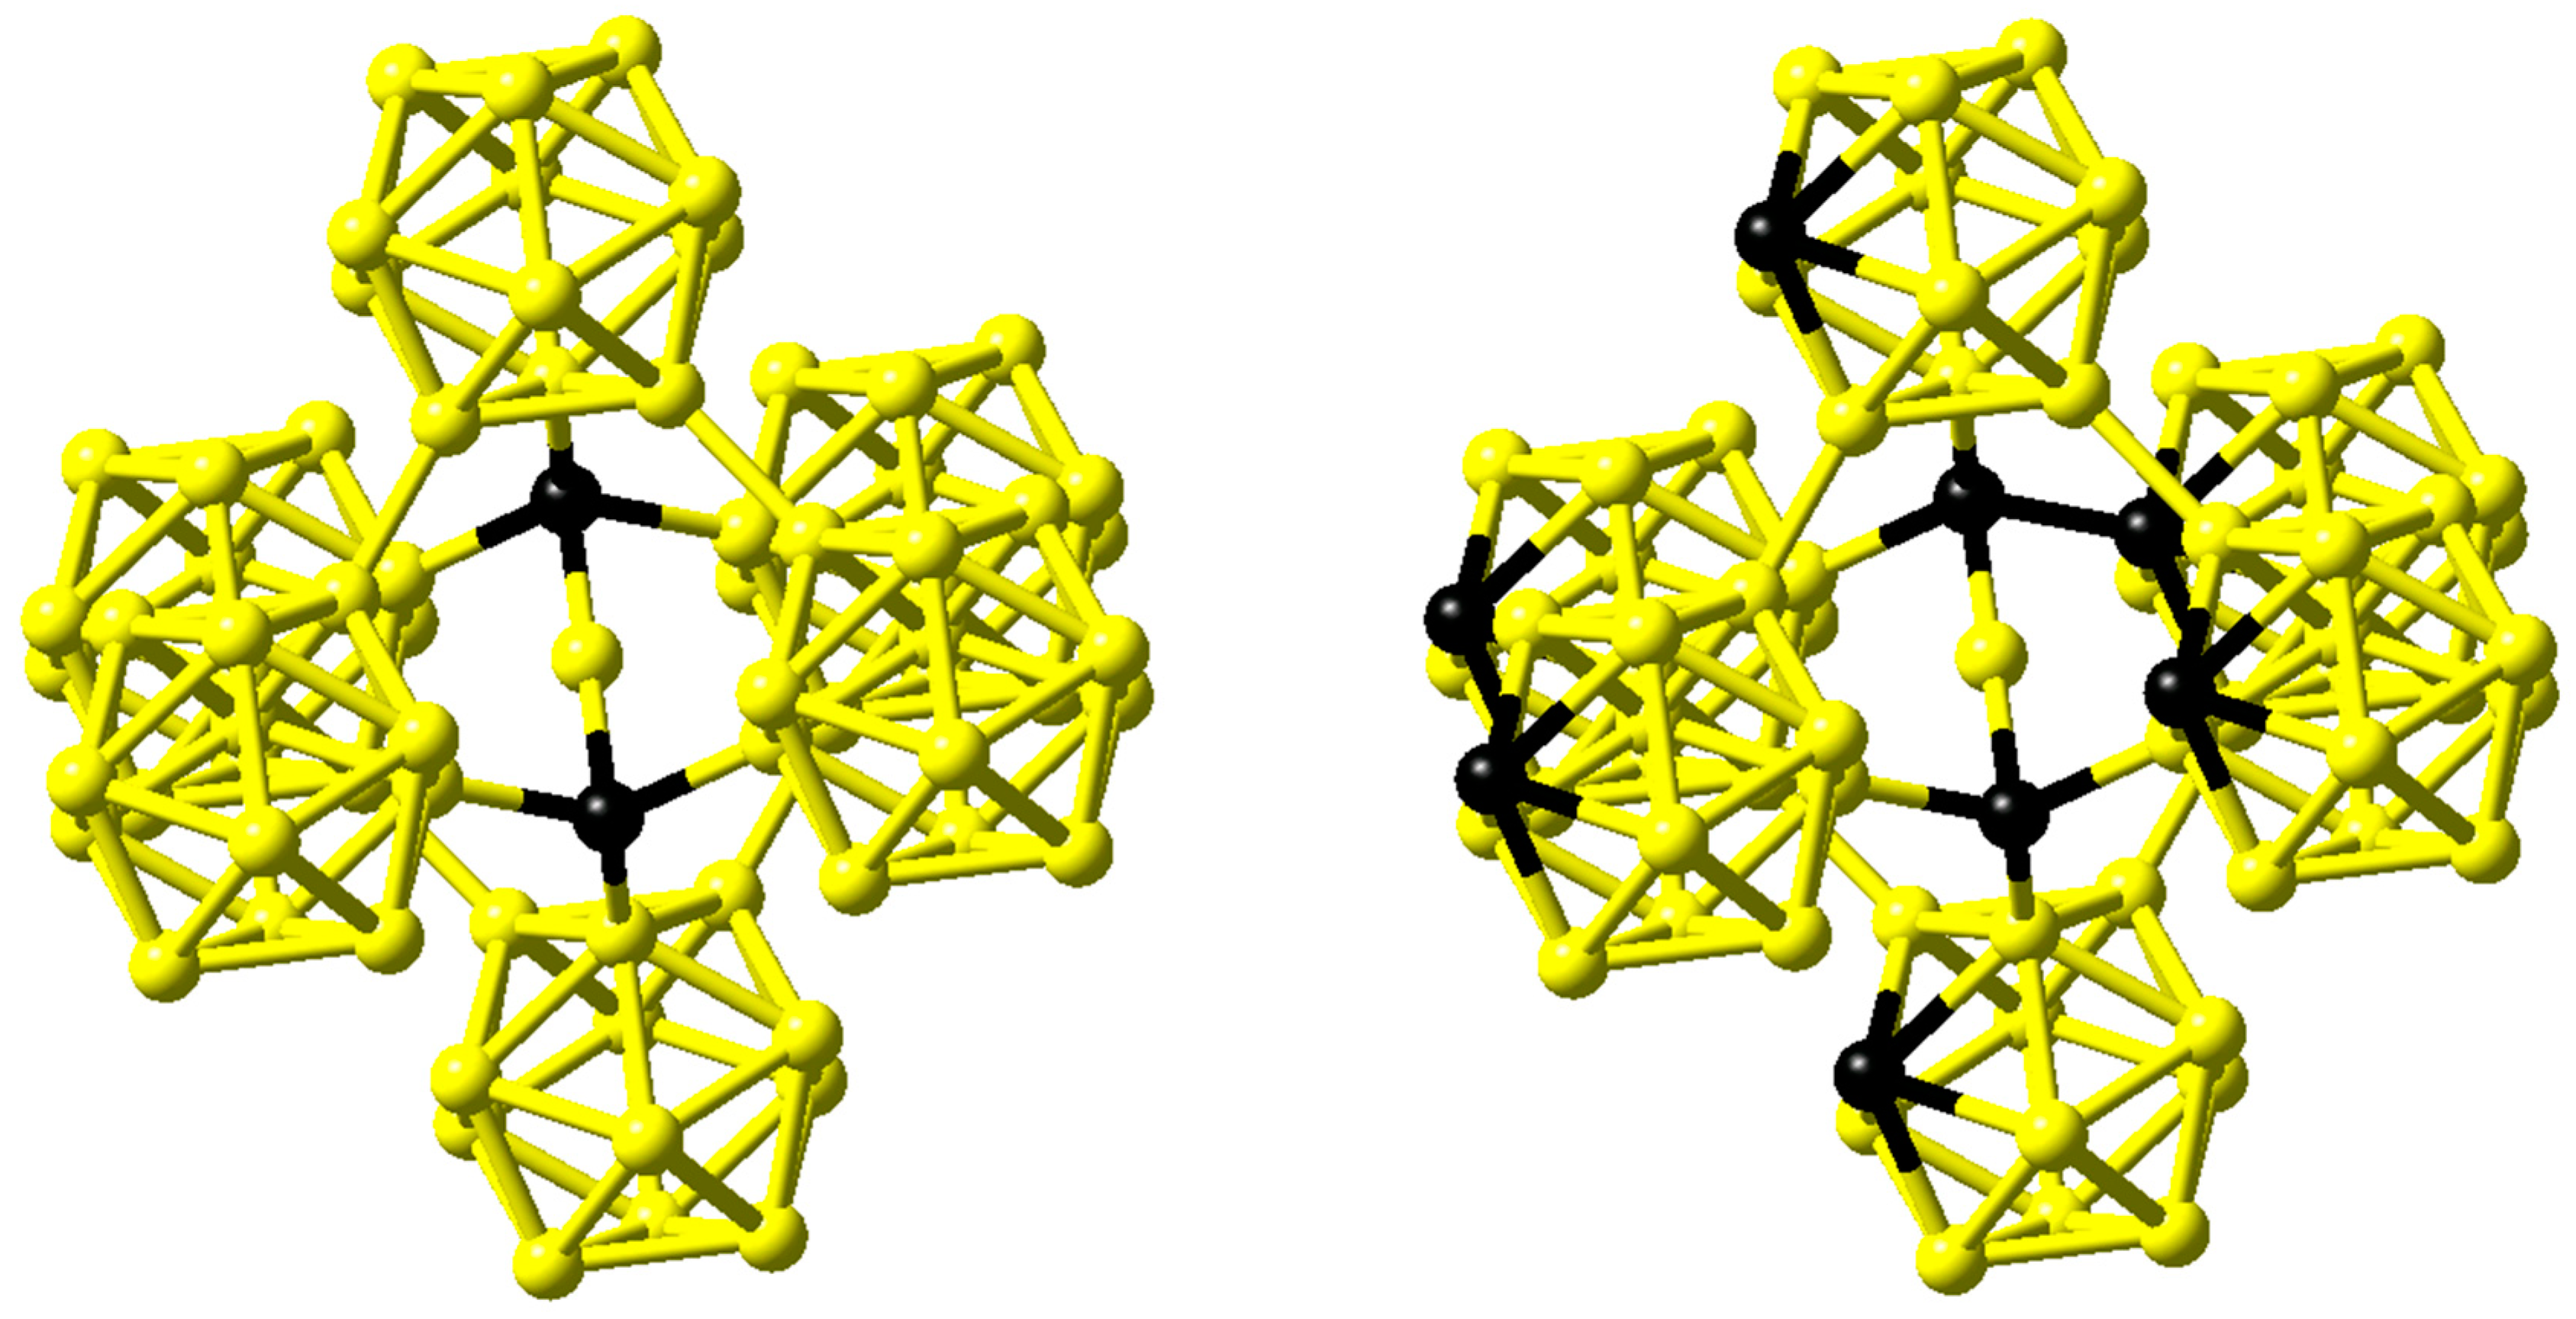
The crystal structure of boron carbide is characterized by a rhombohedral lattice with a single icosahedron at the corner of the unit cell and a three-atom linear rod parallel to the hexagonal c axis at the centre of the unit cell with lattice parameters of about a = 5.6 Å and c = 12.1 Å in hexagonal setting. However, the exact positions of the carbon atoms in this structure are far from being precisely known since B and C have very similar scattering cross sections for both neutron and X-rays. Larson obtained a C-B-C arrangement for both B4C and boron-rich B13C2 within the rods from X-ray diffraction data and, hence, boron-pure icosahedra as shown on the left hand side of Figure 10 for the latter compound [33]. Clark and Hoard gave a structure for B4C with linear C-C-C rods and again icosahedra comprised of only B atoms [34].
In contrast, comparing infrared absorption and Raman diffusion measurements to the predictions of ab initio calculations for B4C, Lazzari et al. confirmed the finding of linear C-B-C rods reported by Larson but in addition were able to identify the carbon atom within the B11C icosahedra at the polar sites, which form the top and bottom triangles [35]. This structure is shown on the right hand side of Figure 10.
The same result was obtained by Mauri et al., who compared the results of their ab initio calculations to 13C and 11B NMR chemical shifts [36]. However, these groups considered only small sets of ordered structures.
In the present section, we describe a more comprehensive method going beyond all previous approaches, namely, the cluster expansion approach [37] together with ab initio calculations to take into account disorder effects and unambiguously determine the distribution of the atoms within the structure. An implementation of this method is offered by the UNiversal CLuster Expansion (UNCLE) code, which has become state of the art in the description of disordered systems [
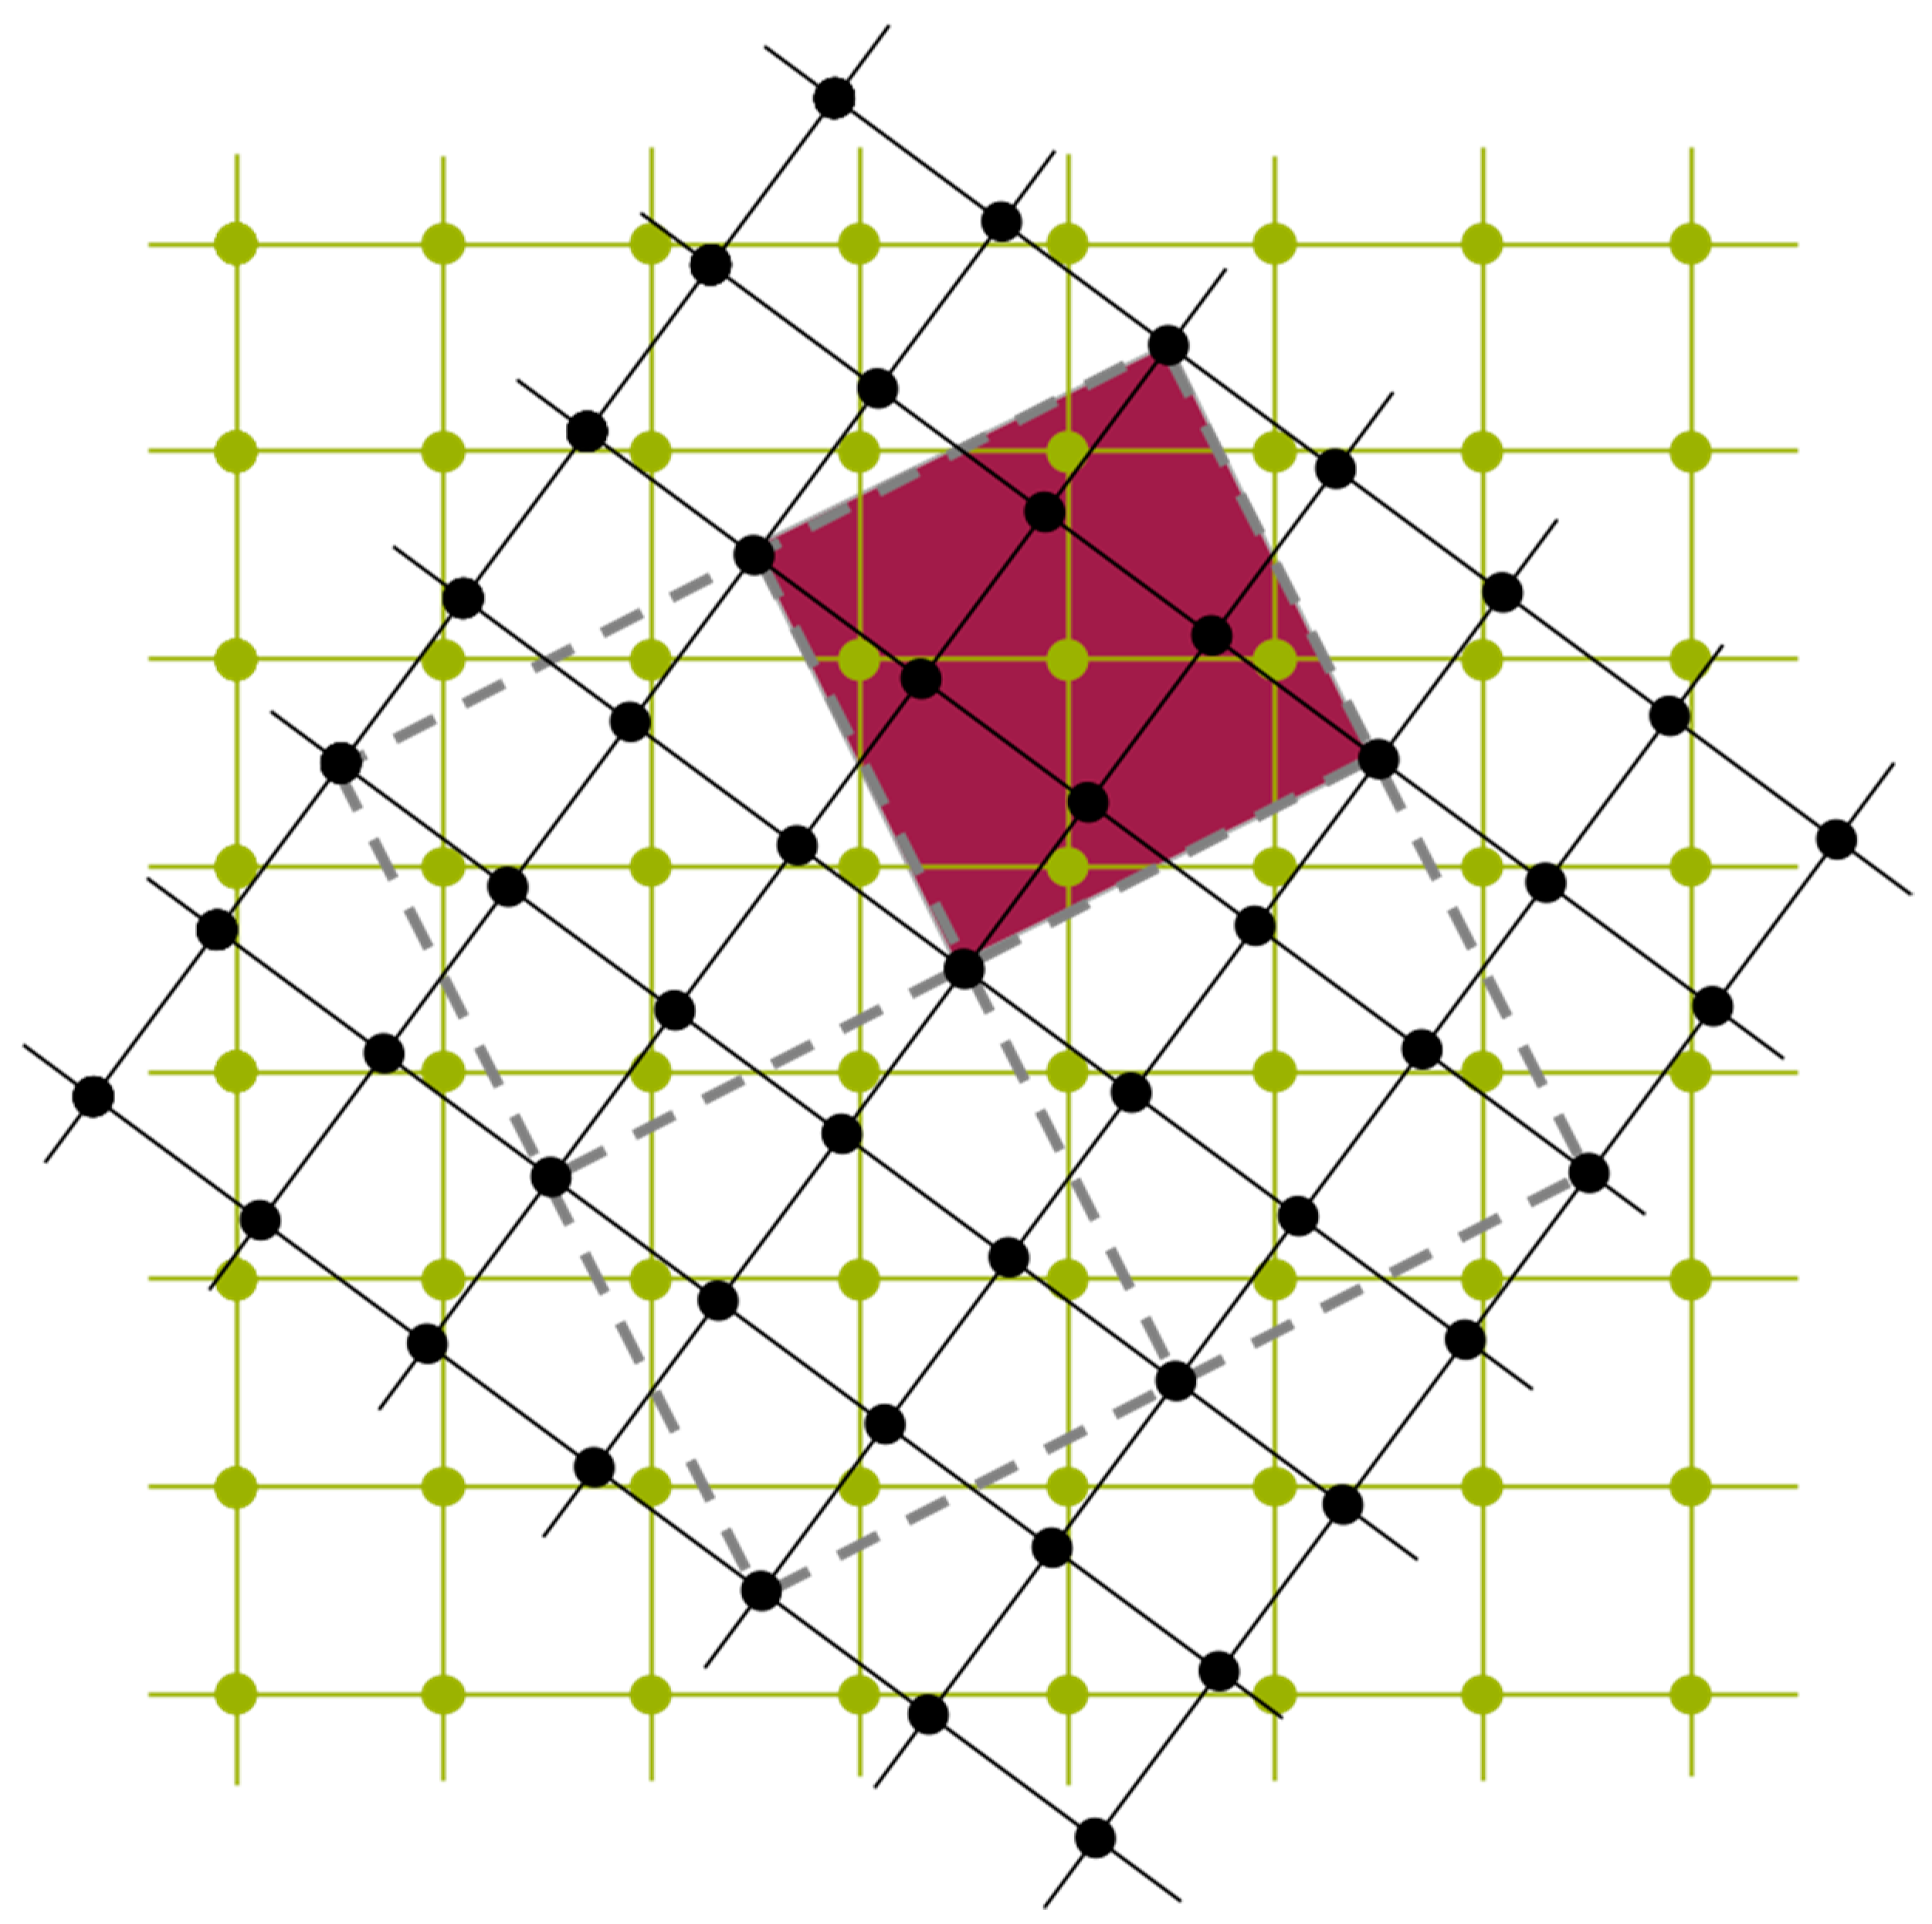
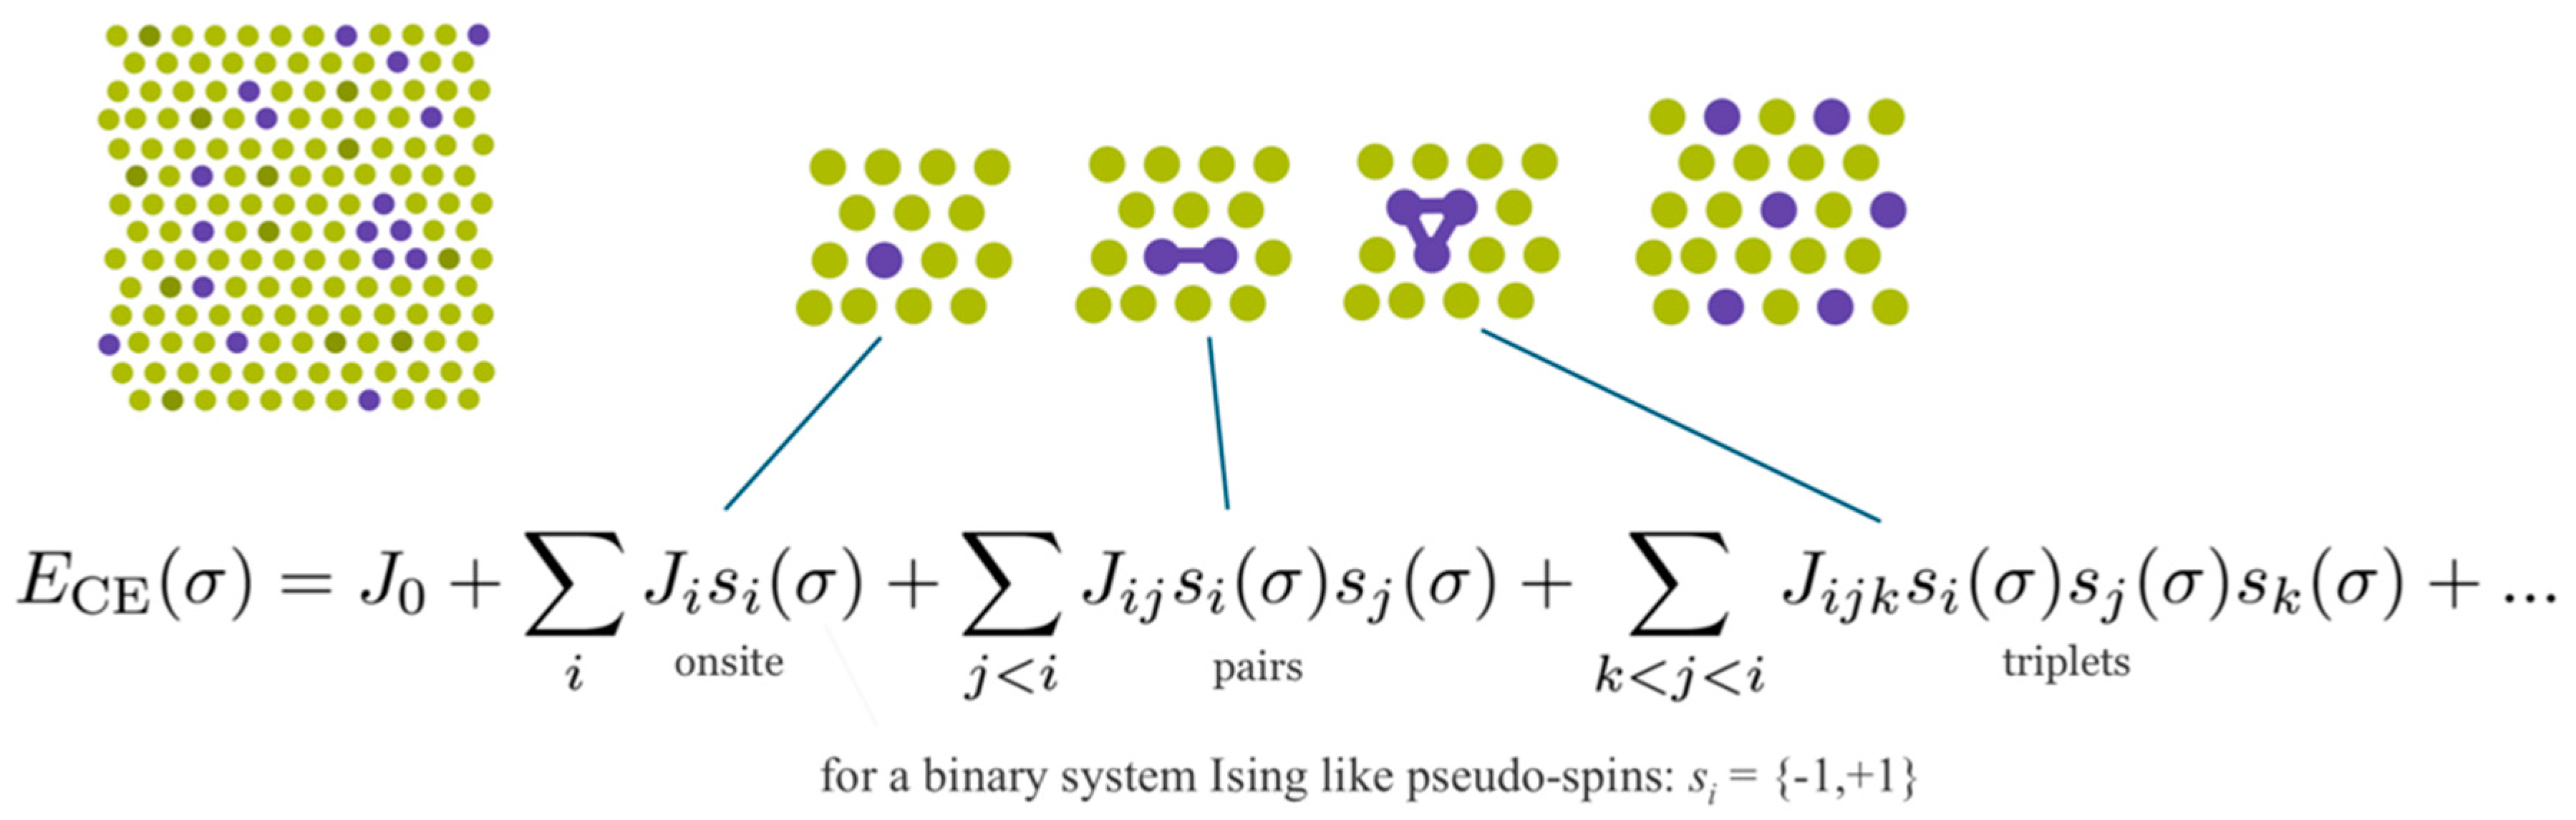
38]. In short, as indicated in Figure 11, UNCLE expresses a desired quantity, for example the total energy, as an expansion in contributions from clusters including progressively larger numbers of vertices.
A crystal structure can be decomposed into an infinite set of clusters with different size and composed of different number of vertices, that is, two-body interactions, three-body interactions and so forth, as shown in Figure 11. An effective interaction parameter is assigned to each of these clusters to reproduce the correct energy (or any other desired quantity). The core task is to truncate the cluster set at a reasonable size and to identify the effective interaction parameters.
The UNCLE code uses a genetic algorithm to identify an optimum set of clusters with their corresponding interaction parameters obtained by a least-squares fit from the energies of structures contained in a training set. In turn these energies are calculated by using a DFT method. Structures are iteratively added to the training set in the procedure sketched in Figure 12 until convergence is achieved.
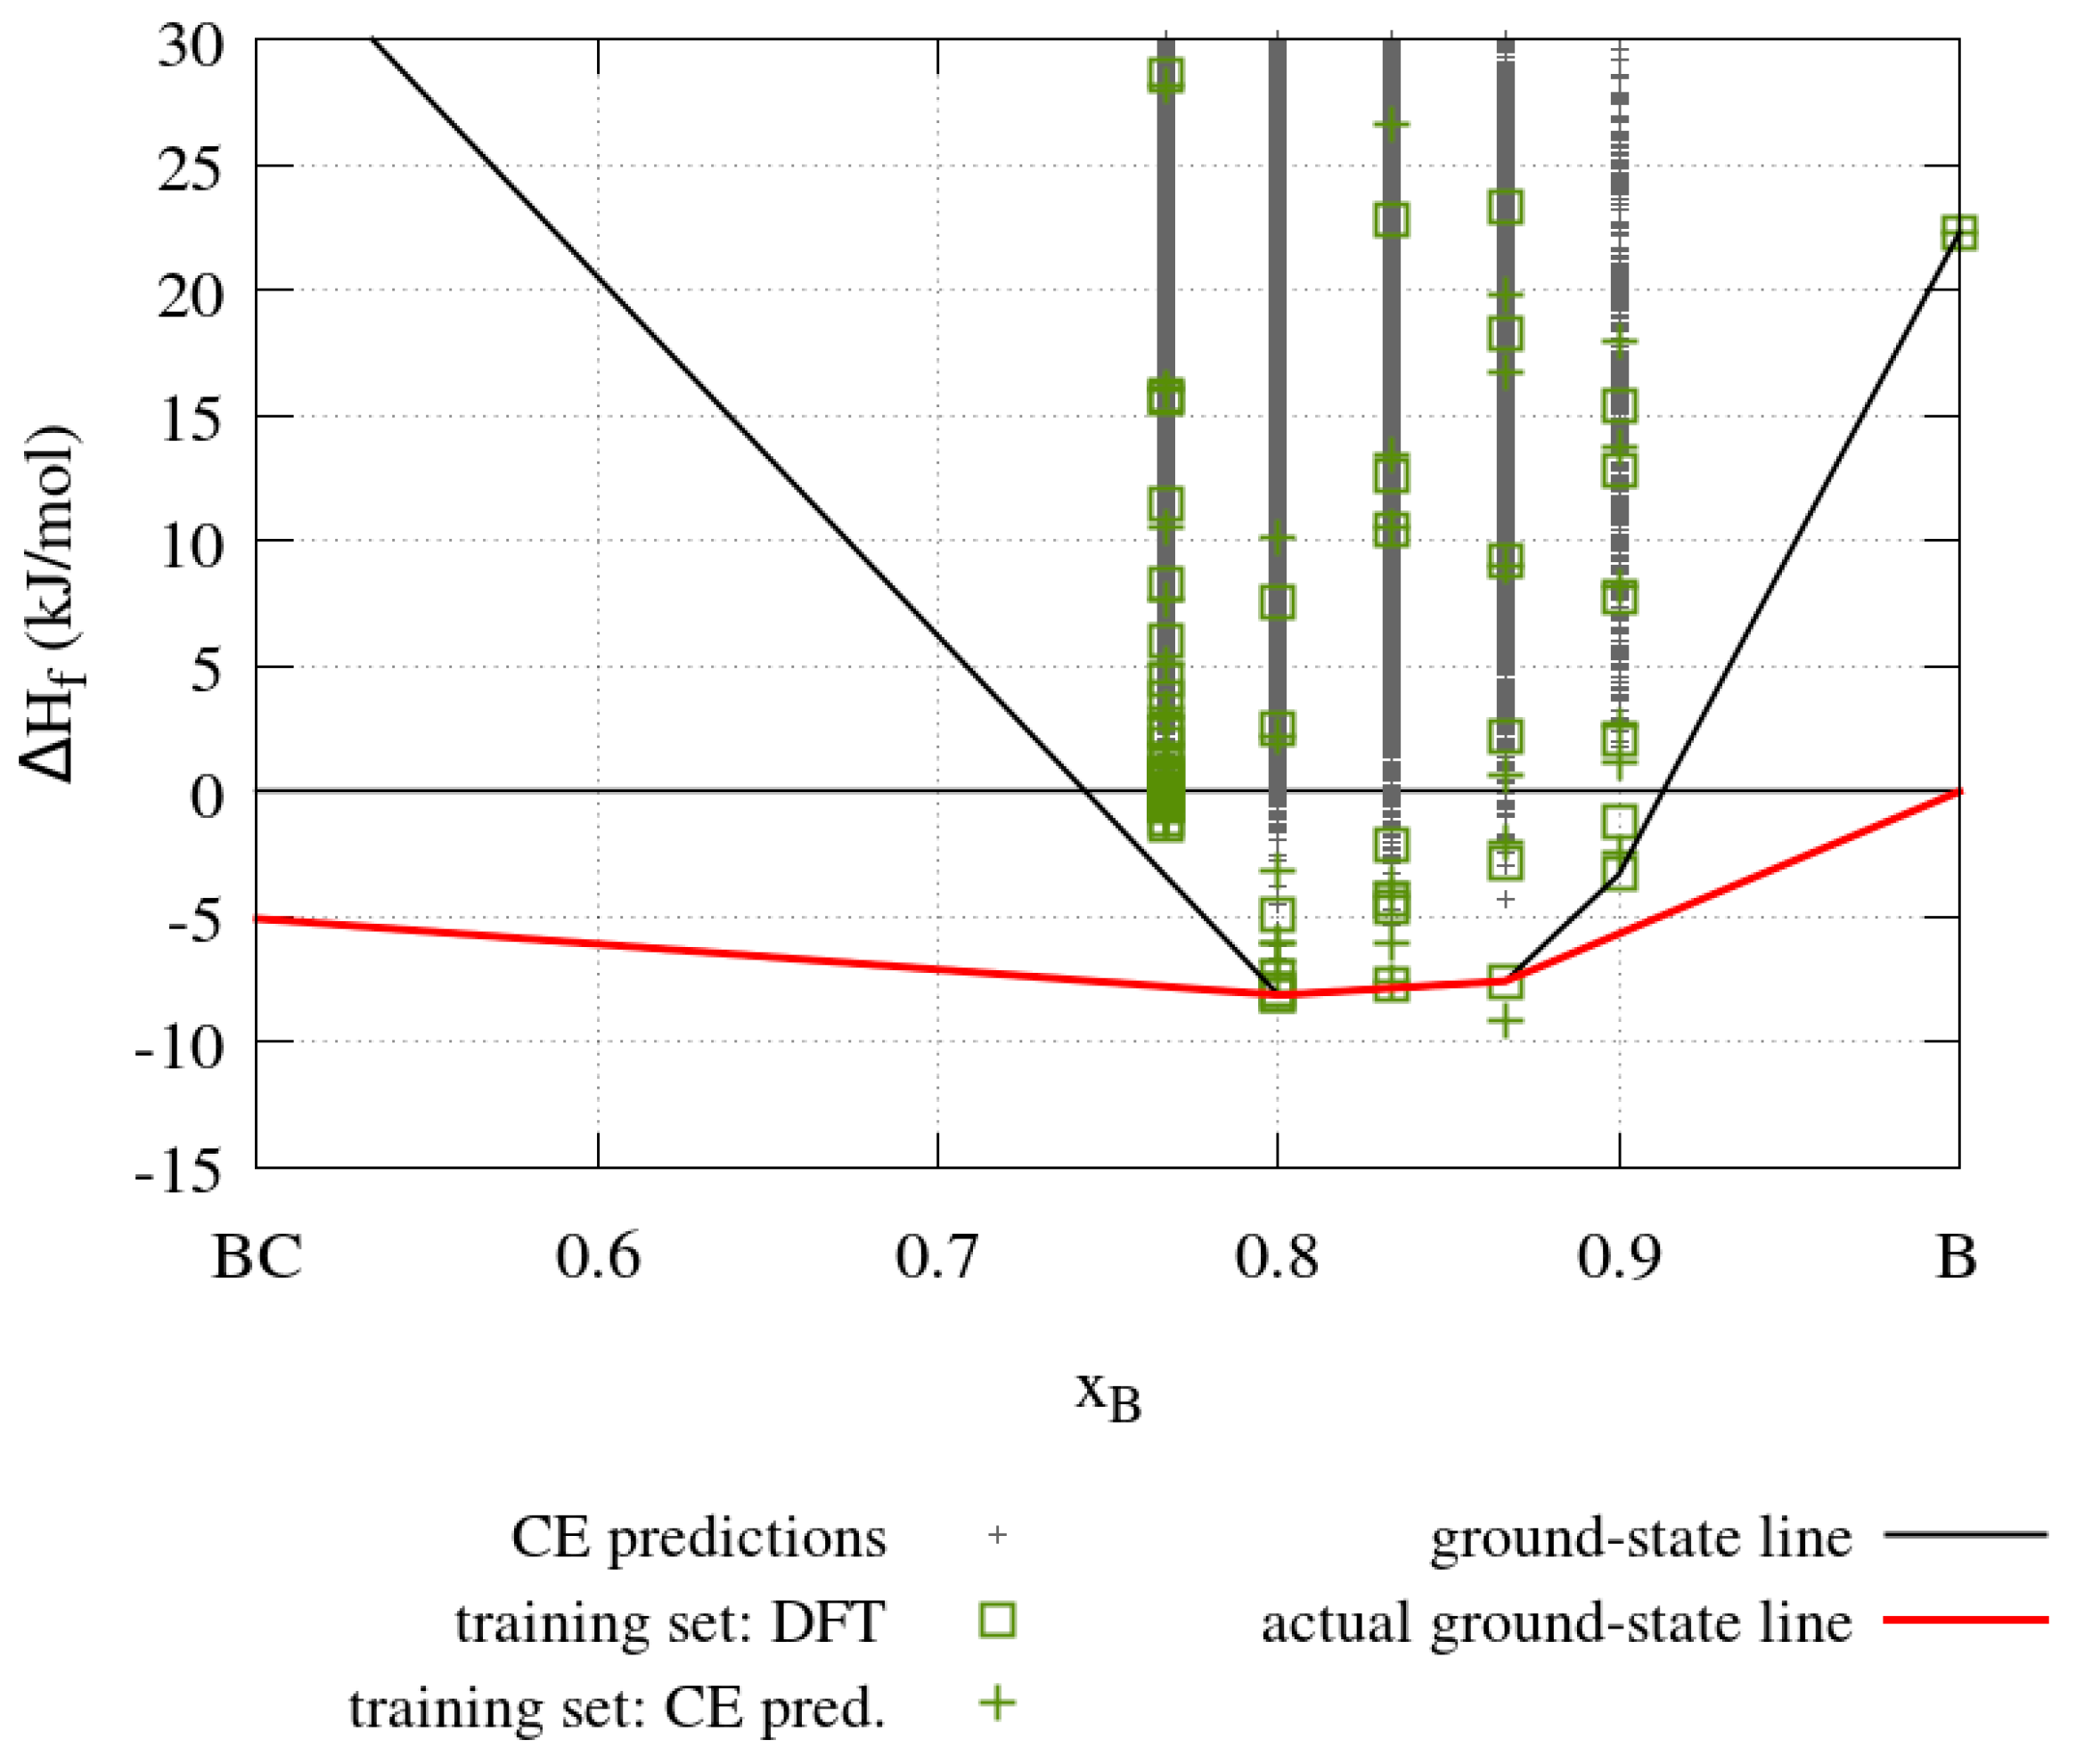
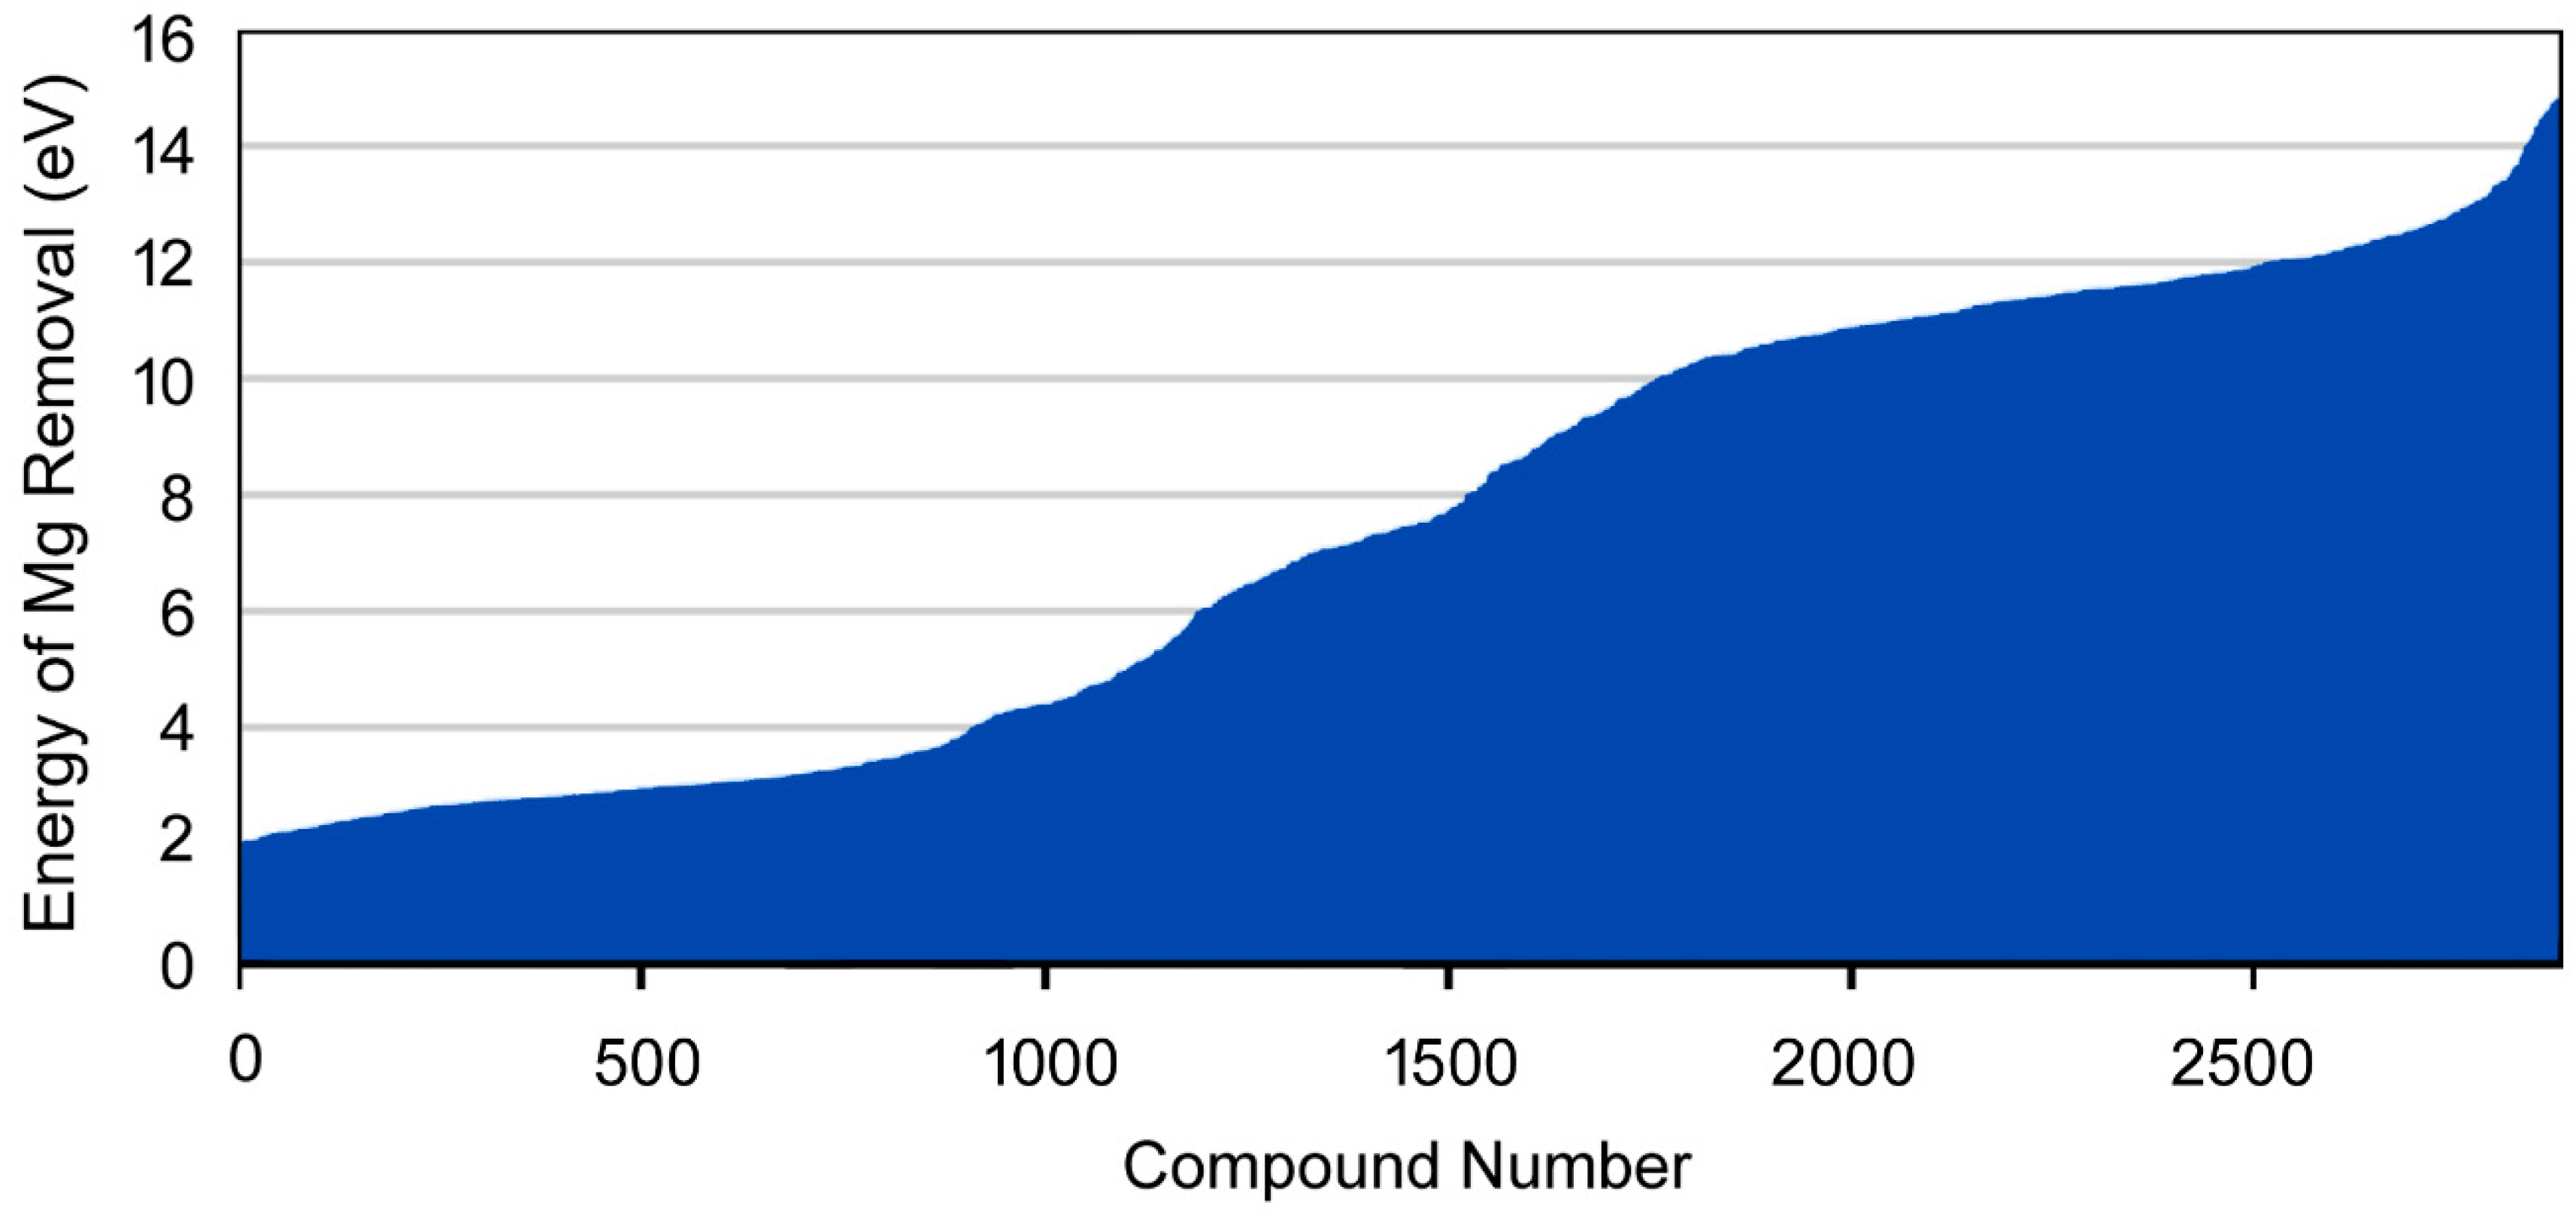
The results obtained from the cluster expansion calculations for the boron-carbide system are summarized in Figure 13, which shows enthalpies of formation for boron carbides with five different boron concentrations. The solid black line in Figure 13 indicates the convex hull obtained from the cluster expansion where the pure carbon and boron phases are based on the rhombohedral boron carbide crystal structure (cf. Figure 10), in which all sites are occupied by carbon and boron atoms, respectively. The solid red line indicates the true ground-state line with graphite as the most stable carbon compound and α-boron as the most stable boron compound. The boron carbide crystal structure is thermodynamically stable where the cluster expansion ground state line coincides with the true ground state line, that is, for x B in the range from 0.8 to 0.8667. The training set containing 63 structures with a maximum size of up to two unit cells is used to obtain the effective cluster interaction parameters. The energy of each structure in the training set is calculated with DFT. These effective cluster interaction parameters are then used to predict the energy of 838,511 structures with DFT accuracy.
The cluster expansion confirms the previous findings. However, since the cluster expansion takes 838,511 ordered structures into account with ab initio precision, the present results are general. Specifically, the ground-state structures obtained for B13C2 (xB = 0.8667) and B4C (xB = 0.8) are identical to those proposed by Larson, Lazzari et al. and Mauri et al. shown in Figure 10, which share the linear C-B-C motifs, whereas additional carbon atoms prefer the polar sites of the icosahedra.
Furthermore, with the ground-state structures for different boron concentrations at hand, the elastic and vibrational properties of these compounds are readily calculated. The elastic coefficients are computed using a fully automated, symmetry general approach [39] as implemented in MedeA [1]. The results as summarized in Table 3 reveal considerable stiffening of the material with increasing C concentration between B9C and B4C as expected with the lowering of the enthalpy of formation within this sequence.
Finally, the computed phonon dispersions for B4C confirm the thermodynamic stability of this compound and reveal an isolated high-frequency mode, which originates from bond-stretching vibrations of the B atoms in the C-B-C linear rods as illustrated in Figure 14, which is consistent with the analysis of Lazzari et al. [35].
In summary, using the UNiversal CLuster Expansion (UNCLE) code as well as calculations of the mechanical and vibrational properties we were able to identify the ground-state structures of boron carbides with boron concentrations varying between xB = 0.8 and xB = 0.9. For B4C and B13C2 the investigation confirmed the C-B-C sequence of the linear rods, whereas additional carbon atoms in B4C prefer the polar sites of the icosahedra. Computed elastic properties showed a stiffening of boron carbide with increasing carbon concentration, while analysis of vibrational spectra revealed an identifiable high-frequency mode connected to bond-stretching within the linear rods.

3.4. High-Throughput Calculations

Computational screening calculations, searching composition, condition, or configuration space, are becoming a routine component of CME and are supported in the MedeA high-throughput (MedeA HT) environment based on Flowcharts. An illustration of such a calculation is provided in Figure 15. Here a database search of materials containing magnesium results in a database ‘hit-list’ of 2886 systems based on search criteria including constraints on the total maximum number of elements present in the compound and the size of the unit cell for the material. For each of these systems, the strength of binding of magnesium within the system was evaluated automatically by computing the energy of the complete system, removing a magnesium atom, recomputing the system energy and computing the energy difference for both systems. This simple procedure directly probes the strength of the bonding present in the system for magnesium and allows different bonding schemes and classes of materials to be identified and studied in detail.
The screening results summarized in Figure 15 represent more than 5000 separate VASP calculations but required the execution of a single Flowchart which in turn managed all model manipulation and data analysis. The resulting calculations consumed 9 days of computation time on 16 cores of a current generation compute server and can be parallelized straightforwardly. Hence, these calculations would have required around 3 h on 1600 cores, for example. Such screening calculations offer tremendous insights into the variation of system properties as well as into the origins of such variations.

3.5. Accurate Band Gaps of Transition-Metal Oxides from Hybrid-Functional Calculations

The metal-insulator transition (MIT) of stoichiometric VO2 at ambient pressure has been the subject of ongoing dispute since its discovery in the 1950s [40,41]. Occurring at the technologically interesting temperature of 340 K this metal-insulator transition is connected with a change in resistivity of several orders of magnitude leading to applications in surface coatings, sensors and imaging systems. Interestingly, this transition temperature is closely related to that of a structural transition from the high-temperature rutile structure to a low-temperature monoclinic M1 structure, which deviates from the former by a pronounced V-V dimerization parallel to the rutile c-axis and a zigzag-like antiferroelectric displacement of the V atoms perpendicular to that axis.
In Figure 16, two unit cells of the rutile structure with the characteristic VO6 octahedra and the vertical V-atom chains are displayed on the left hand side. In the monoclinic M1 structure shown on the right hand side of that figure the unit cell is doubled and the vanadium atoms in the chains are dimerized as well as horizontally shifted off the octahedral centres.
As has been discussed by Goodenough, these atomic displacements can be nicely translated into energetic shifts and splittings of the relevant V 3d and closely related O 2p states. In doing so, Goodenough was indeed able to provide a qualitative understanding of the metal-insulator transition within the framework of an orbital or band picture [42,43]. However, this suggestion was soon questioned by Mott and co-workers, favouring the explanation that strong electron correlations play a dominant role for the metal-insulator transition and regarding the structural changes rather as an amendment [44]. Indeed, first principles calculations as based on density functional theory and the local density or generalized-gradient approximation underrepresented the insulating behaviour and resulted in a slight semimetal-like overlap of the valence and conduction bands [41,45]. The situation became even more complicated by the discovery of the additional low-temperature insulating M2 phase with a slightly different pattern of the structural distortions and long-range magnetic ordering [46,47]. Again, for this new phase, density functional theory together with a semi-local approximation failed to fully capture the insulating behaviour [41].
While for many years these opposing perspectives could not be reconciled, modern hybrid functionals, which are known to accurately describe the electronic and magnetic properties of semiconducting phases of correlated electron materials [18], offered the realistic chance to successfully account for the opening of a band gap in the semiconducting phases of VO2 as well as the antiferromagnetic ordering of its M2 phase and were thus expected to be able to also settle the long-standing dispute on the origin of the metal-insulator transitions of this cornerstone material [48].
This perspective motivated hybrid-functional calculations for both the metallic high-temperature rutile phase as well as the insulating low-temperature monoclinic M1 and M
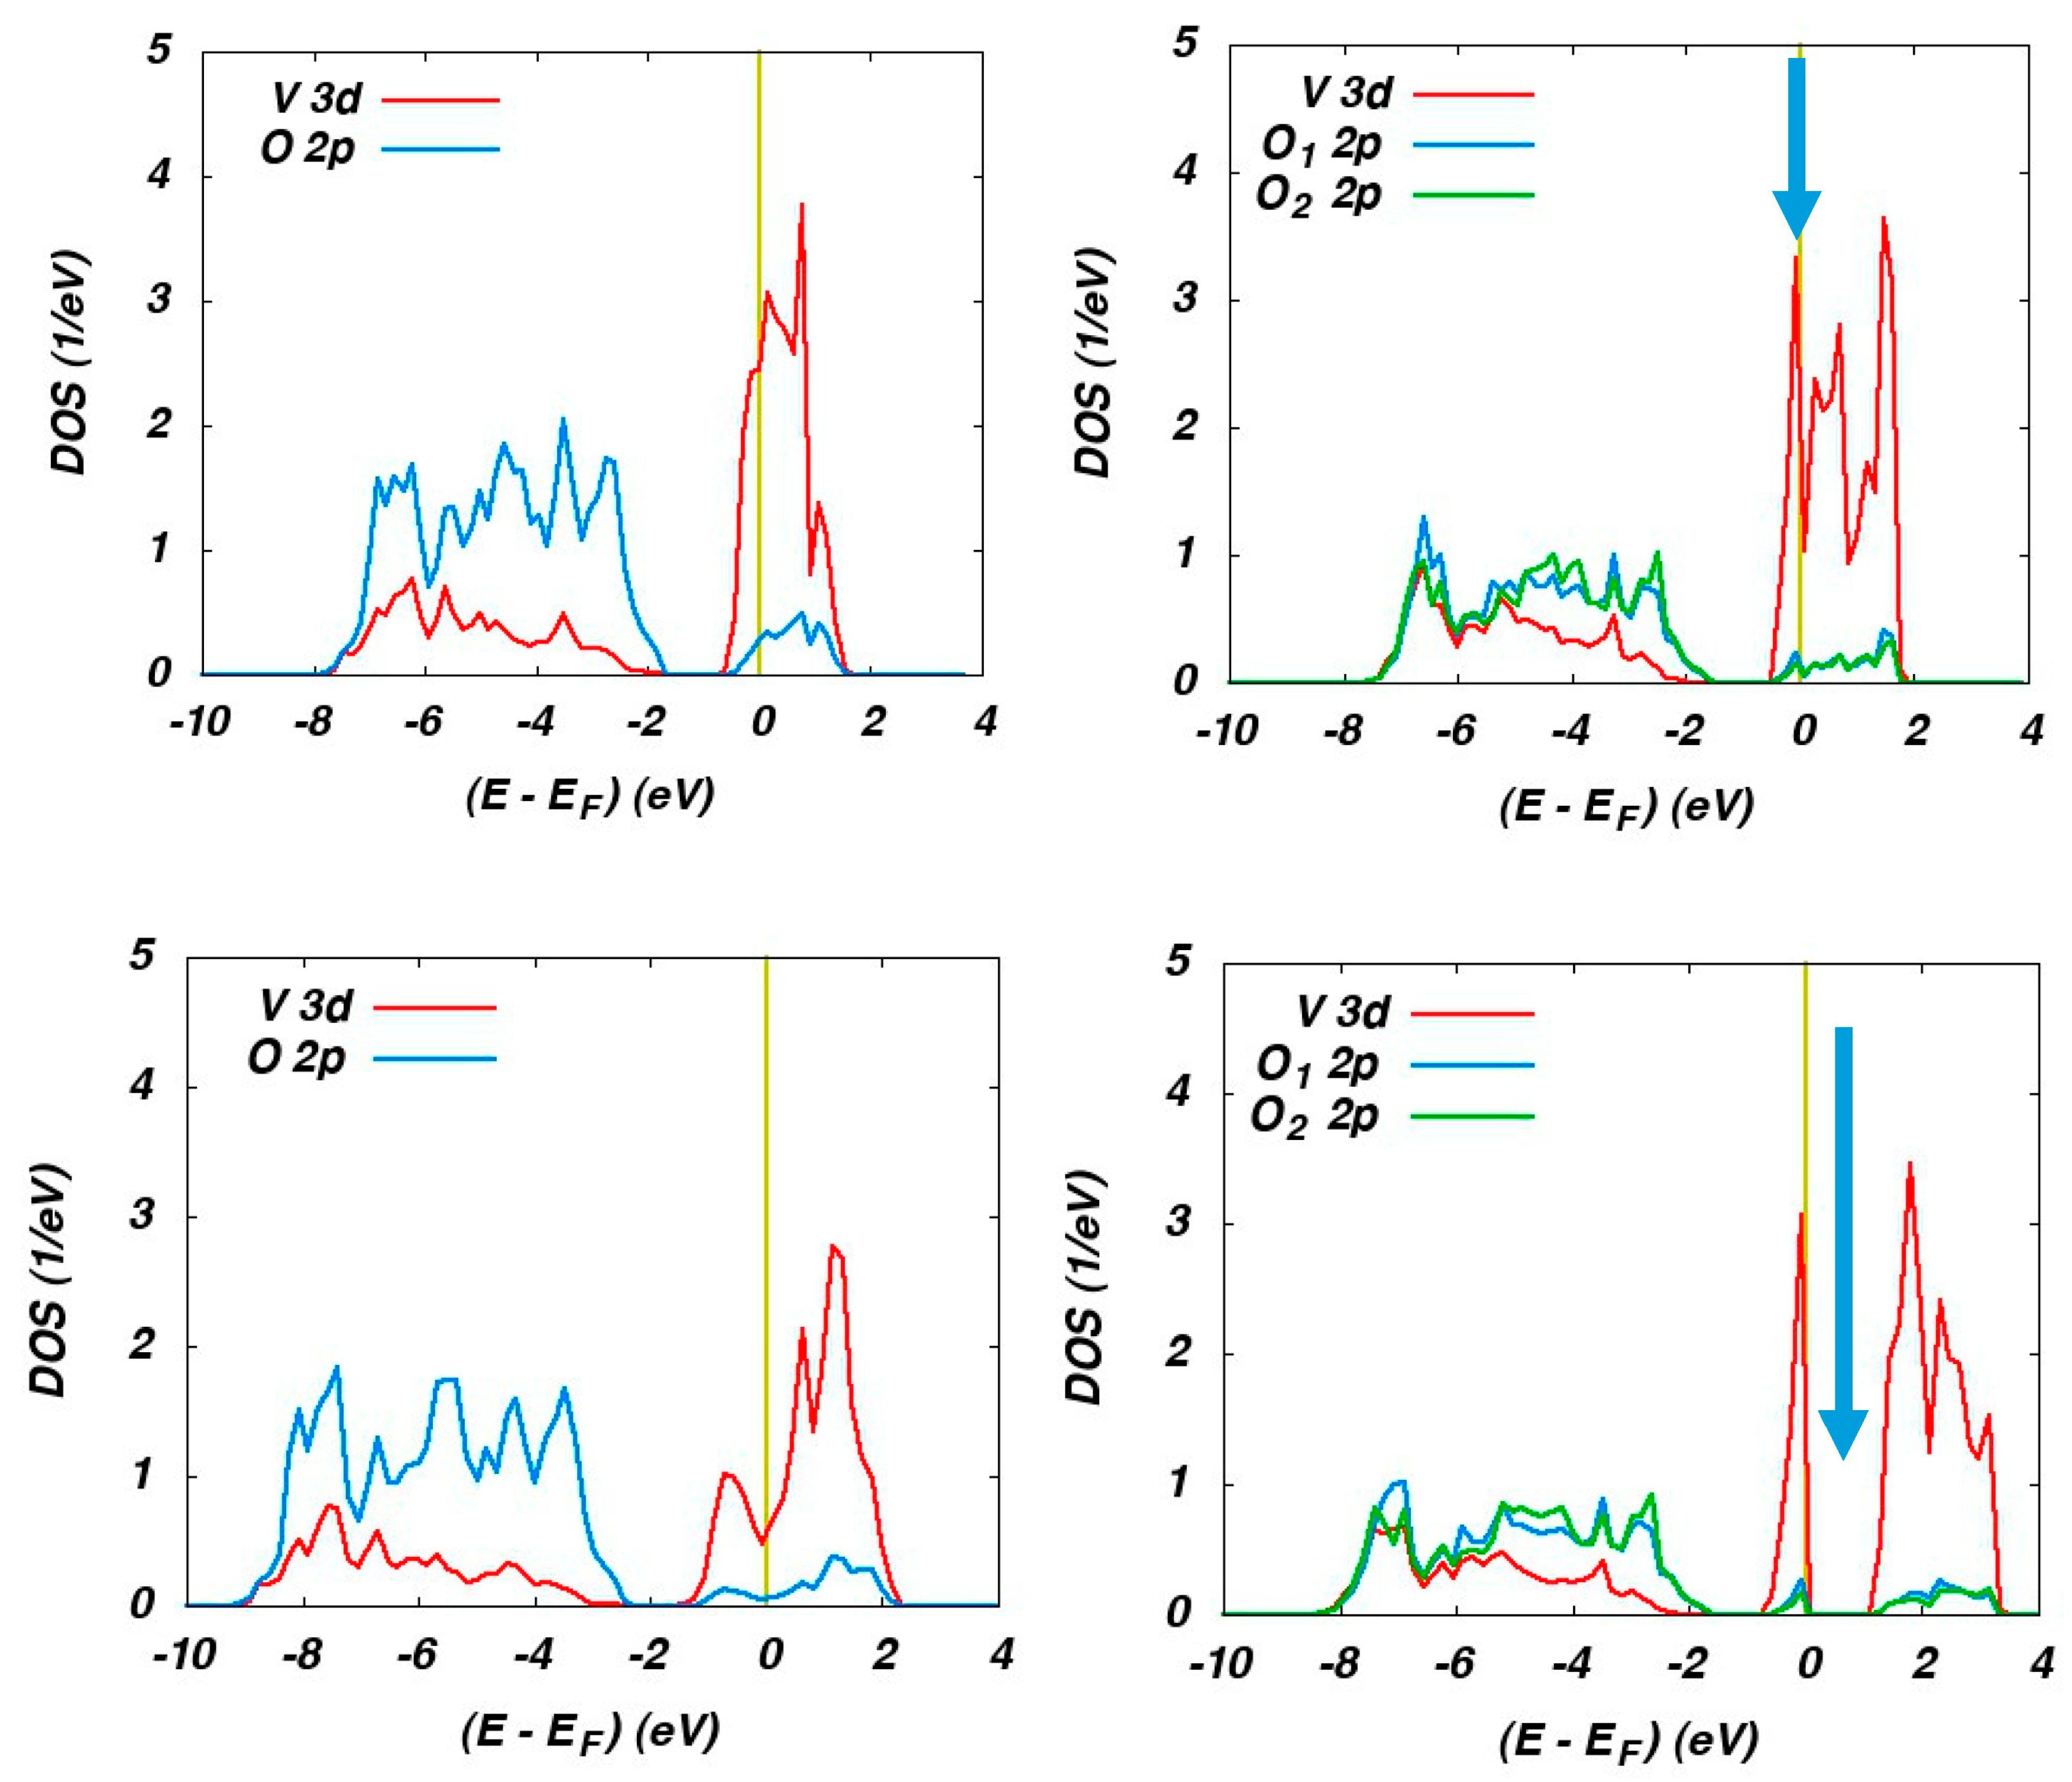
2 phases. The partial densities of states (DOS) calculated for the rutile phase using the semi-local GGA and HSE hybrid functional are displayed on the left-hand side of Figure 17.
The O 2p and V 3d states (with small admixtures from the respective other type of orbital due to hybridization of these states) are easily recognized well below and at the Fermi energy, respectively. Both functionals result in metallic behaviour in accordance with the experimental findings. However, use of the hybrid functional leads to a much larger width of the V 3d bands in much better agreement with photoemission data.
The corresponding partial DOS for the monoclinic M1 phase are displayed on the right-hand side of Figure 17. Again, the O 2p and V 3d states are well separated for both functionals. However, GGA and HSE result in completely different behaviour. While the GGA leads to metallic behaviour as clearly indicated by the presence of electronic states at the Fermi energy, the HSE calculations reproduce the observed optical band gap as indicated by the arrow.
Finally, spin-polarized antiferromagnetic calculations were performed for the insulating M2 phase. For this phase, GGA calculations likewise fail to reproduce the insulating behaviour, whereas HSE calculations yield an optical band gap and well localized magnetic moments at the vanadium sites, thus impressively underlining the striking progress offered by hybrid functionals.
Overall, the calculations thus demonstrated for the first time that first-principles calculations using hybrid functionals are entirely capable of describing the electronic and magnetic properties of the insulating phases of VO2, one of the key representatives of the broad class of electronically correlated materials. Furthermore, the calculations allowed for a deeper understanding of the origin of the metal-insulator transition, which was shown to be intimately connected to the structural changes occurring at the phase transition as suggested by Goodenough and co-workers. Nevertheless, follow-up studies indicated that methods based on density functional theory have difficulties capturing the correct magnetic states of the rutile and M1 phases. A lot of work has been devoted to this issue as well as to investigations regarding the simultaneous occurrence of the electronic and structural transitions leading from the rutile phase to the monoclinic M1 phase [49].

4. Conclusions

In this review article we have illustrated by several examples the strengths of state-of-the-art atomistic simulations as based on highly efficient computer codes and comprehensive software environments. In particular, while the discussion of recent projects in the field of battery research for automotive applications and contacts in electronics devices showed how current industrial problems can be solved using computational materials research, the sections discussing the use of the cluster expansion method for determining the exact structure of boron carbide, the critical impact of hybrid functionals for the accurate description of semiconductor band gaps and the leveraging of high-throughput methods demonstrated how recent developments push the limits and will even more advance the use of atomistic simulations in the years to come.

Author Contributions

M.C. and V.E. jointly performed the calculations for the low-strain cathode materials, the results were analysed together with A.M. and E.W.; V.E. and E.W. jointly worked on the embrittlement of the Cu microstructure by performing the calculations and analysing the results; D.R. and W.W. performed the calculations for boron carbide, which were discussed together with E.W.; the high-throughput calculations were performed by C.F. and E.W.; V.E. performed the calculations for vanadium dioxide; C.F. and E.W. coordinated and supervised the research; V.E. took the lead in writing the manuscript; all authors discussed the results, provided critical feedback and contributed to the final manuscript.

Funding

This project has received funding from the European Union’s Horizon 2020 research and innovation programme under Grant Agreement No. 723867.

Acknowledgments

This article is based on published work performed as a contract research project for Toyota Motors Europe and Infineon Technologies Germany. We are especially grateful to F. Rosciano of Toyota Motors Europe for initiating the project described in Section 3.1, for proposing to focus on spinel-type compounds with Mn as a transition metal, and for carrying out the synthesis and characterization of the proposed compounds. We are likewise indebted to M. Schneegans and W. Robl of Infineon Technologies Germany for initiating the project described in Section 3.2 as well as to all coauthors of Ref. [29] for their collaboration. All calculations described in this work were performed at the computer centre of Materials Design. The continuous assistance of the computer department is gratefully acknowledged.

Conflicts of Interest

MedeA is a product of Materials Design, Inc., the company for which the authors work.

References

  1. MedeA®—Materials Exploration and Design Analysis; Materials Design, Inc.: San Diego, CA, USA, 2018.
  2. Larsen, A.H.; Mortensen, J.J.; Blomqvist, J.; Castelli, I.E.; Christensen, R.; Dułak, M.; Friis, J.; Groves, M.N.; Hammer, B.; Hargus, C. The Atomic Simulation Environment—A Python library for working with atoms. J. Phys. Condens. Matter 2017, 29, 273002. [Google Scholar] [CrossRef] [PubMed]
  3. Jain, A.; Ong, S.P.; Hautier, G.; Chen, W.; Richards, W.D.; Dacek, S.; Cholia, S.; Gunter, D.; Skinner, D.; Ceder, G.; et al. The Materials Project: A Materials Genome Approach to Accelerating Materials Innovation. APL Mater. 2013, 1, 011002. [Google Scholar] [CrossRef]
  4. Saal, J.E.; Kirklin, S.; Aykol, M.; Meredig, B.; Wolverton, C. Materials Design and Discovery with High-Throughput Density Functional Theory: The Open Quantum Materials Database (OQMD). J. Miner. Met. Mater. Soc. 2013, 65, 1501–1509. [Google Scholar] [CrossRef]
  5. Kirklin, S.; Saal, J.E.; Meredig, B.; Thompson, A.; Doak, J.W.; Aykol, M.; Rühl, S.; Wolverton, C. The Open Quantum Materials Database (OQMD): Assessing the accuracy of DFT formation energies. Npj Comput. Mater. 2015, 1, 15010. [Google Scholar] [CrossRef]
  6. Ghiringhelli, L.M.; Carbogno, C.; Levchenko, S.; Mohamed, F.; Huhs, G.; Lüders, M.; Oliveira, M.; Scheffler, M. Towards a Common Format for Computational Material Science Data. arXiv, 2016; arXiv:160704738. [Google Scholar]
  7. Pizzi, G.; Cepellotti, A.; Sabatini, R.; Marzari, N.; Kozinsky, B. AiiDA: Automated interactive infrastructure and database for computational science. Comp. Mater. Sci. 2016, 111, 218–230. [Google Scholar] [CrossRef]
  8. Kresse, G.; Hafner, J. Ab initio molecular dynamics for liquid metals. Phys. Rev. B 1993, 47, 558. [Google Scholar] [CrossRef]
  9. Kresse, G.; Furthmüller, J. Efficient iterative schemes for ab initio total-energy calculations using a plane-wave basis set. Phys. Rev. B 1996, 54, 11169. [Google Scholar] [CrossRef]
  10. Kresse, G.; Furthmüller, J. Efficiency of ab-initio total energy calculations for metals and semiconductors using a plane-wave basis set. Comput. Mater. Sci. 1996, 6, 15–50. [Google Scholar] [CrossRef]
  11. Kresse, G.; Joubert, D. From ultrasoft pseudopotentials to the projector augmented-wave method. Phys. Rev. B 1999, 59, 1758. [Google Scholar] [CrossRef]
  12. Hohenberg, P.; Kohn, W. Inhomogeneous Electron Gas. Phys. Rev. 1964, 136, B864. [Google Scholar] [CrossRef]
  13. Kohn, W.; Sham, L.J. Self-Consistent Equations Including Exchange and Correlation Effects. Phys. Rev. 1965, 140, A1133. [Google Scholar] [CrossRef]
  14. Blöchl, P.E. Projector augmented-wave method. Phys. Rev. B 1994, 50, 17953. [Google Scholar] [CrossRef]
  15. Perdew, J.P.; Burke, K.; Ernzerhof, M. Generalized Gradient Approximation Made Simple. Phys. Rev. Lett. 1996, 77, 3865, Erratum: Generalized Gradient Approximation Made Simple. Phys. Rev. Lett. 1997, 78, 1396. [Google Scholar] [CrossRef] [PubMed]
  16. Perdew, J.P.; Ruzsinszky, A.; Csonka, G.I.; Vydrov, O.A.; Scuseria, G.E.; Constantin, L.A.; Zhou, X.; Burke, K. Restoring the Density-Gradient Expansion for Exchange in Solids and Surfaces. Phys. Rev. Lett. 2008, 100, 136406. [Google Scholar] [CrossRef] [PubMed]
  17. Seidl, A.; Görling, A.; Vogl, P.; Majewski, J.A.; Levy, M. Generalized Kohn-Sham schemes and the band-gap problem. Phys. Rev. B 1996, 53, 3764. [Google Scholar] [CrossRef]
  18. Marsman, M.; Paier, J.; Stroppa, A.; Kresse, G. Hybrid functionals applied to extended systems. J. Phys. Condens. Matter 2008, 20, 064201. [Google Scholar] [CrossRef] [PubMed]
  19. Heyd, J.; Scuseria, G.E.; Ernzerhof, M. Hybrid functionals based on a screened Coulomb potential. J. Chem. Phys. 2003, 118, 8207–8215. [Google Scholar] [CrossRef]
  20. Ebner, M.; Marone, F.; Stampanoni, M.; Wood, V. Visualization and Quantification of Electrochemical and Mechanical Degradation of Li Ion Batteries. Science 2013, 342, 716–720. [Google Scholar] [CrossRef]
  21. Ohzuku, T.; Ueda, A.; Yamamoto, N. Zero-Strain Insertion Material of Li[Li1/3Ti5/3]O4 for Rechargeable Lithium Cells. J. Electrochem. Soc. 1995, 142, 1431–1435. [Google Scholar] [CrossRef]
  22. Kundaraci, M.; Amatucci, G.G. Synthesis and Characterization of Nanostructured 4.7 V LixMn1.5Ni0.5O4 Spinels for High-Power Lithium-Ion Batteries. J. Electrochem. Soc. 2006, 153, A1345–A1352. [Google Scholar] [CrossRef]
  23. Rosciano, F.; Christensen, M.; Eyert, V.; Mavromaras, A.; Wimmer, E. Reduced Strain Cathode Materials for Solid State Lithium Ion Batteries. International Patent WO 2014191018, 4 December 2014. [Google Scholar]
  24. Rosciano, F.; Christensen, M.; Eyert, V.; Mavromaras, A.; Wimmer, E. Computational Design and Experimental Verification of Zero- and Low-Strain Cathode Materials for Solid-State Li-Ion Batteries; International Battery Association: Brisbane, Australia, 2014. [Google Scholar]
  25. Vegard, L.Z. Die Konstitution der Mischkristalle und die Raumfüllung der Atome. Z. Phys. 1921, 5, 17–26. [Google Scholar] [CrossRef]
  26. Ariyoshi, K.; Yamato, R.; Ohzuku, T. Zero-strain insertion mechanism of Li[Li1/3Ti5/3]O4 for advanced lithium-ion (shuttlecock) batteries. Electrochim. Acta 2005, 51, 1125–1129. [Google Scholar] [CrossRef]
  27. Hall, E.O. The Deformation and Ageing of Mild Steel: III Discussion of Results. Proc. Phys. Soc. Sec. B 1951, 64, 747. [Google Scholar] [CrossRef]
  28. Petch, N.J. The Cleavage Strength of Polycrystals. J. Iron Steel Inst. 1953, 174, 25–28. [Google Scholar]
  29. Wimmer, A.; Smolka, M.; Heinz, W.; Detzel, T.; Robl, W.; Motz, C.; Eyert, V.; Wimmer, E.; Jahnel, F.; Treichler, R.; et al. Temperature dependent transition of intragranular plastic to intergranular brittle failure in electrodeposited Cu micro-tensile samples. Mater. Sci. Eng. A 2014, 618, 398–405. [Google Scholar] [CrossRef]
  30. Kronberg, M.L.; Wilson, F.H. Secondary recrystallization in copper. JOM 1949, 185, 501–514. [Google Scholar] [CrossRef]
  31. Villars, P.; Cenzual, K.; Daams, J.L.C.; Hulliger, F.; Massalski, T.B.; Okamoto, H.; Osaki, K.; Prince, A.; Iwata, S. (Eds.) PAULING FILE, Binaries Edition; ASM International: Geauga County, OH, USA, 2002. [Google Scholar]
  32. Villars, P.; Berndt, M.; Brandenburg, K.; Cenzual, K.; Daams, J.; Hulliger, F.; Massalski, T.; Okamoto, H.; Osaki, K.; Prince, A.; et al. The PAULING FILE, Binaries Edition. J. Alloys Compd. 2004, 367, 293–297. [Google Scholar] [CrossRef]
  33. Larson, A.C. Comments concerning the crystal structure of B4C. AIP Conf. Proc. 1986, 140, 109–113. [Google Scholar]
  34. Clark, H.K.; Hoard, J.L. The Crystal Structure of Boron Carbide. J. Am. Chem. Soc. 1943, 65, 2115–2119. [Google Scholar] [CrossRef]
  35. Lazzari, R.; Vast, N.; Besson, J.M.; Baroni, S.; Dal Corso, A. Atomic Structure and Vibrational Properties of Icosahedral B4C Boron Carbide. Phys. Rev. Lett. 1999, 83, 3230. [Google Scholar] [CrossRef]
  36. Mauri, F.; Vast, N.; Pickard, C.J. Atomic Structure of Icosahedral B4C Boron Carbide from a First Principles Analysis of NMR Spectra. Phys. Rev. Lett. 2001, 87, 085506. [Google Scholar] [CrossRef] [PubMed]
  37. Sanchez, J.M.; Ducastelle, F.; Gratias, D. Generalized Cluster Description of Multicomponent Systems. Phys. A Stat. Mech. Its Appl. 1984, 128, 334–350. [Google Scholar] [CrossRef]
  38. Lerch, D.; Wieckhorst, O.; Hart, G.L.; Forcade, R.W.; Müller, S. UNCLE: A code for constructing cluster expansions for arbitrary lattices with minimal user-input. Model. Simul. Mater. Sci. Eng. 2009, 17, 055003. [Google Scholar] [CrossRef]
  39. Le Page, Y.; Saxe, P. Symmetry-general least- squares extraction of elastic data for strained materials from ab initio calculations of stress. Phys. Rev. B 2002, 65, 104104. [Google Scholar] [CrossRef]
  40. Morin, F.J. Oxides which show a Metal-to-Insulator Transition at the Neel Temperature. Phys. Rev. Lett. 1959, 3, 34. [Google Scholar] [CrossRef]
  41. Eyert, V. The metal-insulator transitions of VO2: A band theoretical approach. Ann. Phys. 2002, 11, 650–704. [Google Scholar] [CrossRef]
  42. Goodenough, J.B. Direct Cation-Cation Interactions in Several Oxides. Phys. Rev. 1960, 117, 1442. [Google Scholar] [CrossRef]
  43. Goodenough, J.B. The two components in the crystallographic transition in VO2. J. Solid State Chem. 1971, 3, 490–500. [Google Scholar] [CrossRef]
  44. Zylbersztejn, A.; Mott, N.F. Metal-insulator transition in vanadium dioxide. Phys. Rev. B 1975, 11, 4383. [Google Scholar] [CrossRef]
  45. Wentzcovitch, R.M.; Schulz, W.W.; Allen, P.B. VO2: Peierls or Mott-Hubbard? A view from band theory. Phys. Rev. Lett. 1994, 72, 3389. [Google Scholar] [CrossRef]
  46. Rice, T.M.; Launois, H.; Pouget, J.P. Comment on “VO2: Peierls or Mott-Hubbard? A view from band theory”. Phys. Rev. Lett. 1994, 73, 3042. [Google Scholar] [CrossRef] [PubMed]
  47. Wentzcovitch, R.M.; Schulz, W.W.; Allen, P.B. Wentzcovitch et al. reply. Phys. Rev. Lett. 1994, 73, 3043. [Google Scholar] [CrossRef]
  48. Eyert, V. VO2: A Novel View from Band Theory. Phys. Rev. Lett. 2001, 107, 016401. [Google Scholar] [CrossRef] [PubMed]
  49. Liu, K.; Lee, S.; Yang, S.; Delaire, O.; Wu, J. Recent progresses on physics and applications of vanadium dioxide. Mater. Today 2018, 21, 875–896. [Google Scholar] [CrossRef]
Figure 1. Li chemical potentials and volume changes of candidate cathode materials. The shaded area marks the target materials with a much lower volume change than the benchmark LiNi0.5Mn1.5O4.
Computation 06 00063 g001
Figure 2. Computed cell volume as a function of Li concentration in transition-metal oxides with the spinel structure.
Computation 06 00063 g002
Figure 3. Computed cell volume as a function of Li concentration in transition-metal oxides with the spinel structure.
Computation 06 00063 g003
Figure 4. Computed interatomic distances of the compound LixMn1.125Cr0.5Mg0.375O4 for increasing Li concentration. Li, Mn, Cr, Mg and O atoms are given in dark blue, violet, cyan, light blue and red, respectively.
Computation 06 00063 g004
Figure 5. EBSD/SEM images of the surface and cross-section of the tensile-samples. (ac) Sample type A, (d) sample type A annealed at 1073 K for 5 h, (eg) sample type B and (h) colour code of the inverse pole figure corresponding to the grain orientations. Reprinted from A. Wimmer, M. Smolka, W. Heinz, T. Detzel, W. Robl, C. Motz, V. Eyert, E. Wimmer, F. Jahnel, R. Treichler and G. Dehm, “Temperature dependent transition of intragranular plastic to intergranular brittle failure in electrodeposited Cu micro-tensile samples,” Mater. Sci. Eng. A 618, 398 (2014), with permission from Elsevier.
Computation 06 00063 g005
Figure 6. Stress–strain curves of sample types A and B at 293 K, 473 K and 673 K. Note that at 473 K the yield strength, ultimate tensile strength and elongation to fracture are drastically smaller for the (a) fine-grained sample type A compared to (b) samples of type B with their bamboo-like microstructure. The ultimate tensile strength shows a significant decrease with increasing temperature. Both sample types A and B show a significantly smaller slope during loading at 673 K (apparent Young’s modulus) caused by plastic deformation (settlement) of the sample head. Reprinted from A. Wimmer, M. Smolka, W. Heinz, T. Detzel, W. Robl, C. Motz, V. Eyert, E. Wimmer, F. Jahnel, R. Treichler and G. Dehm, “Temperature dependent transition of intragranular plastic to intergranular brittle failure in electrodeposited Cu micro-tensile samples,” Mater. Sci. Eng. A 618, 398 (2014), with permission from Elsevier.
Computation 06 00063 g006
Figure 7. Model of a Σ5(001) twist grain boundary. The adjacent crystal lattices are indicated in green and black. Note that prior to the rotation (twist) the black lattice points have been found above the centres of the squares formed by the green lattice points. For the rotation shown in the figure some of the black lattice points again coincide with the centres of the squares of the green lattice and the square spanned by these points as indicated in purple comprises five points of the green lattice. Within the coincident site lattice theory [30] a maximum number of coincidences of the original and rotated lattice points lets expect a minimal grain-boundary energy.
Computation 06 00063 g007
Figure 8. Model of a Cu microstructure with a Cl atom at the centre of the grain (left) and at the grain boundary (right).
Computation 06 00063 g008
Figure 9. Boron-carbon phase diagram [31,32].
Computation 06 00063 g009
Figure 10. Structure of B13C2 as proposed by Larson [33] (left) and structure of B4C as proposed by Lazzari et al. [35] (right). Boron and carbon atoms are shown in yellow and black, respectively.
Computation 06 00063 g010
Figure 11. Schematic description of the cluster expansion method.
Computation 06 00063 g011
Figure 12. Schematic description of the cluster expansion ground-state search.
Computation 06 00063 g012
Figure 13. Enthalpy of formation ( Δ H f ) as a function of the boron concentration x B of a binary cluster expansion of boron carbide. The solid black line indicates the convex hull with the pure phases based on the boron carbide crystal structure fully occupied by carbon and boron atoms, respectively. The solid red line shows the correct ground-state line connecting the graphite and α-boron. The green squares show the DFT enthalpies of formation of the structures in the training-set, green crosses the CE predicted enthalpies of formation of the training set structures and the grey crosses the CE predicted enthalpies of formation of all the other structures considered by the cluster expansion. Note that the true ground state line results throughout from DFT calculations. The green cross found below the ground state line at xB = 0.8667 corresponds to the green square found slightly above on the ground state line; the difference between both enthalpies may be taken as a measure of the accuracy of the CE predictions.
Computation 06 00063 g013
Figure 14. Phonon dispersion of B4C computed using the direct method (finite displacement method) as implemented in MedeA-Phonon. The high-frequency mode at 48 THz corresponds to the bond-stretching vibrational mode of the B atoms in the C-B-C linear rods as indicated by the arrow shown in the inset.
Computation 06 00063 g014
Figure 15. Computed descriptor related to magnesium binding energies (eV) for a range of experimentally known magnesium compounds. This screening survey highlights different classes of materials containing magnesium, thus providing a quantitative comparison of the chemical bonding between host structure and the magnesium within each system.
Computation 06 00063 g015
Figure 16. High-temperature rutile structure (left) and low-temperature M1 structure (right) of VO2. Vanadium and oxygen atoms are given in cyan and red, respectively.
Computation 06 00063 g016
Figure 17. Partial DOS of rutile VO2 (left) and M1 VO2 (right) as calculated using the GGA (top) and the HSE (bottom) functional.
Computation 06 00063 g017
Table 1. Calculated energy release during segregation ΔEseg of Cl and S in Cu.
ΔEseg [kJ/mol]
ClS
GB segregation, Σ5 (001)−69.9−54.3
Surface segregation, (001)−321.5−145.3
GB segregation, Σ7 (111)−53.5−56.3
Surface segregation, (111)−272.0−129.9
Table 2. Calculated work of separation Esep of Σ5 and Σ7 grain boundaries of pure Cu and Cu contaminated with Cl and S with planar impurity concentration cimp in atoms per nm2.
cimp [1/nm2]Esep [J/m2]
Pure CuClS
Σ5 (001)0.771.080.821.01
Σ7 (111)0.621.130.891.04
Table 3. Computed bulk and Young’s moduli of boron carbides with boron concentrations between xB = 0.8 and xB = 0.9.
B4CB5CB13C2B9C
Bulk modulus [GPa}270.16261.43253.31239.35
Young’s modulus [GPa]487.94436.45405.86383.36

