EMG Feature Selection and Classification Using a Pbest-Guide Binary Particle Swarm Optimization


1
Fakulti Kejuruteraan Elektrik, Universiti Teknikal Malaysia Melaka, Hang Tuah Jaya, Durian Tunggal, Melaka 76100, Malaysia
2
Fakulti Kejuruteraan Elektronik dan Kejuruteraan Komputer, Universiti Teknikal Malaysia Melaka, Hang Tuah Jaya, Durian Tunggal, Melaka 76100, Malaysia
*
Authors to whom correspondence should be addressed.
Computation 2019, 7(1), 12; https://0-doi-org.brum.beds.ac.uk/10.3390/computation7010012
Submission received: 24 January 2019
/
Revised: 15 February 2019
/
Accepted: 15 February 2019
/
Published: 22 February 2019
(This article belongs to the Section Computational Engineering)
Abstract
:Due to the increment in hand motion types, electromyography (EMG) features are increasingly required for accurate EMG signals classification. However, increasing in the number of EMG features not only degrades classification performance, but also increases the complexity of the classifier. Feature selection is an effective process for eliminating redundant and irrelevant features. In this paper, we propose a new personal best (Pbest) guide binary particle swarm optimization (PBPSO) to solve the feature selection problem for EMG signal classification. First, the discrete wavelet transform (DWT) decomposes the signal into multiresolution coefficients. The features are then extracted from each coefficient to form the feature vector. After which pbest-guide binary particle swarm optimization (PBPSO) is used to evaluate the most informative features from the original feature set. In order to measure the effectiveness of PBPSO, binary particle swarm optimization (BPSO), genetic algorithm (GA), modified binary tree growth algorithm (MBTGA), and binary differential evolution (BDE) were used for performance comparison. Our experimental results show the superiority of PBPSO over other methods, especially in feature reduction; where it can reduce more than 90% of features while keeping a very high classification accuracy. Hence, PBPSO is more appropriate for application in clinical and rehabilitation applications.
1. Introduction
Recently, electromyography (EMG) has received attention from biomedical researchers due to its potential in EMG pattern recognition. Surface EMG is a non-invasive method that records the bioelectric signal generated by muscle activation. Current technologies have allowed the use of EMG pattern recognition to a broad range of applications such as man–machine interface, robot assisted rehabilitation device, and myoelectric prosthetic [1]. However, EMG signals are non-linear and non-stationary due to their complex nature. In addition, EMG signals are easily interrupted by noise and motion artifact [2]. Due to an increment in motion types, training and control strategies are becoming difficult and complex [3]. Therefore, several processes are required for accurate EMG signals classification.
The EMG pattern recognition consists of four parts; signal processing, feature extraction, feature selection, and classification. Signal processing aims to obtain more signal information by applying signal filtering and transformation. Feature extraction highlights meaningful structures, which are hidden in the data stream. Feature selection attempts to select the best combination of relevant features for dimensionality reduction. Finally, classifier, which maps the selected features to target class, for the recognition of hand motion types [4]. In this paper, we focus on the third part, which is feature selection.
Previous studies have indicated that researchers obtained high accuracy in the classification of hand motions without feature selection [5,6,7]. However, their studies only involved healthy subjects, which differ from trans-radial amputees. It is very challenging for the amputee subjects to achieve promising classification results since they perform hand motions based on their imagination. As a result, increasing numbers of features are required to achieve satisfactory classification performance. Nevertheless, the increment in EMG features not only introduces the redundancy to the feature vector, but also increases the complexity [8]. Therefore, feature selection is an effective step to remove redundant and irrelevant features, as well as improving the classification performance.
Feature selection can be categorized into filter and wrapper methods. Filter method applies the information theory, distance measurement, and redundancy for feature selection. Examples of filter methods include t-test, minimal redundancy maximum relevance criterion (mRMR), and the Fisher–Markov selector [9,10,11]. Where as the wrapper method employs the metaheuristic optimization algorithm to evaluate the optimal feature subset. In this method, a classifier is used as the learning algorithm for fitness evaluation. Examples of the wrapper method include binary particle swarm optimization (BPSO), ant colony optimization (ACO), modified binary tree growth algorithm (MBTGA), and genetic algorithm (GA) [12,13,14,15]. Compared to the wrapper method, the filter counterpart is faster and simpler. However, the former usually has better performance, which becomes of interest to researchers during feature selection.
BPSO is a binary version of particle swarm optimization (PSO), which has been widely used in feature selection studies. BPSO has fast convergence behavior, is flexible, and efficient [16,17], it however suffers from premature convergence. This is due to the fact that all particles are learned from the personal best (pbest) and global best (gbest) solutions, which may easily fall into the local optimum. To resolve the issue above, several variants of BPSO have been proposed. In a past study, Chuang et al. [12] introduced an improved BPSO (IBPSO) for gene selection. The authors reset the gbest as if it was not improved for three iterations. This strategy prevented the gbest from being trapped in the local optimum. Three years later, Chuang et al. [18] proposed a chaotic BPSO (CBPSO) for feature selection. The authors applied the chaotic map to alter inertia weight, which increased local and global search capabilities. Zhang et al. [19] implemented the mutation operator in BPSO (MBPSO) for performance enhancement. MBPSO was able to explore untried areas of the search space, thus leading to high exploration. Zhang et al. [20] further introduced a novel BPSO with mutation and time-varying acceleration strategies for automatic resonance brain classification. Furthermore, Bharti and Singh [17] employed the opposition based learning strategy (OBL) and chaotic theory to improve the performance of BPSO in feature selection. The authors proposed a fitness-based dynamic inertia weight to facilitate the exploration.
We recently proposed two new feature selection methods; the binary tree growth algorithm (BTGA) and modified binary tree growth algorithm (MBTGA), to solve the feature selection problem in EMG signals classification [15]. BTGA was the binary version of the tree growth algorithm (TGA), which allowed the algorithm to perform a search on the binary search space. On one hand, MBTGA was an improved version of BTGA that implemented the swap, crossover, and mutation operators in the search process. In the study, we showed that the proper feature selection can significantly improve the classification performance in EMG signals classification. However, only EMG data of healthy subjects were involved in the study. Therefore, in the current study we focus on the analysis of amputee subjects. Furthermore, the MBTGA performance was still far from perfect, which encouraged us to propose another new feature selection method for EMG signals classification. According to the No Free Lunch (NFL) Theorem, there is no universal optimization algorithm that can solve all engineering problems [21]. Therefore, an increasing number of new feature selection methods are need for efficient classification.
In this paper, a new Pbest-guide binary particle swarm optimization (PBPSO) is proposed to tackle the feature selection problem in EMG signals classification. As mentioned in the previous paragraph, BPSO has the limitation of premature convergence. Therefore, we introduced a new pbest-guide strategy to enhance the performance of BPSO during feature selection. Unlike other BPSO variants, PBPSO aims to improve the personal best solution pbest, which allows the pbest to explore and look for better resolution. Thus, the particle can learn from high quality pbest in velocity and position updates. In other words, PBPSO has a very good diversity and it the ability to escape from the local optimum. Moreover, a dynamic crossover rate was used to balance exploration and exploitation in the evaluation process. The proposed method was tested using EMG data from 11 amputee subjects collected from the NinaPro database 3. To evaluate the effectiveness of the proposed method, BPSO, GA, MBTGA, and binary differential evolution (BDE) were used for performance comparison. The experimental results indicated that PBPSO was very good in feature selection, especially for dimensionality reduction.
The remainder of this paper is organized as follows: Section 2 describes the methods used during signal processing, feature extraction, and feature selection. The proposed PBPSO algorithm is also presented. Section 3 reports the experimental setting and results. Section 4 discusses the experimental results. Section 5 concludes the paper and suggests possible future work.
2. Materials and Methods
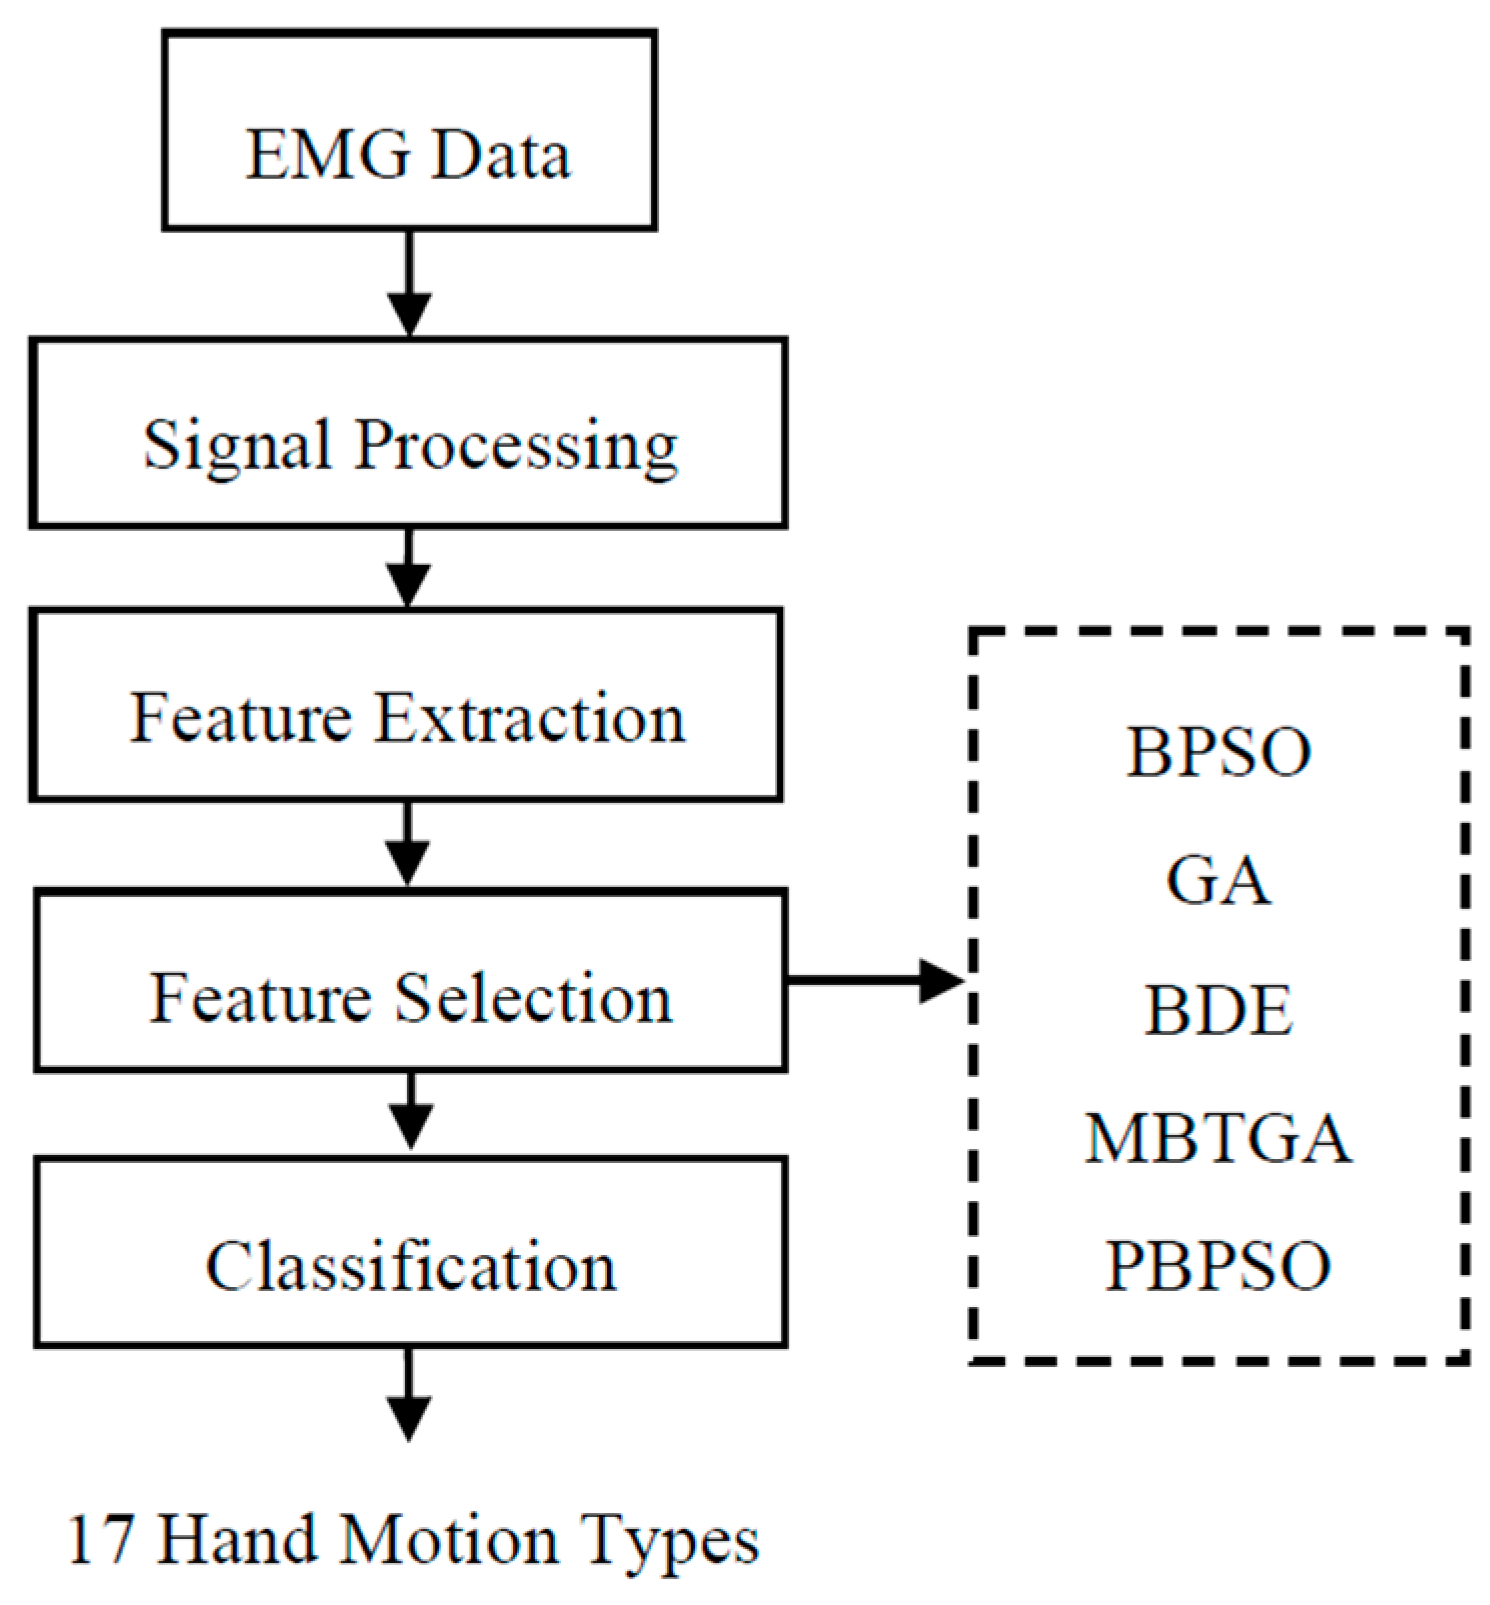
Figure 1 demonstrates the flow chart for the proposed EMG pattern recognition system. In the initial step, DWT decomposes the EMG signal into multiresolution coefficients. Five popular features are then extracted from each DWT coefficient. Next, five feature selection methods including BPSO, BDE, GA, MBTGA, and PBPSO are utilized to evaluate the optimal feature subset. Finally, k-nearest neighbor (KNN) is employed to classify the selected features for the recognition of 17 hand motion types.
2.1. EMG Data
For EMG data acquisition, surface EMG signals are collected from the public access Non-Invasive Adaptive Prosthetics (NinaPro) project (https://www.idiap.ch/project/ninapro). In this work, EMG signals of 17 hand motions (Exercise B) recorded from Database 3 (DB3) were used [22]. DB3 consisted of EMG data acquired from 11 amputee subjects. In the experiment, 12 surface EMG electrodes were implemented, and EMG signals were sampled at 2 k Hz. The subject was asked to perform each hand motion for 5 s, followed by a resting phase of 3 s. Each hand motion was repeated six times. It is worth noting that all the resting phases were removed.
2.2. DWT Based Feature Extraction
In EMG signal processing, Discrete Wavelet Transform (DWT) is the most frequently used. Like other time–frequency methods, DWT produces the signal in time–frequency representation, which provides time and frequency information simultaneously. In DWT decomposition, signal is decomposed into multiresolution coefficients using low and high pass filters. DWT coefficients consist of different frequency bands. Coefficients with higher frequency are called detail (D), which are better resolved in time. On the contrary, coefficients at lower frequency are named as approximation (A), which achieve better frequency resolution [23]. Mathematically, the first decomposition of DWT can be written as:
where Zlow and Zhigh are the approximation and detail coefficients, respectively; x[k] is the input EMG signal; L is the length of signal; and h[.] and g[.] are the high pass and low pass filters, respectively. According to the literature, DWT at the fourth decomposition level can provide promising results regarding EMG pattern recognition [2]. Hence, DWT at the fourth decomposition level was employed in this work.
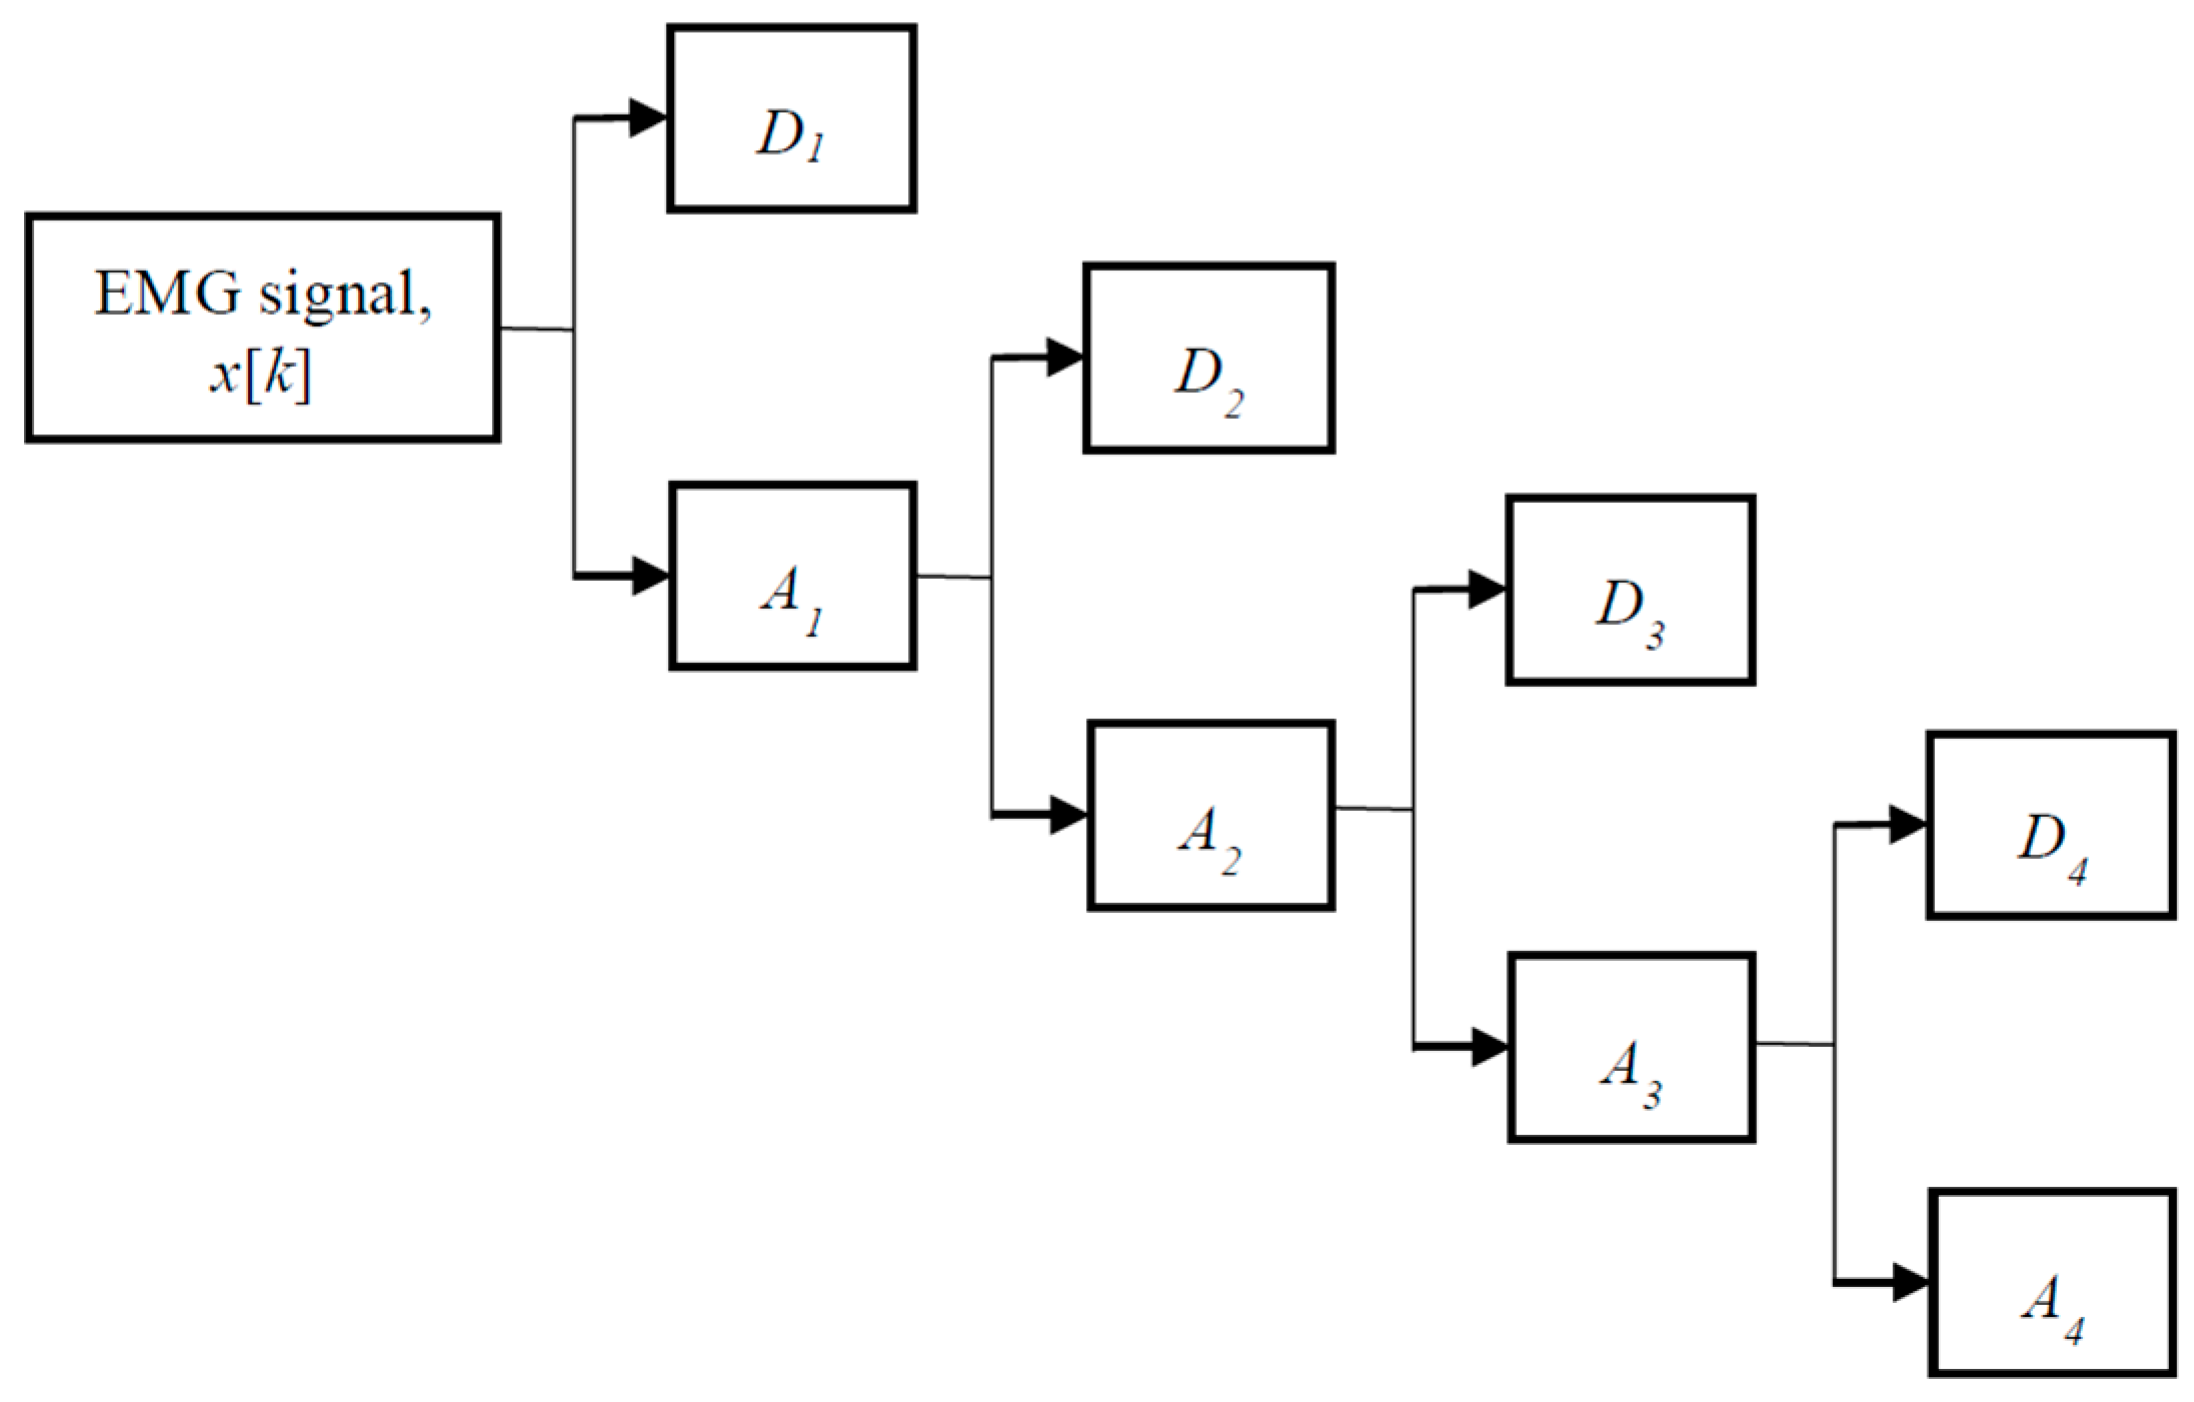
Figure 2 illustrates the procedure of wavelet decomposition at the fourth decomposition level. Initially, the EMG signal is decomposed into A1 and D1. At the second decomposition level, A1 is further decomposed into A2 and D2. In the process of decomposition, DWT halves the number of samples and doubles the frequency resolution [24]. The decomposition process is continued until the desired level is reached. For every decomposition level, the signal is sub-sampled by a factor of two. One of the major drawbacks of DWT is the mother wavelet selection. To achieve the optimal performance, eight commonly used mother wavelets including Bior2.2, Bior4.4, Coif4, Coif5, Db4, Db6, Sym4, and Sym6 were investigated. The experimental data showed that the best classification performance was achieved by Db6. For this reason, DWT with Db6 was applied in the rest of this work.
To obtain valuable information from the wavelet coefficients, five popular features including mean absolute value, wavelength, root mean square, maximum fractal length, and average power were extracted. Note that the features were extracted from each detail and approximation since we did not know the best sub-band (frequency band) in DWT.
2.2.1. Mean Absolute Value
Mean absolute value (MAV) is one of the popular EMG features that have been widely applied in EMG pattern recognition. MAV is defined as the average of absolute signal value, and it can be expressed as [25]:
where Zn is the wavelet coefficient and L is the total length of coefficient.
2.2.2. Wavelength
Wavelength (WL) is a frequently used EMG feature, which represents the cumulative length of waveform over time. WL can be formulated as [26]:
where Zn is the wavelet coefficient and L is the total length of coefficient.
2.2.3. Root Mean Square
Root mean square (RMS) is a feature that describes the muscle force and non-fatigue contraction [27]. RMS can be represented as:
where Zn is the wavelet coefficient and L is the total length of coefficient.
2.2.4. Maximum Fractal Length
Maximum fractal length (MFL) is a recent EMG feature used to measure the activation of low-level muscle contraction [28]. Mathematically, MFL can be defined as:
where Zn is the wavelet coefficient and L is the length of coefficient.
2.2.5. Average Power
Average Power (AP) of wavelet coefficient is one of the statistical features for measuring energy distribution, and it can be calculated as [24]:
where Zn is the wavelet coefficient and L is the total length of coefficient.
2.3. Binary Particle Swarm Optimization
Binary particle swarm optimization (BPSO) is a swarm intelligent method developed by Kennedy and Eberhart in 1997 [29]. In BPSO, particles (solutions) are moving in the binary variables by flipping the number of bits (either 1 or 0). The new particle position is greatly influenced by the velocity. At each iteration, the velocity of each particle is updated as shown in Equation (8).
where v is the velocity; w is the inertia weight; c1 and c2 are cognitive and social learning vectors, respectively; r1 and r2 are two independent random vectors in [0,1]; X is the solution; pbest is the personal best solution; gbest is the global best solution for the entire population; i is the order; d is the dimension of search space; and t is the number of iteration. If the velocity of a particle exceeds the maximum velocity Vmax, then the velocity is limited to Vmax. In our case, the Vmax and Vmin are set at 6 and -6, respectively [12]. For BPSO, the velocity is converted into the probability value using the sigmoid function as shown in Equation (9).
The new position of a particle is updated based on the probability value as follow:
where r3 is a random number distributed between 0 and 1. According to the literature, a dynamic inertia weight that balances the exploration and exploitation leads to better performance [30]. In this study, the inertia weight linearly decreased from 0.9 to 0.4 as shown in Equation (11).
where wmax and wmin are the bounds on inertia weight, t is the number of iteration, and Tmax is the maximum number of iteration. The wmax and wmin were fixed at 0.9 and 0.4, respectively. Initially, a larger number of inertia weight ensures high exploration. At the final iteration, a smaller inertia weight promotes exploitation.
Algorithm 1 demonstrates the pseudocode of BPSO. In the first step, the initial population of particles was randomly initialized. Then, the fitness of each particle was evaluated and the pbest and gbest were set. In every iteration, the inertia weight was computed as shown in Equation (11). For each particle, the velocity, and position were updated using Equations (8), (9), and (10), respectively. Next, the fitness of new particles was evaluated, and the pbest and gbest were updated. The algorithm was repeated until the maximum number of iterations was reached. Finally, the global best solution was selected as the optimal feature subset.
| Algorithm 1. Binary Particle Swarm Optimization | |
| (1) | Begin, initialize the parameters, N, Tmax, c1, c2, vmax, vmin |
| (2) | Initialize a population of particles, X |
| (3) | Evaluate fitness of particles, F(X) |
| (4) | Set pbest and gbest |
| (5) | fort = 1 to maximum number of iteration, Tmax |
| (6) | Compute the inertia weight w as in Equation (11) |
| (7) | for i = 1 to number of particles, N |
| (8) | for d = 1 to number of dimension, D |
| (9) | Update the velocity of particle, using Equation (8) |
| (10) | Convert the velocity into probability value as in Equation (9) |
| (11) | Update the position of particle, using Equation (10) |
| (12) | next d |
| (13) | Evaluate fitness of new particle, |
| (14) | next i |
| (15) | Update the pbest and gbest |
| (16) | next t |
2.4. Genetic Algorithm
Genetic algorithm (GA) is an evolutionary algorithm that has been widely used to solve optimization problems. GA is inspired from the genetic sciences and it is also known as a biology system [13]. In a biology theorem, strong ones have higher opportunity to pass their genes to their children in future generation [31]. Recently, GA received a lot of attentions in the field of feature selection since it does not make use of any formula in the computation. In GA, a solution namely chromosome, which is made up of binary numbers of genes. For example, X = {0,1,0,1,1,0,0,0,0,0}, where a chromosome X consists of ten genes in binary form. As shown in the chromosome, bit 1 means the feature is selected; where as, bit 0 represents the unselected feature. In feature selection, the number of genes is the same as D, where D is the number of features. The operation of GA is described as follow:
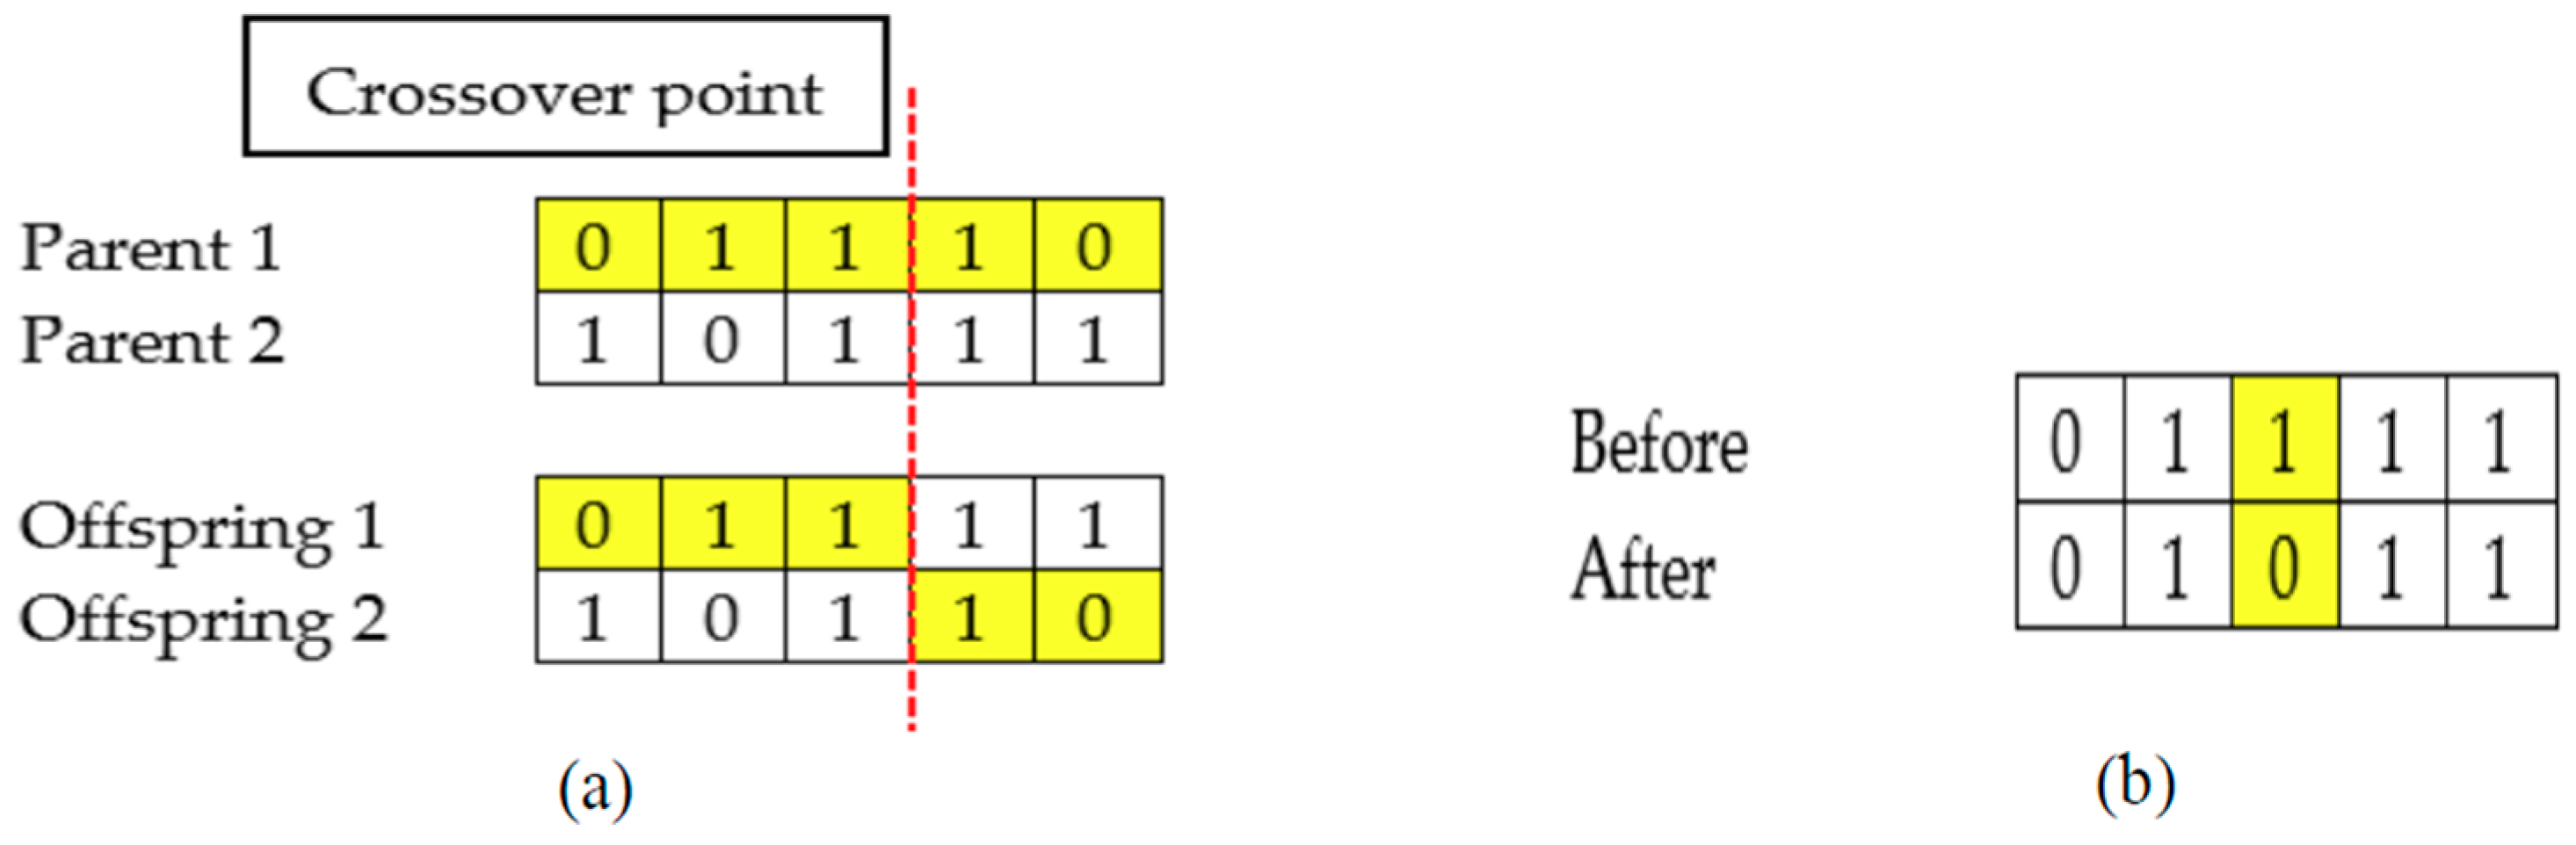
First, an initial population with a collection of chromosomes is randomly generated. After that, the fitness of each chromosome is evaluated. Generally, GA consists of three main operators; parent selection, crossover, and mutation. For parent selection, the roulette wheel selection method is employed. Roulette wheel selection chooses two parents based on the probability calculated from the fitness value. In other words, a chromosome with better fitness value has a higher probability to be chosen as a parent. Next, the crossover is performed between two selected parents. An example of crossover is shown in Figure 3a. Applying crossover allows the two newly generated children (offspring) to inherit genes from both parents.
Furthermore, a mutation operator mutates the gene of the children based on the mutation rate, MR. The mutation rate indicates the probability of a gene (feature) to flip from bit 1 to 0 or bit 0 to 1. An example of mutation was shown in Figure 3b. In the next step, the fitness of a newly generated population is evaluated. Then, the newly generated population is added into the current population. The merged population is sorted according to the fitness value. The best N chromosomes are then selected for the next generation while the rest are eliminated. The algorithm is repeated until the maximum number of iterations is reached. Ultimately, the global best chromosome is selected as the optimal feature subset. The pseudocode of GA is demonstrated in Algorithm 2.
| Algorithm 2. Genetic Algorithm | |
| (1) | Begin, initialize the parameters, N, Tmax, CR, MR |
| (2) | Initialize a population of chromosomes, X |
| (3) | Evaluate fitness of chromosomes, F(X) |
| (4) | Set Z as the best chromosome |
| (5) | fort = 1 to maximum number of generation, Tmax |
| (6) | for i = 1 to number of crossovers |
| (7) | Select 2 parents using roulette wheel selection |
| (8) | Generate 2 children by applying crossover between 2 parents |
| (9) | next i |
| (10) | for j = 1 to twice number of crossover |
| (11) | Mutate the child based on the mutation rate, MR |
| (12) | next j |
| (13) | Evaluate the fitness of newly generated children |
| (14) | Add newly generated children into current population |
| (15) | Rank the population and select the best N chromosomes |
| (16) | Update Z if there is better chromosome in the population |
| (17) | next t |
2.5. Binary Differential Evolution
Differential evolution (DE) was developed by Storn and Price to solve numerical optimization problems [32]. Consequently, DE was designed to solve the continuous optimization problem, but not to feature selection. Hence, a binary version of DE is required to tackle the feature selection problem. Recently, a binary differential evolution (BDE) was proposed to solve the feature selection problem [33]. Similar to DE, BDE is comprised of mutation, crossover, and selection operators. In the mutation process, three vectors Xk1, Xk2, and Xk3 are randomly selected from the population for each vector Xi. It is worth noting that k1 ≠ k2 ≠ k3 ≠ i. To obtain the difference between the selected vectors, the difference vector is computed as follow:
The mutant vector is then calculated as shown in Equation (13).
where i is the vector order, and d is the dimension of search space. For crossover operation, the trial vector U is generated as follow:
where X is the vector, drand is a random selected number in the range [1,D], i is the order, d is the dimension of search space, and CR is a constant crossover rate in [0,1]. In the selection process, if the fitness value of a trial vector is better than the current vector, then the current vector will be replaced. Otherwise, the current vector is kept for the next generation.
Algorithm 3 illustrates the pseudocode of BDE. First, the population of vectors was randomly initialized. Second, the fitness of each vector was evaluated. For each vector, the mutation and crossover operations were computed using Equations (13) and (14), respectively. As a result, a new trial vector is generated. Next, a greedy selection is applied between the trial and current vectors, and the fittest is kept for the next generation. The algorithm is repeated until the maximum number of iteration is reached. Finally, the global best vector is selected as the best feature subset.
| Algorithm 3. Binary Differential Evolution | |
| (1) | Begin, initialize the parameters, N, Tmax, CR |
| (2) | Initialize a population of vectors, X |
| (3) | Evaluate fitness of vectors, F(X) |
| (4) | Set Z as the best vector |
| (5) | fort = 1 to maximum number of generation, Tmax |
| (6) | for i = 1 to number of vectors, N |
| (7) | Randomly choose, k1, k2 and k3 from N, note that k1 ≠ k2 ≠ k3 ≠ i |
| (8) | Randomly select an index drand between [1, D] |
| (9) | for d = 1 to number of dimension, D |
| (10) | Compute mutant vector using the Equations (12) and (13), respectively |
| (11) | Generate trial vector by applying the crossover as in Equation (14) |
| (12) | next d |
| (13) | Evaluate fitness of trial vector, F(Ui) |
| (14) | Perform greedy selection between vector and trial vector |
| (15) | next i |
| (16) | Update Z if there is better vector in the population |
| (17) | next t |
2.6. Pbest Guide Binary Particle Swarm Optimization
As a matter of fact, BPSO suffers from premature convergence and is easily getting trapped in the local optimum [34]. Therefore, a new Pbest-guide binary particle swarm optimization (PBPSO) is proposed to enhance the performance of BPSO in this work. Unlike the other BPSO variants, PBPSO introduces a new pbest guide strategy to improve local and global search capabilities. PBPSO aims to enhance the personal best solution pbest for guiding the particle to move toward the global optimum. When pbest is more likely to fall into the local optimal, pbest guide mechanisms will activate and enhance the pbest. With the powerful pbest guide mechanism, PBPSO has the capability of jumping out from the local optimum.
2.6.1. Velocity and Position Update
Like BPSO, the position and velocity updating rules of PBPSO are guided by the pbest and gbest. In PBPSO, the velocity of a particle is updated as shown in Equation (15).
The velocity is then converted into the probability value using a modified sigmoid function as follow:
The new position of a particle is updated as shown in Equation (17).
where r5 is a random vector in [0,1].
2.6.2. Pbest Guide Strategy
In BPSO, if the fitness value of a new particle Xi is better, then the position of pbesti is updated. This updating mechanism can be formulated as:
where t is the number of iteration, F(.) is the fitness function, X and pbest are the solution and personal best solution at i order in the population, respectively. Iteratively, the particle is moving toward pbest and gbest in the position update. This way, the pbest becomes, or nearly is the same as gbest. This, in turn, will lead to premature convergence and low diversity [16,35]. To resolve this issue, a pbest guide strategy is introduced. In PBPSO, a counter Pcount is given for each pbest with the initial value of zero. In every iteration, if the fitness value of pbest does not improve, then the Pcount is increased by one. On the contrary, the Pcount is reset to zero if the pbest has been evolved.
After velocity and position updates, there is a pbest enhancement process. Pbest enhancement aims to improve the position of pbest if the stagnation in pbest is found. Consequently, if the Pcount is more than or equal to 2, then the pbest is more likely to be stuck in the local optimum. To avoid the PBPSO from suffering premature convergence, the mutation, crossover, and selection operators borrowed from the BDE algorithm were used to enhance the pbest if it did not improve continuously for two iterations.
2.6.3. Dynamic Crossover Rate
In PBPSO, the mutation, crossover, and selection operators were implemented. Since the crossover operator was used in PBPSO, there was an additional parameter, crossover rate CR that needed tuning. Instead of using a constant CR, we applied a dynamic crossover rate in PBPSO as shown in Equation (19).
where t is the number of iteration and Tmax is the maximum number of iteration. As seen in Equation (19), CR linearly decreased from 0.9 to 0. Initially, a larger CR allows more dimensions to be copied from the mutant vector. This in turn will improve the exploration behavior. As the time (iteration) passes, a smaller CR tends to promote local search around the best solution, which ensures high exploitation. In other words, PBPSO utilizes the dynamic crossover rate to balance the exploration and exploitation during the pbest enhancement process.
Algorithm 4 displays the pseudocode of PBPSO. Like BPSO, the initial population of PBPSO was randomly initialized (either 1 or 0). Then, the fitness of each particle was evaluated. The current population is known to be pbest and the best particle is set as gbest. In each iteration, the crossover rate was computed as shown in Equation (19). For each particle, the velocity and position were updated using Equations (15), (16), and (17), respectively. The fitness of each new particle was then evaluated. The pbest and gbest were then updated. If the pbest did not improve, then Pcount was increased by one; otherwise, Pcount was reset to zero. Furthermore, there is an additional pbest enhancement process. If stagnation in pbest was found, then the mutation, crossover, and selection operators (from BDE algorithm) were employed to enhance the quality of pbest. The algorithm was repeated until the maximum number of iteration was reached. In the final step, the global best solution was chosen as the optimal feature subset.
| Algorithm 4. Pbest-Guide Binary Particle Swarm Optimization | |
| (1) | Begin, initialize the parameters, N, Tmax, w, c1, c2, vmax, vmin |
| (2) | Initialize a population of particles, X |
| (3) | Evaluate fitness of particles, F(X) |
| (4) | Set pbest and gbest, initialize Pcount with zero |
| (5) | for t = 1 to maximum number of iteration, Tmax |
| (6) | Compute the crossover rate using Equation (19) |
| (7) | for i = 1 to number of particles, N |
| // Velocity and Position Update // | |
| (8) | for d = 1 to number of dimension, D |
| (9) | Update the velocity of particle, using E Equation. (15) |
| (10) | Convert the velocity into probability value as in Equation (16) |
| (11) | Update the position of particle, using Equation (17) |
| (12) | next d |
| (13) | Evaluate fitness of new particle, |
| // Pbest and Gbest Update // | |
| (14) | Update the pbesti and gbest |
| (15) | if pbesti does not improve, then |
| (16) | Increase Pcounti by 1 |
| (17) | else |
| (18) | Reset Pcounti to 0 |
| (19) | end if |
| (20) | next i |
| // Pbest Enhancement Strategy // | |
| (21) | for i = 1 to number of particles, N |
| (22) | if Pcounti is more than or equal to 2, then |
| (23) | Reset Pcounti to 0 |
| (24) | Generate pbestinew using mutation, crossover and selection (from BDE algorithm) |
| (25) | Update gbest |
| (26) | end if |
| (27) | next i |
| (28) | next t |
2.7. Proposed PBPSO for Feature Selection
Feature selection is an important step in the data mining process. Let E be an EMG dataset with I × D matrix, where I is the number of instances and D is number of features. For feature selection, our goal was to achieve m features from the original dataset E, where m < D. In the feature selection problem, the bit 1 represents the selected feature whereas the bit 0 denotes the unselected feature. For example, given a population X as below:
It shows that X has the population size of four with 10 dimensions. For the first solution, it is observed that the 1st, 2nd, and 10th features were selected. On one hand, 4th, 5th, 7th, and 8th features were selected in the second solution.
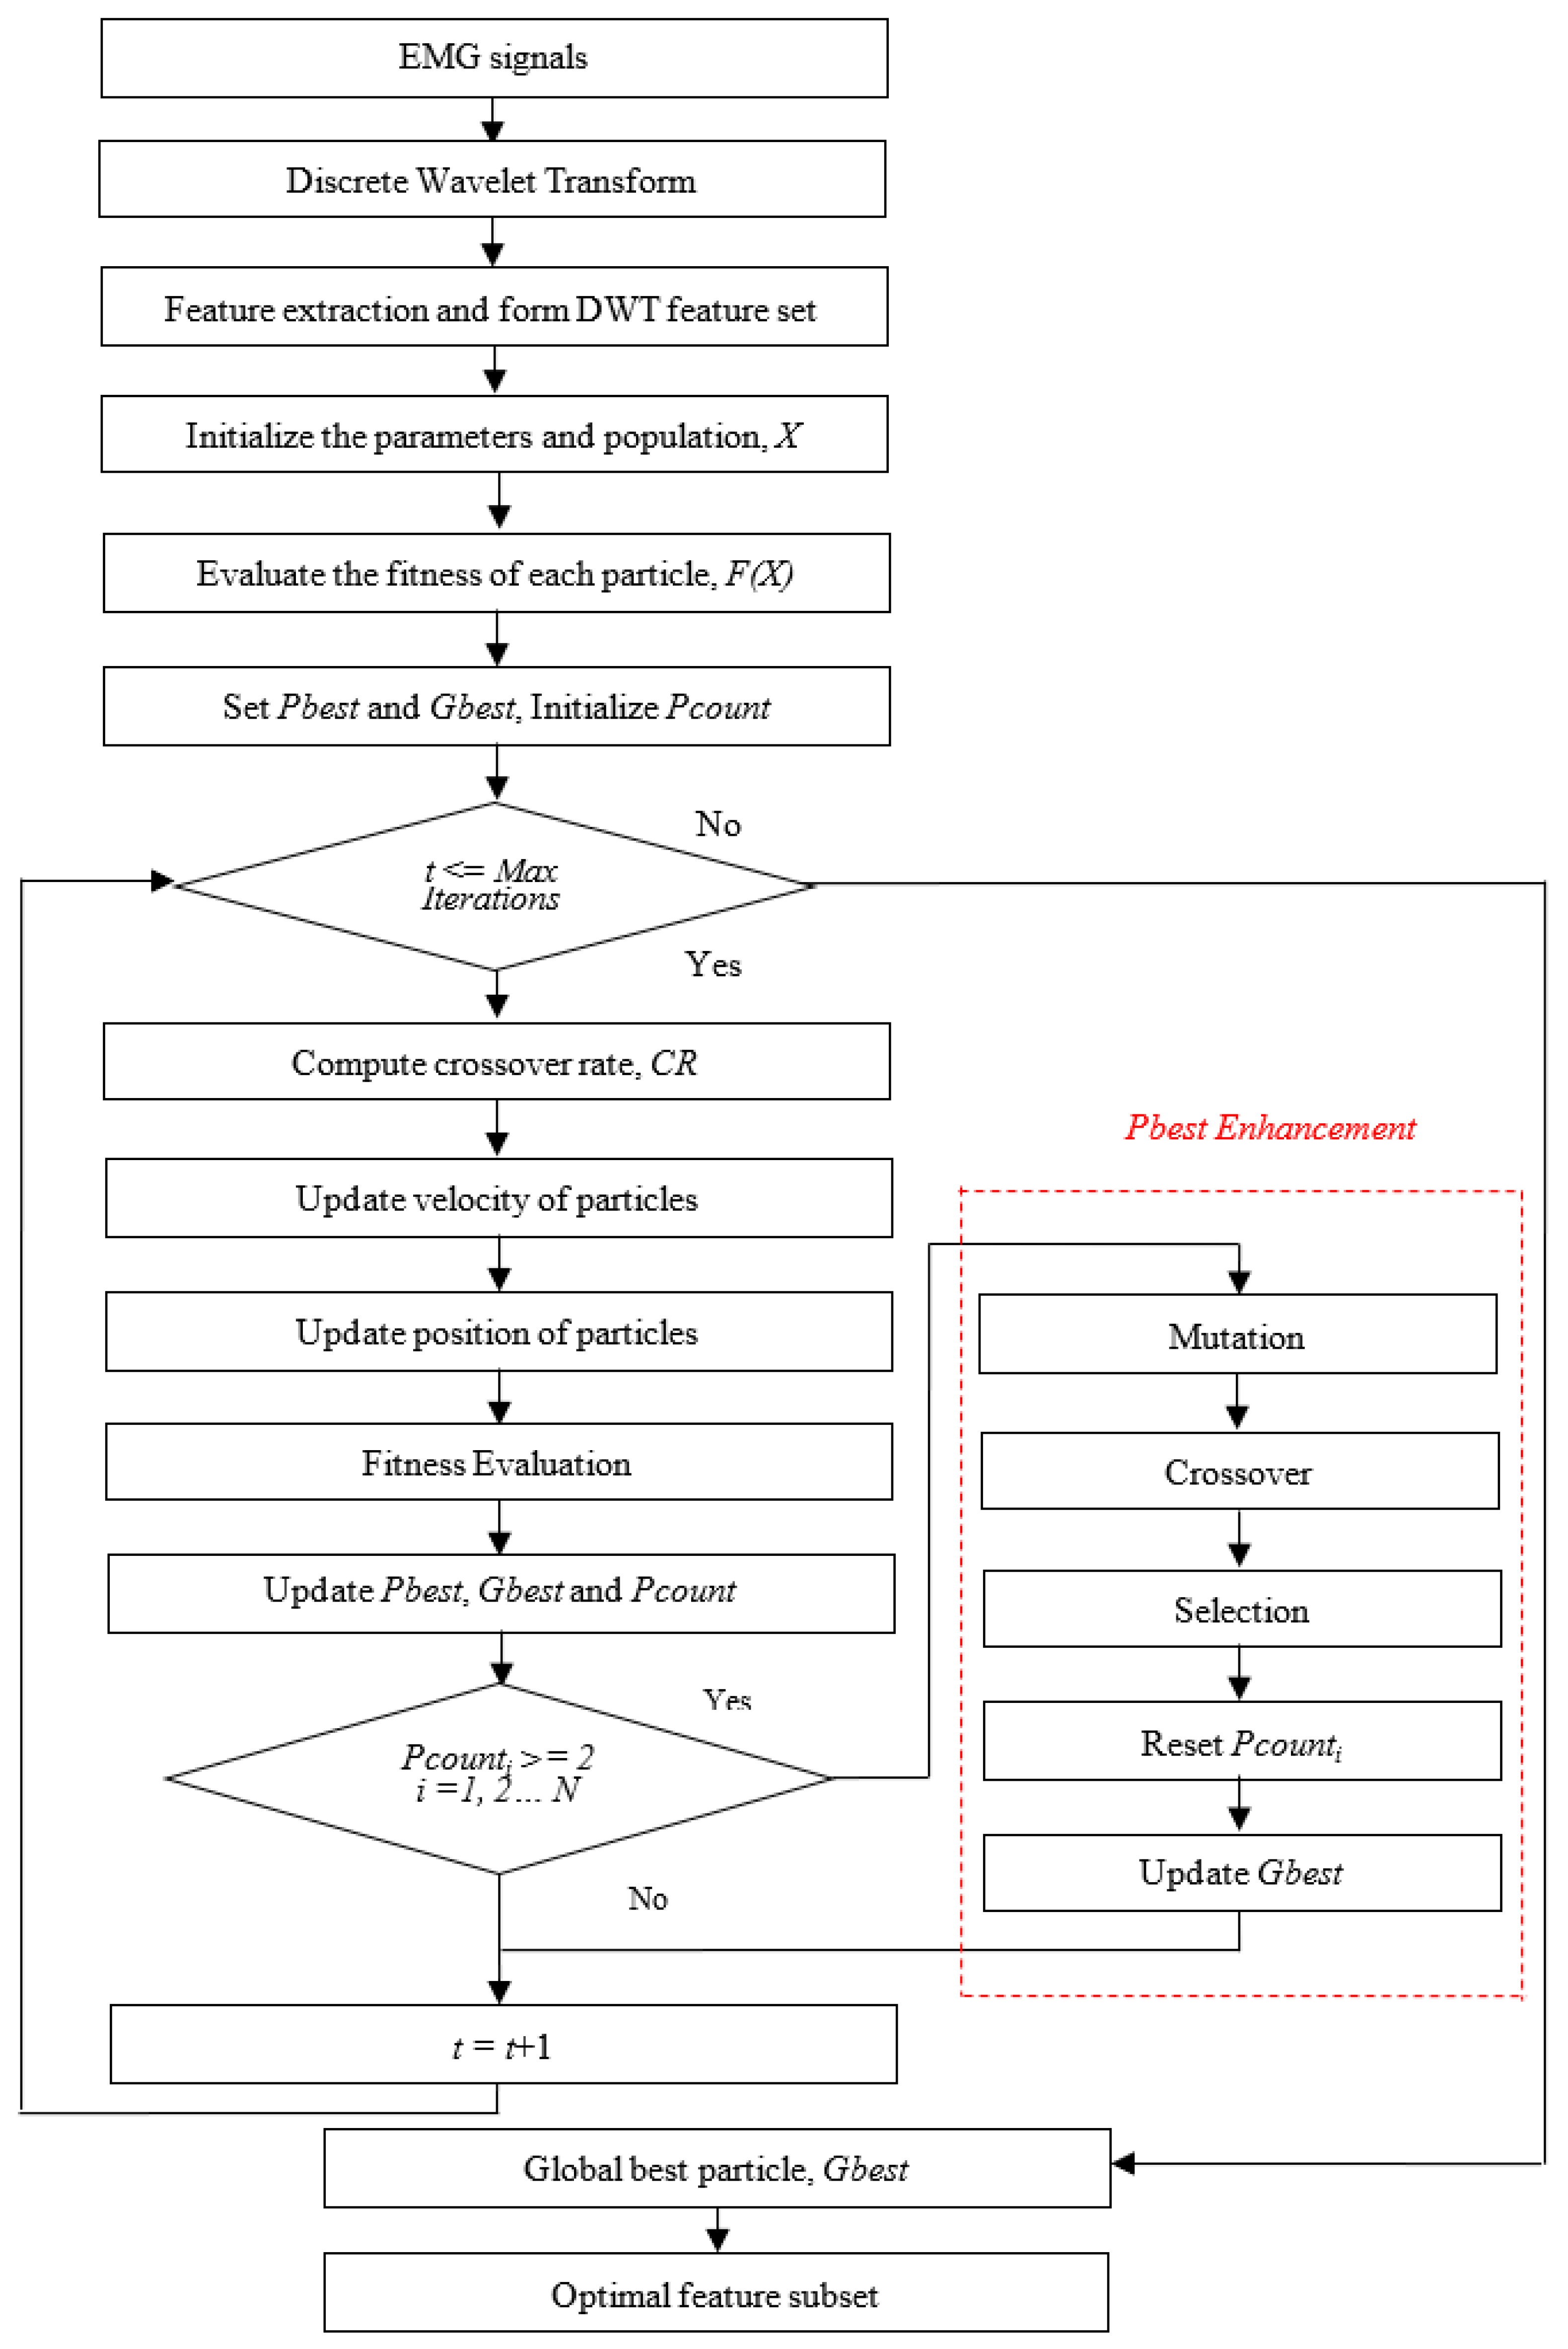
Figure 4 illustrates the flowchart of PBPSO for feature selection. Initially, DWT decomposed the EMG signals into details and approximations. The features were extracted from each detail and approximation to form a feature vector. The DWT feature set was then fed into the proposed PBPSO for feature selection. In PBPSO, the initial solutions were randomized (either 1 or 0). For each iteration, the initial solutions were evolved according to the position and velocity updates. These solutions were guided by pbest and gbest to move toward the global optimum. If the pbest was more likely to fall into the local optimum, the pbest enhancement mechanism would be activated to improve the quality of pbest. In the process of fitness evaluation, k-nearest neighbor (KNN) with Euclidean distance and k = 1 is used as the learning algorithm. KNN is selected because it usually offers promising performance with lower computational cost. Compared to other classifiers, KNN is simpler, faster, and is more easily implemented [36]. In this work, the classification error rate obtained by KNN was used for fitness calculation. It is worth noting that in the process of selection, pbest and gbest update, if the solutions resulted in the same value of fitness, then the solution with the smaller number of features was selected. At the end of iteration, the solution (gbest) that yielded the lowest error rate was chosen as the optimal feature subset.
3. Results
Remarkably, DWT decomposes the EMG signal into wavelet coefficients (four details and four approximations). Five features are then extracted from each detail and approximation. In total, 480 features (5 features × 8 coefficients × 12 channels) are extracted from each movement from each subject. To avoid numerical problems, the features are normalized in the range between 0 and 1. Recently, we have proposed a modified binary tree growth algorithm (MBTGA) for tackling the feature selection task. It is observed that MBTGA can provide satisfactory classification results in EMG signals classification [15]. Hence, it is interesting to know whether MBTGA can achieve promising performance using the amputee dataset. Note that the classification error rate computed by KNN is used as the fitness function for MBTGA, which is similar to BDE, GA, BPSO, and PBPSO in this work.
In this paper, five feature selection methods including BPSO, GA, BDE, MBTGA, and PBPSO were applied to select the most informative feature subset. According to [22], the first, third, fourth, and sixth repetitions were used to train, while the remaining second and fifth repetitions were used for the testing set. For fair comparison, the population size and maximum number of iteration were fixed at 30 and 100, respectively. The parameter setting is explained as follows: for BPSO, the cognitive and social learning factors C1 and C2 were set at 2 [12]. For BDE, the crossover rate CR was fixed at 1 [33]. For GA, the crossover and mutation rates were set at 0.6 and 0.001, respectively [37]. For MBTGA, the number of first group N1, number of second group N2, and number of fourth group N4 were set at 10, 15, and 10, respectively [15]. For PBPSO, the C1 and C2 were set at 2, and the inertia weight w was set at 0.9. Note that each feature selection method was executed for 20 runs with different random seed.
To investigate the performance of the proposed method, five statistical parameters including classification accuracy, feature reduction rate (FR), precision (P), F-measure, and Matthew correlation coefficient (MCC) were measured. These parameters are calculated as follows [38,39,40,41]:
where K is the number of classes, |S| is the number of original features, |R| is the number of selected features, TP, TN, FP and FN are the true positive, true negative, false positive, and false negative, respectively, which can be obtained from the confusion matrix. The average results of 20 different runs were calculated and compared. All the analysis was done using Matlab 9.3.
Experimental Results
Figure 5 illustrates the convergence curve of five different feature selection methods for 11 amputee subjects. In Figure 5, the average fitness is defined as the average of fitness value obtained from 20 different runs. For most subjects, BDE, GA, MBTGA, and BPSO converged faster but without acceleration. This implies that the algorithms are being trapped in the local optimum, thus resulting in poor classification performance. Figure 5 shows that MBTGA did not offer the best performance in this work. However, MBTGA overtook GA, BPSO, and BDE on amputee subjects 1, 2, 6, 8, and 9. On one hand, PBPSO was shown to have very good diversity. Owing to the pbest guide strategy, PBPSO enhanced the quality of pbest if stagnation in pbest was found. This way, PBPSO kept tracking for the global optimum, thus leading to better performance. Overall, it can be inferred that PBPSO is superior to BPSO, BDE, MBTGA, and GA.
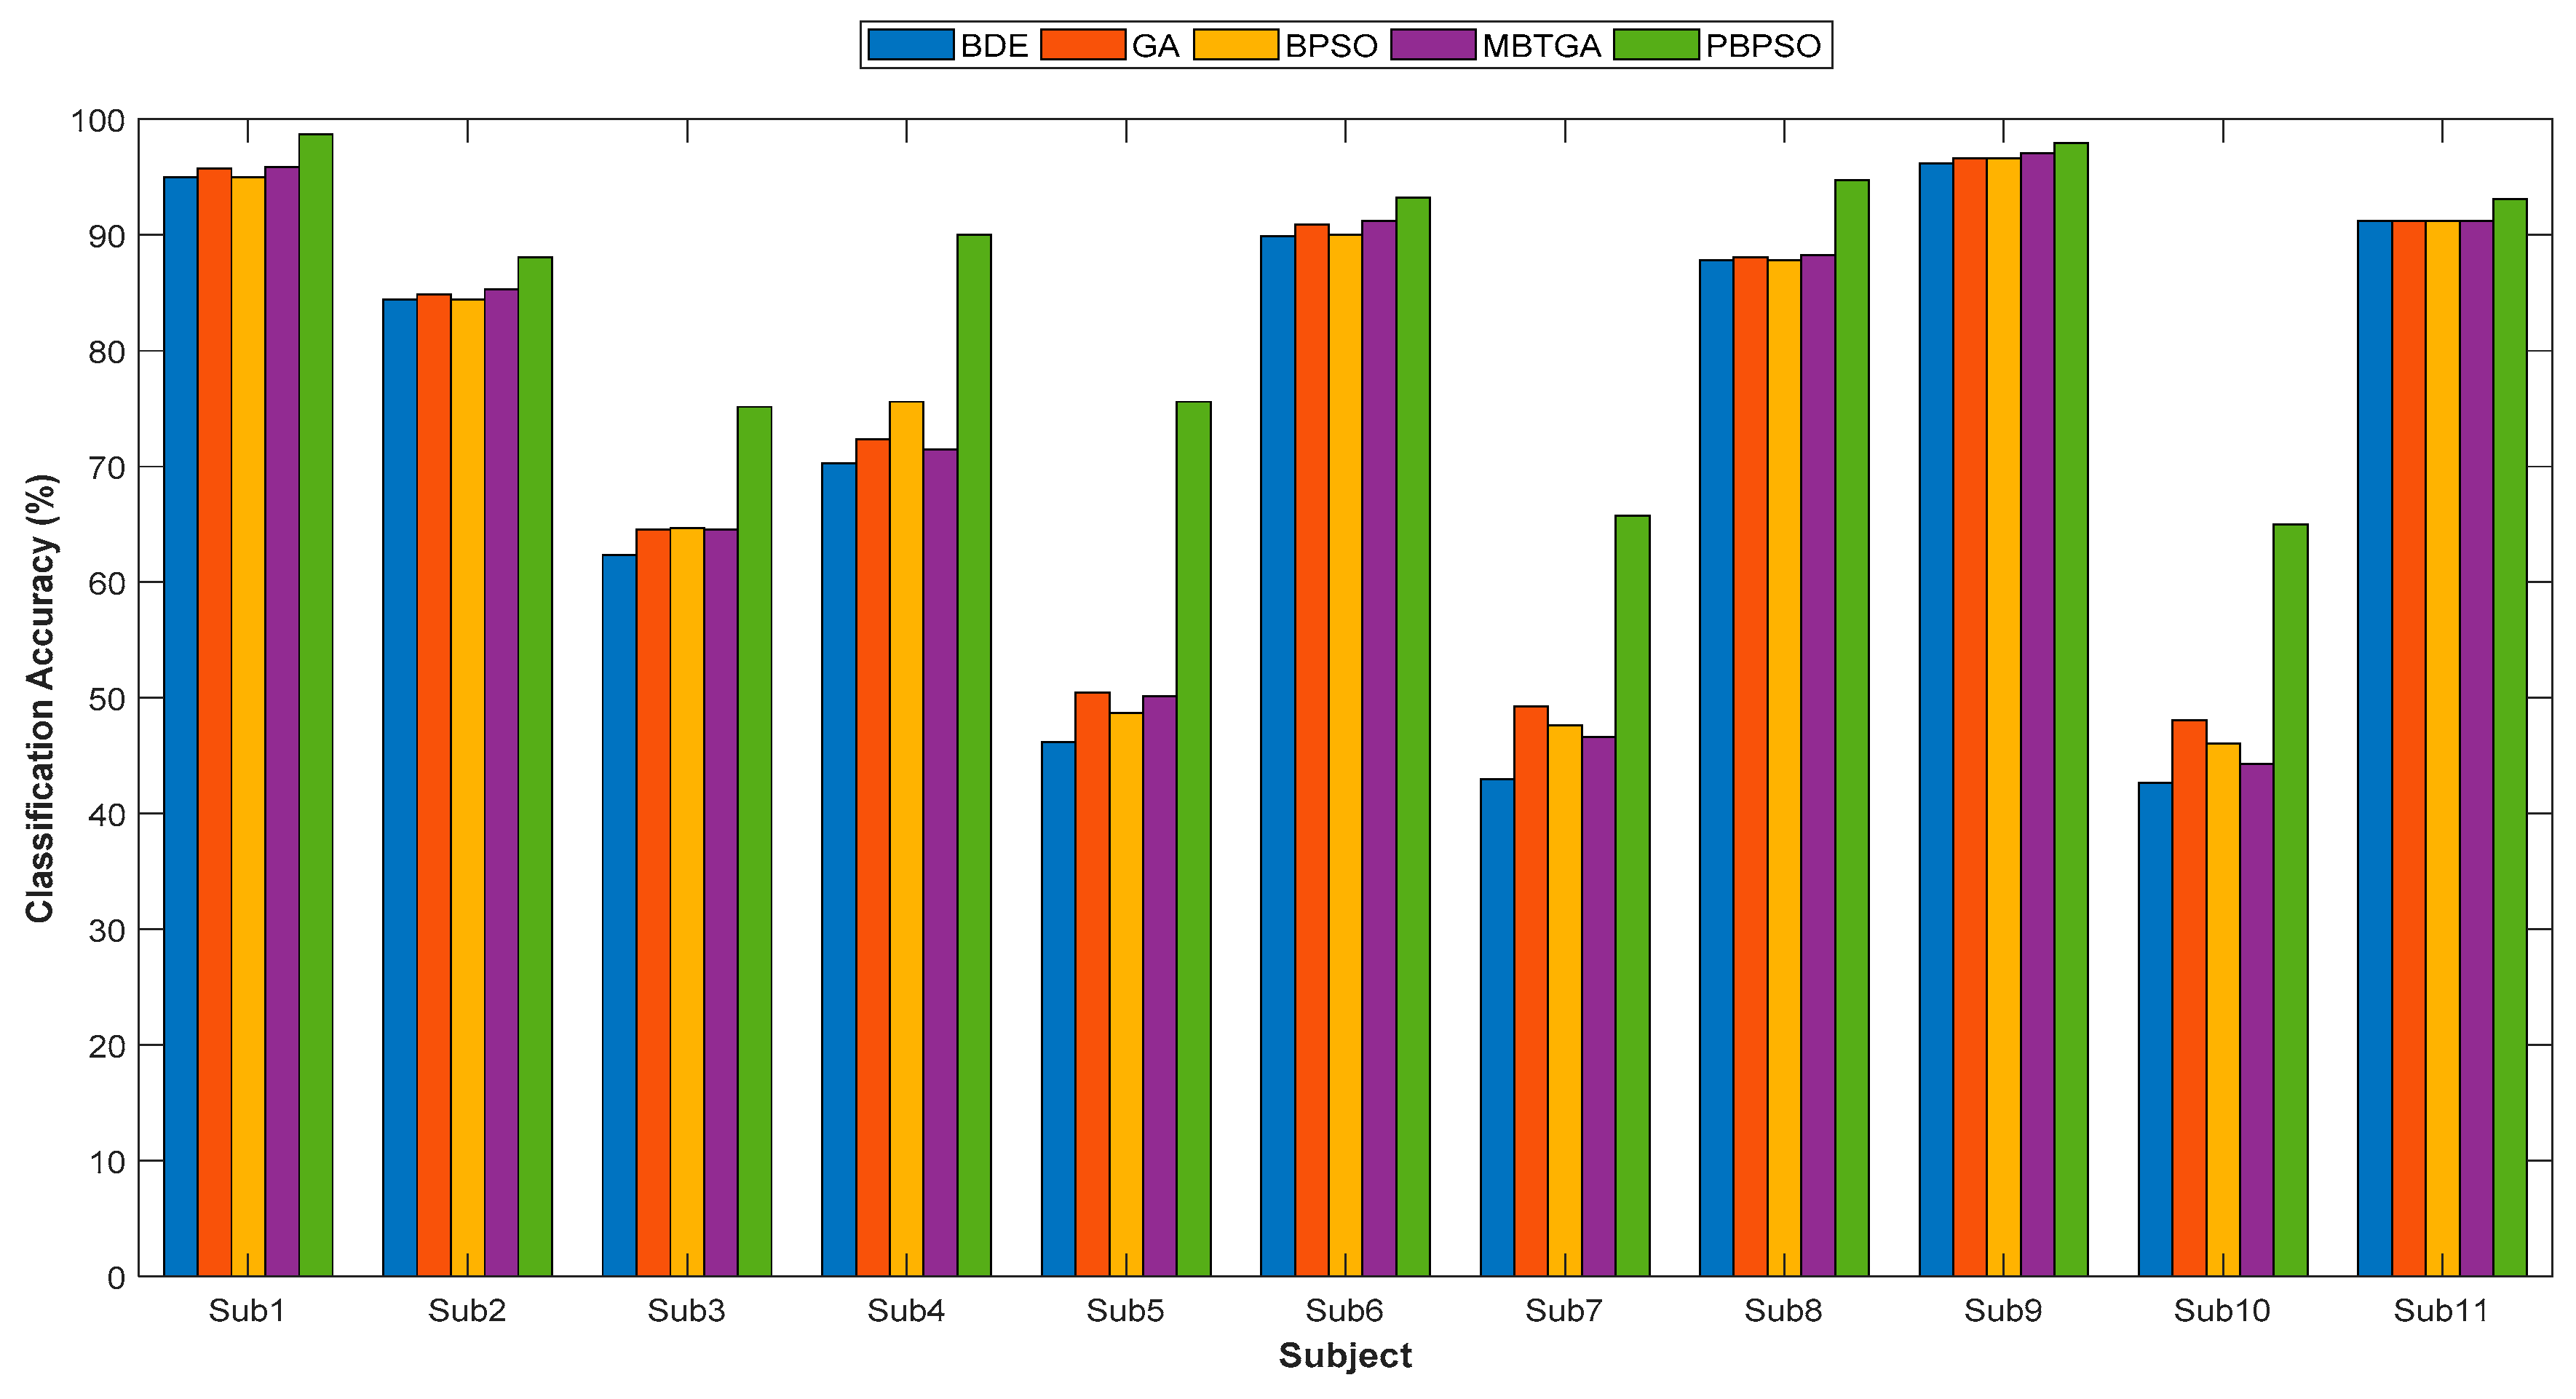
Figure 6 demonstrates the classification accuracy of five different feature selection methods for 11 amputee subjects. BDE yielded the lowest classification performance in this work, mainly due to the fact that BDE does not select the relevant features properly, thus misleading the classification results. From Figure 6, PBPSO provided the highest classification accuracy for all amputee subjects. By applying PBPSO, the classification accuracy showed great improvement compared to BDE, GA, MBTGA, and BPSO. For example, amputee subject 5 showed an increment of more than 20% in accuracy, allowing more accurate recognition of hand motions. Obviously, PBPSO outperformed BPSO, BDE, MBTGA, and GA in evaluating the optimal feature subset.
On average across all amputee subjects, PBPSO achieved a mean classification accuracy of 85.20%, followed by GA at 75.64%. Surprisingly, GA achieved better classification performance than BPSO and MBTGA. It is clear that GA offers better performance for high dimensional datasets. In terms of consistency, the performance of PBPSO was more robust due to the smallest standard deviation value. For instance, the t-test was applied to measure the classification performance of the proposed PBPSO against BDE, GA, MBTGA, and BPSO across 11 subjects. Applying the t-test showed that there was a significant difference in classification performance in PBPSO versus BDE (p < 0.05), PBPSO versus GA (p < 0.05), PBPSO versus MBTGA (p < 0.05), and PBPSO versus BPSO (p < 0.05). This again validated the superiority of PBPSO in feature selection.
Table 1 displays the results of feature size and feature reduction rate (FR) of five different feature selection methods. In Table 1, a higher FR means more features have been eliminated. In contrast, a smaller FR indicates that more features have been selected. By employing feature selection, one can see that less than half of the features were more than enough for accurate EMG signals classification. The experimental results confirmed a proper selection of features not only reduced the number of features, but also enhanced the classification performance. From Table 1, PBPSO achieved the smallest feature size and largest FR for all amputee subjects. This implies that PBPSO is very effective at selecting relevant features. Instead of using all 480 features, PBPSO offered a feature subset of 9 to 36 features in achieving promising result. Compared to BPSO, BDE, MBTGA, and GA, PBPSO yielded the lowest mean feature size (13.96) and highest mean FR (0.9690). With the smallest number of selected features, PBPSO contributed the lowest complexity in the classification process. All in all, PBPSO is very good in dimensionality reduction.
Table 2 and Table 3 outline the results of precision, F-measure, and MCC values. These tables show that PBPSO scored the highest precision, F-measure, and MCC across the 11 amputee subjects. The experimental results demonstrated the superiority of PBPSO in both classification performance and feature reduction. On the other hand, the feature selection method that contributed the worst performance was found to be BDE. According to the findings, PBPSO was more appropriate for use in solving the feature selection problem in EMG signals classification.
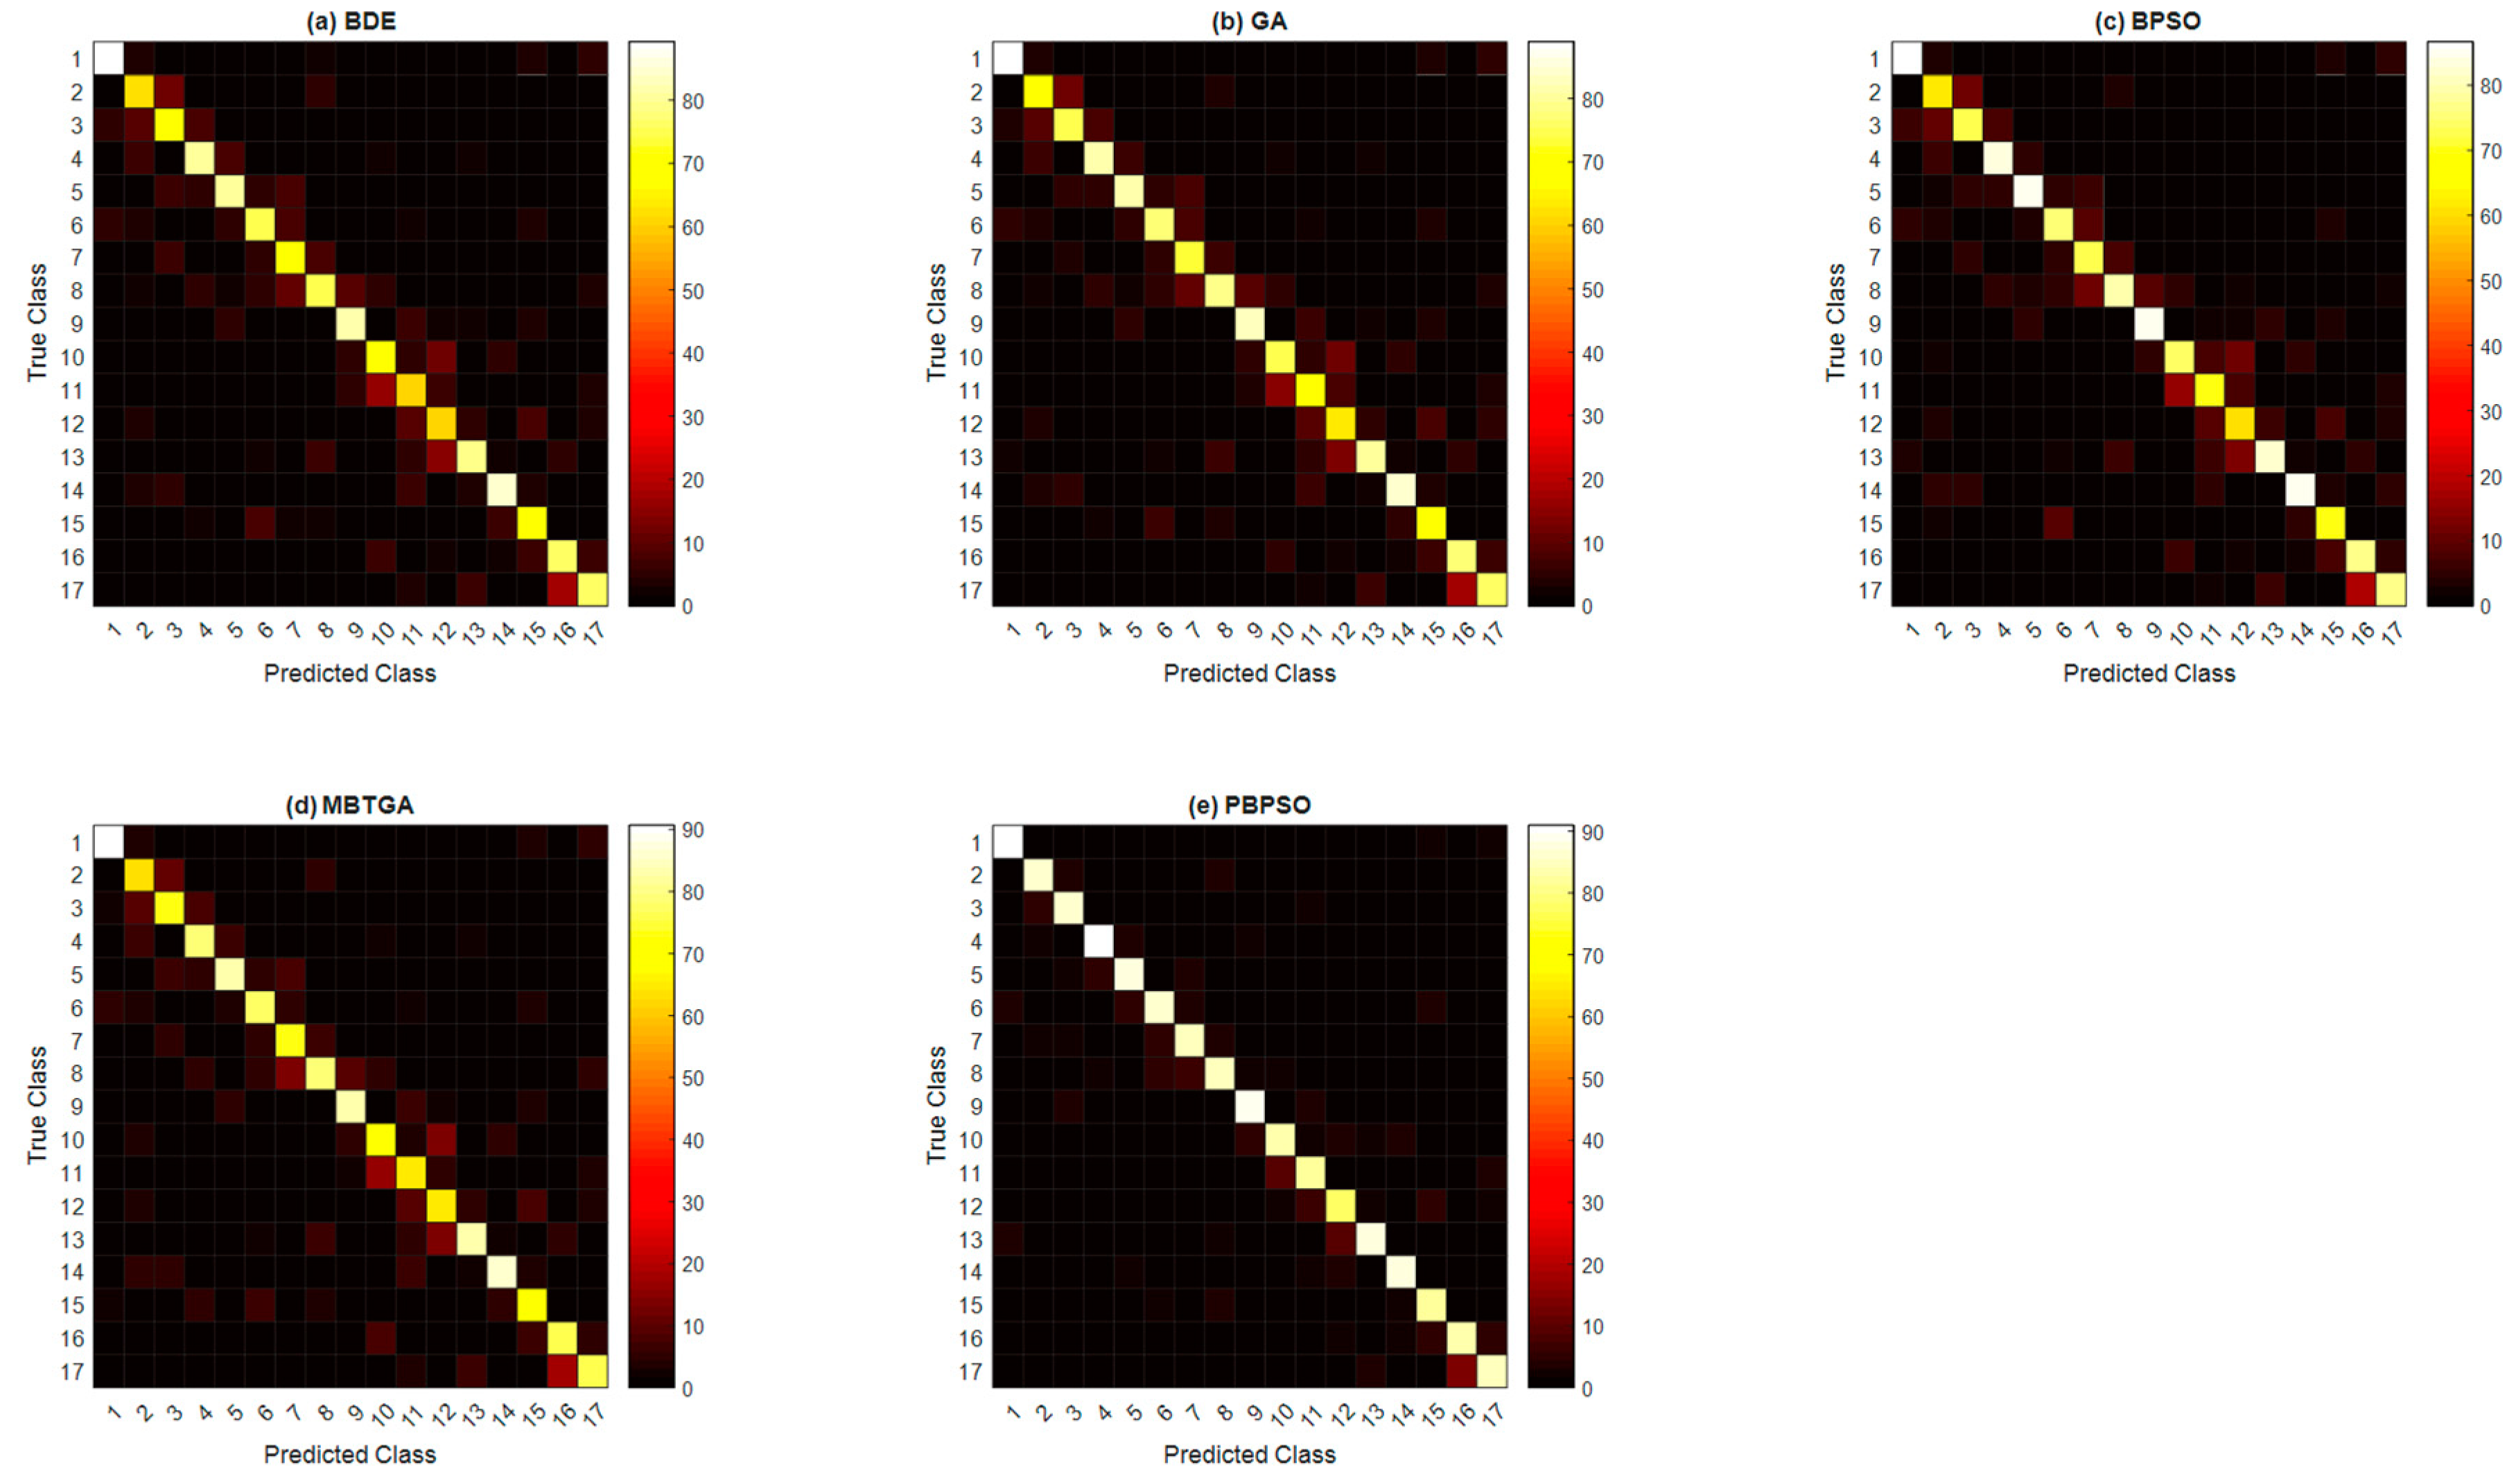
Figure 7 demonstrates the overall confusion matrix of five different feature selection methods across 11 amputee subjects. The x-axis and y-axis indicate the type of hand motions (from class 1 to class 17). It is highly difficult to recognize the hand motions performed by the amputee subjects accurately, mainly due to the fact that amputees performed the hand motions according to their imagination, thus misleading the classification result. Figure 7 shows that the worst class-wise performance was found to be BDE. In BDE, only the 1st, 4th, 9th, and 14th hand motion types (accuracy higher than 80%) were well classified. On the other side, GA and BPSO, respectively obtained the class-wise accuracy of above 80% for seven and six hand motion types. With regard to MBTGA, six out of seventeen hand motion types had their class-wise accuracy higher than 80%. Inspecting the result showed that the best class-wise performance was achieved by PBPSO. Employing PBPSO resulted in fifteen out of seventeen hand motion types being well recognized. In other words, PBPSO only failed to recognize the 11th (79.14%) and 12th (77.13%) hand motions. Altogether, PBPSO contributed the most informative feature subset, offering the best class-wise performance in this work.
4. Discussions
In the present study, a new pbest guide binary particle swarm optimization (PBPSO) is proposed to tackle the feature selection problem in EMG signals classification. Inspecting the results showed that PBPSO is the best feature selection method in this work. PBPSO achieves the highest classification performance while keeping the smallest number of features. Compared to BPSO, BDE, MBTGA, and GA, PBPSO eliminates more than 90% of features in the process of feature evaluation. More specifically, PBPSO is excellent in feature reduction. It can select a very small number of relevant features that contribute the most to the classification model. In this context, PBPSO is highly efficient in solving high dimensional feature selection problems.
The following observations explain the aspects of how PBPSO overtakes other algorithms in feature selection. Unlike BPSO, PBPSO employs a pbest guide strategy for guiding the particle to move toward the global optimum. The pbest enhancement process enables the pbest to evolve itself, which in turn will improve local and global search capabilities. More specifically, a high quality pbest is used in both velocity and position updates, thus leading to very good diversity. Hence, PBPSO has the capability of preventing the pbest from being trapped in the local optimum.
In the pbest enhancement process, the mutation, crossover, and selection operators borrowed from BDE algorithm are applied to improve the quality of pbest. Unlike BDE, PBPSO utilizes a dynamic crossover rate, which aims to balance the exploration and exploitation in the enhancement process. In the beginning, a greater CR leads to higher exploration. In contrast, a smaller CR guarantees exploitation in the end of the iteration. All in all, a dynamic crossover rate improves the search ability, while increasing the diversity of PBPSO. By making full use of these mechanisms, and the modified sigmoid function, PBPSO overtakes GA, BDE, MBTGA, and BPSO in this work.
Furthermore, it shows that the performance of amputee subjects can be improved with feature selection. Especially for subject 5, 7, and 10 who yielded a very low classification accuracy in the experiment. Applying PBPSO showed that those subjects can have better control on myoelectric prosthesis (with accuracy more than 60%), thus allowing them to perform more accurate motions in their daily life. In addition, PBPSO can be applied without prior knowledge. Eventually, PBPSO will automatically select the most informative features which consider the best combination of both channel and frequency bands (DWT). Since the EMG signal is subject-independent, therefore, PBPSO is more appropriate for use in clinical and rehabilitation applications.
There are several limitations to this work. First, we only apply DWT for feature extraction process. Other powerful and popular time–frequency methods such as stationary wavelet transform (SWT) can be considered for feature extraction. In a past study, the SWT entropy was introduced by Zhang et al. [42] for texture feature extraction in Alzheimer’s disease diagnosis system. Second, PBPSO requires extra computational cost compared to BPSO. When stagnation in pbest is found (Pcount >= 2), the pbest enhancement strategy (mutation, crossover, and selection operations) are activated to enhance the quality of pbest. This in turn will improve the computational complexity of the algorithm. Third, only KNN is used as the learning algorithm in this study. Other popular classifiers such as convolutional neural network (CNN) and support vector machine (SVM) can also be implemented, but with extremely high computational cost.
5. Conclusions
Selecting optimal EMG features, and the best combination between features and channels are the challenging problems, especially with regard to amputee dataset. Therefore, we propose a new PBPSO in this study to solve the feature selection problem in EMG signals classification. PBPSO is an improved version of BPSO that utilizes the pbest guide strategy to enhance the quality of pbest during the searching process. In addition, a dynamic crossover rate is implemented to balance the exploration and exploitation. Fully utilizing these mechanisms allows PBPSO to achieve very high classification performance with a minimal number of features. Based on the results obtained, PBPSO outperformed BDE, GA, MBTGA, and BPSO on 11 amputee datasets. The major advantages of PBPSO are that it is robust to complex feature set, and it works properly on feature reduction. On the other hand, it is observed that MBTGA provided competitive results on amputee dataset. However, the performance of MBTGA is still far from perfect. One of the possible reasons is that MBTGA was getting trapped in the local optimum, thus resulting in low classification accuracy. Even though MBTGA can offer promising result on healthy subjects, its effectiveness has been reduced using amputee dataset. These findings highlight that there is no optimal feature selection method that can solve all feature selection problems effectively, which is in accordance with the NFL theorem. Hence, more and more new feature selection methods are preferred for future work.
More research is required for both theoretical and practical aspects of the proposed method. In PBPSO, it is noticed that the best position of a particle is guided by pbest and gbest. However, PBPSO is more likely to be guided by pbest due its guide strategy in the searching process. Hence, the cognitive learning factor C1 in PBPSO can be increased since pbest has more influence compared to gbest. Moreover, popular strategies such as chaotic map and Levy distribution can be implemented in PBPSO for future extension of this work.
Author Contributions
Conceptualization, J.T.; formal analysis, J.T.; funding acquisition, A.R.A.; investigation, J.T.; methodology, J.T. and A.R.A.; software, J.T.; supervision, A.R.A; validation, J.T. and A.R.A.; writing—original draft, J.T.; writing—review and editing, J.T., A.R.A., N.M.S., and W.T.
Funding
This research and the APC were funded by Minister of Higher Education Malaysia (MOHE) under grant number FRGS/1/2017/TK04/FKE-CeRIA/F00334.
Acknowledgments
The authors would like to thank the Skim Zamalah UTeM and Minister of Higher Education Malaysia for funding research under grant FRGS/1/2017/TK04/FKE-CeRIA/F00334.
Conflicts of Interest
The authors declare no conflict of interest.
References
- Shi, W.T.; Lyu, Z.J.; Tang, S.T.; Chia, T.L.; Yang, C.Y. A bionic hand controlled by hand gesture recognition based on surface EMG signals: A preliminary study. Biocybern. Biomed. Eng. 2018, 38, 126–135. [Google Scholar] [CrossRef]
- Chowdhury, R.H.; Reaz, M.B.; Ali, M.A.B.M.; Bakar, A.A.; Chellappan, K.; Chang, T.G. Surface electromyography signal processing and classification techniques. Sensors 2013, 13, 12431–12466. [Google Scholar] [CrossRef] [PubMed]
- Rivela, D.; Scannella, A.; Pavan, E.E.; Frigo, C.A.; Belluco, P.; Gini, G. Analysis and Comparison of Features and Algorithms to Classify Shoulder Movements from sEMG Signals. IEEE Sens. J. 2018, 18, 3714–3721. [Google Scholar] [CrossRef]
- Powar, O.S.; Chemmangat, K.; Figarado, S. A novel pre-processing procedure for enhanced feature extraction and characterization of electromyogram signals. Biomed. Signal Process. Control. 2018, 42, 277–286. [Google Scholar] [CrossRef]
- Al Omari, F.; Hui, J.; Mei, C.; Liu, G. Pattern Recognition of Eight Hand Motions Using Feature Extraction of Forearm EMG Signal. Proc. Natl. Acad. Sci. India Sect. Phys. Sci. 2014, 84, 473–480. [Google Scholar] [CrossRef]
- Purushothaman, G.; Ray, K.K. EMG based man–machine interaction—A pattern recognition research platform. Robot. Auton. Syst. 2014, 62, 864–870. [Google Scholar] [CrossRef]
- Phinyomark, A.; Quaine, F.; Charbonnier, S.; Serviere, C.; Tarpin-Bernard, F.; Laurillau, Y. Feature extraction of the first difference of EMG time series for EMG pattern recognition. Comput. Methods Programs Biomed. 2014, 117, 247–256. [Google Scholar] [CrossRef] [PubMed]
- Phukpattaranont, P.; Thongpanja, S.; Anam, K.; Al-Jumaily, A.; Limsakul, C. Evaluation of feature extraction techniques and classifiers for finger movement recognition using surface electromyography signal. Med. Biol. Eng. Comput. 2018, 18, 1–13. [Google Scholar] [CrossRef]
- Wang, D.; Zhang, H.; Liu, R.; Lv, W.; Wang, D. t-Test feature selection approach based on term frequency for text categorization. Pattern Recognit. Lett. 2014, 45, 1–10. [Google Scholar] [CrossRef]
- Peng, H.; Long, F.; Ding, C. Feature selection based on mutual information criteria of max-dependency, max-relevance, and min-redundancy. IEEE Trans. Pattern. Anal. Mach. Intell. 2005, 27, 1226–1238. [Google Scholar] [CrossRef] [Green Version]
- Cheng, Q.; Zhou, H.; Cheng, J. The Fisher-Markov Selector: Fast Selecting Maximally Separable Feature Subset for Multiclass Classification with Applications to High-Dimensional Data. IEEE Trans. Pattern Anal. Mach. Intell. 2011, 33, 1217–1233. [Google Scholar] [CrossRef] [PubMed]
- Chuang, L.Y.; Chang, H.W.; Tu, C.J.; Yang, C.H. Improved binary PSO for feature selection using gene expression data. Comput. Biol. Chem. 2008, 32, 29–38. [Google Scholar] [CrossRef] [PubMed]
- Huang, C.L.; Wang, C.J. A GA-based feature selection and parameters optimization for support vector machines. Expert Syst. Appl. 2006, 31, 231–240. [Google Scholar] [CrossRef]
- Aghdam, M.H.; Ghasem-Aghaee, N.; Basiri, M.E. Text feature selection using ant colony optimization. Expert Syst. Appl. 2009, 36, 6843–6853. [Google Scholar] [CrossRef]
- Too, J.; Abdullah, A.R.; Saad, N.M.; Ali, N.M. Feature Selection Based on Binary Tree Growth Algorithm for the Classification of Myoelectric Signals. Machines 2018, 6, 65. [Google Scholar] [CrossRef]
- Moharam, A.; El-Hosseini, M.A.; Ali, H.A. Design of optimal PID controller using hybrid differential evolution and particle swarm optimization with an aging leader and challengers. Appl. Soft Comput. 2016, 38, 727–737. [Google Scholar] [CrossRef]
- Bharti, K.K.; Singh, P.K. Opposition chaotic fitness mutation based adaptive inertia weight BPSO for feature selection in text clustering. Appl. Soft Comput. 2016, 43, 20–34. [Google Scholar] [CrossRef]
- Chuang, L.Y.; Yang, C.H.; Li, J.C. Chaotic maps based on binary particle swarm optimization for feature selection. Appl. Soft Comput. 2011, 11, 239–248. [Google Scholar] [CrossRef]
- Zhang, Y.; Wang, S.; Phillips, P.; Ji, G. Binary PSO with mutation operator for feature selection using decision tree applied to spam detection. Knowl.-Based Syst. 2014, 64, 22–31. [Google Scholar] [CrossRef]
- Wang, S.; Phillips, P.; Yang, J.; Sun, P.; Zhang, Y. Magnetic resonance brain classification by a novel binary particle swarm optimization with mutation and time-varying acceleration coefficients. Biomed. Eng. Biomed. Tech. 2016, 61, 431–441. [Google Scholar] [CrossRef] [PubMed]
- Wolpert, D.H.; Macready, W.G. No free lunch theorems for optimization. IEEE Trans. Evol. Comput. 1997, 1, 67–82. [Google Scholar] [CrossRef] [Green Version]
- Atzori, M.; Gijsberts, A.; Castellini, C.; Caputo, B.; Hager, A.G.M.; Elsig, S.; Giatsidis, G.; Bassetto, F.; Müller, H. Electromyography data for non-invasive naturally-controlled robotic hand prostheses. Sci. Data 2014, 1, 140053. [Google Scholar] [CrossRef] [PubMed] [Green Version]
- Subasi, A. Classification of EMG signals using combined features and soft computing techniques. Appl. Soft Comput. 2012, 12, 2188–2198. [Google Scholar] [CrossRef]
- Subasi, A. Classification of EMG signals using PSO optimized SVM for diagnosis of neuromuscular disorders. Comput. Biol. Med. 2013, 43, 576–586. [Google Scholar] [CrossRef] [PubMed]
- Phinyomark, A.; Limsakul, C.; Phukpattaranont, P. Application of Wavelet Analysis in EMG Feature Extraction for Pattern Classification. Meas. Sci. Rev. 2011, 11, 45–52. [Google Scholar] [CrossRef]
- Hudgins, B.; Parker, P.; Scott, R.N. A new strategy for multifunction myoelectric control. IEEE Trans. Biomed. Eng. 1993, 40, 82–94. [Google Scholar] [CrossRef] [PubMed]
- Phinyomark, A.; Phukpattaranont, P.; Limsakul, C. Feature reduction and selection for EMG signal classification. Expert Syst. Appl. 2012, 39, 7420–7431. [Google Scholar] [CrossRef]
- Phinyomark, A.; Phukpattaranont, P.; Limsakul, C. Fractal analysis features for weak and single-channel upper-limb EMG signals. Expert Syst. Appl. 2012, 39, 11156–11163. [Google Scholar] [CrossRef]
- Kennedy, J.; Eberhart, R.C. A discrete binary version of the particle swarm algorithm. In Proceedings of the IEEE International Conference on Systems, Man, and Cybernetics, Orlando, FL, USA, 12–15 October 1997. [Google Scholar] [CrossRef]
- Shi, Y.; Eberhart, R. A modified particle swarm optimizer. In Proceedings of the IEEE on Evolutionary Computation, Anchorage, AK, USA, 4–9 May 1998. [Google Scholar] [CrossRef]
- Konak, A.; Coit, D.W.; Smith, A.E. Multi-objective optimization using genetic algorithms: A tutorial. Reliab. Eng. Syst. Saf. 2006, 91, 992–1007. [Google Scholar] [CrossRef]
- Storn, R.; Price, K. Differential Evolution—A Simple and Efficient Heuristic for global Optimization over Continuous Spaces. J. Glob. Optim. 1997, 11, 341–359. [Google Scholar] [CrossRef]
- Zorarpacı, E.; Özel, S.A. A hybrid approach of differential evolution and artificial bee colony for feature selection. Expert Syst. Appl. 2016, 62, 91–103. [Google Scholar] [CrossRef]
- Jensi, R.; Jiji, G.W. An enhanced particle swarm optimization with levy flight for global optimization. Appl. Soft Comput. 2016, 43, 248–261. [Google Scholar] [CrossRef]
- Gunasundari, S.; Janakiraman, S.; Meenambal, S. Velocity Bounded Boolean Particle Swarm Optimization for improved feature selection in liver and kidney disease diagnosis. Expert Syst. Appl. 2016, 56, 28–47. [Google Scholar] [CrossRef]
- Mafarja, M.M.; Mirjalili, S. Hybrid Whale Optimization Algorithm with simulated annealing for feature selection. Neurocomputing 2017, 260, 302–312. [Google Scholar] [CrossRef]
- Venugopal, G.; Navaneethakrishna, M.; Ramakrishnan, S. Extraction and analysis of multiple time window features associated with muscle fatigue conditions using sEMG signals. Expert Syst. Appl. 2014, 41, 2652–2659. [Google Scholar] [CrossRef]
- Ghareb, A.S.; Bakar, A.A.; Hamdan, A.R. Hybrid feature selection based on enhanced genetic algorithm for text categorization. Expert Syst. Appl. 2016, 49, 31–47. [Google Scholar] [CrossRef]
- Pashaei, E.; Aydin, N. Binary black hole algorithm for feature selection and classification on biological data. Appl. Soft Comput. 2017, 56, 94–106. [Google Scholar] [CrossRef]
- Li, Q.; Chen, H.; Huang, H.; Zhao, X.; Cai, Z.; Tong, C.; Liu, W.; Tian, X. An Enhanced Grey Wolf Optimization Based Feature Selection Wrapped Kernel Extreme Learning Machine for Medical Diagnosis. Comput. Math. Methods Med. 2017, 2017. [Google Scholar] [CrossRef]
- Zhai, X.; Jelfs, B.; Chan, R.H.; Tin, C. Self-Recalibrating Surface EMG Pattern Recognition for Neuroprosthesis Control Based on Convolutional Neural Network. Front. Neurosci. 2017, 11, 379. [Google Scholar] [CrossRef]
- Zhang, Y.; Wang, S.; Sui, Y.; Yang, M.; Liu, B.; Cheng, H.; Sun, J.; Jia, W.; Phillips, P.; Gorriz, J.M. Multivariate Approach for Alzheimer’s Disease Detection Using Stationary Wavelet Entropy and Predator-Prey Particle Swarm Optimization. J. Alzheimers Dis. JAD 2018, 65, 855–869. [Google Scholar] [CrossRef]
Figure 1.
Flow chart of the proposed electromyography (EMG) pattern recognition system.

Figure 2.
Wavelet decomposition at the fourth decomposition level.

Figure 3.
Example of genetic algorithm (GA) operations. (a) Crossover, and (b) mutation.

Figure 4.
Flowchart of proposed PBPSO for feature selection.

Figure 5.
Convergence curve of five different feature selection methods for 11 subjects.
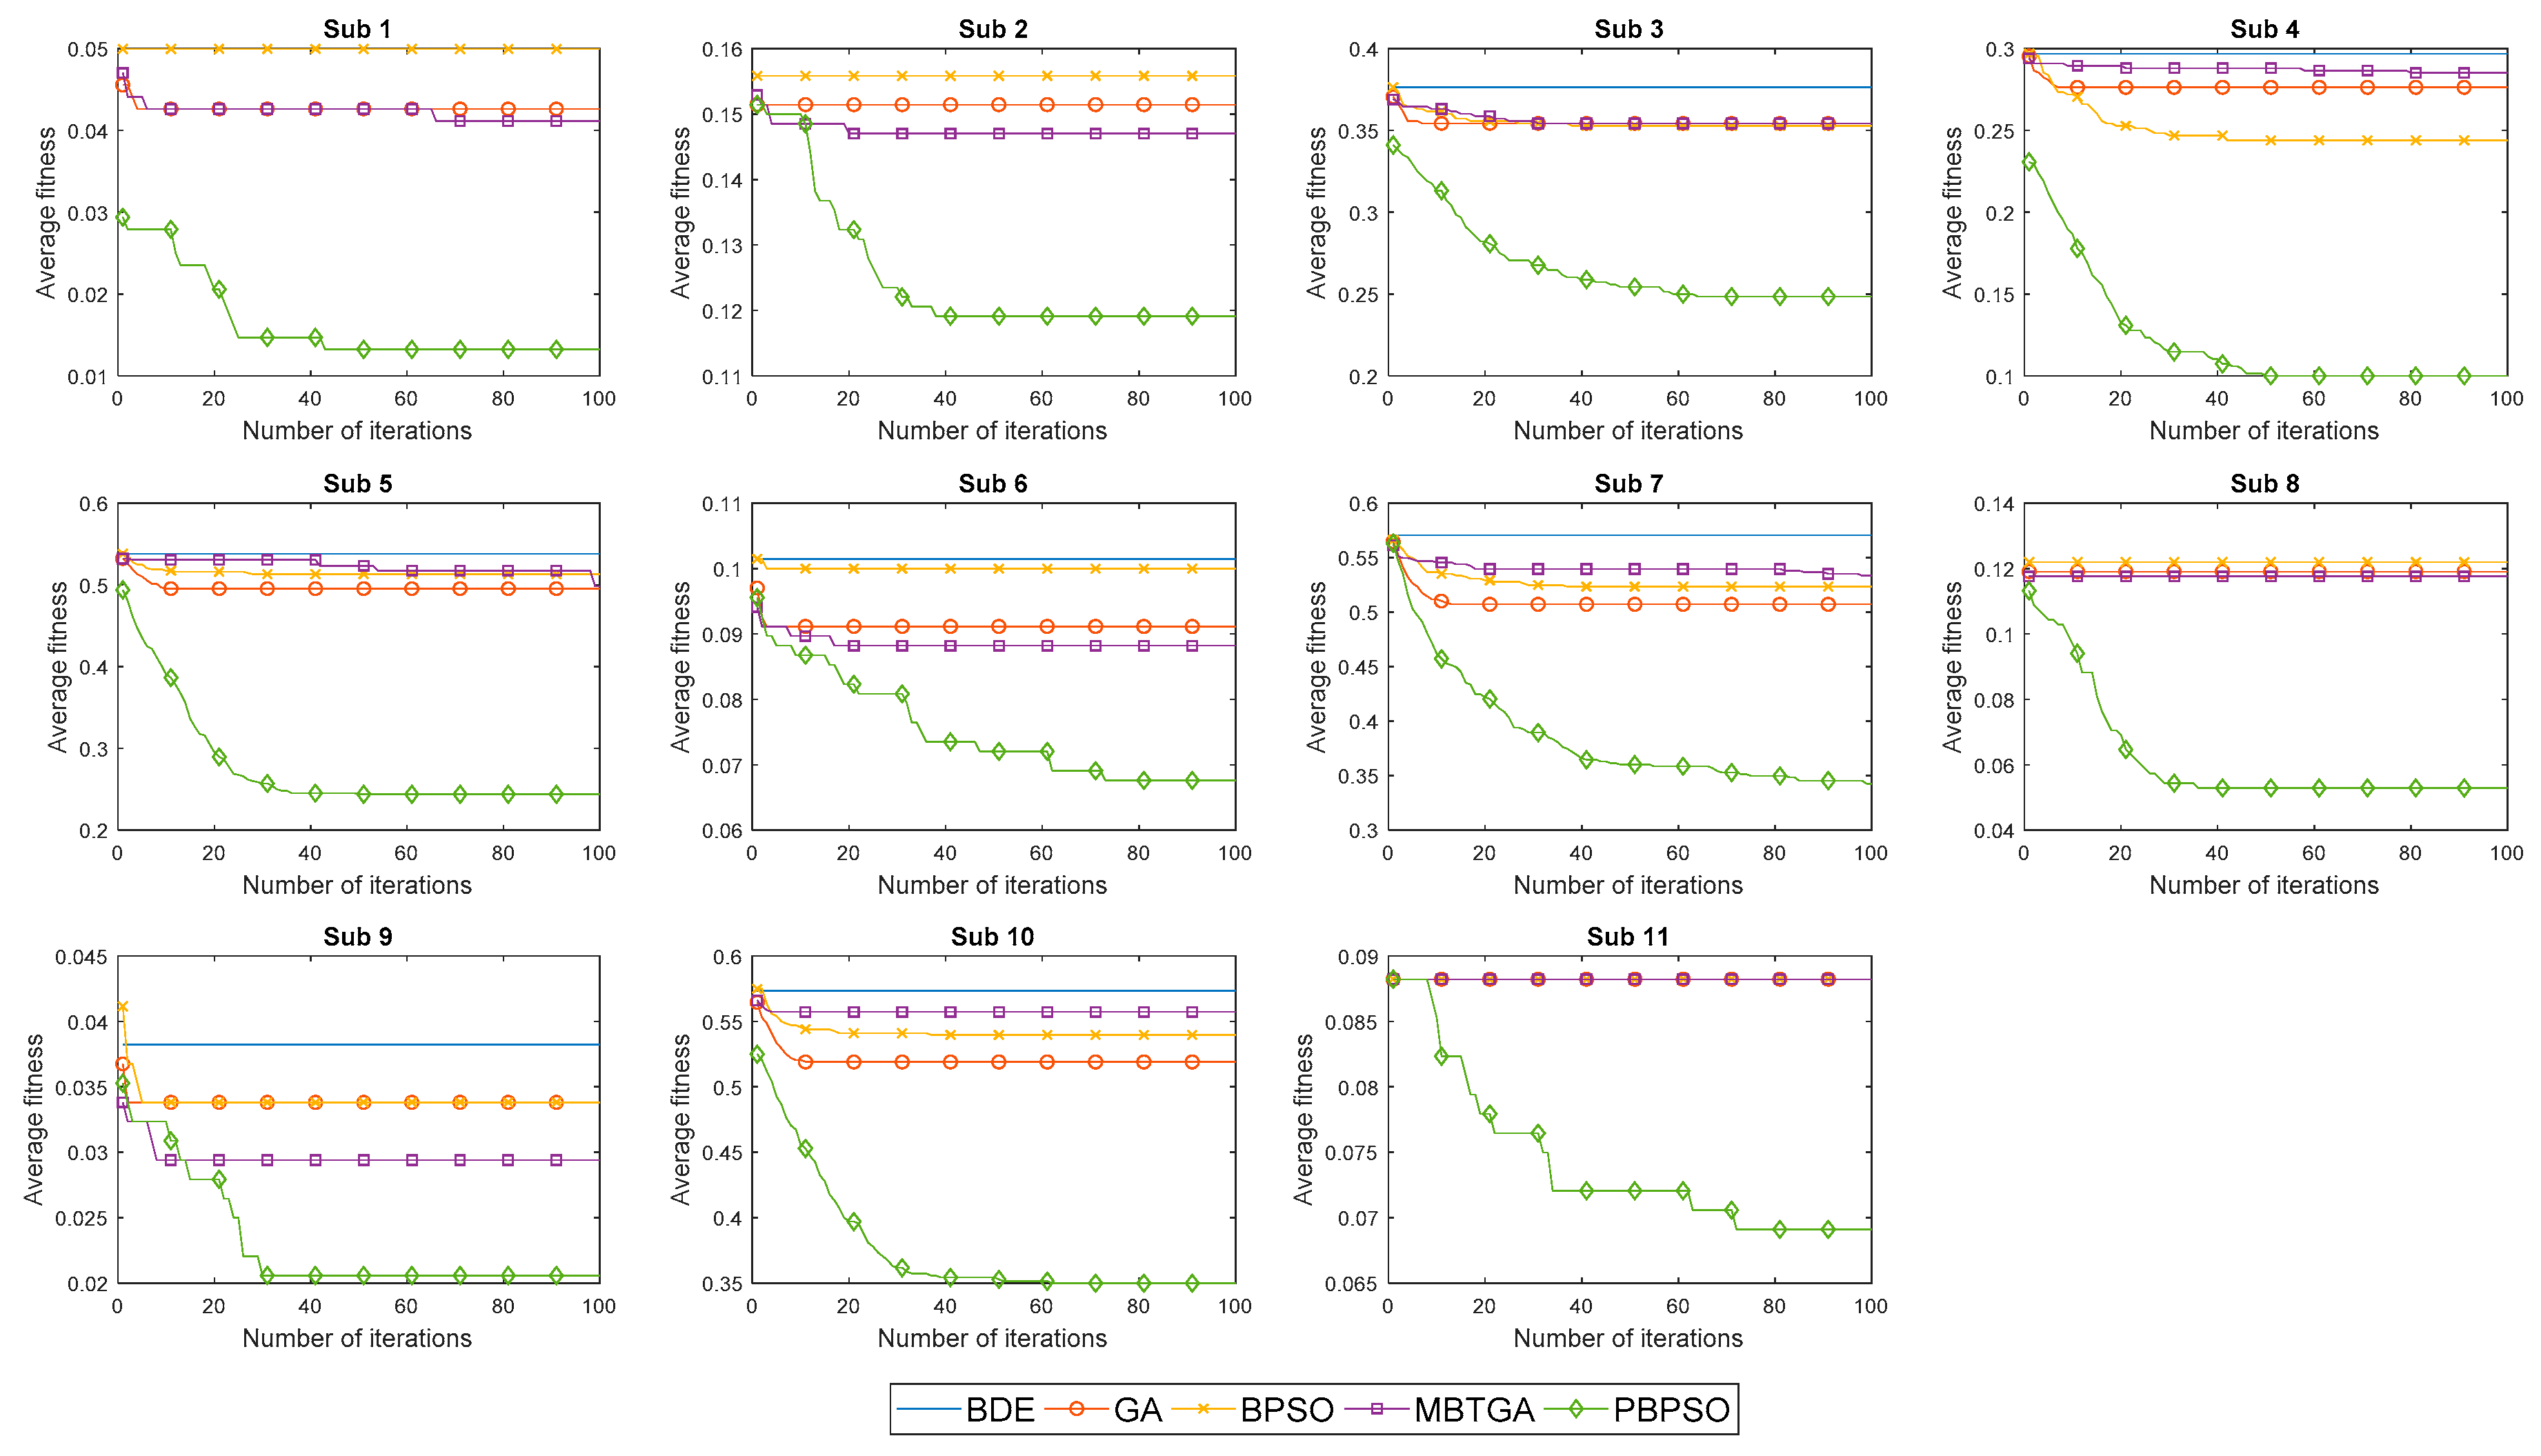
Figure 6.
Classification accuracy of five different feature selection methods for 11 amputee subjects.
Figure 6.
Classification accuracy of five different feature selection methods for 11 amputee subjects.

Figure 7.
The overall confusion matrix of five different feature selection methods across 11 amputee subjects.
Figure 7.
The overall confusion matrix of five different feature selection methods across 11 amputee subjects.


Table 1.
Results of feature size and feature reduction rate (FR) of five different feature selection methods for 11 subjects.
Table 1.
Results of feature size and feature reduction rate (FR) of five different feature selection methods for 11 subjects.
| Amputee Subject | Number of Selected Feature | Feature Reduction Rate (FR) | ||||||||
|---|---|---|---|---|---|---|---|---|---|---|
| BDE | GA | BPSO | MBTGA | PBPSO | BDE | GA | BPSO | MBTGA | PBPSO | |
| 1 | 244.85 | 237.50 | 202.30 | 233.80 | 10.70 | 0.4899 | 0.5052 | 0.5785 | 0.5129 | 0.9777 |
| 2 | 238.10 | 239.45 | 194.50 | 237.35 | 10.00 | 0.5040 | 0.5011 | 0.5948 | 0.5055 | 0.9792 |
| 3 | 240.15 | 234.45 | 201.00 | 236.10 | 13.55 | 0.4997 | 0.5116 | 0.5812 | 0.5081 | 0.9718 |
| 4 | 246.50 | 238.20 | 199.20 | 239.90 | 11.95 | 0.4865 | 0.5038 | 0.5850 | 0.5002 | 0.9751 |
| 5 | 238.95 | 240.15 | 214.20 | 230.65 | 15.55 | 0.5022 | 0.4997 | 0.5538 | 0.5195 | 0.9676 |
| 6 | 201.50 | 201.20 | 166.20 | 200.05 | 14.00 | 0.4963 | 0.4970 | 0.5845 | 0.4999 | 0.965 |
| 7 | 212.40 | 201.80 | 173.70 | 199.55 | 35.75 | 0.4690 | 0.4955 | 0.5657 | 0.5011 | 0.9106 |
| 8 | 234.00 | 236.40 | 196.80 | 236.00 | 8.05 | 0.5125 | 0.5075 | 0.5900 | 0.5083 | 0.9832 |
| 9 | 248.20 | 239.40 | 195.95 | 241.55 | 8.95 | 0.4829 | 0.5013 | 0.5918 | 0.4968 | 0.9814 |
| 10 | 245.75 | 237.55 | 205.20 | 239.85 | 14.15 | 0.4880 | 0.5051 | 0.5725 | 0.5003 | 0.9705 |
| 11 | 245.15 | 235.90 | 194.90 | 235.90 | 10.90 | 0.4893 | 0.5085 | 0.5940 | 0.5085 | 0.9773 |
| Mean | 235.96 | 231.09 | 194.90 | 230.06 | 13.96 | 0.4927 | 0.5033 | 0.5811 | 0.5056 | 0.9690 |
Table 2.
Results of precision and F-measure of five different feature selection methods for 11 subjects.
Table 2.
Results of precision and F-measure of five different feature selection methods for 11 subjects.
| Amputee Subject | Precision (P) | F-Measure | ||||||||
|---|---|---|---|---|---|---|---|---|---|---|
| BDE | GA | BPSO | MBTGA | PBPSO | BDE | GA | BPSO | MBTGA | PBPSO | |
| 1 | 0.9667 | 0.9716 | 0.9667 | 0.9726 | 0.9912 | 0.9467 | 0.9545 | 0.9467 | 0.9561 | 0.9859 |
| 2 | 0.9030 | 0.9074 | 0.9030 | 0.9118 | 0.9250 | 0.8186 | 0.8230 | 0.8186 | 0.8275 | 0.8628 |
| 3 | 0.6514 | 0.6623 | 0.6613 | 0.6659 | 0.7809 | 0.6097 | 0.6304 | 0.6295 | 0.6361 | 0.7304 |
| 4 | 0.7939 | 0.8032 | 0.8095 | 0.7990 | 0.9296 | 0.6846 | 0.7034 | 0.7247 | 0.6949 | 0.8972 |
| 5 | 0.6429 | 0.6665 | 0.6584 | 0.6601 | 0.8259 | 0.4481 | 0.4975 | 0.4742 | 0.4933 | 0.7518 |
| 6 | 0.9309 | 0.9397 | 0.9314 | 0.9412 | 0.9559 | 0.8935 | 0.9032 | 0.8949 | 0.9059 | 0.9282 |
| 7 | 0.5401 | 0.5903 | 0.5931 | 0.5728 | 0.7374 | 0.3976 | 0.4625 | 0.4479 | 0.4306 | 0.6275 |
| 8 | 0.9194 | 0.9209 | 0.9194 | 0.9216 | 0.9637 | 0.8791 | 0.8813 | 0.8791 | 0.8824 | 0.9430 |
| 9 | 0.9745 | 0.9775 | 0.9775 | 0.9804 | 0.9863 | 0.9592 | 0.9639 | 0.9639 | 0.9686 | 0.9780 |
| 10 | 0.4552 | 0.5045 | 0.4994 | 0.4727 | 0.7170 | 0.4120 | 0.4622 | 0.4511 | 0.4256 | 0.6362 |
| 11 | 0.9500 | 0.9500 | 0.9510 | 0.9500 | 0.9579 | 0.9097 | 0.9097 | 0.9098 | 0.9097 | 0.9278 |
| Mean | 0.7934 | 0.8085 | 0.8064 | 0.8044 | 0.8883 | 0.7235 | 0.7447 | 0.7400 | 0.7391 | 0.8426 |
Table 3.
Matthew correlation coefficient (MCC) results of five different feature selection methods for 11 subjects.
Table 3.
Matthew correlation coefficient (MCC) results of five different feature selection methods for 11 subjects.
| Amputee Subject | Matthew Correlation Coefficient (MCC) | ||||
|---|---|---|---|---|---|
| BDE | GA | BPSO | MBTGA | PBPSO | |
| 1 | 0.9500 | 0.9573 | 0.9500 | 0.9588 | 0.9868 |
| 2 | 0.8838 | 0.8885 | 0.8838 | 0.8932 | 0.9066 |
| 3 | 0.6154 | 0.6284 | 0.6350 | 0.6252 | 0.7594 |
| 4 | 0.7508 | 0.7642 | 0.7864 | 0.7585 | 0.9007 |
| 5 | 0.5597 | 0.5715 | 0.5685 | 0.5626 | 0.7649 |
| 6 | 0.8989 | 0.9092 | 0.9002 | 0.9118 | 0.9328 |
| 7 | 0.5021 | 0.5441 | 0.5462 | 0.5383 | 0.7007 |
| 8 | 0.8823 | 0.8847 | 0.8823 | 0.8858 | 0.9488 |
| 9 | 0.9618 | 0.9662 | 0.9662 | 0.9706 | 0.9794 |
| 10 | 0.4016 | 0.4581 | 0.4360 | 0.4202 | 0.6563 |
| 11 | 0.9160 | 0.9160 | 0.9163 | 0.9160 | 0.9327 |
| Mean | 0.7566 | 0.7717 | 0.7701 | 0.7674 | 0.8608 |
© 2019 by the authors. Licensee MDPI, Basel, Switzerland. This article is an open access article distributed under the terms and conditions of the Creative Commons Attribution (CC BY) license (http://creativecommons.org/licenses/by/4.0/).
Share and Cite
MDPI and ACS Style
Too, J.; Abdullah, A.R.; Mohd Saad, N.; Tee, W. EMG Feature Selection and Classification Using a Pbest-Guide Binary Particle Swarm Optimization. Computation 2019, 7, 12. https://0-doi-org.brum.beds.ac.uk/10.3390/computation7010012
AMA Style
Too J, Abdullah AR, Mohd Saad N, Tee W. EMG Feature Selection and Classification Using a Pbest-Guide Binary Particle Swarm Optimization. Computation. 2019; 7(1):12. https://0-doi-org.brum.beds.ac.uk/10.3390/computation7010012
Chicago/Turabian StyleToo, Jingwei, Abdul Rahim Abdullah, Norhashimah Mohd Saad, and Weihown Tee. 2019. "EMG Feature Selection and Classification Using a Pbest-Guide Binary Particle Swarm Optimization" Computation 7, no. 1: 12. https://0-doi-org.brum.beds.ac.uk/10.3390/computation7010012
Note that from the first issue of 2016, this journal uses article numbers instead of page numbers. See further details here.