Article

Fuzzy C-Means Based Clustering and Rule Formation Approach for Classification of Bearing Faults Using Discrete Wavelet Transform

1
School of Computer Science and Engineering, Vellore Institute of Technology, Vellore, Tamil Nadu 632014, India
2
School of Mechanical Engineering, Vellore Institute of Technology, Vellore, Tamil Nadu 632014, India
*
Author to whom correspondence should be addressed.
Submission received: 12 August 2019 / Revised: 17 September 2019 / Accepted: 21 September 2019 / Published: 23 September 2019
(This article belongs to the Special Issue Machine Learning for Computational Science and Engineering)

Abstract

:
The rolling bearings are considered as the heart of rotating machinery and early fault diagnosis is one of the biggest challenges during operation. Due to complicated mechanical assemblies, detection of the advancing fault and faults at the incipient stage is very difficult and tedious. This work presents a fuzzy rule based classification of bearing faults using Fuzzy C-means clustering method using vibration measurements. Experiments were conducted to collect the vibration signals of a normal bearing and bearings with faults in the inner race, outer race and ball fault. Discrete Wavelet Transform (DWT) technique is used to decompose the vibration signals into different frequency bands. In order to detect the early faults in the bearings, various statistical features were extracted from this decomposed signal of each frequency band. Based on the extracted features, Fuzzy C-means clustering method (FCM) is developed to classify the faults using suitable membership functions and fuzzy rule base is developed for each class of the bearing fault using labeled data. The experimental results show that the proposed method is able to classify the condition of the bearing using the extracted features. The proposed FCM based clustering and classification model provides easier interpretation and implementation for monitoring the condition of the rolling bearings at an early stage and it will be helpful to take the preventive action before a large-scale failure.

1. Introduction

Bearings are one of the most critical elements in rotating machinery systems. Early bearing fault detection and diagnosis are very important to prevent critical system failures as any fault on the rolling element bearing leads to sudden, unwarned machine breakdowns and unpredicted failures. It leads to huge loss and affects the production rate. Vibration measurements using accelerometer is commonly used for fault detection in bearings. In order to determine the presence of a bearing fault, existing fault diagnostic methods use fault characteristic frequencies and its sensitiveness towards geometrical parameters of bearing such as inner race diameter, outer race diameter, pitch circle diameter, the diameter of rolling element, radial clearance, etc. However, the defects in bearings cause variation in the frequency at which it operates and this signal is modulated by the natural frequency of the bearings. Also, it is difficult to accurately identify the occurrence of a bearing fault at its incipient stage due to the small signal-to-noise ratio of the vibration signals. Hence, there is a need for developing improved fault diagnosis methods to identify and classify the bearing faults at the early stage.
Vibration measurements and analysis is one of the most effective fault diagnosis techniques especially suitable for rolling element bearings as there is a periodic shock impulse appears every time as one component contacts another if there is a local fault [1,2]. In order to detect and recognize the fault signal, different signal analysis methods were developed in time domain analysis [3,4], frequency domain analysis [5], and time-frequency domain analysis by various researchers. Statistical parameters play also a significant role in the detection of a fault of rotary machines. Time-domain analysis has simple calculations and direct signal processing contributes to the shortening of the processing time, however, the time domain analysis provides limited insight into the fault the disadvantages of low sensitivity and low accuracy. Hence frequency domain analysis methods using Fourier transform has been applied by various researchers. As the fault results in periodic impulses, it attributes to the bearing characteristic frequency and the harmonics appear in the frequency domain [6]. However, the signal needs to be periodic and stationary for using Fourier transforms. Since the vibration signals may not always be stationary [7], the Fourier transform method is not reliable for non-stationary signals. Hence, time-frequency methods were introduced to simultaneously generate both time and frequency information.
Among the time-frequency analysis methods, wavelets are the most widespread tools in signal analysis. The major drawbacks associated with FFT techniques are overcome by many new approaches such as Short term Fourier Transform (STFT), Empirical Mode Decomposition (EMD) [8], Ensemble Empirical Mode Decomposition (EEMD) [9], Support Vector Machine (SVM) [10], Wavelet Transform (WT) [11], Continuous Wavelet Transform (CWT) [12]. Though the proposed methods are used to extract the features from the signal, the WT technique is widely used to discretize the signal into wavelets. This technique can easily acquire the data from both the time domain and frequency domain from which statistical features like mean, median, kurtosis, standard deviation, minimum, maximum, root mean square, peak value, etc. [13]. Similarly, the Discrete WT (DWT) technique can also be an equivalent choice to obtain information about the frequency and time components for feature extraction. The extracted statistical features from DWT contain significant details about the failure of the components precisely [14].
A fault diagnosis approach requires a simpler method to understand the hidden patterns in the signal for detecting a bearing fault and classify it. Cluster analysis is an exploratory data analysis tool for solving classification problems. Its object is to sort cases, data, or objects (events, people, things, etc.) into groups or clusters. Many researchers developed various machine learning algorithms, i.e., GA and Fuzzy inference [15], artificial neural networks (ANN) [16], self-adaptive [17], support vector machines (SVM) [18], Learning Vector Quantization (LVQ) [19], extreme learning machine [20], adaptive stochastic resonance [21], model-based class discrimination (VPMCD) [22], random forest [23], Artificial Bee Colony (ABC) [24], deep belief network [25] and so on. All the aforementioned techniques are pretty complicated to disseminate the fault diagnosis data from a machine operator’s point of view. Fuzzy clustering is one amongst the widely adopted methods for fault diagnosis owing to its superiority in dealing with its independence from supervisors and uncertainty. Hard C-means (HCM) and fuzzy C-means (FCM) clustering algorithms could be adopted to effectively classify the patterns during fault diagnosis.
It is found that lot of researches have been carried out in the field of fault diagnosis of rolling element bearing, in which, very few works have been focused on detection and recognition of the advancing faults and faults of micro size in rolling element bearing. Hence this study presents a new approach using statistical analysis of wavelet transform and Fuzzy C-Means Clustering (FCM) suitable for fault detection and grading the bearing faults at an early stage. Experiments were carried out to acquire vibration signals from the four bearings with different faults such as inner race fault, outer race fault, ball fault along with no-fault and the fault classification results are presented.
This paper is organized as follows: Section 2 presents the experimental details on vibration measurement of roller element bearings. Section 3 and its subsections explains the steps involved in the proposed methodology for fault diagnosis of roller element bearings. Section 4 describes the results and inferences of the proposed methodology. Major conclusions are presented in Section 5.

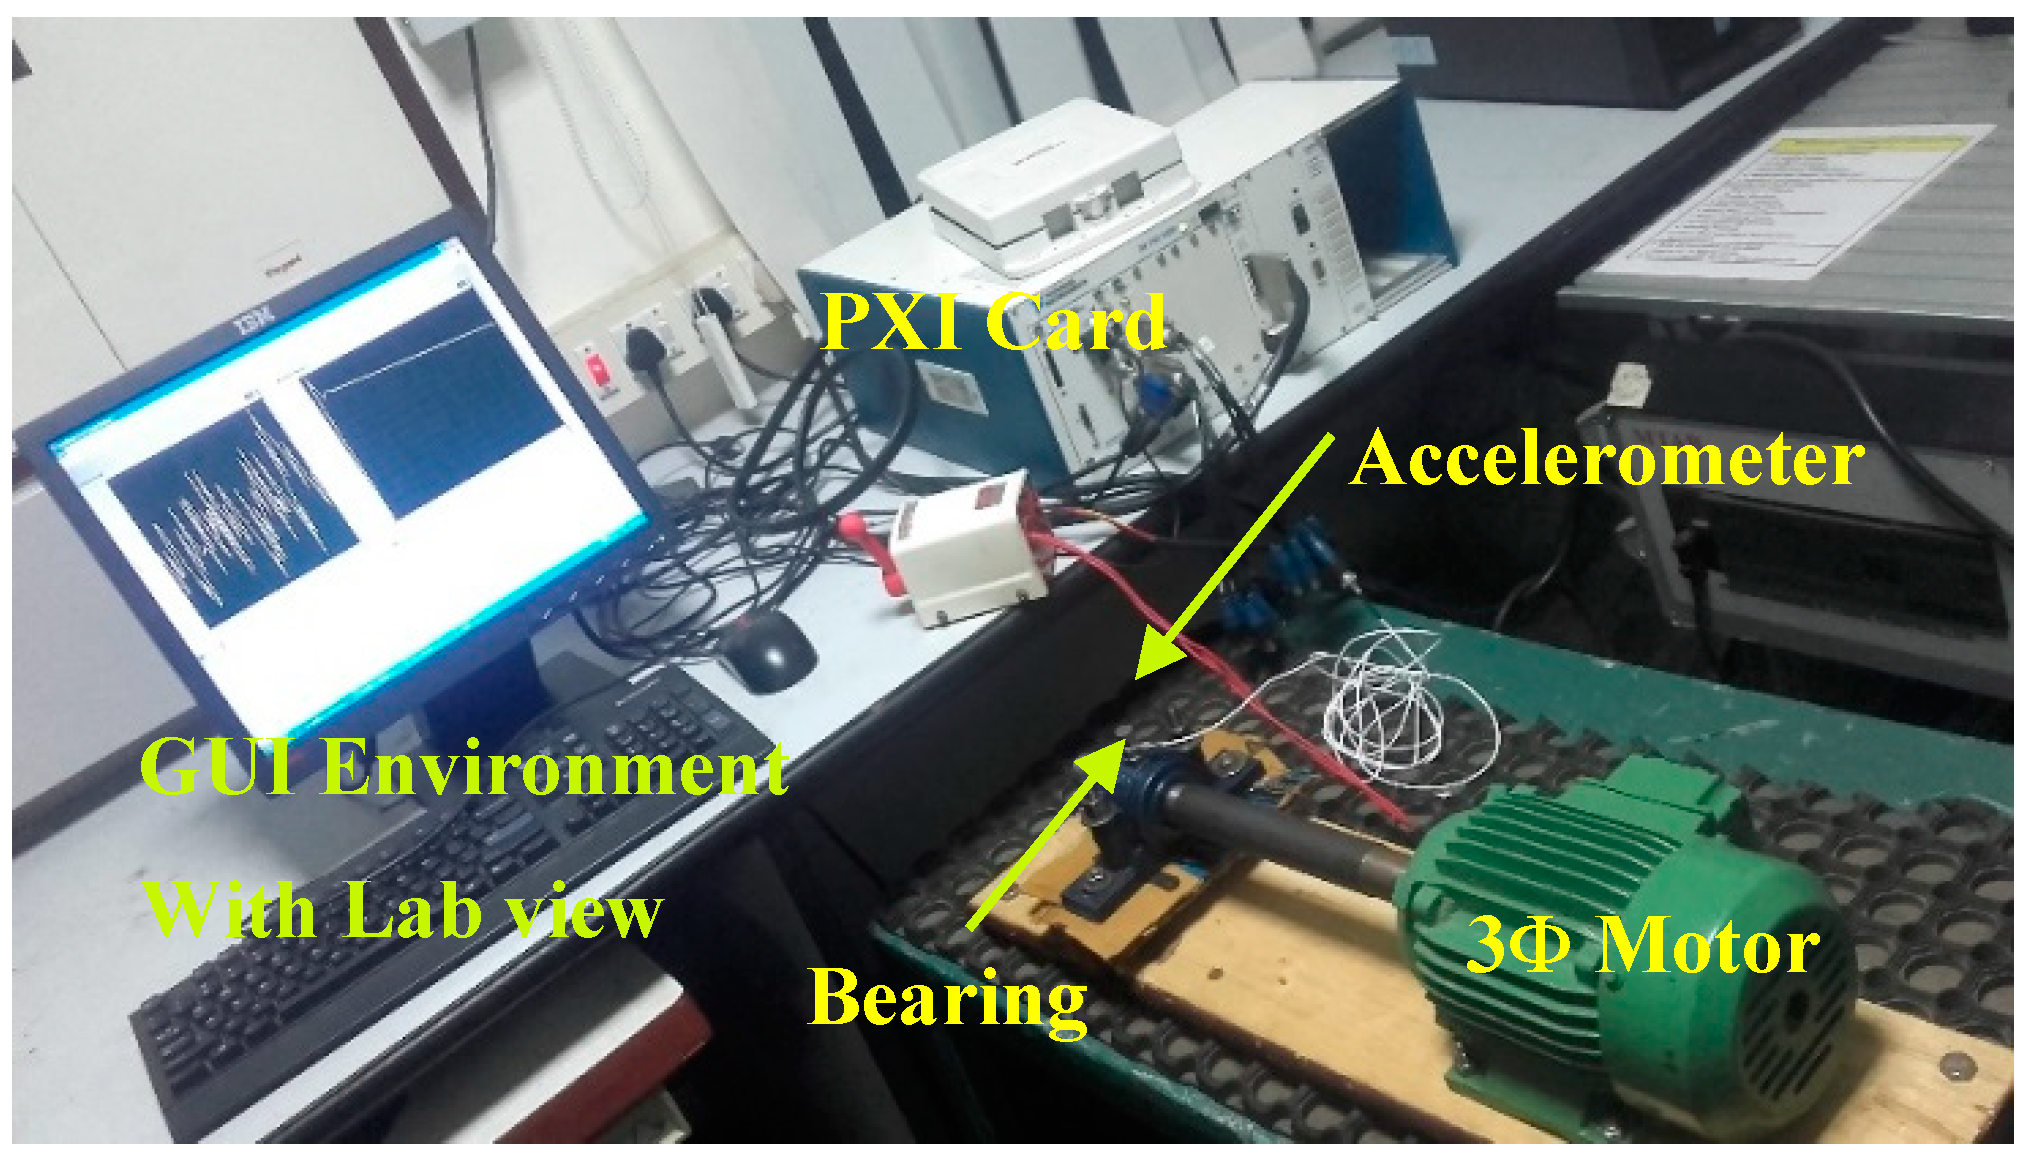
2. Experimental Arrangement

In the present work, a test rig is developed for conducting the vibration measurements for the standard roller element ball bearing as shown in Figure 1. The test rig comprises a three-phase 0.5 HP AC motor-driven shaft bearing mechanical system, shaft coupling, roller element ball bearing and bearing housing.
The specifications of the ball bearing are provided in Table 1. In order to understand the defects at the early stage, a cut of 0.5 mm was created using electro-discharge machining on the inner race, the outer race of bearing.
In this work, an accelerometer (model: Kistler-Type 8730A500, Kistler Instrument Corp., NY, USA) with a sensitivity of 10 mV/g and an acceleration range of ±500 was mounted on the bearing housing to acquire the acceleration signals from the bearing. PC based Data Acquisition (DAQ) system consisting of LABVIEW software is used to obtain vibration signals for No-Fault (NF) and different types of faulty bearings such as Inner Race Fault (IRF), Outer Race Fault (ORF) and Ball Fault (BF). In the present work, the length of the signal consisting of 120,000 data are collected for each bearing conditions such as no fault, Inner race fault, outer race fault and ball fault at a sampling rate of 12 kHz for the duration of 29 s and stored it in PC for further processing. The acquired vibration signals from the test rig are shown in Figure 2. The collected signals are divided into bins containing 10,000 samples for feature extraction and analysis of bearing faults.
A closer view of the acquired vibration signal for different bearing conditions is shown in Figure 3. It can be noticed that vibration signal for the healthy bearing is periodic with low magnitude peaks and relatively large amplitude of dispersed and non-periodic peaks are seen for inner race defect. Vibration signal for the ball defect and outer race defect shows relatively high amplitude vibration with chaos and intermittent behavior.
As the faults in bearing components such inner race, outer race and ball provides an unknown impulse response in the acquired vibration signal, there are changes in the magnitude of energy at different frequency bands related to these faults [26], and it requires further analysis of vibration data for bearing fault detection and classification.

3. Proposed Methodology for Bearing Fault Classification

In the present work, time-frequency domain technique, i.e. wavelet transform is used for analyzing and detecting the bearing faults due to the non-stationary and nonlinear characteristics of the vibration signals. Figure 4 depicts the schematic diagram of the proposed method for fault classification of rolling bearing.
The steps involved in the proposed method are given below and they are explained in the subsequent sections:
(i)
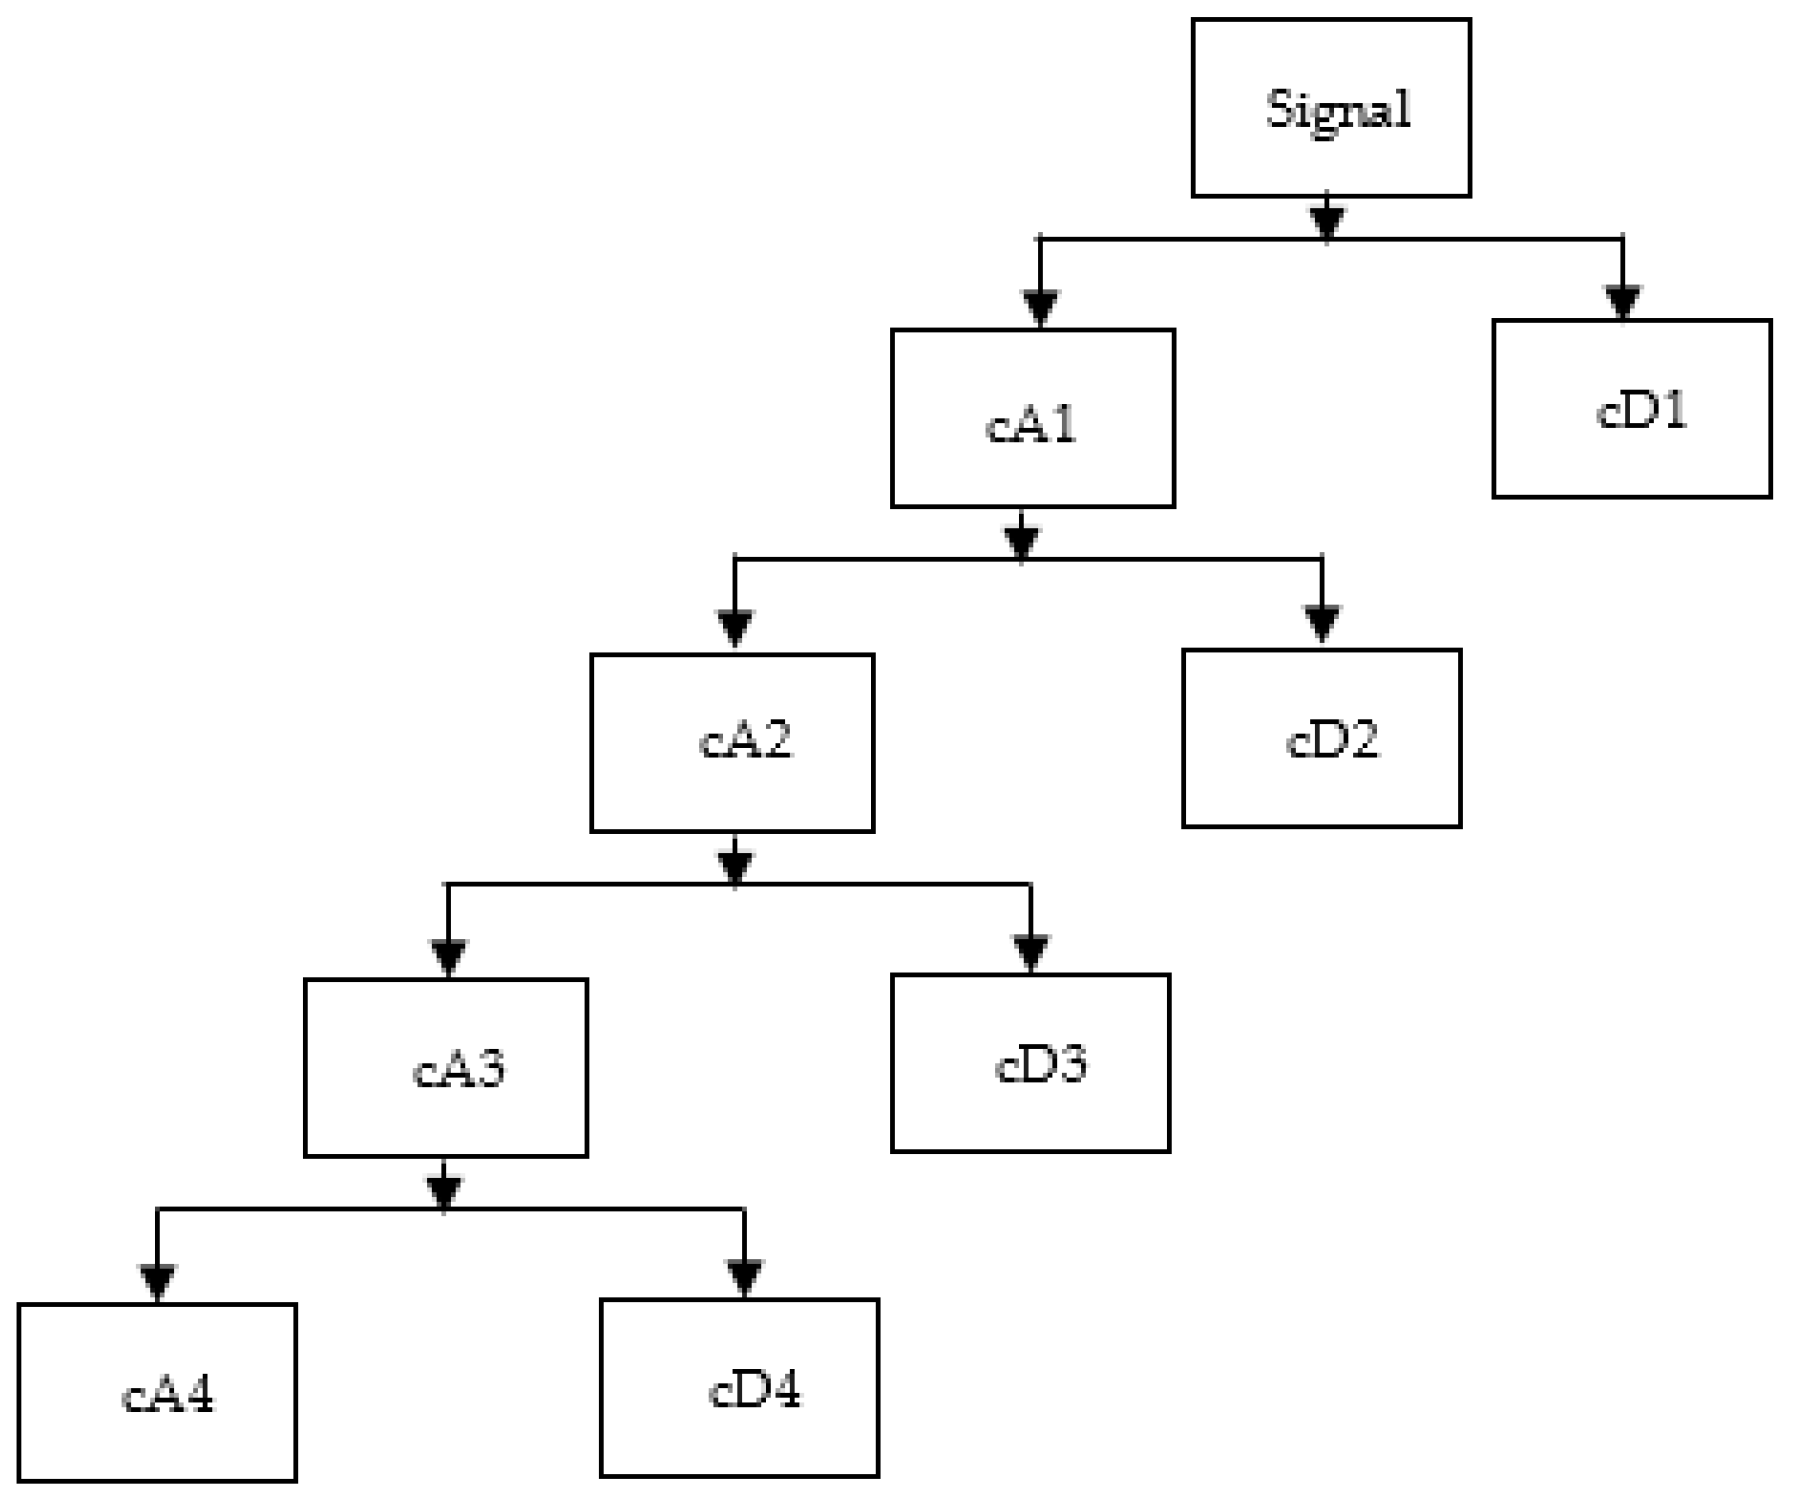
Decomposing the vibration signal into N levels using filtering and decimation to obtain the approximation and detailed coefficients;
(ii)
Extracting the statistical features from the DWT coefficients;
(iii)
Fuzzy C-Means clustering approach for grading the bearing faults using suitable fuzzy membership functions.

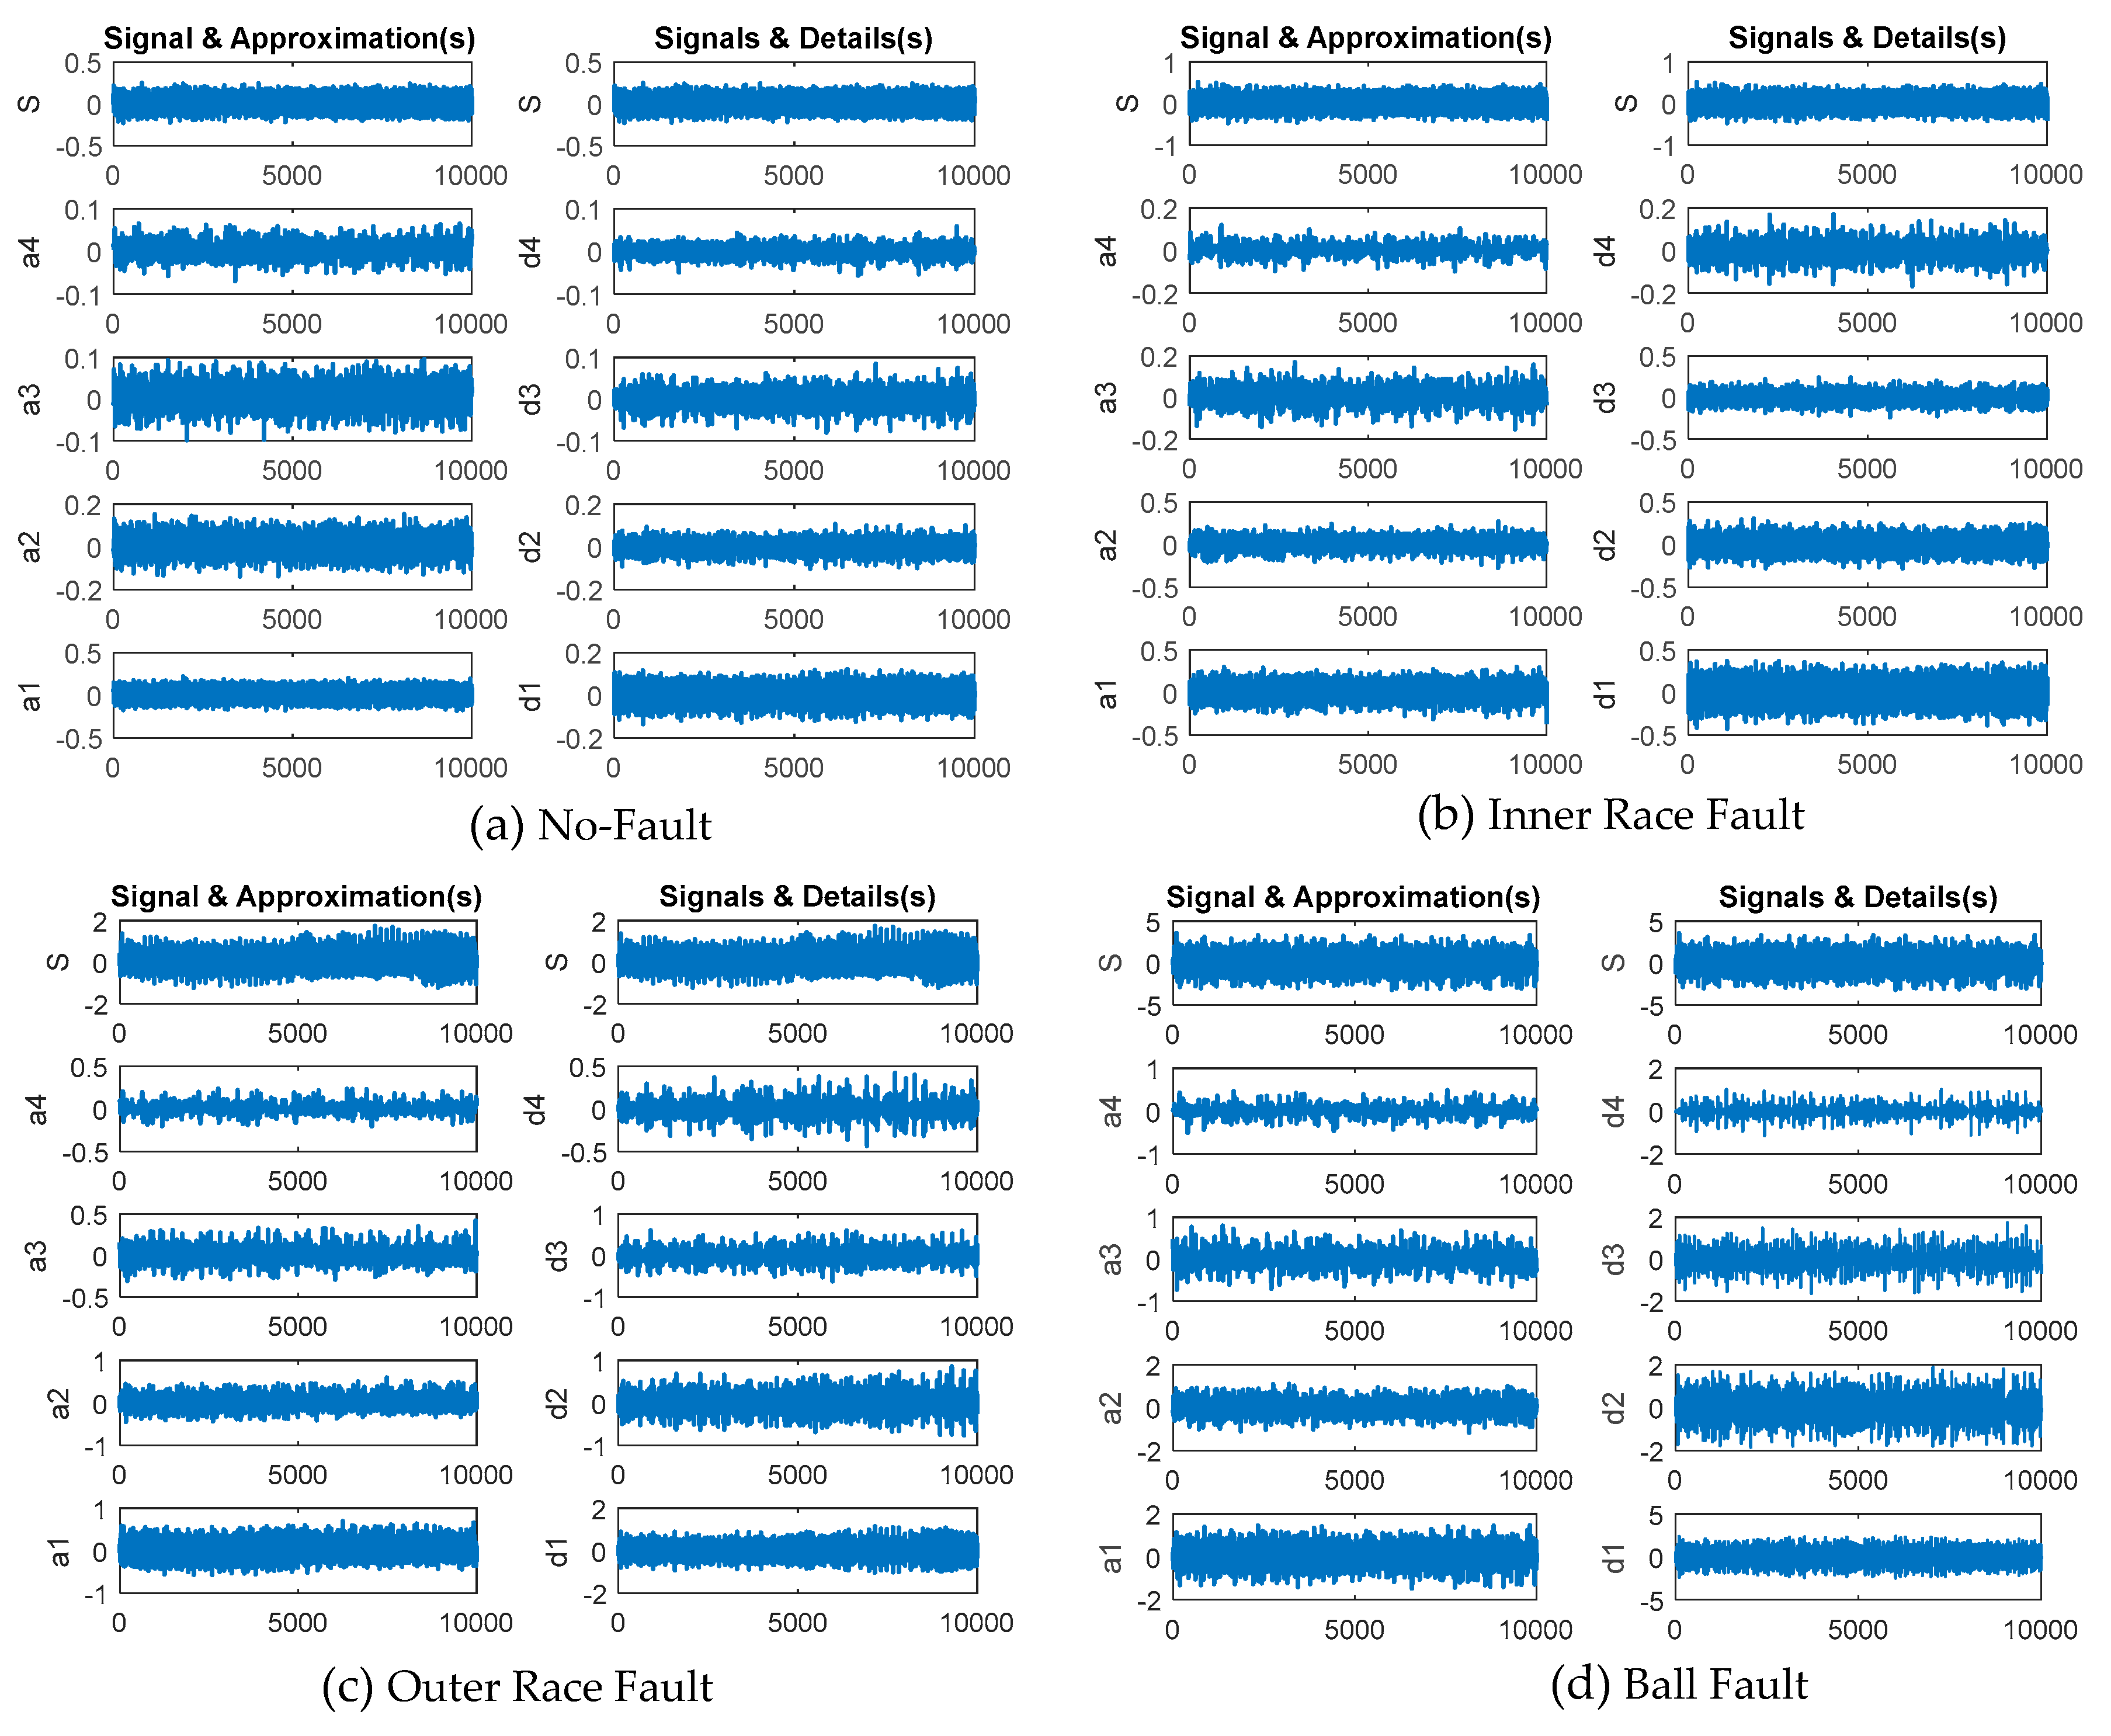
3.1. Decomposition of Vibration Signal Using Discrete Wavelet Transform

Wavelet is defined as a vanishing wave in an oscillatory motion which has energy concentrated with time. The continuous wavelet transform (CWT) of a time varying signal f(t) is identified as the sum over all time of the signal multiplied by scaled, shifted versions of the wavelet function Ψ(t) as given by Equation (1).
W Ψ ( a , b ) = x ( t ) . Ψ a , b ( t ) d t
Here the parameters ‘a’ and ‘b’ are the translation and dilation of the wavelets. By generating daughter wavelets   ψ a , b ( t ) from the mother wavelet ψ ( t ) more time-frequency information can be extracted, which is limited to finite space.
ψ a , b ( t ) = 1 a ψ ( t b a )                
The Discrete wavelet transform (DWT) is derived from the discretization of CWT (a,b) and the most common discretization is dyadic, given also by McFadden and Smith [27] as, DWT uses the power of 2 as scale and position values where a = 2 j and b = k 2 j .
ψ a , b ( t ) = 1 2 j ψ ( t k 2 j 2 j )
The DWT of a signal is calculated by passing it through a series of filters. The signal samples are decomposed by passing through a low pass filter and also a high pass filter in parallel. This decomposition process is iterative with successive approximations such that signal is broken down into many lower resolution component. Here the approximation coefficients and detail coefficients are obtained from the low pass filter and high pass filter respectively and it is shown as a decomposition tree as shown in Figure 5.
In the present work, statistical features are extracted from DWT coefficients (cD1, cD2, cD3, cD4) and (cA1, cA2, cA3, cA4) to detect the bearing faults and it is explained in the next section.

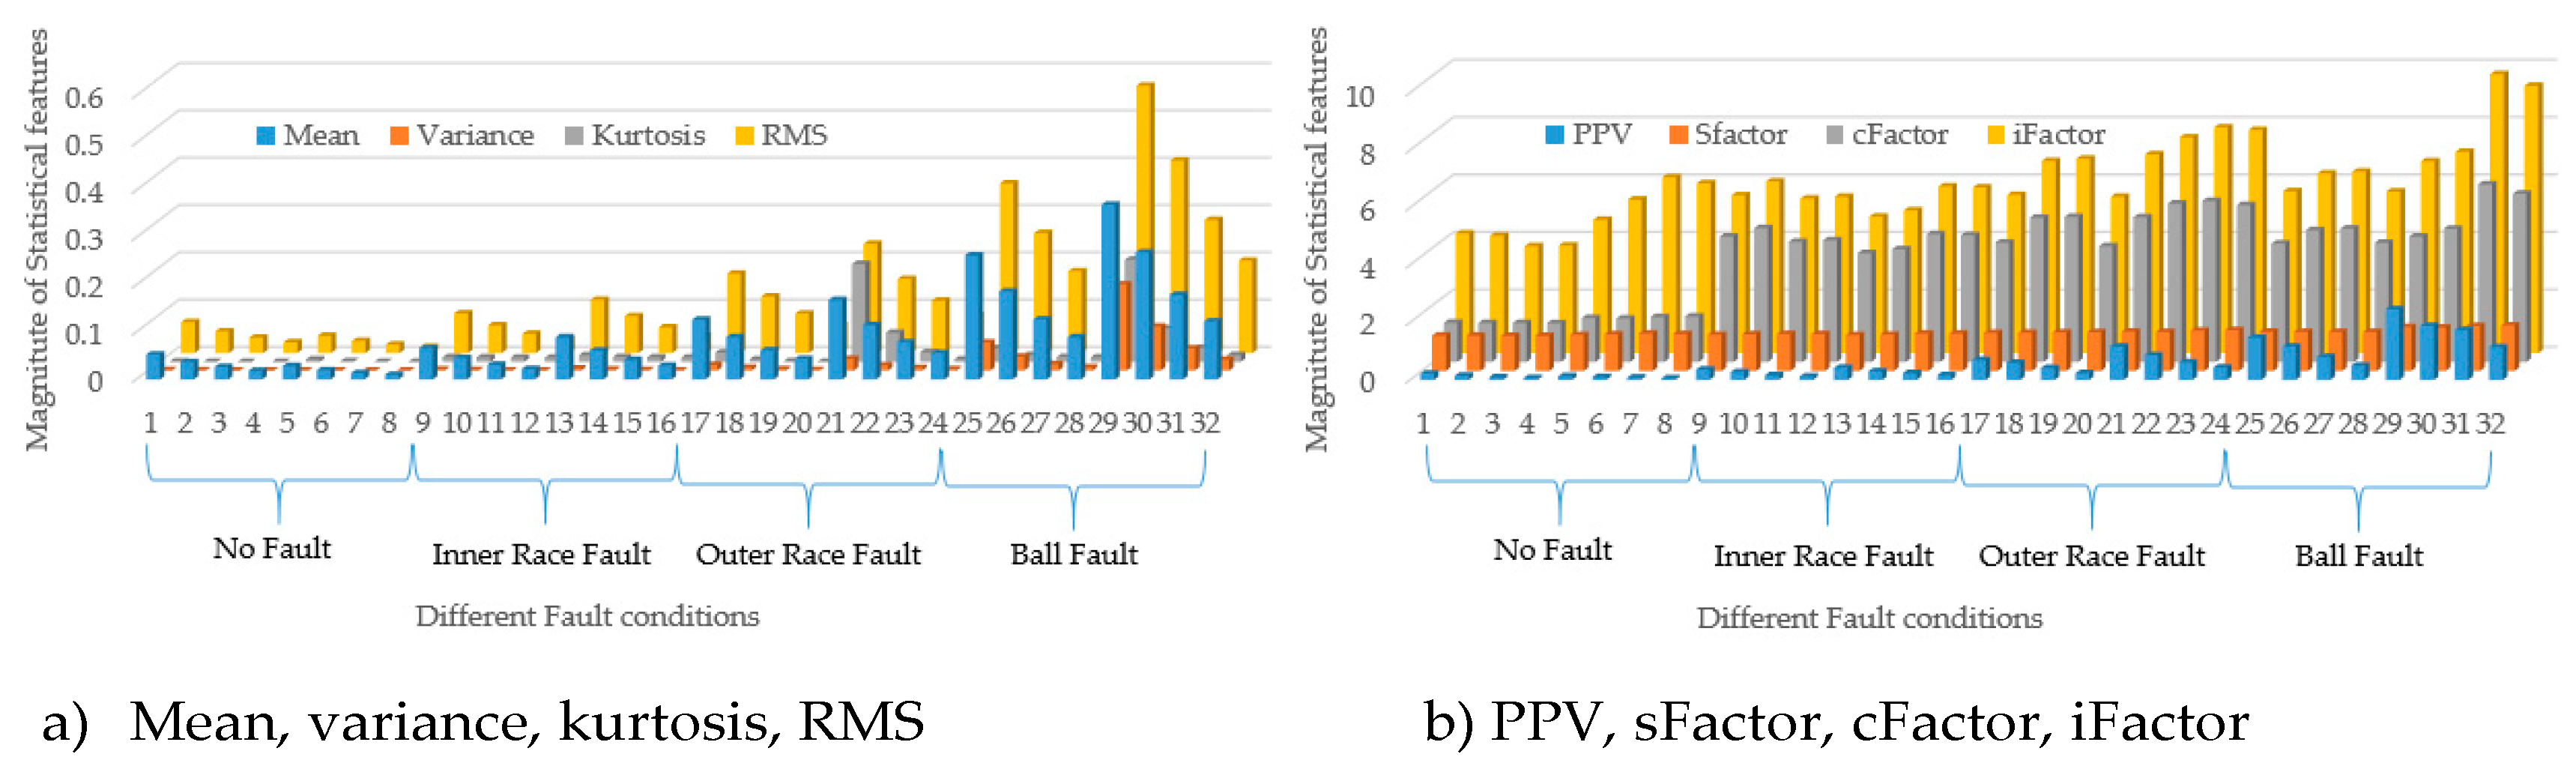
3.2. Extraction of Statistical Features for Different Bearing Faults Using DWT Coefficients

As the statistical features such as Mean, Variance, kurtosis value (KV), Root Mean Square value (RMS), peak-peak value (PPV), shape factor (SF) crest factor (CF), impulse factor (IF) are sensitive to the bearing faults of impulsive in nature, they are extracted from detail and approximation coefficients of wavelet transform [28]. Table 2 highlights the standard formula used for calculating the statistical features [12].
In the present work, the statistical features X = {x1, x2, …, xn} are extracted from detailed coefficients (cD1, cD2, cD3, cD4) and approximate coefficients (cA1, cA2, cA3, cA4) of wavelet transform respectively and the sample values are shown in Table 3.

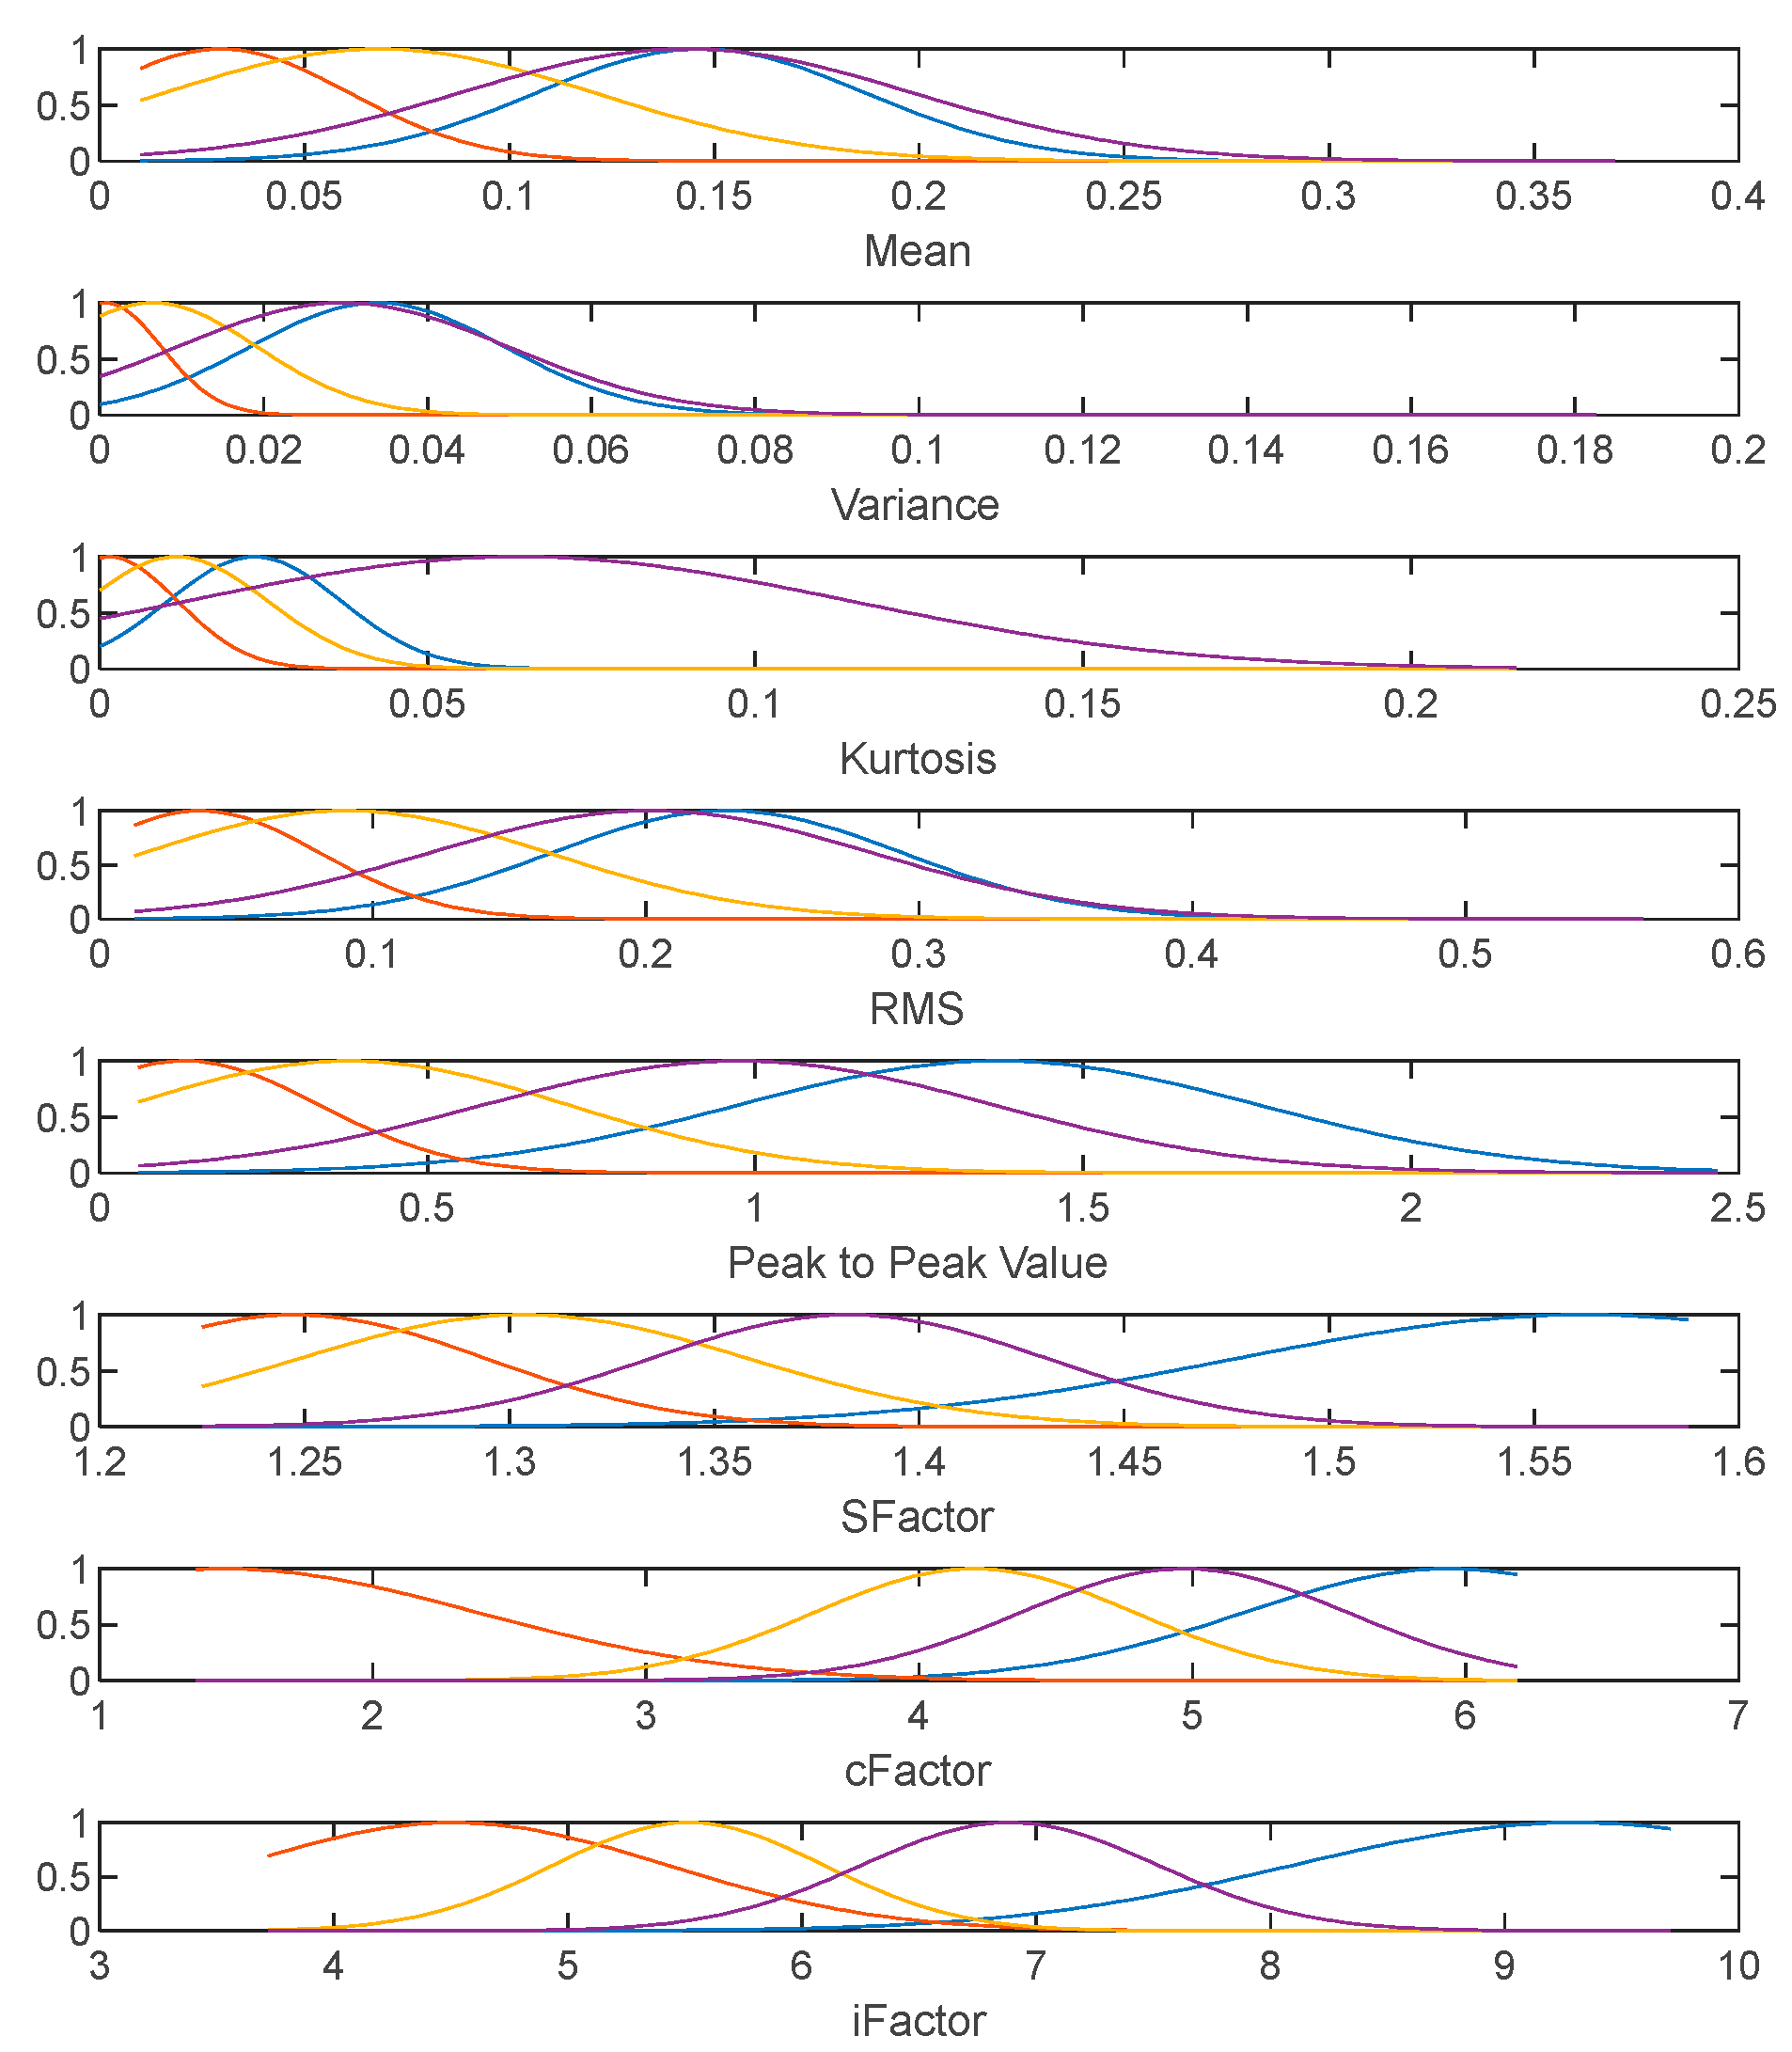
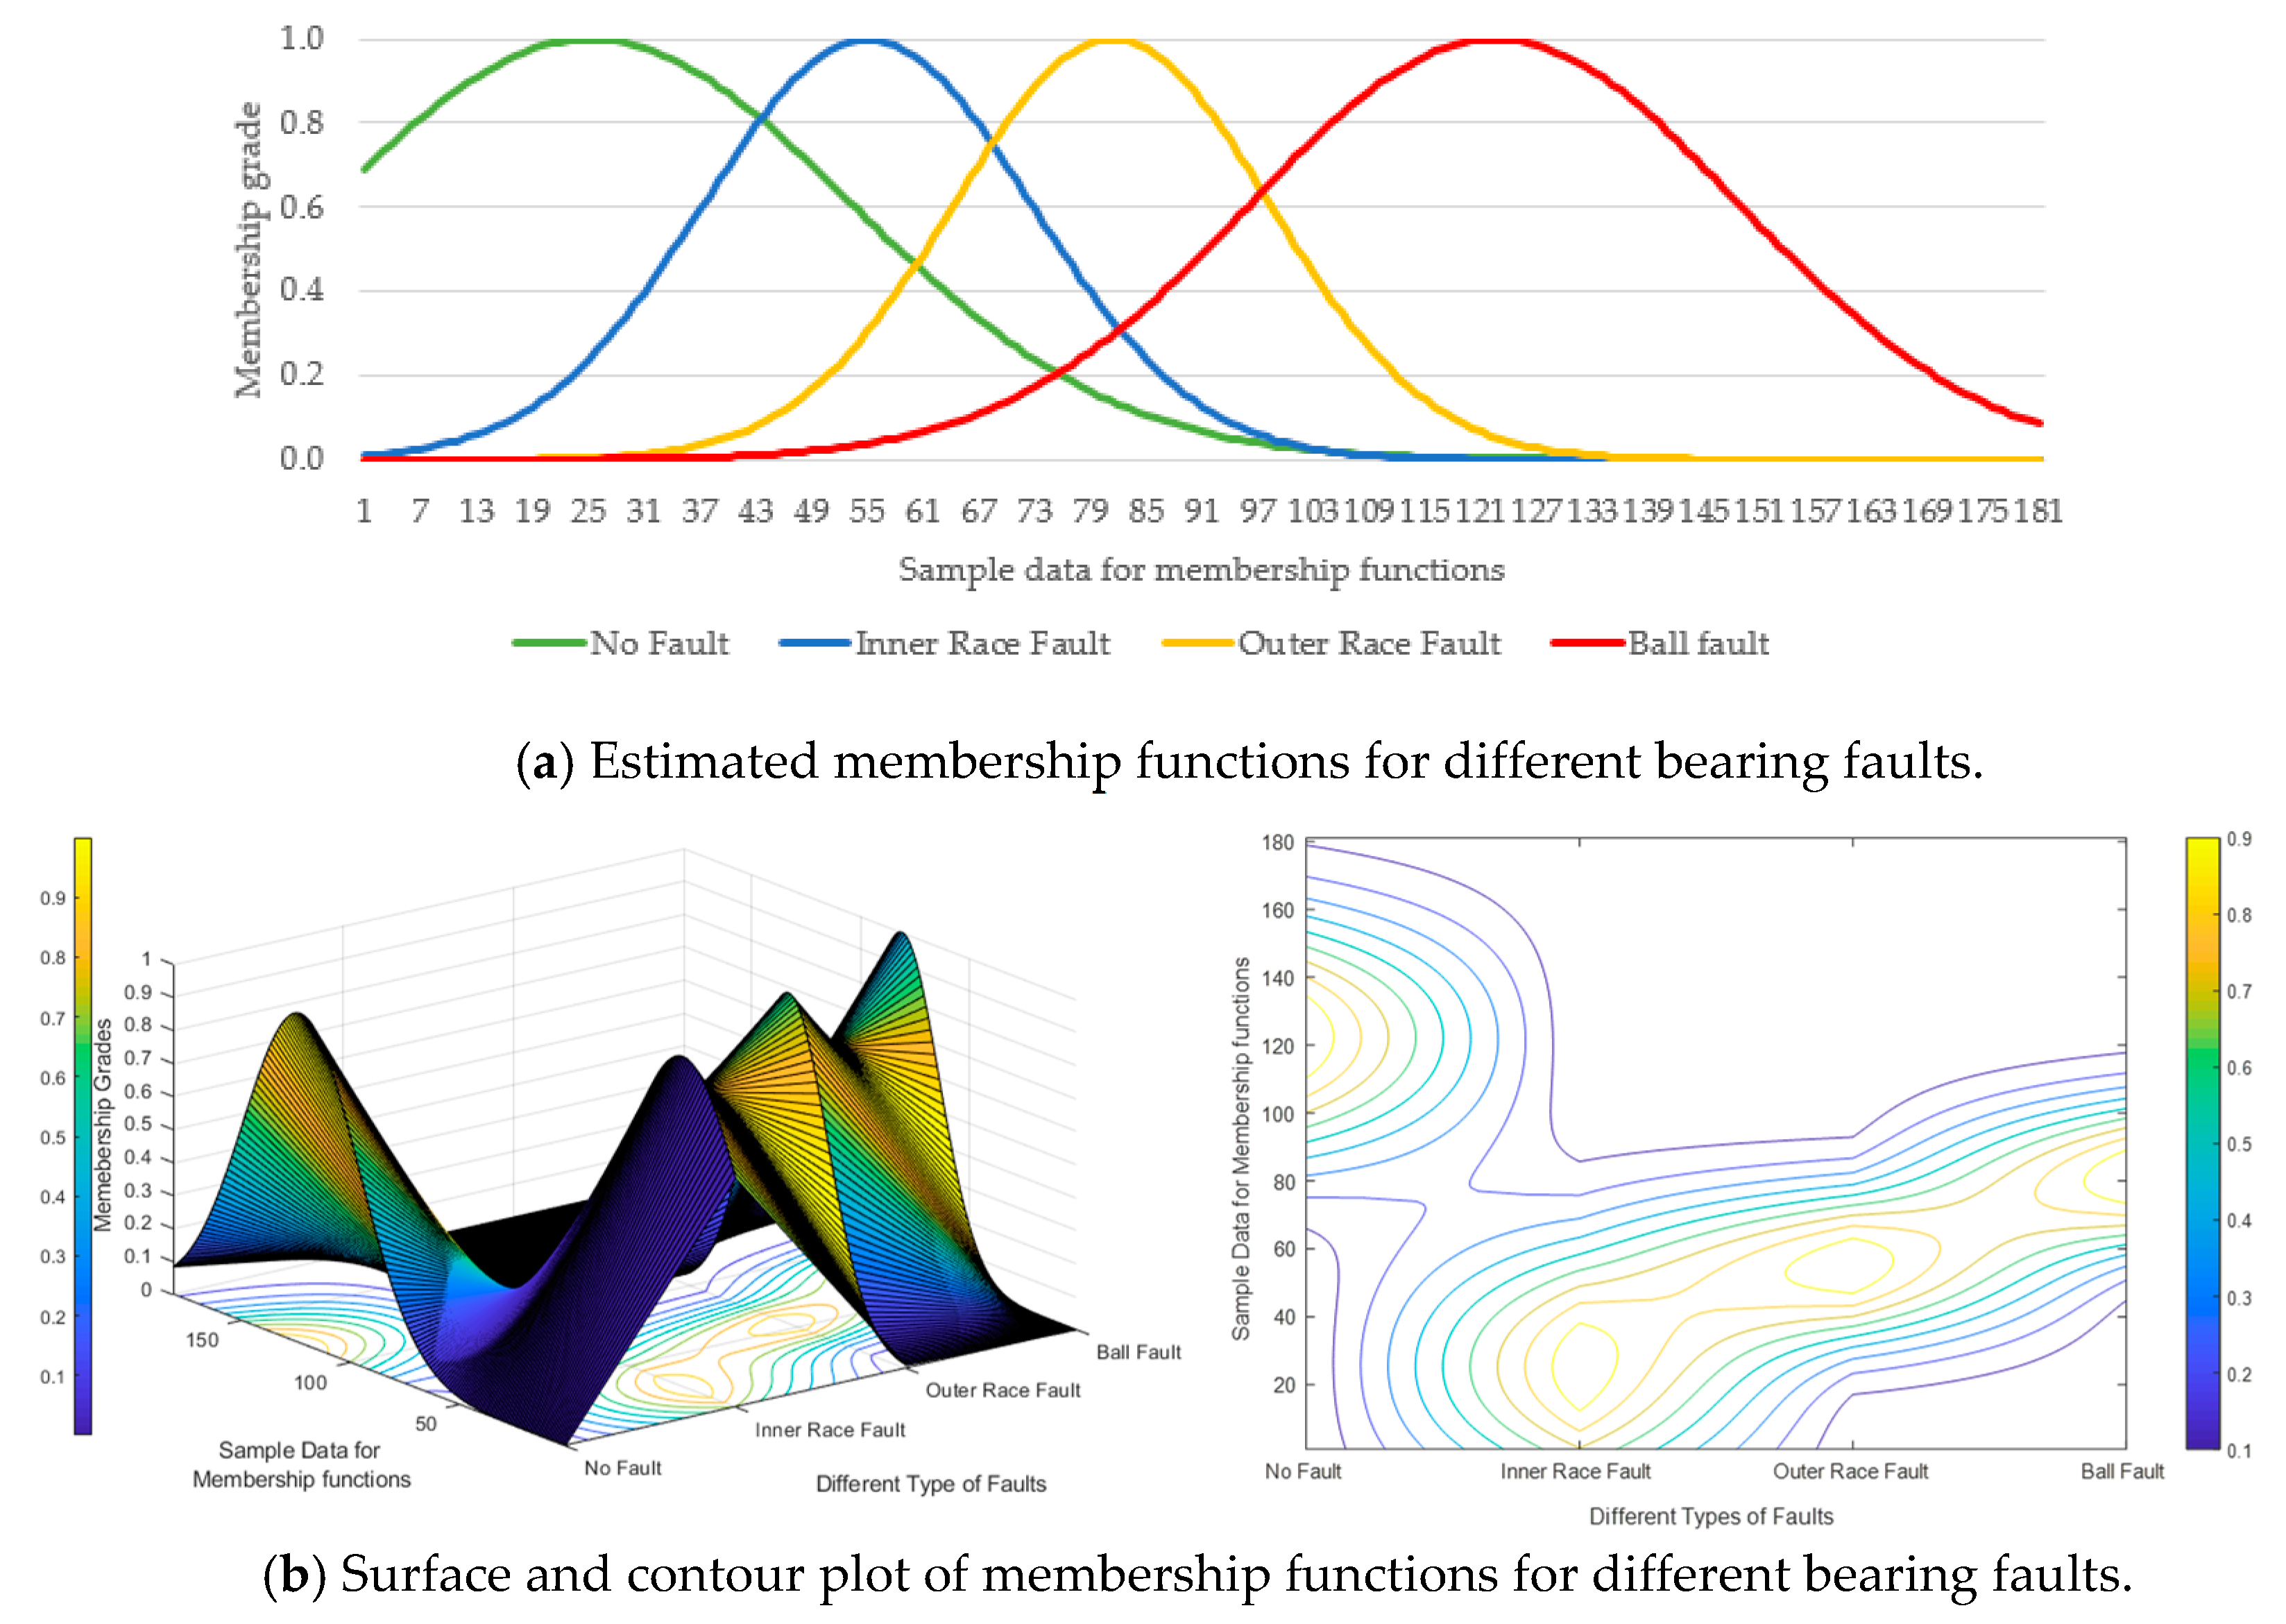
3.3. Fuzzy C-Means Clustering (FCM) of Extracted Statistical Features

As the incipient bearing faults are difficult to detect due to the complexity of the small signal-to-noise ratio of the vibration signals, the crisp clustering fails as the boundaries among the clusters are vague and ambiguous for different bearing faults. Hence FCM is applied for classification of bearing faults in the present work. It is one of the most common clustering algorithms which minimize the Euclidean distance between each sample and all clustering centers using an objective function [29]. Let X = {x1, x2, …, xn} be statistical feature vector of the given dataset with ‘n’ samples to be analyzed, which can be divided into c classes. Here V = {v1, v2, …, vc} be the set of centers of clusters in X dataset in p dimensional space. Where n is the number of objects, p is the number of features, and c is the number of partitions or clusters. Each UMfc is called a Fuzzy C-partition of X; Mfc is the Fuzzy C-partition space associated with X.
M f c = { U V c n | u i j [ 0 , 1 ] i , j ; i = 1 c u i j = 1 j ; i = 1 c u i j > 0 i }
Here uij = uj (xj) is called the grade of membership of xj in the fuzzy set uj. Consider the following subset of V c n . For each integer c , 2 c , < n , let V c n be the vector space of c × n matrices with entries in [0,1], and let uij denote the ijth elements of any U V c n .
In order to obtain the optimum fuzzy partition, least squares objective function J is formulated and must be minimized as given by Equation (5)
J ( U , V ) = k = 1 n i = 1 c ( u i k ) m x k v i 2
Here m is a fuzzifier parameter (or weighting exponent) whose value is chosen as a real number greater than 1 (1     m <   ). While m approaches to 1 clustering tends to become crisp but when it goes to the infinity clustering becomes fuzzified and usually m is fixed as 2U = {uik} is the membership function, with uik   [0,1], which denotes the degree of membership of the k-th pattern and i-th cluster centers; V = {V1, V2, …Vc} is a vector of c cluster. These vi are interpreted as clusters defined by their companion U matrix and the optimal solution is found to be:
u i k = 1 j = 1 c ( X k V i X k V j ) 2 / ( m 1 ) , i , k
V i = k = 1 n ( u i k ) m X k k = 1 n ( u i k ) m , i
Suppose that under a given conditions, a clustering center was determined by the feature of training data sets. Then all subsequent observations can be using the following equation
u k 0 = 1 j = 1 c ( X o V i X o V j ) 2 / ( m 1 ) , i , k
where uk0 is the fuzzy grade of the current observation being assigned to kth pattern and X0 is the current observation. The iteration process will terminate when, the max x i j = { | U ( k + 1 ) U ( k ) | } < ε , where ε, the criteria between 0 and 1 for termination and k are the iteration steps. For the above feature sets, the cluster centers are calculated using the Equations (6) and (7). Using the calculated cluster centers and the formulated membership functions for the statistical feature vectors, fuzzy inference rules are formulated for the classification of bearing faults.

3.4. Generation of Fuzzy Rules Using Cluster Centers

In the present work, a supervised fuzzy rule formation approach is followed for the classification bearing faults based on the estimated cluster centers [30,31]. For the given input statistical feature vectors, output classes are labeled as shown in Table 3. Mamdani type fuzzy rules are extracted based on the calculated vector of centroids of ‘c’ clusters V = {V1, V2, …, Vc} using FCM for given feature vector X of different bearing faults.
If cluster center xi is found to be in the group of data for class ‘c’, then fuzzy sets on Xi, For an input vector in input space Xp, there exist p variables x1, x2, …, xp, which are defined in the interval Xi = [ai, bi], ai < bi, Aij are developed for each cluster. In this work, Gaussian function is used as the membership function for the input feature vectors and the output classes. Based on the estimated cluster center, the following fuzzy rule was extracted and assigned to class ‘c’: Rule i: if X1 is Aij and X2 is Aij … and Xp is Aij, then the bearing fault class is ‘c’.
Where Xj is the j-th input feature and Aij is the membership function in the i-th rule associated with the j-th input feature. Aij is the membership function of the i-th rule. Actually, input data vector is ascribed to class ‘c’ if fuzzy rules determine vector’s higher membership in class ‘c’.

4. Results and Discussion

In order to validate the proposed detection and clustering methodology, experimental data acquired from the experimental setup for different bearing fault conditions and the results are presented in this section. The vibration signal of bearings is decomposed using 4th order Daubechies wavelet (‘db4’) and statistical features are extracted from the wavelet coefficients. Further, the cluster centers are identified from the extracted statistical features; fuzzy rules are extracted for the labeled data of statistical features of different bearing faults. A fuzzy rule base and inference system is developed in MATLAB software environment and results are validated for test data.

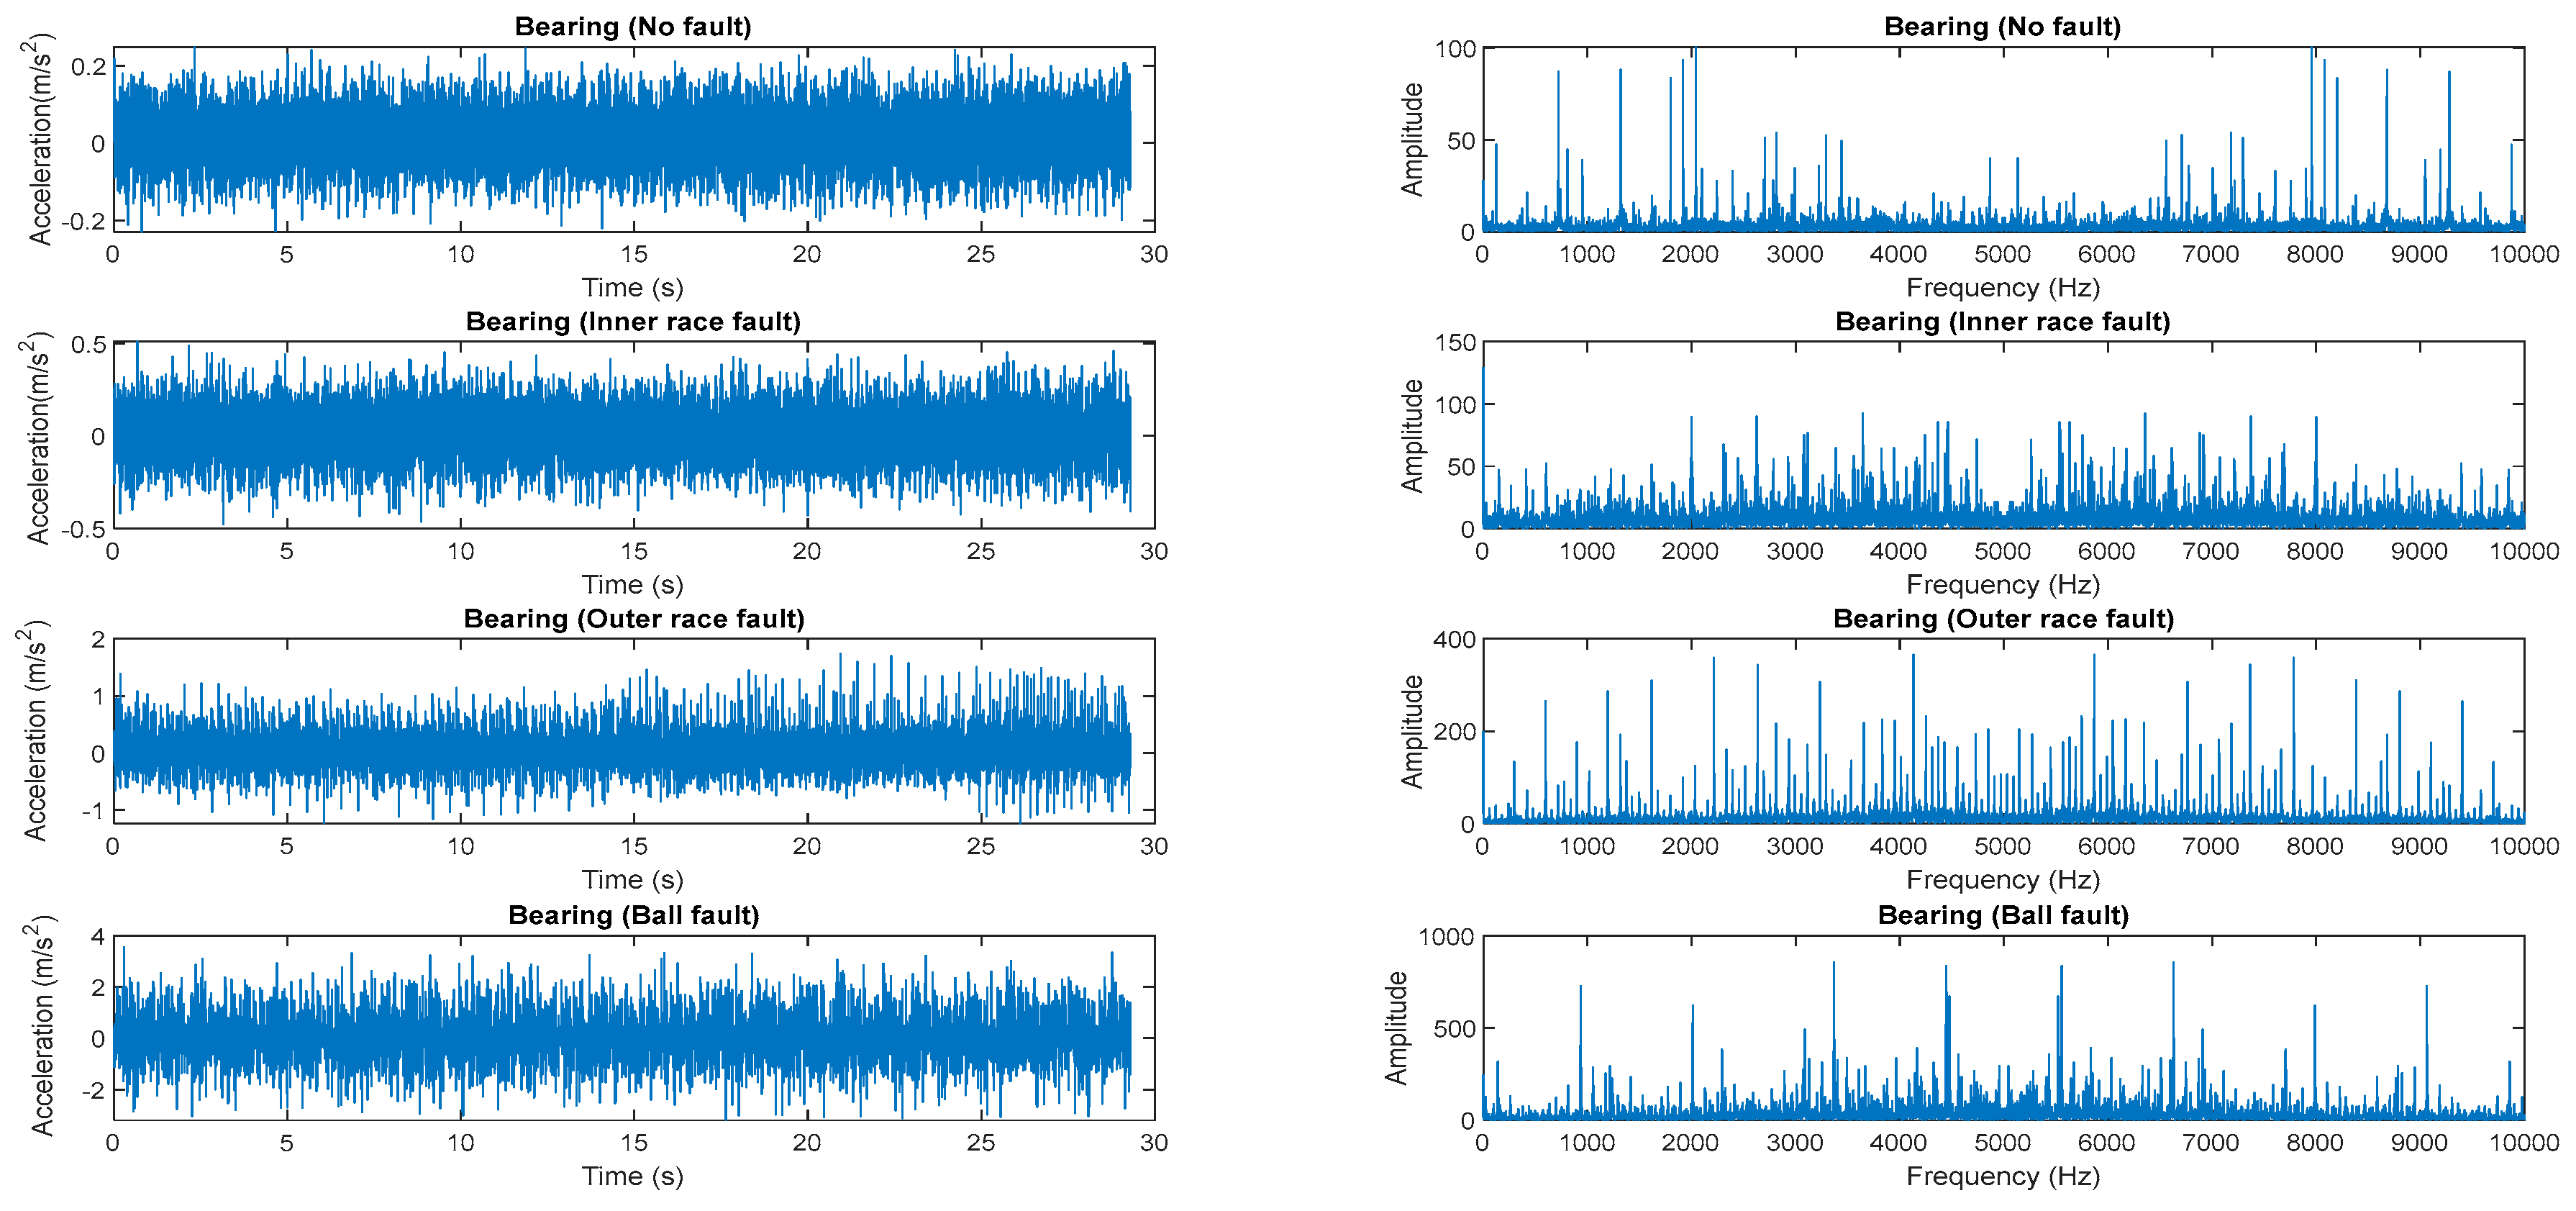
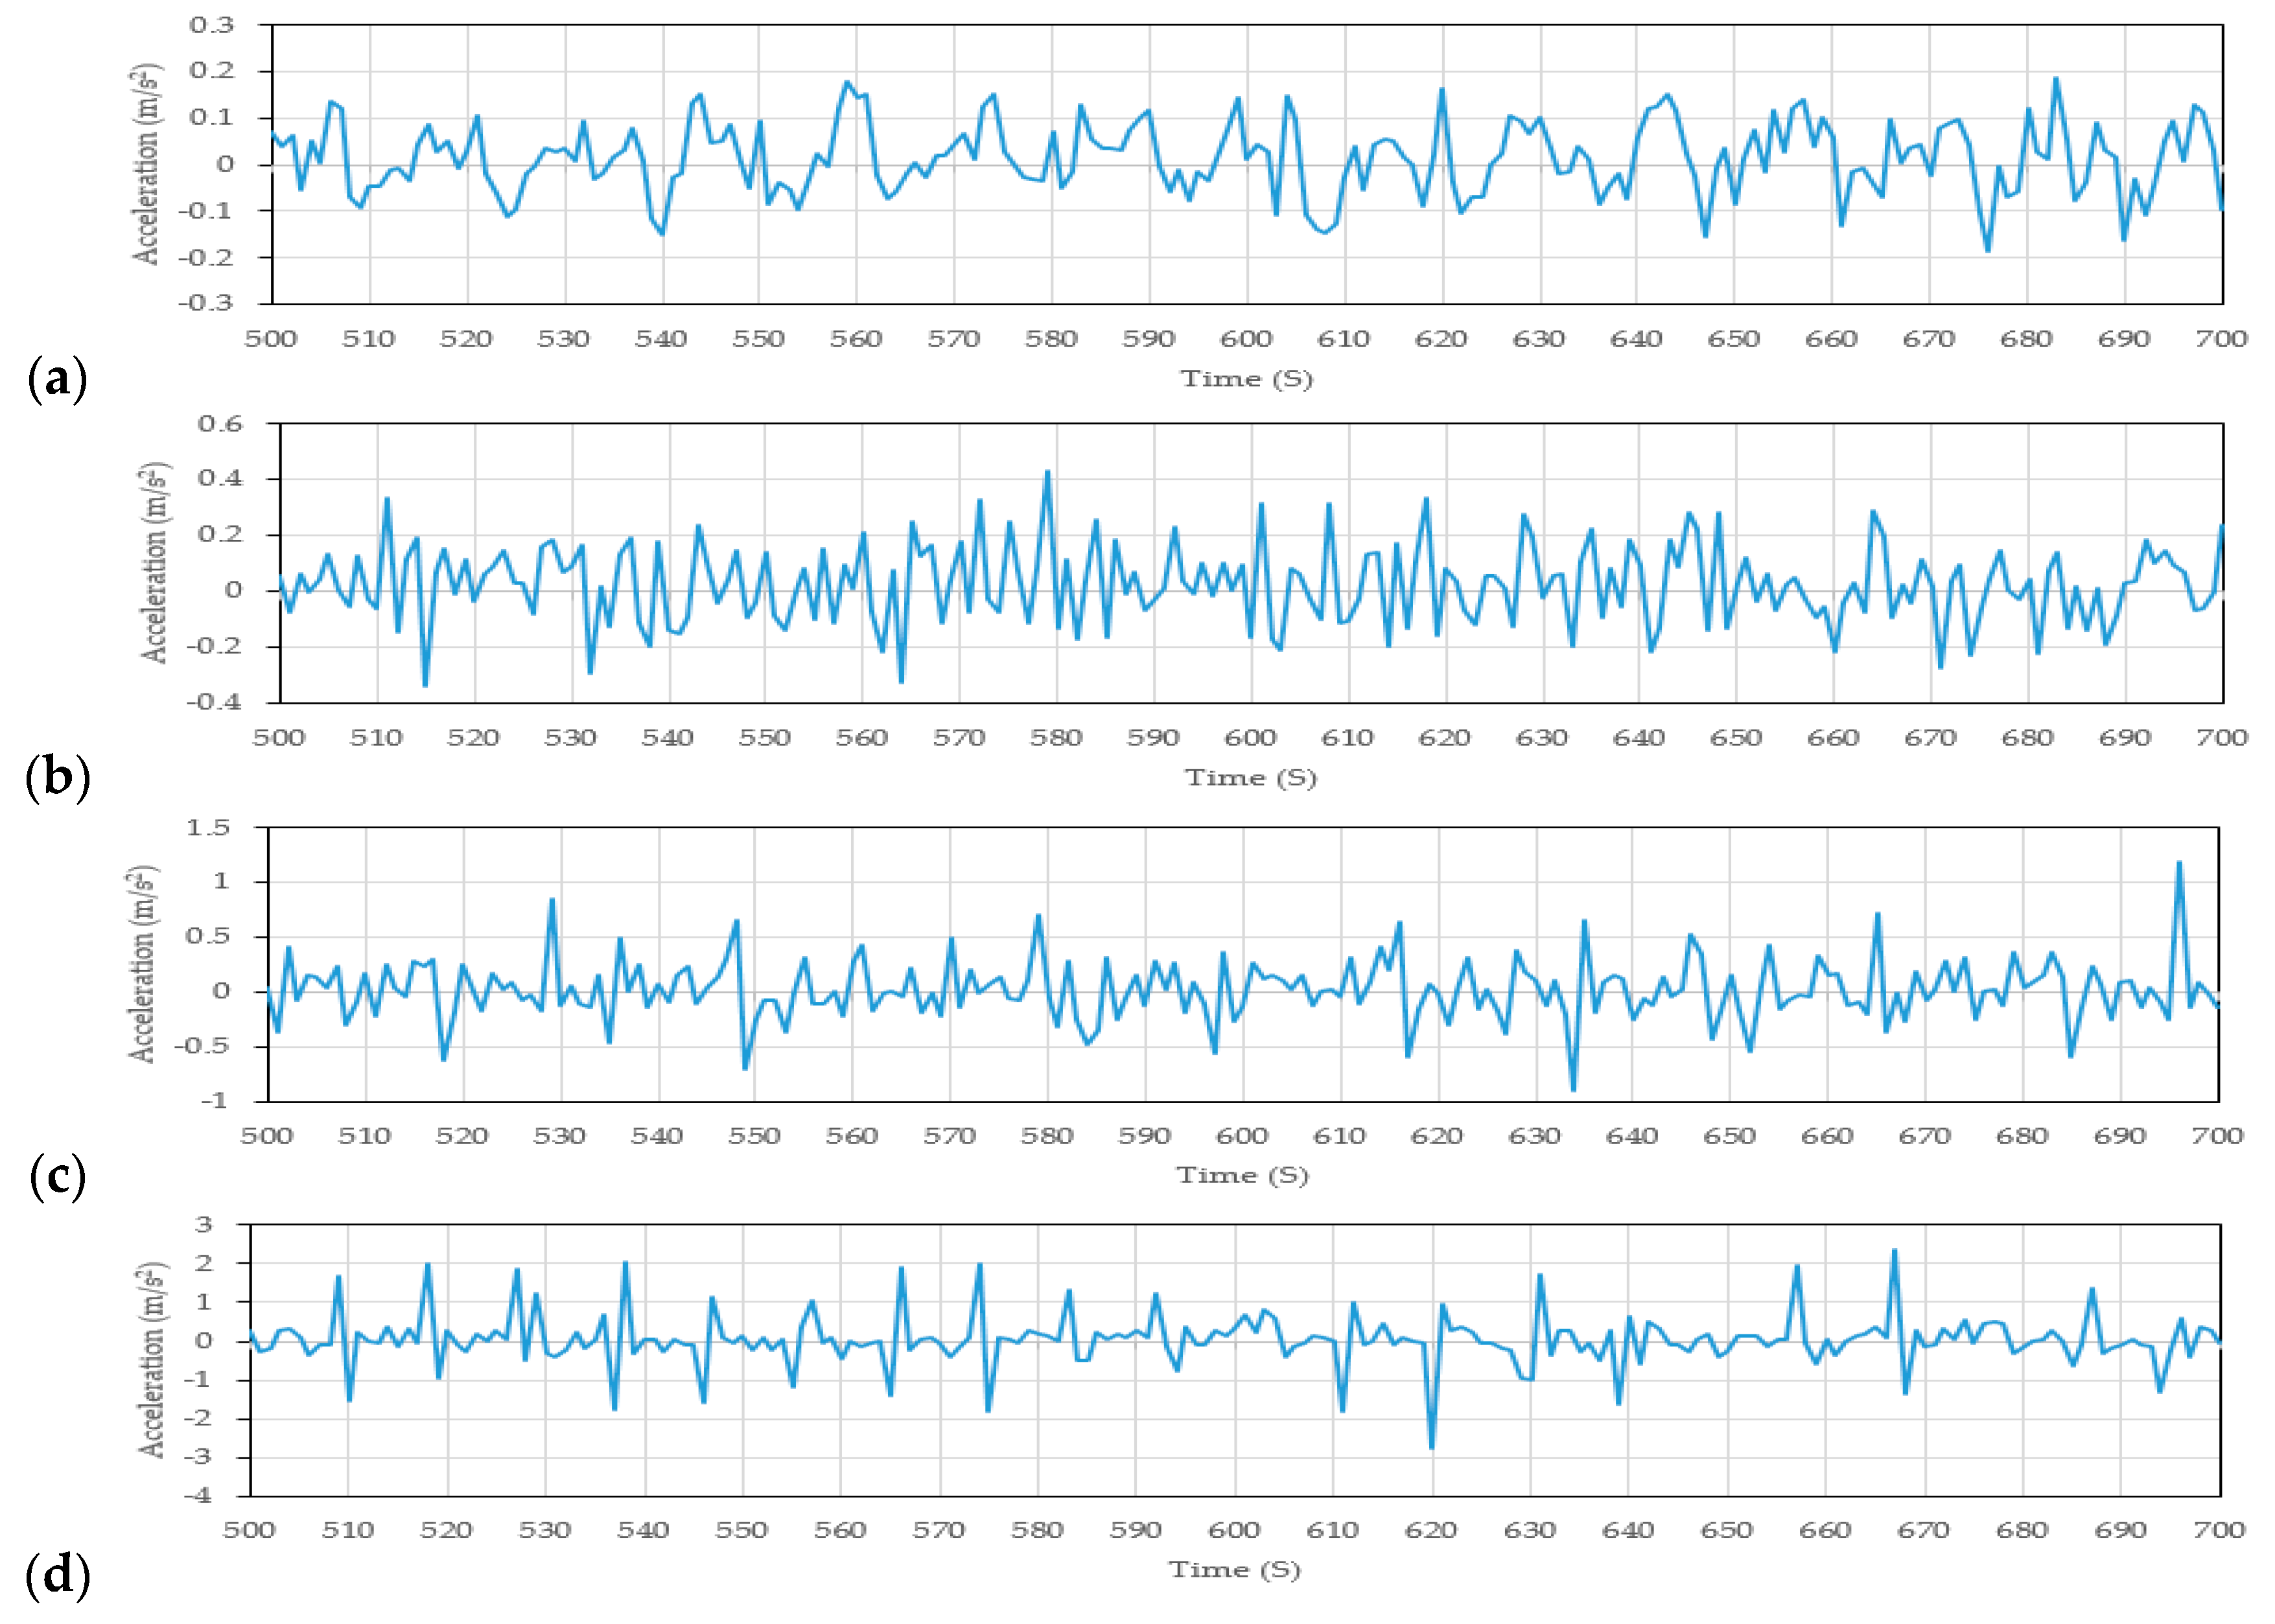
4.1. Wavelet Decomposition of Vibration Signal with Different Bearing Faults

The vibration data for each classes of bearing faults were decomposed using wavelet transform and wavelet coefficients are calculated as it provides a compact representation of energy distribution of the vibration signal in time and frequency domain. Approximate (cA) and detailed (cD) coefficients of wavelet transform at each level of decomposition are graphically represented in Figure 6.
It is noticed from Figure 6 that the decomposed signal obtained from the no-fault bearing has less magnitude which ranges from –0.1 to 0.1 for the approximation coefficient in 4th level. At the same time, it is found that ball fault has a maximum magnitude range from −2 to 2; whereas the other faults such as inner race fault and outer race fault have the magnitude range −0.2 to 0.2 and −0.5 to 0.5 respectively. From these results, it is evident that the magnitudes of wavelet coefficients are sensitive to different bearing faults.

4.2. Statistical Feature Extraction Using Wavelet Coefficients

As the feature extraction typically calculates quantitative information about the faults from the decomposed signal, the statistical features are directly calculated from the approximation and detail wavelet coefficients and it is listed for different conditions of the bearings in Table 3. It can be noticed that the magnitude of extracted statistical features such as Mean, variance, kurtosis, RMS show an increasing trend for different faults from wavelet coefficients for the no-fault condition and its magnitude is less as compared to the faulty conditions of the bearings as shown in Figure 7a.
From Figure 7b, it can be identified that the magnitude of statistical feature for iFactor of wavelet coefficients is found to be higher in magnitude as compared to the other statistical features. Magnitude of statistical features is found to be lesser for No fault bearing condition than the ball fault bearing condition. These results show the sensitivity of detailed and approximated coefficients of DWT for identifying the different bearing fault conditions.

4.3. Determination Cluster Centers Using Proposed FCM Method

The clustering centers for the extracted statistical features are calculated using Equation (6) and Equation (7) for four types of bearing conditions and it is shown as a data matrix (8 × 4) in Table 4.
Based on the cluster centers, the membership values are assigned using Gaussian membership function using the Equation (8) for individual statistical features and it is shown in Figure 8.
The variation in membership values using Gaussian membership function for all the experimental data of statistical features are shown in Figure 9a. The surface and contour plot of the gaussian membership function is given in Figure 9b and it clearly shows 4 peaks and zones which describes four bearing faults determined by the fuzzy clustering method. It is also seen that the magnitude of membership values varies depending upon the position of cluster center. The sample numerical values of the membership function of the given statistical feature data for the four different states of the bearing such as no-fault (A), Inner race fault (B), Outer race fault (C) and Ball fault (D) are given in Table 5.
It can be noticed that when the data point is nearer to the cluster center, the magnitude of membership value is higher and reached minimum when it moves further away from the corresponding cluster.

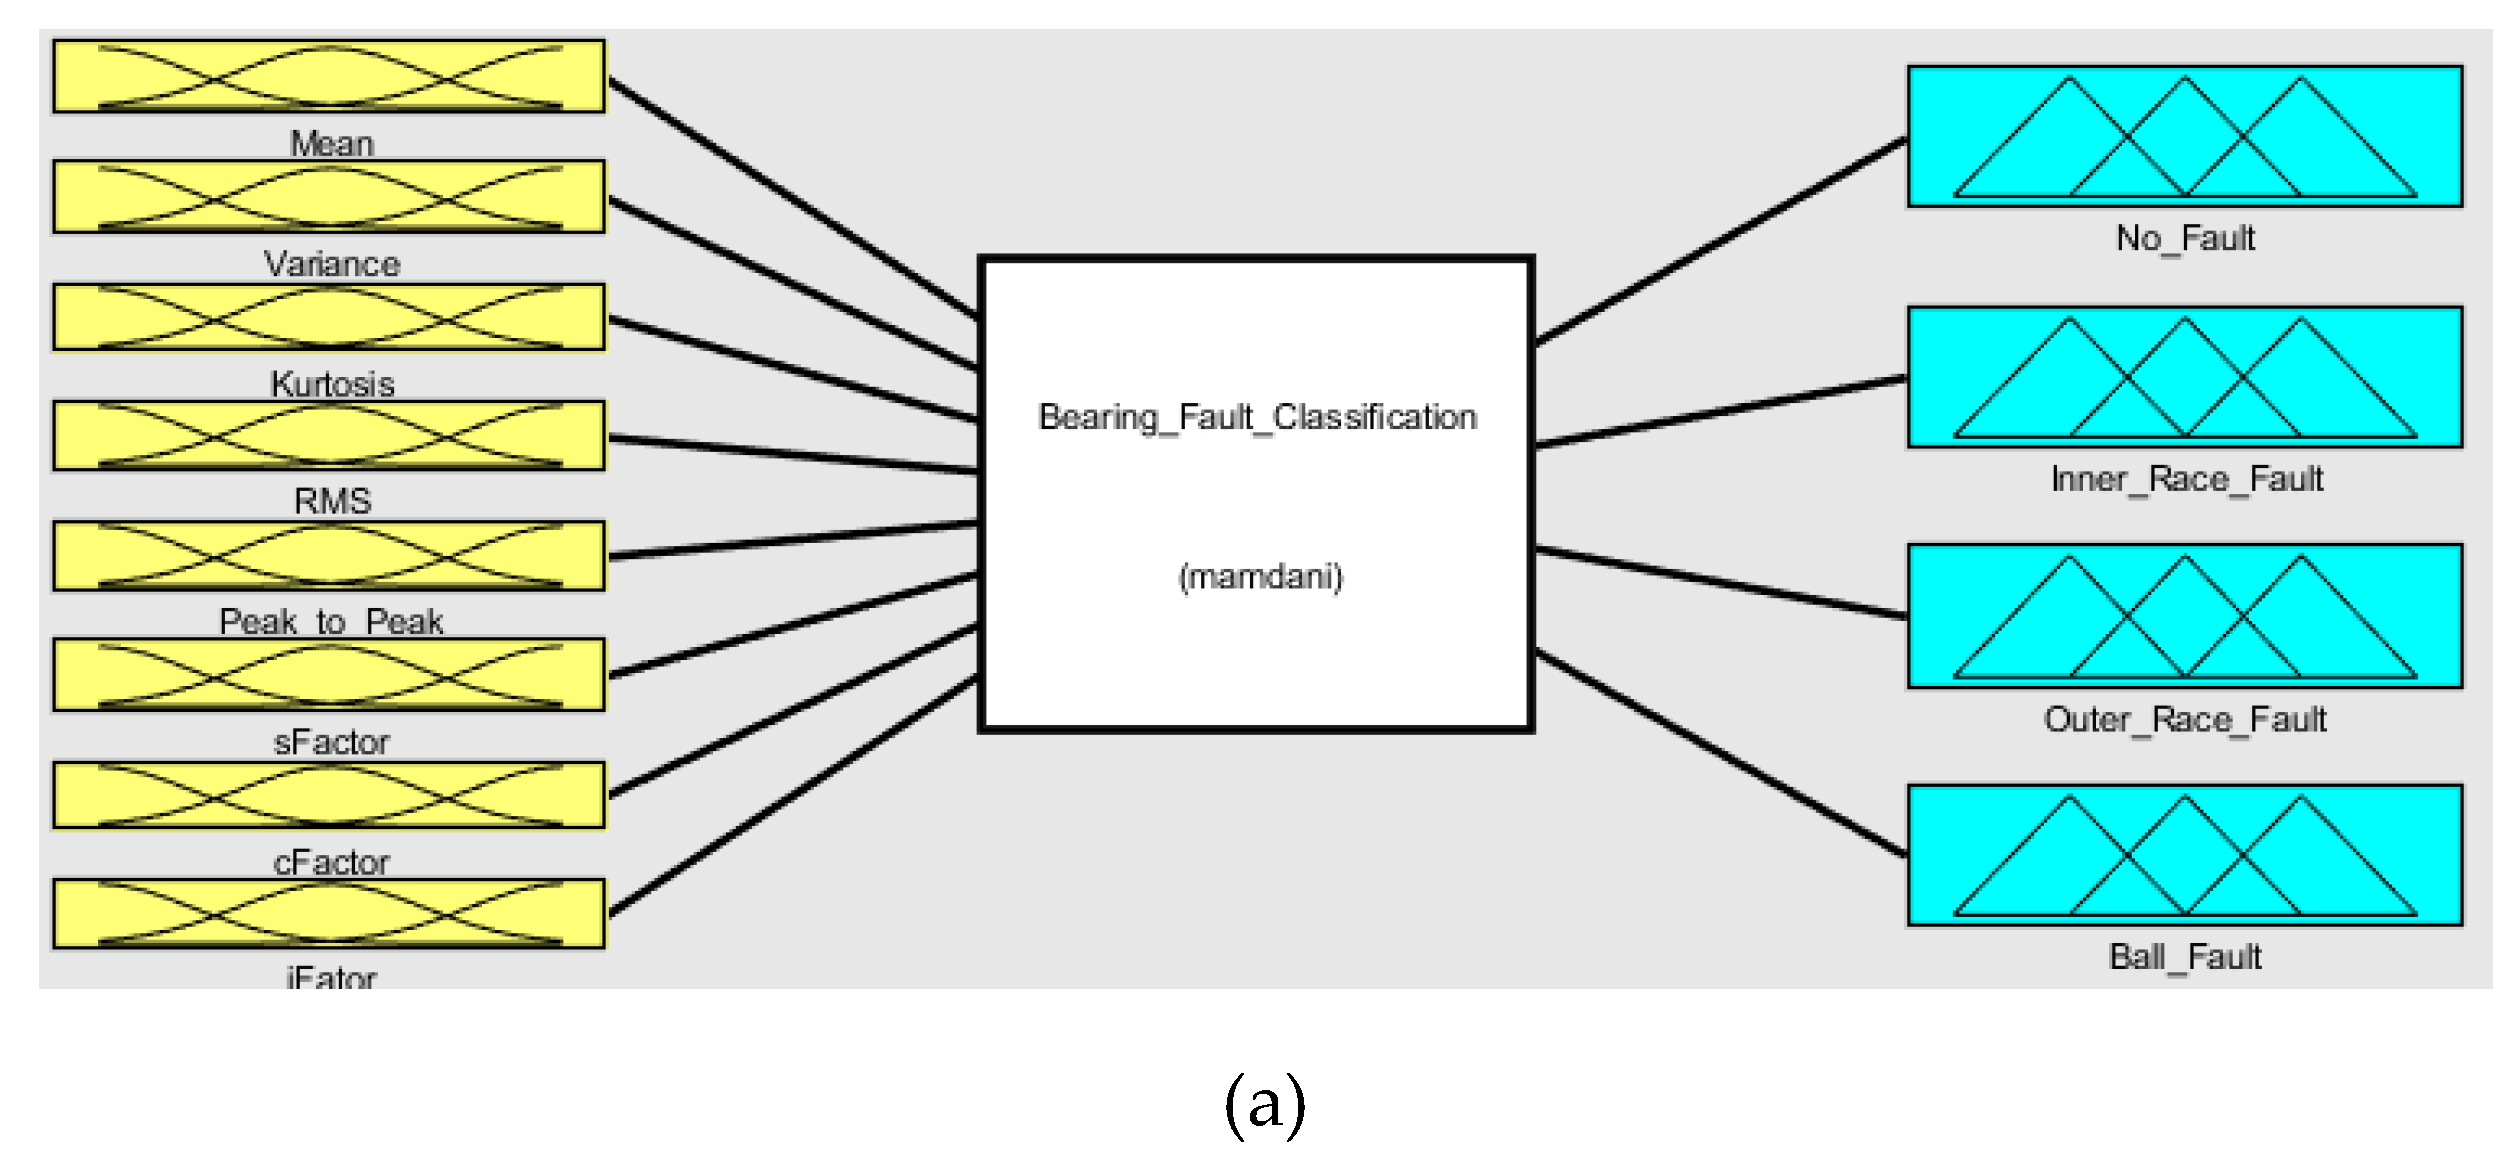
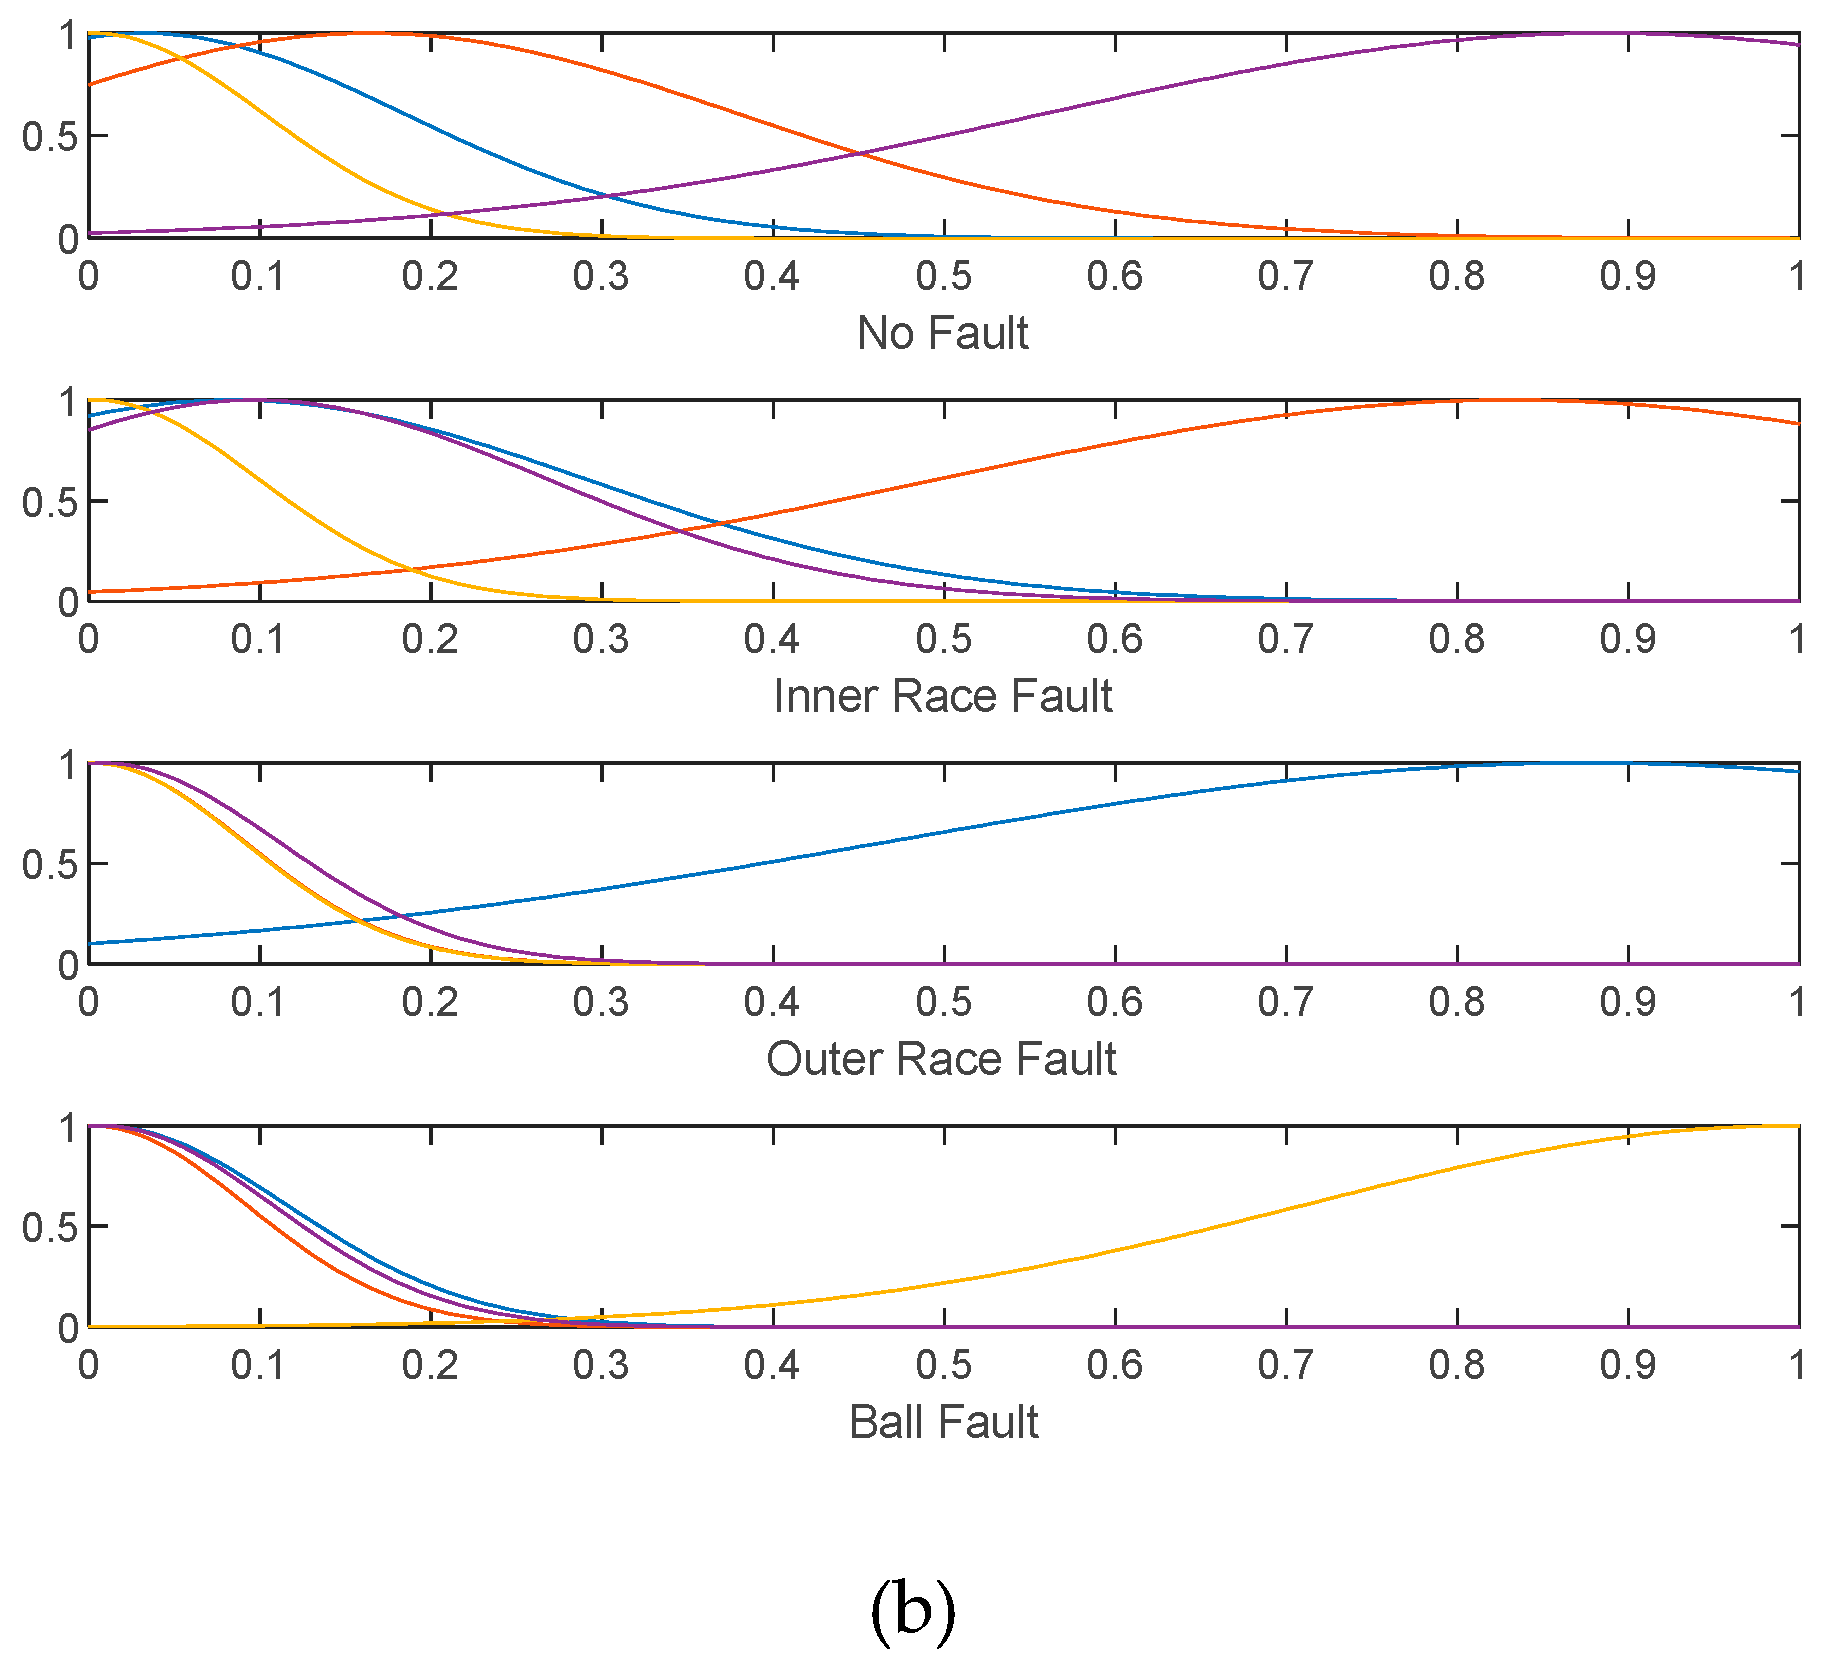
4.4. Development of Fuzzy Rule Base and Inferencing System

Based on the estimated cluster centers of input statistical features, the fault classes are labelled for each bearing fault class and fuzzy rules are extracted using Mamdani type fuzzy inferencing system as shown in Figure 10a.
For the given magnitude of input statistical features such as Mean, Variance, kurtosis value (KV), Root Mean Square value (RMS), peak-peak value (PPV), shape factor (SF) crest factor (CF), impulse factor (IF), the corresponding cluster is identified using FCM and output class is assigned by the proposed fuzzy inferencing system. Following four rules are extracted using the estimated cluster centers for the bearing classes and it is given in Table 6.
From the extracted fuzzy rules given in Table 6, it can be noted that the rule base for bearing fault classification is simple, computationally efficient and linguistically interpretable.

4.5. Validation of the Proposed Approach

In order to validate the proposed approach, 4 samples of feature vector were randomly picked in each class of bearing faults for testing and validation purposes. The classification results are shown in Table 7 and the overall performance of bearing fault classification is found to be 100%. These results prove that the proposed approach is useful for classification and condition monitoring of bearing states.
Figure 11 shows the output of the proposed fuzzy rule based inferencing system for the given input features. This method identifies and assigns the class of the bearing faults based on the highest membership for output class. It can be seen from Table 7 that the predicted class by the proposed method matches with the actual class of the bearing fault for all the input values given to the proposed fuzzy inferencing system.
The performance of the proposed fuzzy rule-based classifier model is found to be better than SVM, neural network [32]. Also, our fuzzy rule based classification method is more efficient and easier to use than neural network, typically producing good results without any trial and error. Also, the proposed fuzzy rule-based classifiers are easy to interpret, verify, and extend.

5. Conclusions

Roller element bearing forms the core of rotating machinery, and its monitoring has always been of significant research interest. In order to enhance the capability of fault classification of bearings, this paper proposes a fuzzy rule based classification approach using discrete wavelet transform (DWT) and the Fuzzy C-means clustering (FCM) to identify fault types. The fault classification results show that the proposed FCM based rule formation approach identified the fault categories of rolling-element bearing more accurately and it grades the condition of the bearing. From the experimental results, it is found that the overall performance of clustering and classification of bearing faults is found to be 100% for identifying the states of the roller element bearings. The proposed method shows that the fuzzy c means clustering method is more direct and easier to implement. It is evident from this work, with the integration of fuzzy sets and fuzzy rule base, FCM is a very powerful tool for the classification and grading of bearing faults. The proposed system can be easily implemented for the early bearing fault identification through online monitoring since the DWT-FCM requires only lesser amount of computation.

Author Contributions

Conceptualization, A.T.; formal analysis, S.A.; investigation, S.A.; methodology, S.D.A.; project administration, S.D.A.; supervision, A.T.; writing—original draft, S.A.

Funding

No External Funding.

Acknowledgments

Authors thank the VIT Management for providing infrastructural and experiential facility for carrying out the trans-disciplinary research on vibration measurements for bearing condition monitoring at Instrumentation lab, VIT, Vellore campus.

Conflicts of Interest

The authors declare no conflict of interest.

References

  1. Analysis, M.V.; Maintenance, P. Practical Machinery Vibration Analysis and Predictive Maintenance; Elsevier: Amsterdam, The Netherlands, 2016. [Google Scholar]
  2. McFadden, P.D.; Smith, J.D. Vibration monitoring of rolling element bearings by the high-frequency resonance technique—A review. Tribol. Int. 1984, 17, 3–10. [Google Scholar] [CrossRef]
  3. Seryasat, O.R.; Aliyari Shoorehdeli, M.; Honarvar, F.; Rahmani, A. Multi-fault diagnosis of ball bearing based on features extracted from time-domain and multi-class support vector machine (MSVM). In Proceedings of the 2010 IEEE International Conference on Systems, Man and Cybernetics, Istanbul, Turkey, 10–13 October 2010; pp. 4300–4303. [Google Scholar]
  4. Srivani, A.; Arunkumar, T.; Denisashok, S. Fourier Harmonic Regression Method for Bearing Condition Monitoring using Vibration Measurements. Mater. Today Proc. 2018, 5, 12151–12160. [Google Scholar] [CrossRef]
  5. Feng, Z.; Liang, M. Fault diagnosis of wind turbine planetary gearbox under nonstationary conditions via adaptive optimal kernel time-frequency analysis. Renew. Energy 2014, 66, 468–477. [Google Scholar] [CrossRef]
  6. Antoni, J.; Randall, R.B. Differential Diagnosis of Gear and Bearing Faults. J. Vib. Acoust. 2002, 124, 165. [Google Scholar] [CrossRef]
  7. Natu, M. Bearing Fault Analysis using Frequency and Wavelet Techniques. Int. J. Innov. Manag. Technol. 2012, 15, 72–74. [Google Scholar]
  8. Reddy, M.S.P.; Reddy, D.M.; Devendiran, S.; Mathew, A.T. Bearing Fault Diagnosis Using Empirical Mode Decomposition, Entropy Based Features and Data Mining Techniques. Mater. Today Proc. 2018, 5, 11460–11475. [Google Scholar]
  9. Zhang, X.; Liang, Y.; Zhou, J.; Zang, Y. A novel bearing fault diagnosis model integrated permutation entropy, ensemble empirical mode decomposition and optimized SVM. Measurement. 2015, 69, 164–179. [Google Scholar] [CrossRef]
  10. Banerjee, T.P.; Das, S. Multi-sensor data fusion using support vector machine for motor fault detection. Inf. Sci. 2012, 217, 96–107. [Google Scholar] [CrossRef]
  11. Kankar, P.K.; Sharma, S.C.; Harsha, S.P. Rolling element bearing fault diagnosis using wavelet transform. Neurocomputing 2011, 74, 1638–1645. [Google Scholar] [CrossRef]
  12. Devendiran, S.; Manivannan, K.; Rajeswari, C.; Amarnath, J.M. Bearing fault diagnosis using CWT, BGA and Artificial Bee Colony Algorithm. Int. J. Mech. Mechatron. Eng. 2015, 15. [Google Scholar]
  13. Rauber, T.W.; De Assis Boldt, F.; Varejão, F.M. Heterogeneous feature models and feature selection applied to bearing fault diagnosis. IEEE Trans. Ind. Electron. 2015, 62, 637–646. [Google Scholar] [CrossRef]
  14. Wang, D.; Miao, Q.; Kang, R. Robust health evaluation of gearbox subject to tooth failure with wavelet decomposition. J. Sound Vib. 2009, 324, 1141–1157. [Google Scholar]
  15. Kobayashi, Y.; Song, L.; Tomita, M.; Chen, P. Automatic Fault Detection and Isolation Method for Roller Bearing Using Hybrid-GA and Sequential Fuzzy Inference. Sensors 2019, 19, 3553. [Google Scholar] [CrossRef]
  16. Ben Ali, J.; Fnaiech, N.; Saidi, L.; Chebel-Morello, B.; Fnaiech, F. Application of empirical mode decomposition and artificial neural network for automatic bearing fault diagnosis based on vibration signals. Appl. Acoust. 2015, 89, 16–27. [Google Scholar]
  17. Tian, Y.; Wang, Z.; Lu, C. Self-adaptive bearing fault diagnosis based on permutation entropy and manifold-based dynamic time warping. Mech. Syst. Signal Process. 2019, 114, 658–673. [Google Scholar] [CrossRef]
  18. Tan, J.; Fu, W.; Wang, K.; Xue, X.; Hu, W.; Shan, Y. Fault Diagnosis for Rolling Bearing Based on Semi-Supervised Clustering and Support Vector Data Description with Adaptive Parameter Optimization and Improved Decision Strategy. Appl. Sci. 2019, 9, 1676. [Google Scholar] [CrossRef]
  19. Kaden, M.; Lange, M.; Nebel, D.; Riedel, M.; Geweniger, T.; Villmann, T. Aspects in classification learning—Review of recent developments in learning vector quantization. Found. Comput. Decis. Sci. 2014, 39, 79–105. [Google Scholar] [CrossRef]
  20. Tian, Y.; Ma, J.; Lu, C.; Wang, Z. Rolling bearing fault diagnosis under variable conditions using LMD-SVD and extreme learning machine. Mech. Mach. Theory 2015, 90, 175–186. [Google Scholar]
  21. Zhou, P.; Lu, S.; Liu, F.; Liu, Y.; Li, G.; Zhao, J. Novel synthetic index-based adaptive stochastic resonance method and its application in bearing fault diagnosis. J. Sound Vib. 2017, 391, 194–210. [Google Scholar] [CrossRef]
  22. Yang, Y.; Pan, H.; Ma, L.; Cheng, J. A fault diagnosis approach for roller bearing based on improved intrinsic timescale decomposition de-noising and kriging-variable predictive model-based class discriminate. J. Vib. Control 2016, 22, 1431–1446. [Google Scholar]
  23. Chen, Y.; Zhang, T.; Zhao, W.; Luo, Z.; Sun, K. Fault Diagnosis of Rolling Bearing Using Multiscale Amplitude-Aware Permutation Entropy and Random Forest. Algorithms 2019, 12, 184. [Google Scholar] [CrossRef]
  24. Fei, S.W. Kurtosis forecasting of bearing vibration signal based on the hybrid model of empirical mode decomposition and RVM with artificial bee colony algorithm. Expert Syst. Appl. 2015, 42, 5011–5018. [Google Scholar] [CrossRef]
  25. Shen, C.; Xie, J.; Wang, D.; Jiang, X.; Shi, J. Improved Hierarchical Adaptive Deep Belief Network for Bearing Fault Diagnosis. Appl. Sci. 2019, 9, 3374. [Google Scholar] [CrossRef]
  26. Randall, R.B. Rolling element bearing diagnostics—A tutorial. Mech. Syst. Signal Proces. 2011, 25, 485–520. [Google Scholar] [CrossRef]
  27. Smith, J.D. The Vibration Produced By Multiple Point Defects Element. Sound Vib. 1985, 98, 263–273. [Google Scholar]
  28. Lou, X.; Loparo, K.A. Bearing fault diagnosis based on wavelet transform and fuzzy inference. Mech. Syst. Signal Process. 2004, 18, 1077–1095. [Google Scholar] [CrossRef]
  29. Topics, A. Tool wear monitoring with wavelet packet transform—Fuzzy clustering method. Wear 1998, 219, 145–154. [Google Scholar]
  30. Yang, M.S.; Lin, C.Y.; Tian, Y.C. A robust fuzzy classification maximum likelihood clustering framework. Int. J. Uncertain. Fuzziness Knowl.-Based Syst. 2013, 21, 755–776. [Google Scholar] [CrossRef]
  31. Wang, L.X.; Mendel, J.M. Generating Fuzzy Rules by Learning from Examples. IEEE Trans. Syst. Man Cybern. 1992, 22, 1414–1427. [Google Scholar] [CrossRef]
  32. Tyagi, S.; Panigrahi, S.K. A DWT and SVM based method for rolling element bearing fault diagnosis and its comparison with Artificial Neural Networks. J. Appl. Comput. Mech. 2017, 3, 80–91. [Google Scholar]
Figure 1. A photographic view of the experimental test rig.
Computation 07 00054 g001
Figure 2. Acquired vibration signals and its corresponding FFT.
Computation 07 00054 g002
Figure 3. A closer view of acquired vibration signal for different bearing conditions. (a) No-Fault; (b) Inner Race Fault; (c) Outer Race Fault; (d) Ball Fault.
Computation 07 00054 g003
Figure 4. Schematic diagram of the proposed method for bearing fault classification.
Computation 07 00054 g004
Figure 5. Schematic diagram for decomposition of vibration signal.
Computation 07 00054 g005
Figure 6. The four-level wavelet decomposition of four classes of bearing conditions.
Computation 07 00054 g006
Figure 7. Extracted Statistical features from DWT Coefficients for different bearing faults.
Computation 07 00054 g007
Figure 8. Membership functions for the statistical features using FCM.
Computation 07 00054 g008
Figure 9. Estimated membership functions of the experimental data for different bearing faults.
Computation 07 00054 g009
Figure 10. Proposed Fuzzy inferencing system for bearing fault classification: (a) Input-Output model of the proposed fuzzy inferencing system; (b) membership functions for output classes of bearing condition.
Computation 07 00054 g010aComputation 07 00054 g010b
Figure 11. Fuzzy rule inferencing system for bearing fault classification.
Computation 07 00054 g011
Table 1. Specifications of roller element ball bearing.
Model NameZKL6006
Inside Dia. (d) mm30
Outside Dia. (D) mm55
Width Dia. (B) mm13
Limiting speed / min18,000
Weight (mass) Kg0.110
Table 2. List of statistical features and formulas.
S. NoNotationFeatureFormula
1x1Mean X _ _ = 1 N t = 1 N x ( n )
2x2Variance X V = 1 N t = 1 N ( x ( n ) x _ ) 2
3x3Kurtosis X k u r t = 1 N t = 1 N ( x ( n ) x ¯ ) 4
4x4Root Mean Square X r m s = ( 1 N t = 1 N x 2 ) 1 2
5x5Peak to Peak x ^ = E { max ( x ( n ) ) }
6x6S Factor S = x r m s / x ¯
7x7C Factor C = x ^ / x r m s
8x8I Factor I = x ^ / x ¯
Table 3. List of statistical features and the output classes for different bearing conditions.
Extracted Features from DWT CoefficientsOutput Classes
x1x2x3x4x5x6x7x8
DWT CoefficientscA10.05290.00140.00070.06500.22021.22841.36564.16360001
cA20.03720.00070.00030.04570.15191.22921.36084.08240001
cA30.02650.00040.00020.03240.09841.22501.35813.71910001
cA40.01850.00020.00010.02270.06921.22621.35403.74100001
cA10.06650.00260.00970.08370.36531.25784.36475.49020010
cA20.04580.00130.00920.05860.27321.28054.66125.96880010
cA30.03140.00060.00910.04040.16901.28514.18465.37750010
cA40.02210.00030.00900.02840.12031.28394.23845.44160010
cA10.12660.01210.01980.16760.69741.32364.16175.50840100
cA20.08970.00620.00510.11920.59911.32875.02786.68070100
cA30.06210.00310.00110.08320.42011.33955.04826.76220100
cA40.04370.00160.00030.05900.23771.34924.03025.43740100
cA10.26240.05950.02880.35831.47781.36564.12485.63271000
cA20.18630.02960.01410.25351.16431.36084.59306.24991000
cA30.12730.01370.01010.17290.80361.35814.64736.31151000
cA40.08950.00670.00930.12120.50301.35404.15215.62181000
cD10.02890.00050.00490.03620.13391.25411.52794.64210001
cD20.01980.00020.00110.02530.10581.27871.51145.34200001
cD30.01370.00010.00030.01790.08401.30411.56876.11890001
cD40.01000.00010.00010.01280.05891.28861.58755.91250001
cD10.08960.00460.01390.11240.42571.25373.78844.74960010
cD20.06160.00230.01010.07780.30561.26303.92934.96290010
cD30.04160.00120.00930.05420.24151.30204.45355.79850010
cD40.02930.00060.00910.03820.16881.30634.41185.76320010
cD10.16830.02500.20700.23081.16371.37165.04116.91430100
cD20.11510.01130.06150.15660.86421.36065.51807.50760100
cD30.07900.00600.02050.11080.62121.40155.60717.85850100
cD40.05600.00320.00530.07950.43451.41945.46727.75990100
cD10.36970.18250.21600.56492.46671.52794.36626.67131000
cD20.26910.09300.07050.40661.88561.51144.63697.00831000
cD30.17930.04700.02950.28121.74031.56876.18799.70721000
cD40.12300.02300.01430.19521.14361.58755.85909.30101000
Table 4. Estimated Cluster centers of statistical features for different bearing faults.
FeaturesA
(No Fault)
B
(Inner Race Fault)
C
(Outer Race Fault)
D
(Ball Fault)
Mean (x1) 0.06960.02960.14210.1468
Variance (x2)0.00670.00080.02940.0339
Kurtosis (x3)0.01180.00140.06440.0236
RMS (x4)0.09210.03680.20030.2300
PPV (x5)0.38740.12960.96991.3732
Sfactor (x6)1.30471.24751.38291.5629
cFactor (x7)4.20121.44924.98055.9423
iFactor (x8)5.51904.50466.90249.3055
Table 5. Sample membership values of feature data for different fault classes.
S. NoMembership Values for Different Fault Classes
µ (A)µ (B))µ (C)µ (D)
10.99740.99950.00210.9964
20.99980.99950.00220.9996
30.99950.99560.00240.9996
40.99660.98790.00250.9965
50.99110.97650.00270.9903
60.98310.96150.00290.9811
70.97250.94310.00310.9689
80.95950.92150.00330.9539
90.94410.89690.00350.9361
100.92660.86960.00380.9159
110.90700.83990.00400.8932
120.88540.80810.00430.8684
130.86210.77450.00460.8416
140.83720.73950.00490.8131
150.81090.70330.00520.7831
160.78330.66630.00560.7518
170.75470.62880.00590.7196
180.72510.59120.00630.6865
190.69490.55370.00670.6530
200.66420.51650.00720.6191
Table 6. Fuzzy rule base for bearing fault classification.
Rule NoGenerated Fuzzy Rules Using FCM
1If (Mean is in1cluster1) and (Variance is in2cluster1) and (Kurtosis is in3cluster1) and (RMS is in4cluster1) and (Peak_to_Peak is in5cluster1) and (sFactor is in6cluster1) and (cFactor is in7cluster1) and (iFator is in8cluster1) then (No_Fault is out1cluster1)(Inner_Race_Fault is out2cluster1)(Outer_Race_Fault is out3cluster1)(Ball_Fault is out4cluster1) (1)’
2If (Mean is in1cluster2) and (Variance is in2cluster2) and (Kurtosis is in3cluster2) and (RMS is in4cluster2) and (Peak_to_Peak is in5cluster2) and (sFactor is in6cluster2) and (cFactor is in7cluster2) and (iFator is in8cluster2) then (No_Fault is out1cluster2)(Inner_Race_Fault is out2cluster2)(Outer_Race_Fault is out3cluster2)(Ball_Fault is out4cluster2) (1)’
3If (Mean is in1cluster3) and (Variance is in2cluster3) and (Kurtosis is in3cluster3) and (RMS is in4cluster3) and (Peak_to_Peak is in5cluster3) and (sFactor is in6cluster3) and (cFactor is in7cluster3) and (iFator is in8cluster3) then (No_Fault is out1cluster3)(Inner_Race_Fault is out2cluster3)(Outer_Race_Fault is out3cluster3)(Ball_Fault is out4cluster3) (1)
4If (Mean is in1cluster4) and (Variance is in2cluster4) and (Kurtosis is in3cluster4) and (RMS is in4cluster4) and (Peak_to_Peak is in5cluster4) and (sFactor is in6cluster4) and (cFactor is in7cluster4) and (iFator is in8cluster4) then (No_Fault is out1cluster4)(Inner_Race_Fault is out2cluster4)(Outer_Race_Fault is out3cluster4)(Ball_Fault is out4cluster4) (1)’
Table 7. Testing and validation of proposed approach for classification of bearing faults.
Test NoExtracted Features (For Testing Purpose)Predicted ClassActual ClassClassification Accuracy
F1F2F3F4F5F6F7F8
10.01270.00030.00040.03150.14521.23782.15833.3411No FaultNo Fault100%
20.01210.00140.01020.05560.24821.39724.46435.6920Inner FaultInner Fault100%
30.06490.00370.00120.07900.44351.32985.08415.6227Outer FaultOuter Fault100%
4.0.21790.08200.01280.27221.75401.57685.93819.2712Ball FaultBall Fault100%

