
Density Functional Theory Study of Metal and Metal-Oxide Nucleation and Growth on the Anatase TiO2(101) Surface


Institute of Materials Chemistry, Vienna University of Technology, Getreidemarkt 9/165-TC, A-1060 Vienna, Austria
*
Author to whom correspondence should be addressed.
Computation 2021, 9(11), 125; https://0-doi-org.brum.beds.ac.uk/10.3390/computation9110125
Submission received: 12 October 2021
/
Revised: 4 November 2021
/
Accepted: 5 November 2021
/
Published: 19 November 2021
(This article belongs to the Special Issue Commemorative Issue in Honor of Professor Karlheinz Schwarz on the Occasion of his 80th Birthday)
Abstract
:Experimental studies have shown the possible production of hydrogen through photocatalytic water splitting using metal oxide (MO) nanoparticles attached to an anatase TiO surface. In this work, we performed density functional theory (DFT) calculations to provide a detailed description of the stability and geometry of MO clusters M = Cu, Ni, Co, Fe and Mn, x = 1–5, and y = 0–5 on the anatase TiO(101) surface. It is found that unsaturated 2-fold-coordinated O-sites may serve as nucleation centers for the growth of metal clusters. The formation energy of Ni-containing clusters on the anatase surface is larger than for other M clusters. In addition, the Ni adsorption energy increases with cluster size n, which makes the formation of bigger Ni clusters plausible as confirmed by transition electron microscopy images. Another particularity for Ni-containing clusters is that the adsorption energy per atom gets larger when the O-content is reduced, while for other M atoms it remains almost constant or, as for Mn, even decreases. This trend is in line with experimental results. Also provided is a discussion of the oxidation states of MO clusters based on their magnetic moments and Bader charges and their possible reduction with oxygen depletion.
1. Introduction
The over-exploitation of the fossil energies leads to a significant increase of CO in the atmosphere, resulting in severe climate problems. It is therefore absolutely necessary to replace them by alternative energy sources. When using sun light as energy source, however, materials with specialized properties are necessary, and TiO is such a versatile material that has numerous applications in catalysis, photocatalysis, and solar energy [1]. TiO crystallizes in three major different structures: rutile (tetragonal), anatase (tetragonal) and brookite (rhombohedral). Other structures exist as well, as for example cotunnite, that has been synthesized at high pressures and is one of the hardest polycrystalline materials known. However, only rutile and anatase play an important role in the applications of TiO. A well-suited model compound for photocatalytic water splitting is anatase. It has a slightly larger band gap than rutile (∼3.0 eV for rutile and ∼3.2 eV for anatase) [2,3,4,5,6] and shows better performance [7], since it also has a longer electron-hole pair life time, which makes anatase more suitable for photocatalytic applications [8]. To improve the water splitting photocatalyst activity, the use of co-catalysts is necessary and the most widely used are Pt and Pd for photocatalytic reduction, and IrO and RuO for the oxidation of water. However, these are expensive materials based on rare noble metals. To achieve large-scale industrial applications of photocatalytic water splitting, the development of new co-catalysts based on cheap and widely available elements remains an important issue. With regard to novel abundant co-catalysts for photocatalytic water splitting, research efforts focus on transition metals (M) oxides, which are known for their excellent catalytic properties and applications in industry, research and nature.
Recently, small clusters of M oxides were produced by deposition of M-acetylacetonate precursors on TiO and subsequent calcination in air. In particular, the Ni (and Cu) nanoparticles showed pronounced activities for water splitting, but little is known about the atomic structure of these nanoparticles [9]. This inspired the present work, where we used density functional theory (DFT) [10,11] to study possible adsorption sites of a transition metal atom (Cu, Ni, Co, Fe, and Mn), which can be the nucleation sites for bigger M clusters (2 to 5 atoms) or M oxides clusters on TiO(101) anatase, the lowest-energy surface of anatase [12]. There are a couple of previous theoretical works on the M adsorption on anatase, studying single M atom adsorption and diffusion [13], or the adsorption of small Ni [14] or Cu and Cu-oxide [15,16] clusters. A nice review related to this topic is given by Zhou and Dong [17]. However, note that most of these calculations used a generalized gradient approximation (GGA) in DFT for the correlated electrons, which may not be accurate enough.
2. Methods
Spin-polarized DFT calculations of the adsorption of MO clusters (M = Cu, Ni, Co, Fe or Mn, 1, 2, 3, 5, and 0, 1, 2, 3, 4, 5) on the TiO(101) surface were performed using the full-potential augmented plane wave plus local orbitals method [18,19] as implemented in the WIEN2k code [20,21]. We employed the PBEsol exchange-correlation functional [22], which is a GGA and yields lattice parameters of bulk anatase TiO, Å and Å that are in good agreement with experimental data [23]. In order to treat the correlated electrons of the M atoms a Hubbard U correction was used [24]. We used of 5 eV for Cu, Ni, and Co and 4 eV for Mn and Fe. These values are deliberately chosen smaller than what is typically used in strongly correlated oxides, since in our case also less ionic (metallic) clusters were investigated and the correlation may not be always so strong. We note that small changes of would not affect our basic results and conclusions.
The (101) surface was modeled by a symmetric slab with a thickness of three layers of TiO (see Figure 1, where only one layer is shown for better visibility) and a vacuum region of 16 Å between the slabs. In order to reduce the interactions between the adsorbed clusters in neighboring cells a supercell was used for all surfaces with adsorbed M atoms. Moreover, such a supercell is also helpful to release the interfacial strain energy and find more stable configurations. A -centered mesh of -points is used during relaxation (a mesh for the final results) and a basis-set size corresponding to , where is the smallest atomic sphere radius and the largest reciprocal lattice vector, was used. All surface models were relaxed until all residual forces were below 1 mRy/bohr.
Consistent and values have been used for calculating the adsorption energy of clusters on anatase surface, which is defined as
where and are the total energies of the free M atom and an O molecule, and is for the bare (101) surface. Bader’s quantum theory of atoms in molecules [25] was used to calculate the atomic magnetic moments and charges.
3. Results and Discussion
3.1. Perfect Anatase TiO2(101) Surface
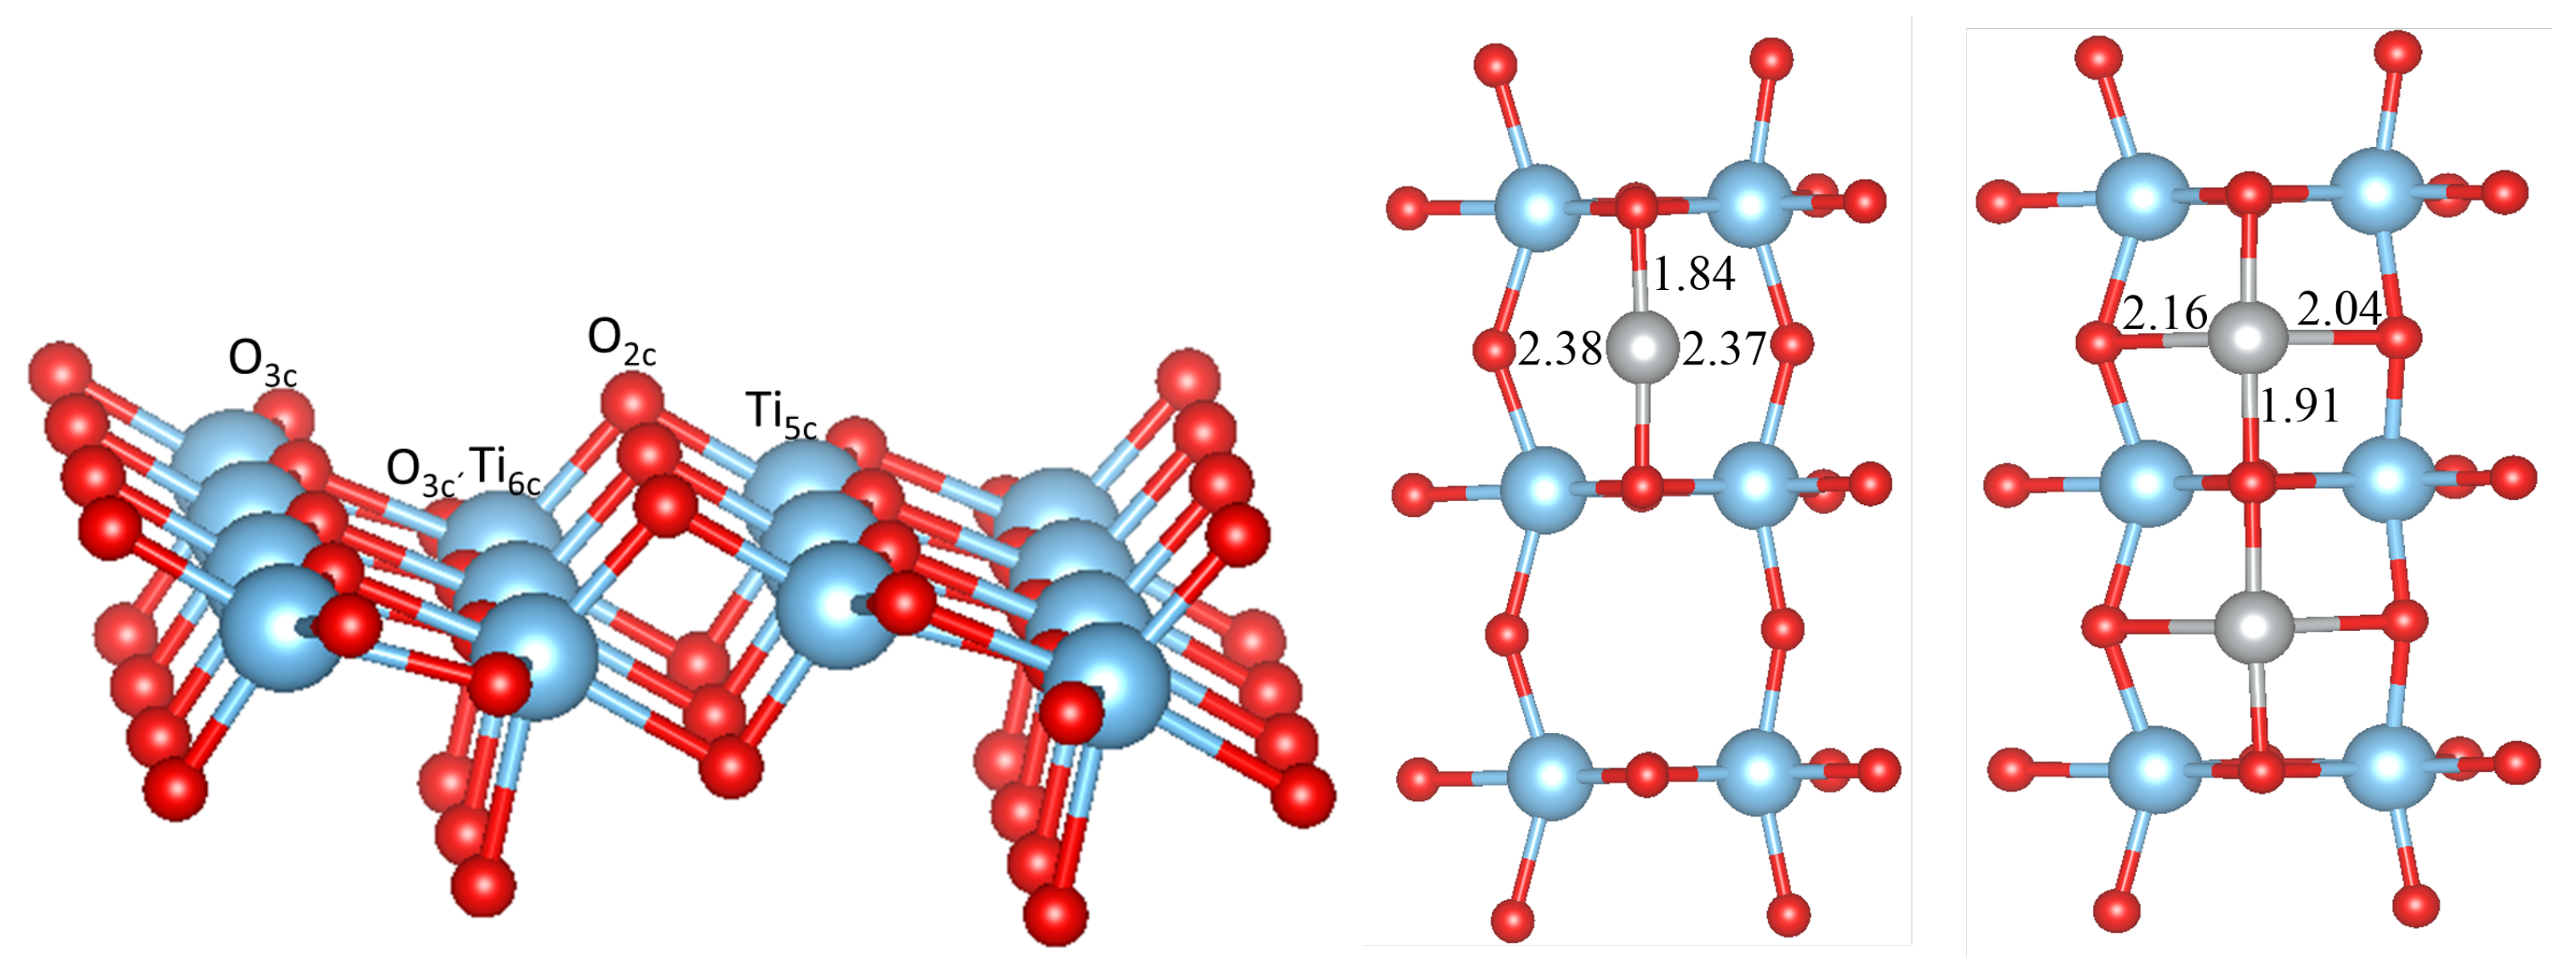
As shown in Figure 1, the anatase TiO(101) surface has a stepped structure. Threefold coordinated O atoms (O and O) and sixfold coordinated Ti atoms (Ti) are fully saturated and have bulk-like coordination, whereas the twofold O and fivefold Ti atoms are under-coordinated. The O atoms are located at the ridges of the saw-tooth-like structure, and after optimization they relax inwards by ∼0.16 Å with respect to bulk TiO. The three-fold coordinated O and O atoms relax outwards by ∼0.07 Å, while the Ti and Ti atoms relax inwards by ∼0.15 Å and ∼0.16 Å respectively, so that the surface exhibits a slightly buckled structure.
3.2. Pure Metal Clusters on the Anatase TiO2(101) Surface
Upon calcination of the M-acetylacetonate precursors, single M atoms may adsorb, diffuse and form larger clusters and finally oxidize on the surface. It is thus natural to study as a first step the possible adsorption sites of a single M atom or a small cluster. We have considered several possible initial configurations of the adsorbed metal atoms and clusters M with 1, 2, 3, and 5. The most stable structures, which are the same for all M (Cu, Ni, Co, Fe or Mn), are presented in Figure 1, Figure 2 and Figure 3 in the case of Ni clusters with 1, 2 and 5. The nearest-neighbor distances are shown in Table 1, while the adsorption energy and magnetic moment are available in Table 2.
A single adsorbed M atom prefers to adsorb at the bridge site between two unsaturated oxygens (O) atoms, similar as found in previous studies [13,14]. The corresponding M-O bond length (it is the shortest for Ni, 1.84 Å) follows in general the trend found in the bulk M oxides (except for the Cu-O and Ni-O distances, which are interchanged), but in all cases is much shorter (and therefore indicates a stronger bonding) than in the bulk MO (e.g., 2.08 Å in NiO). The particular short bond distance for Ni goes hand in hand with the O-Ni-O bond angle, which reaches 177 and forms a nearly linear bond, while for the other metals this varies from 167 (Fe) to 150 (Co). On the other hand the two larger M-O bond distances are also almost equal (but very large) for Ni, but for all other M form a short and long bond in an asymmetric position (see Table 1). All M atoms except Cu possess a magnetic moment (see Table 2), where as expected Mn has the largest moment, while it is the smallest for Ni. It should be noted that PBEsol without U would lead to a non-magnetic Ni atom and the moments for the other M would be smaller but still sizeable. The adsorption energy on the TiO(101) surface (Table 2) is the largest for Ni (3.46 eV) and the smallest for Cu (2.24 eV). Comparing our results with literature the adsorption energy of Ni is 0.4 eV larger than in references [13,14] and the Ni position is symmetric with respect to the O atoms. On the other hand, our calculated adsorption energy for Fe is 0.7 eV smaller than that in reference [13], while it agrees well for Cu and Co. These differences could arise due to the neglect in references [13,14] of a Hubbard U correction for the M atom or the use of pseudopotentials.
If 2 or 3 M atoms are adsorbed on the surface, the most stable structures are still obtained when the M atoms sit at the O bridge sites (the structure on the right side in Figure 1 shows 2 M atoms adsorbed on the surface), very similar to a single atom adsorption. Interestingly, for all M atoms except Ni the adsorption energy per M atom decreases slightly (Figure 4 and Table 2). For Ni it increases by 0.65 eV. The reason seems to be that the Ni atom is smaller than the others and an almost linear chain fits perfectly for Ni but not in the other cases, where this additional strain reduces slightly. Most magnetic moments remain unchanged, except for Ni, where it increases to 0.97/0.98 . In our supercell, 3 M atoms form an infinite linear chain of M-O pairs.
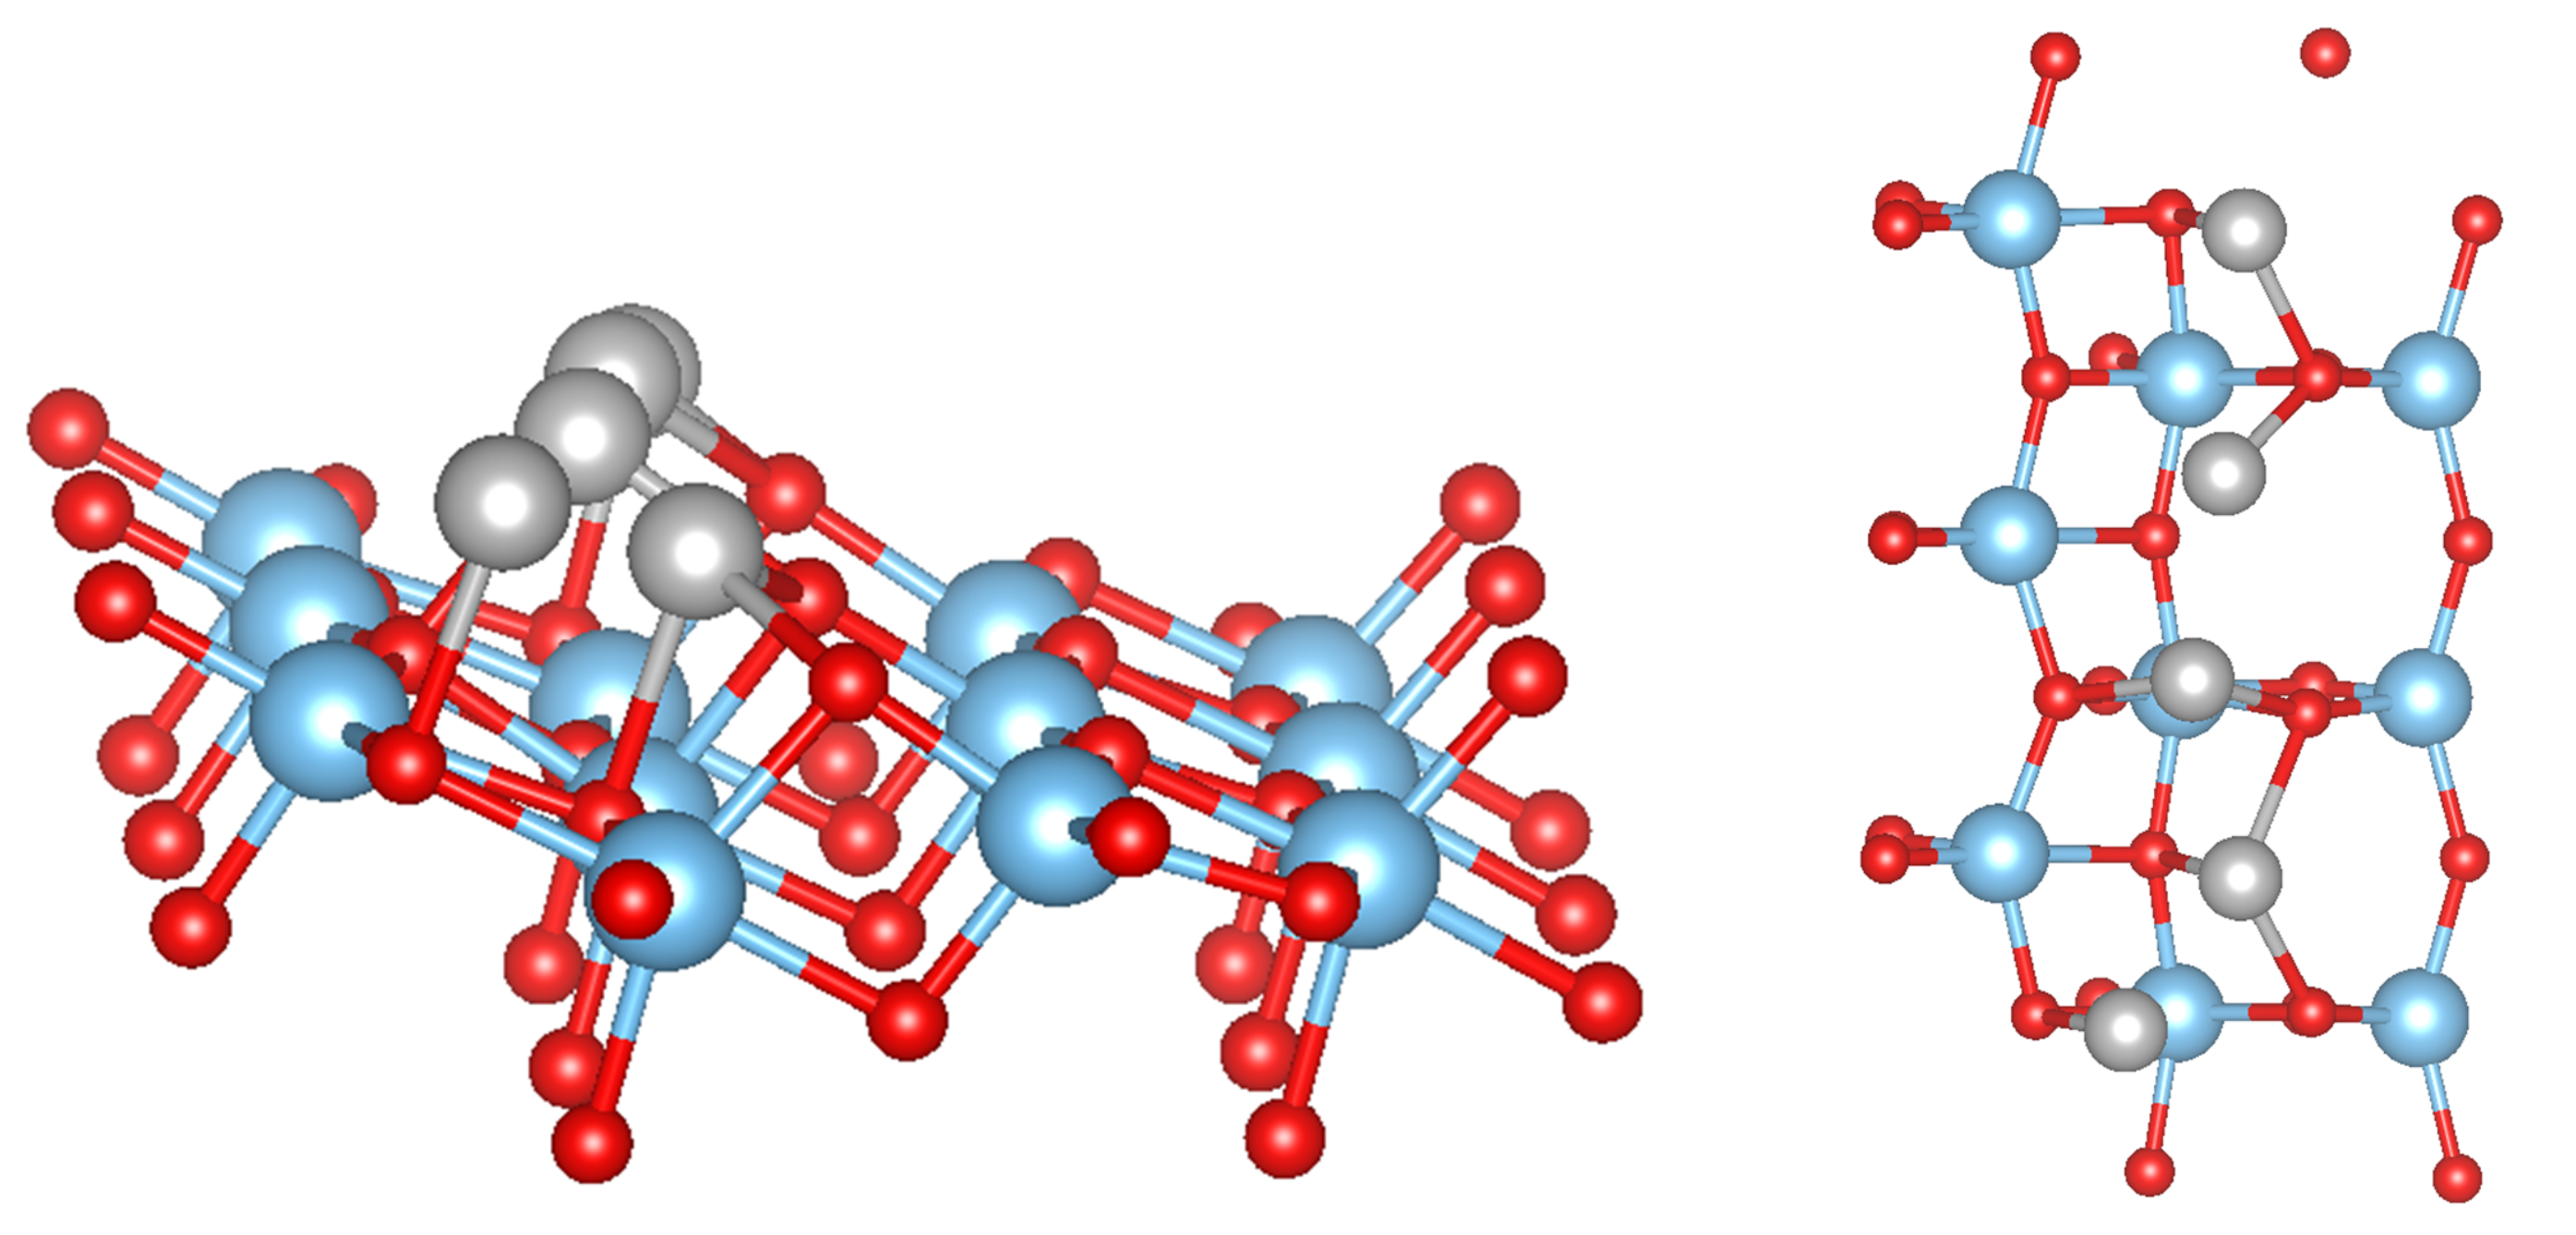
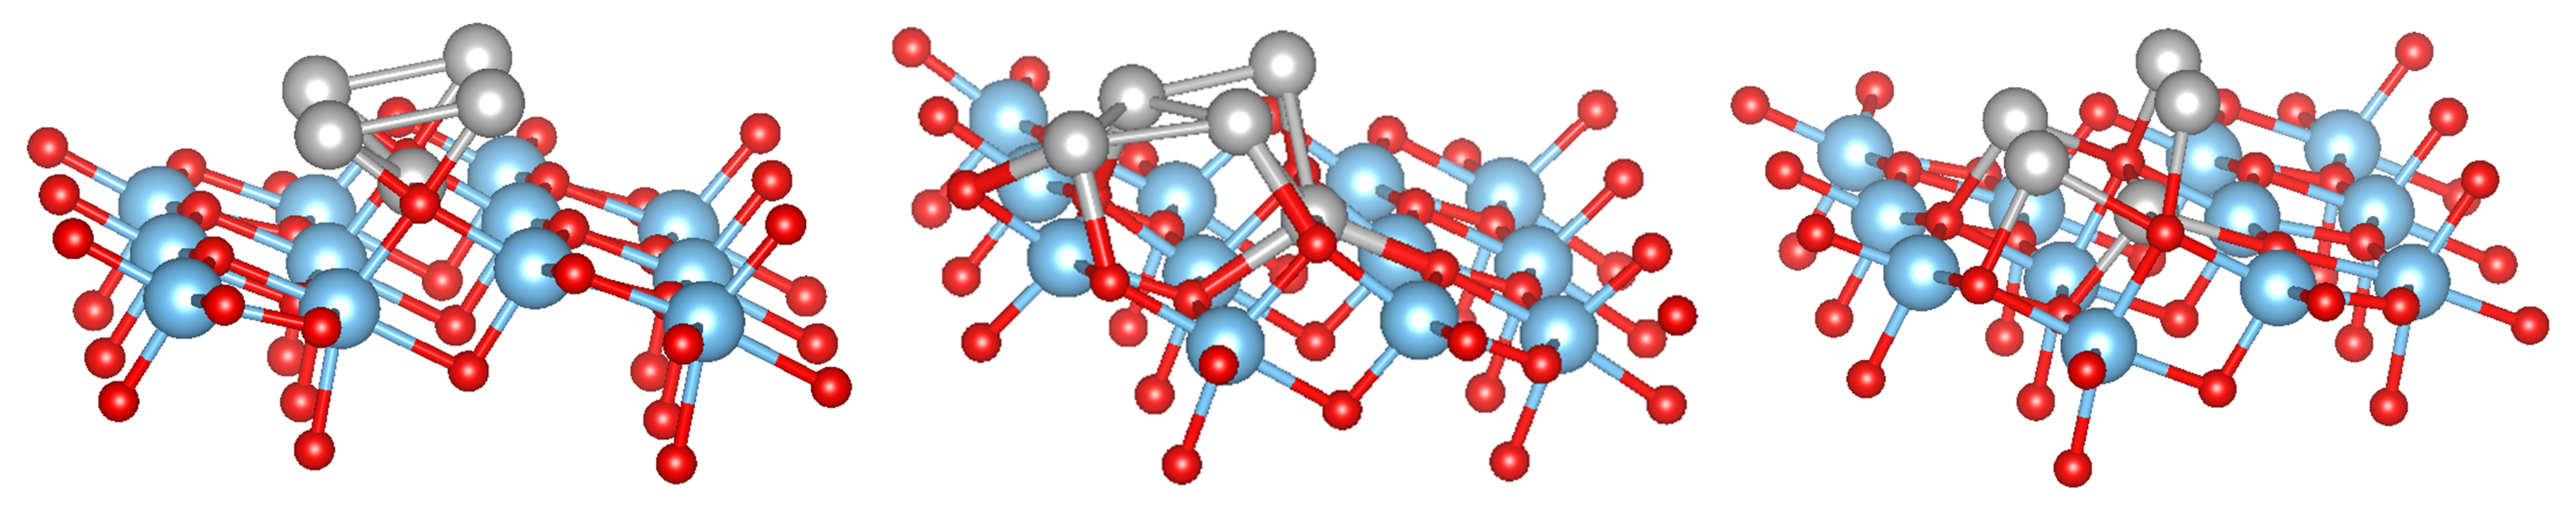
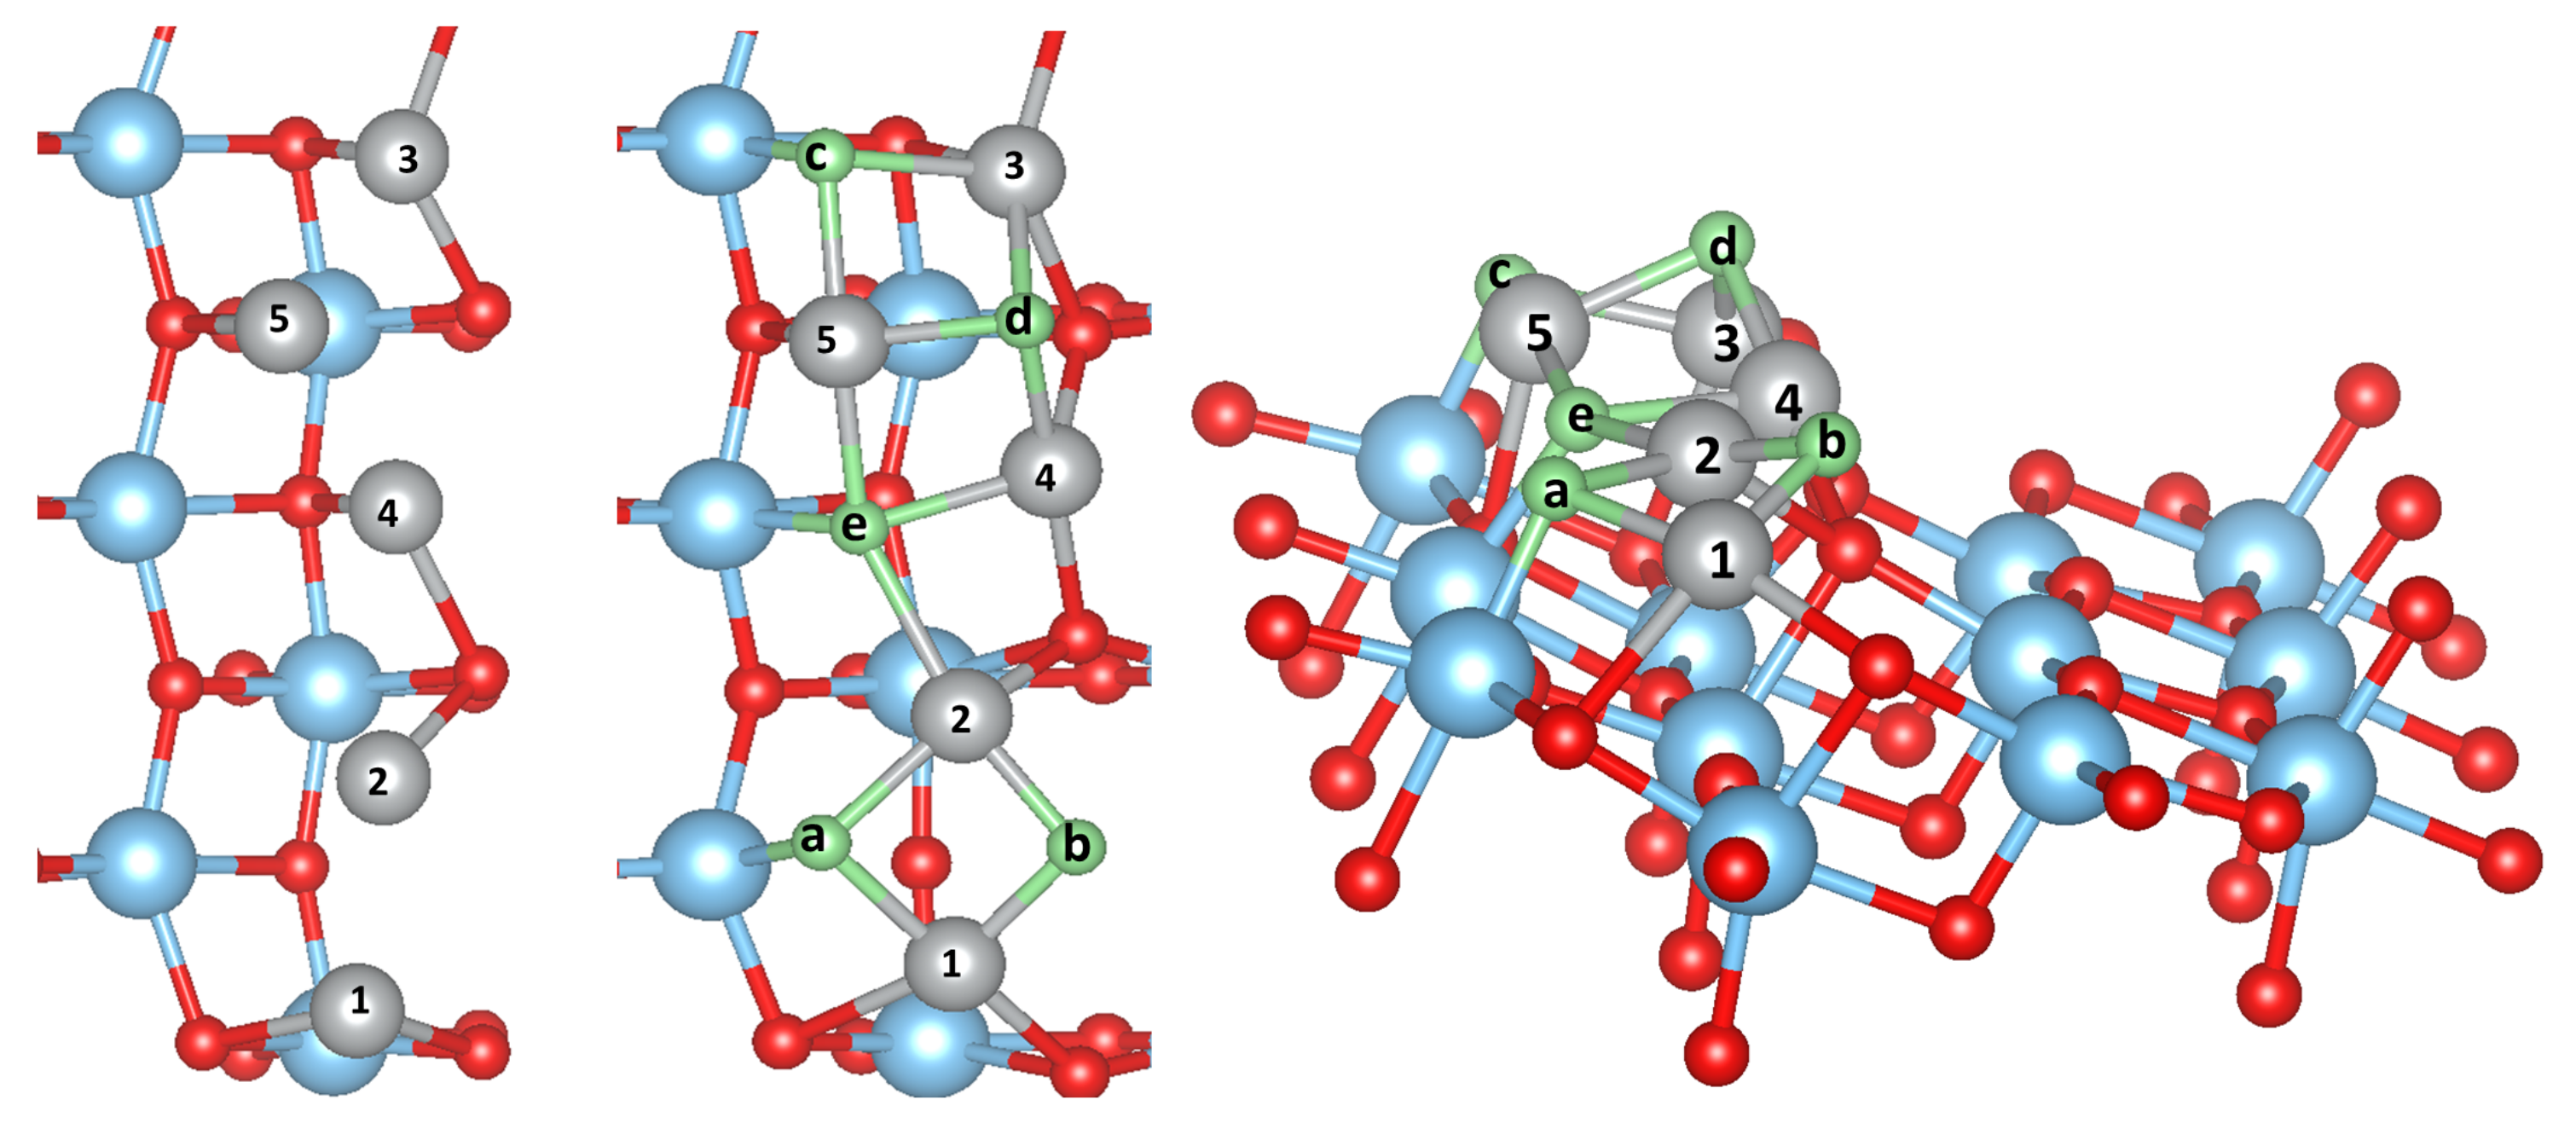
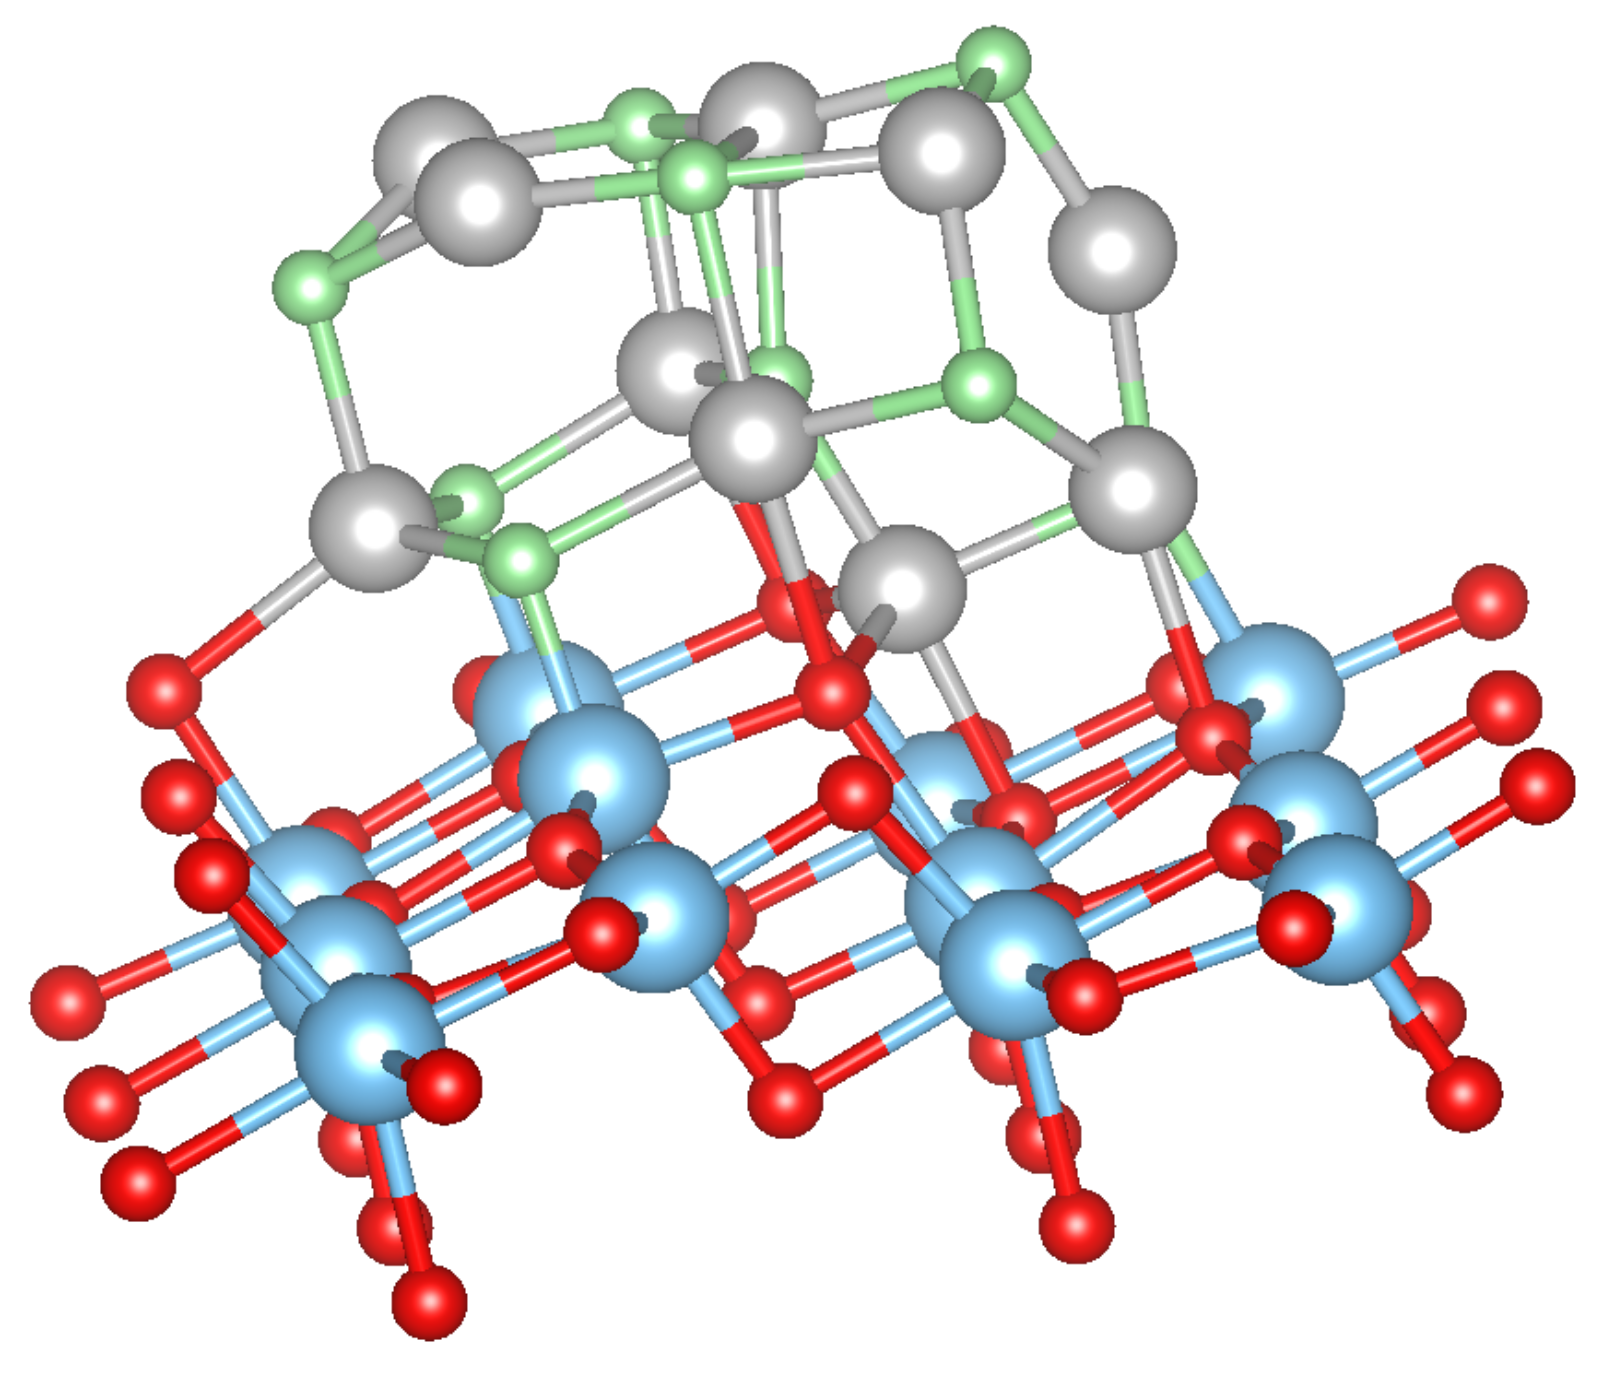
For 5 adsorbed M atoms, we tried several different starting structures in the supercell. The most promising structures are based on the chain-like structure with 2 additional atoms (labelled M(1), see Figure 2) or a structure with a more “crystalline type” nucleated on a single M bridge atom (labelled M(2), see Figure 3). The additional 2 atoms “destroy” the symmetric chain-like 3-atom structure above the O atoms forming a quite irregular array of M atoms with bonds to O, O and O atoms. Still this structure seems to be the most stable for Fe and Mn although is smaller than for less M atoms. The crystalline M(2) structures behave very differently for the bcc metals Mn and Fe and the fcc metals Co, Ni and Cu. While for the former the cluster structure stays basically close to the starting one and form a “bcc” like cluster (Figure 3), for the latter the cluster rearranges and can be considered as a nucleus for an fcc like cluster. In fact, their is larger than for the corresponding chain-like M(1) structures and for Ni and Cu even the highest within the series.
For Mn in a crystalline bcc structure, we also started from different antiferromagnetic configurations (labelled Mn(2a)), but the adsorption energies were not much larger than in the ferromagnetic case.
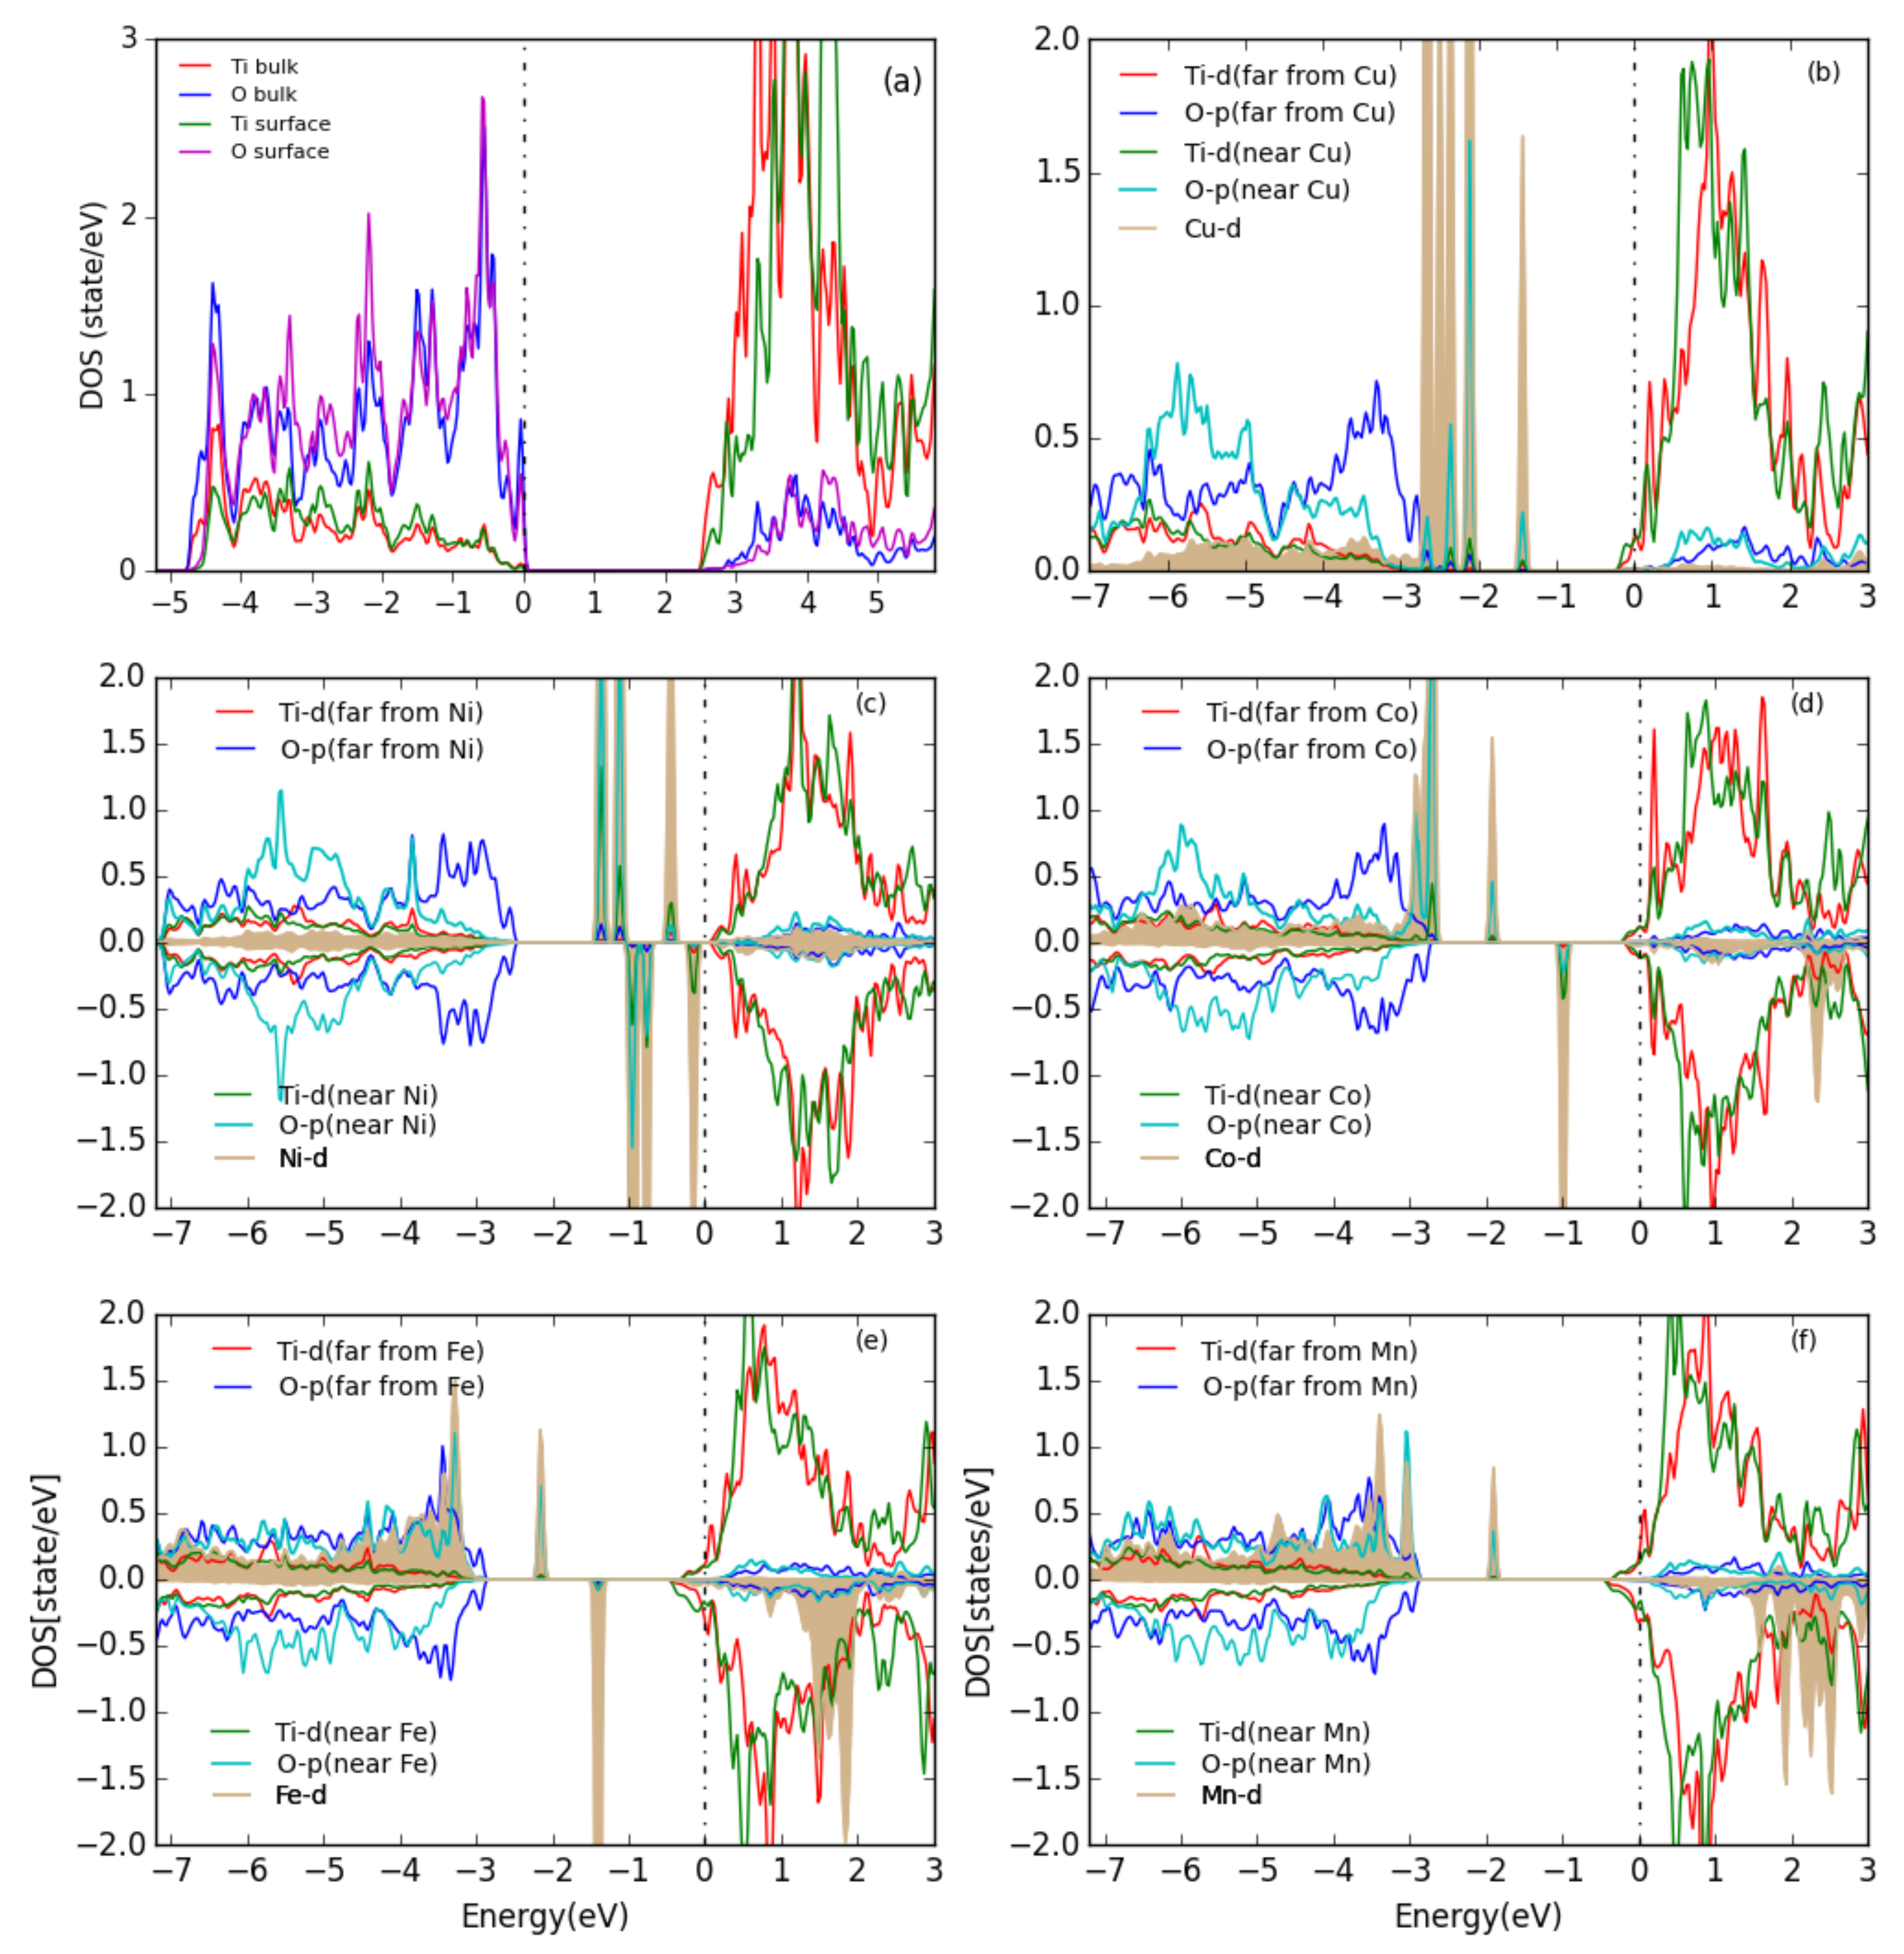
The partial density of states (PDOS) for the TiO(101) surface and for the energetically most favorable configuration of one metal atom on the surface are shown in Figure 5. For the TiO(101) surface, both the valance band maximum (VBM) and the conduction band minimum (CBM) are composed of a mixture of O- and Ti- states, with the CBM having mostly character while the VBM has more O- character, which indicates a mixed ionic and covalent bonding. After adsorption of a M atom on the anatase TiO(101) surface, the Fermi level moves to the conduction band and the system becomes formally metallic. In the case of adsorbed Cu and Ni atoms, almost all the d states of Cu/Ni are concentrated in the band gap below the Fermi energy, and they slightly hybridize with the O-p and Ti-d states of the Ti and O atoms which are the closest to the Cu/Ni atom. With an adsorbed Co, Fe, or Mn atom the d states are not only in the band gap but also show a peak at the VBM for spin-up and inside the conduction band for spin-down states.
3.3. MO on the Anatase TiO2(101) Surface
Turning now to the adsorption of metal-oxides clusters MO on the anatase TiO(101) surface, several 2D and 3D (starting) configurations among the numerous possible ones were considered. Some of the most stable structures are shown in Figure 6 and Figure 7, and the adsorption energies are shown in Table 3 for the NiO clusters. It can be seen that is almost constant with the increase of cluster size indicating that bigger Ni clusters can easily be formed on the anatase TiO(101) surface, which is in agreement with the experimental result [9]. The most favorable structure is NiO with a NaCl like structure (shown in Figure 7).
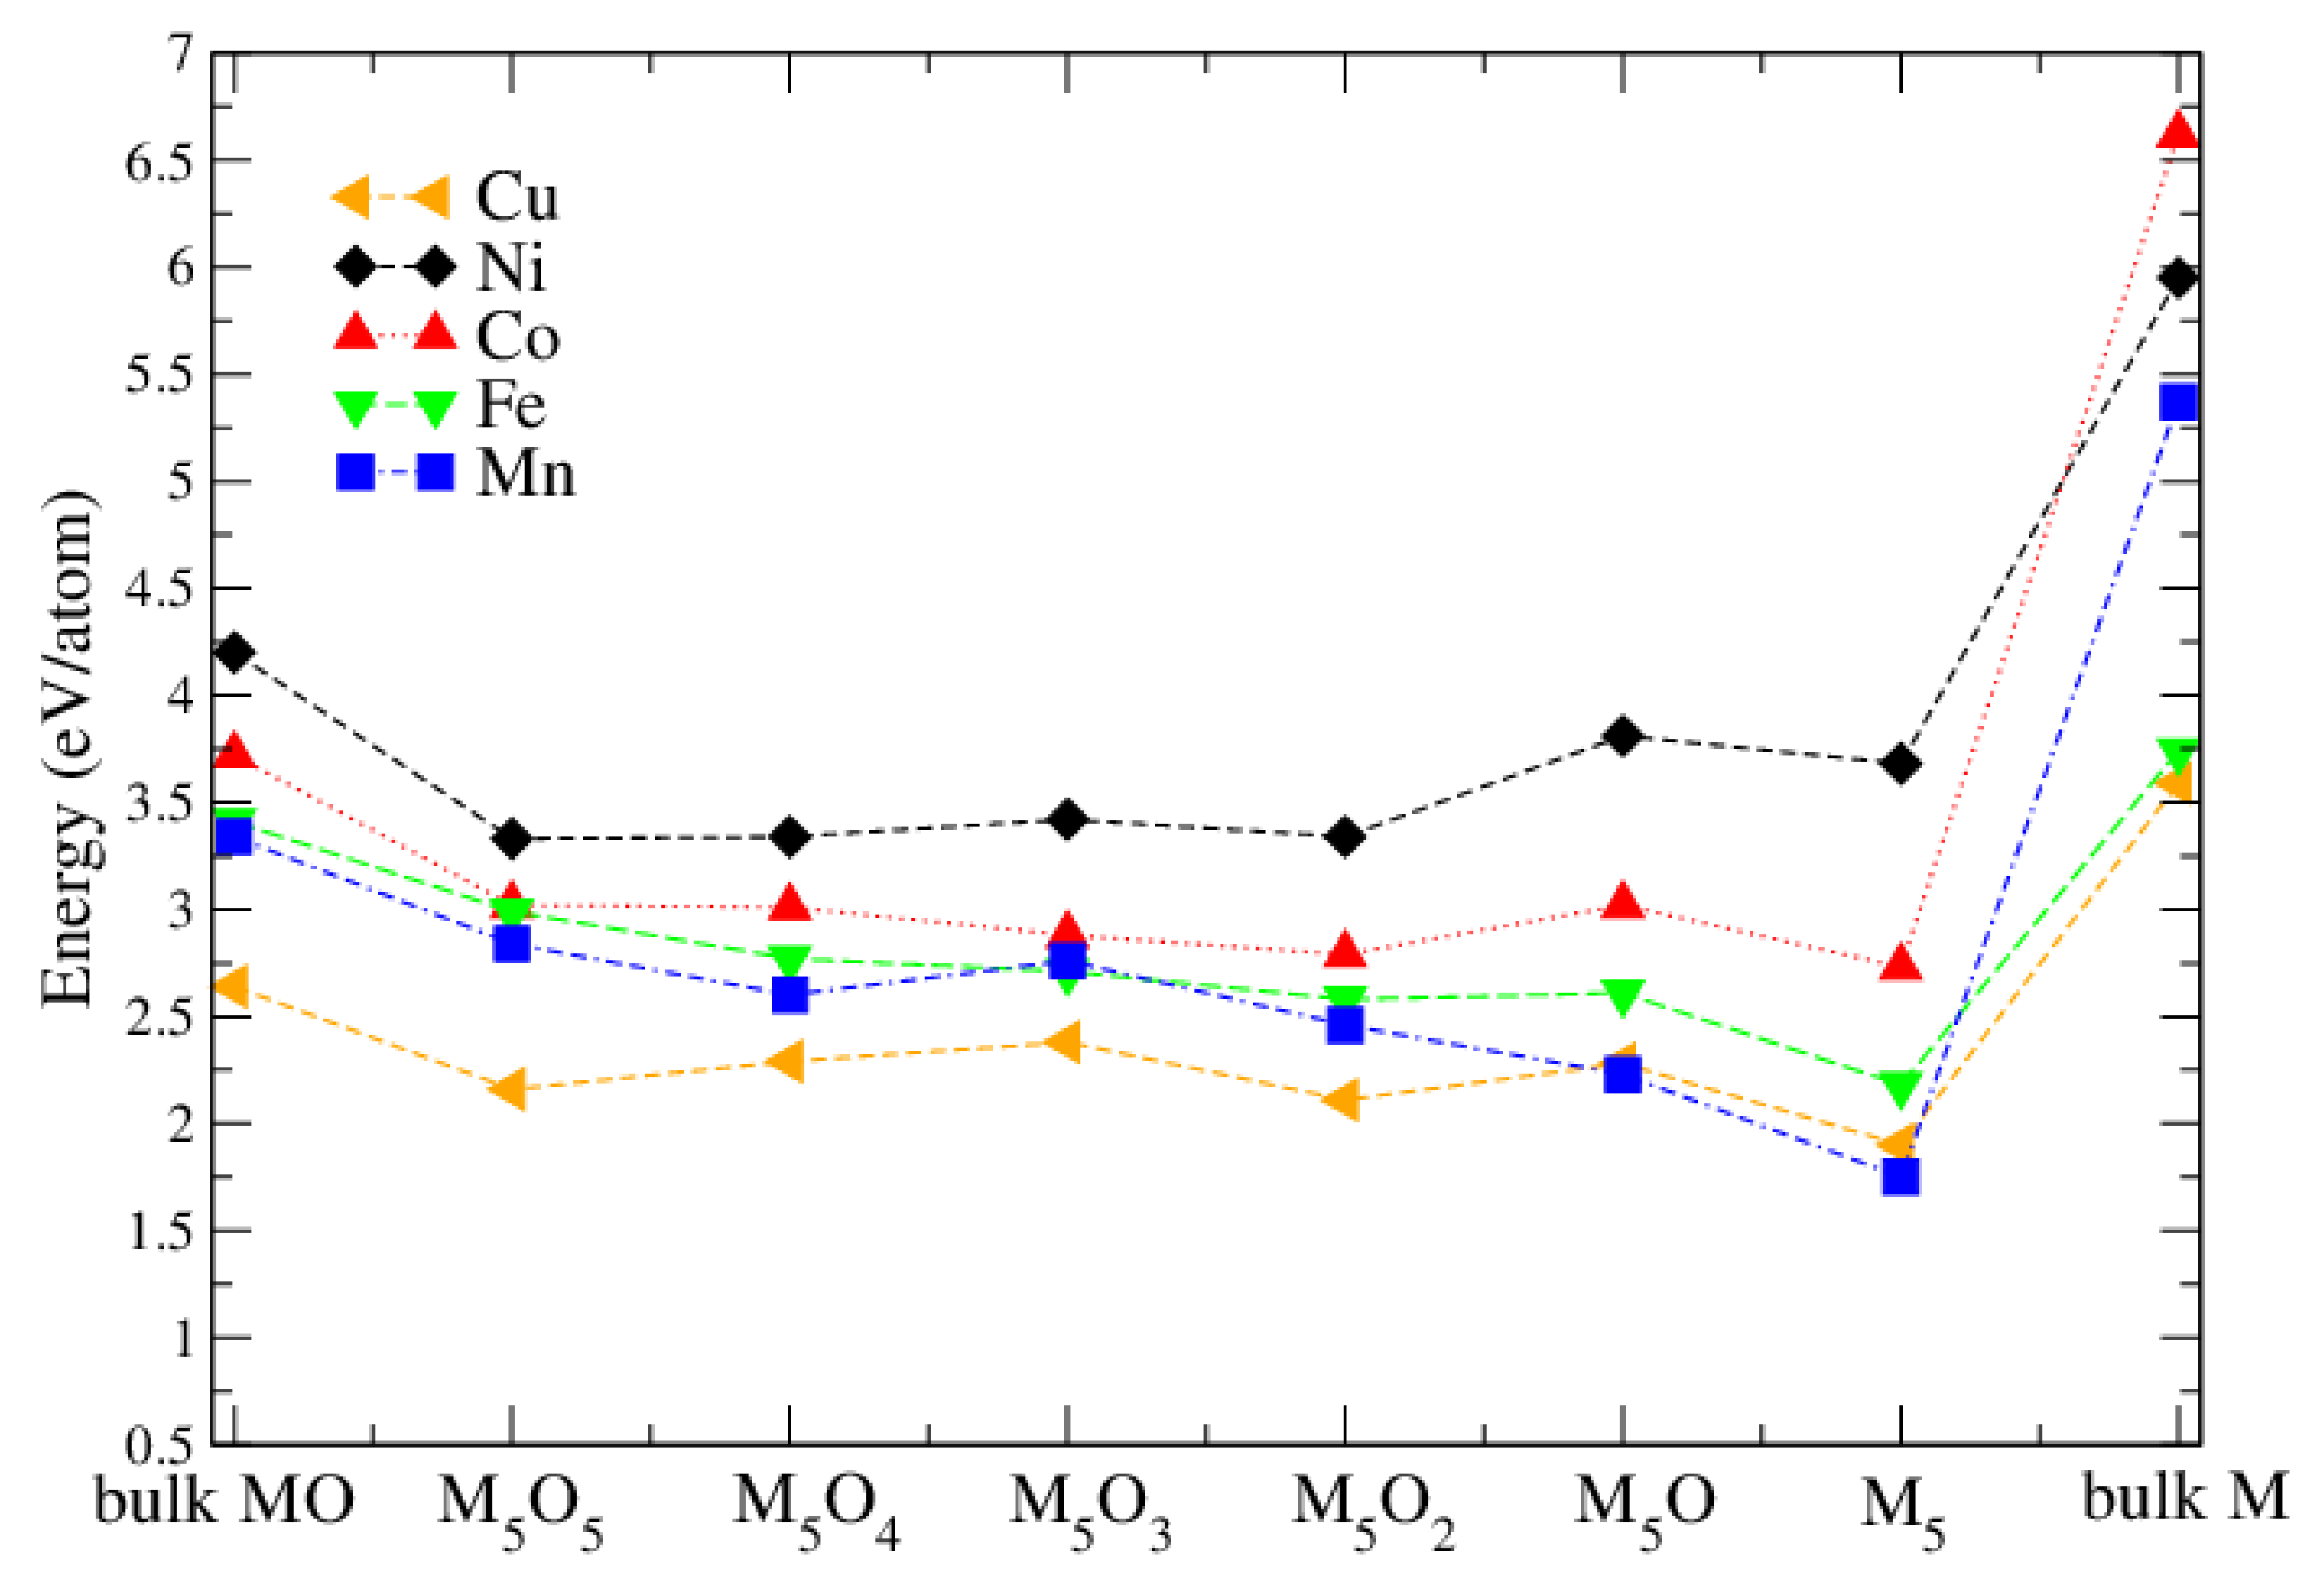
It was found experimentally [9] that the oxidation state of the M atoms changed after a hydrogen evolution reaction (HER) experiment. In order to study the M oxidation state theoretically, we started from the chain-like M clusters (Figure 6) and added oxygen atoms systematically until a fully oxidized M cluster has been obtained. Figure 8 compares the adsorption energy of different MO M oxide clusters on the surface and also includes for comparison the cohesive energy of the bulk pure metals and bulk metal monoxides. It can be seen that, among all metal-oxide clusters, NiO have the highest adsorption energy. All adsorption energies are lower than the cohesive energies of the corresponding bulk monoxide and the pure bulk metal. Thus they form non-crystalline clusters on the surface. It can be seen that Ni clusters are a bit more stable with less oxygen, while for the other metals the adsorption energy remains almost constant, or, in particular for Mn, is reduced with less oxygen. This is in agreement with experimental transition electron microscopy (TEM) results [9], where cluster formation was seen in particular for Ni. In addition, XPS on calcinated NiO-TiO samples shows mainly Ni, but after HER experiments a substantial increase of Ni compared to Ni appears. On the other hand, XPS on MnO-TiO samples shows only Mn, even after the HER experiments.
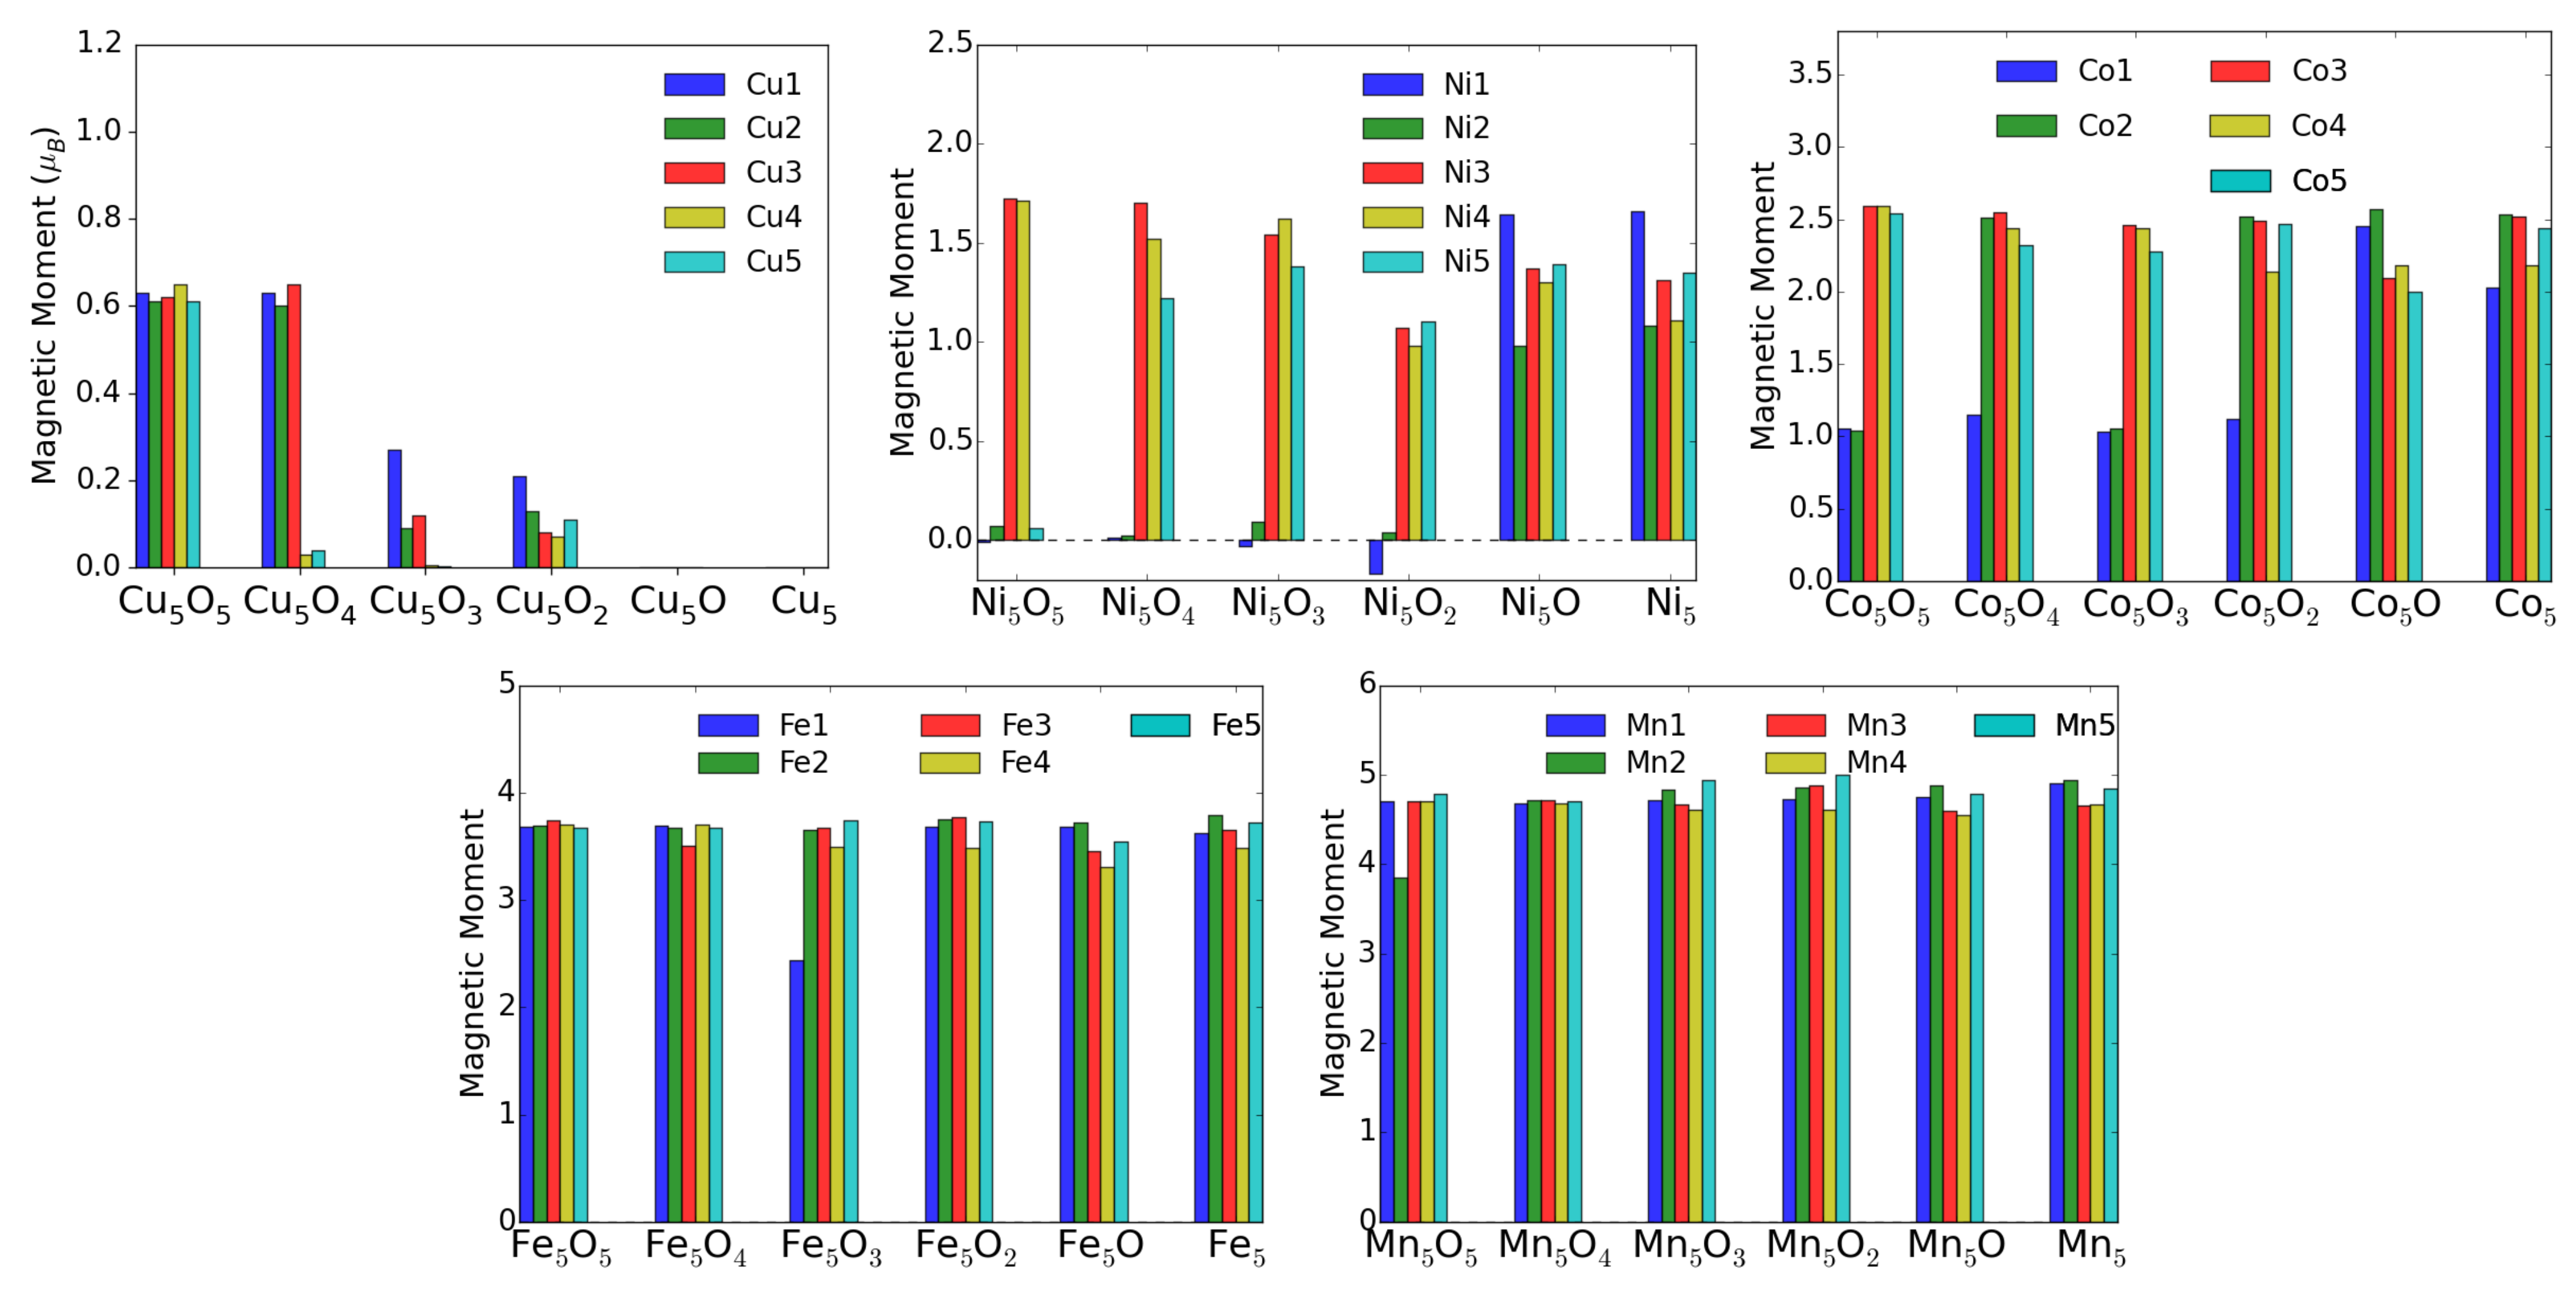
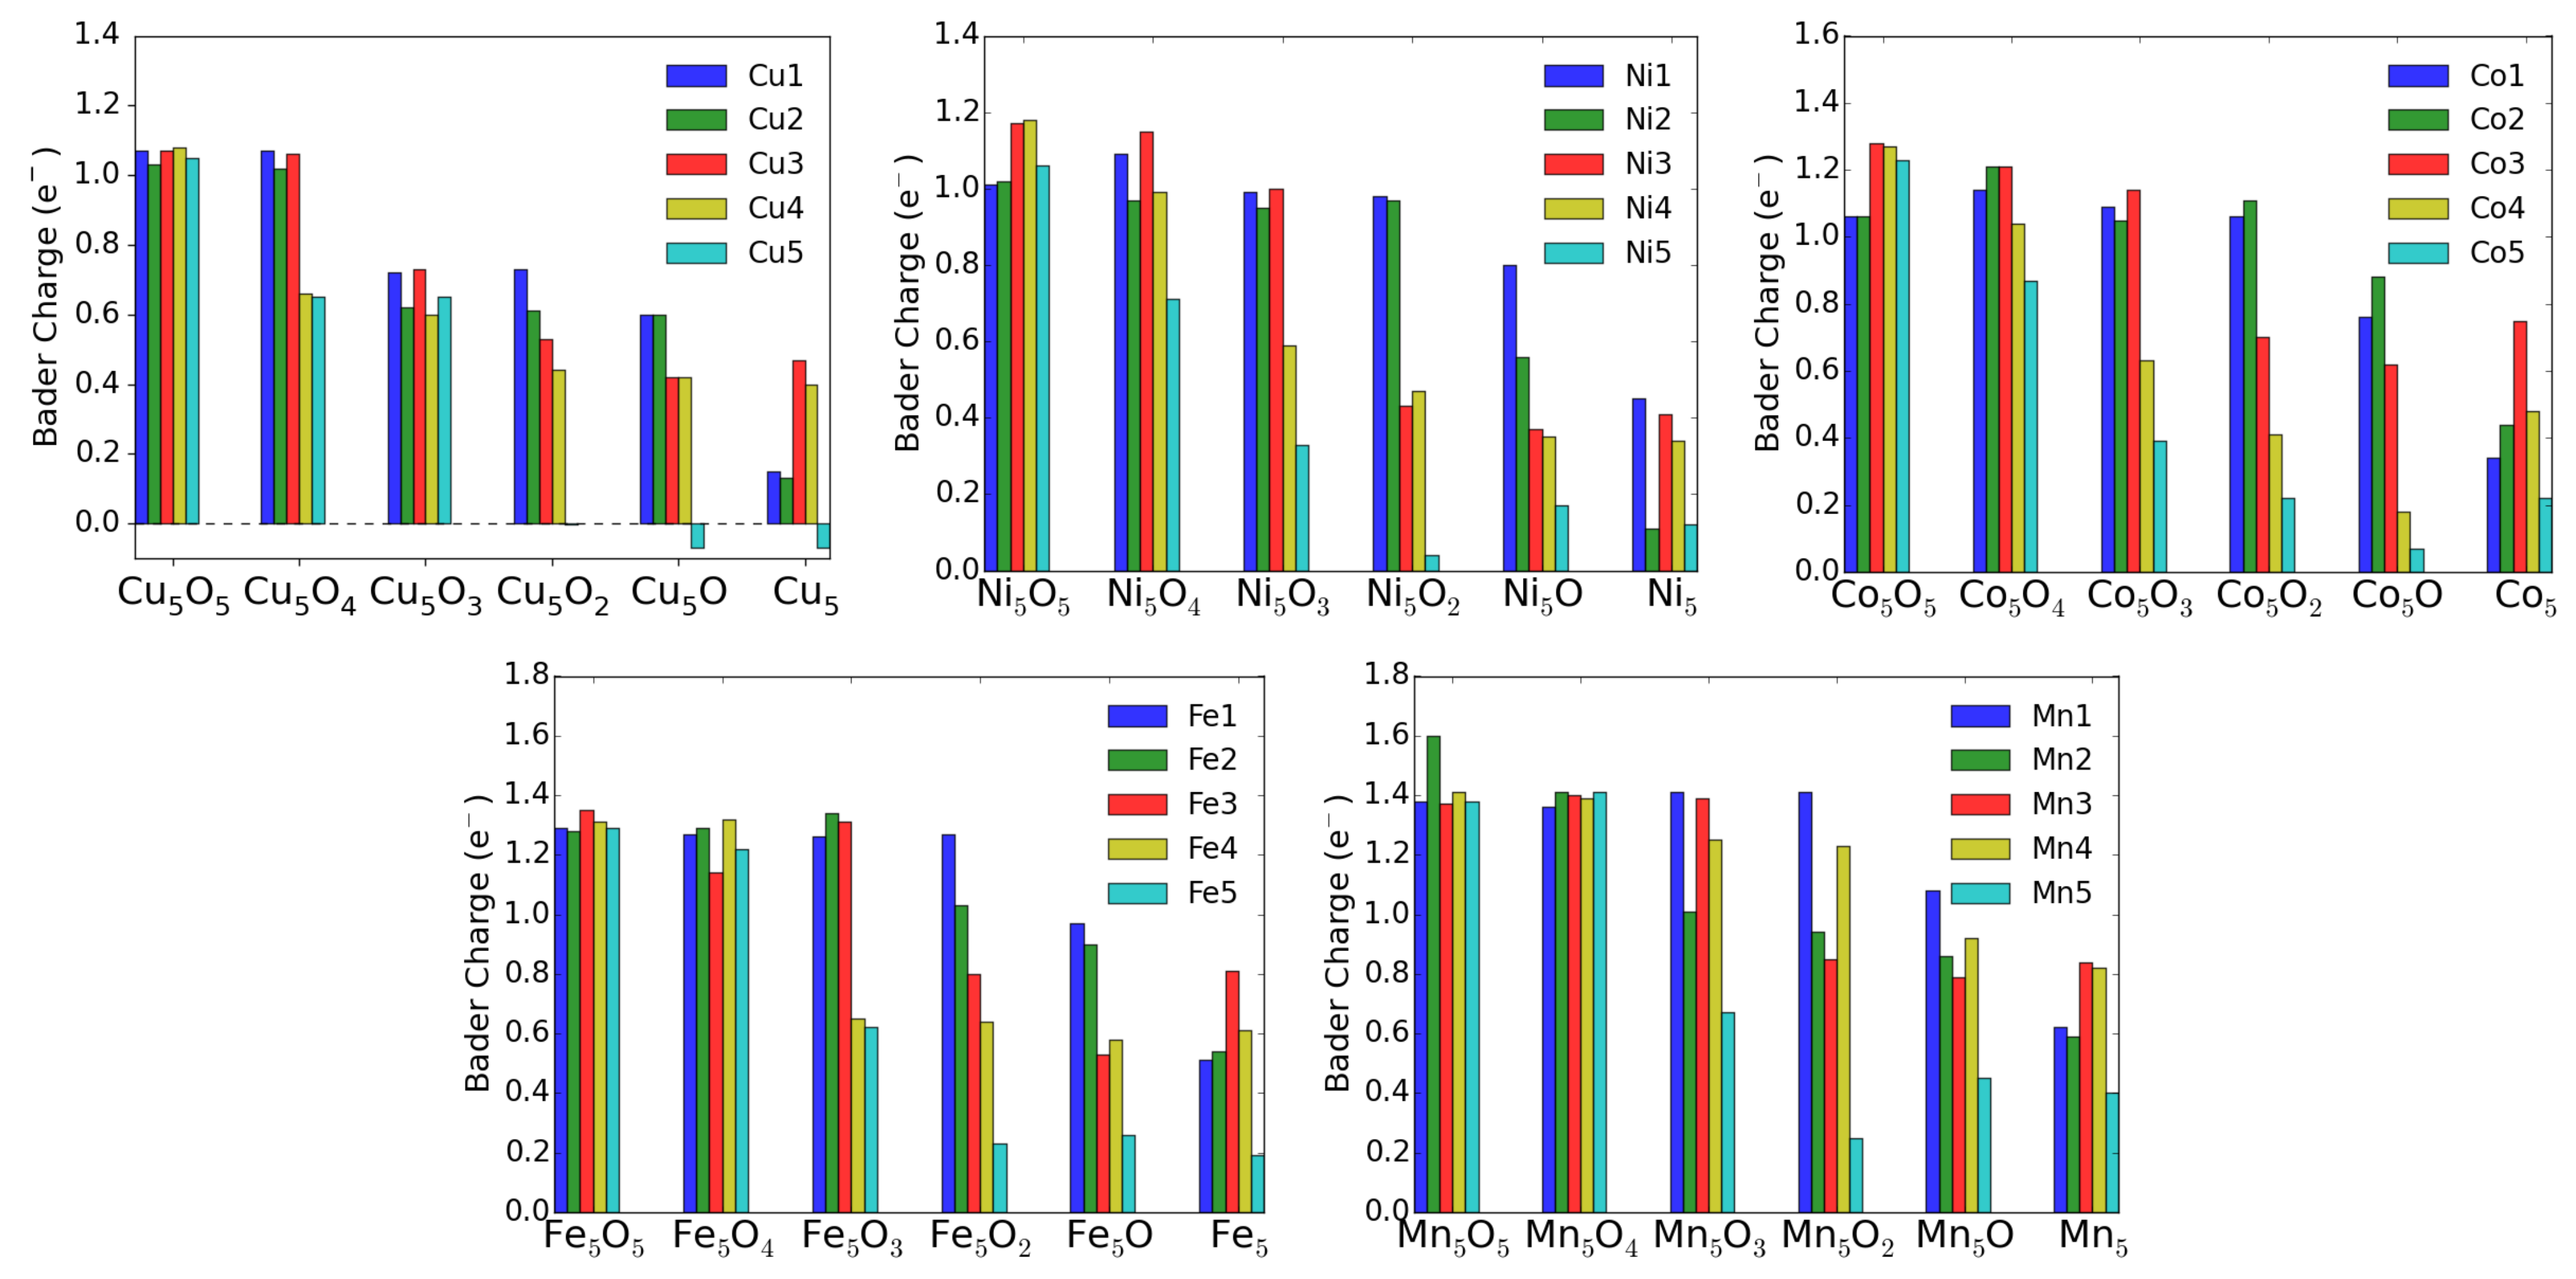
Theoretically, the oxidation state is more difficult to estimate. One can use for instance Bader’s method [26], which uses the electron density to calculate the gradient vector field and searches for surfaces of zero flux. The charge enclosed within this zero flux surface (basin) can be used to define the total electronic charge of an atom. It must be mentioned that one never gets the full nominal charges, but these Bader charges are always smaller than anticipated. In addition, in particular for open structures like surfaces, these charges may sometimes correlate more with the specific geometry and the distances and number of other atoms around the M atom. For transition-metal atoms, the magnetic moment can also be a good indication of the charge state in some cases. For instance, only Cu ions possess a magnetic moment, while both Cu and neutral Cu are non-magnetic. Similarly, one can quite well distinguish, e.g., Fe and Fe based on their smaller or larger magnetic moments (provided they remain in high-spin states). The magnetic moments and the Bader charges of each atom in MO clusters are shown in bar charts in Figure 9 and Figure 10. The largest magnetic moments for each M atom increase as expected from 0.6 for Cu to 1.6, 2.6, 3.7 and 4.9 in the series Ni, Co, Fe and Mn. This is due to the number of spin-down electrons that gets reduced when dealing with high-spin states and fully occupied spin-up states.
For the charge state of Cu clusters, both methods mentioned above give quite reliable results. Bader charges of about one and magnetic moments of 0.6 indicate Cu, while Bader charges of 0.6 indicate Cu and even smaller Bader charges neutral Cu, both with vanishing magnetic moments. Apparently, in the fully oxidized cluster all Cu are in the 2+ charge state, while removal of an O atom (see Figure 6) leads to a drastic reduction of the charge state of the neighboring Cu and Cu atoms.
For Ni, however, the situation is more complicated. Even in the fully oxidized cluster some Ni moments are completely quenched because the Ni-O bond length (1.77 Å) is for these Ni atoms much smaller than for the magnetic ions (1.97 Å) and it is difficult to estimate the charge states based on the magnetic moment. On the other hand the Bader charges show a very systematic decrease with oxygen removal, and the experimentally observed increase of neutral Ni correlates reasonably with these Bader charges. Going to the extreme case of Mn, the magnetic moments stay almost constant around 5 indicative of Mn in a high-spin state in agreement with experiment. The Bader charges are less convincing, but nevertheless they never indicate a neutral charge state of a Mn atom.
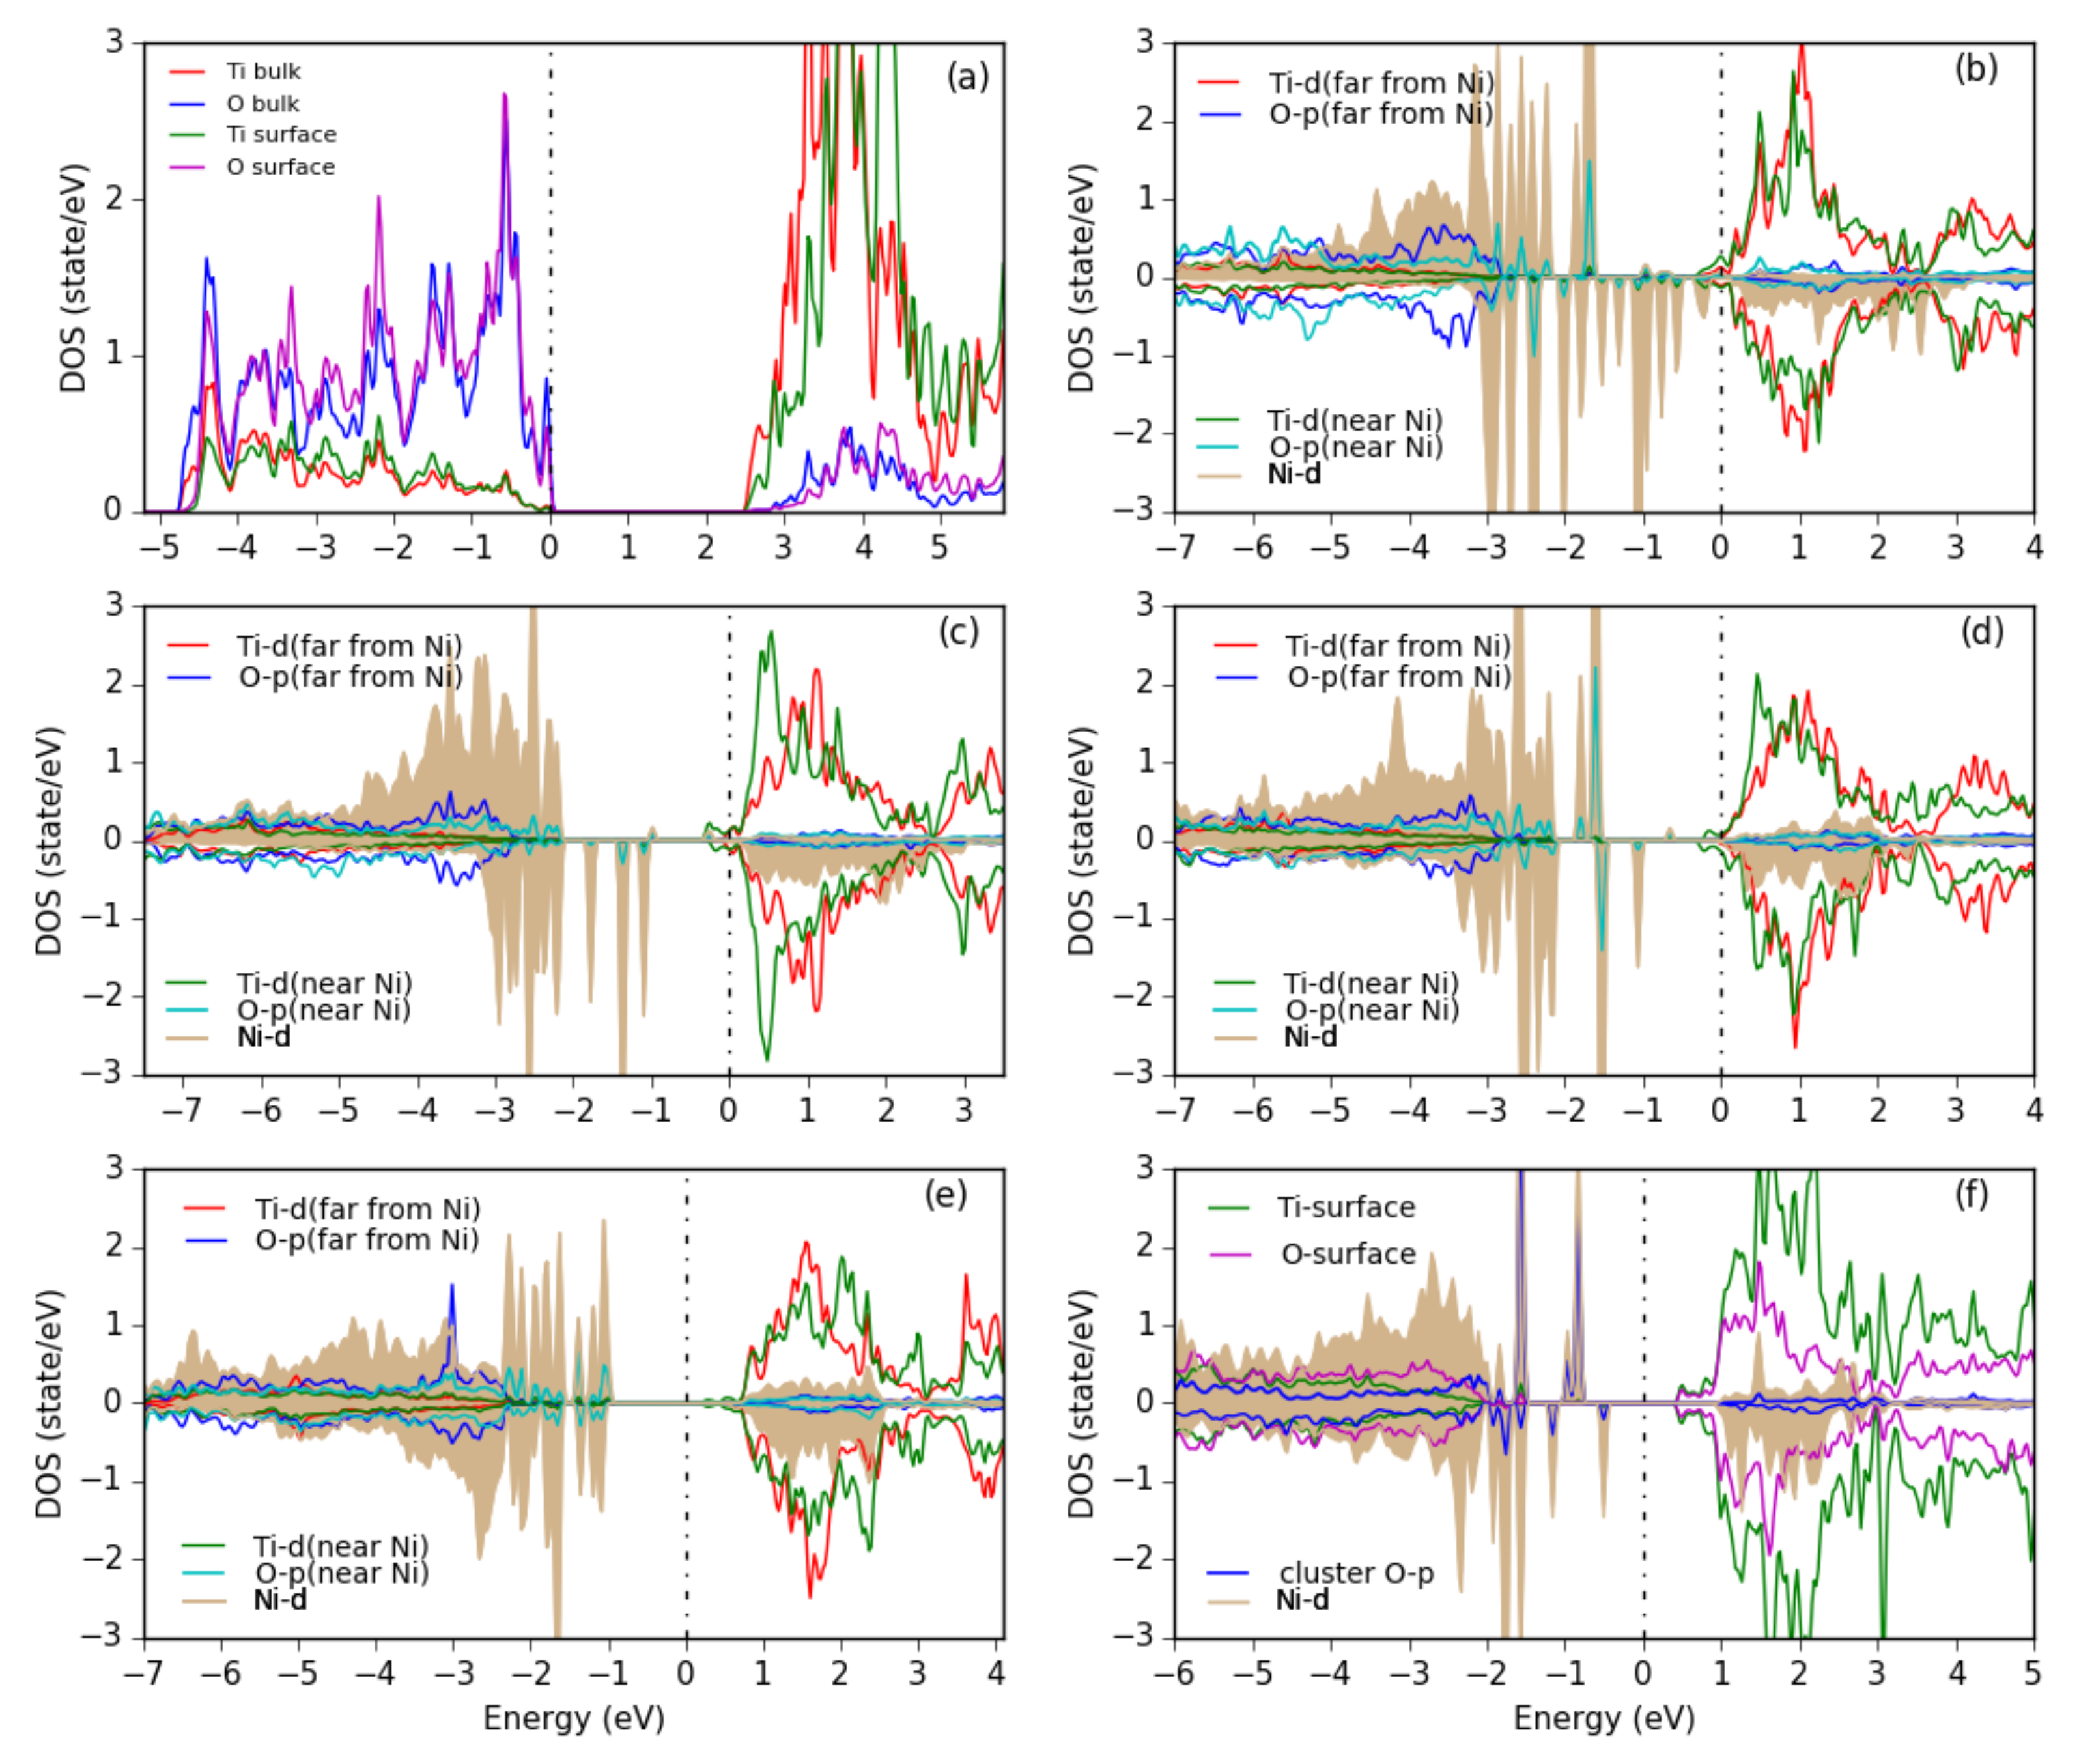
In order to get more information about the electronic structure, the PDOS of various Ni-O clusters is shown in Figure 11. For a Ni cluster (Figure 11b) we see a wide range of Ni-d states within the gap of TiO, but also some spin-up states mixed into the O- valence band and some spin-down states in the empty conduction band, indicating the different bonding situation of the different Ni atoms. Upon oxidation a more pronounced formation of upper and lower Hubbard bands can be seen and the remaining Ni-d states in the gap sharpen until for the NiO cluster (Figure 11f) quite sharp Ni-d states of (distorted) e and t character appear similar as in bulk NiO.
4. Summary and Conclusions
Spin-polarized DFT calculations were carried out to investigate possible stable structures of five different transition metal clusters, namely Cu, Ni, Co, Fe and Mn adsorbed on the anatase TiO(101) surface. The adsorption site for single atoms is in all cases the bridge site between two unsaturated oxygen (O) atoms. We found that among all tested metals Ni has the largest adsorption energy, and for all metals except Ni the adsorption energies decrease with increased number of adsorbed atoms, so that probably only Ni prefers to form bigger clusters on the TiO surface in agreement with experimental TEM results [9]. Clusters with five M atoms can form either a fcc-like structure (Cu, Ni, Co) or still remain in a chain-like structure (Fe, Mn) as is common for smaller clusters.
We also studied several oxidized metals clusters MO, and in order to get more information on the charge state of the M atom a systematic study of MO (y = 0–5) clusters on the TiO(101) surface was made. We found that Ni forms more stable structures with reduced oxidation, while for the other metals the adsorption energy is almost constant or is reduced. An analysis of the Bader charges and magnetic moments allows to reveal the corresponding charges of the M atoms, and we found, in agreement with the experimental results [9], that Ni can be more easily reduced during a HER experiment, while Mn atoms will keep their 2+ oxidation state.
Author Contributions
L.K.: investigation, formal analysis, writing—original draft, software, visualization. F.T.: writing—review and editing. P.B.: supervision, writing—review and editing. All authors have read and agreed to the published version of the manuscript.
Funding
This research was funded by the TU-D doctoral college (TU Vienna).
Institutional Review Board Statement
Not applicable.
Informed Consent Statement
Not applicable.
Data Availability Statement
The data presented in this study are available in insert article.
Conflicts of Interest
The authors declare no conflict of interest.
References
- Diebold, U. The surface science of titanium dioxide. Surf. Sci. Rep. 2003, 48, 53–229. [Google Scholar] [CrossRef]
- Khan, M.M.; Pradhan, D.; Sohn, Y. Nanocomposites for Visible Light-Induced Photocatalysis; Springer: Cham, Switzerland, 2017; Volume 101. [Google Scholar]
- Ameta, R.; Ameta, S.C. Photocatalysis: Principles and Applications; CRC Press: Boca Raton, FL, USA, 2016. [Google Scholar]
- Ibhadon, A.O.; Fitzpatrick, P. Heterogeneous photocatalysis: Recent advances and applications. Catalysts 2013, 3, 189–218. [Google Scholar] [CrossRef] [Green Version]
- Ni, M.; Leung, M.K.; Leung, D.Y.; Sumathy, K. A review and recent developments in photocatalytic water-splitting using TiO2 for hydrogen production. Renew. Sustain. Energy Rev. 2007, 11, 401–425. [Google Scholar] [CrossRef]
- Jafari, T.; Moharreri, E.; Amin, A.S.; Miao, R.; Song, W.; Suib, S.L. Photocatalytic water splitting—The untamed dream: A review of recent advances. Molecules 2016, 21, 900. [Google Scholar] [CrossRef] [PubMed]
- Liu, L.; Zhao, H.; Andino, J.M.; Li, Y. Photocatalytic CO2 reduction with H2O on TiO2 nanocrystals: Comparison of anatase, rutile, and brookite polymorphs and exploration of surface chemistry. ACS Catal. 2012, 2, 1817–1828. [Google Scholar] [CrossRef]
- Xu, M.; Gao, Y.; Moreno, E.M.; Kunst, M.; Muhler, M.; Wang, Y.; Idriss, H.; Wöll, C. Photocatalytic activity of bulk TiO2 anatase and rutile single crystals using infrared absorption spectroscopy. Phys. Rev. Lett. 2011, 106, 138302. [Google Scholar] [CrossRef] [PubMed] [Green Version]
- Schubert, J.S.; Popovic, J.; Haselmann, G.M.; Nandan, S.P.; Wang, J.; Giesriegl, A.; Cherevan, A.S.; Eder, D. Immobilization of Co, Mn, Ni and Fe oxide co-catalysts on TiO2 for photocatalytic water splitting reactions. J. Mater. Chem. A 2019, 7, 18568–18579. [Google Scholar] [CrossRef] [Green Version]
- Hohenberg, P.; Kohn, W. Inhomogeneous electron gas. Phys. Rev. 1964, 136, B864. [Google Scholar] [CrossRef] [Green Version]
- Kohn, W.; Sham, L.J. Self-consistent equations including exchange and correlation effects. Phys. Rev. 1965, 140, A1133. [Google Scholar] [CrossRef] [Green Version]
- Hebenstreit, W.; Ruzycki, N.; Herman, G.S.; Gao, Y.; Diebold, U. Scanning tunneling microscopy investigation of the TiO2 anatase (101) surface. Phys. Rev. B 2000, 62, R16334–R16336. [Google Scholar] [CrossRef]
- Alghannam, A.; Muhich, C.L.; Musgrave, C.B. Adatom surface diffusion of catalytic metals on the anatase TiO2(101) surface. Phys. Chem. Chem. Phys. 2017, 19, 4541–4552. [Google Scholar] [CrossRef]
- Wang, Y.; Su, Y.; Zhu, M.; Kang, L. Ni cluster nucleation and growth on the anatase TiO2(101) surface: A density functional theory study. RSC Adv. 2015, 5, 16582–16591. [Google Scholar] [CrossRef]
- Iyemperumal, S.K.; Fenton, T.G.; Gillingham, S.L.; Carl, A.D.; Grimm, R.L.; Li, G.; Deskins, N.A. The stability and oxidation of supported atomic-size Cu catalysts in reactive environments. J. Chem. Phys. 2019, 151, 054702. [Google Scholar] [CrossRef]
- Sharma, P.K.; Cortes, M.A.; Hamilton, J.; Han, Y. Surface modification of TiO2 with copper clusters for band gap narrowing. Catal. Today 2019, 321, 9–17. [Google Scholar] [CrossRef]
- Zhou, X.; Dong, H. A Theoretical perspective on charge separation and transfer in metal oxide photocatalysts for water splitting. ChemCatChem 2019, 11, 3688–3715. [Google Scholar] [CrossRef]
- Singh, D.J.; Nordström, L. Planewaves, Pseudopotentials and the LAPW Method, 2nd ed.; Springer: Berlin, Germany, 2006. [Google Scholar]
- Karsai, F.; Tran, F.; Blaha, P. On the importance of local orbitals using second energy derivatives for d and f electrons. Comput. Phys. Commun. 2017, 220, 230–238. [Google Scholar] [CrossRef]
- Blaha, P.; Schwarz, K.; Madsen, G.K.H.; Kvasnicka, D.; Luitz, J.; Laskowski, R.; Tran, F.; Marks, L.D. WIEN2k: An Augmented Plane Wave plus Local Orbitals Program for Calculating Crystal Properties; Vienna University of Technology: Vienna, Austria, 2018. [Google Scholar]
- Blaha, P.; Schwarz, K.; Tran, F.; Laskowski, R.; Madsen, G.K.H.; Marks, L.D. WIEN2k: An APW+ lo program for calculating the properties of solids. J. Chem. Phys. 2020, 152, 074101. [Google Scholar] [CrossRef] [PubMed]
- Perdew, J.P.; Ruzsinszky, A.; Csonka, G.I.; Vydrov, O.A.; Scuseria, G.E.; Constantin, L.A.; Zhou, X.; Burke, K. Restoring the density-gradient expansion for exchange in solids and surfaces. Phys. Rev. Lett. 2008, 100, 136406. [Google Scholar] [CrossRef] [Green Version]
- Schossberger, F. Über die Umwandlung des Titandioxyds. Zeitschrift Kristallographie 1942, 104, 358–374. [Google Scholar] [CrossRef]
- Anisimov, V.I.; Zaanen, J.; Andersen, O.K. Band theory and Mott insulators: Hubbard U instead of Stoner I. Phys. Rev. B 1991, 44, 943–954. [Google Scholar] [CrossRef] [Green Version]
- Bader, R.F.W. Atoms in Molecules: A Quantum Theory; Oxford University Press: Oxford, UK, 1990. [Google Scholar]
- Bader, R.F.W. Atoms in molecules. Acc. Chem. Res. 1985, 18, 9–15. [Google Scholar] [CrossRef]
Figure 1.
Side and top views of the top-most layer of the TiO(101) surface (in the supercell) with a single adsorbed Ni atom (middle) and two Ni atoms (right structure). Red, blue and gray spheres correspond to O, Ti and Ni atoms, respectively. Selected Ni-O bond distances (in Å) are also given. O and O are threefold coordinated oxygen with two Ti and one Ti, and two Ti and one Ti nearest neighbors, respectively.

Figure 2.
Side and top views of the top-most layer of the TiO(101) surface with an adsorbed Ni cluster in a chain-like structure. The color coding is as in Figure 1.
Figure 2.
Side and top views of the top-most layer of the TiO(101) surface with an adsorbed Ni cluster in a chain-like structure. The color coding is as in Figure 1.

Figure 3.
Side view of the starting (left) and relaxed structures of Ni (middle) and Fe clusters (right) adsorbed on the TiO(101) surface in a crystalline structure. The color coding is as in Figure 1.
Figure 3.
Side view of the starting (left) and relaxed structures of Ni (middle) and Fe clusters (right) adsorbed on the TiO(101) surface in a crystalline structure. The color coding is as in Figure 1.

Figure 4.
Adsorption energy (in eV/atom) for different metal clusters M. M(1) and M(2) correspond to chain-like and crystalline structures, respectively.
Figure 4.
Adsorption energy (in eV/atom) for different metal clusters M. M(1) and M(2) correspond to chain-like and crystalline structures, respectively.

Figure 5.
PDOS for (a) the bare TiO(101) surface and (b–f) for one metal atom adsorbed on the TiO(101) surface. The Fermi level is indicated by a vertical dashed line. All Ti and O PDOS are from surface atoms. The d partial DOS of the metals are scaled down by a factor of 3. The plots are aligned at the TiO CBM and the Fermi energy is set at 0 eV.

Figure 6.
Top view of the Ni cluster (left) and, top and side view of NiO cluster (middle and right) adsorbed on TiO(101) surface in chain-like structure. Red, blue, gray and green spheres correspond to O, Ti, Ni and added O, respectively. From Ni to NiO, the O atoms are added in the order O, O, O, O and O.

Figure 7.
NiO cluster with a NaCl-like structure adsorbed on the TiO(101) surface. The color coding is as in Figure 6.
Figure 7.
NiO cluster with a NaCl-like structure adsorbed on the TiO(101) surface. The color coding is as in Figure 6.

Figure 8.
Adsorption energy (in eV/atom) of MO clusters on the TiO(101) surface. Also shown is the cohesive energy of bulk MO (left-most data) and bulk M (right-most data).
Figure 8.
Adsorption energy (in eV/atom) of MO clusters on the TiO(101) surface. Also shown is the cohesive energy of bulk MO (left-most data) and bulk M (right-most data).

Figure 9.
Atomic magnetic moments (in ) of M atoms in MO clusters adsorbed on TiO(101) surface.

Figure 10.
Bader charges of M atoms in MO clusters adsorbed on TiO(101) surface.

Figure 11.
PDOS for (a) the bare anatase TiO(101) surface, showing the surface atoms and the bulk-layer states, (b) Ni, (c) NiO, (d) NiO, (e) NiO clusters in chain-like structures and (f) a NiO cluster with NaCl-like structure adsorbed on the surface. All Ti and O PDOS are from surface atoms only. The Ni PDOS is shaded. The plots are aligned at the TiO CBM and the Fermi energy is set at 0 eV.


Table 1.
Shortest M-O bonds (in Å) between a M atom (of the pure metal clusters adsorbed on the TiO(101) surface) and O atoms (O and O) of TiO. M(1) and M(2) refer to chain-like and crystalline structures, respectively, and Mn(2a) corresponds to a bcc like structure with antiferromagnetic configuration. The results for different M atoms are separated by semi-colons. “(2)” means two bonds of same length.
| MO Bulk | MO at the Surface | M-O at the Surface | |
|---|---|---|---|
| TiO-Cu | (CuO)1.97/(CuO)1.86 | 1.87(2) | 2.33, 2.47 |
| TiO-Cu | (1.88, 1.89); (1.88, 1.89) | (2.34, 2.52); (2.34, 2.52) | |
| TiO-Cu | 1.90(2); 1.90(2); 1.90(2) | (2.28, 2.46); (2.28, 2.46); (2.29, 2.46) | |
| TiO-Cu(1) | 1.97; 2.11; (2.09, 2.10); (2.04, 2.15); 2.83 | (2.81, 2.71); (2.31, 2.90); 2.30; 2.42; - | |
| TiO-Cu(2) | 1.86; -; -; 2.94; 1.86 | -; -; -; 2.00; 2.75 | |
| TiO-Ni | 2.08 | 1.84(2) | 2.37, 2.38 |
| TiO-Ni | (1.91, 1.92); (1.91, 1.92) | (2.04, 2.16); (2.04, 2.16) | |
| TiO-Ni | 1.89(2); 1.89(2); 1.89(2) | (2.02, 2.31); (2.02, 2.31); (2.02, 2.31) | |
| TiO-Ni(1) | 2.02; 1.99; (2.04, 2.22); (2.13, 2.46); 2.86 | 2.04; 2.75; 2.10; 2.04; 2.05 | |
| TiO-Ni(2) | (1.96, 1.94); 2.13; 1.98; -; 2.07 | (2.04, 2.16); -; -; 2.01; 2.07 | |
| TiO-Co | 2.13 | 1.89(2) | 2.03, 2.71 |
| TiO-Co | 1.97(2); (1.88, 1.89) | (2.03, 2.04); (2.03, 2.76) | |
| TiO-Co | (1.99, 2.00); (2.03, 1.91); (1.90, 2.02) | (2.05, 2.09); (2.04, 2.12); (2.04, 2.29) | |
| TiO-Co(1) | 2.08; 2.30; (2.06, 2.09); (2.03, 2.06); 2.06 | (2.15, 2.30); 2.04; 2.13; 2.15; 2.86 | |
| TiO-Co(2) | 2.02; -; 1.91; 2.90; 2.07 | 2.09; -; -; 1.96; 2.19 | |
| TiO-Fe | 2.16 | 1.89(2) | 2.08, 2.23 |
| TiO-Fe | (1.88, 1.91); (1.88, 1.91) | (2.10, 2.11); (2.10, 2.11) | |
| TiO-Fe | 1.88(2); 1.88(2); 1.88(2) | (2.11, 2.14); (2.11, 2.14); (2.11, 2.14) | |
| TiO-Fe(1) | 2.03; 2.09; (2.00, 2.09); (2.05, 2.15); 2.98 | (2.21, 2.25); 2.09; 2.14; 2.06; 2.02 | |
| TiO-Fe(2) | (2.06, 2.05); 2.04; 2.04; 2.22; 2.25 | (2.14, 2.04); -; -; 2.11; 2.08 | |
| TiO-Mn | 2.22 | 1.93(2) | 2.14, 2.30 |
| TiO-Mn | 1.94(2); 1.94(2) | (2.11, 2.28); (2.11, 2.28) | |
| TiO-Mn | (1.91, 1.92); (1.92, 1.93); (1.92, 1.93) | (2.16, 2.30); (2.16, 2.27); (2.16, 2.27) | |
| TiO-Mn(1) | 2.17; 2.19; (2.03, 2.08); (2.10, 2.03); 3.27 | 2.12; 2.13; 2.16; 2.16; 2.07 | |
| TiO-Mn(2) | (2.02, 2.02); 2.08; 2.08; 2.17; 2.18 | (2.03, 2.04); -; -; 2.09 | |
| TiO-Mn(2a) | (2.14, 2.15); 2.09; 2.09; 2.07; 2.07 | 2.15; -; -; 2.15; 2.16 |
Table 2.
Adsorption energy (in eV/atom) and atomic magnetic moment (in ) for pure metal clusters adsorbed on the TiO(101) surface. M(1) and M(2) refer to the chain-like and crystalline structures, respectively, and Mn(2a) corresponds to the bcc structure with antiferromagnetic configuration. The cohesive energies for bulk MO are 2.75, 4.20, 3.72, 3.41, and 3.34 eV for Cu, Ni, Co, Fe, and Mn, respectively.
| Solid | Magnetic Moment | |
|---|---|---|
| TiO-Cu | 2.24 | 0 |
| TiO-Cu | 2.08 | 0 |
| TiO-Cu | 1.99 | 0 |
| TiO-Cu(1) | 1.90 | 0 |
| TiO-Cu(2) | 2.26 | 0 |
| TiO-Ni | 3.46 | 0.25 |
| TiO-Ni | 4.11 | 0.97(2) |
| TiO-Ni | 3.94 | 0.98(3) |
| TiO-Ni(1) | 3.68 | 1.66; 1.08; 1.31; 1.11; 1.35 |
| TiO-Ni(2) | 4.49 | −0.97; 1.22; 0.74; −1.10; 0.87 |
| TiO-Co | 3.19 | 2.12 |
| TiO-Co | 3.04 | 2.12; 2.11 |
| TiO-Co | 3.00 | 2.15; 2.28; 2.28 |
| TiO-Co(1) | 2.73 | 2.03; 2.53; 2.52; 2.18; 2.44 |
| TiO-Co(2) | 2.87 | 2.34; 2.00; 2.66; 1.96; 2.04 |
| TiO-Fe | 2.71 | 3.61 |
| TiO-Fe | 2.57 | 3.51; 3.50 |
| TiO-Fe | 2.48 | 3.52(3) |
| TiO-Fe(1) | 2.18 | 3.62; 3.79; 3.64; 3.48; 3.71 |
| TiO-Fe(2) | 2.03 | 3.00; 3.75; 3.72; 3.58; 3.57 |
| TiO-Mn | 2.40 | 4.66 |
| TiO-Mn | 2.19 | 4.66(2) |
| TiO-Mn | 2.08 | 4.61; 4.61; 4.63 |
| TiO-Mn(1) | 1.78 | 4.90; 4.94; 4.66; 4.66; 4.83 |
| TiO-Mn(2) | 1.10 | 0.45; 5.00; 4.99; 4.57; 4.57 |
| TiO-Mn(2a) | 1.44 | 4.90; −5.04; 5.03; −4.73; −4.73 |
Table 3.
Adsorption energy (in eV/atom) of NiO clusters on TiO(101) surface. The largest values are in bold.
Table 3.
Adsorption energy (in eV/atom) of NiO clusters on TiO(101) surface. The largest values are in bold.
| Cluster | |
|---|---|
| NiO(1) | 3.55 |
| NiO(2) | 3.14 |
| NiO(3) | 3.19 |
| NiO(4) | 3.14 |
| NiO(1) | 3.07 |
| NiO(2) | 2.59 |
| NiO(3) | 3.58 |
| NiO(1) | 3.32 |
| NiO(2) | 3.17 |
| NiO(3) | 2.75 |
| NiO(4) | 3.51 |
| NiO(1) | 3.42 |
| NiO(2) | 2.87 |
| NiO | 3.35 |
| NiO | 3.63 |
Publisher’s Note: MDPI stays neutral with regard to jurisdictional claims in published maps and institutional affiliations. |
© 2021 by the authors. Licensee MDPI, Basel, Switzerland. This article is an open access article distributed under the terms and conditions of the Creative Commons Attribution (CC BY) license (https://creativecommons.org/licenses/by/4.0/).
Share and Cite
MDPI and ACS Style
Kalantari, L.; Tran, F.; Blaha, P. Density Functional Theory Study of Metal and Metal-Oxide Nucleation and Growth on the Anatase TiO2(101) Surface. Computation 2021, 9, 125. https://0-doi-org.brum.beds.ac.uk/10.3390/computation9110125
AMA Style
Kalantari L, Tran F, Blaha P. Density Functional Theory Study of Metal and Metal-Oxide Nucleation and Growth on the Anatase TiO2(101) Surface. Computation. 2021; 9(11):125. https://0-doi-org.brum.beds.ac.uk/10.3390/computation9110125
Chicago/Turabian StyleKalantari, Leila, Fabien Tran, and Peter Blaha. 2021. "Density Functional Theory Study of Metal and Metal-Oxide Nucleation and Growth on the Anatase TiO2(101) Surface" Computation 9, no. 11: 125. https://0-doi-org.brum.beds.ac.uk/10.3390/computation9110125
Note that from the first issue of 2016, this journal uses article numbers instead of page numbers. See further details here.