
Optimal Economic–Environmental Operation of BESS in AC Distribution Systems: A Convex Multi-Objective Formulation

 ,
,  , and
, and
Abstract
:1. Introduction
- ✓
- A multi-purpose convex formulation for the efficient operation of energy storage systems in alternating current distribution networks, considering the simultaneous minimization of carbon dioxide emissions in diesel plants and energy losses in conductors. To this end, a reformulation of the second-order cone programming model of the multi-period optimal flow problem is proposed, with the main advantage of ensuring that the global optimum is found;
- ✓
- The application of the weighted weights method to transform the multi-objective optimization model into a single-objective equivalent, which is iteratively solved to obtain the Pareto optimal front by solving this model using the Self-Dual-Minimization (SeDuMi) and SemiDefinite Programming (SDPT3) tools available in the MATLAB CVX tool;
- ✓
- The assessment of the effect of manageable reactive power injection in the batteries concerning the cost of CO2 losses and emissions when compared with the unity power factor scenario.
2. Mathematical Formulation
3. Convex Reformulation
4. Solution Strategy
5. Test System and Characteristics
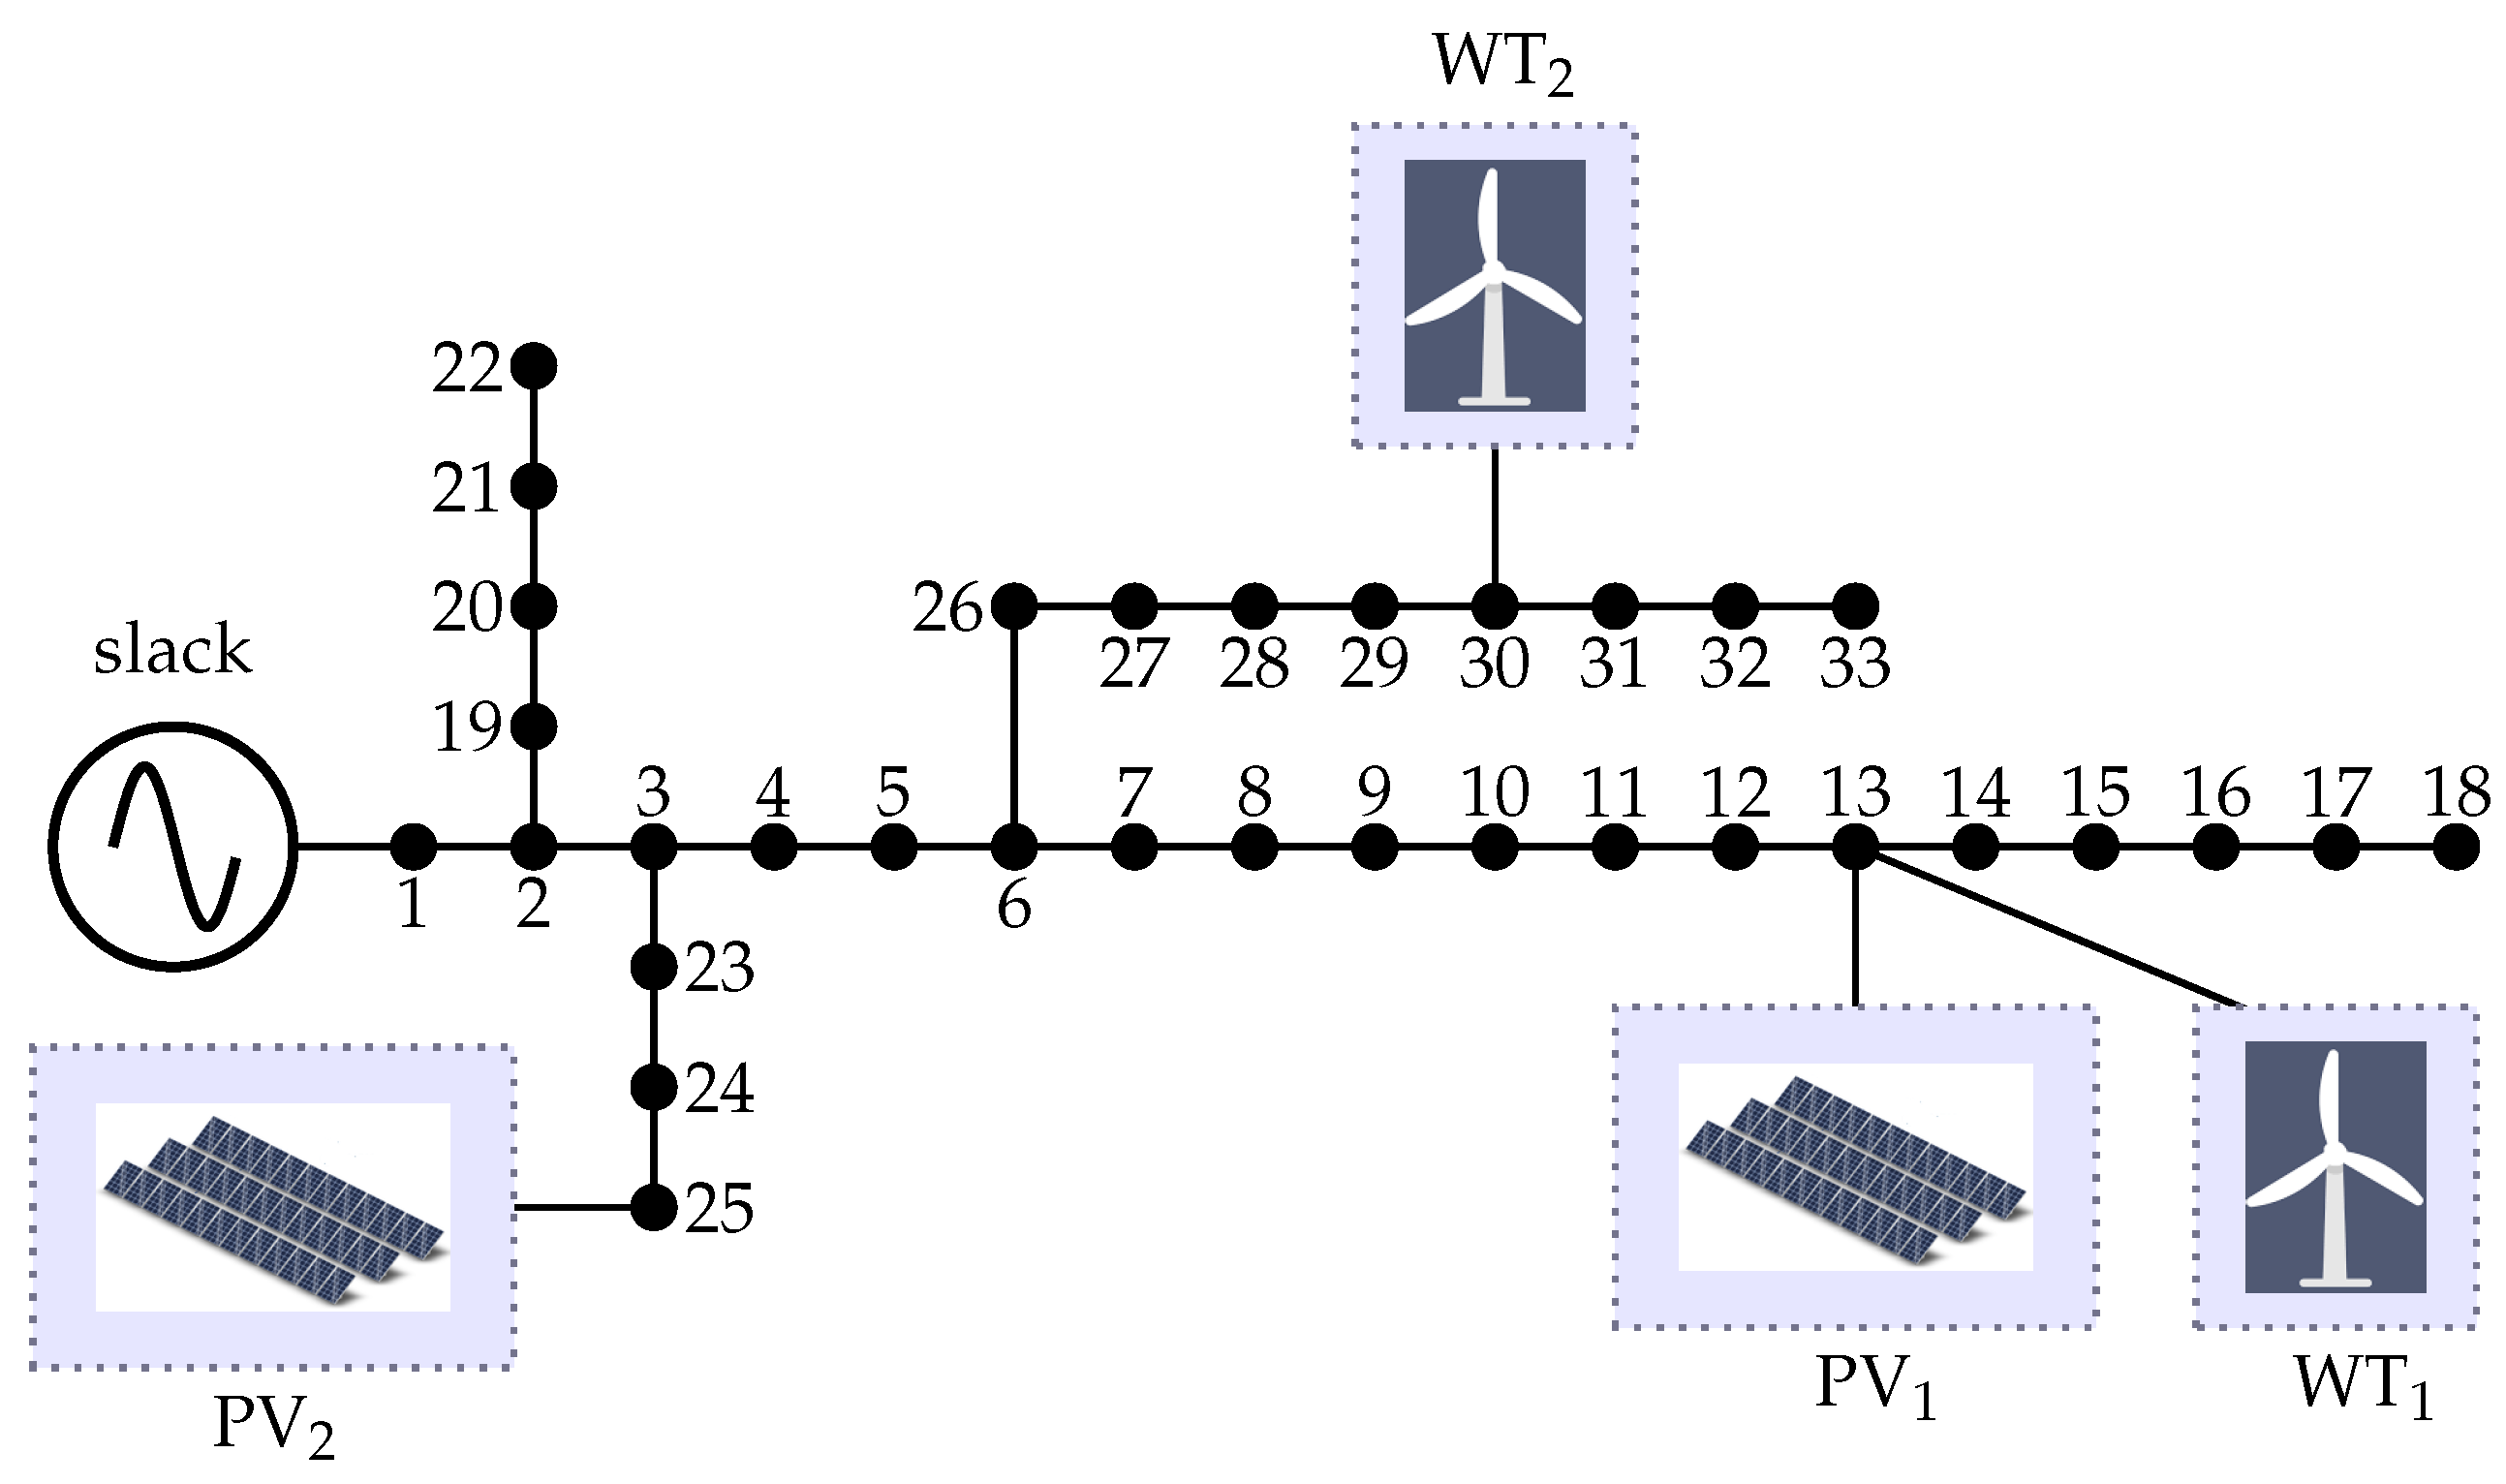
- ✓
- The photovoltaic generator PV1 is connected to node 13 with a nominal generation of 450 kW, and the photovoltaic generator PV2 is installed at node 25 with a nominal generation of 1500 kW;
- ✓
- The wind generator WT1 is installed at node 13 with a nominal power of 825 kW, and the wind generator WT2 is installed at node 30 with a maximum power generation of 1200 kW.
- ✓
- A type-A battery with an energy storage capacity of 1000 kWh and charge/discharge times of 4 h;
- ✓
- A type-B battery with an energy storage capacity of 1500 kWh and charge/discharge times of 4 h;
- ✓
- A type-C battery with an energy storage capacity of 2000 kWh and charge/discharge times of 5 h.
6. Computational Validation and Discussion
6.1. Scenario 1
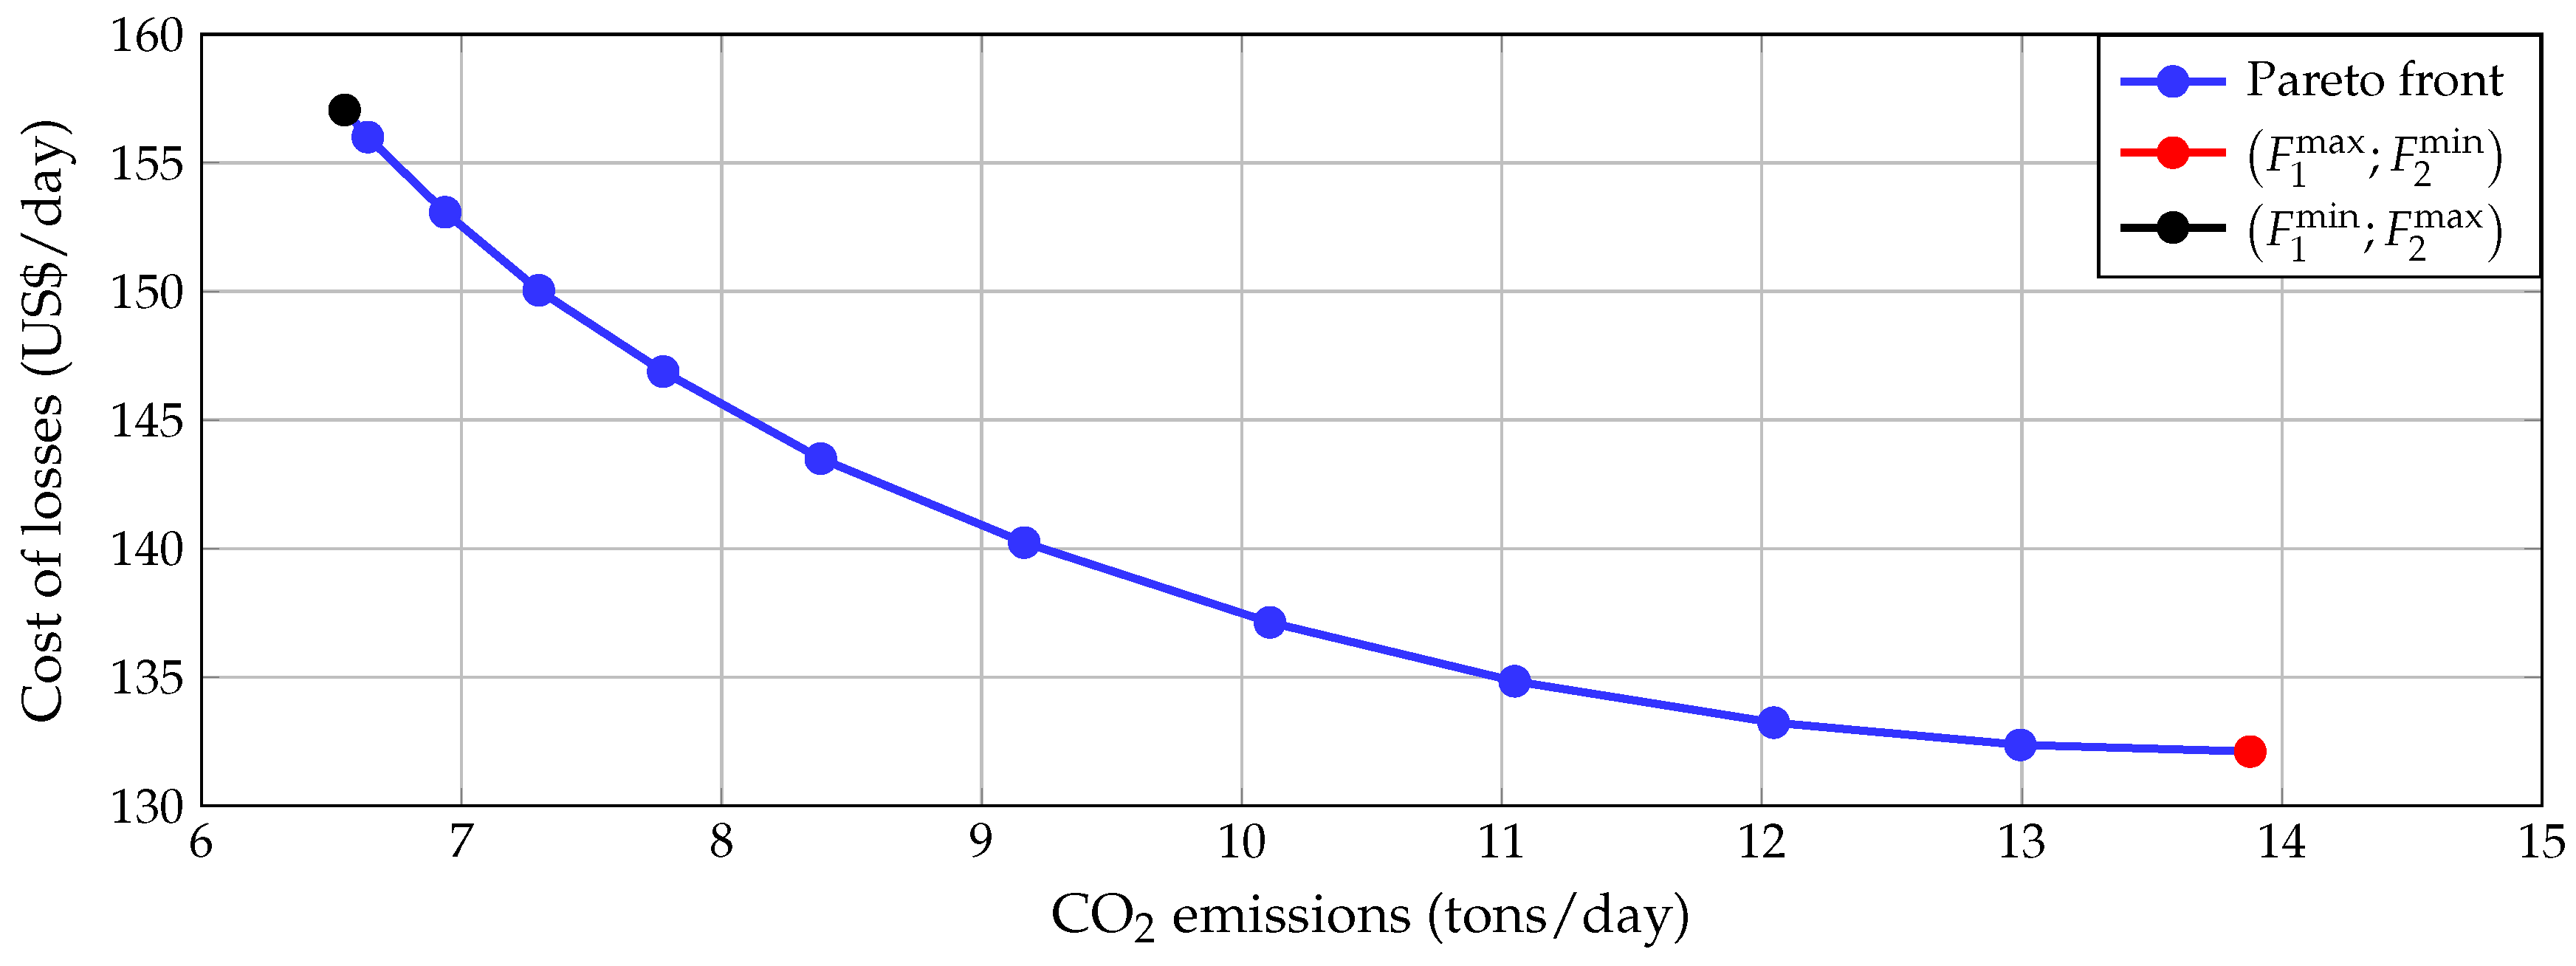
- ✓
- The maximum value of CO2 gas emissions to the atmosphere, i.e., , is 13.8780 tons/day; whereas the maximum value of the daily cost of energy losses, i.e., , is USD 157.0549;
- ✓
- The minimum values of CO2 gas emissions to the atmosphere, i.e., , is 6.5502 tons/day; whereas the minimum value of the daily cost of energy losses, i.e., , is USD 132.1042;
- ✓
- The difference between the maximum and minimum values of CO2 gas emissions is 7.3278 tons/day, which implies a maximum achievable reduction of 52.80%;
- ✓
- The analysis of the extremes of the daily cost of energy losses shows that the difference between its maximum and minimum values is USD 24.9507, which implies a maximum achievable reduction of 15.89%.
6.2. Scenario 2
- ✓
- The maximum value of CO2 gas emissions to the atmosphere, i.e., , is 13.7072 tons/day, whereas the maximum value of the daily cost of energy losses, i.e., , is USD 68.6022. These results imply a reduction of 0.1708 tons/day in greenhouse gas emissions and 85.4527 USD/day in the cost of energy losses;
- ✓
- The minimum value of CO2 gas emissions to the atmosphere, i.e., , is 6.3317 tons/day, whereas the minimum value of the daily cost of energy losses, i.e., , is USD 44.7601. As in the case of the upper bounds, in this case, daily reductions of 0.2185 tons of CO2 and USD 87.3441 are achieved;
- ✓
- The main effect of reactive power injection on the multi-objective operation of the BESS is to reduce energy losses in conductors, because this reduction helps to locally offset the consumption of reactants, which translates into currents of lower magnitude in the branches, and, therefore, lower losses.
6.3. Complementary Analysis
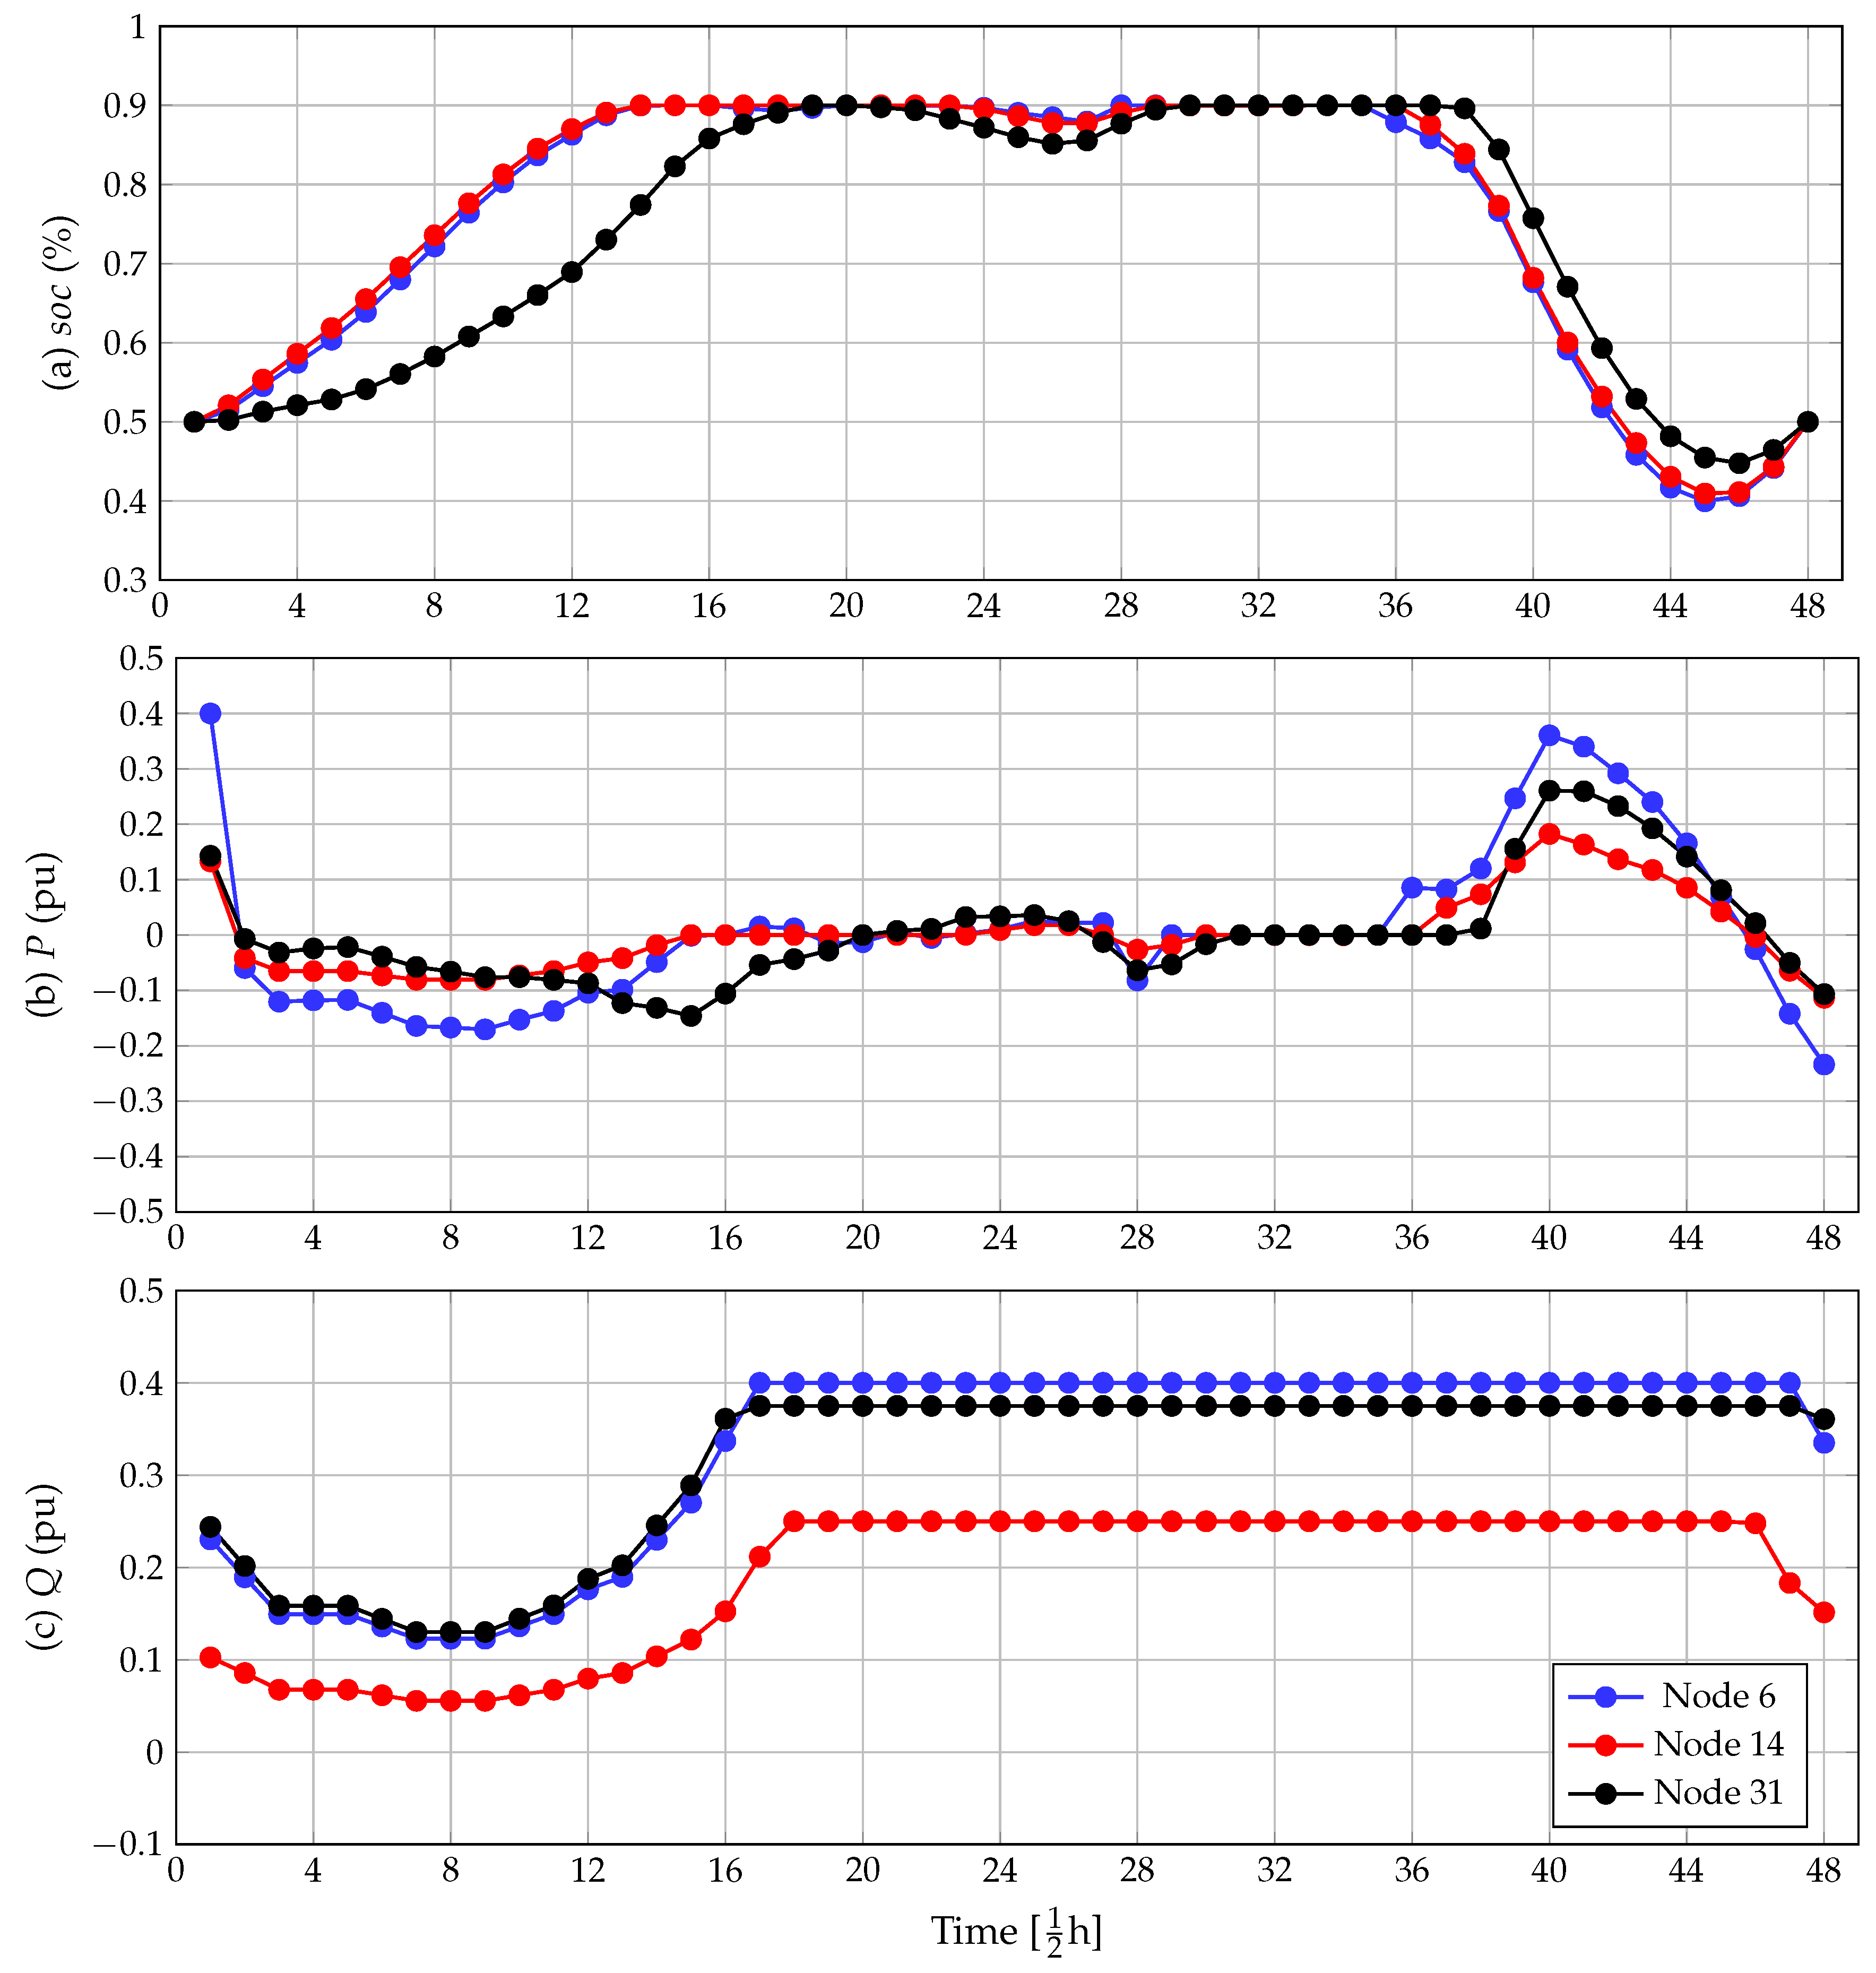
- ✓
- The batteries are charged during the earlier time periods between 6 a.m. and 10 a.m. (see Figure 4a), periods during which the active power of the battery is negative (see Figure 4b), because this energy is being used to increase the state of charge from 50% to 90%, which corresponds to the upper bound established for this state of charge;
- ✓
- Between 10 a.m. to 6 p.m., the state of charge of the batteries remains stable, with only small variations, which implies that the injected (absorbed) active power is practically nil in this entire operating range;
- ✓
- After 6 p.m., the batteries start discharging the stored energy to the grid, which coincides with a constant decrease in the state of charge until 10 p.m., after which, its state of charge starts to increase again until reaching the final condition of a 50% state of charge, which was set as an operational target. When the state of charge decreases, the active power is positive, which implies a power flow from the battery to the electrical grid (compare Figure 4a,b);
- ✓
- The behavior of the reactive power shown in Figure 4c demonstrates that this variable is independent of the state of charge (see the mathematical model (17)) and that it only depends on the ability of the converter to transfer/absorb power. Accordingly, the battery always delivers reactive power to the grid, and delivers the maximum possible reactive power in the period from 8 a.m. to 11 p.m.
7. Conclusions and Future Work
Author Contributions
Funding
Institutional Review Board Statement
Informed Consent Statement
Data Availability Statement
Acknowledgments
Conflicts of Interest
Abbreviations
| Objective function that quantifies the amount of CO2 emissions to the atmosphere | |
| (tons/day). | |
| Objective function that quantifies the daily cost of energy losses (USD/day). | |
| Carbon dioxide emission rate for medium-capacity diesel generation (kg/MWh). | |
| Average cost of electricity (USD/Wh). | |
| Active power flowing from the substation node (i.e., source node 0) to the node i | |
| in the time period t (MW). | |
| Resistance of the network branch between the nodes i and j (). | |
| Reactance of the network branch between the nodes i and j (). | |
| Magnitude of the current flowing between the nodes i and j in the time period t (A). | |
| Fraction of time of the study period (h). | |
| Set with all system nodes. | |
| Set with all time periods. | |
| Set with all network branches. | |
| Active power flowing from the node i to the node j in the time period | |
| t (W). | |
| Reactive power flowing from the node i to the node j in the time period | |
| t (var). | |
| Active power flowing from the node j to the node k in the time period t (W). | |
| Reactive power flowing from the node j to the node k in the time period | |
| t (var). | |
| Active power consumption at the node j in the time period t (W). | |
| Reactive power consumption at the node j in the time period t (var). | |
| Active powers generated by a distributed source connected to the node | |
| j in the time period t (W). | |
| Active powers generated by a distributed source connected to the node | |
| j in the time period t (var). |
References
- Kocer, M.C.; Cengiz, C.; Gezer, M.; Gunes, D.; Cinar, M.A.; Alboyaci, B.; Onen, A. Assessment of Battery Storage Technologies for a Turkish Power Network. Sustainability 2019, 11, 3669. [Google Scholar] [CrossRef] [Green Version]
- Zheng, Y.; Zhao, J.; Song, Y.; Luo, F.; Meng, K.; Qiu, J.; Hill, D.J. Optimal Operation of Battery Energy Storage System Considering Distribution System Uncertainty. IEEE Trans. Sustain. Energy 2018, 9, 1051–1060. [Google Scholar] [CrossRef]
- Li, B.; Wang, Y.; Li, J.; Cao, S. A Fully Distributed Approach for Economic Dispatch Problem of Smart Grid. Energies 2018, 11, 1993. [Google Scholar] [CrossRef] [Green Version]
- Monteiro, R.V.; Guimarães, G.C.; Moura, F.A.; Albertini, M.R.; Silva, F.B. Long-term sizing of lead–acid batteries in order to reduce technical losses on distribution networks: A distributed generation approach. Electr. Power Syst. Res. 2017, 144, 163–174. [Google Scholar] [CrossRef]
- Koehler, U. General Overview of Non-Lithium Battery Systems and their Safety Issues. In Electrochemical Power Sources: Fundamentals, Systems, and Applications; Elsevier: Amsterdam, The Netherlands, 2019; pp. 21–46. [Google Scholar] [CrossRef]
- Hesse, H.; Schimpe, M.; Kucevic, D.; Jossen, A. Lithium-Ion Battery Storage for the Grid—A Review of Stationary Battery Storage System Design Tailored for Applications in Modern Power Grids. Energies 2017, 10, 2107. [Google Scholar] [CrossRef] [Green Version]
- Chen, T.; Jin, Y.; Lv, H.; Yang, A.; Liu, M.; Chen, B.; Xie, Y.; Chen, Q. Applications of Lithium-Ion Batteries in Grid-Scale Energy Storage Systems. Trans. Tianjin Univ. 2020, 26, 208–217. [Google Scholar] [CrossRef] [Green Version]
- Montoya, O.D.; Gil-González, W. Dynamic active and reactive power compensation in distribution networks with batteries: A day-ahead economic dispatch approach. Comput. Electr. Eng. 2020, 85, 106710. [Google Scholar] [CrossRef]
- Zhu, Y.; Liu, C.; Wang, B.; Sun, K. Damping control for a target oscillation mode using battery energy storage. J. Mod. Power Syst. Clean Energy 2018, 6, 833–845. [Google Scholar] [CrossRef] [Green Version]
- Bangash, K.N.; Farrag, M.E.A.; Osman, A.H. Investigation of Energy Storage Batteries in Stability Enforcement of Low Inertia Active Distribution Network. Technol. Econ. Smart Grids Sustain. Energy 2019, 4, 1. [Google Scholar] [CrossRef] [Green Version]
- Montoya, O.D.; Gil-González, W.; Hernández, J.C. Optimal Selection and Location of BESS Systems in Medium-Voltage Rural Distribution Networks for Minimizing Greenhouse Gas Emissions. Electronics 2020, 9, 2097. [Google Scholar] [CrossRef]
- Li, X.; Wang, S. A review on energy management, operation control and application methods for grid battery energy storage systems. CSEE J. Power Energy Syst. 2019. [Google Scholar] [CrossRef]
- Vargas, A.; Samper, M.E. Real-Time Monitoring and Economic Dispatch of Smart Distribution Grids: High Performance Algorithms for DMS Applications. IEEE Trans. Smart Grid 2012, 3, 866–877. [Google Scholar] [CrossRef]
- Zhang, H.; Zhao, D.; Gu, C.; Li, F.; Wang, B. Economic optimization of smart distribution networks considering real-time pricing. J. Mod. Power Syst. Clean Energy 2014, 2, 350–356. [Google Scholar] [CrossRef] [Green Version]
- Zhang, R.; Hredzak, B. Nonlinear Sliding Mode and Distributed Control of Battery Energy Storage and Photovoltaic Systems in AC Microgrids With Communication Delays. IEEE Trans. Ind. Inform. 2019, 15, 5149–5160. [Google Scholar] [CrossRef]
- Becherif, M.; Ayad, M.Y.; Henni, A.; Wack, M.; Aboubou, A.; Allag, A.; Sebai, M. Passivity-Based Control and Sliding Mode Control applied to Electric Vehicles based on Fuel Cells, Supercapacitors and Batteries on the DC Link. In Energy Management; InTech: Rijeka, Croatia, 2010. [Google Scholar] [CrossRef] [Green Version]
- Montoya, O.D.; Gil-Gonzalez, W.J.; Garces, A.; Escobar-Mejia, A.; Norena, L.F.G. Nonlinear Control for Battery Energy Storage Systems in Power Grids. In Proceedings of the 2018 IEEE Green Technologies Conference (GreenTech), Austin, TX, USA, 4–6 April 2018. [Google Scholar] [CrossRef]
- Swathika, R.; Ram, R.; Kalaichelvi, V.; Karthikeyan, R. Application of fuzzy logic for charging control of lead-acid battery in stand-alone solar photovoltaic system. In Proceedings of the 2013 International Conference on Green Computing, Communication and Conservation of Energy (ICGCE), Chennai, India, 12–14 December 2013. [Google Scholar] [CrossRef]
- Jadhav, A.D.; Nair, S. Battery Management using Fuzzy Logic Controller. J. Phys. Conf. Ser. 2019, 1172, 012093. [Google Scholar] [CrossRef]
- Lee, H.J.; Jhang, S.S.; Yu, W.K.; Oh, J.H. Artificial Neural Network Control of Battery Energy Storage System to Damp-Out Inter-Area Oscillations in Power Systems. Energies 2019, 12, 3372. [Google Scholar] [CrossRef] [Green Version]
- Fernández, L.M.; Serra, F.; Angelo, C.D.; Montoya, O. Control of a charging station for electric vehicles. J. Phys. Conf. Ser. 2020, 1448, 012013. [Google Scholar] [CrossRef] [Green Version]
- Montoya, O.D.; Grajales, A.; Garces, A.; Castro, C.A. Distribution Systems Operation Considering Energy Storage Devices and Distributed Generation. IEEE Lat. Am. Trans. 2017, 15, 890–900. [Google Scholar] [CrossRef]
- Grisales-Noreña, L.; Montoya, O.D.; Gil-González, W. Integration of energy storage systems in AC distribution networks: Optimal location, selecting, and operation approach based on genetic algorithms. J. Energy Storage 2019, 25, 100891. [Google Scholar] [CrossRef]
- Montoya, O.D.; Gil-González, W.; Serra, F.M.; Hernández, J.C.; Molina-Cabrera, A. A Second-Order Cone Programming Reformulation of the Economic Dispatch Problem of BESS for Apparent Power Compensation in AC Distribution Networks. Electronics 2020, 9, 1677. [Google Scholar] [CrossRef]
- Zafar, R.; Ravishankar, J.; Fletcher, J.E.; Pota, H.R. Optimal Dispatch of Battery Energy Storage System Using Convex Relaxations in Unbalanced Distribution Grids. IEEE Trans. Ind. Inform. 2020, 16, 97–108. [Google Scholar] [CrossRef]
- Abou El-Ela, A.A.; El-Seheimy, R.A.; Shaheen, A.M.; Wahbi, W.A.; Mouwafi, M.T. PV and battery energy storage integration in distribution networks using equilibrium algorithm. J. Energy Storage 2021, 42, 103041. [Google Scholar] [CrossRef]
- Shaheen, A.M.; Elattar, E.E.; El-Sehiemy, R.A.; Elsayed, A.M. An Improved Sunflower Optimization Algorithm-Based Monte Carlo Simulation for Efficiency Improvement of Radial Distribution Systems Considering Wind Power Uncertainty. IEEE Access 2021, 9, 2332–2344. [Google Scholar] [CrossRef]
- Yuan, Z.; Wang, W.; Wang, H.; Yildizbasi, A. A new methodology for optimal location and sizing of battery energy storage system in distribution networks for loss reduction. J. Energy Storage 2020, 29, 101368. [Google Scholar] [CrossRef]
- Deng, T.; Ran, Y.; Yin, Y.; Liu, P. Multi-objective optimization design of thermal management system for lithium-ion battery pack based on Non-dominated Sorting Genetic Algorithm II. Appl. Therm. Eng. 2020, 164, 114394. [Google Scholar] [CrossRef]
- Shaheen, A.M.; Hamida, M.A.; El-Sehiemy, R.A.; Elattar, E.E. Optimal parameter identification of linear and non-linear models for Li-Ion Battery Cells. Energy Rep. 2021, 7, 7170–7185. [Google Scholar] [CrossRef]
- Farivar, M.; Low, S.H. Branch Flow Model: Relaxations and Convexification—Part I. IEEE Trans. Power Syst. 2013, 28, 2554–2564. [Google Scholar] [CrossRef]
- Liu, W.; Zheng, T.; Liu, Z.; Fan, Z.; Kang, Y.; Wang, D.; Zhang, M.; Miao, S. Active and Reactive Power Compensation Control Strategy for VSC-HVDC Systems under Unbalanced Grid Conditions. Energies 2018, 11, 3140. [Google Scholar] [CrossRef] [Green Version]
- Gonzalez, W.J.G.; Bocanegra, S.Y.; Serra, F.M.; Bueno-López, M.; Magaldi, G.L. Control Methods for Single-phase Voltage Supply with VSCs to Feed Nonlinear Loads in Rural Areas. Trans. Energy Syst. Eng. Appl. 2020, 1, 33–47. [Google Scholar] [CrossRef]
- Montoya, O.D.; Gil-González, W.; Hernández, J.C. Efficient Operative Cost Reduction in Distribution Grids Considering the Optimal Placement and Sizing of D-STATCOMs Using a Discrete-Continuous VSA. Appl. Sci. 2021, 11, 2175. [Google Scholar] [CrossRef]
- Serra, F.M.; Fernández, L.M.; Montoya, O.D.; Gil-González, W.; Hernández, J.C. Nonlinear Voltage Control for Three-Phase DC-AC Converters in Hybrid Systems: An Application of the PI-PBC Method. Electronics 2020, 9, 847. [Google Scholar] [CrossRef]
- Benson, H.Y.; Sağlam, Ü. Mixed-Integer Second-Order Cone Programming: A Survey. In Theory Driven by Influential Applications; INFORMS: Catonsville, MD, USA, 2013; pp. 13–36. [Google Scholar] [CrossRef] [Green Version]
- Chen, G.; Yi, X.; Zhang, Z.; Lei, H. Solving the Multi-Objective Optimal Power Flow Problem Using the Multi-Objective Firefly Algorithm with a Constraints-Prior Pareto-Domination Approach. Energies 2018, 11, 3438. [Google Scholar] [CrossRef] [Green Version]
- Eltved, A.; Dahl, J.; Andersen, M.S. On the robustness and scalability of semidefinite relaxation for optimal power flow problems. Optim. Eng. 2019, 21, 375–392. [Google Scholar] [CrossRef] [Green Version]
- Molina-Martin, F.; Montoya, O.D.; Grisales-Noreña, L.F.; Hernández, J.C.; Ramírez-Vanegas, C.A. Simultaneous Minimization of Energy Losses and Greenhouse Gas Emissions in AC Distribution Networks Using BESS. Electronics 2021, 10, 1002. [Google Scholar] [CrossRef]
- Lipu, M.S.H.; Hannan, M.A.; Hussain, A.; Ayob, A.; Saad, M.H.M.; Muttaqi, K.M. State of Charge Estimation in Lithium-Ion Batteries: A Neural Network Optimization Approach. Electronics 2020, 9, 1546. [Google Scholar] [CrossRef]
- Grant, M.; Boyd, S. CVX: Matlab Software for Disciplined Convex Programming, Version 2.1. 2014. Available online: http://cvxr.com/cvx (accessed on 3 November 2021).
- Gil-González, W.; Montoya, O.D.; Holguín, E.; Garces, A.; Grisales-Noreña, L.F. Economic dispatch of energy storage systems in dc microgrids employing a semidefinite programming model. J. Energy Storage 2019, 21, 1–8. [Google Scholar] [CrossRef]


| Variables | Type | Number |
|---|---|---|
| Active powers | Real | |
| Reactive powers | Real | |
| Square voltages | Real | |
| Square currents | Real | |
| Batteries’ states of charge | Real | |
| Objective function | Real | 2 |
| Total variables | Real | |
| Constraints | Type | Number |
| Active power balance | Equality (affine) | |
| Reactive power balance | Equality (affine) | |
| Voltage drops | Equality (affine) | |
| Powers from Tellegen’s theorem | Inequality conic constraint | |
| Batteries’ state of charge behavior | Equality (affine) | |
| Apparent power in batteries | Inequality conic constraint | |
| Active power cap. in generators and batteries | Inequalities (box-type constraints) | |
| Batteries’ state of charge bounds | Inequality (box-type constraint) | |
| Apparent power in disperse generators | Inequality conic constraint | |
| Voltage regulation bounds | Inequality (box-type constraint) | |
| Initial and final state of charges | Equality (affine) | |
| Objective functions | Equality (affine) | 2 |
| Total constraints | Equalities + Inequalities |
| Per. (h) | PV1 (pu) | PV2 (pu) | WT1 (pu) | WT2 (pu) | Dem. (pu) |
|---|---|---|---|---|---|
| 1 | 0 | 0 | 0.6303 | 0.4854 | 0.4854 |
| 2 | 0 | 0 | 0.6194 | 0.4632 | 0.4632 |
| 3 | 0 | 0 | 0.6098 | 0.4452 | 0.4452 |
| 4 | 0 | 0 | 0.6050 | 0.4369 | 0.4369 |
| 5 | 0 | 0 | 0.6122 | 0.4341 | 0.4341 |
| 6 | 0 | 0 | 0.6411 | 0.4383 | 0.4383 |
| 7 | 0 | 0 | 0.6927 | 0.4438 | 0.4438 |
| 8 | 0 | 0 | 0.7395 | 0.4535 | 0.4535 |
| 9 | 0 | 0 | 0.7779 | 0.4646 | 0.4646 |
| 10 | 0 | 0 | 0.7887 | 0.4799 | 0.4799 |
| 11 | 0 | 0 | 0.7671 | 0.5007 | 0.5007 |
| 12 | 0 | 0 | 0.7479 | 0.5381 | 0.5381 |
| 13 | 0 | 0 | 0.7287 | 0.5936 | 0.5936 |
| 14 | 0 | 0 | 0.7371 | 0.6491 | 0.6491 |
| 15 | 0 | 0 | 0.7731 | 0.7115 | 0.7115 |
| 16 | 0.0016 | 0.0238 | 0.8031 | 0.7698 | 0.7698 |
| 17 | 0.0403 | 0.1244 | 0.8271 | 0.8225 | 0.8225 |
| 18 | 0.1344 | 0.2715 | 0.8523 | 0.8558 | 0.8558 |
| 19 | 0.2710 | 0.4394 | 0.8788 | 0.8682 | 0.8682 |
| 20 | 0.3673 | 0.6037 | 0.9064 | 0.8793 | 0.8793 |
| 21 | 0.4584 | 0.7325 | 0.9328 | 0.8890 | 0.8890 |
| 22 | 0.6125 | 0.8096 | 0.9520 | 0.9001 | 0.9001 |
| 23 | 0.8134 | 0.8603 | 0.9640 | 0.9112 | 0.9112 |
| 24 | 0.9122 | 0.9838 | 0.9700 | 0.9251 | 0.9251 |
| 25 | 0.9633 | 1.0000 | 0.9748 | 0.9376 | 0.9376 |
| 26 | 1.0000 | 0.9754 | 0.9784 | 0.9501 | 0.9501 |
| 27 | 0.9582 | 0.7709 | 0.9832 | 0.9626 | 0.9626 |
| 28 | 0.8791 | 0.8888 | 0.9880 | 0.9750 | 0.9750 |
| 29 | 0.7308 | 0.6296 | 0.9940 | 0.9861 | 0.9861 |
| 30 | 0.7645 | 0.5932 | 0.9988 | 0.9945 | 0.9945 |
| 31 | 0.6866 | 0.4043 | 1.0000 | 0.9986 | 0.9986 |
| 32 | 0.5893 | 0.3659 | 0.9964 | 1.0000 | 1.0000 |
| 33 | 0.4193 | 0.2307 | 0.9892 | 0.9986 | 0.9986 |
| 34 | 0.2784 | 0.2025 | 0.9652 | 0.9931 | 0.9931 |
| 35 | 0.1373 | 0.1299 | 0.9244 | 0.9847 | 0.9847 |
| 36 | 0.0374 | 0.0532 | 0.8607 | 0.9626 | 0.9626 |
| 37 | 0.0007 | 0.0084 | 0.7743 | 0.9293 | 0.9293 |
| 38 | 0 | 0 | 0.7251 | 0.8613 | 0.8613 |
| 39 | 0 | 0 | 0.7167 | 0.7587 | 0.7587 |
| 40 | 0 | 0 | 0.7167 | 0.7004 | 0.7004 |
| 41 | 0 | 0 | 0.7251 | 0.6865 | 0.6865 |
| 42 | 0 | 0 | 0.7263 | 0.6865 | 0.6865 |
| 43 | 0 | 0 | 0.7179 | 0.7018 | 0.7018 |
| 44 | 0 | 0 | 0.7095 | 0.7143 | 0.7143 |
| 45 | 0 | 0 | 0.6987 | 0.7226 | 0.7226 |
| 46 | 0 | 0 | 0.6915 | 0.7295 | 0.7295 |
| 47 | 0 | 0 | 0.6867 | 0.7351 | 0.7351 |
| 48 | 0 | 0 | 0.6831 | 0.7379 | 0.7379 |
| No. | (tons/day) | (USD/day) | No. | (tons/day) | (USD/day) |
|---|---|---|---|---|---|
| 1 | 13.8780 | 132.1042 | 7 | 8.3812 | 143.4954 |
| 2 | 12.9941 | 132.3619 | 8 | 7.7757 | 146.8818 |
| 3 | 12.0455 | 133.2272 | 9 | 7.2971 | 150.0405 |
| 4 | 11.0497 | 134.8376 | 10 | 6.9370 | 153.0781 |
| 5 | 10.1083 | 137.1284 | 11 | 6.6395 | 156.0007 |
| 6 | 9.1637 | 140.2305 | 12 | 6.5502 | 157.0549 |
| No. | (tons/day) | (USD/day) | No. | (tons/day) | (USD/day) |
|---|---|---|---|---|---|
| 1 | 13.7072 | 44.7601 | 7 | 8.0085 | 56.6499 |
| 2 | 12.7983 | 45.0283 | 8 | 7.4001 | 59.9527 |
| 3 | 11.8224 | 45.9312 | 9 | 6.9359 | 63.0869 |
| 4 | 10.7779 | 47.6243 | 10 | 6.5899 | 65.9802 |
| 5 | 9.8010 | 49.9735 | 11 | 6.3386 | 68.5226 |
| 6 | 8.8164 | 53.2112 | 12 | 6.3317 | 68.6023 |
Publisher’s Note: MDPI stays neutral with regard to jurisdictional claims in published maps and institutional affiliations. |
© 2021 by the authors. Licensee MDPI, Basel, Switzerland. This article is an open access article distributed under the terms and conditions of the Creative Commons Attribution (CC BY) license (https://creativecommons.org/licenses/by/4.0/).
Share and Cite
Gil-González, W.; Montoya, O.D.; Grisales-Noreña, L.F.; Escobar-Mejía, A. Optimal Economic–Environmental Operation of BESS in AC Distribution Systems: A Convex Multi-Objective Formulation. Computation 2021, 9, 137. https://0-doi-org.brum.beds.ac.uk/10.3390/computation9120137
Gil-González W, Montoya OD, Grisales-Noreña LF, Escobar-Mejía A. Optimal Economic–Environmental Operation of BESS in AC Distribution Systems: A Convex Multi-Objective Formulation. Computation. 2021; 9(12):137. https://0-doi-org.brum.beds.ac.uk/10.3390/computation9120137
Chicago/Turabian StyleGil-González, Walter, Oscar Danilo Montoya, Luis Fernando Grisales-Noreña, and Andrés Escobar-Mejía. 2021. "Optimal Economic–Environmental Operation of BESS in AC Distribution Systems: A Convex Multi-Objective Formulation" Computation 9, no. 12: 137. https://0-doi-org.brum.beds.ac.uk/10.3390/computation9120137