Article

Mass Media as a Mirror of the COVID-19 Pandemic

1
Institute of Information and Computational Technologies MES RK, Pushkin Street, 125, Almaty 050010, Kazakhstan
2
Institute of Automation and Information Technologies, Satbayev University, Satpayev Street, 22A, Almaty 050013, Kazakhstan
3
School of Engineering Management, Almaty Management University, Rozybakiev Street, 227, Almaty 050060, Kazakhstan
4
Faculty of Management Science and Informatics, University of Zilina, Univerzitná 8215/1, 010 26 Žilina, Slovakia
5
Department of Information Technology, Maharishi International University, 1000 N 4th Street, Fairfield, IA 52557, USA
6
International Radio Astronomy Centre, Ventspils University of Applied Sciences, Inzhenieru Street, 101, LV-3601 Ventspils, Latvia
7
Department of Natural Science and Computer Technologies, ISMA University, Lomonosov Street, 1, LV-1011 Riga, Latvia
*
Authors to whom correspondence should be addressed.
Submission received: 23 October 2021 / Revised: 21 November 2021 / Accepted: 2 December 2021 / Published: 13 December 2021
(This article belongs to the Special Issue Computation to Fight SARS-CoV-2 (CoVid-19))

Abstract

:
The media plays an important role in disseminating facts and knowledge to the public at critical times, and the COVID-19 pandemic is a good example of such a period. This research is devoted to performing a comparative analysis of the representation of topics connected with the pandemic in the internet media of Kazakhstan and the Russian Federation. The main goal of the research is to propose a method that would make it possible to analyze the correlation between mass media dynamic indicators and the World Health Organization COVID-19 data. In order to solve the task, three approaches related to the representation of mass media dynamics in numerical form—automatically obtained topics, average sentiment, and dynamic indicators—were proposed and applied according to a manually selected list of search queries. The results of the analysis indicate similarities and differences in the ways in which the epidemiological situation is reflected in publications in Russia and in Kazakhstan. In particular, the publication activity in both countries correlates with the absolute indicators, such as the daily number of new infections, and the daily number of deaths. However, mass media tend to ignore the positive rate of confirmed cases and the virus reproduction rate. If we consider strictness of quarantine measures, mass media in Russia show a rather high correlation, while in Kazakhstan, the correlation is much lower. Analysis of search queries revealed that in Kazakhstan the problem of fake news and disinformation is more acute during periods of deterioration of the epidemiological situation, when the level of crime and poverty increase. The novelty of this work is the proposal and implementation of a method that allows the performing of a comparative analysis of objective COVID-19 statistics and several mass media indicators. In addition, it is the first time that such a comparative analysis, between different countries, has been performed on a corpus in a language other than English.

1. Introduction

COVID-19 has highlighted the relative inefficiency and low productivity in the health sector, which in turn have contributed to increased social tension and a steady decline in the economic growth in most countries during the pandemic [1]. The healthcare system can be considered as one of the main factors determining the sustainable growth of welfare in many countries including Kazakhstan. However, healthcare systems in Kazakhstan and throughout the world face multiple problems, which cause an increased demand for health services, high public expectations, and higher expenses [2]. Not only economic but also social and medical efficiency is important in the healthcare system; “medical measures of therapeutic and preventive nature may be economically unprofitable, but medical and social effects require them” [3]. According to the authors of [4], a fundamental transformation of healthcare systems, based on Artificial Intelligence (AI) technology, is necessary. The economic impact of AI on healthcare in Europe is estimated at 200 billion euros [5]. The effect is associated with savings in time and an increase in the number of lives saved.
One of the technologies related to AI is Natural Language Processing (NLP) [6], which effectively uses machine learning techniques to process natural language texts and speech; it is used in healthcare to extract information from clinical records [7], to process speech messages, and to create question answering systems [8,9]. NLP methods can be used not only to address the direct healthcare objectives but also to assess how the mass media (media) reflect the public health situation during the pandemic. Mass media and social networks have a substantial influence on the informational environment of society. Nowadays, the media not only act as a source of information on current events, but often shape the information agenda and form the discourse of socially important topics [10,11]. The inadequate presentation of health authorities in the media may contribute to the spread of rumors and misinformation [12], and affect the mental health of the population [13]. Topic modeling in combination with sentiment analysis is often used to evaluate media texts [14,15,16].
The severity of the COVID-19 pandemic in Kazakhstan and Russia [17] is significantly higher than for an average nation. While Russia is the ninth largest country by population in the world, the total number of COVID-19 cases made Russia the third–fifth largest pandemic nation. Kazakhstan is in 63rd place in terms of population, and holds 36th–39th place according to the number of new cases. This makes these two nations an interesting target for this kind of research, especially since mass media in both countries is primarily in the same language (Russian).
In this paper, we aimed to achieve two research objectives: to identify the differences in the publication activities of the two countries regarding the COVID-19 pandemic and to assess the correlation of publication activity with the COVID-19 pandemic indicators.
The main contribution of this study was the development of a new method to compare and analyze real statistical data on COVID-19 (published by the WHO) and the responses of mass media specified in the study. These responses were evaluated by new indicators that are elaborated and introduced in the study. The indicators were developed based on three approaches used in the evaluation of mass media dynamics—automatically obtained topics, average sentiment, and dynamic indicators—according to manually selected search queries.
This study also represents the first time such a comparative analysis of COVID-19’s representation in mass media was performed for languages other than English.
The obtained results showed the substantial differences in the representation of the pandemic in the media of Russia and Kazakhstan, as well as providing several insights on how the internet media tended to react to changes in epidemiological situations.
In this work, we used topic modeling for a comparative analysis of the corpus of media publications on the COVID-19 pandemic in two countries, and we also assessed the correlation of publication activities with the statistics of the pandemic. The work consisted of the following parts.
The first part of this study examined the existing research on media publications during the COVID-19 pandemic. The analysis showed the lack of comparative studies of the pandemic publication corpora in languages other than English.
In the second part, we considered the publication corpus and the method of processing this corpus; this made it possible to obtain three types of mass media dynamic indicators describing the different aspects of the representation of the COVID-19 situation by mass media.
In the third part, we described and discussed the obtained results. The main result of the experiments was a quantitative comparison of the coefficients of correlation between the mass media indicators and the indicators of the COVID-19 epidemiological situation, as well as the analysis of these coefficients. We also briefly described the system architecture of the proposed method of data collection and processing.
In the end, we briefly described the advantages and limitations of the proposed approach, and formulated the future research objectives.

2. Related Work

Evaluation of the media content is a focus of many research studies due to its practical importance for advertising companies, news agencies and governmental bodies. Based on the analysis of media content, it is possible to predict the possible popularity of news [18] and to plan PR strategies for the promotion of products and services [19,20]. Government sectors can use tools for the promotion of their opinions, as well as to improve the planning of publication activities (i.e., which topics and events should be emphasized) and to identify negative content.
According to the Edelman Trust Barometer [21], the trust in information presented by government and media channels remains low. The gap between the informed and general public is growing [21]. When people do not have reliable information or experience to comprehend what is going on, they become dependent on the information accessible via the mass media sources [22]. According to previous studies [23,24], mass media and social network sources employ manipulative techniques to form public opinion, or to focus the audience on specific topics. An additional factor affecting public perception is the increased availability of various news items on the Internet, which can create confusion due to the usage of personal, often unchecked sources of information, such as personal blogs, video streaming, and unverified news [25]. Hence, many researchers focus on the possibilities of assessing the negative effects of media and facilitating its positive effects [26].
During the COVID-19 pandemic, media messages have significantly affected people’s emotions and their psychological stability [27]. During this period, more than 51% of news headlines in English-language media have had a negative sentiment and only about 30% of them were found to be positive [28]. Such information can cause anxiety, fear, anger, longing, sadness, etc. in a great number of people [29].
Public reactions to the implemented measures, assessed via the analysis of large volumes of documents, permits the adjustment of the restrictions imposed by government agencies. In particular, the positive attitudes of the population to the measures of the governments of South Korea [30] and Singapore [31] were revealed. There is some evidence of increasing confidence in traditional media in the United States [32] and in India [33]. During the pandemic, the amount of misinformation and rumors circulating on social media increased significantly; some of them could be detected automatically [34].
The analysis of mass media, social media, and publicly available datasets is important to encourage analytical efforts and to provide data for pandemic mitigation planning [35]. Such an analysis can also be used as one of the possible proxy indicators and even predictors of the economic situation in the country [36,37]. The list of analyzed indicators can include the level of inflation, unemployment, poverty, economic development, etc.
One of the main tools used to analyze large corpora of texts is topic modeling. The topic model determines the quantitative relationships between documents and topics, as well as between topics and words or phrases. Clusters of terms and phrases formed in the process of topic modeling, in particular, allow the solving of problems of synonymy and polysemy of terms [38]. To build a topic model of a document corpus, the following methods are generally used: Probabilistic Latent Semantic Analysis (PLSA), ARTM (Additive Regularization of Topic Models) [39] and, very commonly, Latent Dirichlet Allocation (LDA) [40].
Many studies that use LDA as a primary tool focus on identifying the list of topics prevalent in publications and further analyzing the sentiment of the messages [41]. For example, the authors of [42] identified several main topics on Twitter, including “news on new confirmed cases”, “COVID-19-related deaths”, “cases outside China (worldwide)”, “COVID-19 outbreak in South Korea”, “early signs of outbreak in New York”, “Diamond Princess cruise”, “economic impact”, “preventive measures”, “authorities”, and “supply chain”. However, topics related to treatment and symptoms are not as important on Twitter. In [43], the topics of the publications are summarized as follows: “work and life under pandemic conditions”, “social problems”, “understanding the nature of the virus”, and “methods of prevention”. The authors of the paper [44] determined that users in South Africa focus their attention on the following topics: “sale and consumption of alcohol”, “staying at home”, “daily tracking of statistics”, “police brutality”, “5G”, “spread of disease”, “testing”, “doctors”, and “conspiracy theories” about vaccines. An analysis of publications in different countries revealed common themes widely covered in the UK, India, Japan, and South Korea: “education”, “economy”, “USA”, and “sports” [14].
LDA is a prevalent method of topic modeling (see Table 1). The most frequent language of the text corpora is English. Most of the publications are based on the social networks Twitter, Sina Weibo, and Facebook. The most frequently considered corpus type is publications on the situation in a particular country.
Therefore, there is a certain lack of research on corpora of publications about COVID-19 in languages other than English. We did not identify the studies devoted to a comparative analysis of corpora of texts from the traditional internet media either. It is not clear how the sentiment of statements in social networks and mass media correlates with the objective indicators of the pandemic (the number of infected and sick people, the mortality rate, etc.).
One of the main aims of the research is to reduce the above-mentioned gap in studies; this paper performs a comparative analysis of the Russian-language media in Russia and Kazakhstan based on the corpus of texts we collected earlier.
We evaluated the correlations between the sentiment expressed in the media, and the number of publications on certain topics with objective indicators of the COVID-19 epidemic in Russia and Kazakhstan.
In this work, we define media as “traditional” mass media (newspapers, magazines, and TV-channels) presented in electronic form as well as purely electronic news websites and social networks represented by widespread services such as Twitter, Sina Weibo, Telegram, VK., etc. Attention is mainly paid to the mass media in the traditional sense, which continues to play an important role in shaping the opinions of the population. The media readership behavior in Kazakhstan and in Russia is very similar, although the lists of popular news sources are obviously different and generally have almost no intersections.

3. Methods and Data

The employed methods included the following steps (Figure 1): text corpus collection (a), text corpus processing (b), and correlation analysis using the objective data on the epidemiological situation (c).
(a)
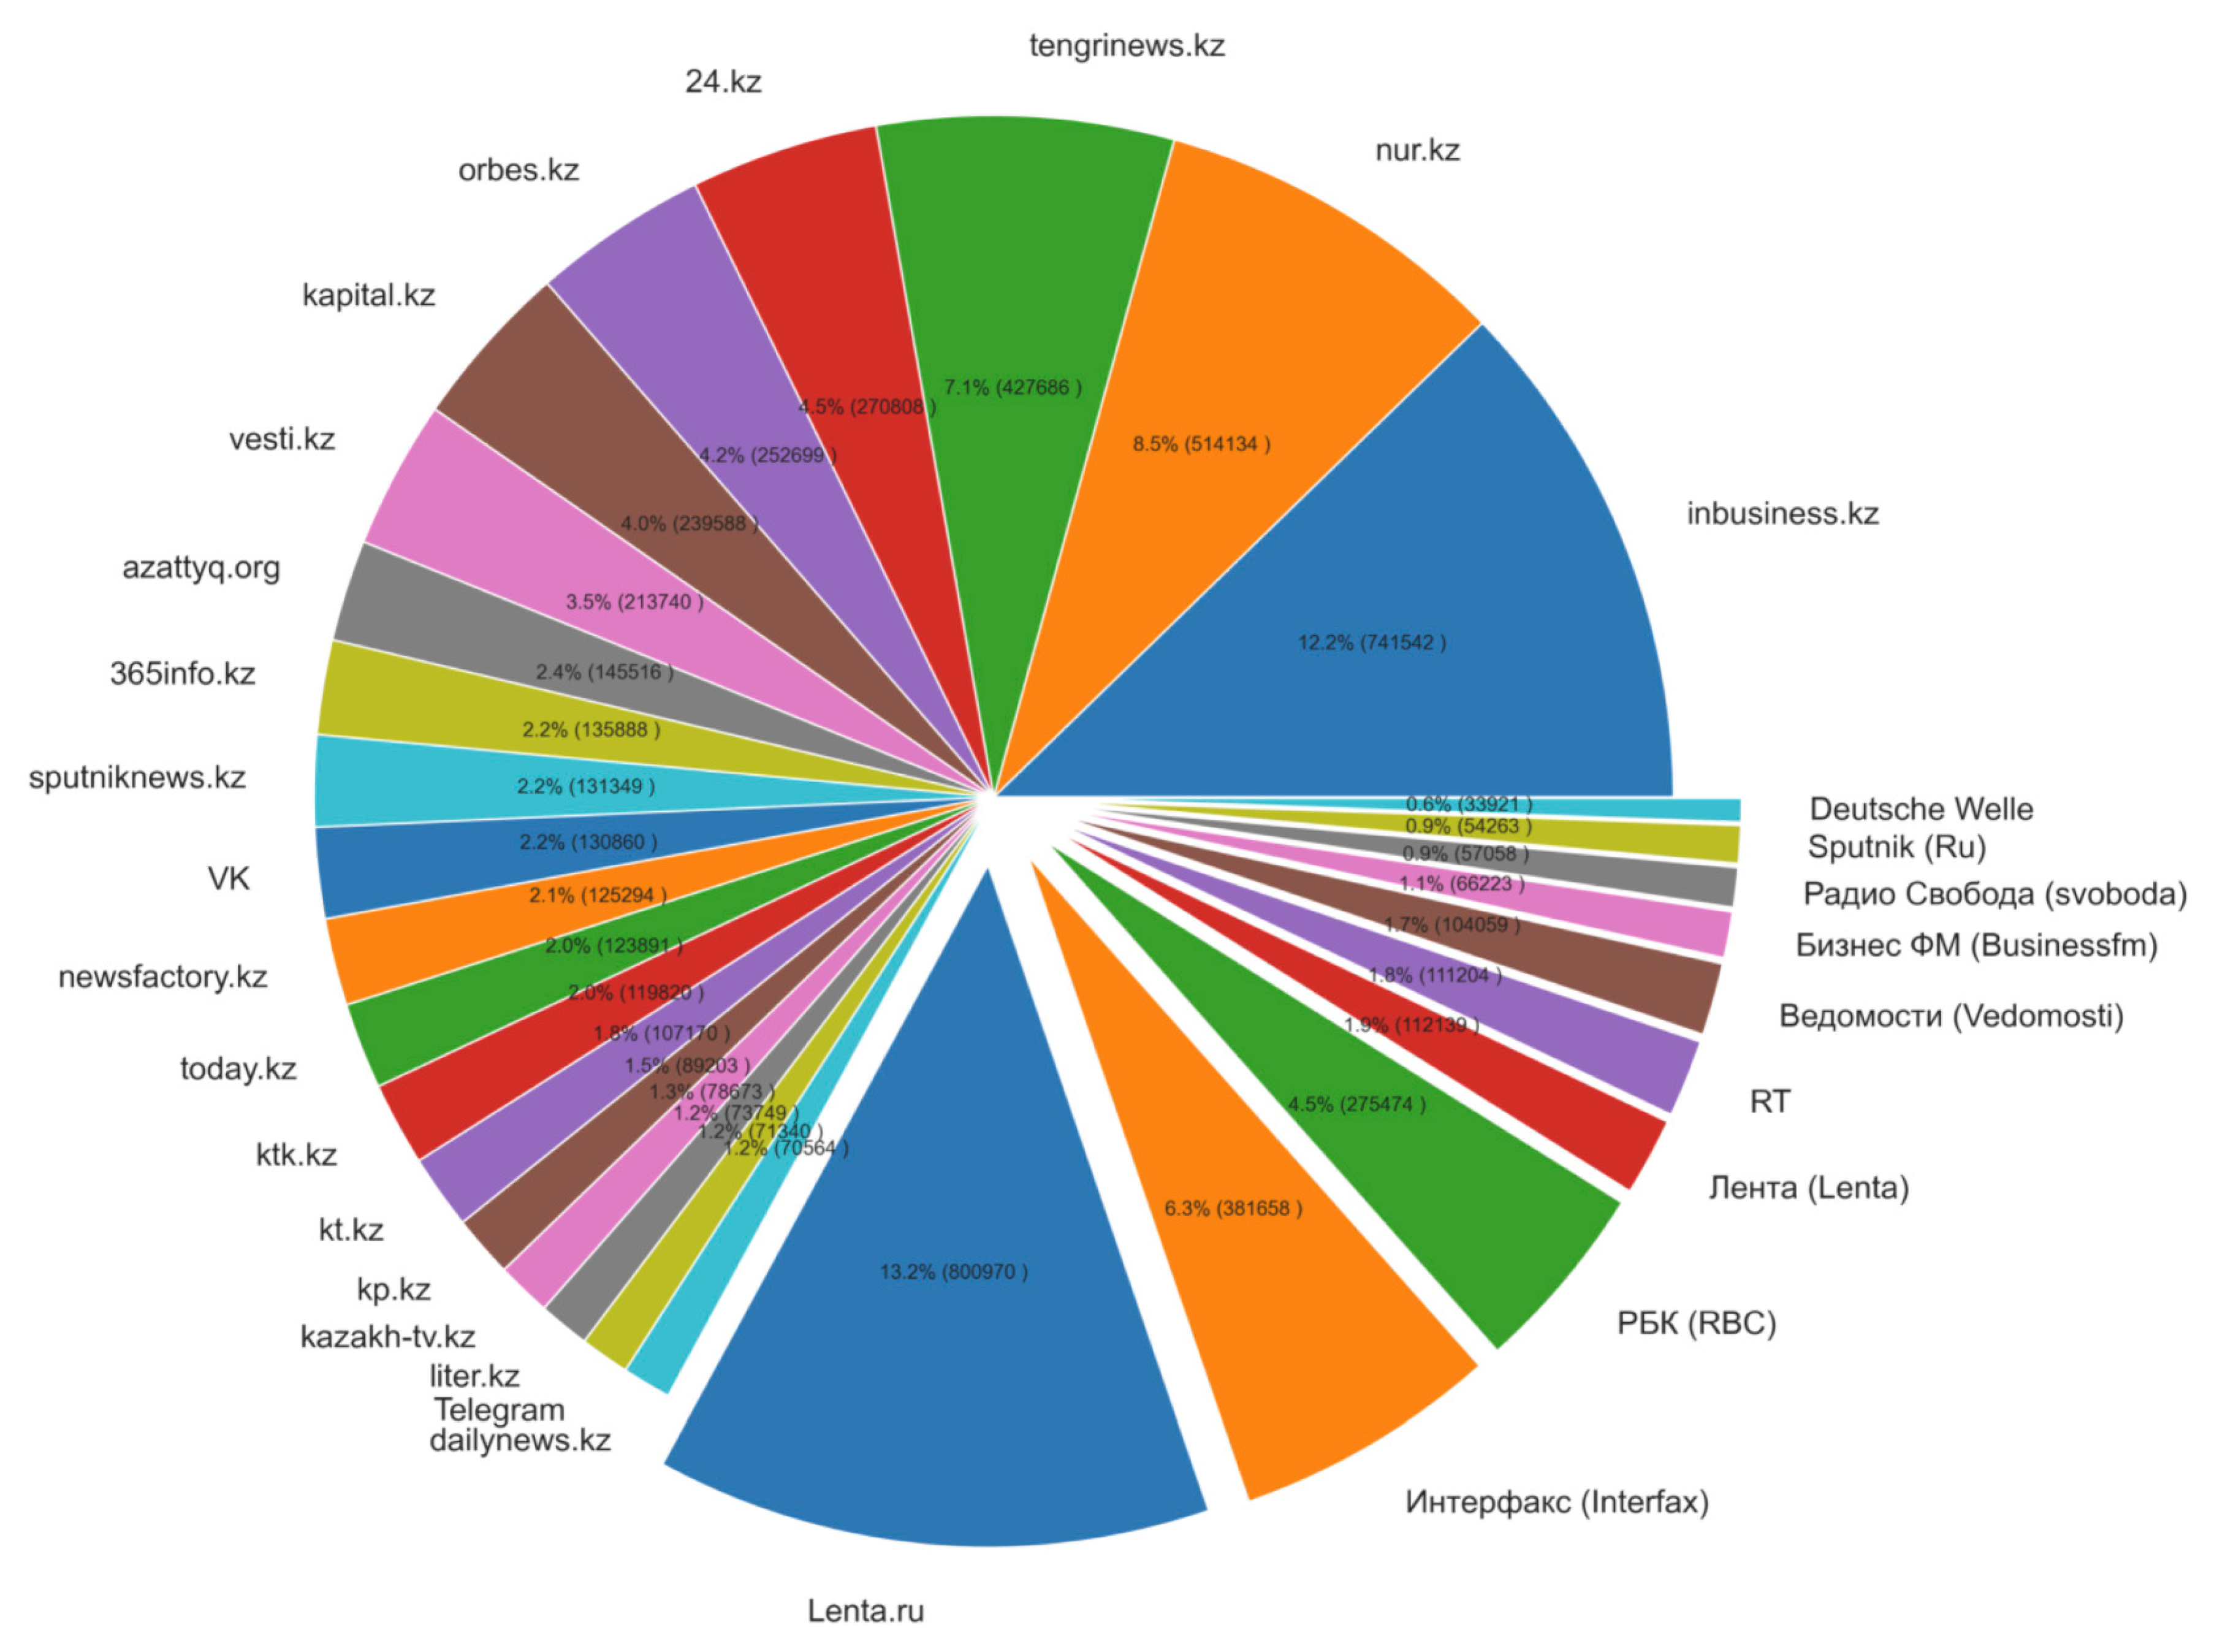
Data collection. Mass media and social network news publications were gathered using automatic scrapping tools.
(b)
Text corpus processing was necessary to extract meaningful dynamic indicators of mass media publication activity. Three types of indicators were proposed; they were described in the section below: topics were obtained by a cascade of topic models, sentiment analysis, and analysis of full-text search queries.
(c)
Correlation analysis. We performed the assessment of pairwise correlation between two groups of dynamic indicators—mass media indicators obtained in step (b) and COVID-10 epidemiological indicators. We used COVID-19 indicators, which were processed and prepared by the Center for Systems Science and Engineering at Johns Hopkins University (JHU CSSE) [52].
Finally, the proposed method assumed the performance of manual analysis of the obtained correlation coefficients in order to draw conclusions about the similarities and differences of the pandemic reflection in different countries.
A corpus of news publications from media in Russia and in Kazakhstan was used for the research [53]. It included social networks (VK.com, YouTube, Instagram, and Telegram) and more than 20 news websites. The total numbers of news items were as follows: 4,233,990 documents, received from various sources in Kazakhstan, and 2,027,963 documents from various sources in Russia; the date span of the publications was from 2000 to 2021 (see Figure 2). The data mainly contained news publications from traditional news web sites or from official groups/channels of those web sites and resources on social networks. There was a small number of news publications from independent bloggers or slightly moderated social network groups.
The data were collected using the Python library Scrapy, for which a custom configurable Spider (crawler) was developed. The scraper was run regularly according to a source-by-source schedule, which ranged from hourly to daily execution based on source priority. The scheduling was implemented using Apache Airflow DAGs. The scraping process was started in late 2019 and subsequently worked according to the schedule; hence, the date and time of collection for each news publication were very close to its publication date.

3.1. COVID-19 Data

Data from JHU CSSE [52] were used is order to analyze the objectivity of the representation of the COVID-19 epidemiological situation in media in Kazakhstan and in Russia. The daily analyzed indicators are presented in Table 2.

3.2. Methods

We proposed the use of three main approaches to analyzing media data:
  • Topic-modeling approach;
  • Sentiment analysis;
  • Analysis by search queries.
The first approach applies Topic Modeling (TM). TM is a method that allows the automatic finding of the hidden latent structures of corpora based on the statistical characteristics of document collections. TM is often used in humanitarian research, since it allows the efficient representation of large volumes of textual data in the form of a distribution of a set of terms over documents (D) and a distribution of documents over topics (T) [55].
LDA [40,56] is often used as a method for building topic models. There is also a popular generalization of LDA, which employs a set of ARTM. We use an ARTM in the form of the BigARTM library [39] in this research.
The probabilistic thematic model is based on the assumption that each document is a set of words generated randomly and independently from the conditional probability distribution of words (w) in documents (d) [55]:
p w | d = t T p w   |   t ,   d   p ( t   |   d ) = t T φ w t θ t d
which represents the sum of mixed conditional distributions on all T-set topics, where p w   |   t is the conditional distribution of words (w) in topics (t), and p ( t   |   d ) is the conditional distribution of topics in the documents (d), w defines the distribution of words and d represents the documents, φ w t is a matrix representing distribution of words over topics and θ t d is a matrix representing the distribution of topics over documents. This ratio is true, based on the assumption that there is no need to maintain the order of documents in the corpus and the order of words in the documents. The LDA method assumes that the components φ w t and θ t d . are generated by Dirichle’s continuous multidimensional probability distribution. The aim of the algorithm is to search for parameters φ w t and θ t d by maximizing the likelihood function with appropriate regularization:
d M w d n d w l n t T φ w t θ t d + R φ , θ m a x
where n d w is the number of occurrences of the word w in the document d, and R φ , θ is a logarithmic regularizer. To determine the optimal number of topics (clusters) T, the method of maximizing the coherence value with the use of UMass metrics is often applied [57].
BigARTM is an open-source library for the simultaneous calculation of topic models on large text corpora, the implementation of which is based on the additive regularization approach (ARTM), in which the maximization of the logarithm of plausibility, restoring the original distribution of W words on documents D, is added to a weighted sum of regularizers, by many criteria:
R φ , θ = i = 1 τ i R i φ , θ
This summand is a weighted linear combination of regularizers, with non-negative τ i weights.
BigARTM offers a set of regularizers:
  • The smoothing regularizer, based on the assumption that the matrix columns φ   a n d   θ are generated by Dirichlet distributions with hyperparameters β 0 β t and α 0 α t (identical to the implementation of the LDA model, in which hyperparameters can only be positive);
    R φ , θ   = β 0 t T w W β w t l n φ w t + α 0   d D w W α t d l n θ t d   m a x
In this way we can highlight the background topics, defining the vocabulary of the language, or calculate the general vocabulary in the section of each document.
2.
By decreasing the regularizer coefficients, the reverse smoothing regularizer can be obtained:
φ , θ   = β 0 t T w W β w t l n φ w t α 0 d D w W α t d l n θ t d   m a x
This aims to identify the significant subject words, so-called lexical kernels, in addition to subject topics in each document, zeroing out small probabilities.
3.
The decorrelator Phi regularizer makes topics more “different”. The selection of topics allows the model to discard small, uninformative, duplicate, and dependent topics:
φ , θ   = 0.5 τ t T s T t c o v φ t φ s m a x ,   c o v φ t φ s = w W φ w t
This regularizer is independent of matrix θ . The estimation of differences in the discrete distributions is implemented by φ w t = p ( w | t ) , in which the measure is the covariance of the current distribution of words in the topics φ t versus the calculated distributions φ s ,   where   s T / t .
The BigARTM topic model was applied to a corpus of over a million texts (news) published from 1 January 2020 to 25 February 2021 from over 30 major internet media sources in Russia and in Kazakhstan. Concatenation of news titles and article bodies was used to extract the topics.
The analyzed media sources publish news articles in three different languages: Russian, English, and Kazakh. For the purpose of comparing Kazakhstani and Russian media, only the news in Russian was considered. Since all three languages use distinctly different alphabets, the filtering was based on simple character-frequency statistics. Next, the news in the Russian language was lemmatized using the PyMyStem3 library [58]. A list of stop words provided by the stop-words Python library [59] was applied.
A cascade of topic models was used in this research, since the preliminary experiments showed that a single topic model is not capable of providing the required details. First, a topic model with 200 topics was built; we refer to it as level-0 (initial) model. Then, experts manually chose and labelled the topics related to medicine, the pandemic, and healthcare. This labelling was used to filter a sub-corpus of documents that had relative weights, in relation to the selected topics (from θ-matrix), above a constant threshold, which was set to 0.05, empirically determined based on experiments. Then, a level-1 topic model (150 topics) was calculated based on the text document from the sub-corpus. However, the analysis of the level-1 topic model showed that the accuracy of results of medicine-related filtration was not high enough, and parts of the topics were irrelevant. Hence, the described process was re-iterated in order to obtain two more models (Level 2 and Level 3). Each time, the number of topics was chosen empirically based on quality metrics (perplexity, coherence, and contrast [39]), as presented in Table 3. Let us discuss the metrics used for the assessment of the models:
Perplexity is an indicator from information theory, which defines how well a probability model predicts a sample. Lower values indicate that the model predicts the sample better. The perplexity of a probability model (topic model) can be defined as:
P P p = 2 H p = 2 x p x l o g 2 p x = x p x p x
where H(p) is the information entropy of the distribution, and x represents an iterator over the samples (documents). Perplexity value does not have a minimum value; hence, it is usually used to compare different models over the same set of data or to detect the “elbow effect” to determine the optimal number of topics [60].
Contrast of the topics is defined by the formula 1 W t w w t p ( t | w ) , where w t is a topic kernel, i.e., the words from the topic with relation weight greater than or equal to a given threshold.
Purity is defined by the formula w w t p ( w | t ) , where w t is also a topic kernel [60].
Finally, the following list of topic models was used for analysis:
  • The level-0 topic model, which mainly consisted of general topics, such as economy, medicine (in general), education, etc.
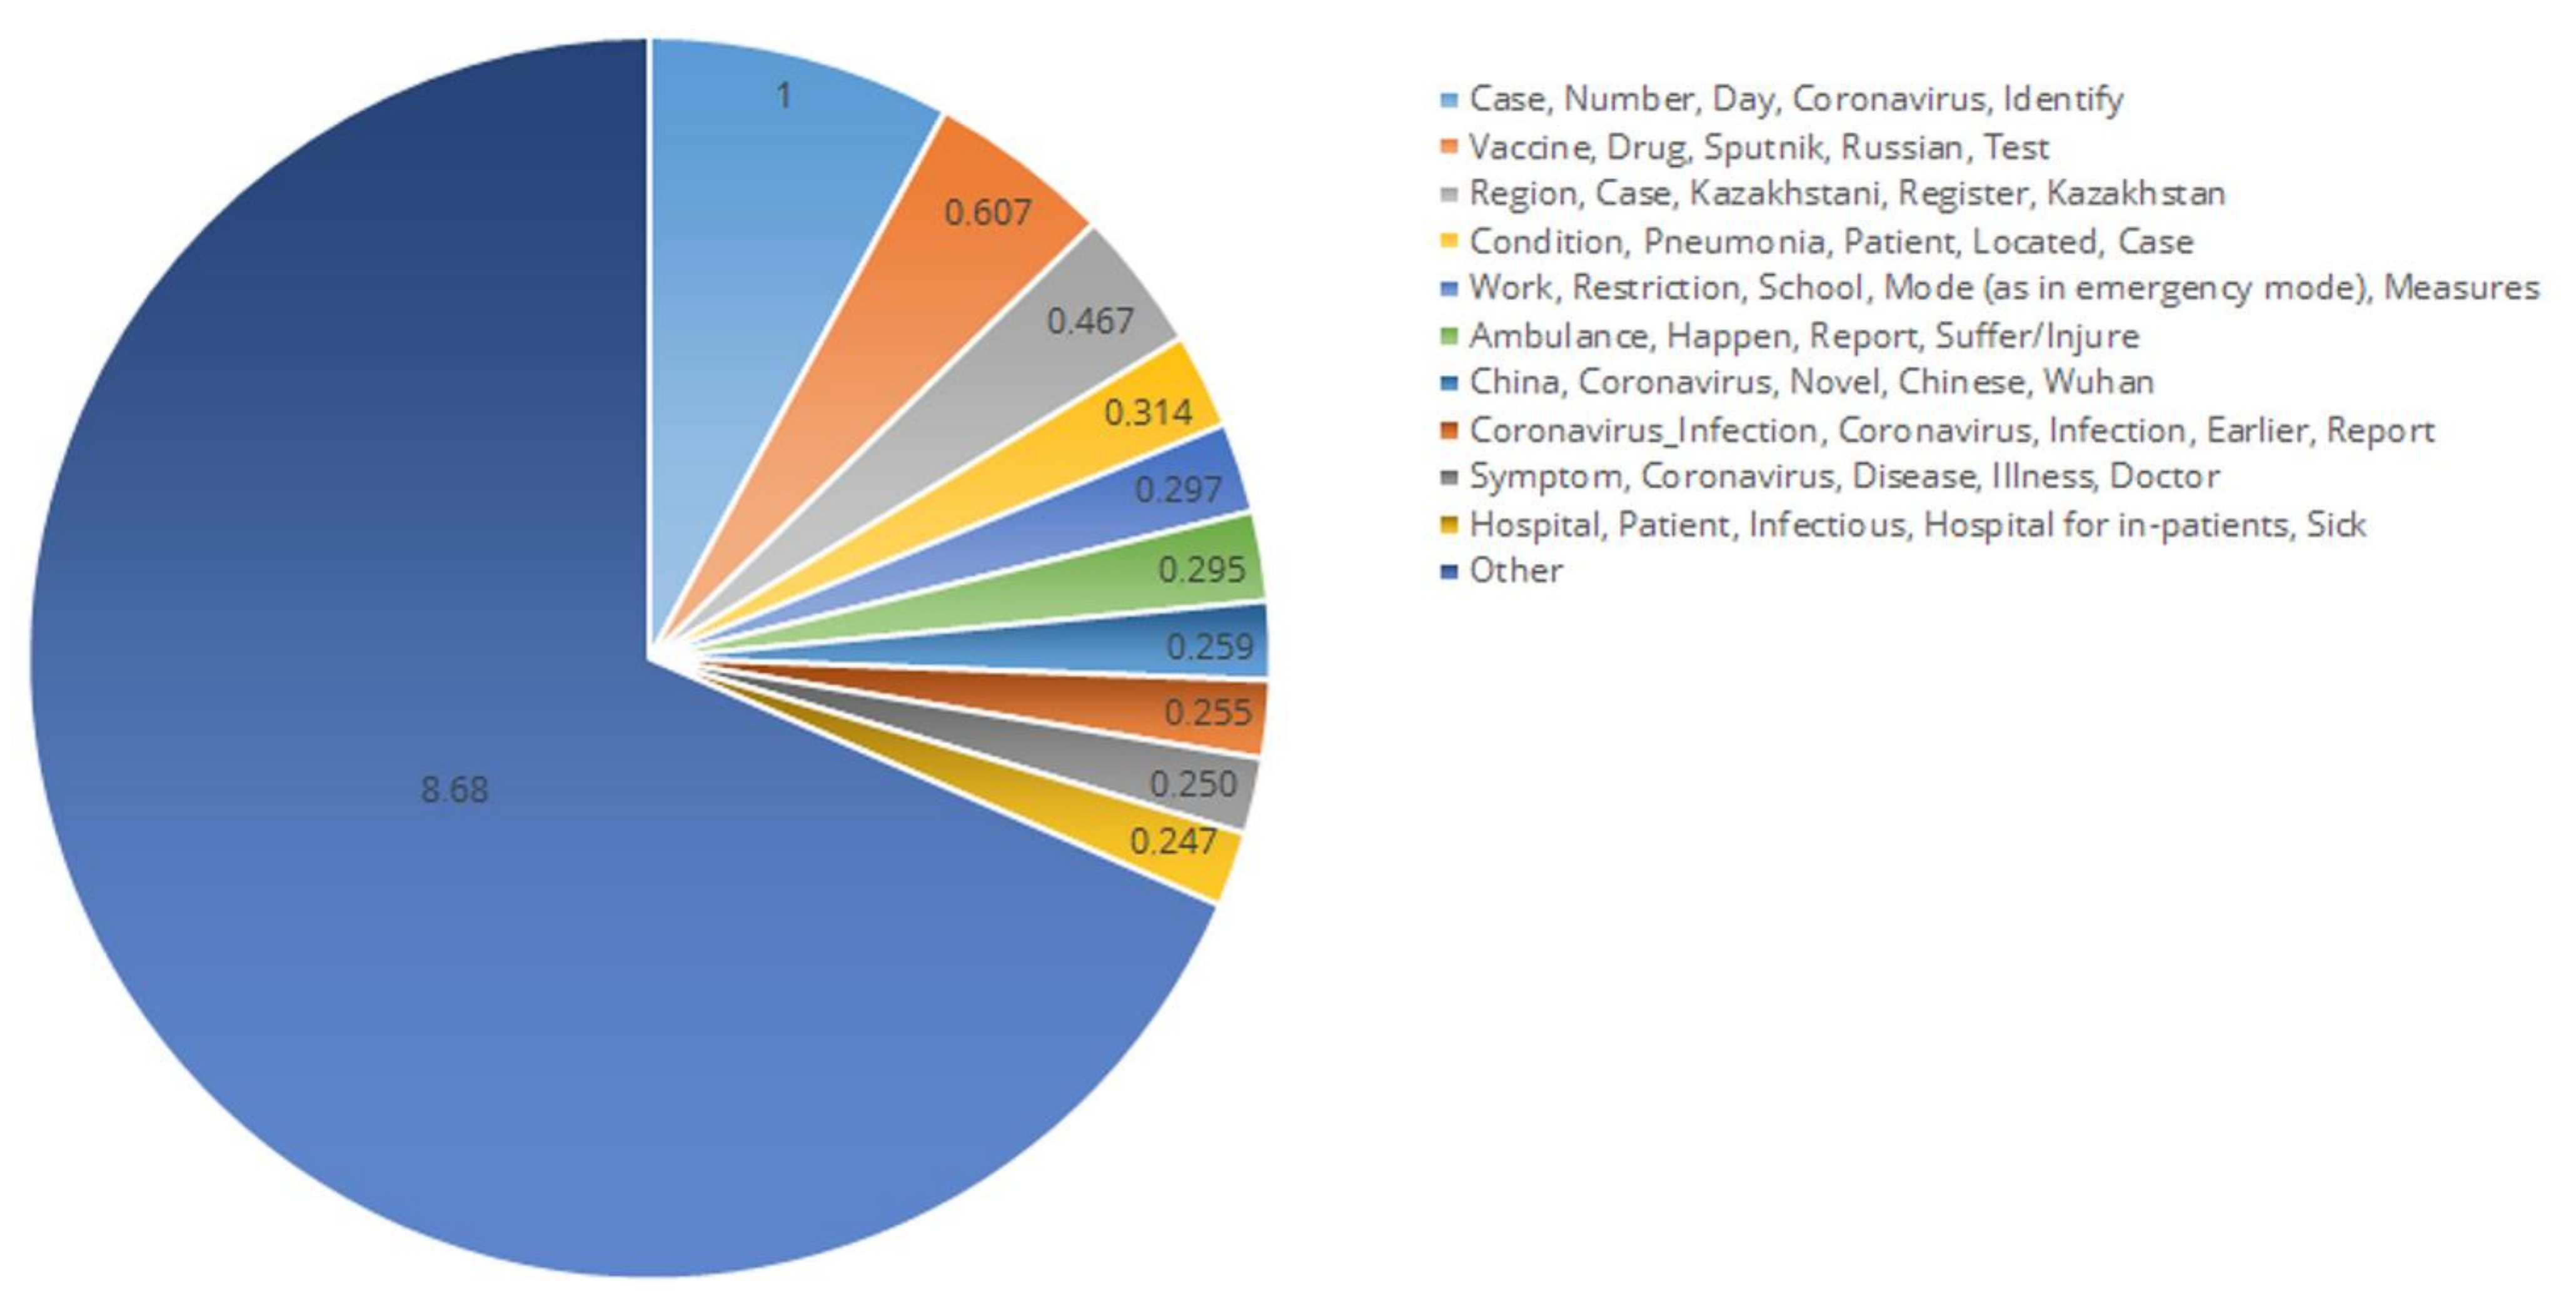
  • The level-2 topic model comprised the topics related to medicine including the ones somehow related to medicine and the epidemiological situation, such as quarantine limitations in education, sport events and public life, the economic situation in the context of the pandemic, etc. (Figure 3)
  • The level-3 topic model provided very high accuracy in classifying medicine- and healthcare-related topics and documents
Table 3 illustrates number of topics, membership thresholds, and quality metrics for the obtained models.
The level-1 topic model did not provide the required level of accuracy; therefore, it was excluded from the analysis. It only served as an intermediate model, which allowed the obtaining of the more accurate models.
The obtained topic models were used in order to calculate the relative weight of each of the topics. The relative weight was calculated daily in order to be able to analyze the topics’ dynamics within the publication activity. The relative weight of a topic is a ratio of a column of the θ-matrix, representing the given topic in relation to the sum of the whole θ-matrix. The relative weight ranges from 0 to 1 and shows the ratio of information related to the given topic in the information field described by the corpus under analysis. Figure 4, Figure 5 and Figure 6 show the dynamics of weekly relative weight of 3 of 100 topics within the level-2 topic model.
The topic model made it possible to exclude the personal bias from the process of analysis; it enhanced the model’s utility in the task of assessing the reflection of epidemiological situation by mass media. However, this approach was found to have two main limitations:
  • It considers the dynamic weight of only single topic, while it might be possible that some combination of topics according to other criteria may be more representative;
  • Topic modelling cannot consider the expert opinion, and certain topics, which are considered to be important by experts, may not be distinguished automatically by the topic model, depending on its meta-parameters.
In order to resolve this limitations, two other approaches were proposed. Sentiment analysis was based on MMA (Mass Media Assessment) method [15], which required expert labelling of topics by sentiment. This approach allowed the analysis of some combinations of topics grouped by their sentiment. It also allowed the creation of effective classification models with low volume high-level manual labeling—in this case, labeling topics by sentiment in the range from −1 to +1. Then, the result for each document was obtained by a summation of expert labeling results weighted by document related to each topic. Another aggregation method could also be used, as described in [15]. On test data, this approach made it possible to achieve an ROC AUC of 0.93, which is comparable to modern deep learning classifiers.
It also should be noted that, in this case, the definition of sentiment differed from the conventional definition: we did not define sentiment as an author’s opinion on some issue, but rather the general positivity or negativity of the described event for the society. Journalism ethics requires news publications to be neutral and objective; hence, the conventional definition of sentiment does not seem to apply to the problem.
The third approach aimed to perform an analysis of specific search queries constructed by experts. It allowed the testing of the specific hypothesis by manually defined search queries without relying on the topic model to distinguish the corresponding topics. The list was composed based on the assumption that the COVID-19 pandemic had significantly affected almost all areas of human activities [61], including healthcare, the economy (unemployment, crisis, poverty) [62], remote work and education [63], crime rate [64], and the abundance of fake news [65]. In the list, we attempted to encompass the most important areas that might have been affected by the COVID-19 pandemic according to common sense and literature review.
The translated list of queries used for the analysis is presented below:
  • Fake, disinformation, anti-vax;
  • Unemployment, poverty;
  • Crisis, economic decline;
  • Famine, starvation, homeless, poverty;
  • Remote education;
  • Freelance, remote work, brain drain;
  • Criminal, robbery, theft, homicide;
  • Crisis, lending, debt, microcredits;
  • Healthcare, hospitals, issues, healthcare scandals;
  • Vaccination, COVID-19 vaccines.
This list was composed manually in order to address the main hypothesis: what areas of human activity were most affected by the COVID-19 pandemic. The list was based on the opinion of populations of Kazakhstan and Russia as perceived by experts. The population was mainly concerned with the economic impact of the pandemic, including unemployment and poverty, the potential growth of criminal activity due to the economic decline, impacts on education and healthcare, and also vaccination and how fake news and disinformation can affect public opinion on the COVID-19 vaccination.
These queries (in Russian) were searched via ElasticSearch with the employment of a multi-match full-text search method, which returned a list of matching documents with relative weights. Then, a daily average of these relative weights was calculated for analysis.
ElasticSearch is a NoSQL in-memory storage database, which uses the Apache Lucene engine for full text search and provides REST API to index (create), modify, and access (search) different types of data, including texts of arbitrary lengths [66]. ElasticSearch makes it possible to effectively perform full-text search queries on large volumes of textual data and is able to assess document relevance based on search queries using built-in algorithms implemented in the Apache Lucene engine [67].
Distribution of media by the top negative and top positive criteria is presented in Appendix A.
The next step was calculating the Pearson correlation coefficient and Spearman correlation coefficient between the three groups of indicators described above and the COVID-19 data (Table 2). The use of these two correlation coefficients was justified by the necessity to verify the results using two fundamentally different statistics (parametric and non-parametric). The Pearson correlation assesses the linear dependency between two variables, while the Spearman coefficient assesses how well the relationship of two variables can be described using a monotonic function (which may or may not be linear). These coefficients can be applied to assess the correlation between two time series. Usually, such research is performed under the hypothesis that one of the time series is an independent variable and another is a dependent variable. Such a method of analysis allows the performance of an automatic dependency search between hundreds of variables (time series); however, the results must be manually analyzed and verified by experts, since correlation analysis may produce inadequate results, especially when there are too many different indicators under consideration. The following experimental procedure was proposed:
  • Experiments should be performed for Russia and Kazakhstan separately;
  • Experiments should be performed for each of the topic models’ average daily sentiments using the level-2 topic model, and for each of the search queries separately;
  • Experiments should be performed for each of seven COVID-19 indicators selected for analysis.
Below is a description of the system architecture, which implemented the proposed methods for data collection, processing and analysis. During the development of the data processing architecture, the following key needs were identified [68]:
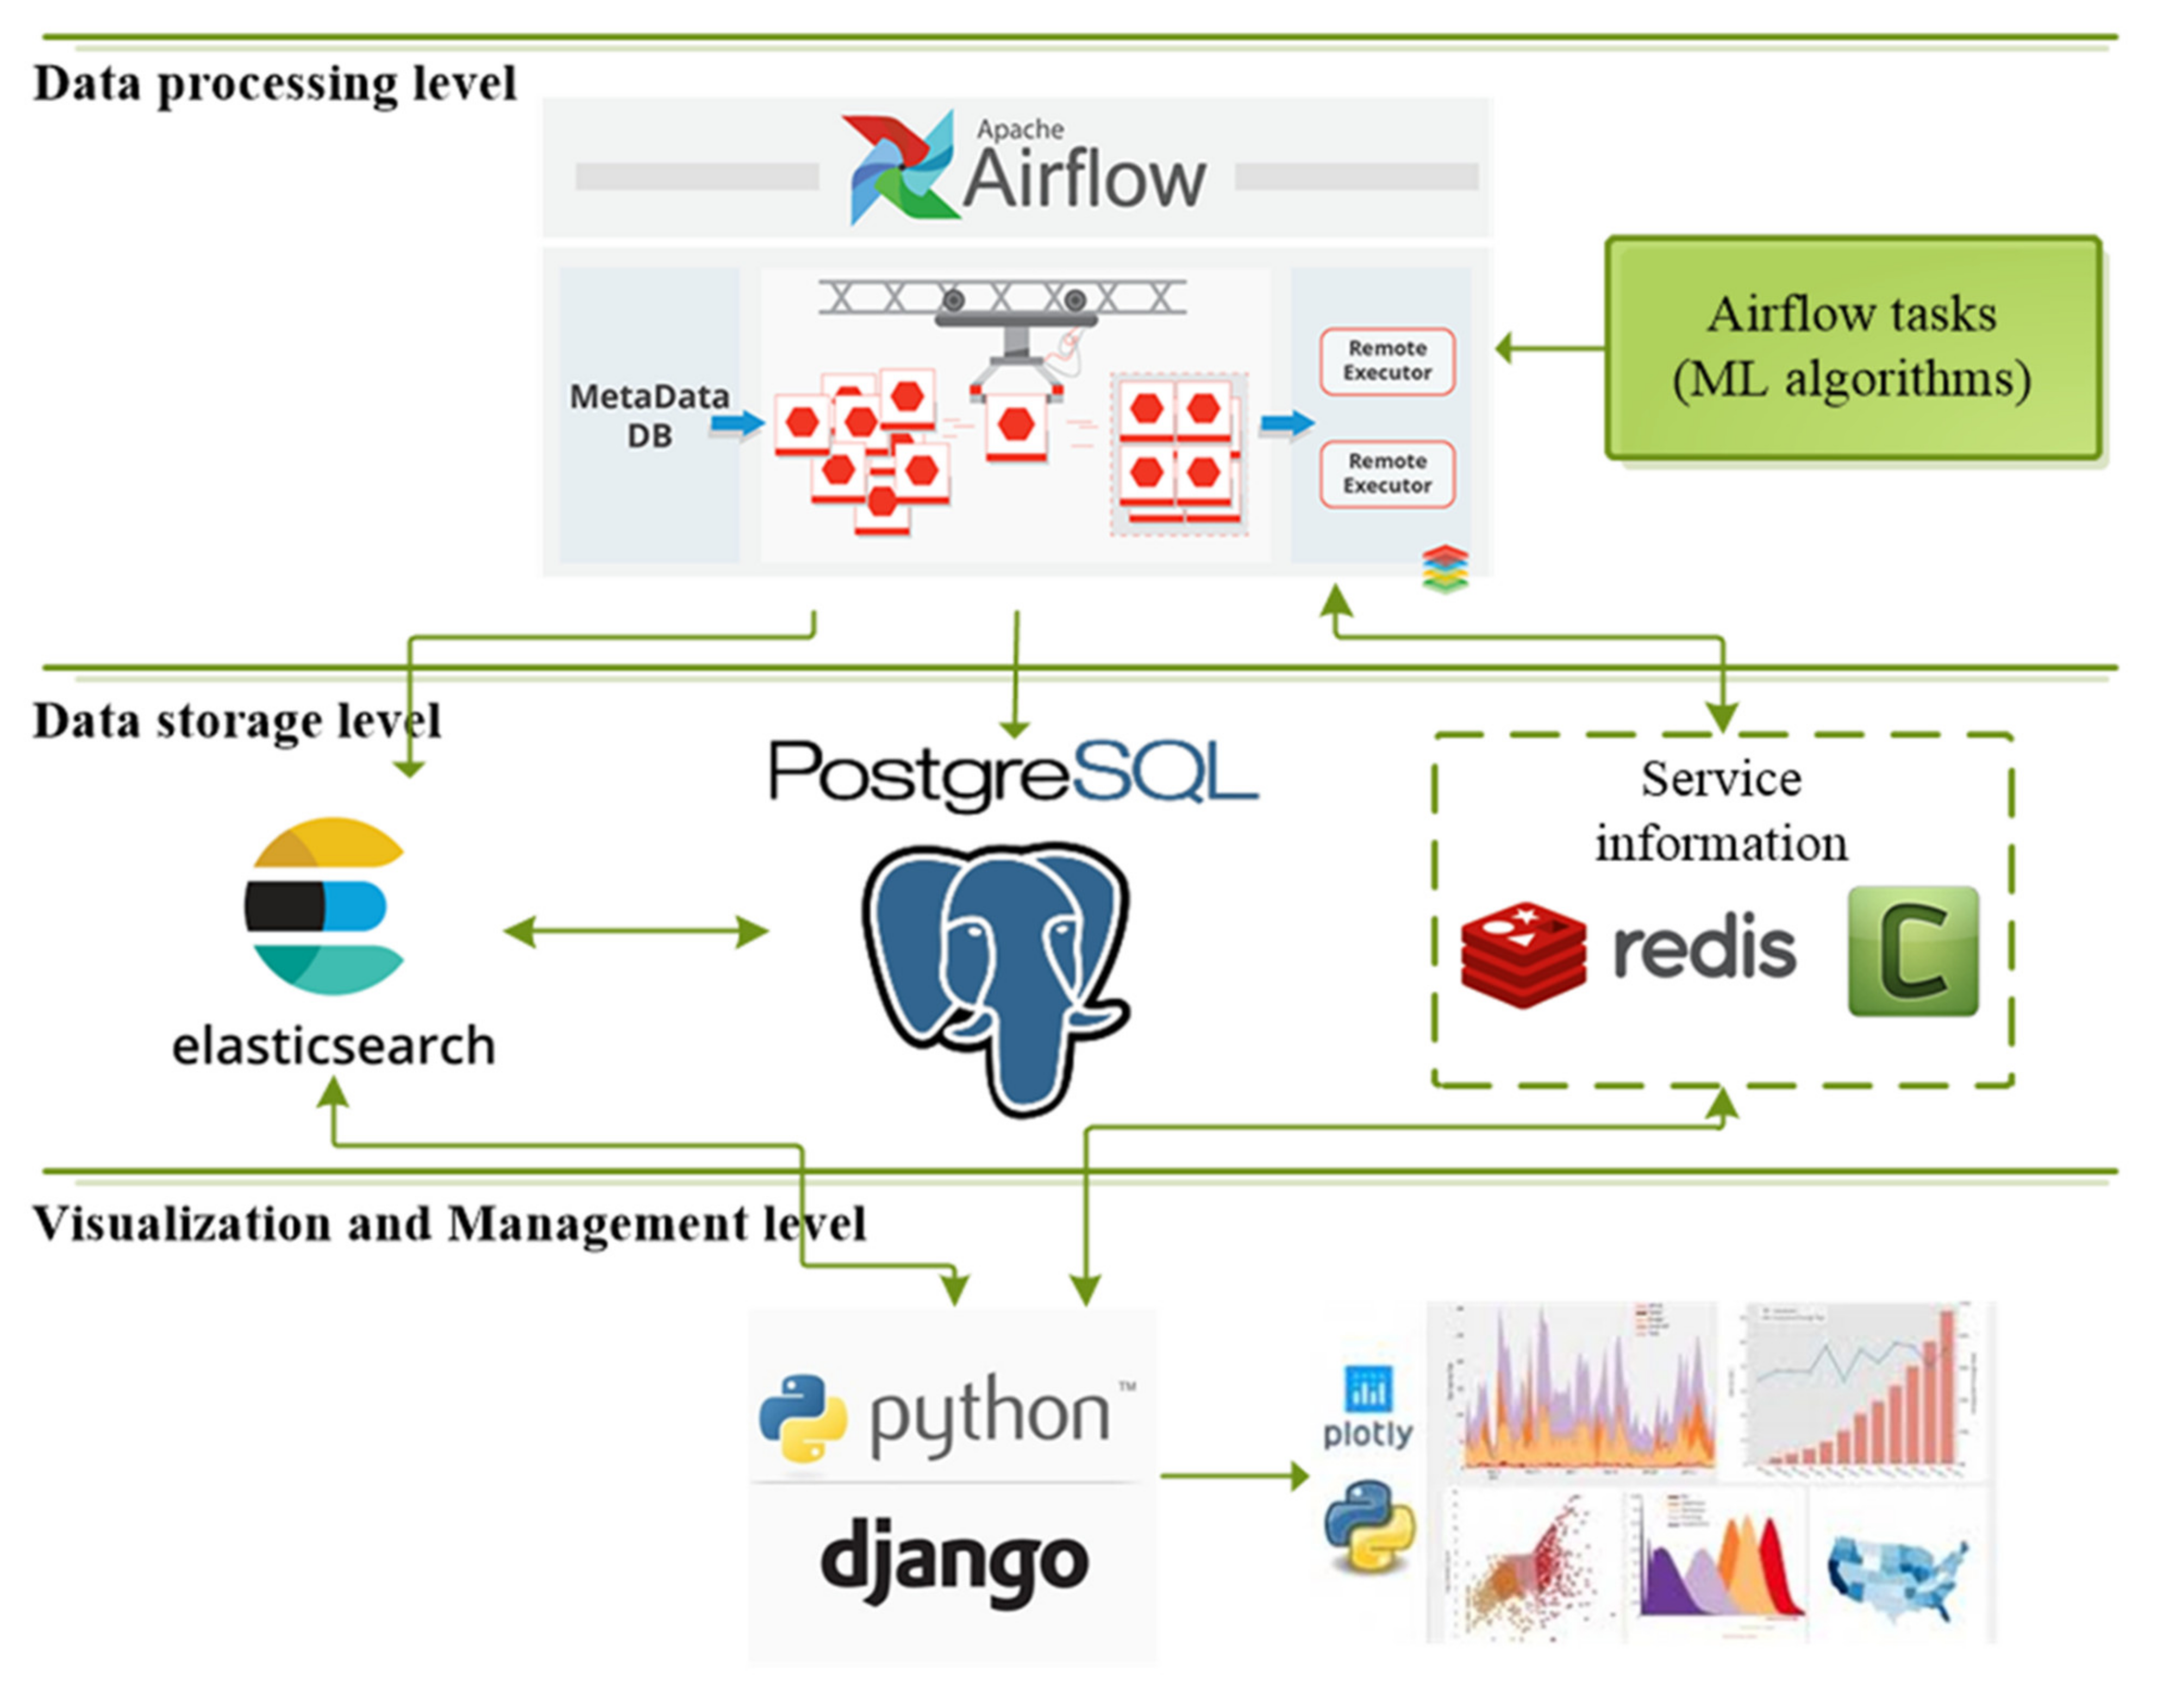
  • The possibility of simultaneous calculations with the employment of several machines;
  • Ability to flexibly plan the various data processing tasks;
  • Ability to monitor tasks in real time, including prompt notification of exceptions;
  • Flexibility in using the tools and technologies.
The Apache Airflow open-source software platform was chosen to meet all these needs that were identified in the analysis.
The system components (see Figure 7) were organized as Docker containers [68].
The containers had access to the same virtual network, which provided the ability to exchange data using standard network protocols (TCP). This system implementation ensured the operation of subsystems as independent components, and each of them could be replaced if necessary. The interaction of the system layers—the visualization layer and the data processing layer—was carried out with the help of the storage system.
There were three types of storage in the system:
  • PostgreSQL—performed the role of a persistent storage medium for structured data;
  • ElasticSearch—in-memory NoSQL storage, dedicated to storing unstructured or poorly structured data, as well as fast search (including full-text), filtering, and streaming access;
  • Redis—fast key-value storage, used for caching individual pages and elements, and for caching authorization sessions. Redis stored service data as well as page and element caches, which were often accessed.
The general scheme of component interaction was organized according to the ETL (extract, transform, load) principle: the user makes a request for data in ElasticSearch (if data are rarely used) or in Redis (if data are often used). Text processing algorithms were implemented as Airflow-tasks. The processing subsystem used Airflow-scheduler, which writes information about the distribution of tasks by workers to Redis; they, in turn, report to Redis about the status of their tasks. The subsystem interface was an HTML + CSS + JS website accessible via the HTTP protocol. The web application was implemented on the Python Django framework, the webserver was Gunicorn, and the reverse proxy was Nginx. The web application had access to both the persistent storage PostgreSQL and ElasticSearch.

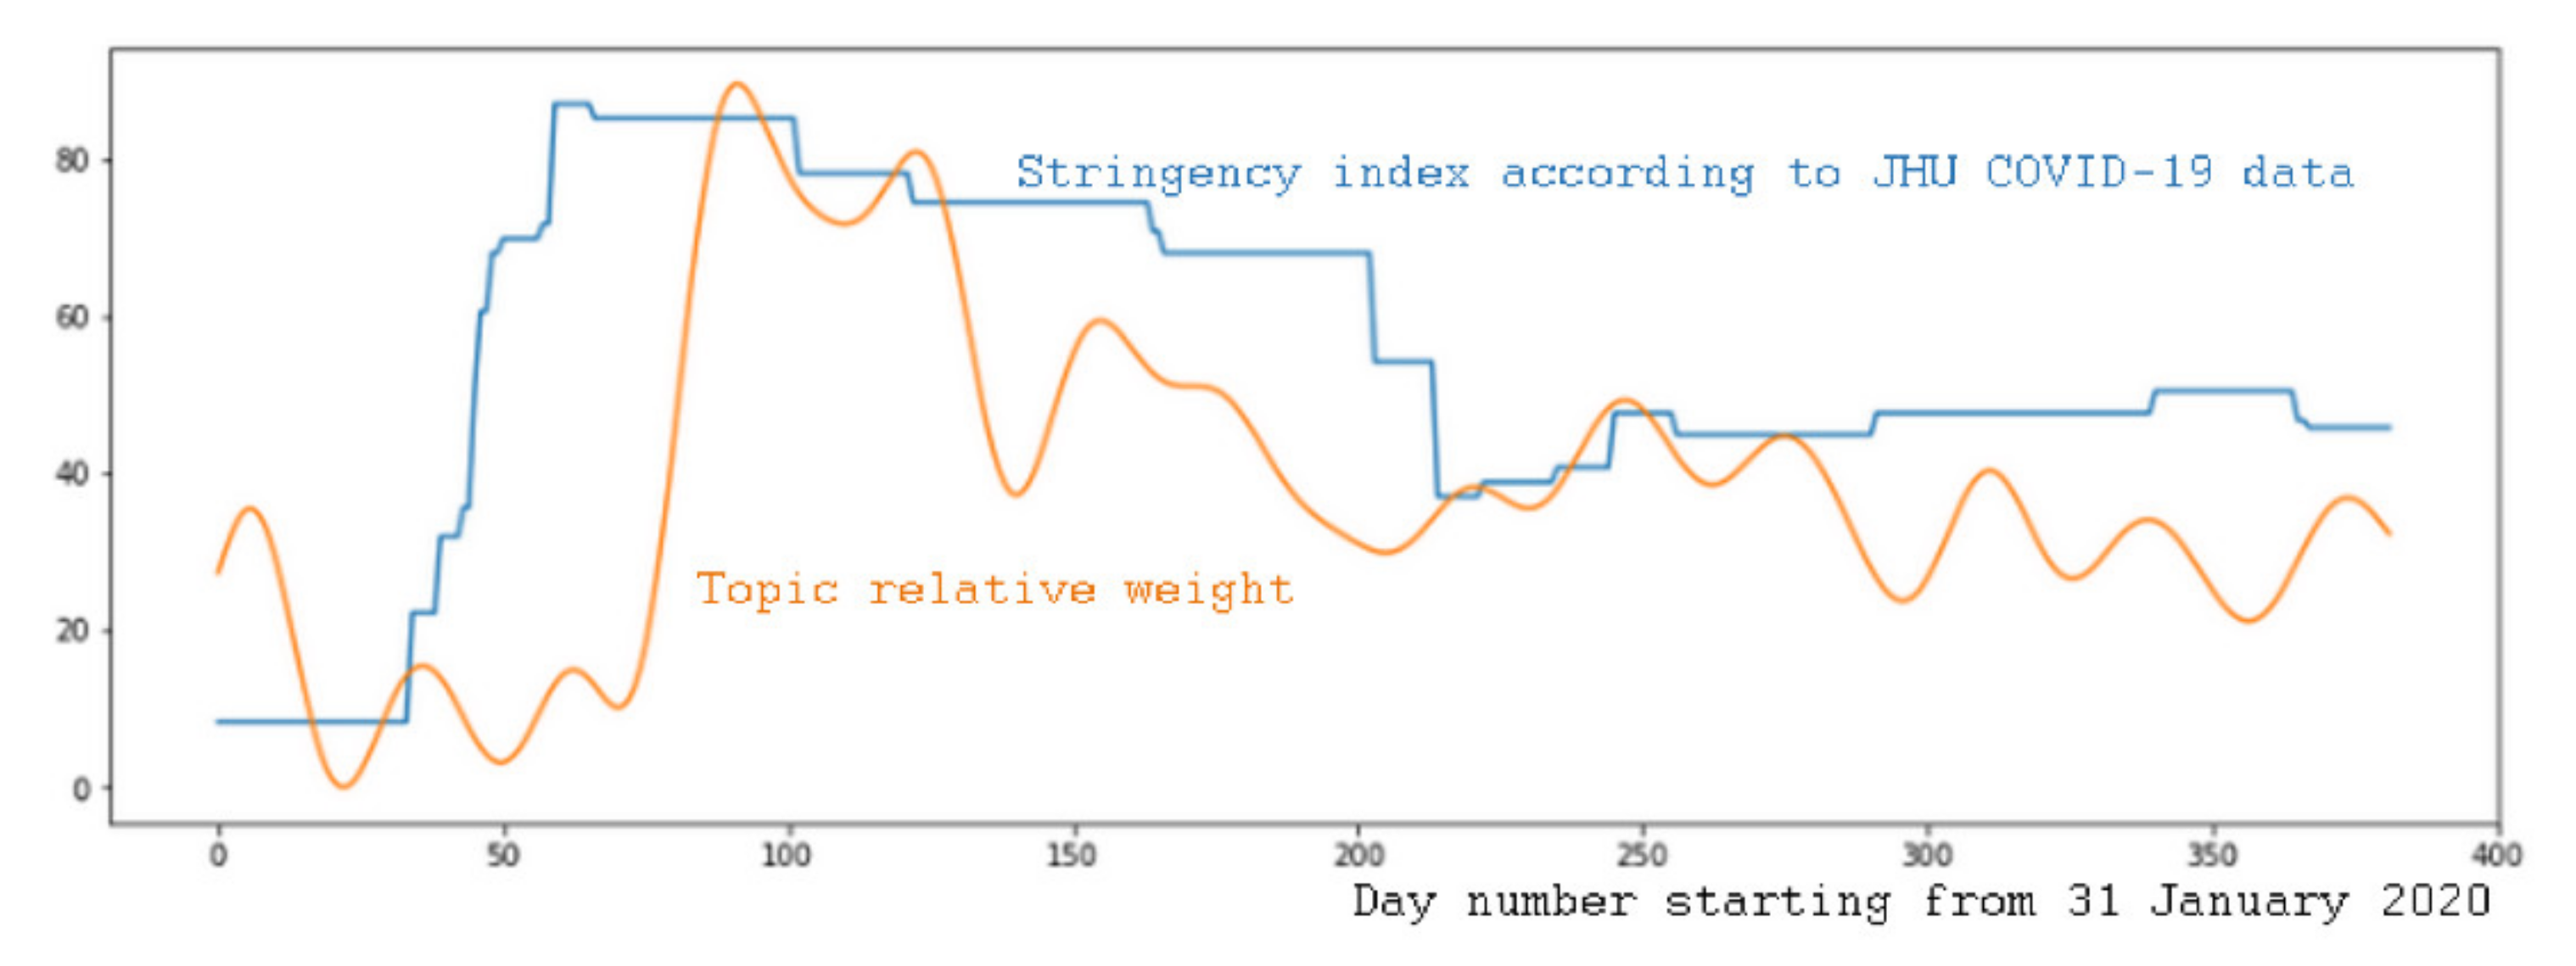
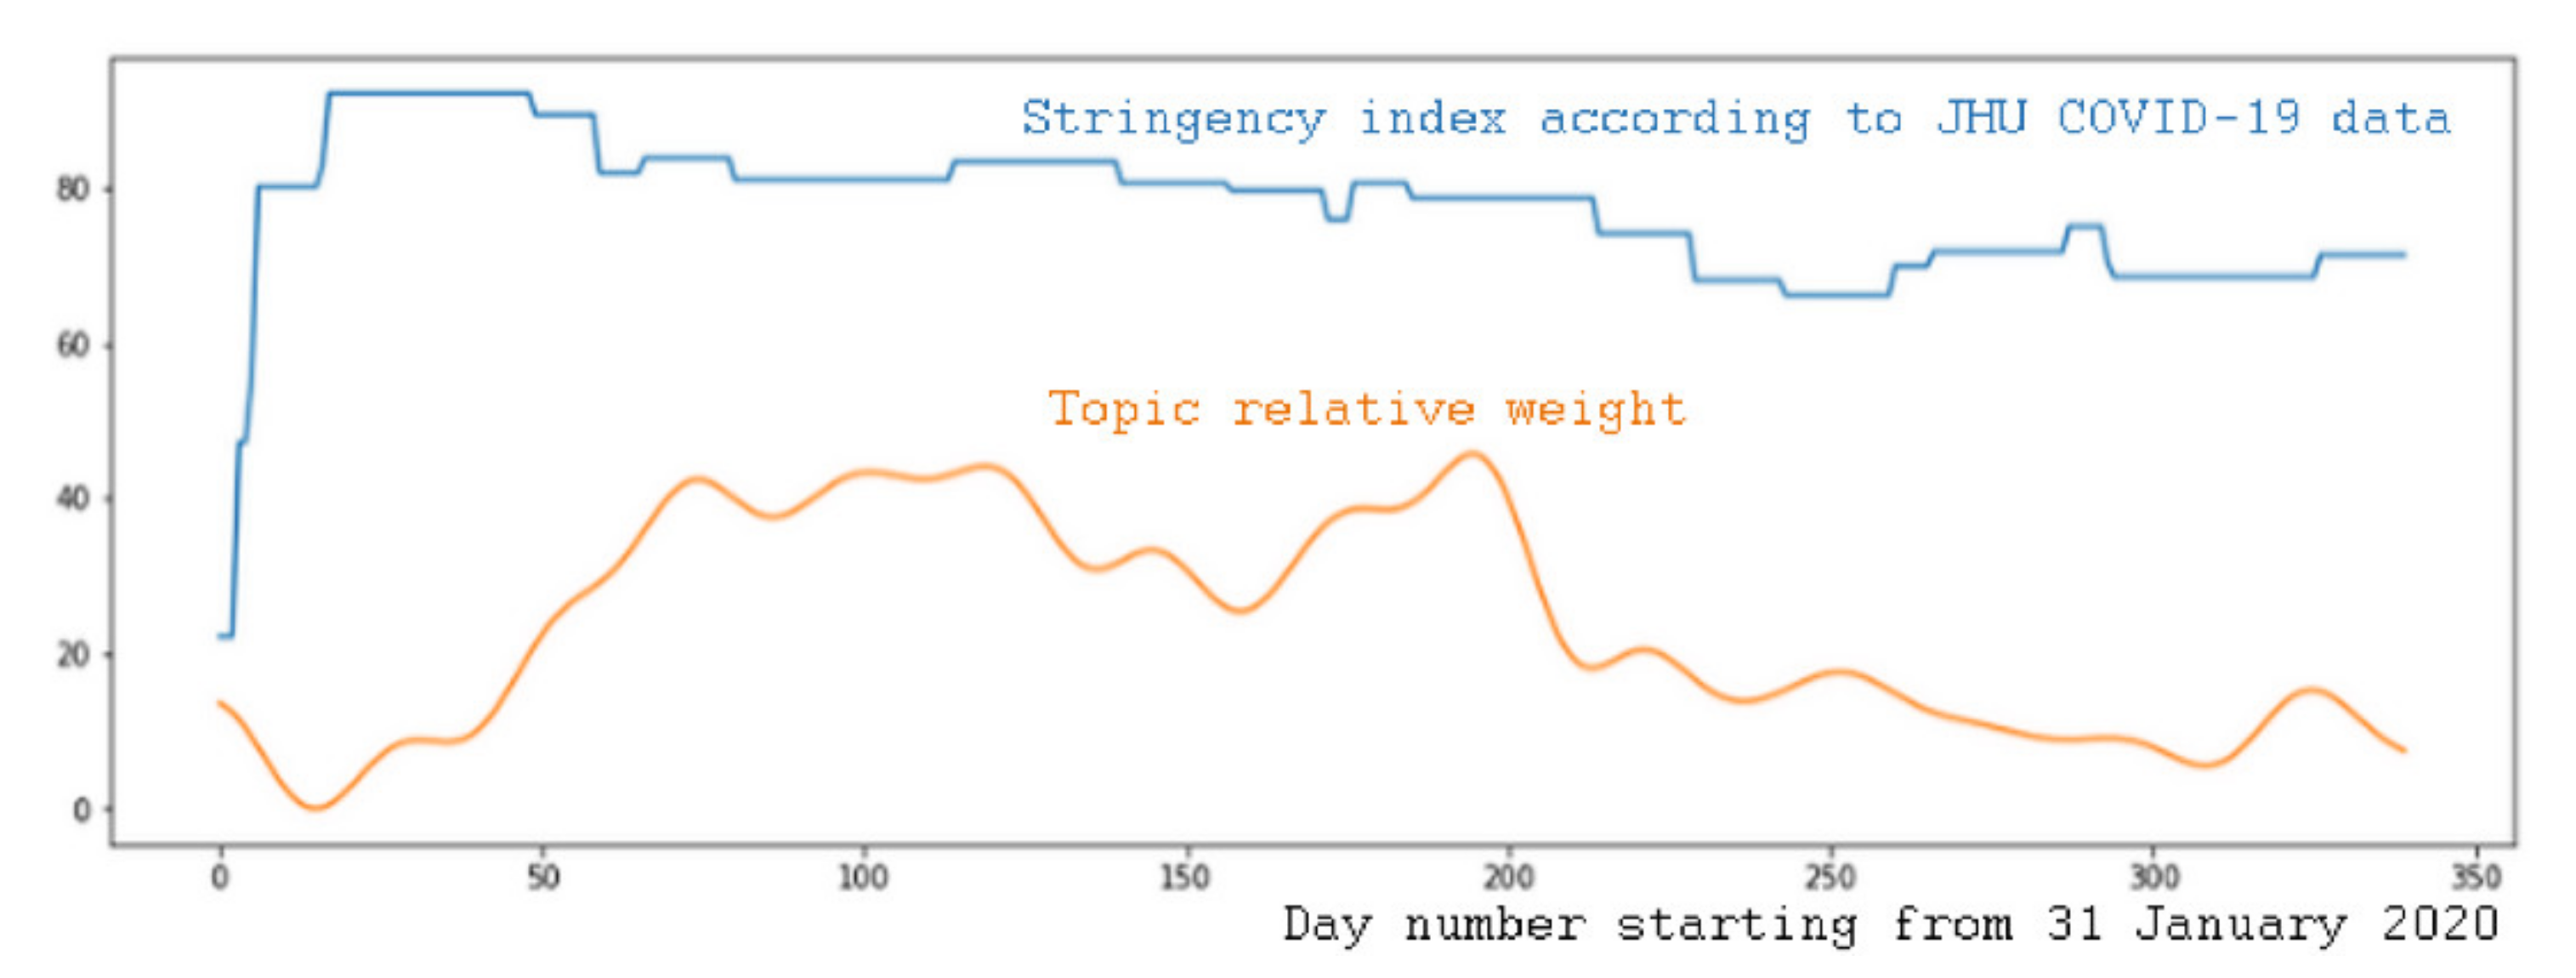
4. Results and Discussion

The proposed method was applied to the obtained topic models over the course of 42 experiments in which analysis was performed across two countries, three topic models and seven indicators. Then, the results of the experiments were analyzed by experts. Table 4 illustrates an example of data obtained during the experiments, and shows the topics with top correlation.
The implemented research allowed us to propose some results and recommendations.
The numbers of daily deaths and daily new cases had higher maximum correlations in all of the experiments (typically 0.6–0.8). However, more informative relative indicators, such as the positive test rate, reproduction rate, and number of tests per positive result (an indicator, reversed to the “positive test rate” indicator) had lower maximum correlations (typically 0.4–0.6). Hence, the media in Kazakhstan and in Russia focused too much on absolute numbers, which can be argued to be biased and less informative. For example, the absolute number of new identified COVID-19 cases does not reflect the situation accurately, since the number of performed tests may vary drastically. Such types of analysis can lead to situations when, although the overall epidemiological situation is steady, media start to inflate the public opinion and cause panic due to an increase in the number of tests, which leads to an increase in the absolute number of new cases, and the reverse situation is also possible. However, media agencies in Kazakhstan and in Russia seemed to ignore the relative indicators.
The index of the stringency of quarantine restrictions seemed to have high correlation with topics in media in Russia (0.75, Figure 8), while media in Kazakhstan did not seem to focus on stringency, and the highest correlation was only 0.43 (Figure 9). This may indicate that in Kazakhstan, there was a divergence between restrictions due to the pandemic and their reflection in the media, which can be considered as a problem, since mass media are one of the main tools for government to broadcast information about current the situation and related restrictions.
A topic from the Kazakhstani news corpus with main associated words being “oxygen, investigation, embezzlement” had the highest correlation with the number of daily deaths from COVID-19 (0.8). This correlation was one of the highest among all topics and COVID-19 indicators for Kazakhstan. It could be argued that this proves that criminal embezzlements of liquid oxygen, required for critical cases of lung damage induced by COVID-19, might be a reason for the increase in the number of deaths. Topics related to the coronavirus vaccination had the highest correlation with the number of deaths in Russia (0.82–0.84). This could be interpreted as an attempt to mitigate the risks of panic among the population by informing them about new methods of stopping the epidemic.
One counterintuitive outcome of the series of experiments was that there was a strong negative correlation between the number of deaths and newly identified cases and topics related to the economy and banking (−0.3, −0.4). Although the negative impact of the pandemic on the world economy is obvious, the deterioration of the epidemiological situation did not cause the sudden increases in information on politics- and economics-related topics; at the same time, neutral topics, such as culture, art, celebrities, and lifestyle, do not correlate considerably with epidemiological indicators.
Table 5, Table 6 and Table 7 show the correlation coefficients between COVID-19 indicators and sentiment in the media in Russia and in Kazakhstan. It is important to note that most topics that were labelled by experts to be positive according to the level-2 topic model were related to vaccination, COVID-related scientific research, and medical development. There were also several topics on positive COVID-19 dynamics occurring as a result of compliance with quarantine conditions, as well as a topic about governmental support of small businesses. Hence, this explains why there was a high correlation between positive news and overall average sentiment and such indicators as numbers of new deaths and numbers of new cases.
These data make it possible to draw some conclusions, which are presented below.
This results obtained using this approach support the hypothesis that the media in Russia reflected COVID-19 situation more accurately.
Moreover, the number of negative news stories in media in Russian strongly correlated with two very representative parameters—the virus reproduction rate and the quarantine stringency index—which also indicates that the mass media in Russia presented the situation in an objective and accurate manner.
Rankings according to the Pearson and Spearman correlation coefficients were identical to the data obtained for the Russian Federation and very similar to the data for Kazakhstan. This might indicate that, in the Russian Federation, mass media publication activity was responsive the changes in the epidemiological situation in a more linear way, as compared to the media in Kazakhstan.
Generally, there was a moderate correlation between the number of deaths, new cases, and new tests, and the number of positive news stories (which was also considerably higher in the Russian media). This might indicate that the media generally tend to smooth out the negative psychological effects caused by the pandemic situation, rather than inflating fear. Specifically, when the epidemiological situation deteriorated, the media tended to publish more information about the latest research on—and benefits of—vaccines.
Lastly, we consider the results of the manually constructed full-text search query analysis. There were several options for obtaining the time series from the query results. In this case, the average daily relative weights of the documents were used (the results are presented in Table 8).
These experiments also demonstrated that the Russian media reflected the COVID-19 situation more objectively.
The rankings that were constructed according to the Pearson and Spearman correlation coefficients were also identical for the Russian Federation, while for Kazakhstan, there was considerable inconsistency.
In the cases of both sentiment and query correlation, the most inconsistent COVID-19 indicator, which accounted for the most of the differences in ranking, was the stringency index of Kazakhstan. According to the analysis, this might indicate that the stringency index in Kazakhstan changed non-linearly and it was less responsive to changes in the epidemiological situation as compared to the stringency index in Russia. Figure 8 and Figure 9 illustrate this difference, since it is visible that the spread of the stringency index was much lower in Kazakhstan (while the epidemiological situation’s spread seemed to be comparable).
In both countries, the Healthcare, Crisis, and Vaccination queries showed the highest correlation, while Crime and Famine/Starvation were ranked much lower, even in the media in Russia, which might indicate that the fears that the pandemic critically damaged the economy and led to severe problems such as crime and extreme poverty were not justified.
In Kazakhstan, the query about fake news and disinformation was ranked much higher than in Russia, which might indicate that these were significantly more acute problems for Kazakhstan.
The queries about remote education, freelancing, and unemployment showed moderate correlations in both countries.
The hypothesis that there might be a lag between COVID-19 indicators and mass media reaction was already addressed in a number of computational experiments. Different lags between −10 and +10 days were tested. The experiments showed that mass media and COVID-19 indicators steadily demonstrated maximum correlation at close to zero lag, while increases in the lag (either positive or negative) led to monotonic decreases in the maximum and average correlation coefficients. This regularity was observed in both countries. Although it might intuitively be assumed that mass media should react to COVID-19 indicators with some delay, in practice, this idea is not supported. Two explanations can be considered in this regard:
  • Mass media received actual information rather promptly, and react to it operatively;
  • There was some inherent lag in the analyzed COVID-19 indicators. For example, daily statistics may have actually contained some sort of aggregated information over several days due to imperfections in statistical data collection processes in Kazakhstan and Russia.
The main contribution of this work is the proposal of a model to perform a comparative analysis of the representation of the COVID-19 pandemic by mass media in two different countries, where English was not used as the language of communication, taking into account multiple points of view—automatically obtained topics, average sentiment, and dynamic indicators—according to manually selected search queries.

5. Conclusions and Future Research

The COVID-19 pandemic has had a great impact on the life of society in almost all countries of the world. The analysis of media texts allows us to evaluate the public reaction to the non-standard situation and the measures taken by national governments.
We proposed a method that, in this study, made it possible to analyze how statistical indicators related to COVID-19 were reflected in mass media. The method assumes the application of BigARTM or another topic model in order to obtain the topical structure of the corpus, which can then be used to calculate the topics’ dynamics. Those dynamical indicators of publication activity can be compared with COVID-19 indicators, such as numbers of new cases, positive test rates, stringency indexes, and others, in order to perform the correlation analysis. In this study, sentiment analysis based on topic embeddings [14] was also conducted, as well as an analysis of correlation in which the daily average relevance weights were obtained from 10 full-text search queries constructed manually by experts.
The main advantage of the proposed method is that it combines the analysis the dynamics of unbiased and automatically obtained topics, sentiment analysis based on expert labelling, and manual queries. It can be argued that an such approach may produce more objective results and conclusions through the comparative analysis of the results of three groups of computational experiments.
The proposed method can potentially be used to obtain insights on how COVID-19 is presented in the media, and on which statistical indicators describe the media activities. For example, it was found that the media in Russia and in Kazakhstan focused on absolute values, while more informative relative indicators such as positive test rates and virus reproduction rates were generally ignored, since such indicators showed much lower correlations with publishing activities on several topics as well as with sentiment.
The method might also be applied to estimate how the stringency of quarantine limitations is reflected in the media. Such an analysis may help indicate reasons for deteriorations in the epidemiological situation, since quarantine restrictions must not only be introduced, but also enforced and broadcasted.
The limitations of the current study include the fact that only daily aggregations were used, while valuable insights could theoretically also have been obtained at different degrees of granularity. Time-lagged correlation was not considered in the study; however, this is not a limitation of the method.
One obvious methodological limitation, which is inherent to all correlation-based approaches, is the possibility of sporadic correlations. However, the proposed method attempts to avoid this problem by using small (daily) granularity, which makes the chances of sporadic random correlation much lower, and also by including three different groups of experiments into the analysis to make it possible to cross-check the findings.
It should also be noted that, in the study, the cross-national effects were not taken into account; thus, the lack of generalizability to a global perspective is a limitation of this study.
Directions of further research include:
  • Attempt to build a model for the recognition of inaccuracies in official statistical indicators regarding the COVID-19 pandemic using mass media data as a reference;
  • Conduct an analysis of the topical profile of the COVID-19 pandemic in different countries and explore how it evolved over time. Such an analysis can be used to assess its impact on the economy, education, politics, tourism, etc.

Author Contributions

Conceptualization, R.I.M. and K.Y.; methodology, R.I.M., K.Y. and E.Z.; software, K.Y.; validation, V.L., Y.K. and M.Y.; formal analysis R.I.M.; investigation, A.S., M.A., E.Z. and V.G.; resources, R.I.M.; data curation, K.Y., E.M. and M.Y.; writing—original draft preparation, R.I.M. and K.Y.; writing—review and editing, M.Y., A.S., V.G. and R.I.M.; visualization, R.I.M., E.M. and K.Y.; supervision, R.I.M.; project administration, Y.K. and V.G.; funding acquisition, R.I.M., V.L. and M.A. All authors have read and agreed to the published version of the manuscript.

Funding

This research was funded by the Science Committee of the Ministry of Education and Science of the Republic of Kazakhstan, Grant No. AP09259587, “Developing of methods and algorithms of intelligent GIS for multi-criteria analysis of healthcare data”, and by the Slovak Research and Development Agency, no. APVV PP-COVID-20–0013, “Development of methods of healthcare system risk and reliability evaluation under coronavirus outbreak”.

Institutional Review Board Statement

Not applicable.

Informed Consent Statement

Not applicable.

Data Availability Statement

Data are available at https://data.mendeley.com/datasets/2vz7vtbhn2/1 (accessed on 4 December 2021); https://data.mendeley.com/datasets/hwj24p9gkh/1 (accessed on 4 December 2021) under dataset License: CC-BY-SA.

Acknowledgments

The authors would like to express their sincere gratitude to the anonymous referees for their useful comments and to Yelena Popova for her professional support.

Conflicts of Interest

The authors declare no conflict of interest.

Appendix A

Visualization of the topic modeling and sentiment analysis results for the corpus of media publications.
Figure A1. The dynamics of sentiment.
Computation 09 00140 g0a1
Figure A2. Number of positive and negative articles.
Computation 09 00140 g0a2
Figure A3. Negative media.
Computation 09 00140 g0a3
Figure A4. Top negative news.
Computation 09 00140 g0a4
Figure A5. Top positive news.
Computation 09 00140 g0a5

References

  1. Baldwin, R.; di Mauro, B.W. Economics in the time of COVID-19: A new eBook. VOX CEPR Policy Portal 2020, 2–3. [Google Scholar]
  2. Atun, R. Transitioning health systems for multimorbidity. Lancet 2015, 386, 721–722. [Google Scholar] [CrossRef]
  3. Orlov, E.M. The category of effectiveness in the health care system. Basic Res. 2010, 10, 70–75. [Google Scholar]
  4. Panch, T.; Szolovits, P.; Atun, R. Artificial intelligence, machine learning and health systems. J. Glob. Health 2018, 8, 020303. [Google Scholar] [CrossRef] [PubMed]
  5. The Socio-Economic Impact of AI in Healthcare. October 2020. Available online: https://www.medtecheurope.org/wp-content/uploads/2020/10/mte-ai_impact-in-healthcare_oct2020_report.pdf (accessed on 10 September 2021).
  6. Mukhamediev, R.I.; Symagulov, A.; Kuchin, Y.; Yakunin, K.; Yelis, M. From Classical Machine Learning to Deep Neural Networks: A Simplified Scientometric Review. Appl. Sci. 2021, 11, 5541. [Google Scholar] [CrossRef]
  7. Lee, J.; Yoon, W.; Kim, S.; Kim, D.; Kim, S.; So, C.H.; Kang, J. BioBERT: A pre-trained biomedical language representation model for biomedical text mining. Bioinformatics 2020, 36, 1234–1240. [Google Scholar] [CrossRef]
  8. Daniel, J.; Willie, R.; Copley, C. Towards automating healthcare question answering in a noisy multilingual low-resource setting. In Proceedings of the 57th Annual Meeting of the Association for Computational Linguistics, Florence, Italy, 28 July–2 August 2019; pp. 948–953. [Google Scholar] [CrossRef]
  9. Feng, L.; Xiaoli, W.; Qingfeng, W.; Jiaying, L.; Xueliang, Q.; Zhifeng, B. HQADeepHelper: A deep learning system for healthcare question answering. In Companion Proceedings of the Web Conference 2020 (WWW ’20); Association for Computing Machinery: New York, NY, USA, 2020; pp. 194–197. [Google Scholar] [CrossRef]
  10. Draganescu, O. Forms of Influencing Young People through Media Discourse. EIRP Proc. 2019, 13. Available online: http://www.proceedings.univ-danubius.ro/index.php/eirp/article/view/1965/2250 (accessed on 2 December 2021).
  11. Choudhary, V. Role of mass media in shaping public opinion. Aut Aut Res. J. 2020, XI, 398–404. [Google Scholar]
  12. Tasnim, S.; Hossain, M.; Mazumder, H. Impact of Rumors and Misinformation on COVID-19 in Social Media. J. Prev. Med. Public Health 2020, 53, 171–174. [Google Scholar] [CrossRef] [PubMed] [Green Version]
  13. Gao, J.; Zheng, P.; Jia, Y.; Chen, H.; Mao, Y.; Chen, S.; Wang, Y.; Fu, H.; Dai, J. Mental health problems and social media exposure during COVID-19 outbreak. PLoS ONE 2020, 15, e0231924. [Google Scholar]
  14. Ghasiya, P.; Okamura, K. Investigating COVID-19 News across Four Nations: A Topic Modeling and Sentiment Analysis Approach. IEEE Access 2021, 9, 36645–36656. [Google Scholar] [CrossRef]
  15. Mukhamediev, R.I.; Yakunin, K.; Mussabayev, R.; Buldybayev, T.; Kuchin, Y.; Murzakhmetov, S.; Yelis, M. Classification of Negative Information on Socially Significant Topics in Mass Media. Symmetry 2020, 12, 1945. [Google Scholar] [CrossRef]
  16. Kirill, Y.; Mihail, I.G.; Sanzhar, M.; Rustam, M.; Olga, F.; Ravil, M. Propaganda Identification Using Topic Modelling. Proc. Comput. Sci. 2020, 178, 205–212. [Google Scholar] [CrossRef]
  17. Battineni, G.; Chintalapudi, N.; Amenta, F. Forecasting of COVID-19 epidemic size in four high hitting nations (USA, Brazil, India and Russia) by Fb-Prophet machine learning model. Appl. Comput. Inform. 2020. [Google Scholar] [CrossRef]
  18. Yakunin, K.; Murzakhmetov, S.; Mussabayev, R.; Muhamedyev, R. News popularity prediction using topic modelling. In Proceedings of the 2021 IEEE International Conference on Smart Information Systems and Technologies (SIST), Nur-Sultan, Kazakhstan, 28–30 April 2021. [Google Scholar] [CrossRef]
  19. Tatar, A.; Antoniadis, P.; de Amorim, M.D.; Fdida, S. Ranking news articles based on popularity prediction. In Proceedings of the 2012 IEEE/ACM International Conference on Advances in Social Networks Analysis and Mining, Istanbul, Turkey, 26–29 August 2012; pp. 106–110. [Google Scholar]
  20. Bandari, R.; Asur, S.; Huberman, B. The pulse of news in social media: Forecasting popularity. In Proceedings of the International AAAI Conference on Web and Social Media, Dublin, Ireland, 4–7 June 2012. [Google Scholar]
  21. Edelman Trust Barometer. Available online: https://www.edelman.com/trust-barometer (accessed on 5 August 2021).
  22. Miller, D. Promotional strategies and media power. In Introduction to Media; Briggs, A., Cobley, P., Eds.; Longman: London, UK, 1998; pp. 65–80. ISBN 0582 27798 1. [Google Scholar]
  23. Bushman, B.; Whitaker, J. Media influence on behavior. In Encyclopedia of Human Behavior, 2nd ed.; Elsevier Inc.: Amsterdam, The Netherlands, 2012; pp. 571–575. [Google Scholar]
  24. Stacks, D.; Li, Z.C.; Spaulding, C. Media effects. In International Encyclopedia of the Social & Behavioral Sciences, 2nd ed.; Elsevier Inc.: Amsterdam, The Netherlands, 2015; pp. 29–34. [Google Scholar]
  25. Ko, H.; Hong, J.Y.; Kim, S.; Mesicek, L.; Na, I.S. Human-machine interaction: A case study on fake news detection using a backtracking based on a cognitive system. Cogn. Syst. Res. 2019, 55, 77–81. [Google Scholar] [CrossRef]
  26. Bushman, B.J.; Whitaker, J.L. Media Influence on Behavior. Reference Module in Neuroscience and Biobehavioral Psychology; Elsevier Inc.: Amsterdam, The Netherlands, 2017. [Google Scholar]
  27. Giri, S.P.; Maurya, A.K. A neglected reality of mass media during COVID-19: Effect of pandemic news on individual’s positive and negative emotion and psychological resilience. Personal. Individ. Differ. 2021, 180, 110962. [Google Scholar] [CrossRef]
  28. Aslam, F.; Awan, T.M.; Syed, J.H.; Kashif, A.; Parveen, M. Sentiments and emotions evoked by news headlines of coronavirus disease (COVID-19) outbreak. Human. Soc. Sci. Commun. 2020, 7, 1–9. [Google Scholar] [CrossRef]
  29. Hamidein, Z.; Hatami, J.; Rezapour, T. How people emotionally respond to the news on COVID-19: An online survey. Basic Clin. Neurosci. 2020, 11, 171. [Google Scholar] [CrossRef]
  30. Jo, W.; Chang, D. Political Consequences of COVID-19 and Media Framing in South Korea. Front. Public Health 2020, 8, 425. [Google Scholar] [CrossRef] [PubMed]
  31. Ridhwan, K.M.; Hargreaves, C.A. Leveraging Twitter Data to Understand Public Sentiment for the COVID-19 Outbreak in Singapore. Int. J. Inf. Manag. Data Insights 2021, 1, 100021. [Google Scholar] [CrossRef]
  32. Casero-Ripollés, A. Impact of Covid-19 on the media system. Communicative and democratic consequences of news consumption during the outbreak. Prof. Inf. 2020, 29, e290223. [Google Scholar] [CrossRef]
  33. Tandoc, E.C., Jr. Tell me who your sources are: Perceptions of news credibility on social media. J. Pract. 2019, 13, 178–190. [Google Scholar] [CrossRef]
  34. Song, X.; Petrak, J.; Jiang, Y.; Singh, I.; Maynard, D.; Bontcheva, K. Classification aware neural topic model for COVID-19 disinformation categorisation. PLoS ONE 2021, 16, e0247086. [Google Scholar] [CrossRef]
  35. Sun, K.; Chen, J.; Viboud, C. Early epidemiological analysis of the coronavirus disease 2019 outbreak based on crowdsourced data: A population-level observational study. Lancet Digit. Health 2020, 2, e201–e208. [Google Scholar] [CrossRef]
  36. Gabrielyan, D.; Masso, J.; Uuskula, L. Mining news data for the measurement and prediction of inflation expectations. In Proceedings of the CARMA 2020—3rd International Conference on Advanced Research Methods and Analytics, Valencia, Spain, 8–9 July 2020. [Google Scholar] [CrossRef]
  37. Leombroni, M.; Vedolin, A.; Venter, G.; Whelan, P. Central bank communication and the yield curve. J. Financ. Econ. 2021. [Google Scholar] [CrossRef]
  38. Parkhomenko, P.A.; Grigor’yev, A.A.; Astrakhantsev, N.A. Review and experimental comparison of text clustering methods. Proc. Inst. Syst. Program. RAS 2017, 29, 161–200. [Google Scholar] [CrossRef] [Green Version]
  39. Vorontsov, K.; Frei, O.; Apishev, M.; Romov, P.; Dudarenko, M. Bigartm: Open source library for regularized multimodal topic modeling of large collections. In Proceedings of the International Conference on Analysis of Images, Social Networks and Texts, Yekaterinburg, Russia, 9–11 April 2015; pp. 370–381. [Google Scholar]
  40. Jelodar, H. Latent Dirichlet allocation (LDA) and topic modeling: Models, applications, a survey. Multimed. Tools Appl. 2019, 78, 15169–15211. [Google Scholar] [CrossRef] [Green Version]
  41. Alsolamy, M.; Alotaibi, A.; Alabbas, A.; Abdullah, M. Topic based Sentiment Analysis for COVID-19 Tweets. Int. J. Adv. Comput. Sci. Appl. 2021, 12. [Google Scholar] [CrossRef]
  42. Xue, J.; Chen, J.; Chen, C.; Zheng, C.; Li, S.; Zhu, T. Public discourse and sentiment during the COVID 19 pandemic: Using Latent Dirichlet Allocation for topic modeling on Twitter. PLoS ONE 2020, 15, e0239441. [Google Scholar] [CrossRef]
  43. Tao, G.; Miao, Y.; Ng, S. COVID-19 topic modeling and visualization. In Proceedings of the 2020 24th International Conference Information Visualisation (IV), Melbourne, Australia, 7–11 September 2020; pp. 734–739. [Google Scholar]
  44. Mutanga, M.B.; Abayomi, A. Tweeting on COVID-19 pandemic in South Africa: LDA-based topic modelling approach. Afr. J. Sci. Technol. Innov. Dev. 2020, 1–10. [Google Scholar] [CrossRef]
  45. Tsao, S.-F.; Chen, H.; Tisseverasinghe, T.; Yang, Y.; Li, L.; Butt, Z.A. What social media told us in the time of COVID-19: A scoping review. Lancet Digit. Health 2021, 3, e175–e194. [Google Scholar] [CrossRef]
  46. Kuchler, T.; Russel, D.; Stroebel, J. JUE Insight: The geographic spread of COVID-19 correlates with the structure of social networks as measured by Facebook. J. Urban Econ. 2021, 103314. [Google Scholar] [CrossRef]
  47. Gupta, A.; Aeron, S.; Agrawal, A.; Gupta, H. Trends in COVID-19 Publications: Streamlining Research Using NLP and LDA. Front Digit Health 2021, 3, 686720. [Google Scholar] [CrossRef] [PubMed]
  48. Angelov, D. Top2vec: Distributed representations of topics. arXiv 2020, arXiv:2008.09470 2020. [Google Scholar]
  49. Liu, Y.; Ott, M.; Goyal, N.; Du, J.; Joshi, M.; Chen, D.; Levy, O.; Lewis, M.; Zettlemoyer, L.; Stoyanov, V. Roberta: A robustly optimized bert pretraining approach. arXiv 2019, arXiv:1907.11692 2019. [Google Scholar]
  50. Chintalapudi, N.; Battineni, G.; Amenta, F. Sentimental Analysis of COVID-19 Tweets Using Deep Learning Models. Infect. Dis. Rep. 2021, 13, 329–339. [Google Scholar] [CrossRef]
  51. Chakraborty, A.K.; Das, S.; Kolya, A.K. Sentiment analysis of covid-19 tweets using evolutionary classification-based LSTM model. In Proceedings of Research and Applications in Artificial Intelligence; Springer: Berlin/Heidelberg, Germany, 2021; pp. 75–86. [Google Scholar]
  52. Dong, E.; Du, H.; Gardner, L. An interactive web-based dashboard to track COVID-19 in real time. Lancet Infect. Dis. 2020, 20, 533–534. [Google Scholar] [CrossRef]
  53. Yakunin, K.; Kalimoldayev, M.; Mukhamediev, R.; Mussabayev, R.; Barakhnin, V.; Kuchin, Y.; Murzakhmetov, S.; Buldybayev, T.; Ospanova, U.; Yelis, M.; et al. KazNewsDataset: Single Country Overall Digital Mass Media Publication Corpus. Data 2021, 6, 31. [Google Scholar] [CrossRef]
  54. Arroyo-Marioli, F.; Bullano, F.; Kucinskas, S.; Rondón-Moreno, C. Tracking R of COVID-19: A new real-time estimation using the Kalman filter. PLoS ONE 2021, 16, e0244474. [Google Scholar] [CrossRef]
  55. Vorontsov, K.V.; Potapenko, A.A. Regularization, robustness and sparsity of probabilistic thematic models. Comput. Res. Model. 2012, 4, 693–706. [Google Scholar] [CrossRef] [Green Version]
  56. Blei, D.M.; Ng, A.Y.; Jordan, M.I. Latent dirichlet allocation. J. Mach. Learn. Res. 2003, 3, 993–1022. [Google Scholar]
  57. Mimno, D.; Wallach, H.; Talley, E.; Leenders, M.; McCallum, A. Optimizing semantic coherence in topic models. In Proceedings of the Conference on Empirical Methods in Natural Language Processing, Edinburgh, UK, 27–31 July 2011; pp. 262–272. [Google Scholar]
  58. Segalovich, I. A fast morphological algorithm with unknown word guessing induced by a dictionary for a web search engine. MLMTA 2003, 2003, 273. [Google Scholar]
  59. Stop-Words 2018.7.23. Available online: https://pypi.org/project/stop-words/ (accessed on 13 November 2021).
  60. Krasnov, F.; Anastasiia, S. The number of topics optimization: Clustering approach. Mach. Learn. Knowl. Extr. 2019, 1, 416–426. [Google Scholar] [CrossRef] [Green Version]
  61. Haleem, A.; Mohd, J.; Raju, V. Effects of COVID-19 pandemic in daily life. Curr. Med. Res. Pract. 2020, 10, 78. [Google Scholar] [CrossRef] [PubMed]
  62. Fernandes, N. Economic Effects of Coronavirus Outbreak (COVID-19) on the World Economy. 2020. SSRN 3557504. Available online: https://papers.ssrn.com/sol3/papers.cfm?abstract_id=3557504 (accessed on 4 December 2021).
  63. Galanti, T.; Guidetti, G.; Mazzei, E.; Zappalà, S.; Toscano, F. Work from Home During the COVID-19 Outbreak: The Impact on Employees’ Remote Work Productivity, Engagement, and Stress. J. Occup. Environ. Med. 2021, 63, e426–e432. [Google Scholar] [CrossRef]
  64. Campedelli, G.; Alberto, A.; Serena, F. Exploring the immediate effects of COVID-19 containment policies on crime: An empirical analysis of the short-term aftermath in Los Angeles. Am. J. Crim. Justice 2021, 46, 704–727. [Google Scholar] [CrossRef] [PubMed]
  65. Apuke, D.; Bahiyah, O. Fake news and COVID-19: Modelling the predictors of fake news sharing among social media users. Telemat. Inform. 2021, 56, 101475. [Google Scholar] [CrossRef]
  66. Divya, M.; Shiv Kumar, G. ElasticSearch: An advanced and quick search technique to handle voluminous data. Compusoft 2013, 2, 171–175. [Google Scholar]
  67. Białecki, A.; Muir, R.; Ingersoll, G. Apache lucene. In Proceedings of the SIGIR 2012 Workshop on Open Source Information Retrieval, Portland, OR, USA, 16 August 2012; Volume 4, pp. 17–24. [Google Scholar]
  68. Barakhnin, V.; Kozhemyakina, O.; Mukhamedyev, R.; Borzilova, Y.; Yakunin, K. The design of the structure of the software system for processing text document corpus. Bus. Inform. 2019, 13, 60–72. [Google Scholar] [CrossRef]
Figure 1. Main steps of the method for correlation analysis of mass media indicators and COVID-19 data.
Computation 09 00140 g001
Figure 2. Major sources of the corpus.
Computation 09 00140 g002
Figure 3. Distribution of topics by relative volume in the second level of the thematic model.
Computation 09 00140 g003
Figure 4. Weekly smoothed dynamics of “Vaccine, Drug, Sputnik-V, Russian, Test” topic relative weight.
Computation 09 00140 g004
Figure 5. Weekly smoothed dynamics of “Case, Number, Day, Coronavirus, Reveal” topic relative weight.
Computation 09 00140 g005
Figure 6. Weekly smoothed dynamics of “China, Coronavirus, New, Chinese, Wuhan” topic relative weight.
Computation 09 00140 g006
Figure 7. Multilayer system architecture.
Computation 09 00140 g007
Figure 8. Blue line shows quarantine limitations index in Russia over time, orange line shows dynamic weight of topic with the highest correlation (0.75) over time. The topic is related to the reports on newly identified COVID-19 cases across the different regions of the country.
Computation 09 00140 g008
Figure 9. Blue line shows quarantine limitations index in Kazakhstan over time, orange line shows dynamic weight of topic with the highest correlation (0.43) over time. The topic is related to the reports on newly identified COVID-19 cases across the different regions of the country.
Computation 09 00140 g009
Table 1. Some examples of objectives and methods of research of publications about COVID-19.
Purpose of ResearchMethodData SourceThe Language of the Corpus of Publications
The impact of news about COVID-19 on people’s emotional state [27]Statistical analysisOnline surveyEnglish
Analysis of social media information during a pandemic [45]LDA, Random ForestTwitter, Sina WeiboEnglish, Chinese
Testing the hypothesis that COVID-19 is more likely to spread between regions with closer ties in social networks [46].Statistical analysisFacebookdata
Understanding the discourse and psychological reactions of Twitter users to COVID-19 [42].LDA, sentiment analysisTwitterdata
Identifying predominant themes and accompanying emotions [43]LDATwitterEnglish
Identifying what topics are discussed by the public and how they affect the implementation of measures taken by the government [44]LDAPapersEnglish
Analysis of PubMed® publication topics and their evolution over time during the COVID-19 pandemic [47]LDAPubMedEnglish
Identification of the most representative themes and sentiment analysis [14]Top2vec [48],
RoBERTa [49]
The mediaEnglish
Assessing social media sentiment toward coronavirus [41]LDA, sentiment analysisTwitterEnglish
Analysis of Indian online users’ tweets during the COVID-19 lockdown to identify texts containing fear, sadness, anger, and joy [50]Sentiment analysis based on BERTTwitterEnglish
Sentiment predictions on Covid-19 data [51]Sentiment analysis based on LSTMTwitterEnglish
Table 2. COVID-19 epidemiological indicators that were used in the analysis.
IndicatorDescription
Number of new testsDaily number of new tests for COVID-19
Positive rateThe share of COVID-19 tests that are positive, given as a rolling 7-day average (this is the inverse of tests per case indicator)
Number of new cases smoothedNew confirmed cases of COVID-19 (7-day smoothed)
Number of new deaths smoothedNew deaths attributed to COVID-19 (7-day smoothed)
Tests per caseTests conducted per new confirmed case of COVID-19, given as a rolling 7-day average (this is the inverse of positive rate indicator)
Virus reproduction rateReal-time estimate of the effective reproduction rate (R) of COVID-19 [54]
Stringency indexGovernment Response Stringency Index: composite measure based on 9 response indicators including school closures, workplace closures, and travel bans, rescaled to a value from 0 to 100 (100 = strictest response)
Table 3. Main information on the obtained topic models.
Topic Model# Topics# DocumentsMembership ThresholdPerplexityContrastPurity
Level-02001679803-31650.480.203
Level-11502855640.0518530.5050.207
Level-21002415360.0418950.5090.244
Level-3501943920.118590.5030.284
Table 4. Correlation between the number of new deaths from COVID-19 and topics from the initial topic model.
Correlation (Pearson/Spearman)Topic Name (Top-Words)Topic Volume (Documents)
0.91/0.87Vaccine, Vaccination, Drug, Coronavirus, Test, Sputnik-V, Russian15,434
0.86/0.85Petersburg, Saint Petersburg, Petersburg, Leningrad region, Moscow, report deaths, COVID1495
0.77/0.69Health, Product, Doctor, Alcohol, Organism, Nutrition, Healthy8318
0.74/0.63Tell, Photo, Arrive, Depart, Tourism, Return, Go2693
0.67/0.49Temperature, Degree, Night, Snow, Weather, Air, Strong8196
Table 5. Correlation between average sentiment and COVID-19 indicators.
RussiaKazakhstan
IndicatorCorrelation Coefficient
(Pearson/Spearman)
IndicatorCorrelation Coefficient
(Pearson/Spearman)
New deaths smoothed0.81/0.77New tests0.55/0.54
New cases smoothed0.66/0.67New cases smoothed0.51/0.76
Positive test rate0.57/0.54Positive test rate0.23/0.62
New tests0.36/0.49New deaths smoothed0.22/0.58
Reproduction rate−0.007/−0.11Reproduction rate−0.18/−0.43
Stringency index−0.12/−0.16Stringency index−0.53/−0.56
Tests per case−0.13/−0.05Tests per case−0.54/−0.58
Table 6. Correlation between numbers of news stories with negative sentiment and COVID-19 indicators.
RussiaKazakhstan
IndicatorCorrelation Coefficient
(Pearson/Spearman)
IndicatorCorrelation Coefficient
(Pearson/Spearman)
Reproduction rate0.71/0.72Tests per case0.42/0.36
Stringency index0.65/0.57Stringency index0.41/0.75
Tests per case0.08/0.26Reproduction rate0.16/0.42
Positive test rate0.02/0.17Positive test rate0.14/−0.40
New tests−0.11/0.10New deaths smoothed−0.29/−0.47
New cases smoothed−0.18/0.08New cases smoothed−0.35/−0.47
New deaths smoothed−0.32/−0.10New tests−0.56/−0.50
Table 7. Correlation between numbers of news stories with positive sentiment and COVID-19 indicators.
RussiaKazakhstan
IndicatorCorrelation Coefficient
(Pearson/Spearman)
IndicatorCorrelation Coefficient
(Pearson/Spearman)
New deaths smoothed0.84/0.71New cases smoothed0.50/0.63
New cases smoothed0.70/0.68Positive test rate0.36/0.67
Positive test rate0.68/0.62New deaths smoothed0.29/0.54
New tests0.47/0.48New tests0.20/0.13
Reproduction rate0.25/0.14Reproduction rate−0.06/−0.43
Stringency index0.05/−0.06Stringency index−0.21/−0.11
Tests per case−0.14/−0.11Tests per case−0.5/−0.63
Table 8. Correlation between average relative weights of queries and indicators with the highest correlations.
RussiaKazakhstan
QueryTop Indicator
(Pearson/Spearman)
Correlation Coefficient
(Pearson/Spearman)
QueryTop Indicator
(Pearson/Spearman)
Correlation Coefficient
(Pearson/Spearman)
Vaccination, COVID-19 vaccinesPositive rate/Positive rate0.76/0.78Healthcare, hospitals, issues, healthcare scandalsStringency index/Stringency index0.42/0.32
Healthcare, hospitals, issues, healthcare scandalsPositive rate/Reproduction rate0.67/0.53Crisis, lending, debt, microcreditsTests per case/Stringency index0.41/0.46
Crisis, lending, debt, microcreditsReproduction rate/Stringency index0.56/0.54Vaccination, COVID-19 vaccinesReproduction rate/Stringency index0.38/0.52
Unemployment, povertyStringency index/Stringency ondex0.56/0.48Fake, disinformation, anti-vaxTests per case/Reproduction rate0.33/0.21
Crisis, economic declineTests per case/Stringency index0.49/0.44Crisis, economic declineTests per case/Stringency index0.29/0.47
Freelance, remote work, brain drainStringency index/Stringency index0.39/0.35Remote educationNew tests/Positive rate0.29/0.38
Famine, starvation, homeless, povertyStringency index/Stringency index0.35/0.47Unemployment, povertyTests per case/Reproduction rate0.27/0.29
Fake, disinformation, anti-vaxTests per case/Tests per case0.33/0.39Freelance, remote work, brain drainStringency index/Stringency index0.26/0.46
Remote educationReproduction rate/Tests per case0.11/0.39Criminal, robbery, theft, homicideNew tests/New tests0.20/0.15
Criminal, robbery, theft, homicideNew deaths/Positive rate0.07/0.10Famine, starvation, homeless, povertyNew tests/Positive rate0.09/0.16
Publisher’s Note: MDPI stays neutral with regard to jurisdictional claims in published maps and institutional affiliations.

