
A Computational Analysis for Active Flow and Pressure Control Using Moving Roller Peristalsis


Laboratory of Biofluid Mechanics & Biomedical Engineering, School of Mechanical Engineering, National Technical University of Athens, 15780 Athens, Greece
*
Author to whom correspondence should be addressed.
Computation 2021, 9(12), 144; https://0-doi-org.brum.beds.ac.uk/10.3390/computation9120144
Submission received: 18 November 2021
/
Revised: 11 December 2021
/
Accepted: 13 December 2021
/
Published: 20 December 2021
(This article belongs to the Special Issue Experiments/Process/System Modeling/Simulation/Optimization (IC-EPSMSO 2021))
Abstract
:Peristaltic motion arises in many physiological, medical, pharmaceutical and industrial processes. Control of the fluid volume rate and pressure is crucial for pumping applications, such as the infusion of intravenous liquid drugs, blood transportation, etc. In this study, a simulation of peristaltic flow is presented in which occlusion is imposed by pairs of circular rollers that squeeze a deformable channel connected to a reservoir with constant fluid pressure. Naturally, this kind of flow is laminar; hence, the computation occurred in this context. The effect of the number and speed of the pairs of rollers, as well as that of the intrapair roller gap, is investigated. Non-Newtonian fluids are considered, and the effect of the shear-thinning behavior degree is examined. The volumetric flow rate is found to increase with an increase in the number of rollers or in the relative occlusion. A reduction in the Bird–Carreau power index resulted in a small reduction in transport efficiency. The characteristic of the pumping was computed, i.e., the induced pressure as a function of the fluid volume rate. A strong positive correlation exists between relative occlusion and induced pressure. Shear-thinning behavior significantly decreases the developed pressure compared to Newtonian fluids. The immersed boundary method on curvilinear coordinates is adapted and validated for non-Newtonian fluids.
1. Introduction
Peristaltic flow appears in many physiological processes, such as urine flow in the ureter, lymph flow in the lymphatic system, bolus and chyme flow through the gastrointestinal tract and spermatic flow in the vas deferens. Peristaltic pumping is used for industrial applications, such as food displacement in pipes, and medical applications, such as the extracorporeal pumping of blood and the infusion of pharmaceutical fluids [1,2].
Elaboration of Navier–Stokes equations for two-dimensional analysis with constant viscosity (using the fact that viscous forces dominate peristaltic flow) results in good predictions for the flow [3,4,5]. The effect of the presence of an axial body on such flows has been theoretically investigated for Newtonian fluids, and the role of flow parameters in pumping characteristics was characterized by Roy et al. [6]. A non-Newtonian analysis for power-law fluids was reported by Srivastava and Srivastava [7], which showed a pressure rise reduction for a power index less than unity.
An analogous experimental examination of peristaltic pumping for a circular deformable tube was introduced by Latham [3] and Weinberg et al. [8]. Flow through a straight deformable tube squeezed by three pairs of rollers was studied for non-Newtonian fluids using computer tomography and Doppler velocimetry by Nahar [9].
The effects of the relative occlusion imposed by the roller, the wavenumber, the Reynolds number and the back pressure with a sinusoidal-shaped wave were investigated computationally by Tsui et al. [10]. Saw-toothed and trapezoidal wave shapes were also calculated by Tatsumi et al. [11], who found that the wave formation is less important than the wave amplitude. Additionally, shear-thinning behavior was simulated by Al-Habahbeh [12] and Alokaily et al. [13] for circular-segment-shaped waves produced by pairs of circular rollers squeezing the tube. U- and O-shaped pumps were simulated by Zhoo et al. [14], who showed that the O-shaped ones may produce lower levels of wall shear stress. This finding suggests that the O-shaped setting is more suitable for blood and other cell-containing fluids, as it poses less hemolysis, or cytolysis in general, risk. Backflow suppression and uniformization of roller pump outflow were addressed by Manopoulos et al. [15] by introducing an appropriate inflating portion of the deformable tube, thus producing momentum to compensate for the negative pressure gradient at the outlet of the pump that occurs when there is zero occlusion by a roller.
In this study, the confined flow in an elastic tube under a peristaltic wave caused by multiple (one, two and three) circular rollers moving consecutively was computed by means of the immersed boundary method (IBM) [16,17]. As the first step, the conclusions drawn via body-fitted methods for the effect of the roller speed, the half-gap and the Bird–Carreau power index on the peristaltic flow are confirmed. The curvilinear immersed boundary method of Ge and Sotiropoulos [18] is adjusted and tested for non-Newtonian fluids.
Subsequently, the resulting flow fields and the effect of the number of rollers on the output fluid volume rate are investigated. Moreover, we computed the pumping characteristics for a straight peristaltic pump considering Newtonian and non-Newtonian behavior. The role of relative occlusion and pseudoplasticity in peristalsis characteristics is analyzed.
2. Materials and Methods
2.1. Geometry
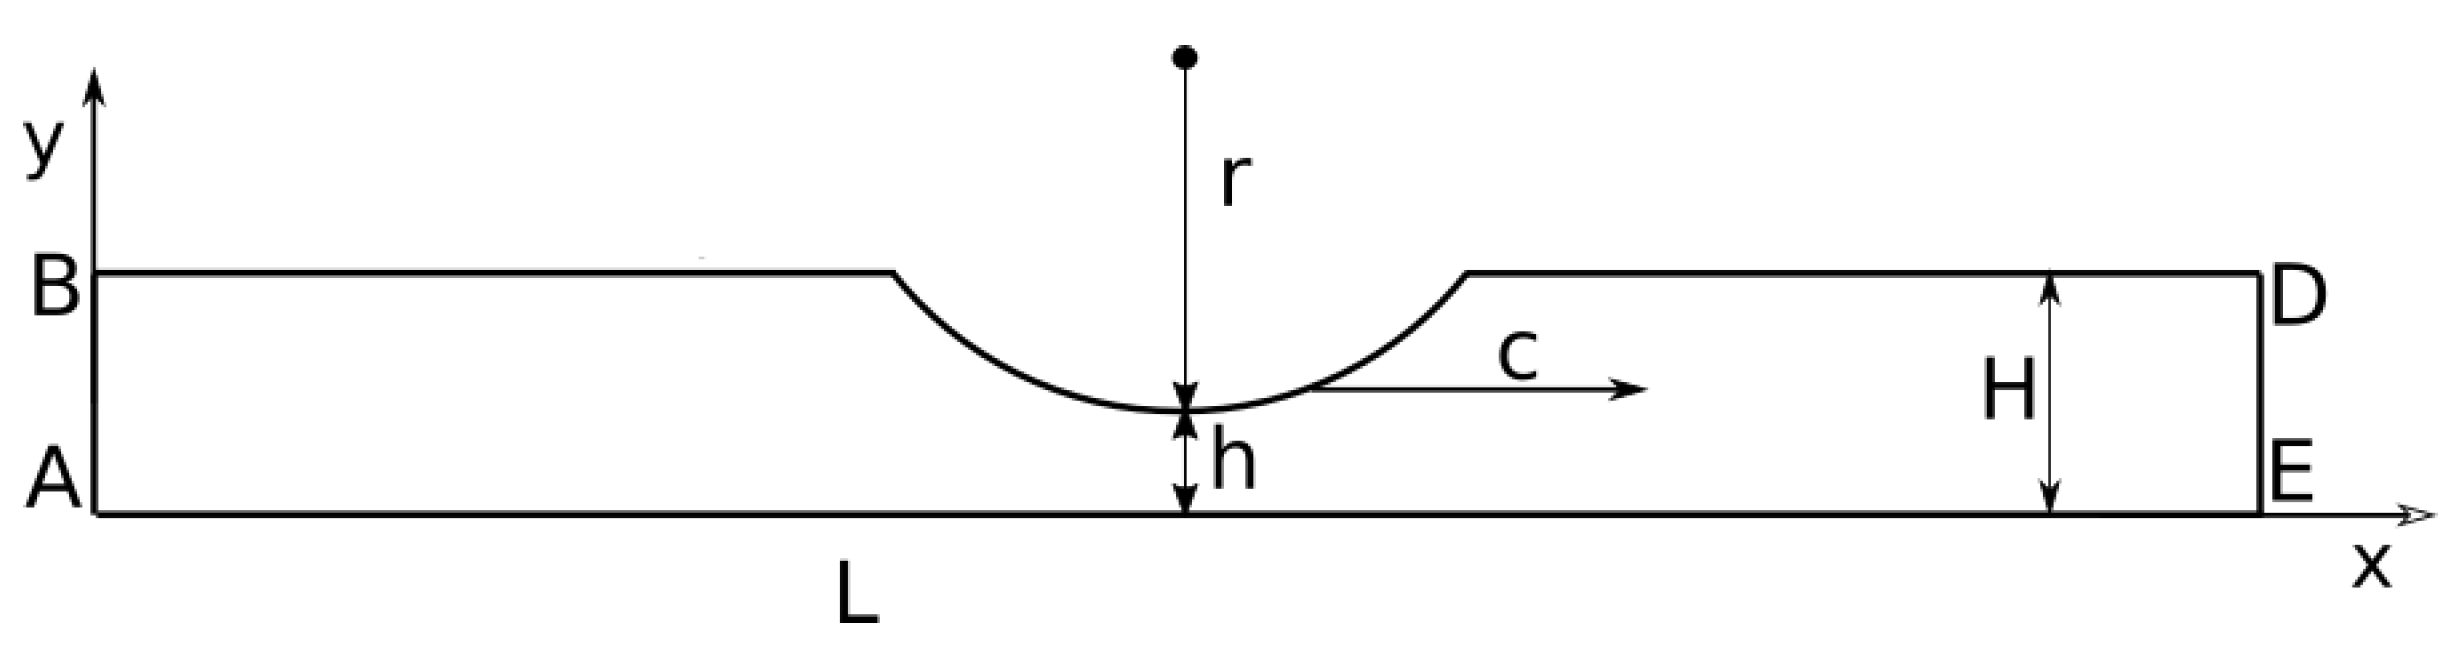
A two-dimensional symmetric model, given in Figure 1, is used to represent the deformable channel. The elastic tube is squeezed by two opposite circular waves that move horizontally with velocity c. Simulations were performed for channels with lengths mm (Section 3.1, Section 3.2, Section 3.3 and Section 3.5) and mm (Section 3.4). The half-height of the undeformed channel is taken as mm, similar to that of the human esophagus. The radius of the circular sector of the roller is mm (as in the experiments presented by Nahar [9]). The minimum height of the deformed channel takes several values according to the compression amplitude, which, in the figure, is depicted by the half-gap width h.
2.2. Mathematical Model
We consider time-independent non-Newtonian fluids with the constitutive law of the form of a generalized first-grade Rivlin–Ericksen fluid [19] with shear-dependent viscosity:
We employ the symbol for the Cauchy stress tensor, for the velocity vector, p for pressure, for the identity tensor, for the dynamic viscosity of the fluid considered, for the shear rate (i.e., the strain rate tensor norm) and for the strain rate tensor (2 is the first Rivlin–Ericksen tensor):
where: represents the colon product between dyads, is the velocity gradient tensor and is the Cartesian velocity vector. The incompressible Navier–Stokes equations for the subclass of generalized Newtonian fluids that have a rheological equation of state as in Equation (1) are
Following previous research by Nahar et al. [20] and Al-Habahbeh [12], the density of the pumped fluid is , and its rheology is predicted from the Bird–Carreau equation for the shear dependent dynamic viscosity [21,22]:
In the above equation, is the viscosity at infinite shear rate, Pa·s is the viscosity at zero shear rate, s is the relaxation time and n is the Bird–Carreau power index. Fluids with exhibit shear-thinning or pseudoplastic behavior, where shows shear-thickening or dilatant behavior, while fluids with are Newtonian. We studied fluids for which .
At the centerline symmetry, boundary conditions are defined; that is, the axial velocity normal gradient and the transverse velocity are set to zero:
where u and are the streamwise and vertical velocity components, respectively. On the upper, deformable wall, the no-slip condition is defined.
where is the velocity component of the wall.
For Section 3.1, Section 3.2, Section 3.3 and Section 3.4, the boundary condition for the left and right ends of the tube—cross-sections AB and DE in Figure 1, respectively—is the periodic boundary condition for the velocity components:
For Section 3.5, at cross-section AB of Figure 1, the imposed boundary condition is that of a parabolic velocity profile:
where is the maximum velocity of the parabolic profile on the axis . At the outlet cross-section DE, for , a zero-velocity normal gradient is set:
2.3. Computational Method
The dimensional incompressible Navier–Stokes equations for non-Newtonian fluids were solved using the immersed boundary method on curvilinear coordinates of Ge and Sotiropoulos [18]. The conservation of mass (Equation (4)) is expressed in index notation as
and the conservation of momentum (Equation (5)) is given as
where the Jacobian of the transformation is
In the preceding equations, the curvilinear coordinates are represented by , and the Cartesian coordinates are given by . Contravariant velocity components are given by , and the Cartesian velocity components are given by . The time variable is t, and the symbol stands for the contravariant metric tensor components:
The governing equations (Equations (12) and (13)) are discretized by employing a staggered grid arrangement [23]. Pressure is defined in volume centers, while momentum equations for the respective contravariant velocities are solved at surface centers, thus gaining the advantages of the staggered grid [24,25]. The equations are integrated in time via a second-order Crank–Nicholson scheme [26,27]. After the velocity field is derived by solving the momentum equations, the projection method for pressure is employed, leading to the satisfaction of the continuity equation by the final calculated velocity field [28,29]. The solution method was implemented via the Virtual Flow Simulator (VFS) code [30] with extensions for non-Newtonian fluids and for moving-wall boundary conditions.
A mesh independence study was performed using a coarse ( nodes) and a fine ( nodes) Cartesian grid for the 180 mm pump and analogously for the 90 mm pump. The peak difference at the axial velocity for the two grids is less than . The maximum mesh interval of the fine mesh is mm. A three-dimensional solution algorithm was employed; therefore, a subtle depth was considered along with slip conditions at the boundary surfaces of the third dimension. The immersed boundary surface of the roller is triangulated with 3104 nodes and 6204 elements, and the node distance is upper bounded by mm.
We adjust the coordinate system shown in Figure 1 at the roller and define it as the moving frame of reference. The simulation occurred at this moving frame of reference. Consequently, the roller does not move, whereas the surface moves with velocity ; therefore, we computed a steady flow field. To the computed flow field, the roller speed is added uniformly in order to return to the laboratory frame of reference.
3. Results and Discussion
The relative occlusion () is defined as the ratio of the penetration of a pair of rollers in the deformable tube to the height of the undeformed channel, namely,
The transport efficiency () is defined as the fluid volume rate over the wave speed and over the height of the complete channel, namely,
3.1. Varying Relative Occlusion
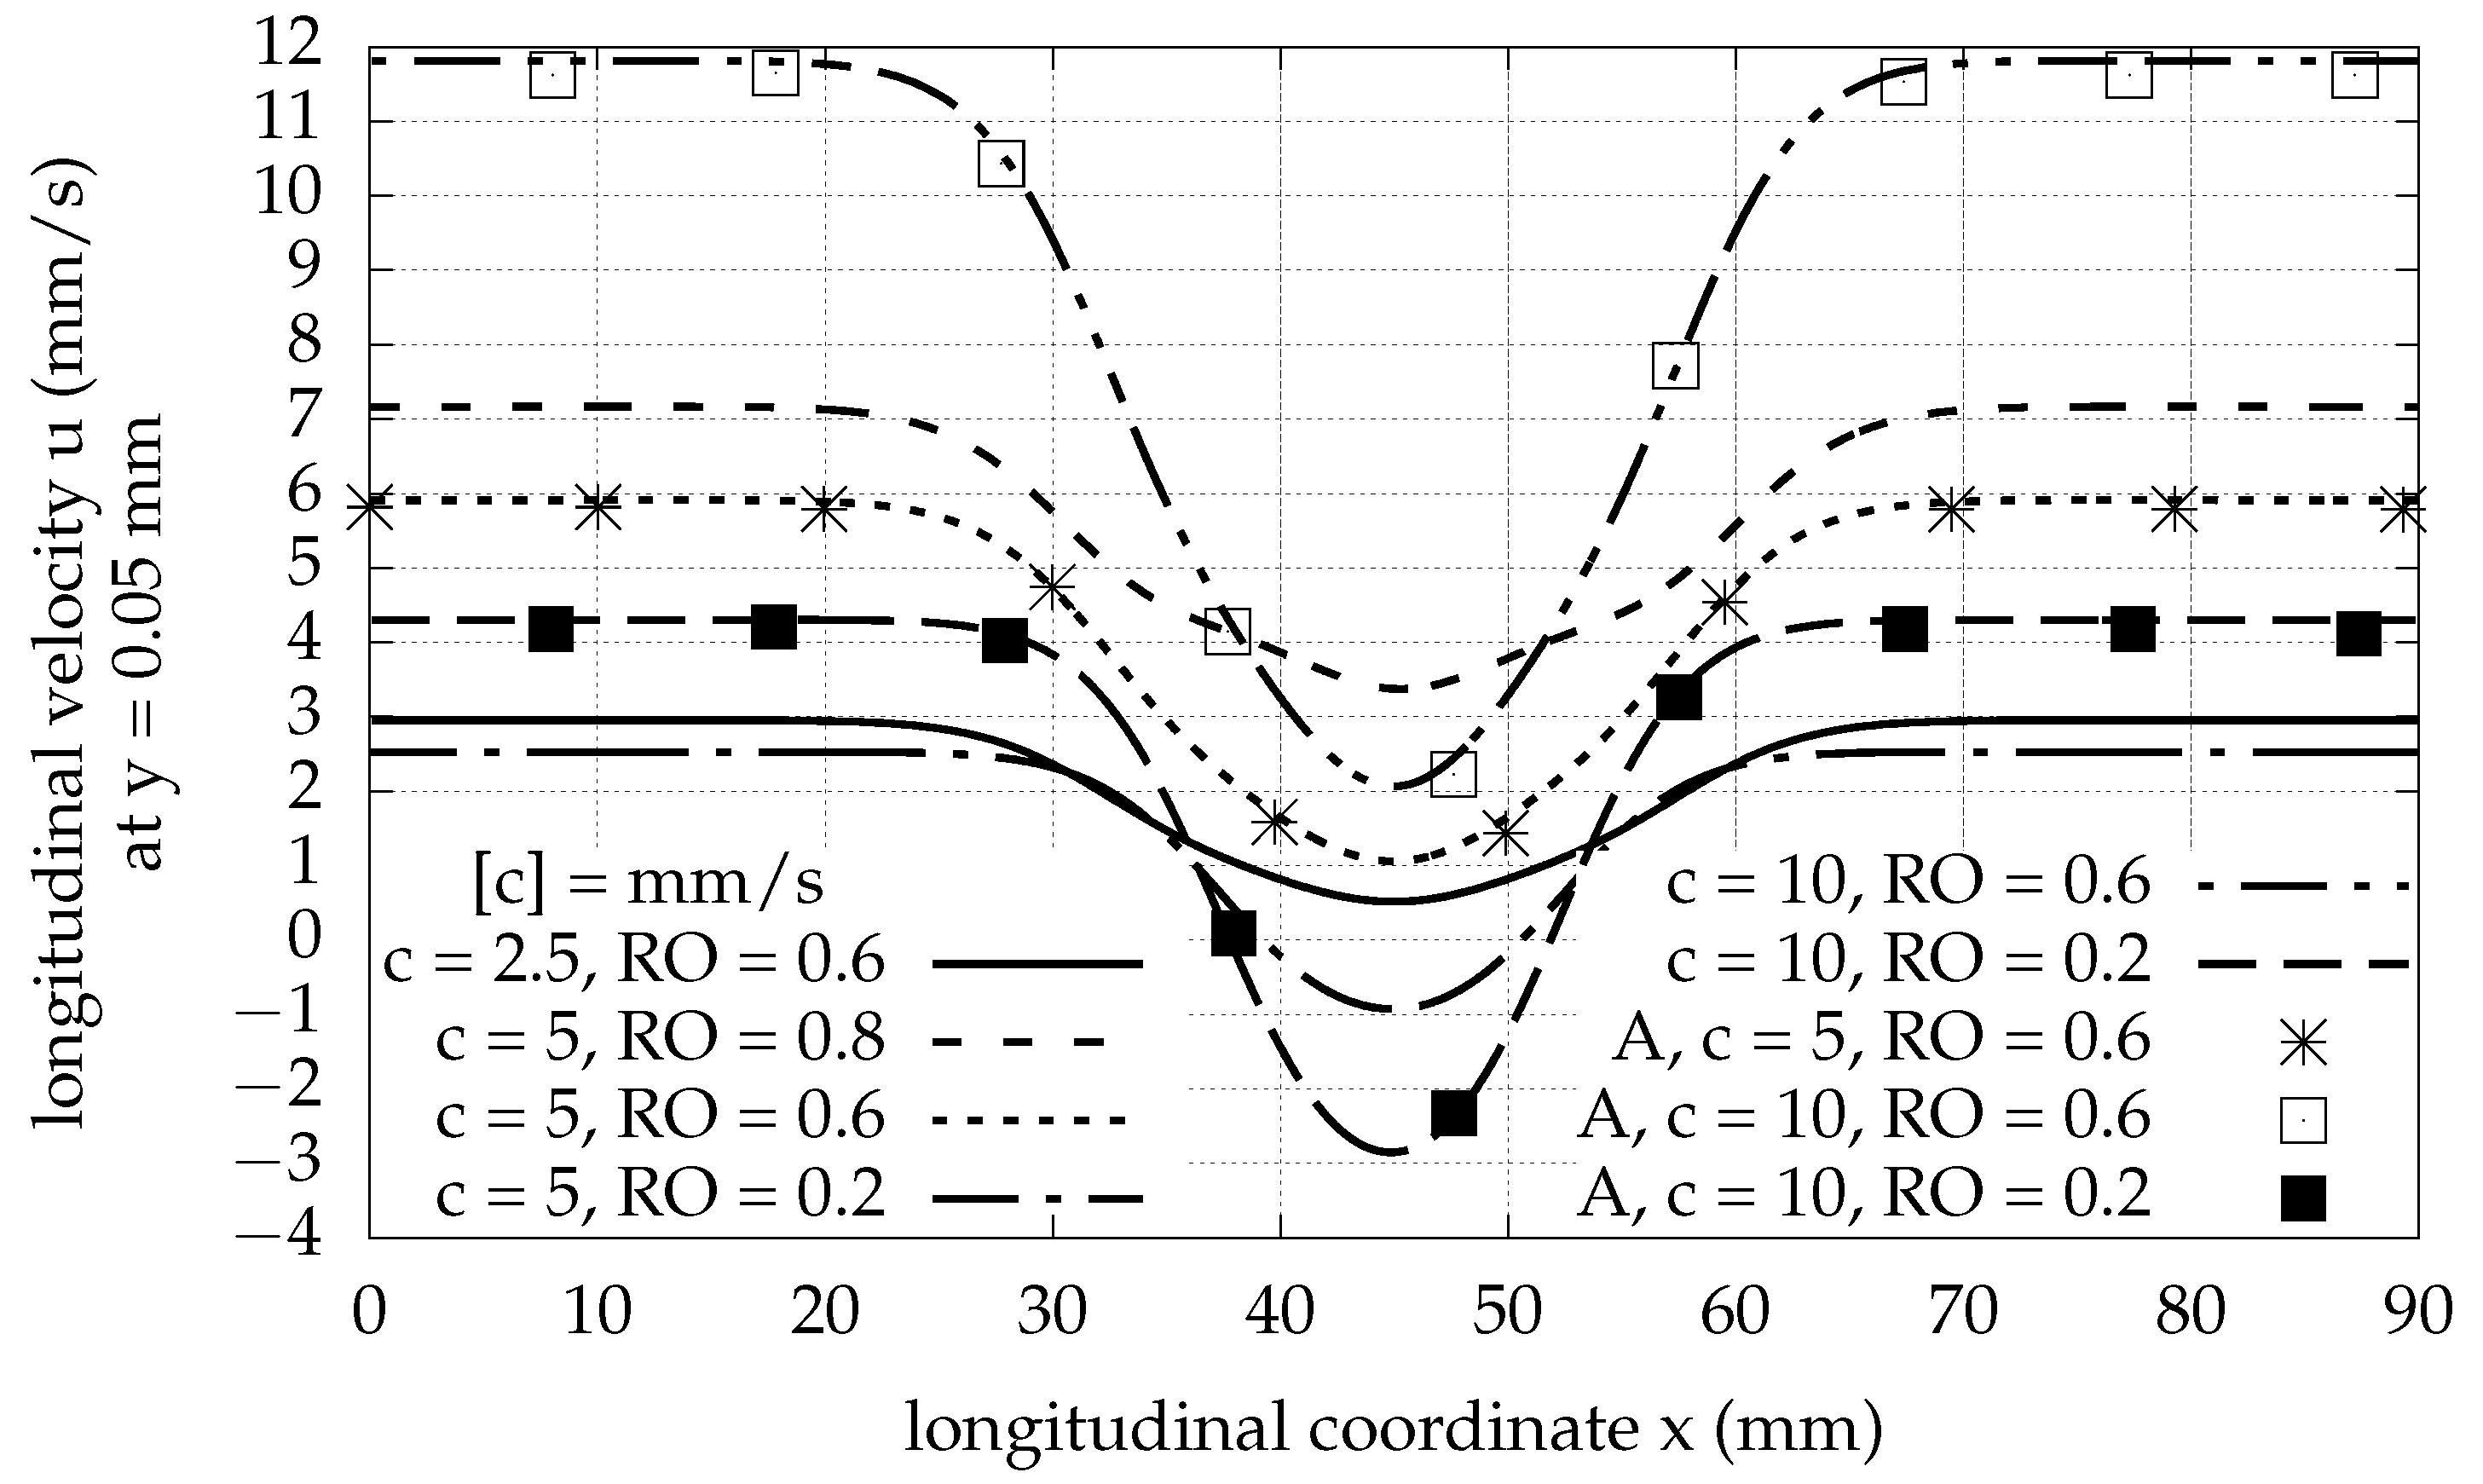
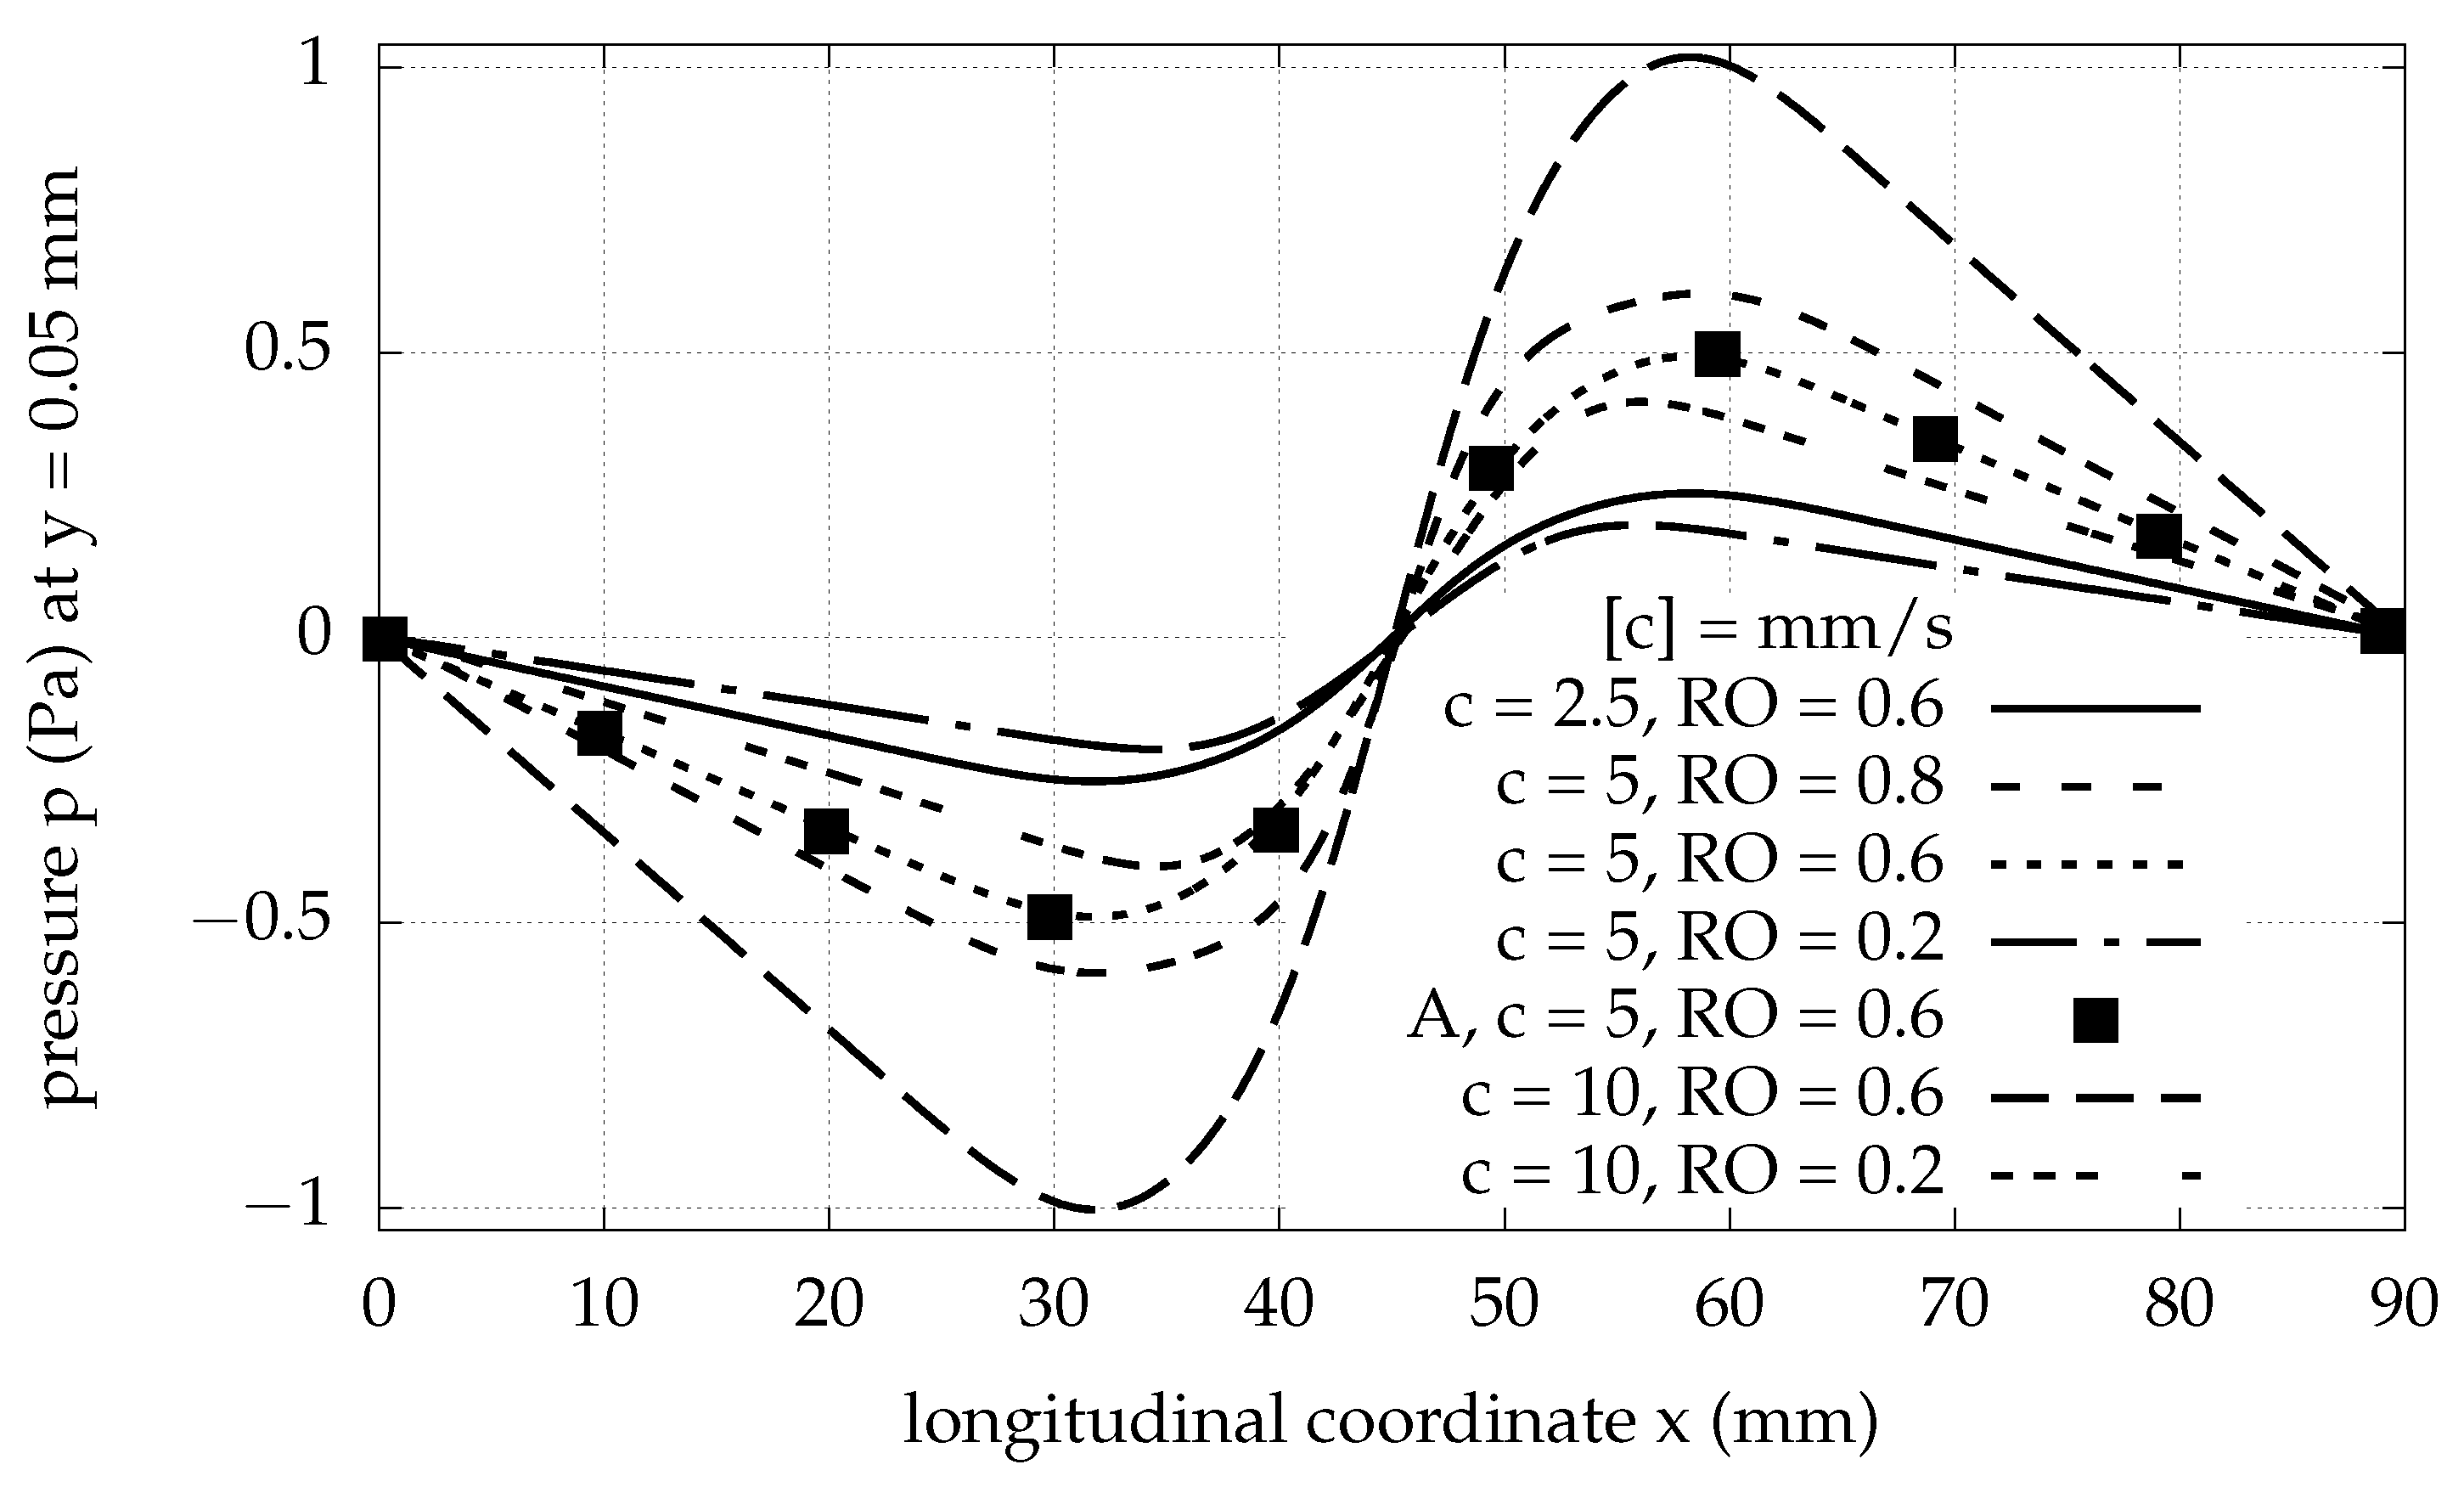
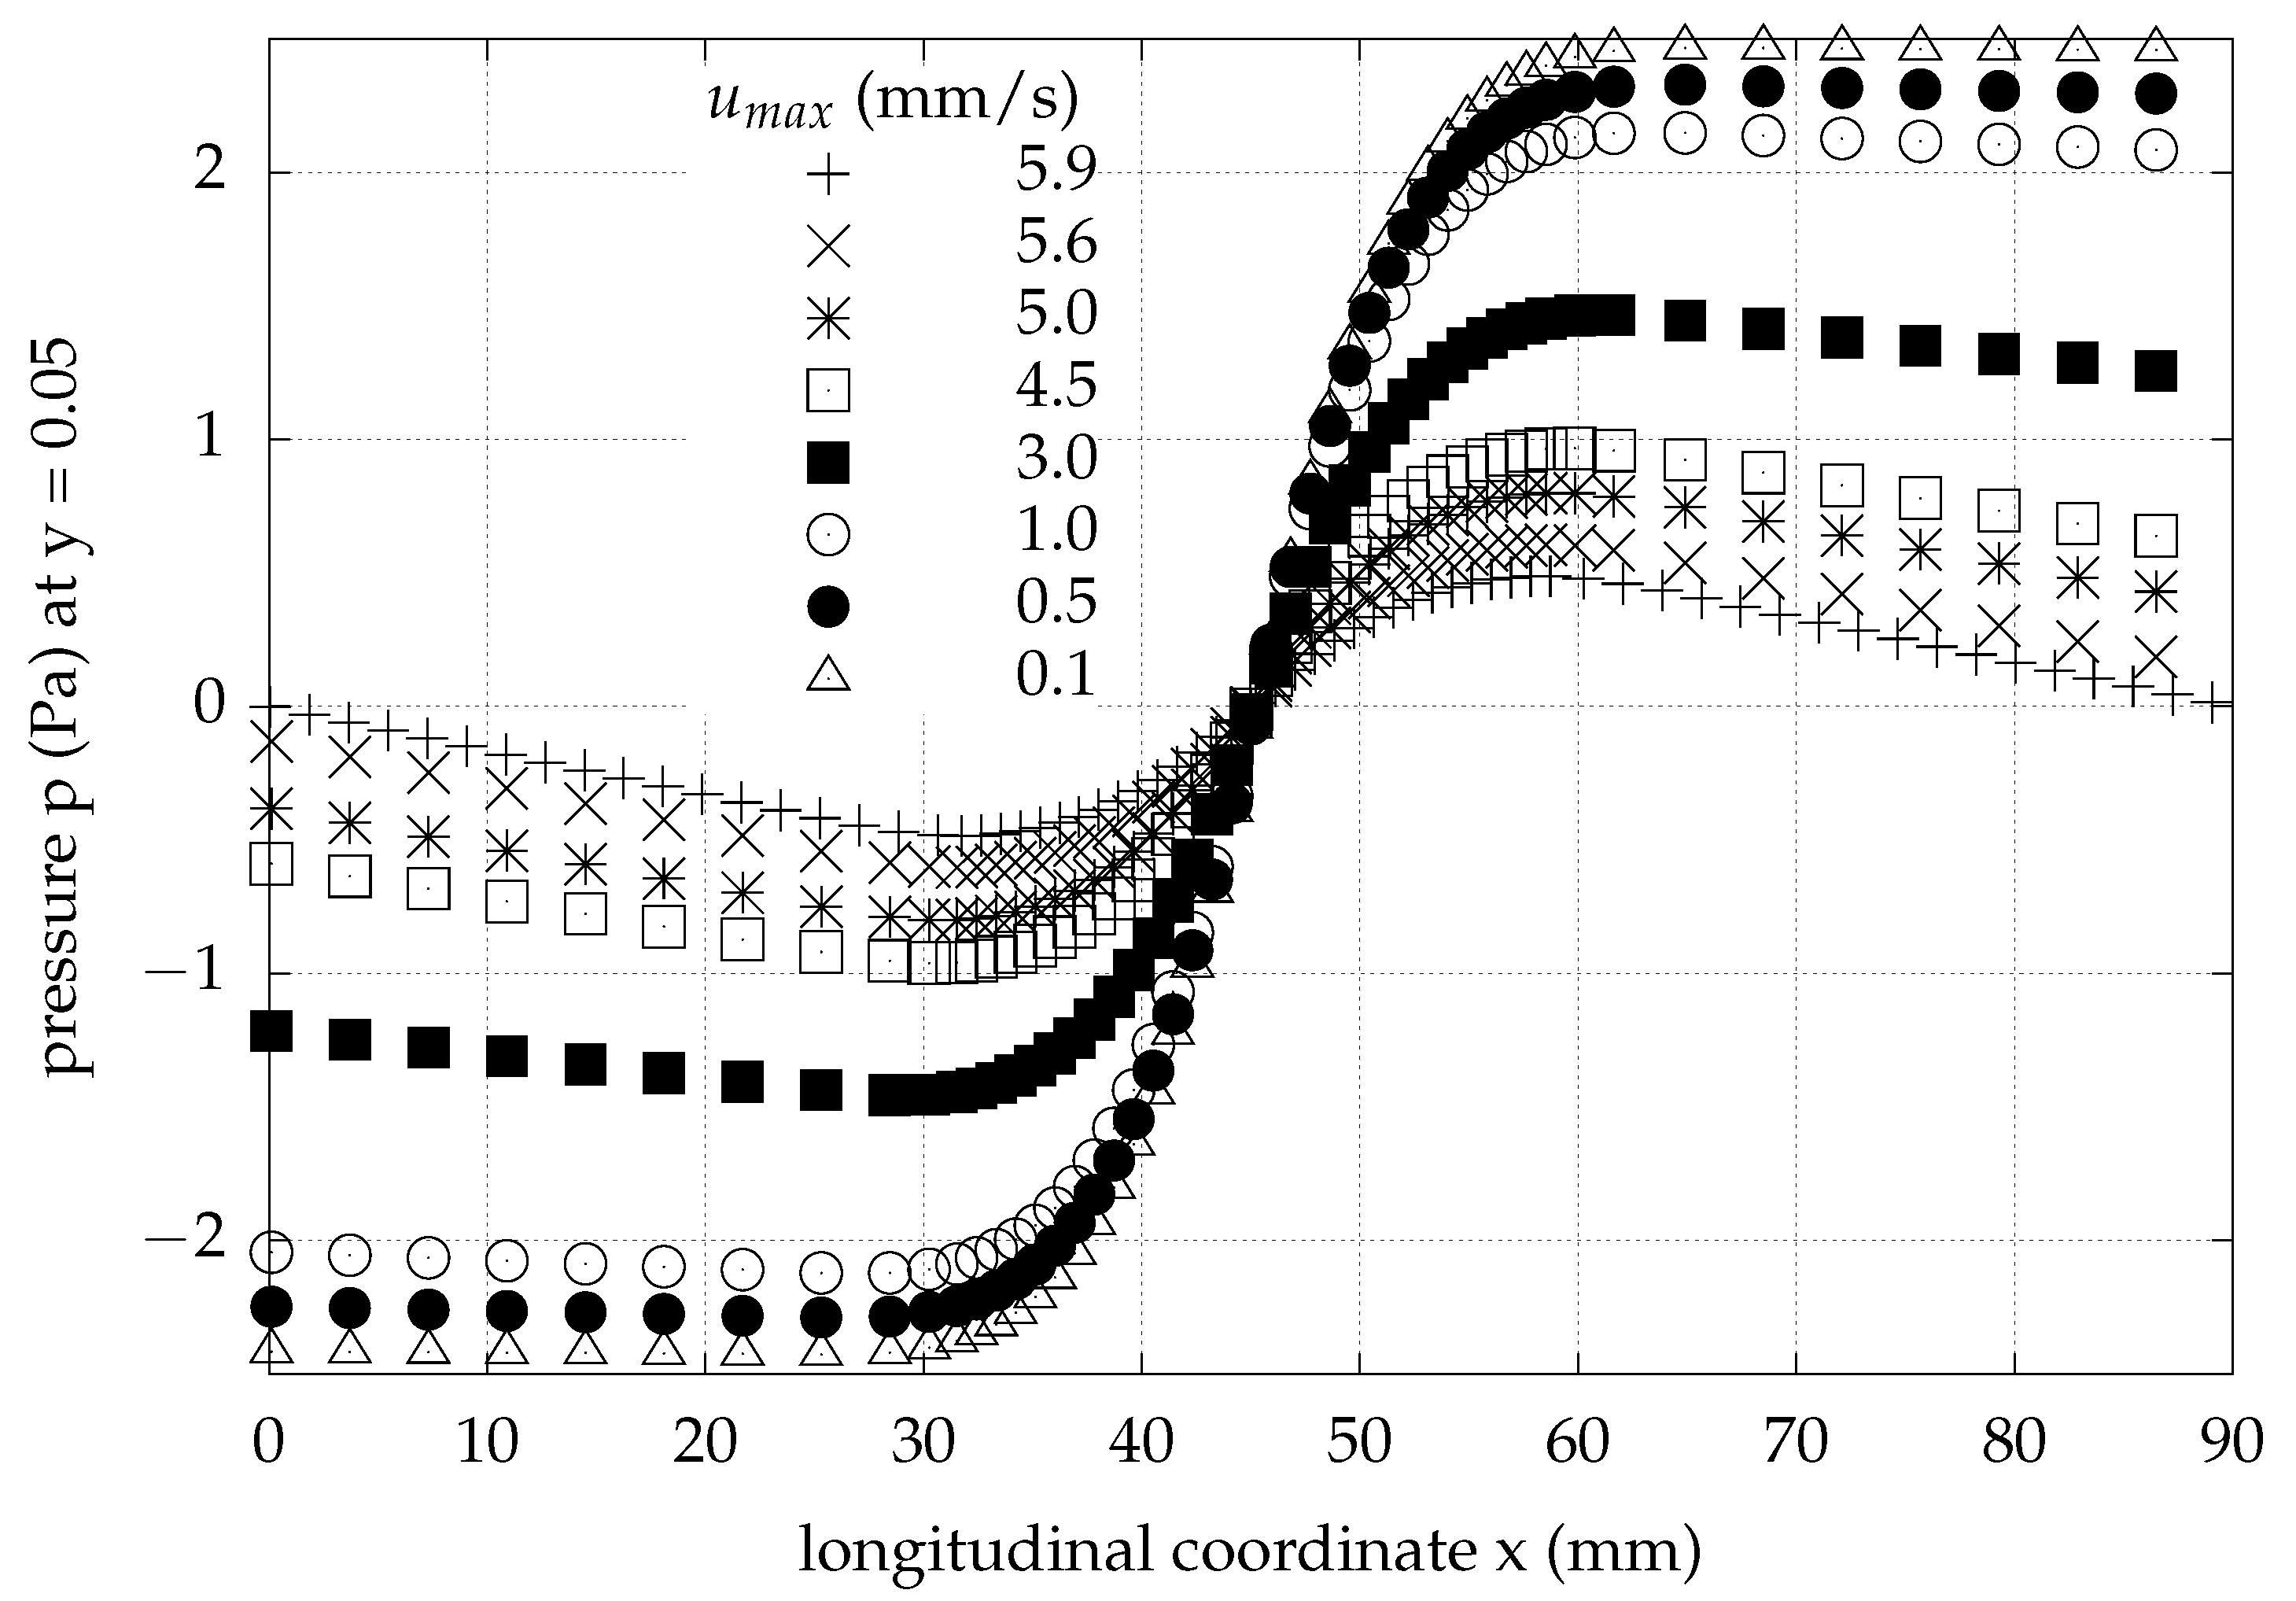
The higher the , the higher the values of axial velocity profiles near the centerline and the higher the pressure rise after the roller, as shown in Figure 2 and Figure 3, for mm/s and mm/s.
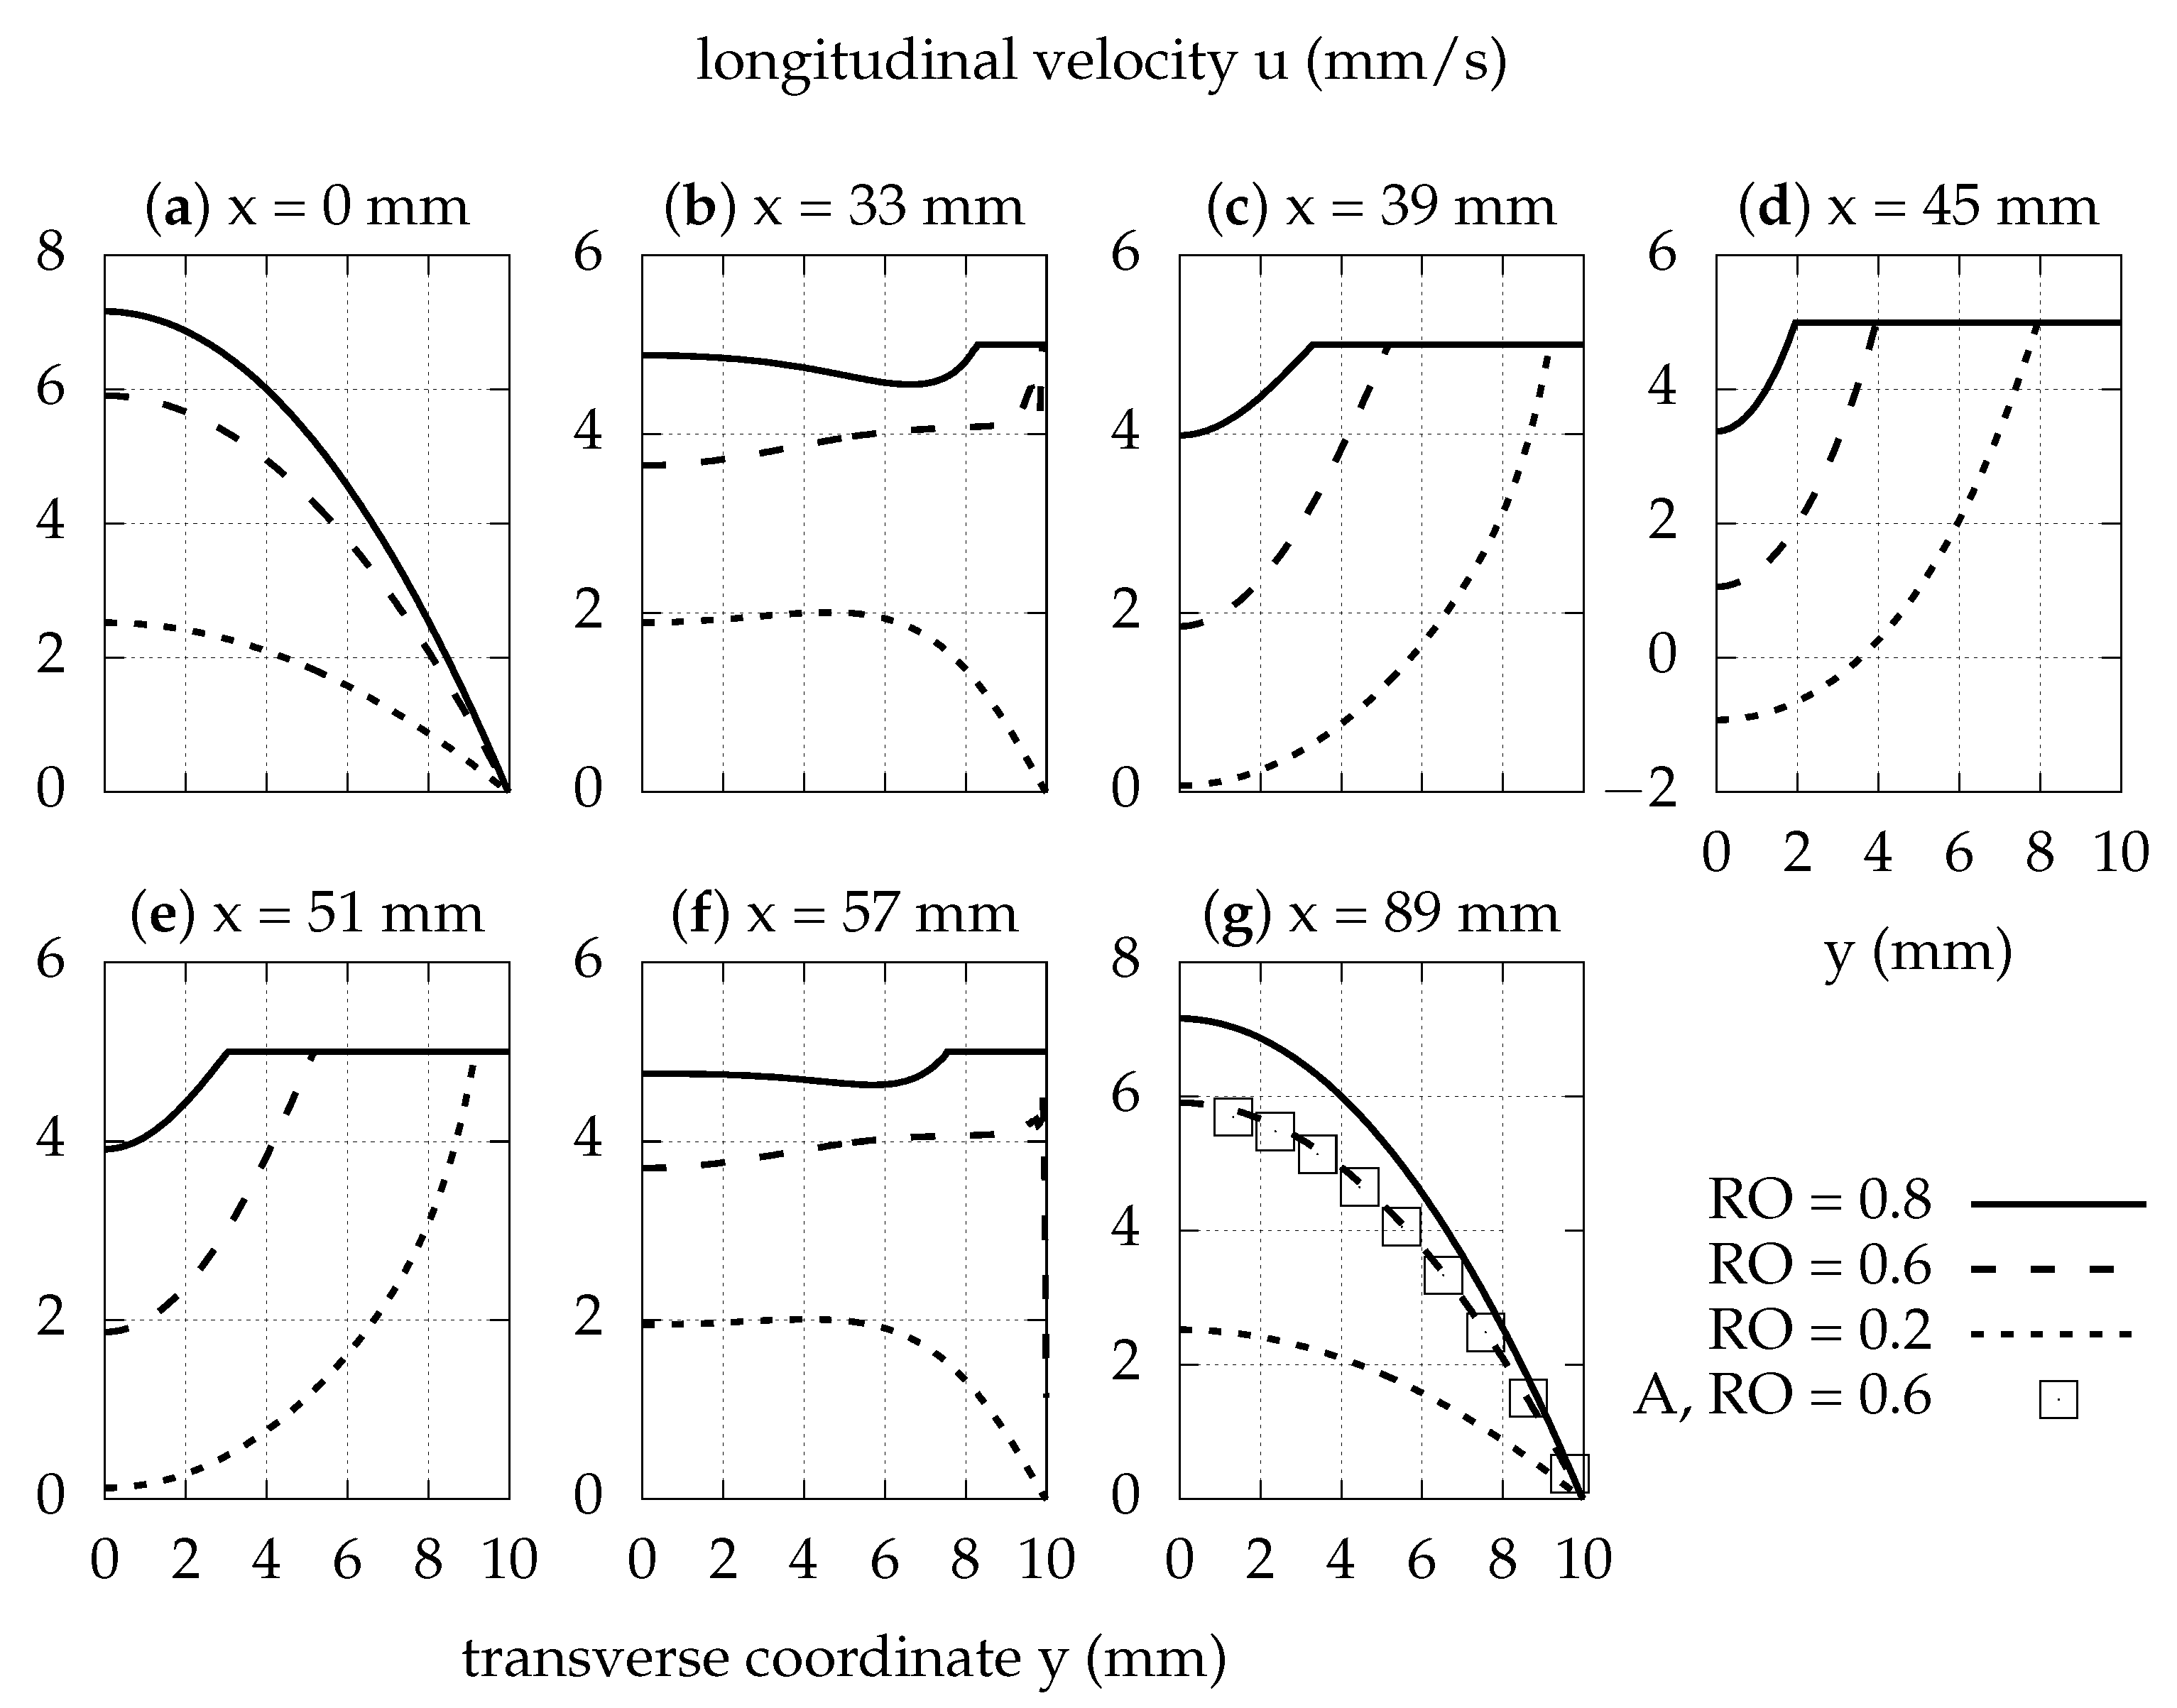
Axial velocity profiles show higher values as rises, as suggested by Figure 4. For small values of , backflow arises in the region under the roller, as observed in Figure 2 and Figure 4c–e.
Transport efficiency is found to be strongly dependent on relative occlusion, as is shown in Table 1.
3.2. Varying Roller Speed
Roller speed has a similar effect to that of on axial velocity and pressure. As indicated in Figure 2, for higher roller speed, the axial velocity near the centerline ( mm) away from the longitudinal center reaches values around 20–25% higher than c. Pressure fluctuation is also approximately linearly related to roller speed, as suggested by Figure 3. According to Figure 5, the shear rate near the axis has two similar skewed bell curves, which are symmetric with respect to the vertical axis passing thought the roller center (at mm). The peak shear rate is approximately linearly related to the roller speed. For example, for mm/s, near the axis is , while for mm/s, near the axis is .
The transport efficiency is approximately constant with respect to changes in roller speed, so the flow volume rate through the pump is approximately linearly related to the roller speed, as shown in Table 1.
3.3. Non-Newtonian Fluids
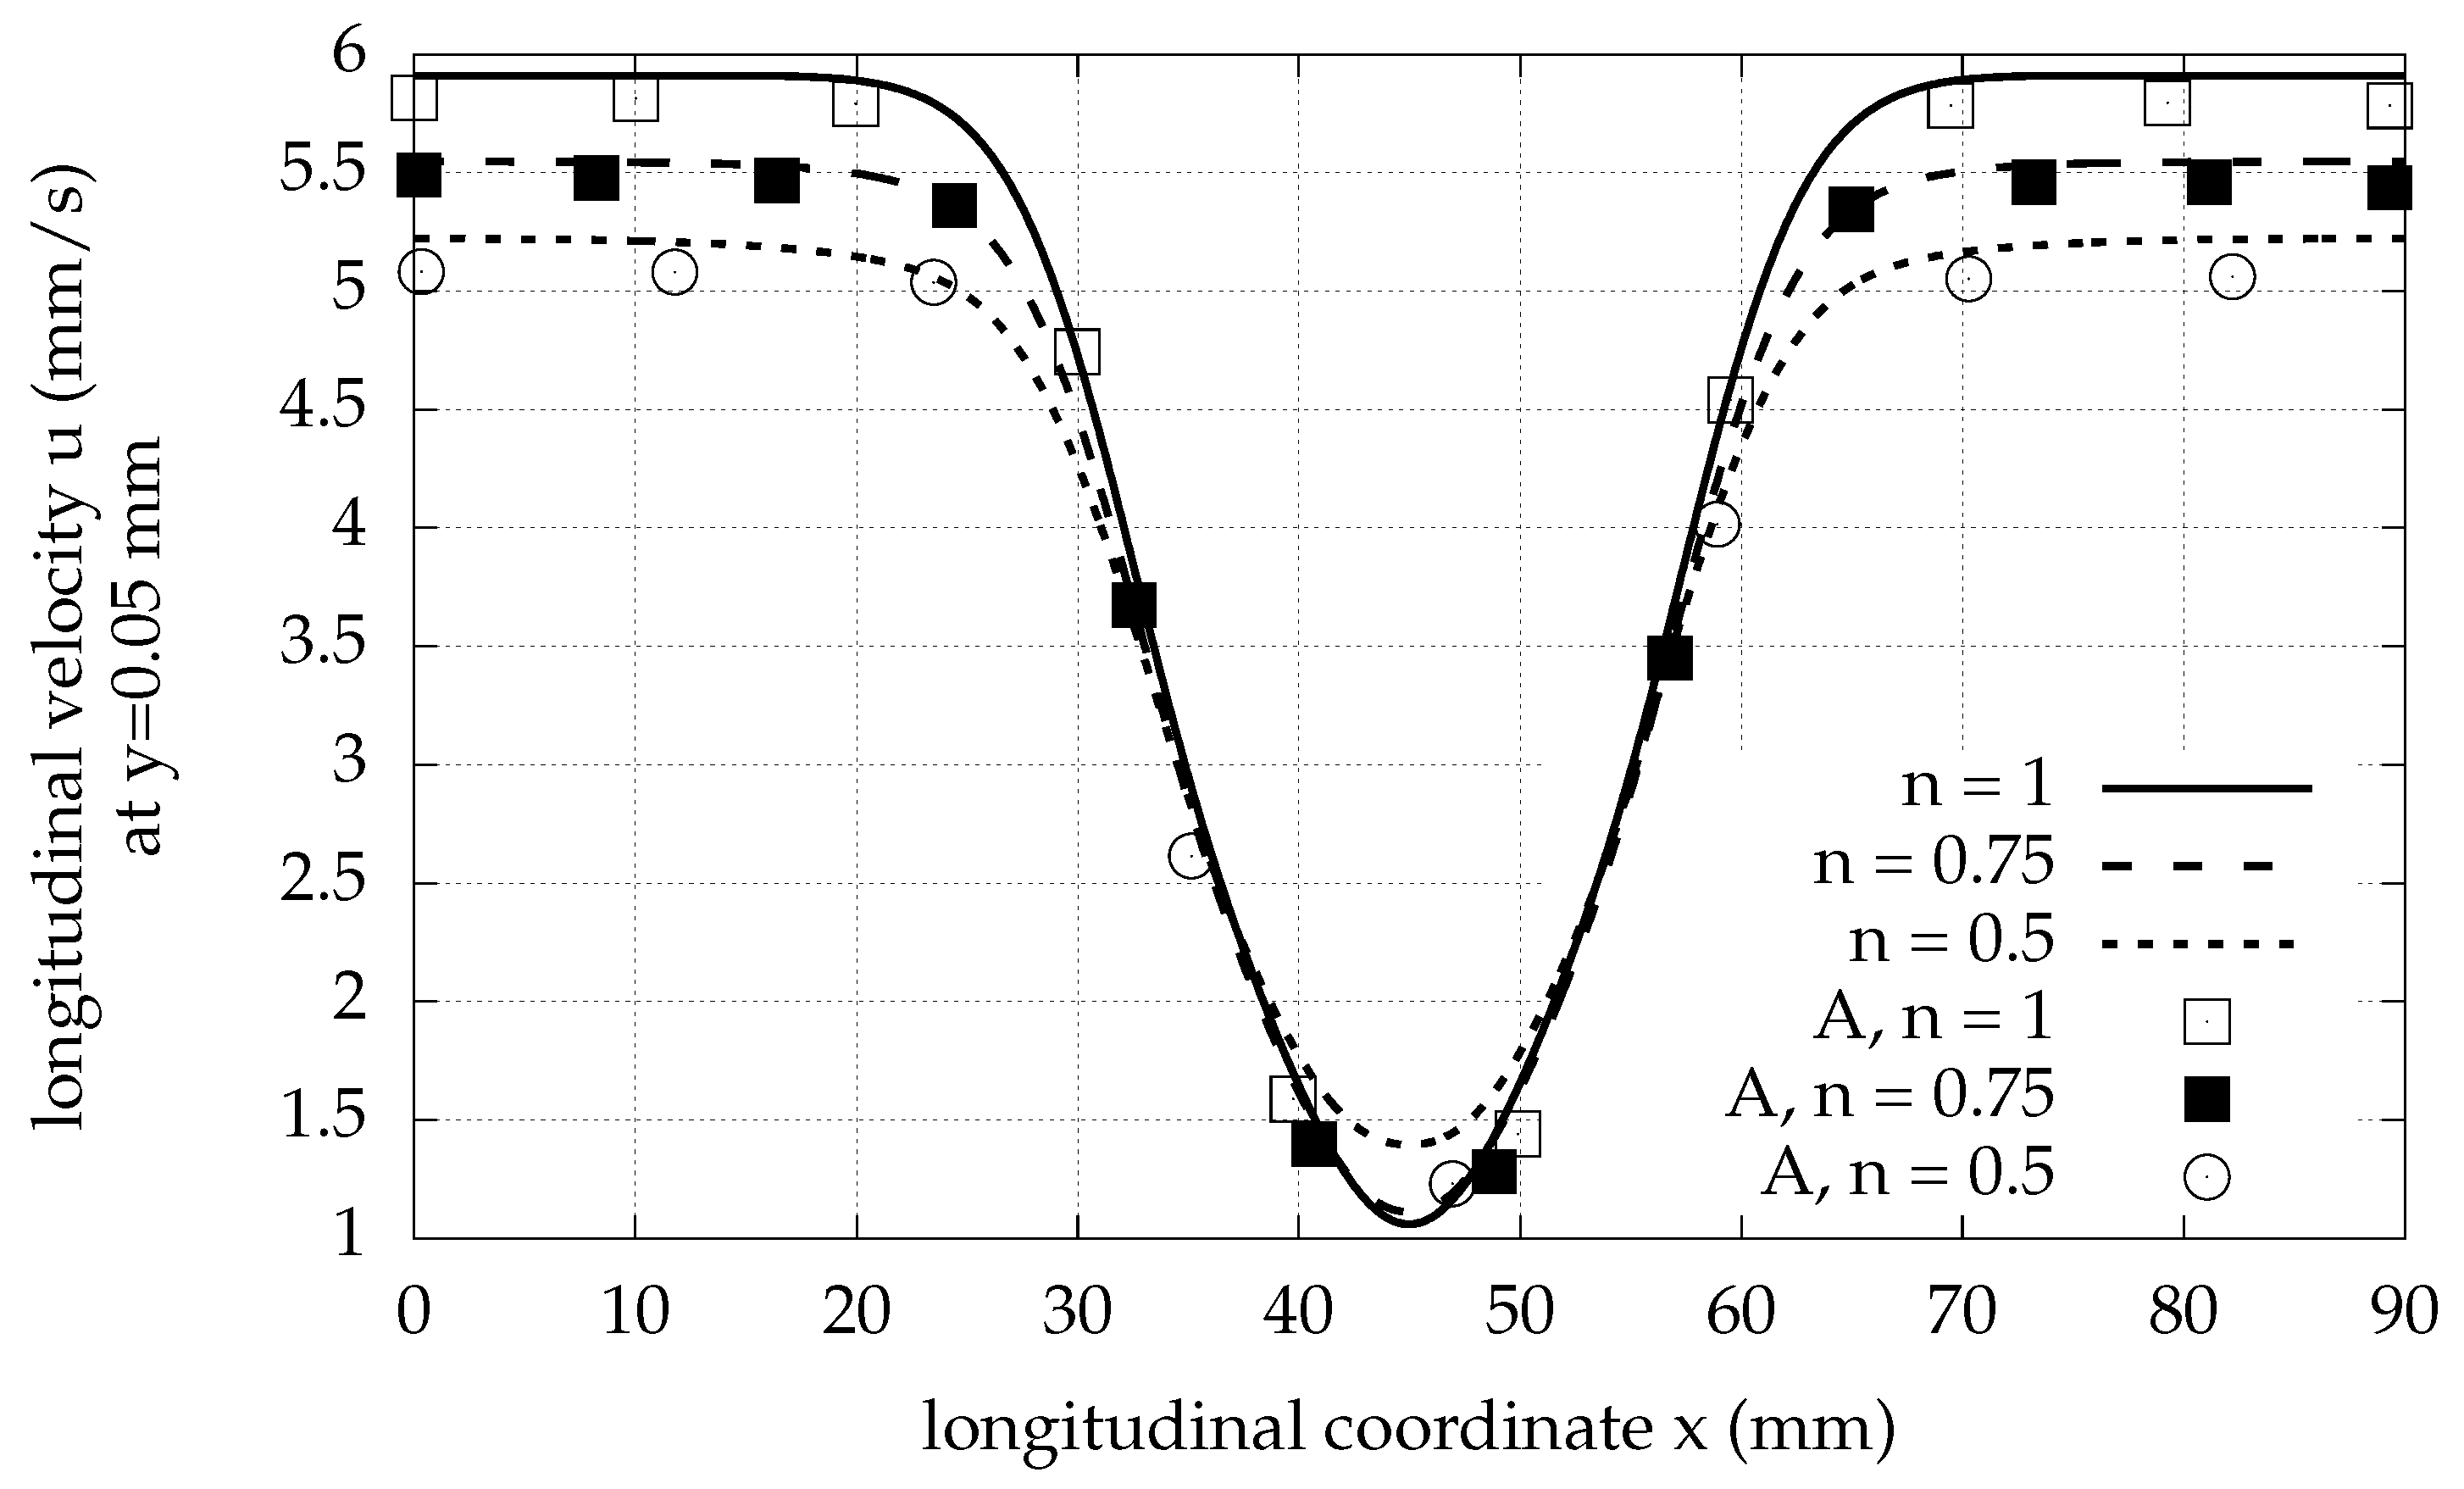
As the value of the Bird–Carreau power index decreases, the effect of the moving roller on the axial velocity near the longitudinal axis of symmetry ( mm) slightly weakens; i.e., near the axis, the streamwise longitudinal velocity curve exhibits fairly little fluctuation, as shown in Figure 6. More specifically, away from the roller position, the velocity decreases, while at the position of the roller, it increases.
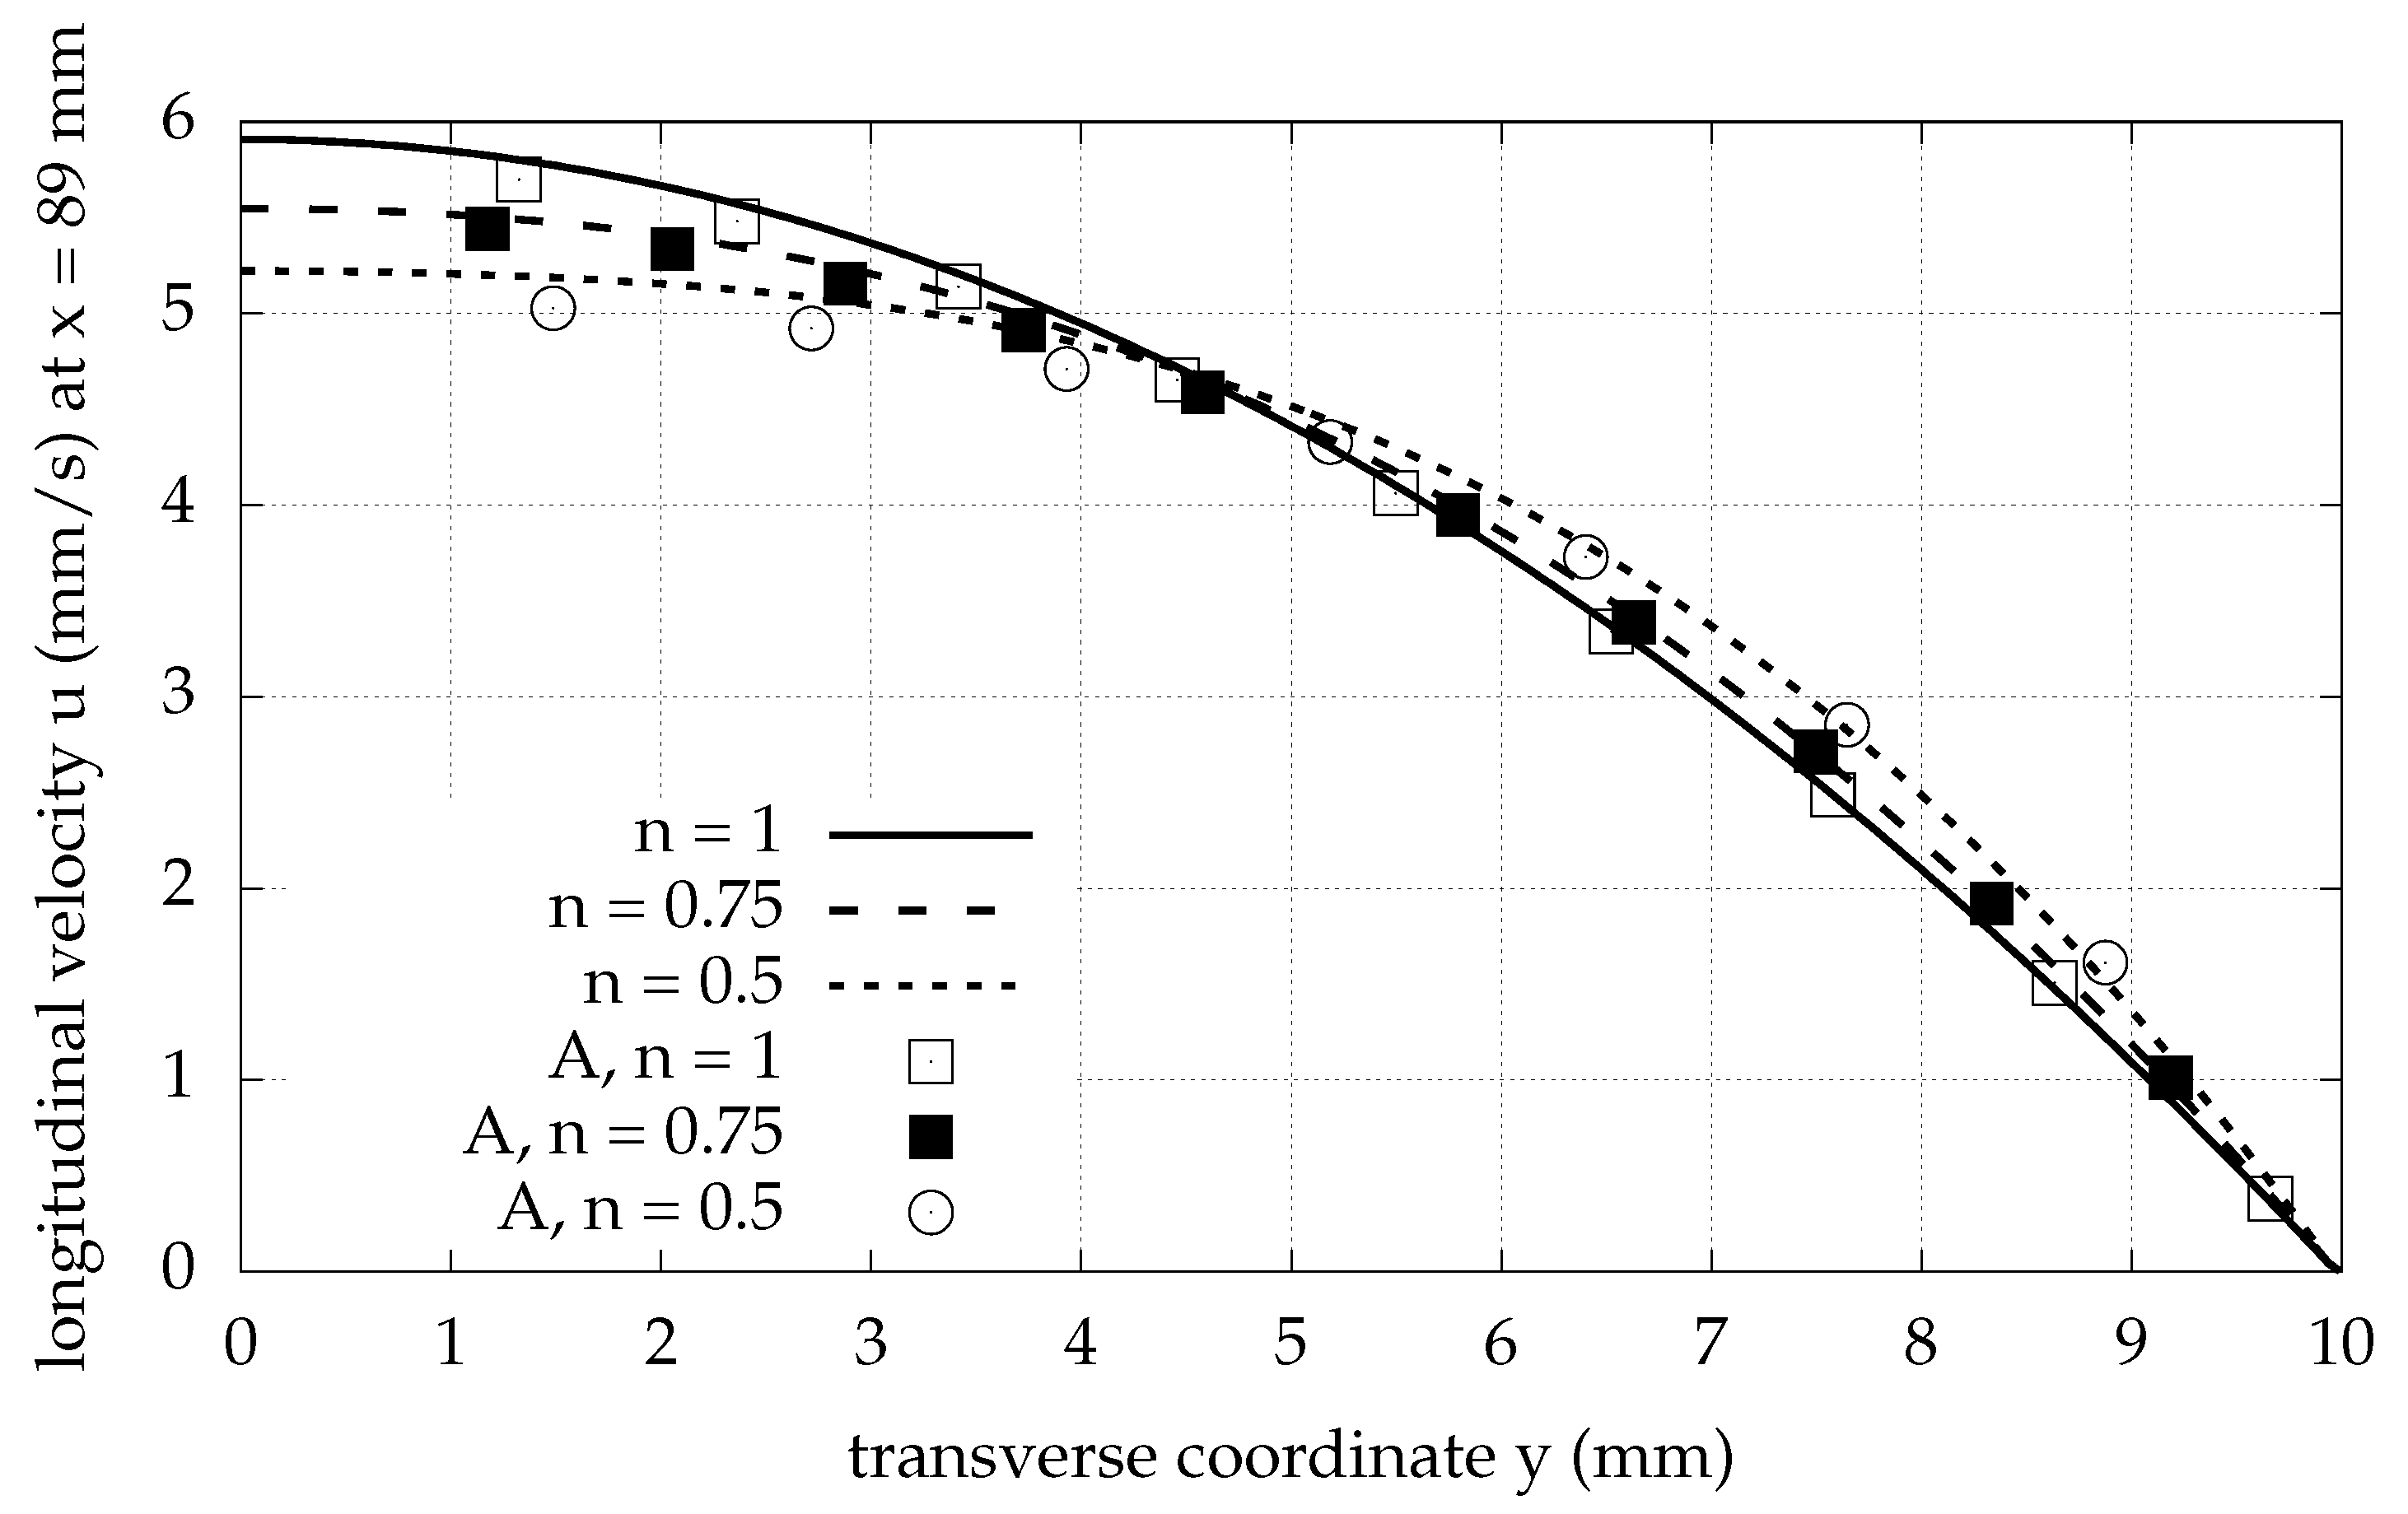
As suggested in Figure 7, near the wall, the axial velocity is higher for pseudoplastic fluids than for Newtonian fluids. Pressure shows a stronger dependence on the power index, and the force exerted on the roller decreases 5-fold when the power index decreases by a factor , as observed in Figure 8.
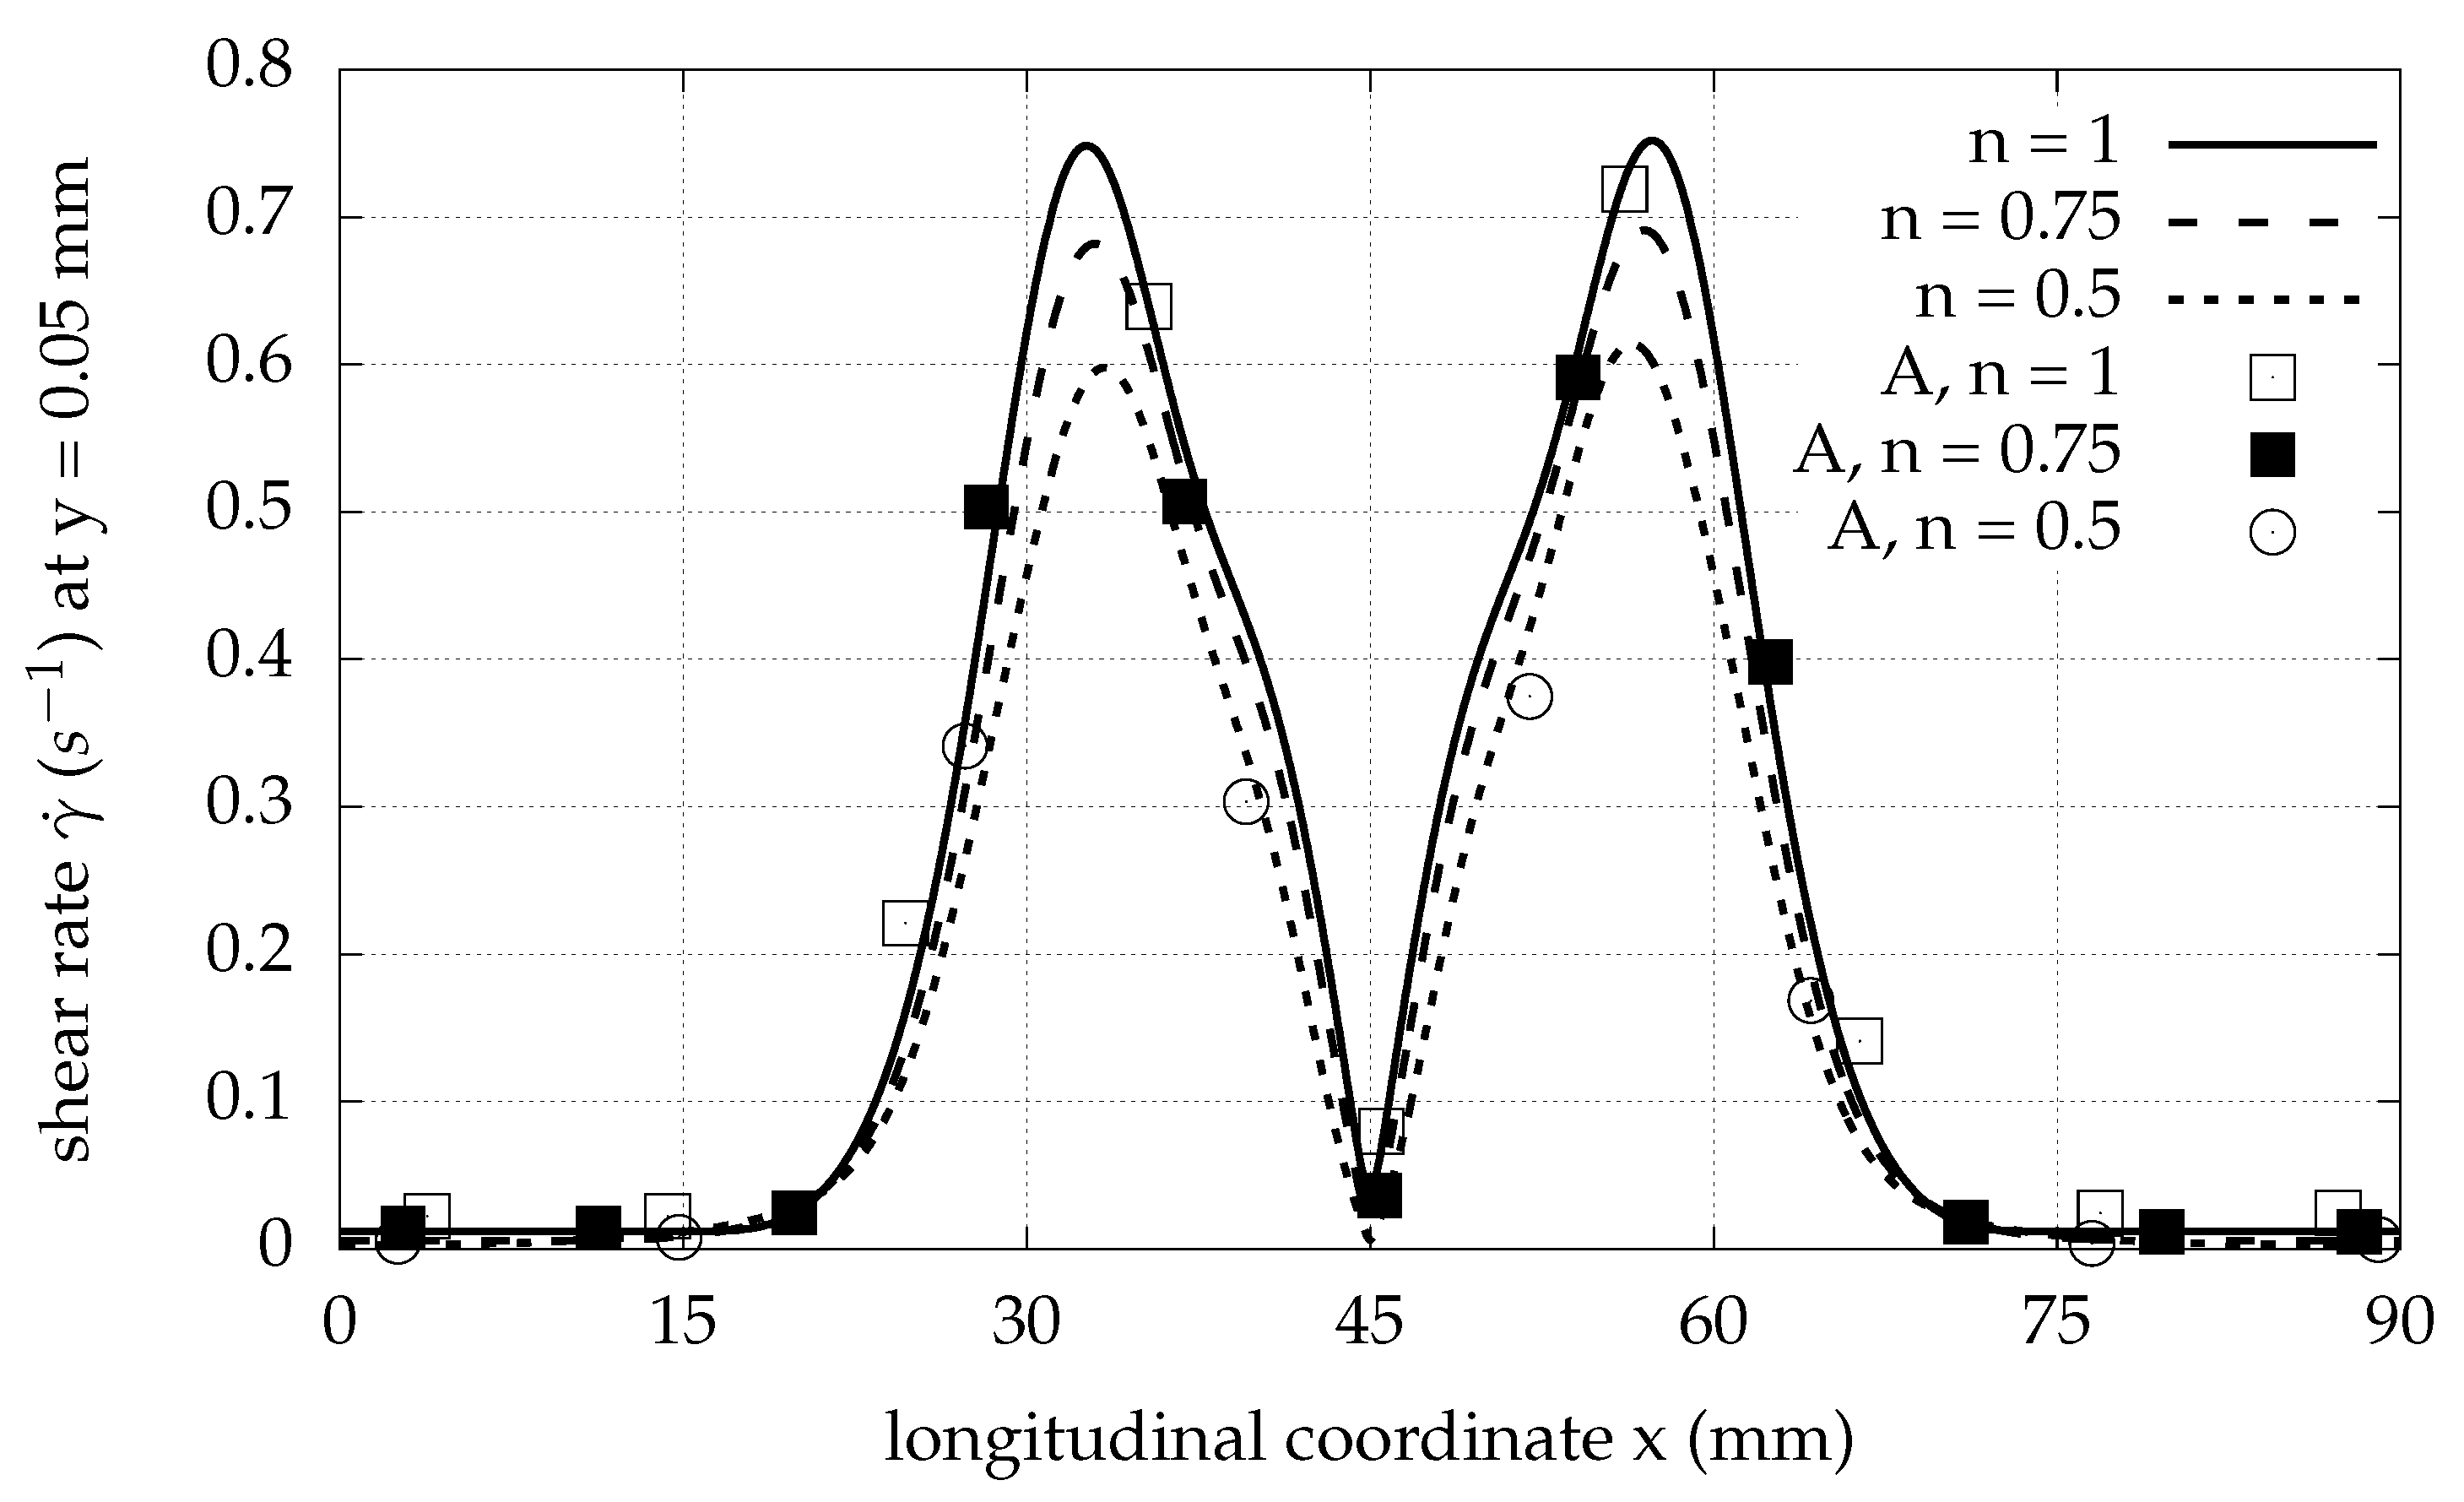
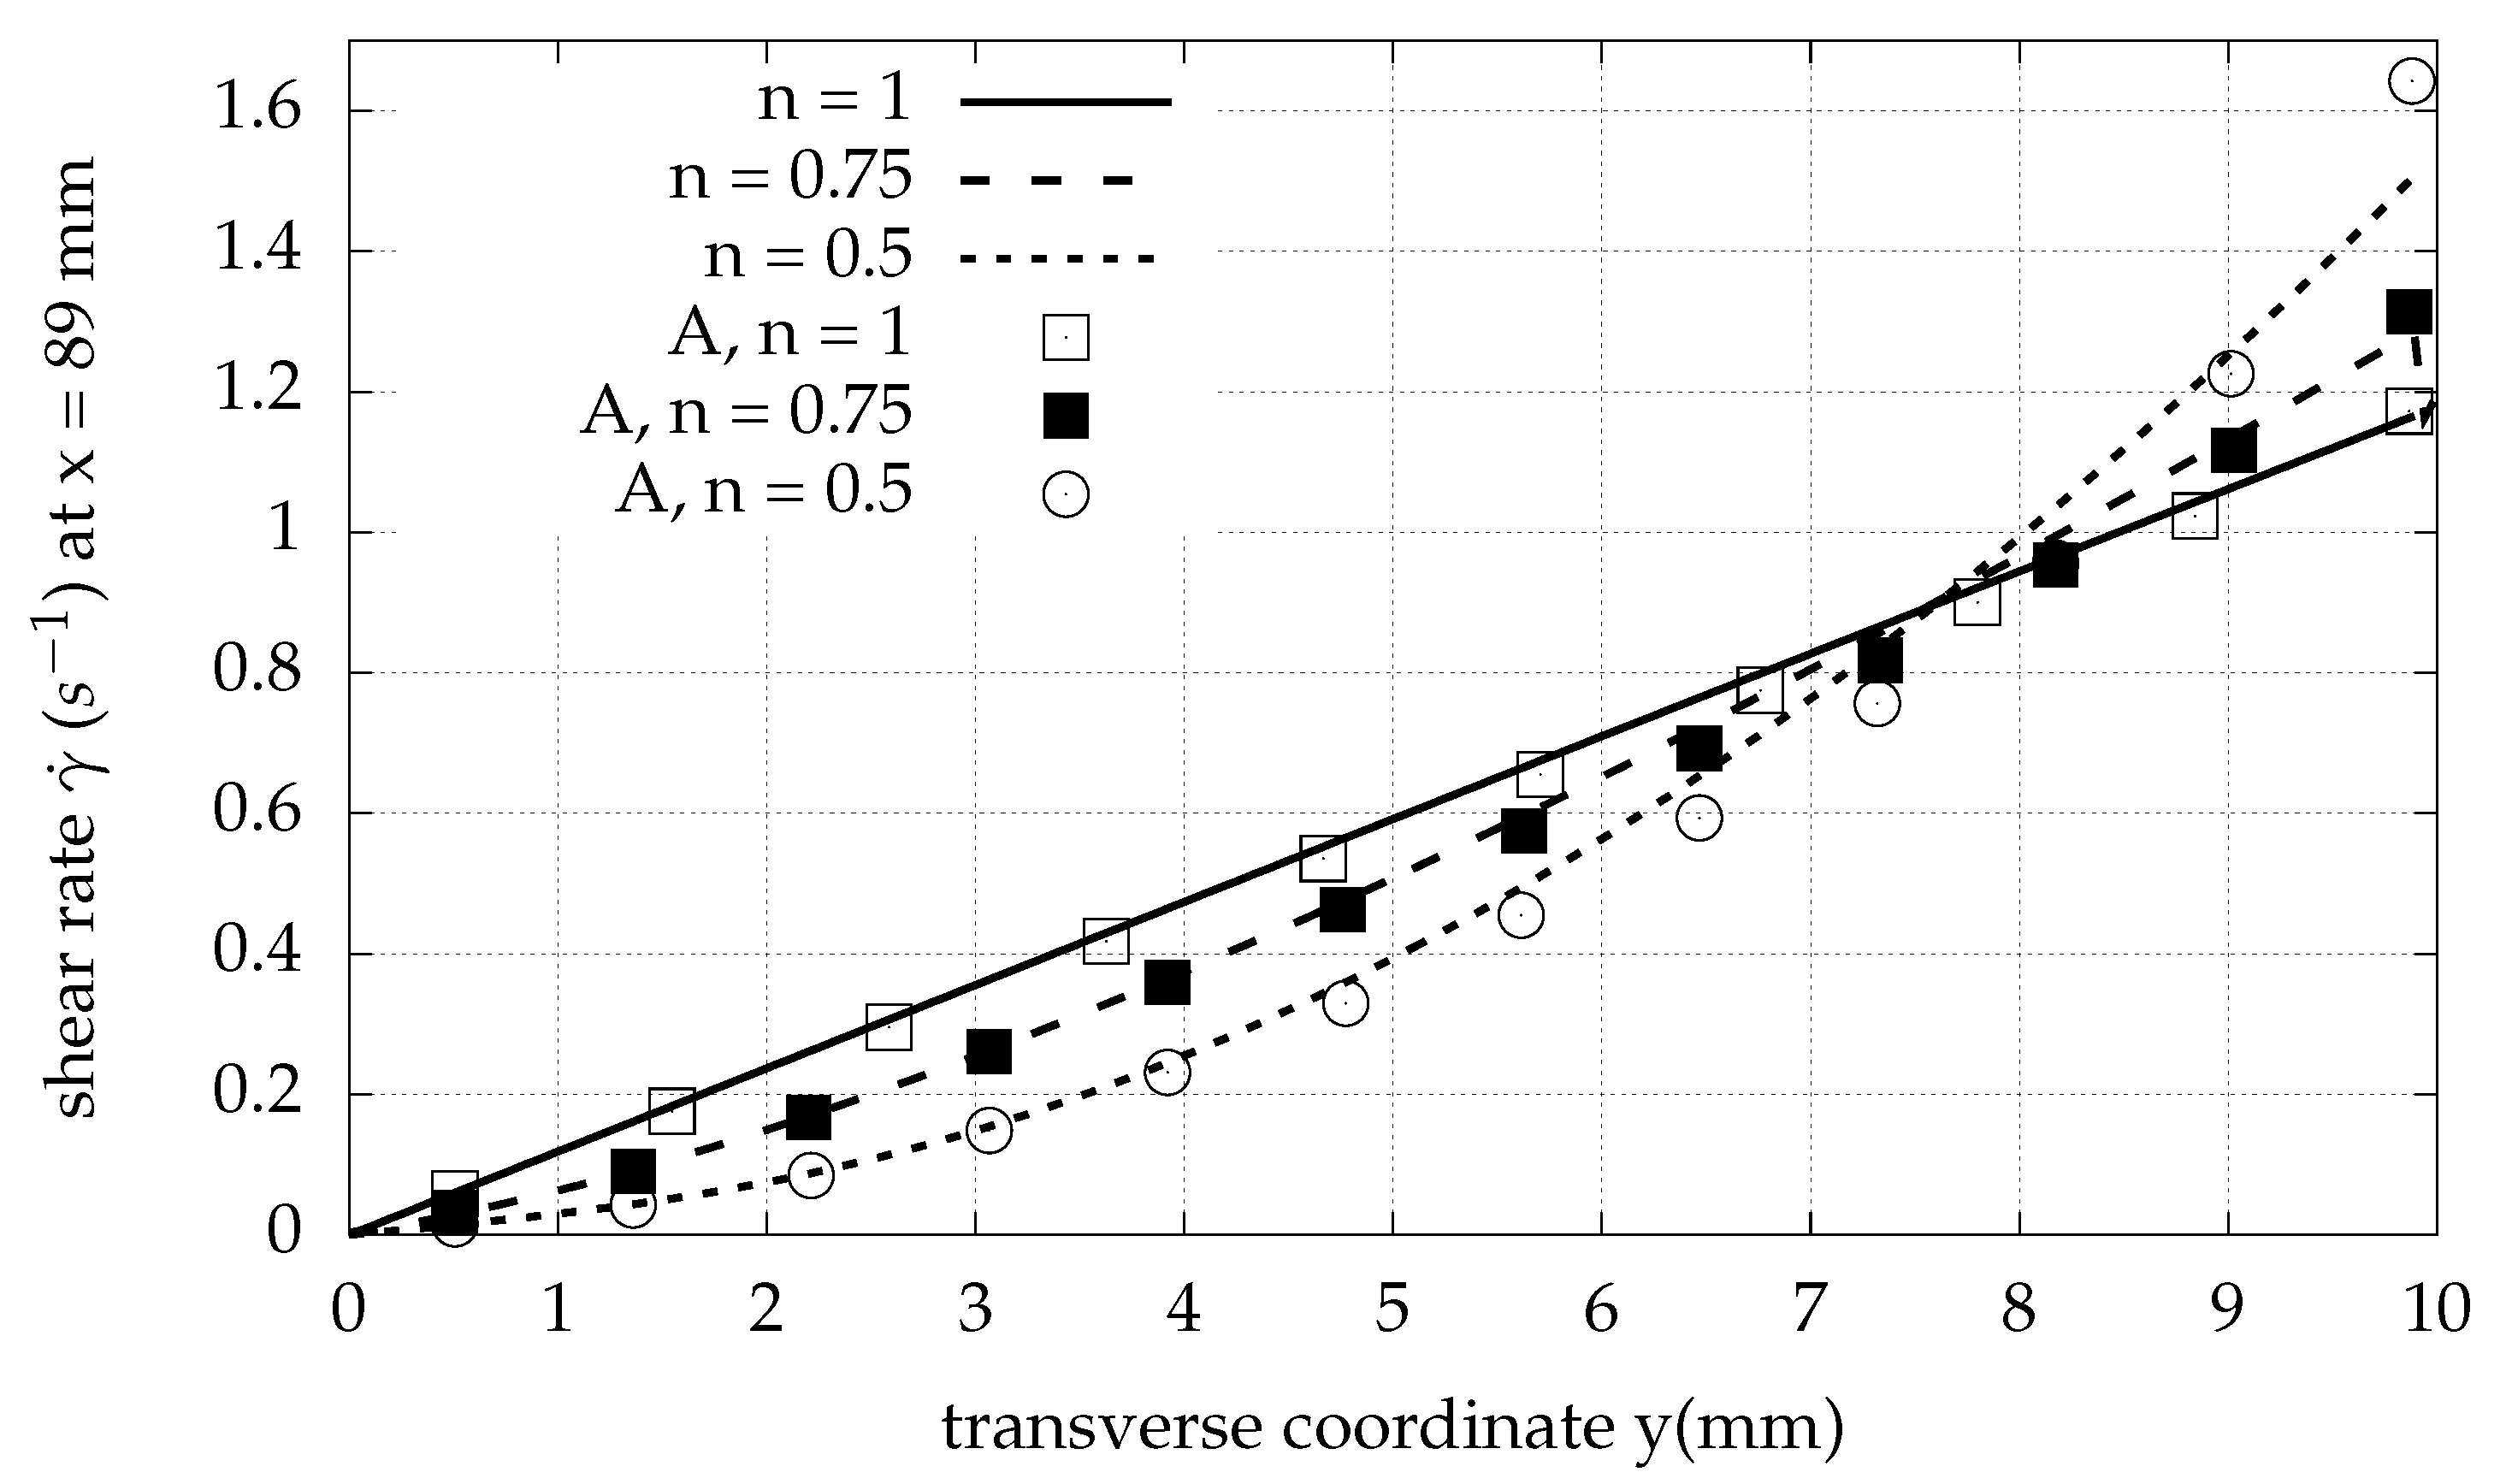
The shear rate also decreases near the x-axis for smaller values of the power index n, as Figure 9 shows. Near the wall, the shear rate increases for shear-thinning fluids as compared to Newtonian fluids, as shown in Figure 10. Transport efficiency is weakly dependent on the Bird–Carreau power index, as presented in Table 1.
3.4. Multiple Rollers
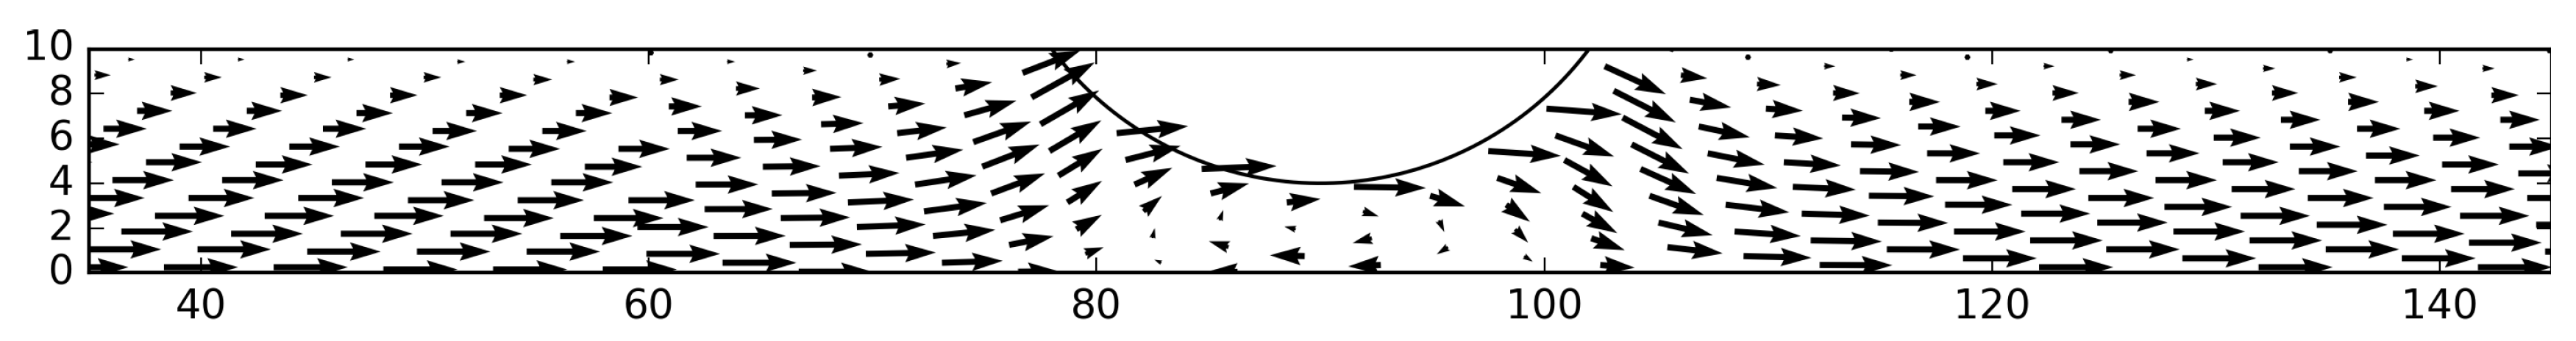
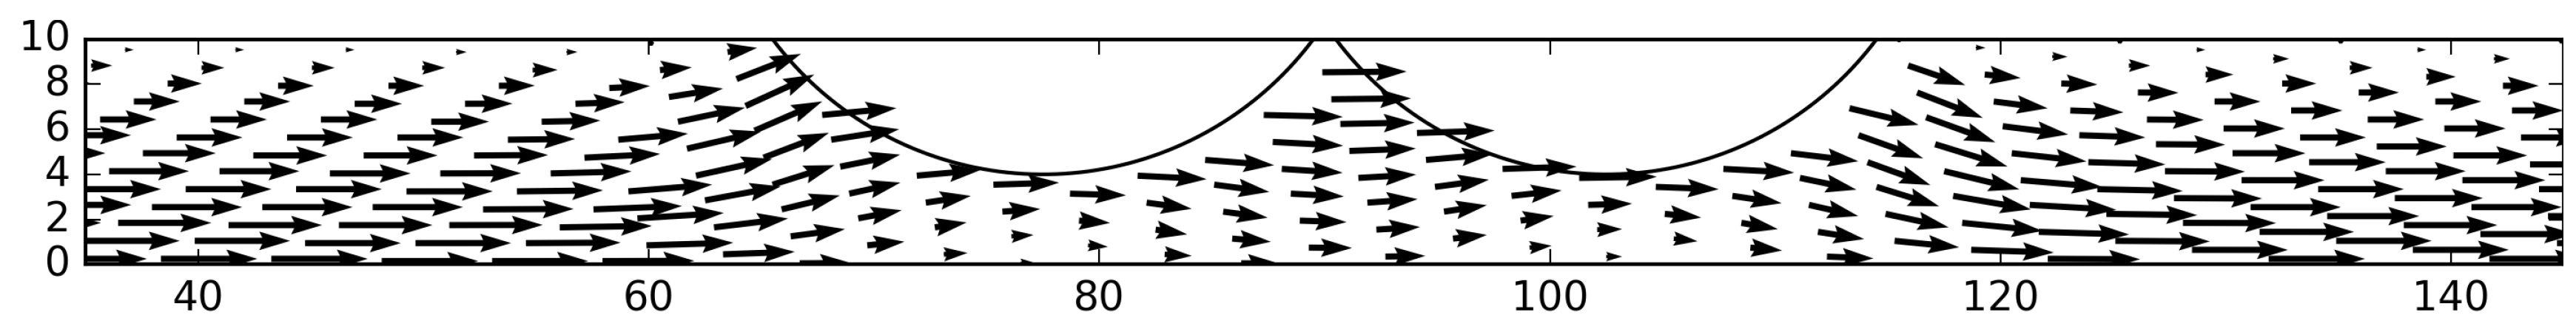
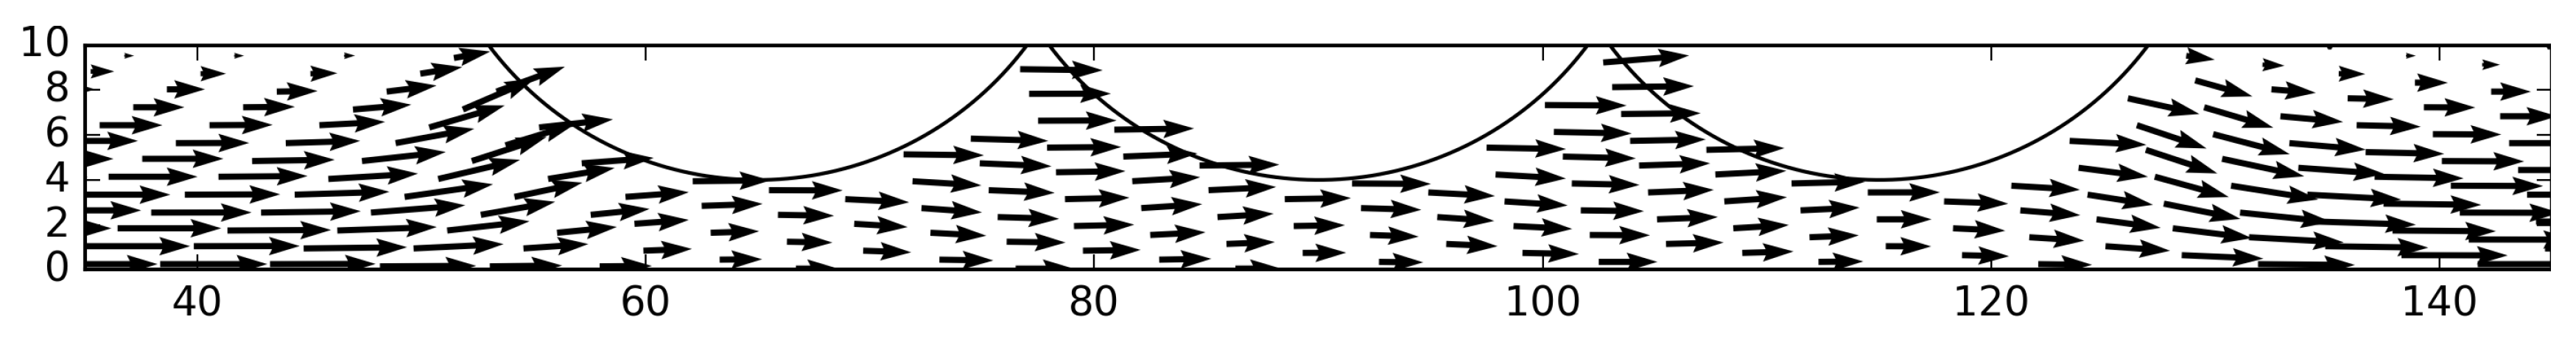
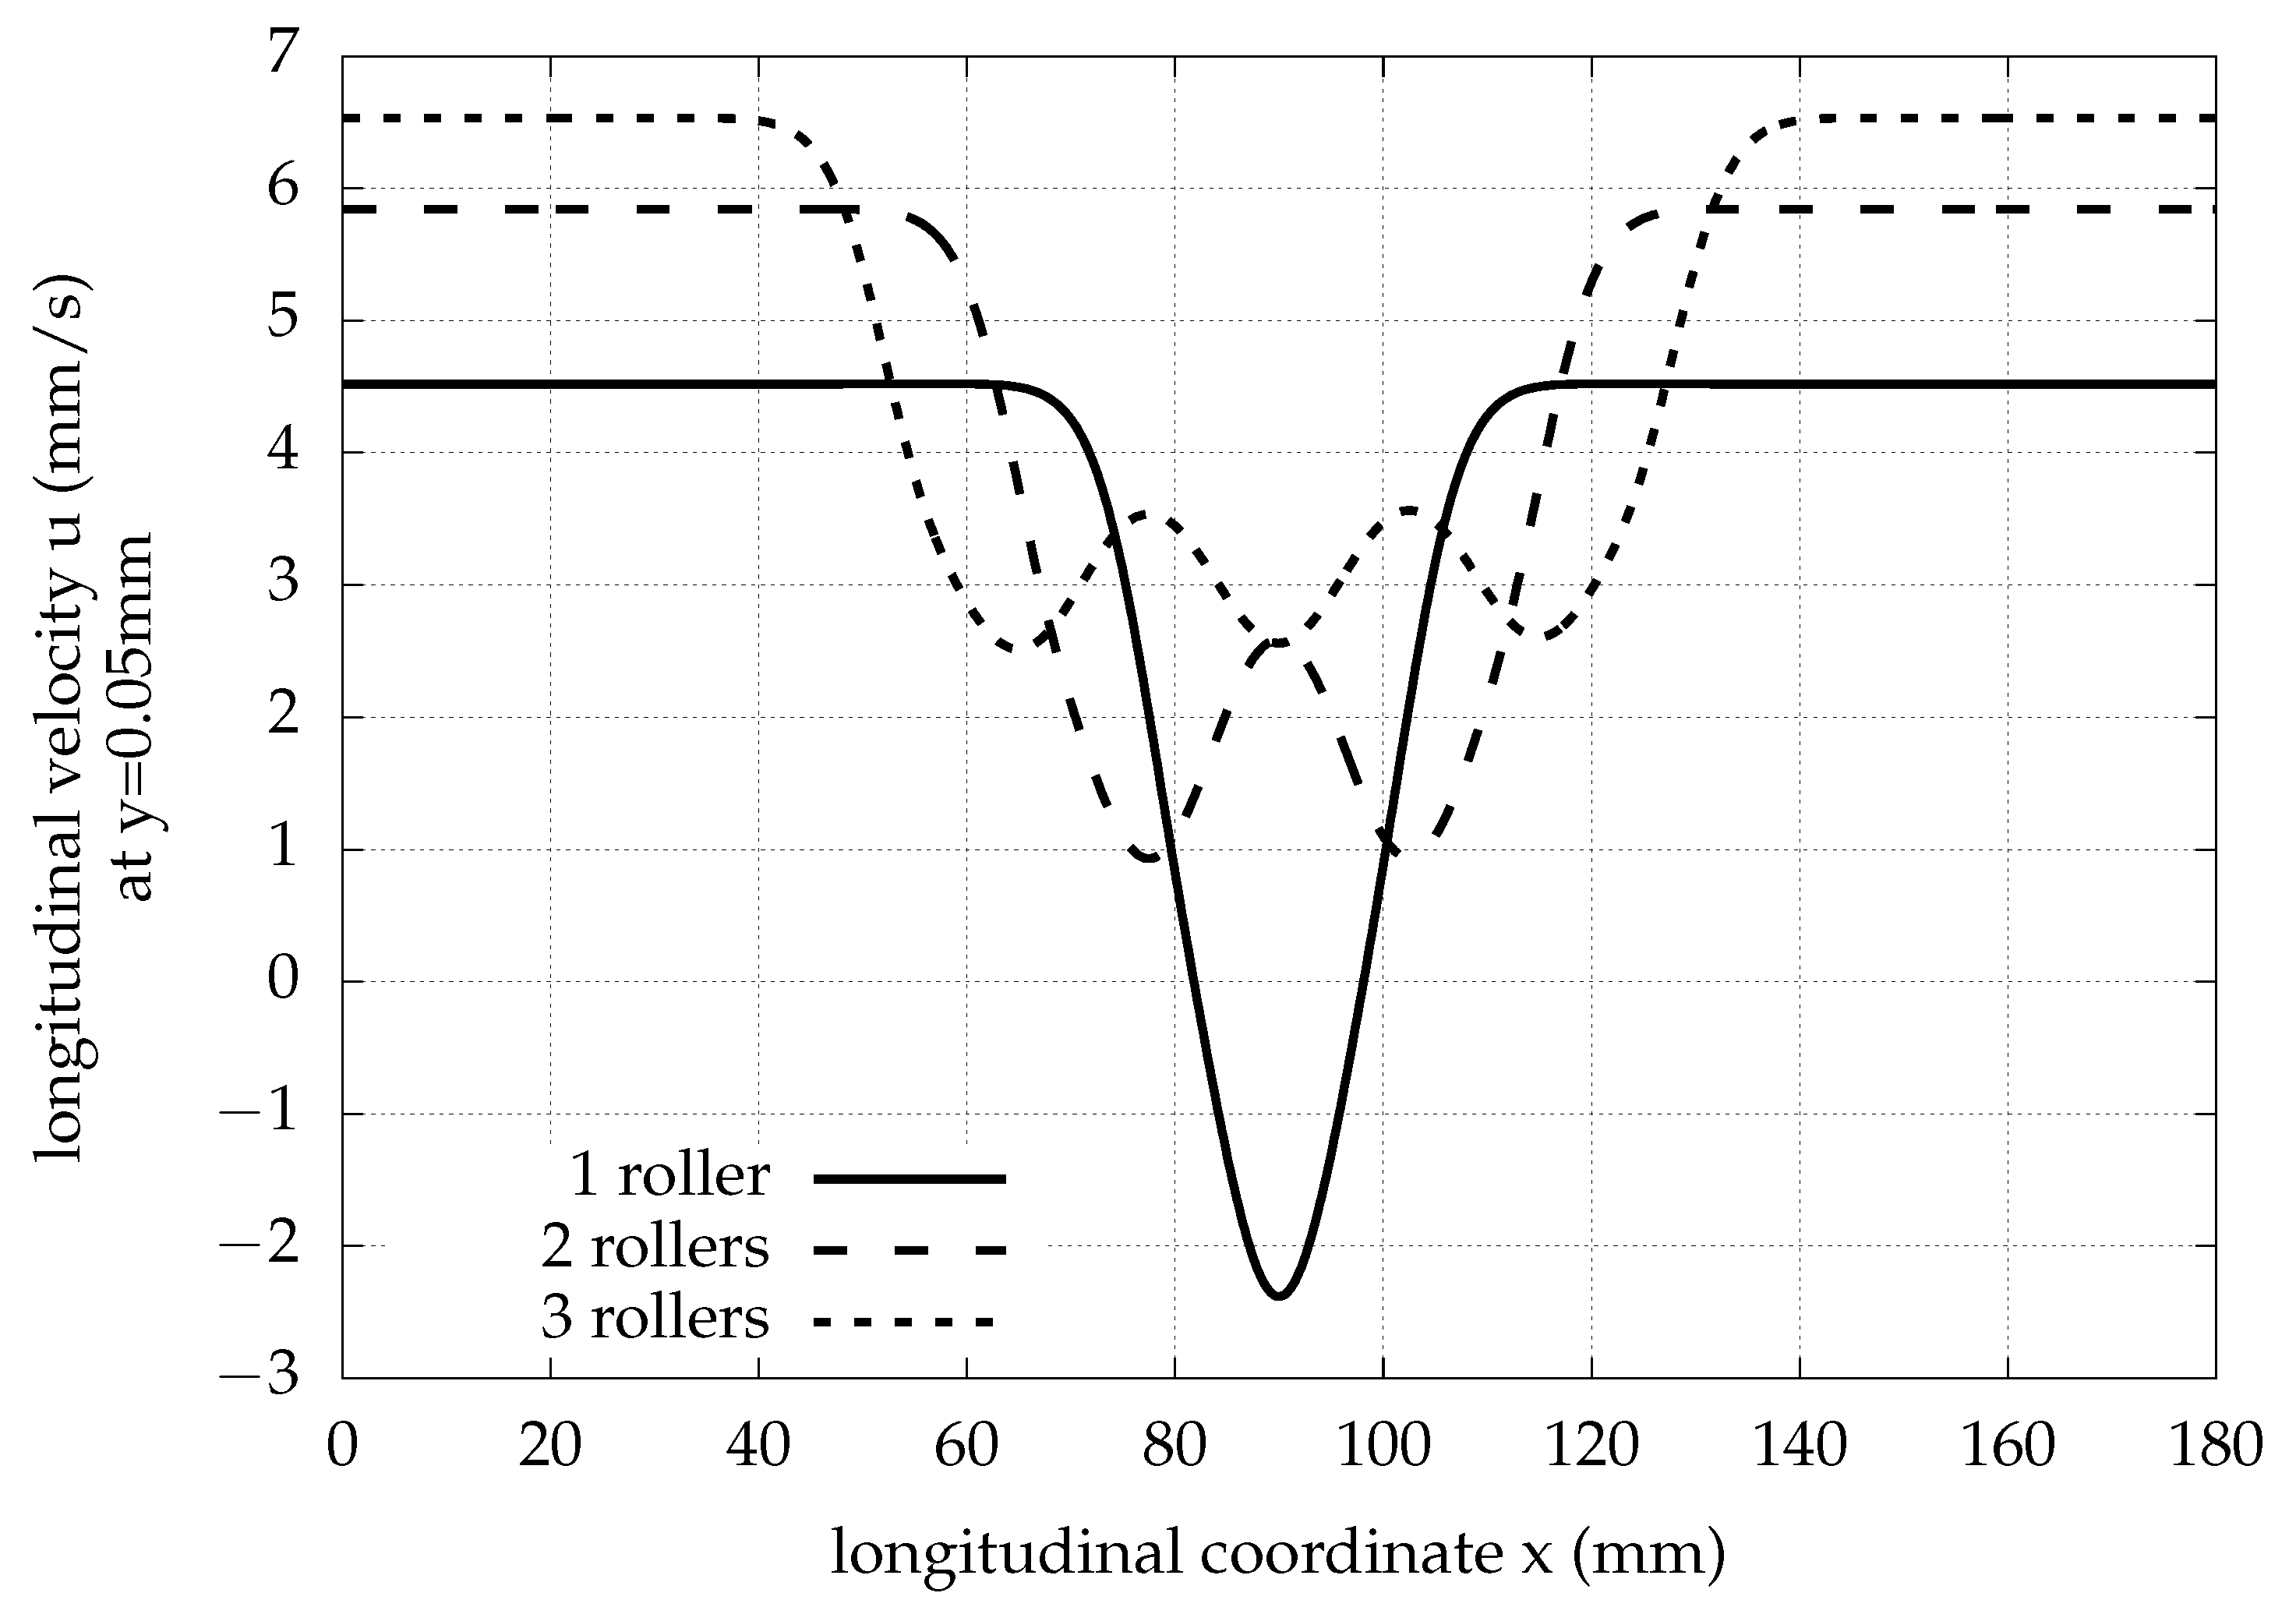
The fluid velocity vectors for one, two and three roller pumps with mm are illustrated in Figure 11, Figure 12 and Figure 13. The axial velocity shows the highest value near the x-axis away from the roller and reaches its minimum value under the roller, as is also shown in Figure 14. For the case of one roller, the axial velocity under the roller () and near the longitudinal axis of symmetry () is negative with a magnitude nearly half the speed of the moving roller, creating a recirculation zone. For multiple rollers, no negative axial velocity values appear.
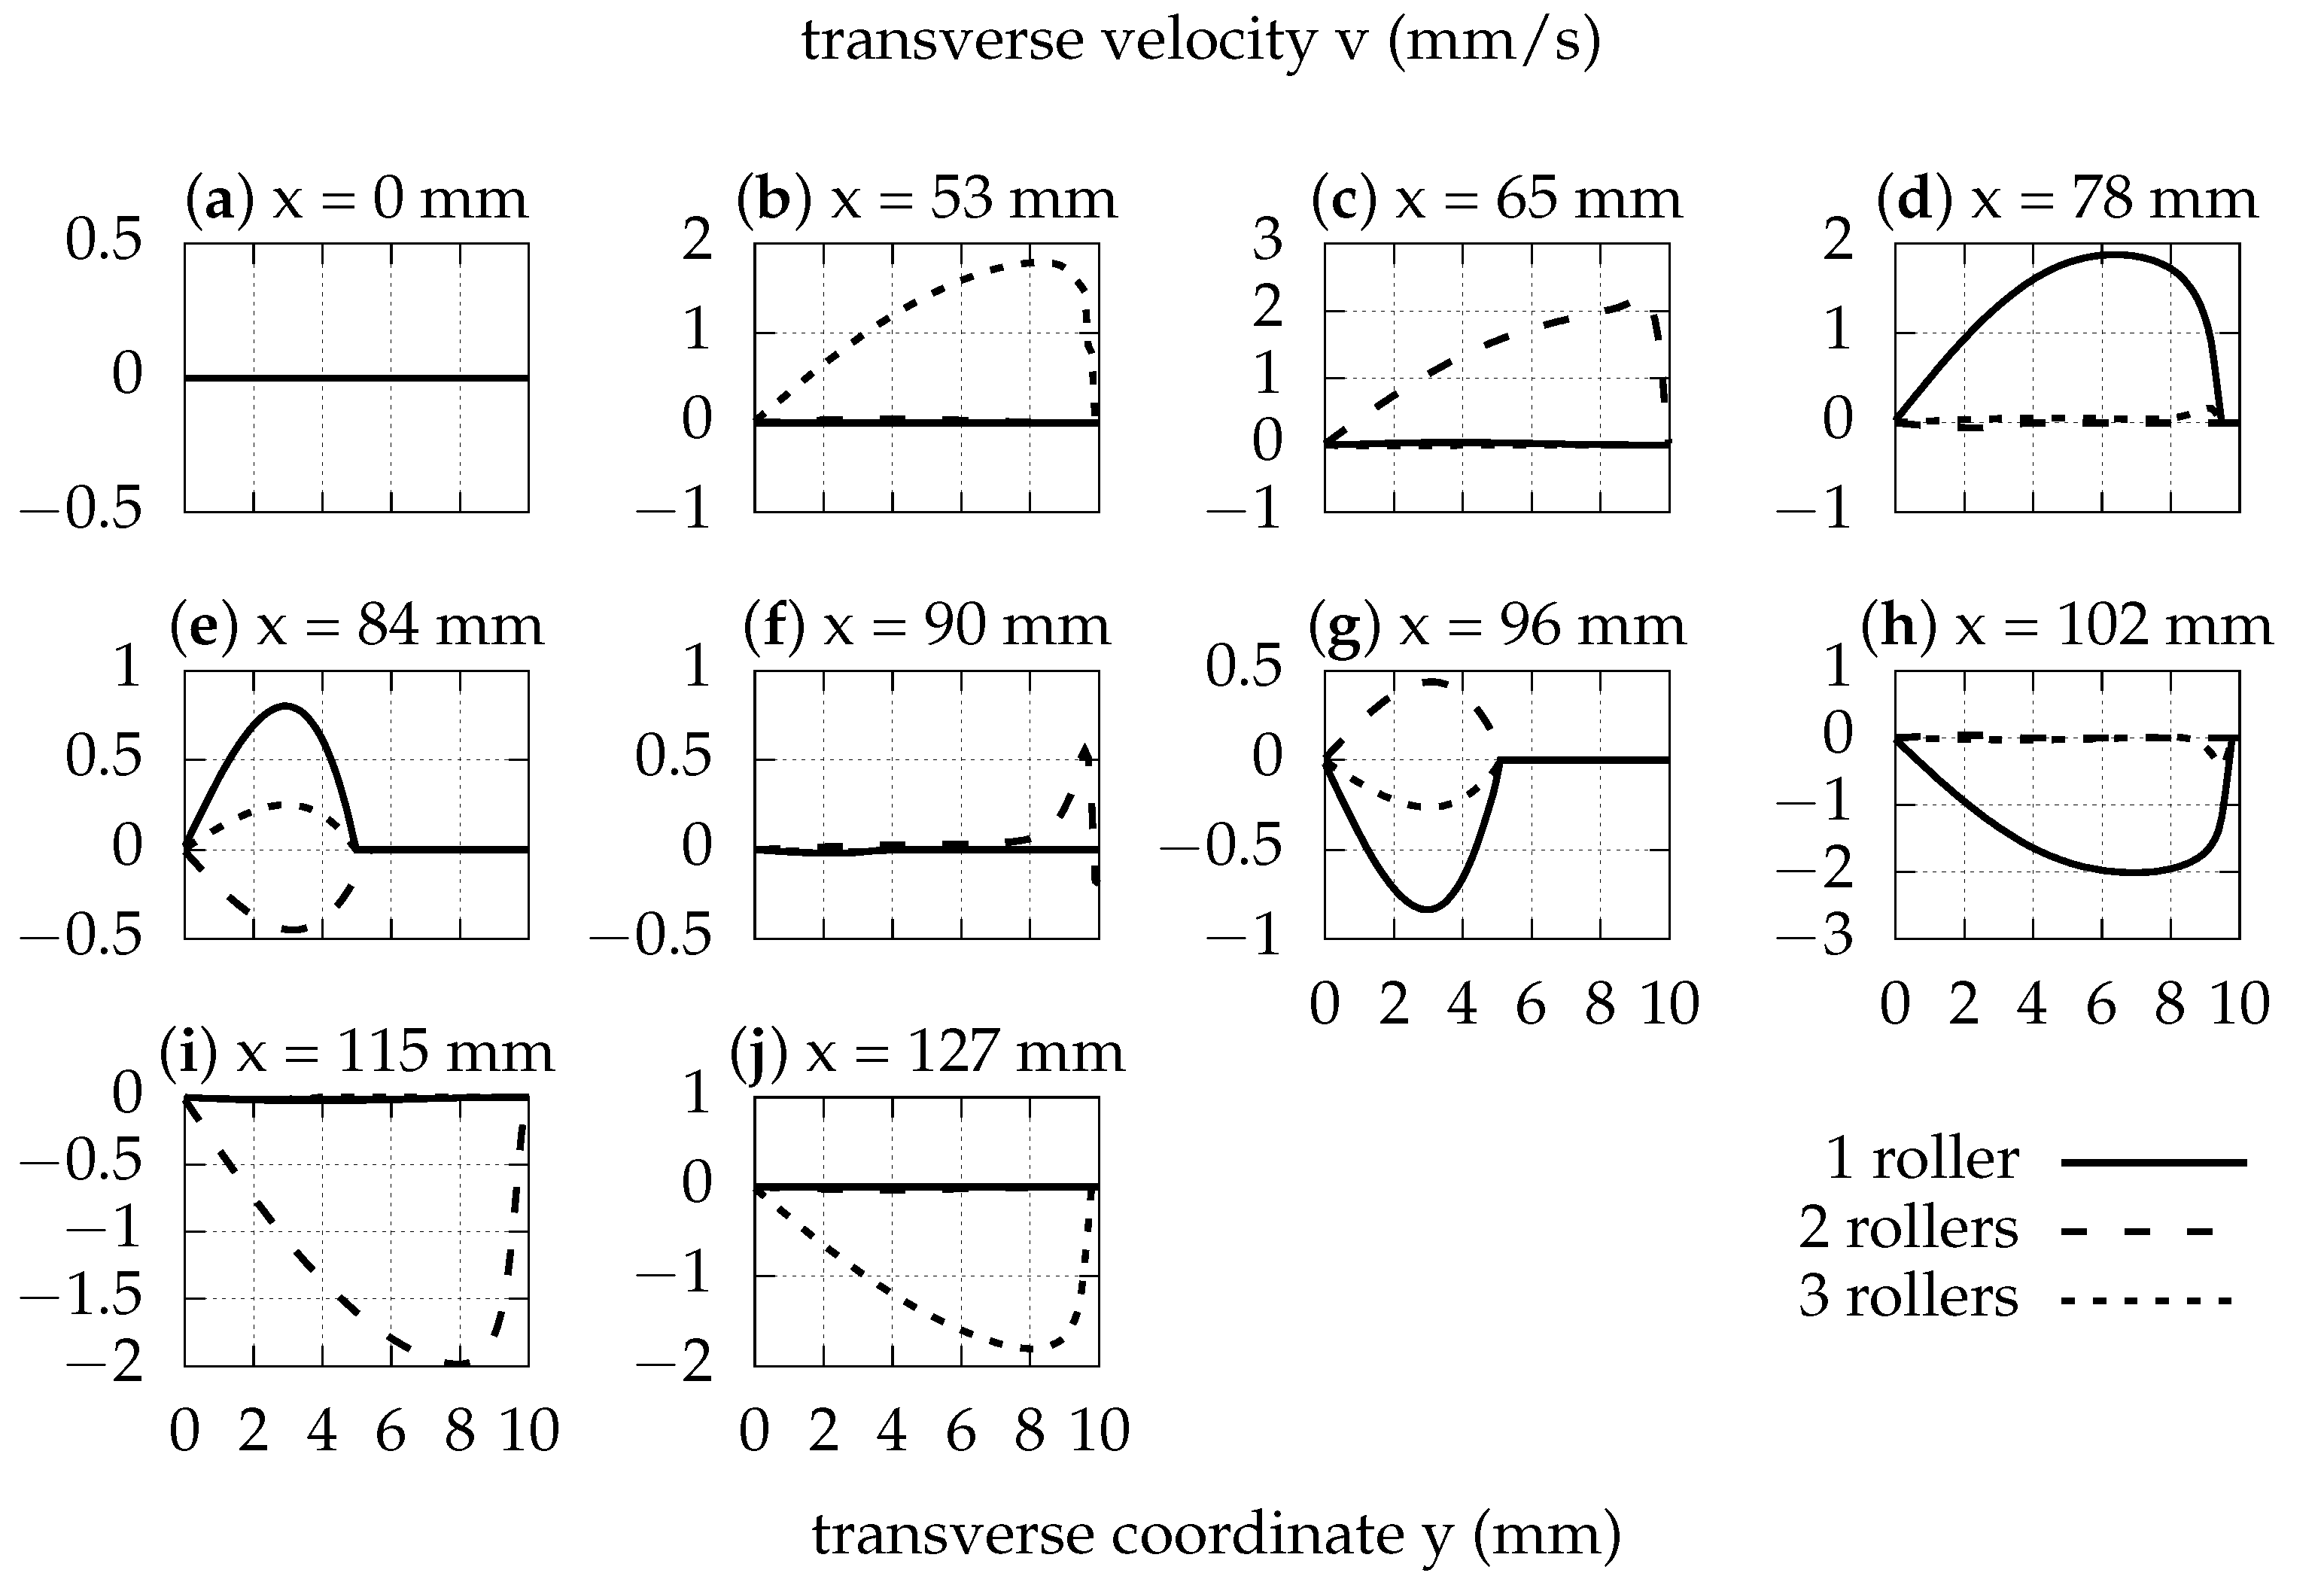
The extrema of transverse velocity are directly before and directly after the roller(s) train for all cases. This behavior is explained by the need for the area to be vacant for the roller train to pass (e.g., at for two rollers) and for fluid to fill the empty space left from the departure of the roller (e.g., at for two rollers).
In Figure 15 and Figure 16, the horizontal and vertical velocity profiles, respectively, are given at the cross-sections of interest near the beginning and ending of the rollers, distributed under the rollers and at the incoming flow. The inlet longitudinal velocity profile shows higher values as the number of consecutive rollers increases. The same pattern is observed for the profiles around the middle of the length. Transverse velocity maxima are at approximately the same level, mm/s, for one, two and three rollers. Under the roller center, the vertical velocity nearly vanishes, as is expected because of the symmetry of the geometry, as shown in Figure 16.
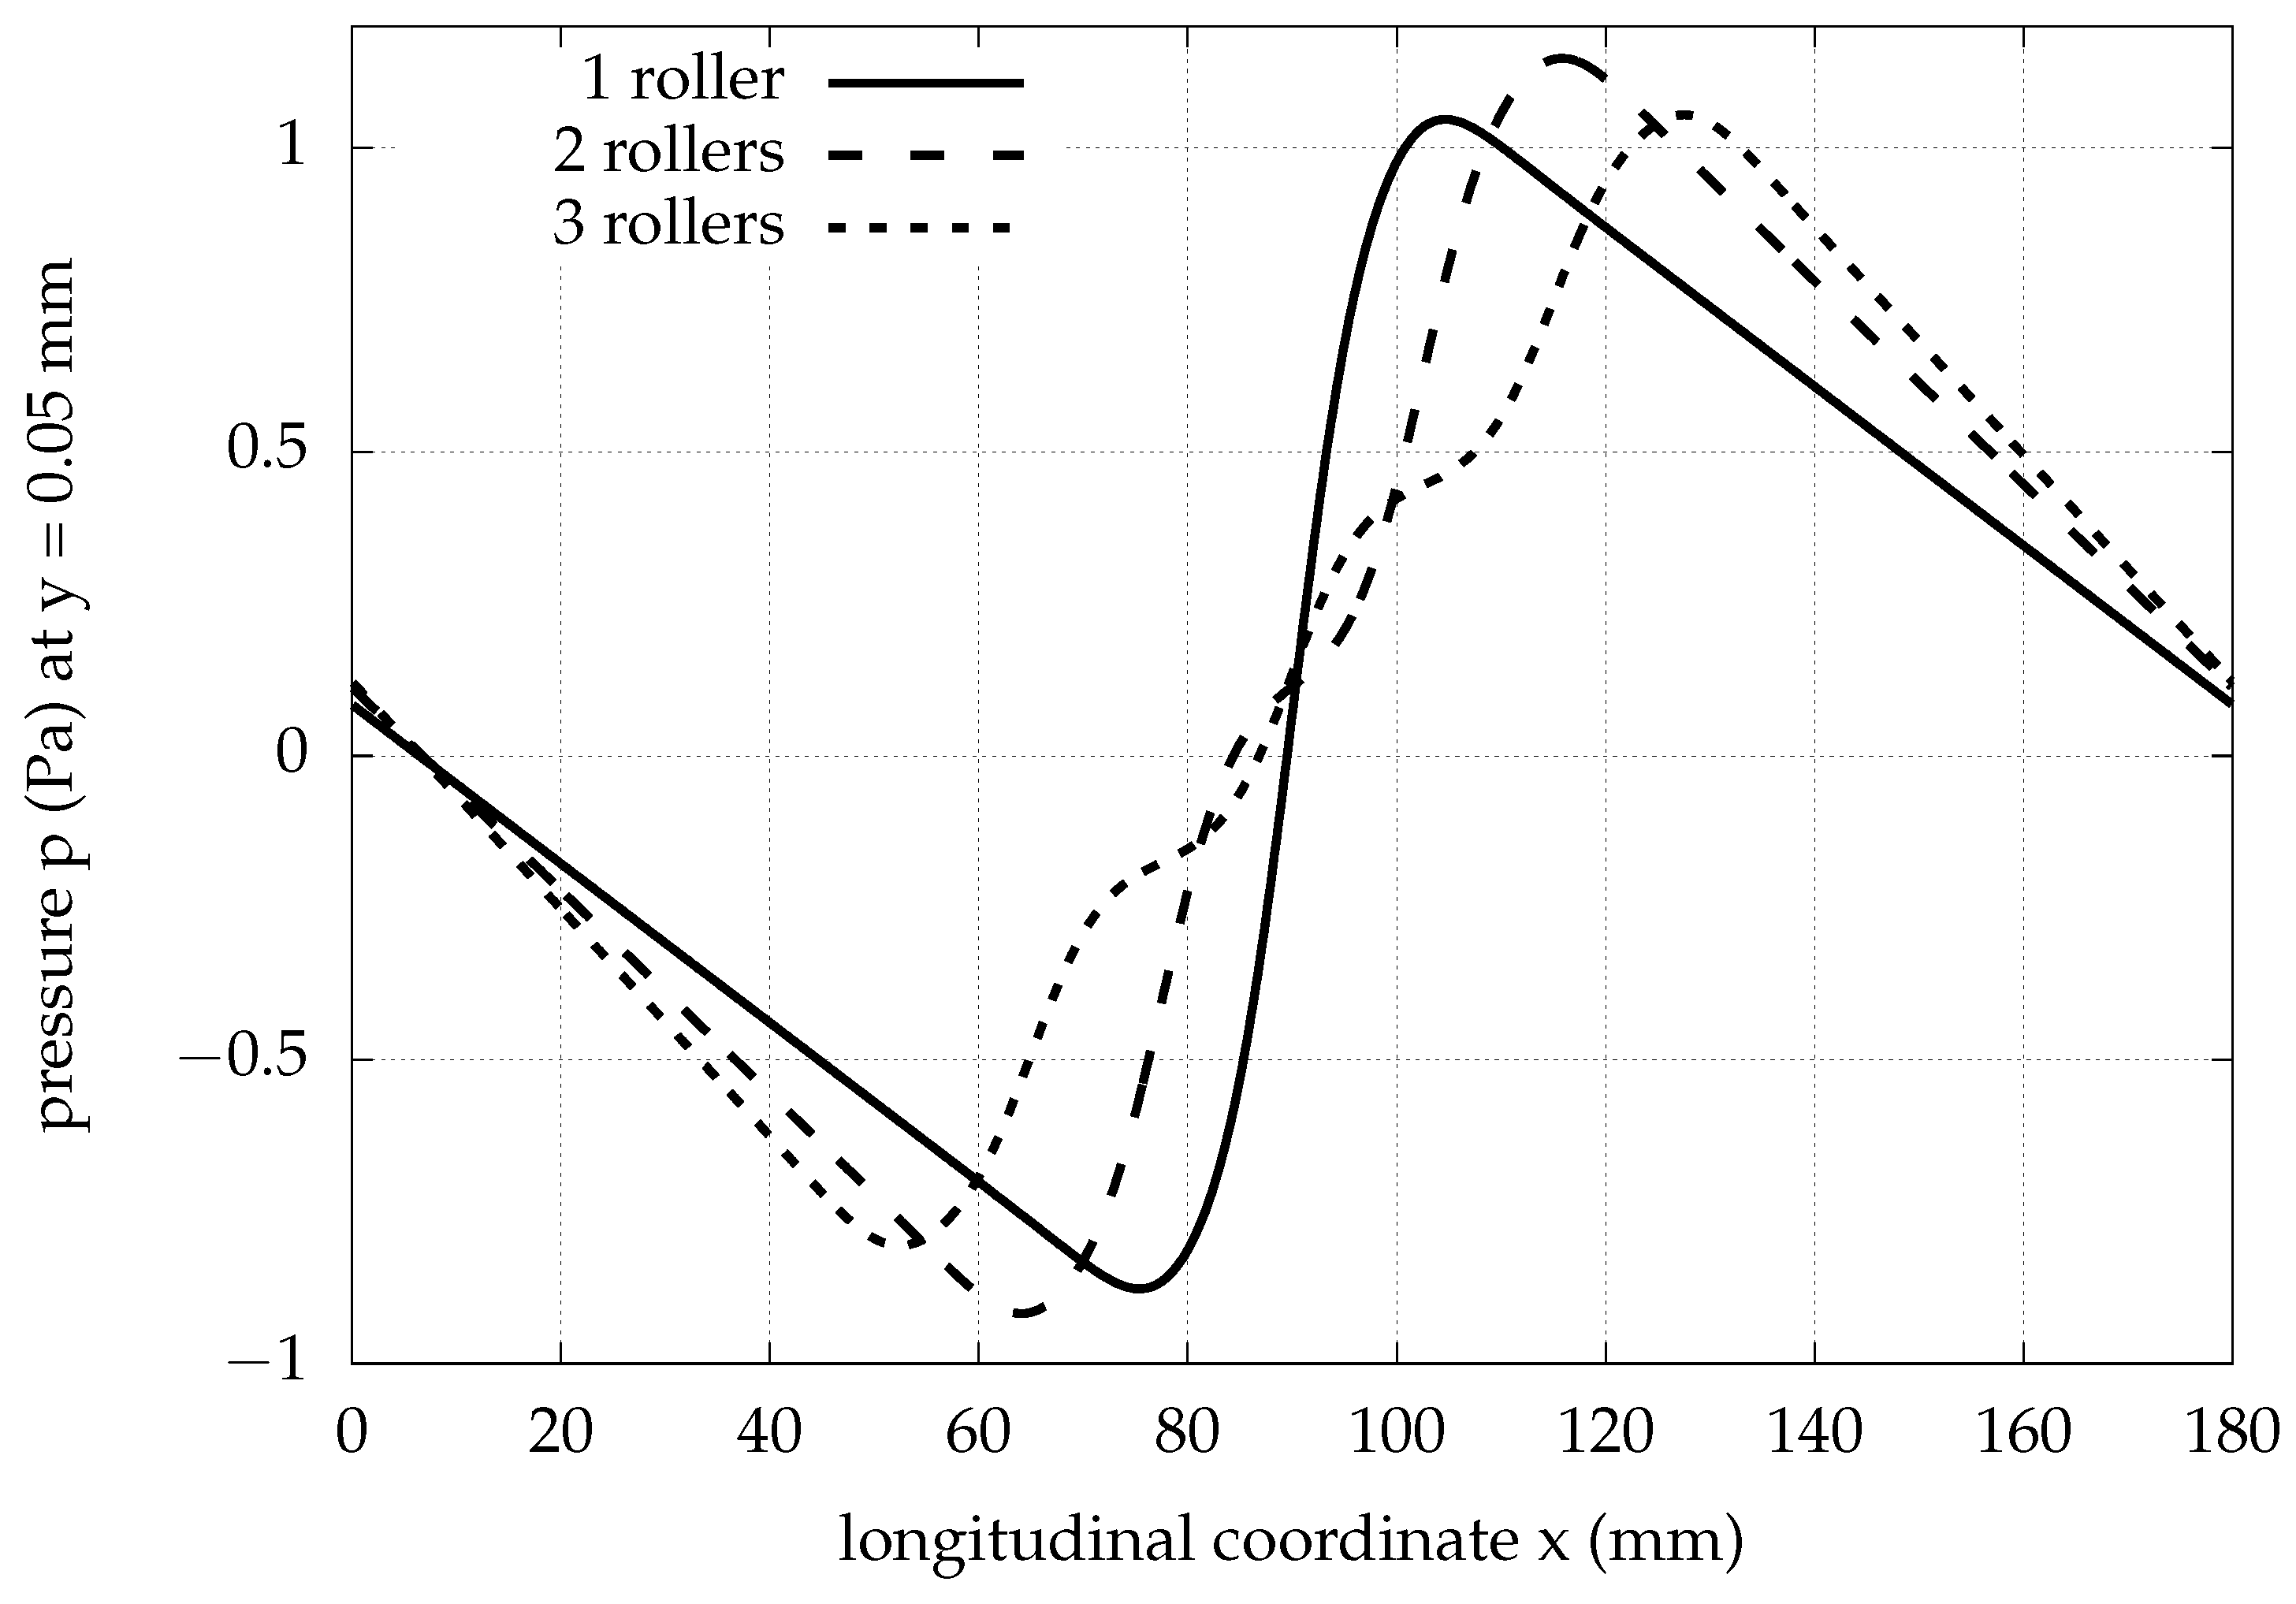
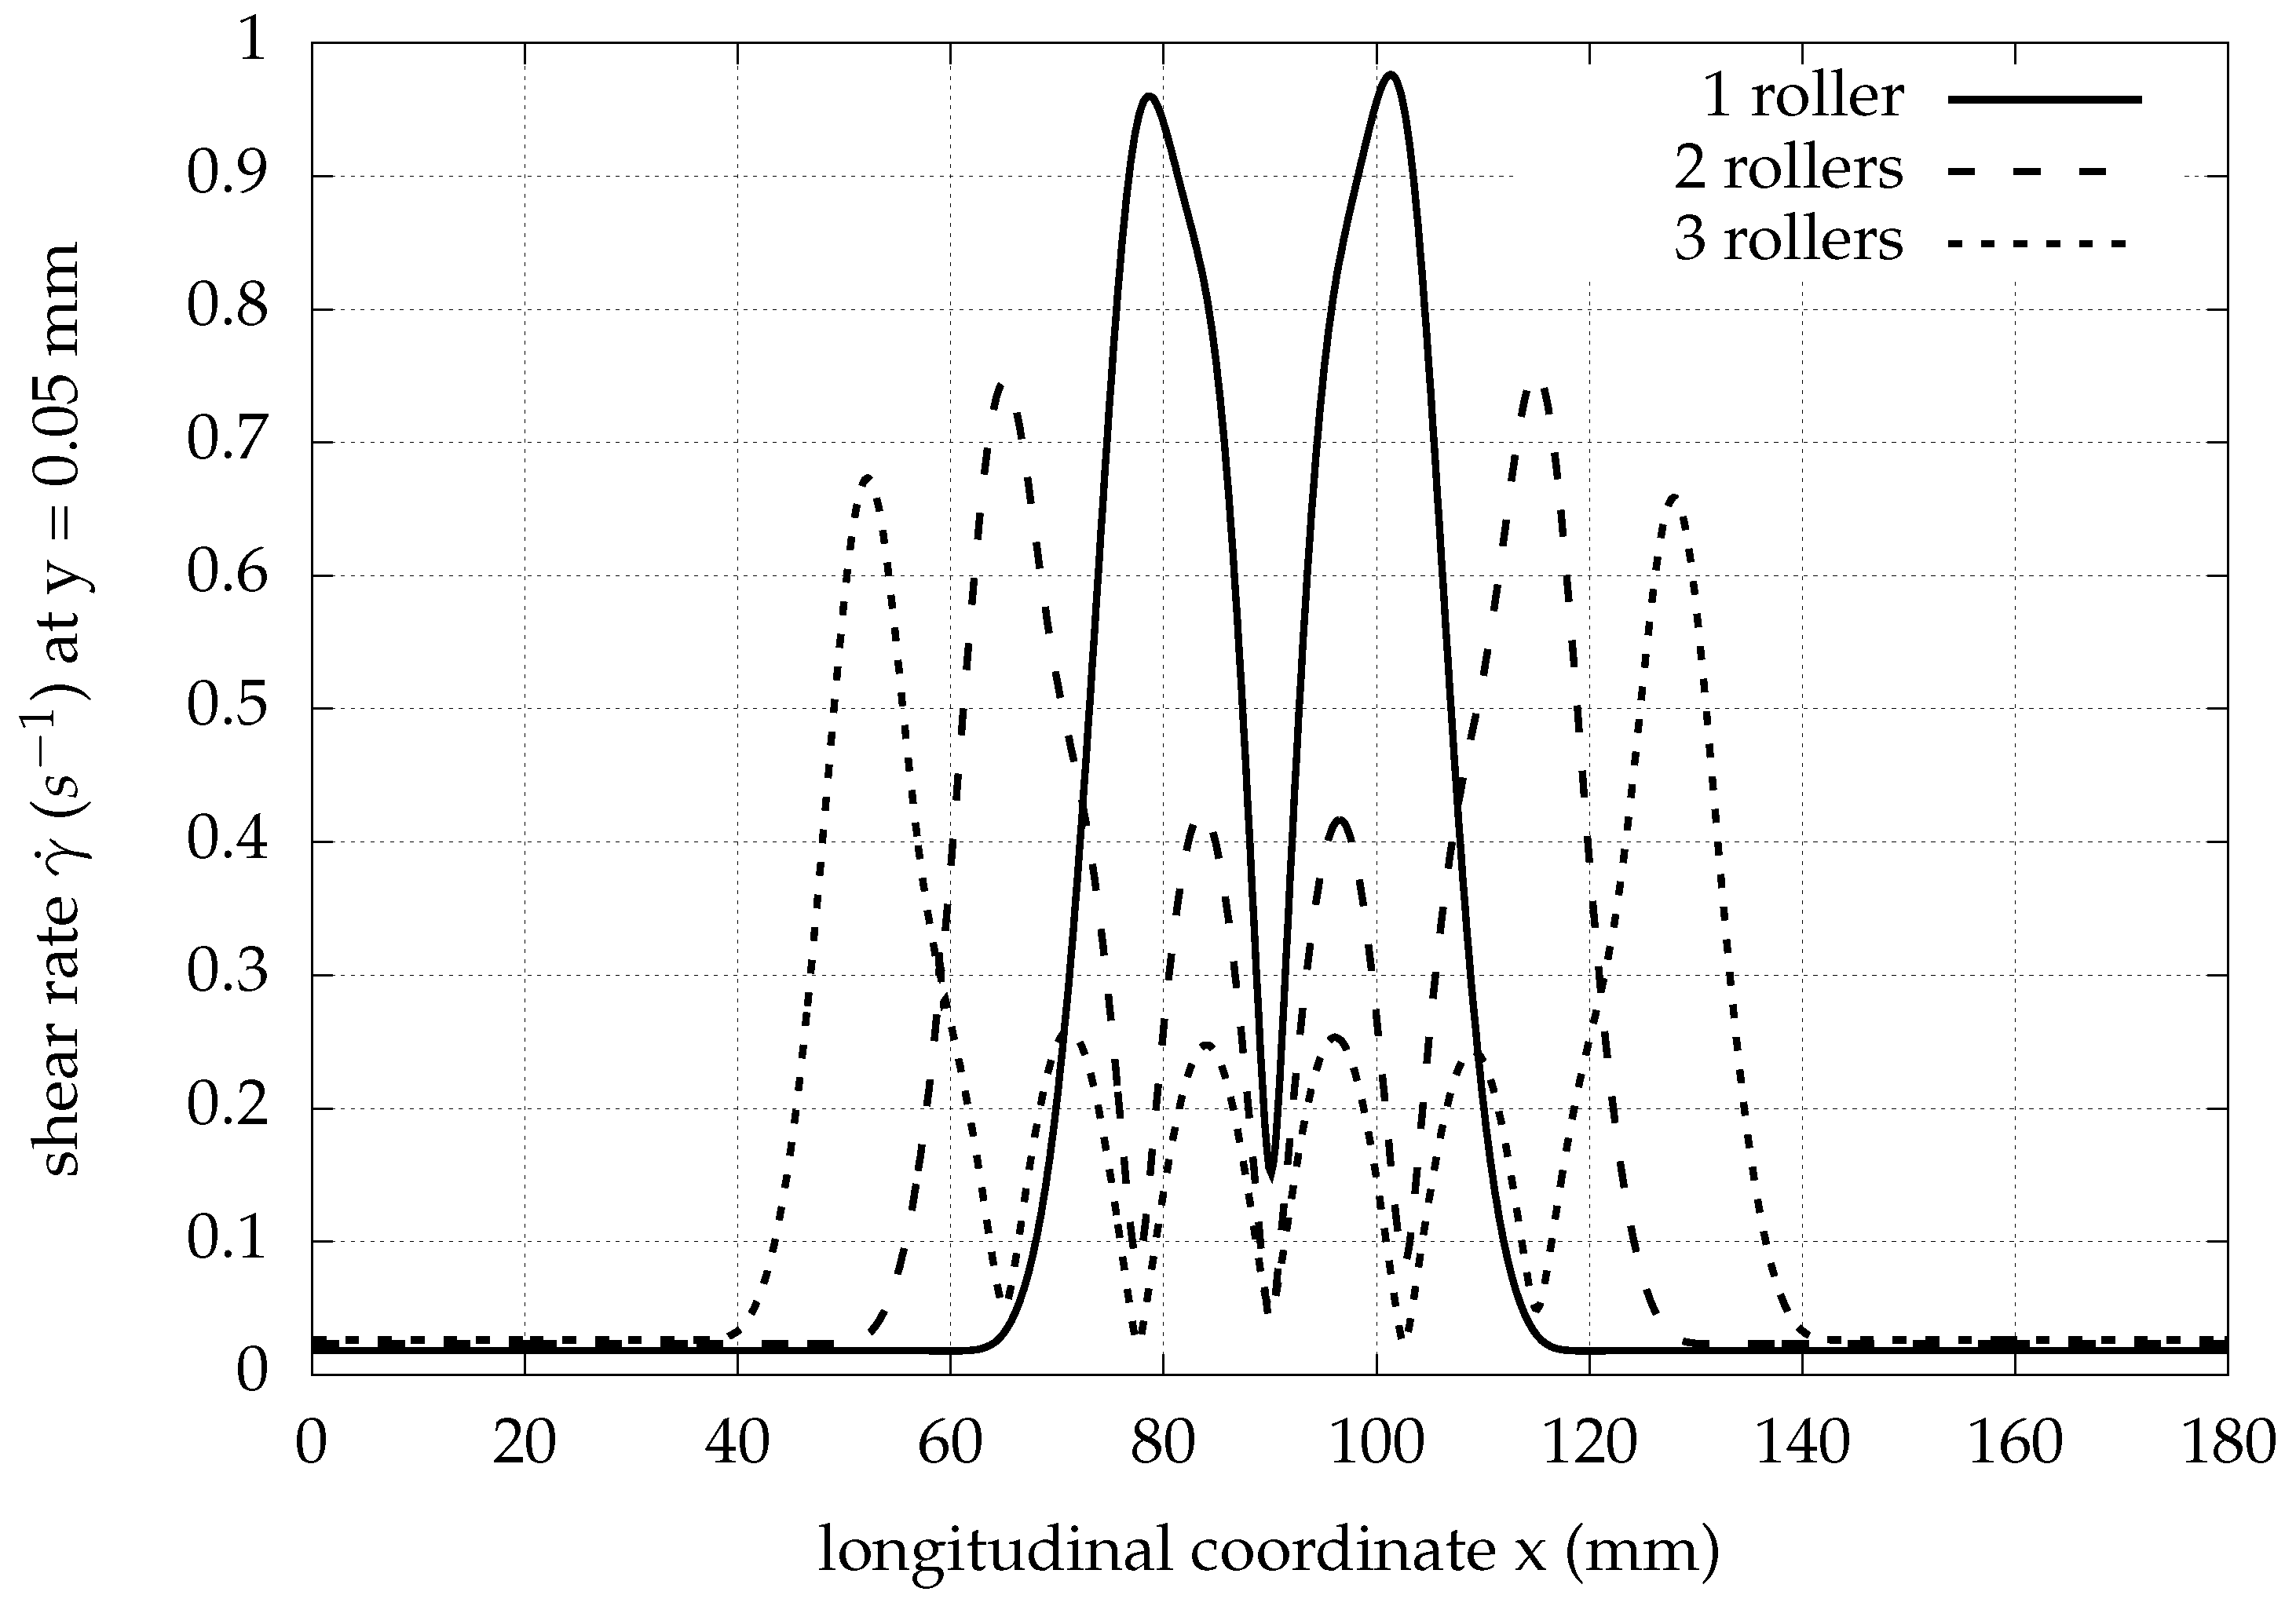
Pressure reaches its lower value right before the roller train and its higher value right downstream of it, as depicted in Figure 17. Moreover, the pressure function under the rollers is monotonous, and its maxima and minima have similar values, independent of the roller number. Maximum shear rate values near the axis of symmetry are considerably higher for one roller () than for more than one ( for two and for three), as shown in Figure 18.
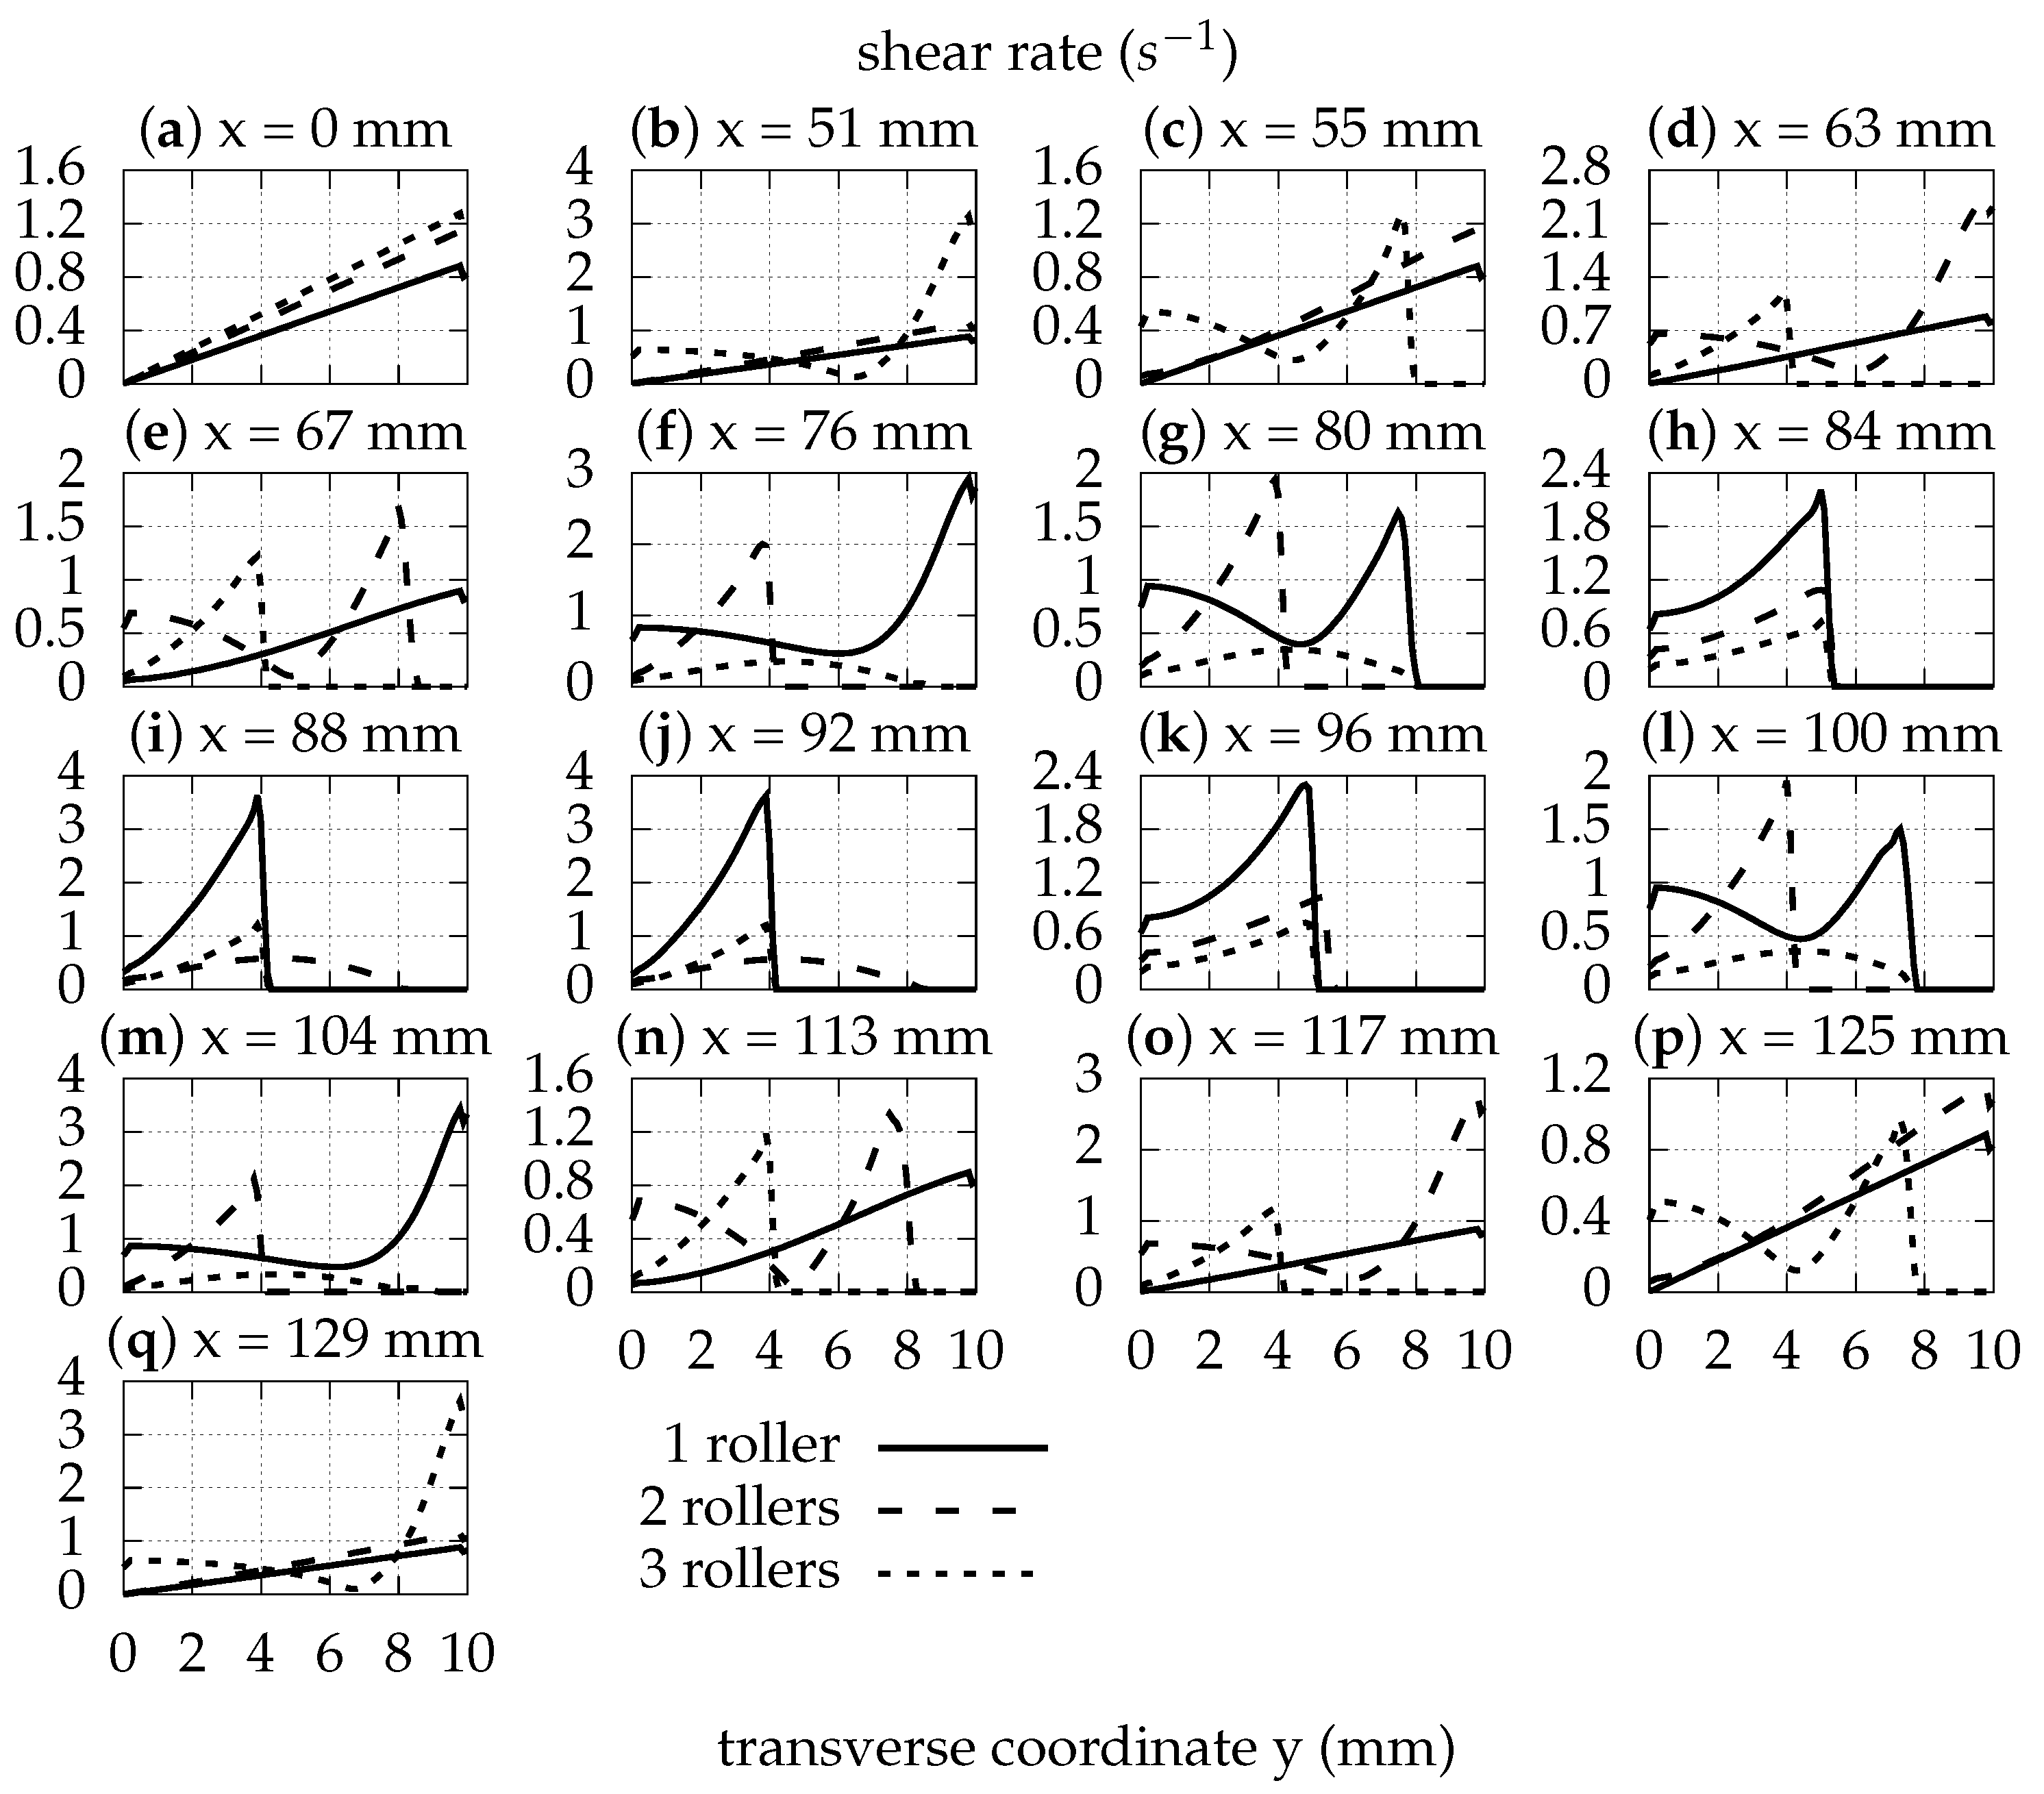
The shear rate profiles for a series of vertical sections are given in Figure 19.
Away from the rollers’ positions (e.g., for or for ), the shear rate increases linearly as a function of the y-coordinate. Generally, the shear rate reaches its maximum value close to the wall, or close to the roller for streamwise positions, where a roller exists.
As tabulated in Table 2, transport efficiency increases sublinearly as the number of consecutive rollers rises.
3.5. Peristaltic Pump Characteristics
We simulated the flow of a parabolic inlet velocity profile (Equation (10)) through the pump geometry with one roller. Therefore, we determined the pressure rise induced by the presence of the roller wave.
For a higher inlet flow volume rate, the pressure rise decreases, as Figure 20 demonstrates. The pressure drop through the elastic channel beside the roller is reduced as the inlet fluid volume rate decreases. The pressure rise along the roller length increases dramatically as the inlet fluid volume rate decreases.
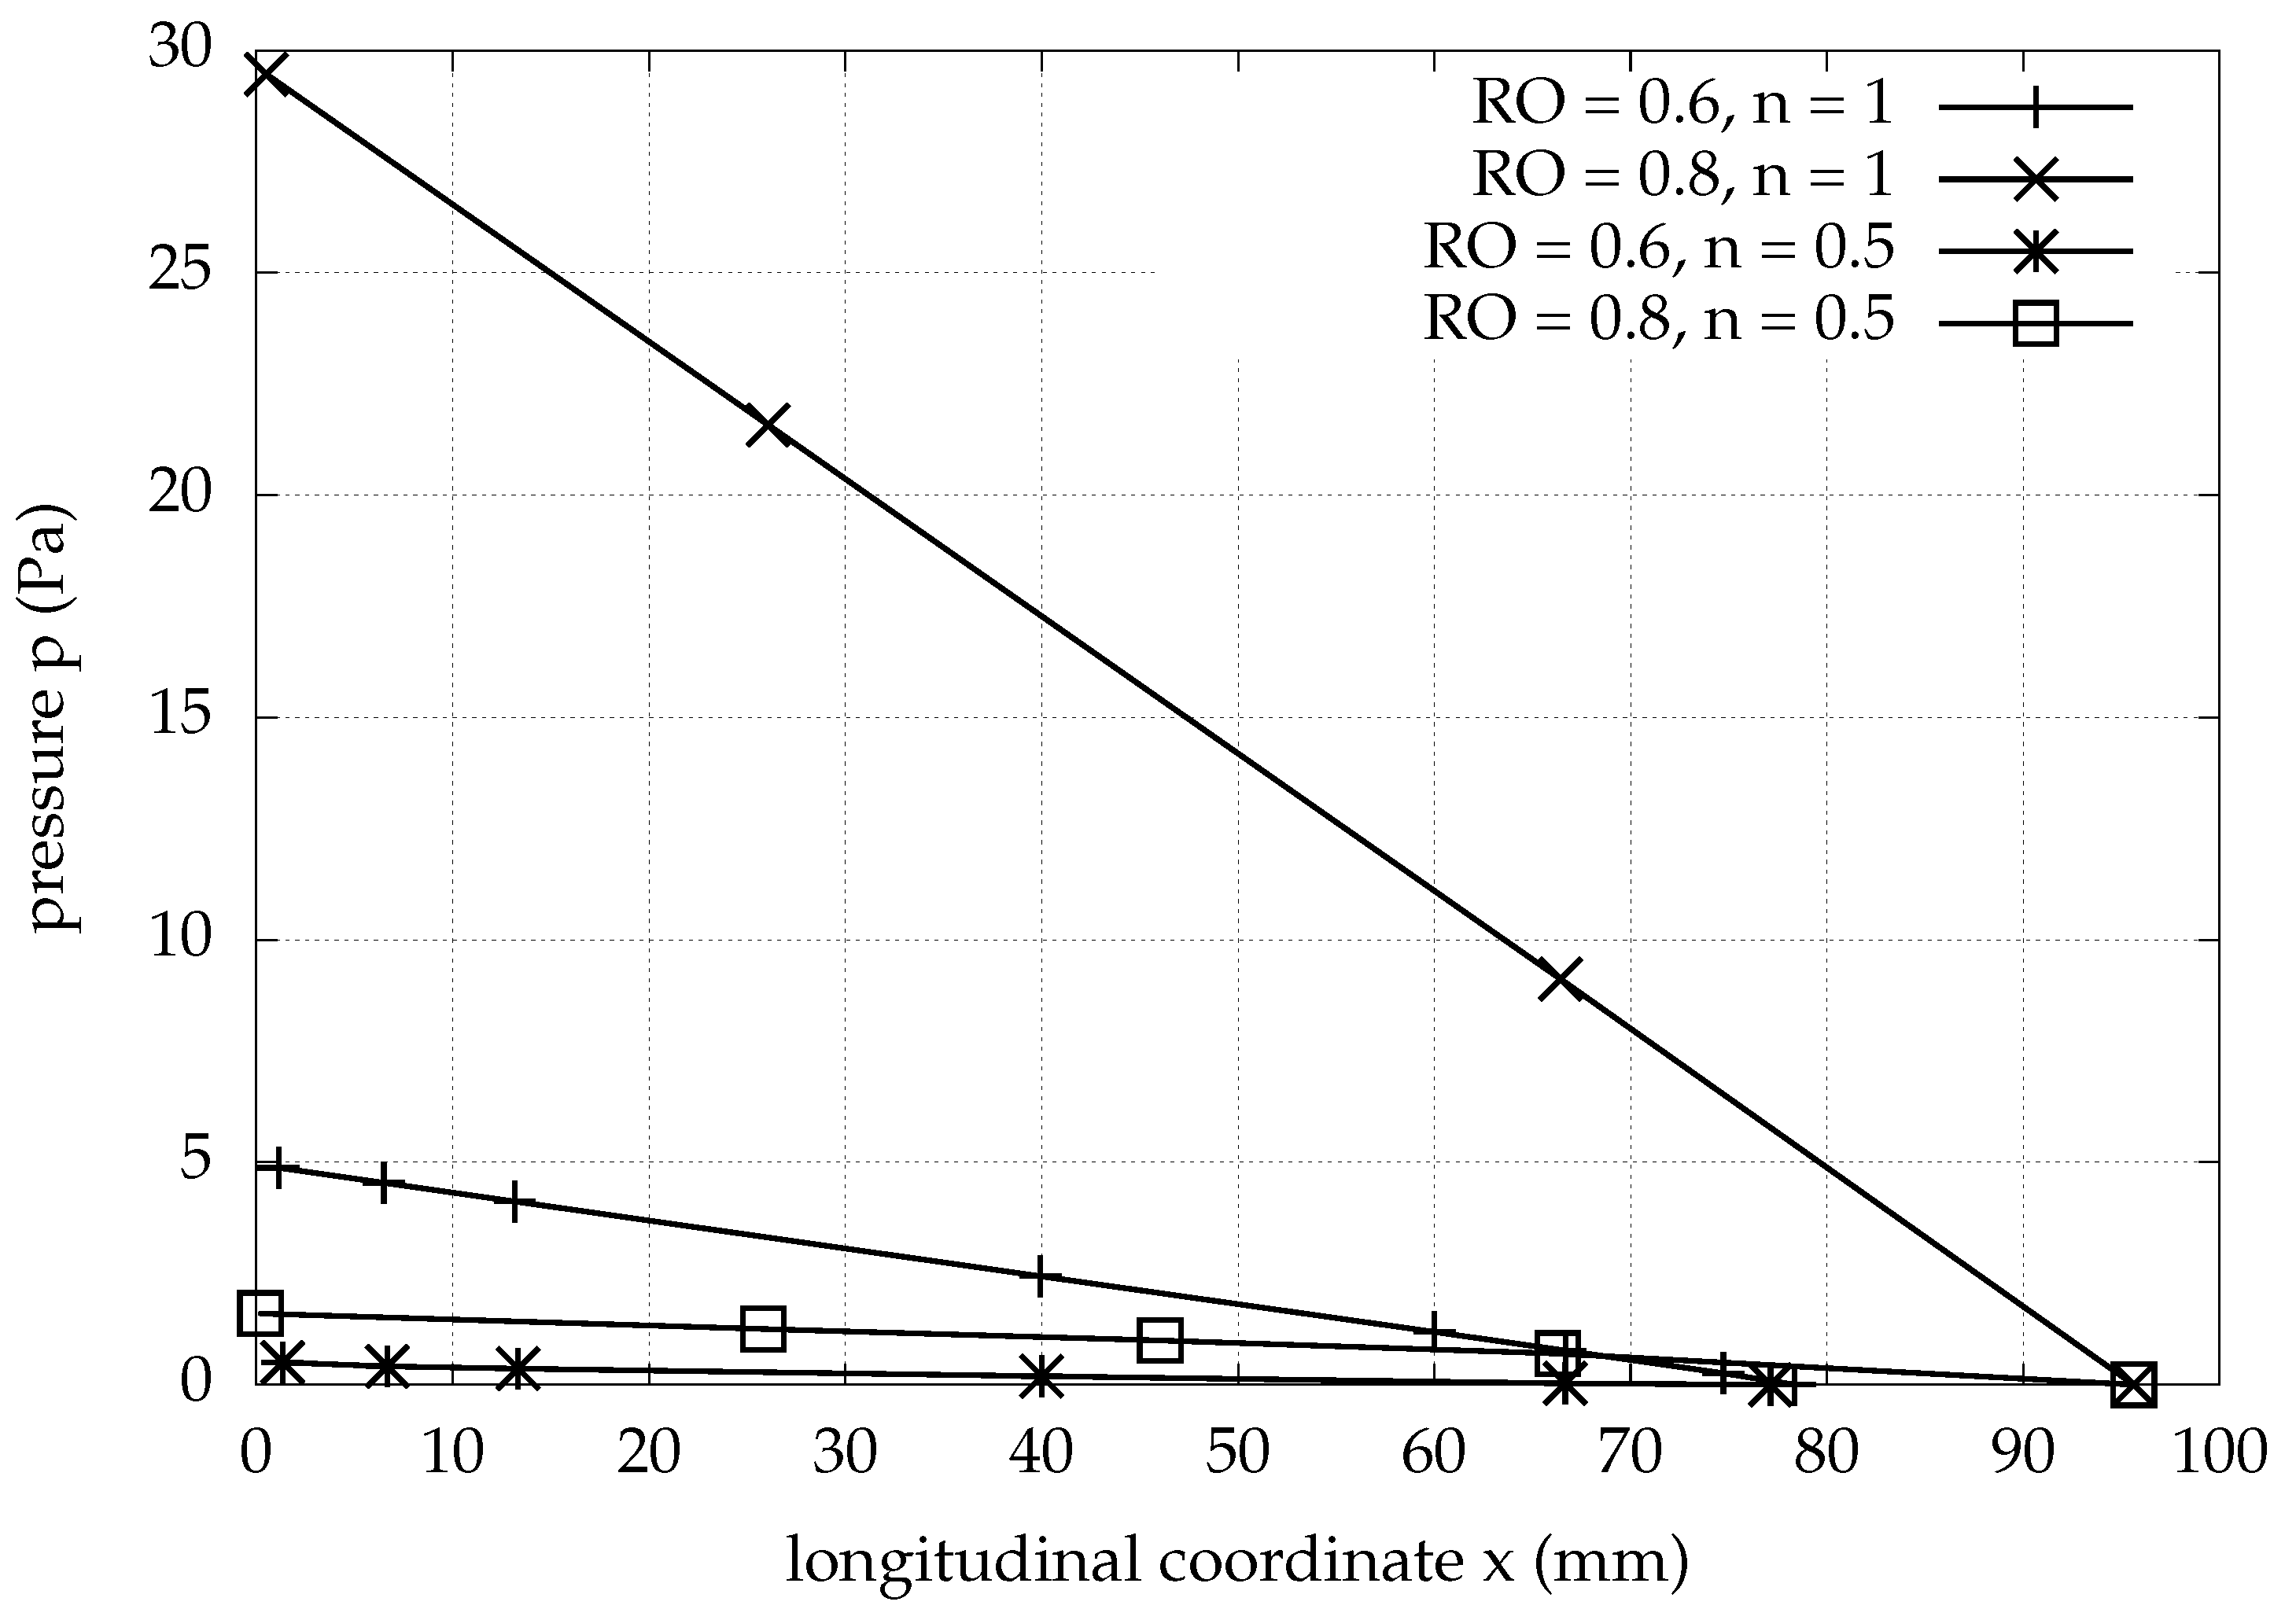
The characteristic line of the peristaltic pump is given in Figure 21 and Figure 22 for the case of one roller, a pump with length mm and roller speed mm/s and for two different values of the roller gap and of the Bird–Carreau power index.
The characteristics are approximately straight lines with negative inclination. The slopes of the characteristics are negatively correlated with the relative occlusion. The impact of the roller penetration on the flow becomes more noticeable when it is deeper, namely, when the half-gap is smaller. For a constant volume flux, the maximum pressure that develops on the flow is approximately 6 times higher for than for . Moreover, for a constant pressure, the relative occlusion and the flow volume rate potentially observed, are positively related.
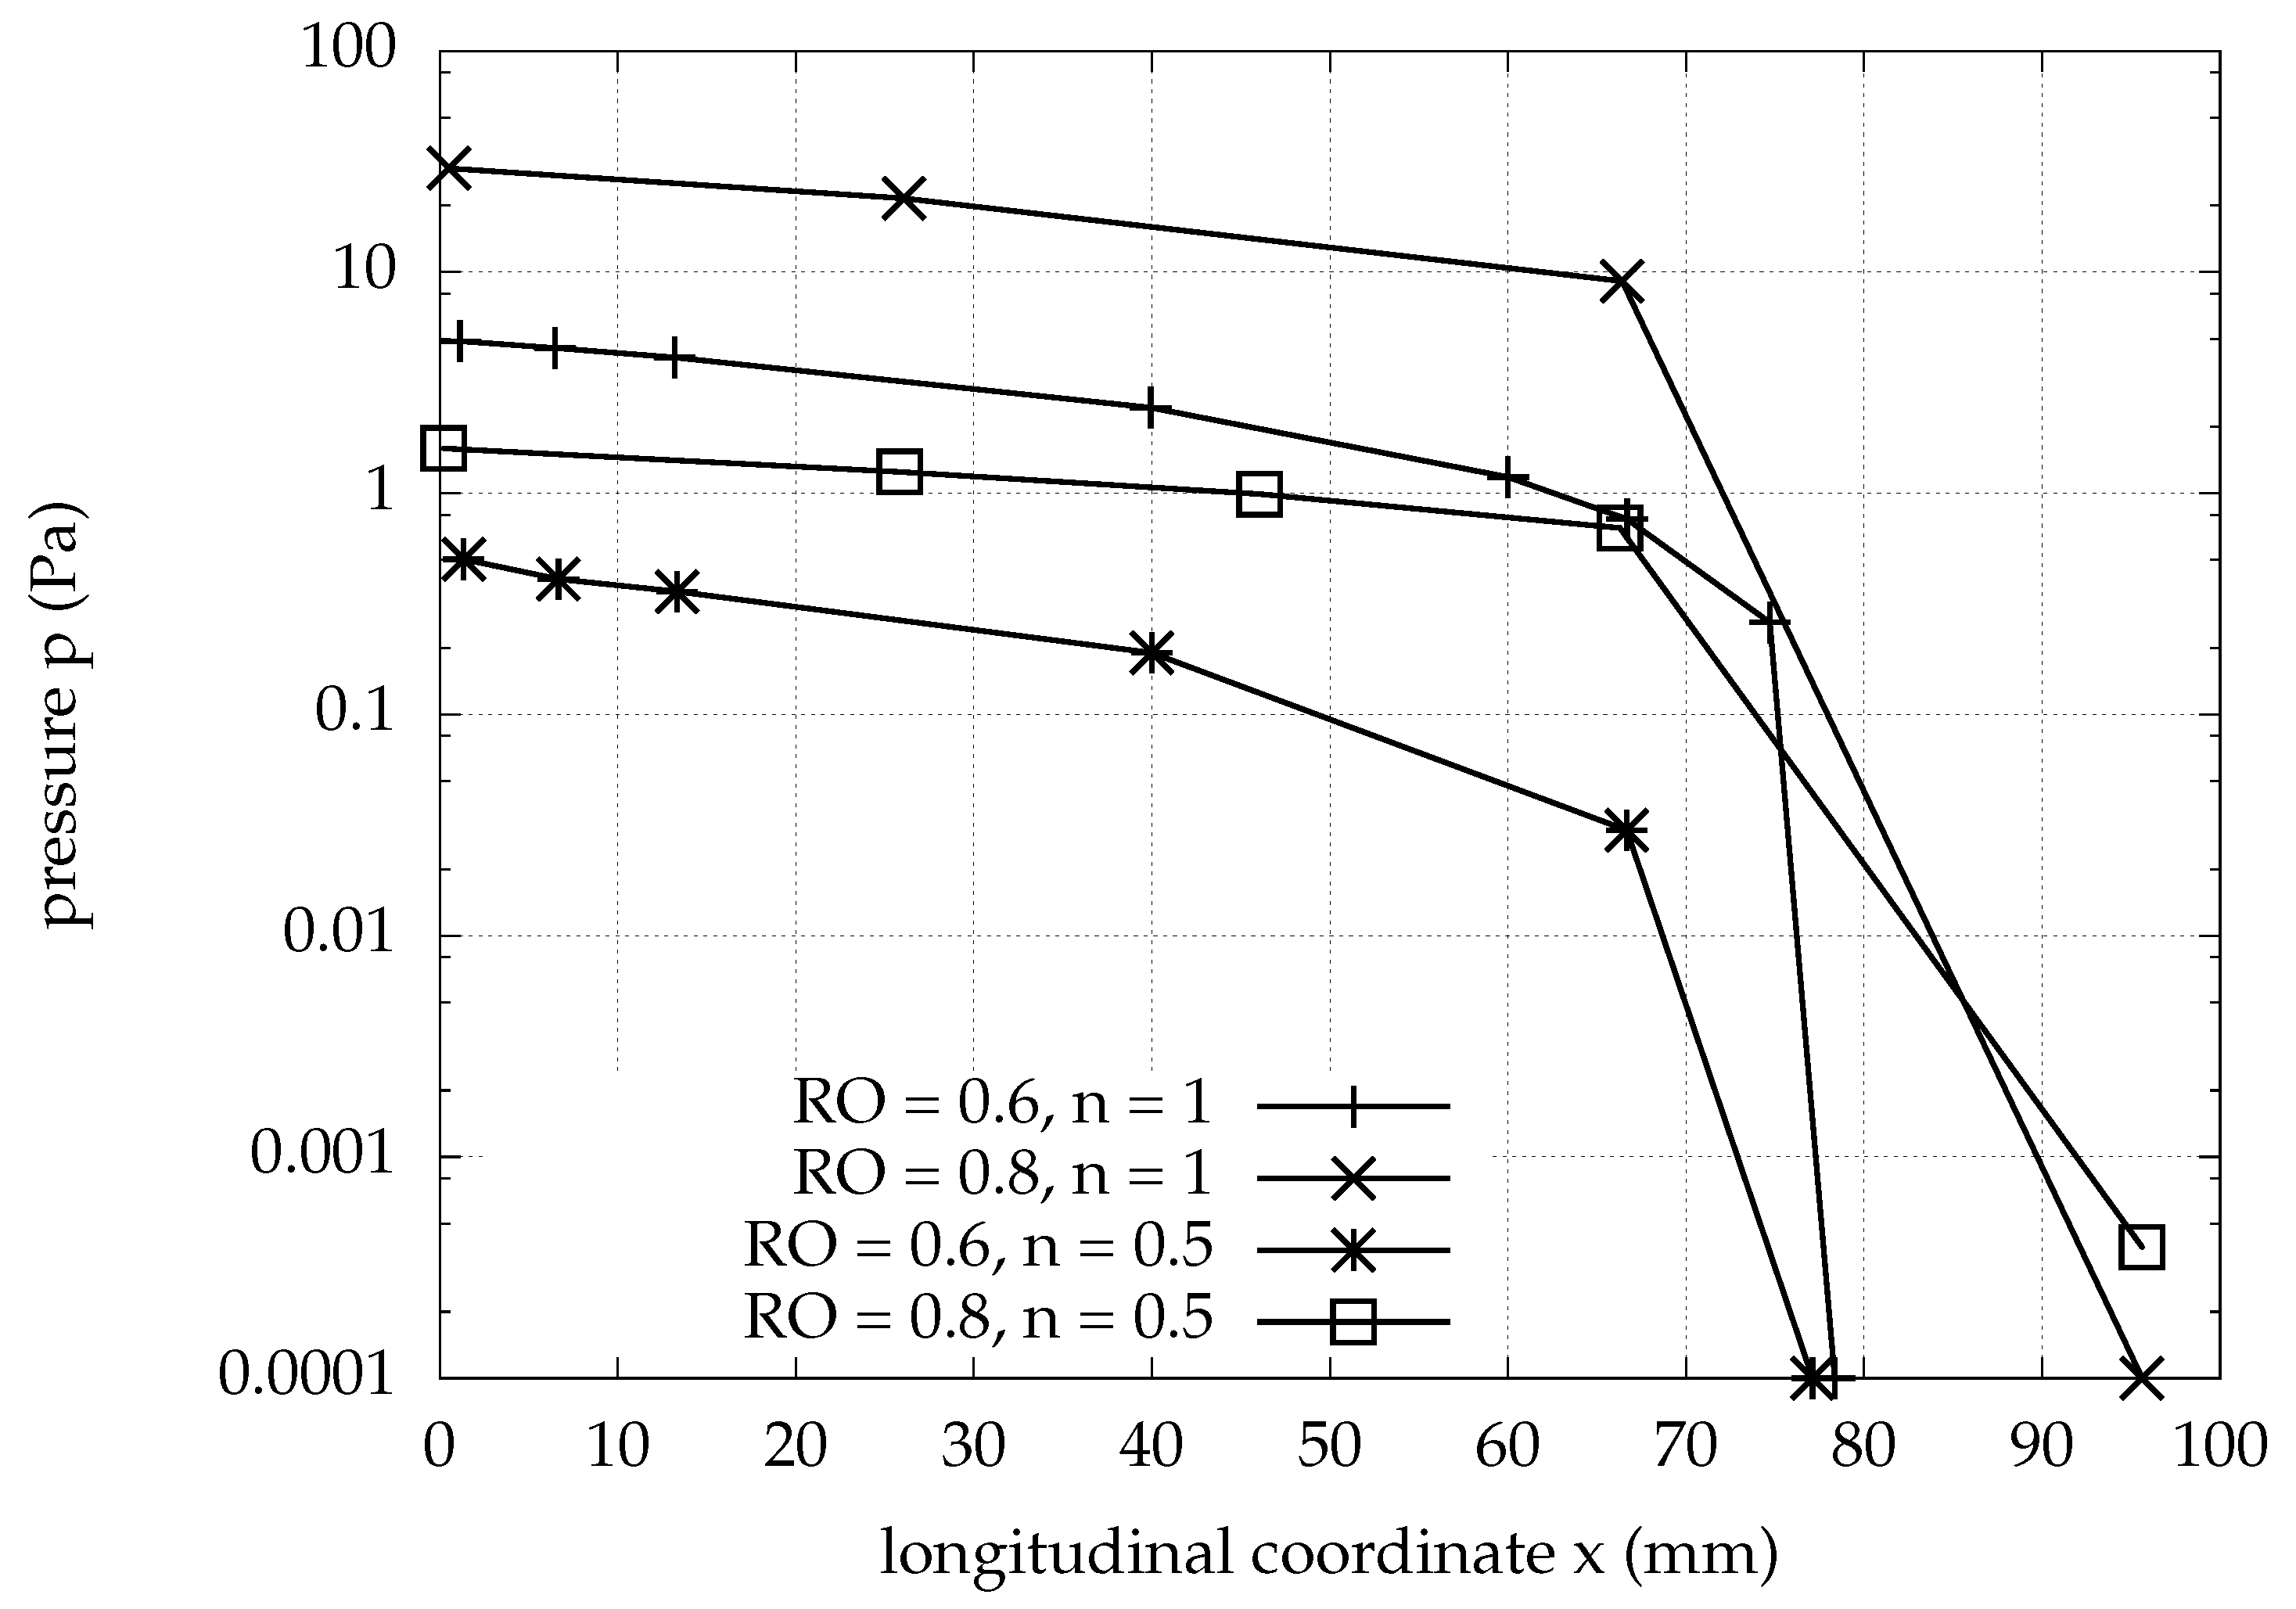
Shear-thinning fluids also exhibit approximately straight-line characteristics with negative inclination. The pressure rise potential of Non-Newtonian fluids with a Bird–Carreau power index is over an order of magnitude lower than that of the Newtonian ones. Additionally, the fluid volume rate potential decreases for shear-thinning fluids. For a non-Newtonian index , the maximum fluid volume rate that can be pumped decreases by around one-fifth in comparison to that of the Newtonian fluids.
4. Conclusions
In the present work, we studied the peristaltic flow with circular rollers for straight roller pumps. Using various values for relative occlusion , roller speed c, Bird–Carreau shear-thinning behavior expressed by n, number of rollers and length of the deformable tube L, simulations with the curvilinear immersed boundary method were performed.
Some of our results were compared with existing computational results [12] obtained with the OpenFOAM body-fitted algorithm [31]. The validation of the curvilinear immersed boundary method for non-Newtonian fluids has a satisfying outcome, as good agreement is observed with a similar depiction of the trends of the flow versus the parameters.
Relative occlusion and the number of consecutive rollers are found to be strongly positively correlated with the transport efficiency. The Bird–Carreau shear-thinning exponent has a very slight effect, and roller speed is independent of transport efficiency. For a greater length of the deformable tube, transport efficiency decreases. Below the critical value for the relative occlusion or for the number of rollers or above a threshold for the length of the pump, backflow appears under the roller and near the longitudinal centerline. Increasing the number of identical consecutive rollers causes a lower upper bound for the shear rate, close to the longitudinal centerline, thus suggesting that multi-roller pumps are more appropriate for the extracorporeal circulation of biological, cell-containing fluids such as blood.
Peristaltic characteristics were computed for combinations of values of the input parameters. Pumping capability decreases linearly as the flow volume rate of the pumped fluid increases. The pressure rise strongly depends on relative occlusion. For shear-thinning fluids, the inclination of the characteristic rises drastically, meaning that the pumping potential decreases significantly. As an example, for a fluid with a power index , the pressure potential decreases by an order of magnitude compared to that of a Newtonian fluid. The maximum volumetric flow rate that can be pumped also decreases for shear-thinning fluids.
Author Contributions
I.M., C.M. and S.T. provided equal contributions to this research paper. All authors have read and agreed to the published version of the manuscript.
Funding
This research was co-funded by the European Union and Greek national funds through the Operational Program Competitiveness, Entrepreneurship and Innovation, under the name RESEARCH-CREATE-INNOVATE (project code: T1EDK-01366, MIS: 5032787).
Data Availability Statement
No new data were created or analyzed in this study. Data sharing is not applicable to this article.
Acknowledgments
We acknowledge Kyriakos Giannakoglou at the National Technical University of Athens (NTUA) for kindly granting us the opportunity and support to perform the simulations on the NTUA Parallel CFD and Optimization Unit cluster.
Conflicts of Interest
The authors declare no conflict of interest.
References
- Boron, W.F.; Boulpaep, E.L. Medical Physiology; Elsevier: Amsterdam, The Netherlands, 2016. [Google Scholar]
- Gravlee, G.P.; Davis, R.F.; Hammon, J.; Kussman, B. Cardiopulmonary Bypass and Mechanical Support: Principles And Practice, 4th ed.; Wolters Kluwer-Lippincott Williams & Wilkins: Philadelphia, PA, USA, 2015. [Google Scholar]
- Latham, T.W. Fluid Motion in a Peristaltic Pump. Master’s Thesis, Massachusetts Institute of Technology, Cambridge, MA, USA, 1966. [Google Scholar]
- Jaffrin, M.Y.; Shapiro, A.H. Peristaltic Pumping. Annu. Rev. Fluid Mech. 1971, 3, 13–37. [Google Scholar] [CrossRef]
- Shapiro, A.H.; Jaffrin, M.Y.; Weinberg, S.L. Peristaltic pumping with long wavelengths at low Reynolds number. J. Fluid Mech. 1969, 37, 799–825. [Google Scholar] [CrossRef]
- Roy, R.; Rios, F.; Riahi, D. Mathematical Models for Flow of Chyme during Gastrointestinal Endoscopy. Appl. Math. 2011, 2, 600–607. [Google Scholar] [CrossRef] [Green Version]
- Srivastava, L.M.; Srivastava, V.P. Peristaltic Transport of a non-Newtonian Fluid: Applications to Vas Deferens and Small Intestine. Ann. Biomed. Eng. 1985, 13, 137–153. [Google Scholar] [CrossRef] [PubMed]
- Weinberg, S.L.; Eckstein, E.C.; Shapiro, A.H. An experimental study of peristaltic pumping. J. Fluid Mech. 1971, 49, 461–479. [Google Scholar] [CrossRef]
- Nahar, S. Steady and Unsteady Flow Characteristics of Non-Newtonian Fluids in Deformed Elastic Tubes. Ph.D. Thesis, Swiss Federal Institute of Technology (ETH), Zürich, Switzerland, 2012. [Google Scholar]
- Tsui, Y.Y.; Guo, D.C.; Chen, S.H.; Lin, S.W. Pumping Flow in a Channel with a Peristaltic Wall. ASME J. Fluids Eng. 2013, 136, 1–9. [Google Scholar] [CrossRef]
- Tatsumi, K.; Matsunaga, Y.; Miwa, Y.; Nakabe, K. Numerical study on fluid-flow characteristics of peristaltic pump. Prog. Comput. Fluid Dyn. 2009, 9, 176–182. [Google Scholar] [CrossRef]
- Al-Habahbeh, A.A. Simulations of Newtonian and Non-Newtonian Flows in Deformable Tubes. Ph.D. Thesis, Michigan Technology University, Houghton, MI, USA, 2013. [Google Scholar]
- Alokaily, S.; Feigl, K.; Tanner, F.X.; Windhab, E.J. Numerical Simulations of the Transport of Newtonian and Non-newtonian Fluids via Peristaltic Motion. Appl. Rheol. 2018, 28, 1–15. [Google Scholar]
- Zhou, X.; Liang, X.; Zhao, G.; Su, Y.; Wang, Y. A New Computational Fluid Dynamics Method for In-Depth Investigation of Flow Dynamics in Roller Pump Systems. Artif. Organs 2014, 38, 106–117. [Google Scholar] [CrossRef] [PubMed]
- Manopoulos, C.; Savva, G.; Tsoukalis, A.; Vasileiou, G.; Rogkas, N.; Spitas, V.; Tsangaris, S. Optimal Design in Roller Pump System Applications for Linear Infusion. Computation 2020, 8, 35. [Google Scholar] [CrossRef]
- Peskin, C.S. Flow patterns around heart valves: A numerical method. J. Comput. Phys. 1972, 10, 252–271. [Google Scholar] [CrossRef]
- Sotiropoulos, F.; Yang, X. Immersed boundary methods for simulating fluid–structure interaction. Prog. Aerosp. Sci. 2014, 65, 1–21. [Google Scholar] [CrossRef]
- Ge, L.; Sotiropoulos, F. A numerical method for solving the 3D unsteady incompressible Navier—Stokes equations in curvilinear domains with complex immersed boundaries. J. Comput. Phys. 2007, 225, 1782–1809. [Google Scholar] [CrossRef] [PubMed] [Green Version]
- Rivlin, R.S.; Ericksen, J.L. Stress-Deformation Relations for Isotropic Materials. J. Ration. Mech. Anal. 1955, 4, 323–425. [Google Scholar] [CrossRef]
- Nahar, S.; Jeelani, S.A.K.; Windhab, E.J. Steady and Unsteady Flow Characteristics of non-Newtonian Fluids in Deformed Elastic Tubes. In Proceedings of the 7th International Symposium on Ultrasonic Doppler Methods for Fluid Mechanics and Fluid Engineering, Gothenburg, Sweden, 7–9 April 2010; Wiklund, J., Levenstam Bragd, E., Manneville, S., Eds.; Chalmers University of Technology: Gothenburg, Sweden, 2010; pp. 61–64. [Google Scholar]
- Carreau, P.J. Rheological Equations from Molecular Network Theories. Ph.D. Thesis, University of Winsconsin, Madison, WI, USA, 1968. [Google Scholar]
- Bird, R.; Armstrong, R.; Hassager, O. Dynamics of Polymeric Liquids, Volume 1: Fluid Mechanics, 2nd ed.; Wiley: Hoboken, NJ, USA, 1987. [Google Scholar]
- Harlow, F.H.; Welch, J.E. Numerical Calculation of Time-Dependent Viscous Incompressible Flow of Fluid with Free Surface. Phys. Fluids 1965, 8, 2182–2189. [Google Scholar] [CrossRef]
- Gilmanov, A.; Sotiropoulos, F. A hybrid Cartesian/immersed boundary method for simulating flows with 3D, geometrically complex, moving bodies. J. Comput. Phys. 2005, 207, 457–492. [Google Scholar] [CrossRef]
- Patankar, S.V. Numerical Heat Transfer and Fluid Flow; Series on Computational Methods in Mechanics and Thermal Science; Hemisphere Publishing Corporation: Oxfordshire, UK, 1980. [Google Scholar]
- Kang, S.; Sotiropoulos, F. Numerical modeling of 3D turbulent free surface flow in natural waterways. Adv. Water Resour. 2012, 40, 23–36. [Google Scholar] [CrossRef]
- Crank, J.; Nicholson, P. A practical method for numerical evaluation of solutions of partial differential equations of the heat-conduction type. Math. Proc. Camb. Philos. Soc. 1947, 43, 50–67. [Google Scholar] [CrossRef]
- Chorin, A.J. A numerical method for solving incompressible viscous flow problems. J. Comput. Phys. 1967, 2, 12–26. [Google Scholar] [CrossRef]
- Ferziger, J.H.; Perić, M. Computational Methods for Fluid Dynamics, 2nd ed.; Springer: Berlin, Germany, 1999. [Google Scholar]
- VFS-WIND Virtual Flow Simulator. Available online: https://safl-cfd-lab.github.io/VFS-Wind/ (accessed on 10 January 2021).
- Chen, G.; Xiong, Q.; Morris, P.J.; Paterson, E.G.; Sergeev, A.; Wang, Y.C. OpenFOAM for computational fluid dynamics. Not. Am. Math. Soc. 2014, 61, 354–363. [Google Scholar] [CrossRef]
Figure 1.
Geometry of the two-dimensional computational domain for the peristaltic pump. Mirroring this scheme with respect to the x-axis and extruding with respect to the z-axis provides the geometry of the full pump.
Figure 1.
Geometry of the two-dimensional computational domain for the peristaltic pump. Mirroring this scheme with respect to the x-axis and extruding with respect to the z-axis provides the geometry of the full pump.

Figure 2.
Longitudinal velocity near the central axis of the pump ( mm) for various values of and c, and one roller. Comparison with existing results (A: Data from [12]) is presented.
Figure 2.
Longitudinal velocity near the central axis of the pump ( mm) for various values of and c, and one roller. Comparison with existing results (A: Data from [12]) is presented.

Figure 3.
Pressure near the central axis of the pump ( mm) for various values of and c, and one roller. Comparison with existing results (A: Data from [12]) is presented.
Figure 3.
Pressure near the central axis of the pump ( mm) for various values of and c, and one roller. Comparison with existing results (A: Data from [12]) is presented.

Figure 4.
Longitudinal velocity profiles at successive longitudinal positions x (a–g) for various values of and for mm/s, and one roller. Comparison with existing results (A: Data from [12]) is presented.
Figure 4.
Longitudinal velocity profiles at successive longitudinal positions x (a–g) for various values of and for mm/s, and one roller. Comparison with existing results (A: Data from [12]) is presented.

Figure 5.
Shear rate near the central axis of the pump ( mm) for various values of c and for , and one roller. Comparison with existing results (A: Data from [12]) is presented.
Figure 5.
Shear rate near the central axis of the pump ( mm) for various values of c and for , and one roller. Comparison with existing results (A: Data from [12]) is presented.

Figure 6.
Longitudinal velocity near the central axis of the pump ( mm) for Newtonian and non-Newtonian fluids, mm/s, and one roller. Comparison with existing results (A: Data from [12]) is presented.
Figure 6.
Longitudinal velocity near the central axis of the pump ( mm) for Newtonian and non-Newtonian fluids, mm/s, and one roller. Comparison with existing results (A: Data from [12]) is presented.

Figure 7.
Longitudinal velocity profile at mm for Newtonian and non-Newtonian fluids. The roller speed is mm/s, the relative occlusion is and there is one roller. Comparison with existing results (A: Data from [12]) is presented.
Figure 7.
Longitudinal velocity profile at mm for Newtonian and non-Newtonian fluids. The roller speed is mm/s, the relative occlusion is and there is one roller. Comparison with existing results (A: Data from [12]) is presented.

Figure 8.
Pressure near the central axis of the pump ( mm) for Newtonian and non-Newtonian fluids, mm/s, and one roller. Comparison with existing results (A: Data from [12]) is presented.
Figure 8.
Pressure near the central axis of the pump ( mm) for Newtonian and non-Newtonian fluids, mm/s, and one roller. Comparison with existing results (A: Data from [12]) is presented.

Figure 9.
Shear rate near the central axis of the pump ( mm) for Newtonian and non-Newtonian fluids. The roller speed is mm/s, the relative occlusion is and there is one roller. Comparison with existing results (A: Data from [12]) is presented.
Figure 9.
Shear rate near the central axis of the pump ( mm) for Newtonian and non-Newtonian fluids. The roller speed is mm/s, the relative occlusion is and there is one roller. Comparison with existing results (A: Data from [12]) is presented.

Figure 10.
Shear rate profile at mm for Newtonian and non-Newtonian fluids. The roller speed is mm/s, the relative occlusion is and there is one roller. Comparison with existing results (A: Data from [12]) is presented.
Figure 10.
Shear rate profile at mm for Newtonian and non-Newtonian fluids. The roller speed is mm/s, the relative occlusion is and there is one roller. Comparison with existing results (A: Data from [12]) is presented.

Figure 11.
Velocity vectors for 1 roller, mm/s, mm, and .

Figure 12.
Velocity vectors for 2 rollers, mm/s, mm, and .

Figure 13.
Velocity vectors for 3 rollers, mm/s, mm, and .

Figure 14.
Longitudinal velocity near the central axis of the pump ( mm) for various numbers of rollers. The roller speed is mm/s, the relative occlusion is and the Bird–Carreau power index is .
Figure 14.
Longitudinal velocity near the central axis of the pump ( mm) for various numbers of rollers. The roller speed is mm/s, the relative occlusion is and the Bird–Carreau power index is .

Figure 15.
Axial velocity u profiles at successive longitudinal positions x (a–j) for various numbers of rollers, mm/s, and .
Figure 15.
Axial velocity u profiles at successive longitudinal positions x (a–j) for various numbers of rollers, mm/s, and .

Figure 16.
Vertical velocity profiles at successive longitudinal positions x (a–j) for various numbers of rollers, mm/s, and .
Figure 16.
Vertical velocity profiles at successive longitudinal positions x (a–j) for various numbers of rollers, mm/s, and .

Figure 17.
Pressure near the central axis of the pump ( mm) for various numbers of rollers, mm/s, and .
Figure 17.
Pressure near the central axis of the pump ( mm) for various numbers of rollers, mm/s, and .

Figure 18.
Shear rate near the central axis of the pump ( mm) for various numbers of rollers. The roller speed is mm/s, the relative occlusion is and the Bird–Carreau power index is .
Figure 18.
Shear rate near the central axis of the pump ( mm) for various numbers of rollers. The roller speed is mm/s, the relative occlusion is and the Bird–Carreau power index is .

Figure 19.
Shear rate profiles at successive longitudinal positions x (a–q) for various numbers of rollers. The roller speed is mm/s, the relative occlusion is and the Bird–Carreau power index is .
Figure 19.
Shear rate profiles at successive longitudinal positions x (a–q) for various numbers of rollers. The roller speed is mm/s, the relative occlusion is and the Bird–Carreau power index is .

Figure 20.
Longitudinal pressure distribution for the case of one pair roller pump, 90 mm long, mm/s, , and parabolic flow inlet profile with various values for maximum velocity.
Figure 20.
Longitudinal pressure distribution for the case of one pair roller pump, 90 mm long, mm/s, , and parabolic flow inlet profile with various values for maximum velocity.

Figure 21.
Peristalsis characteristics for roller pumps 90 mm long and one roller, moving with mm/s, using linear scale for the pressure.
Figure 21.
Peristalsis characteristics for roller pumps 90 mm long and one roller, moving with mm/s, using linear scale for the pressure.

Figure 22.
Peristalsis characteristics for roller pumps 90 mm long and one roller moving with mm/s using the logarithmic scale for pressure.
Figure 22.
Peristalsis characteristics for roller pumps 90 mm long and one roller moving with mm/s using the logarithmic scale for pressure.


Table 1.
Transport efficiency () for various pumping conditions and pump length mm. Comparison with existing results [12].
Table 1.
Transport efficiency () for various pumping conditions and pump length mm. Comparison with existing results [12].
| , | mm/s, | mm/s, | mm/s, | ||||||
|---|---|---|---|---|---|---|---|---|---|
| c(mm/s) | TE(%) | RO | TE(%) | TE(%) [12] | RO | TE(%) | n | TE(%) | TE(%) [12] |
| 2.5 | 78.8 | 0.8 | 95.6 | 95 | 0.6 | 78.8 | 1 | 78.4 | 78 |
| 5 | 78.4 | 0.6 | 78.4 | 78 | 0.2 | 28.6 | 0.75 | 77.5 | 77 |
| 10 | 78.8 | 0.2 | 28.4 | 28 | 0.5 | 77.1 | 76 | ||
Table 2.
Transport efficiency for multiple consecutive rollers, pump length mm, mm/s, and .
| Number of Rollers | 1 | 2 | 3 |
|---|---|---|---|
| TE (%) | 60 | 78 | 87 |
Publisher’s Note: MDPI stays neutral with regard to jurisdictional claims in published maps and institutional affiliations. |
© 2021 by the authors. Licensee MDPI, Basel, Switzerland. This article is an open access article distributed under the terms and conditions of the Creative Commons Attribution (CC BY) license (https://creativecommons.org/licenses/by/4.0/).
Share and Cite
MDPI and ACS Style
Moulinos, I.; Manopoulos, C.; Tsangaris, S. A Computational Analysis for Active Flow and Pressure Control Using Moving Roller Peristalsis. Computation 2021, 9, 144. https://0-doi-org.brum.beds.ac.uk/10.3390/computation9120144
AMA Style
Moulinos I, Manopoulos C, Tsangaris S. A Computational Analysis for Active Flow and Pressure Control Using Moving Roller Peristalsis. Computation. 2021; 9(12):144. https://0-doi-org.brum.beds.ac.uk/10.3390/computation9120144
Chicago/Turabian StyleMoulinos, Iosif, Christos Manopoulos, and Sokrates Tsangaris. 2021. "A Computational Analysis for Active Flow and Pressure Control Using Moving Roller Peristalsis" Computation 9, no. 12: 144. https://0-doi-org.brum.beds.ac.uk/10.3390/computation9120144
Note that from the first issue of 2016, this journal uses article numbers instead of page numbers. See further details here.