2. Materials and Methods
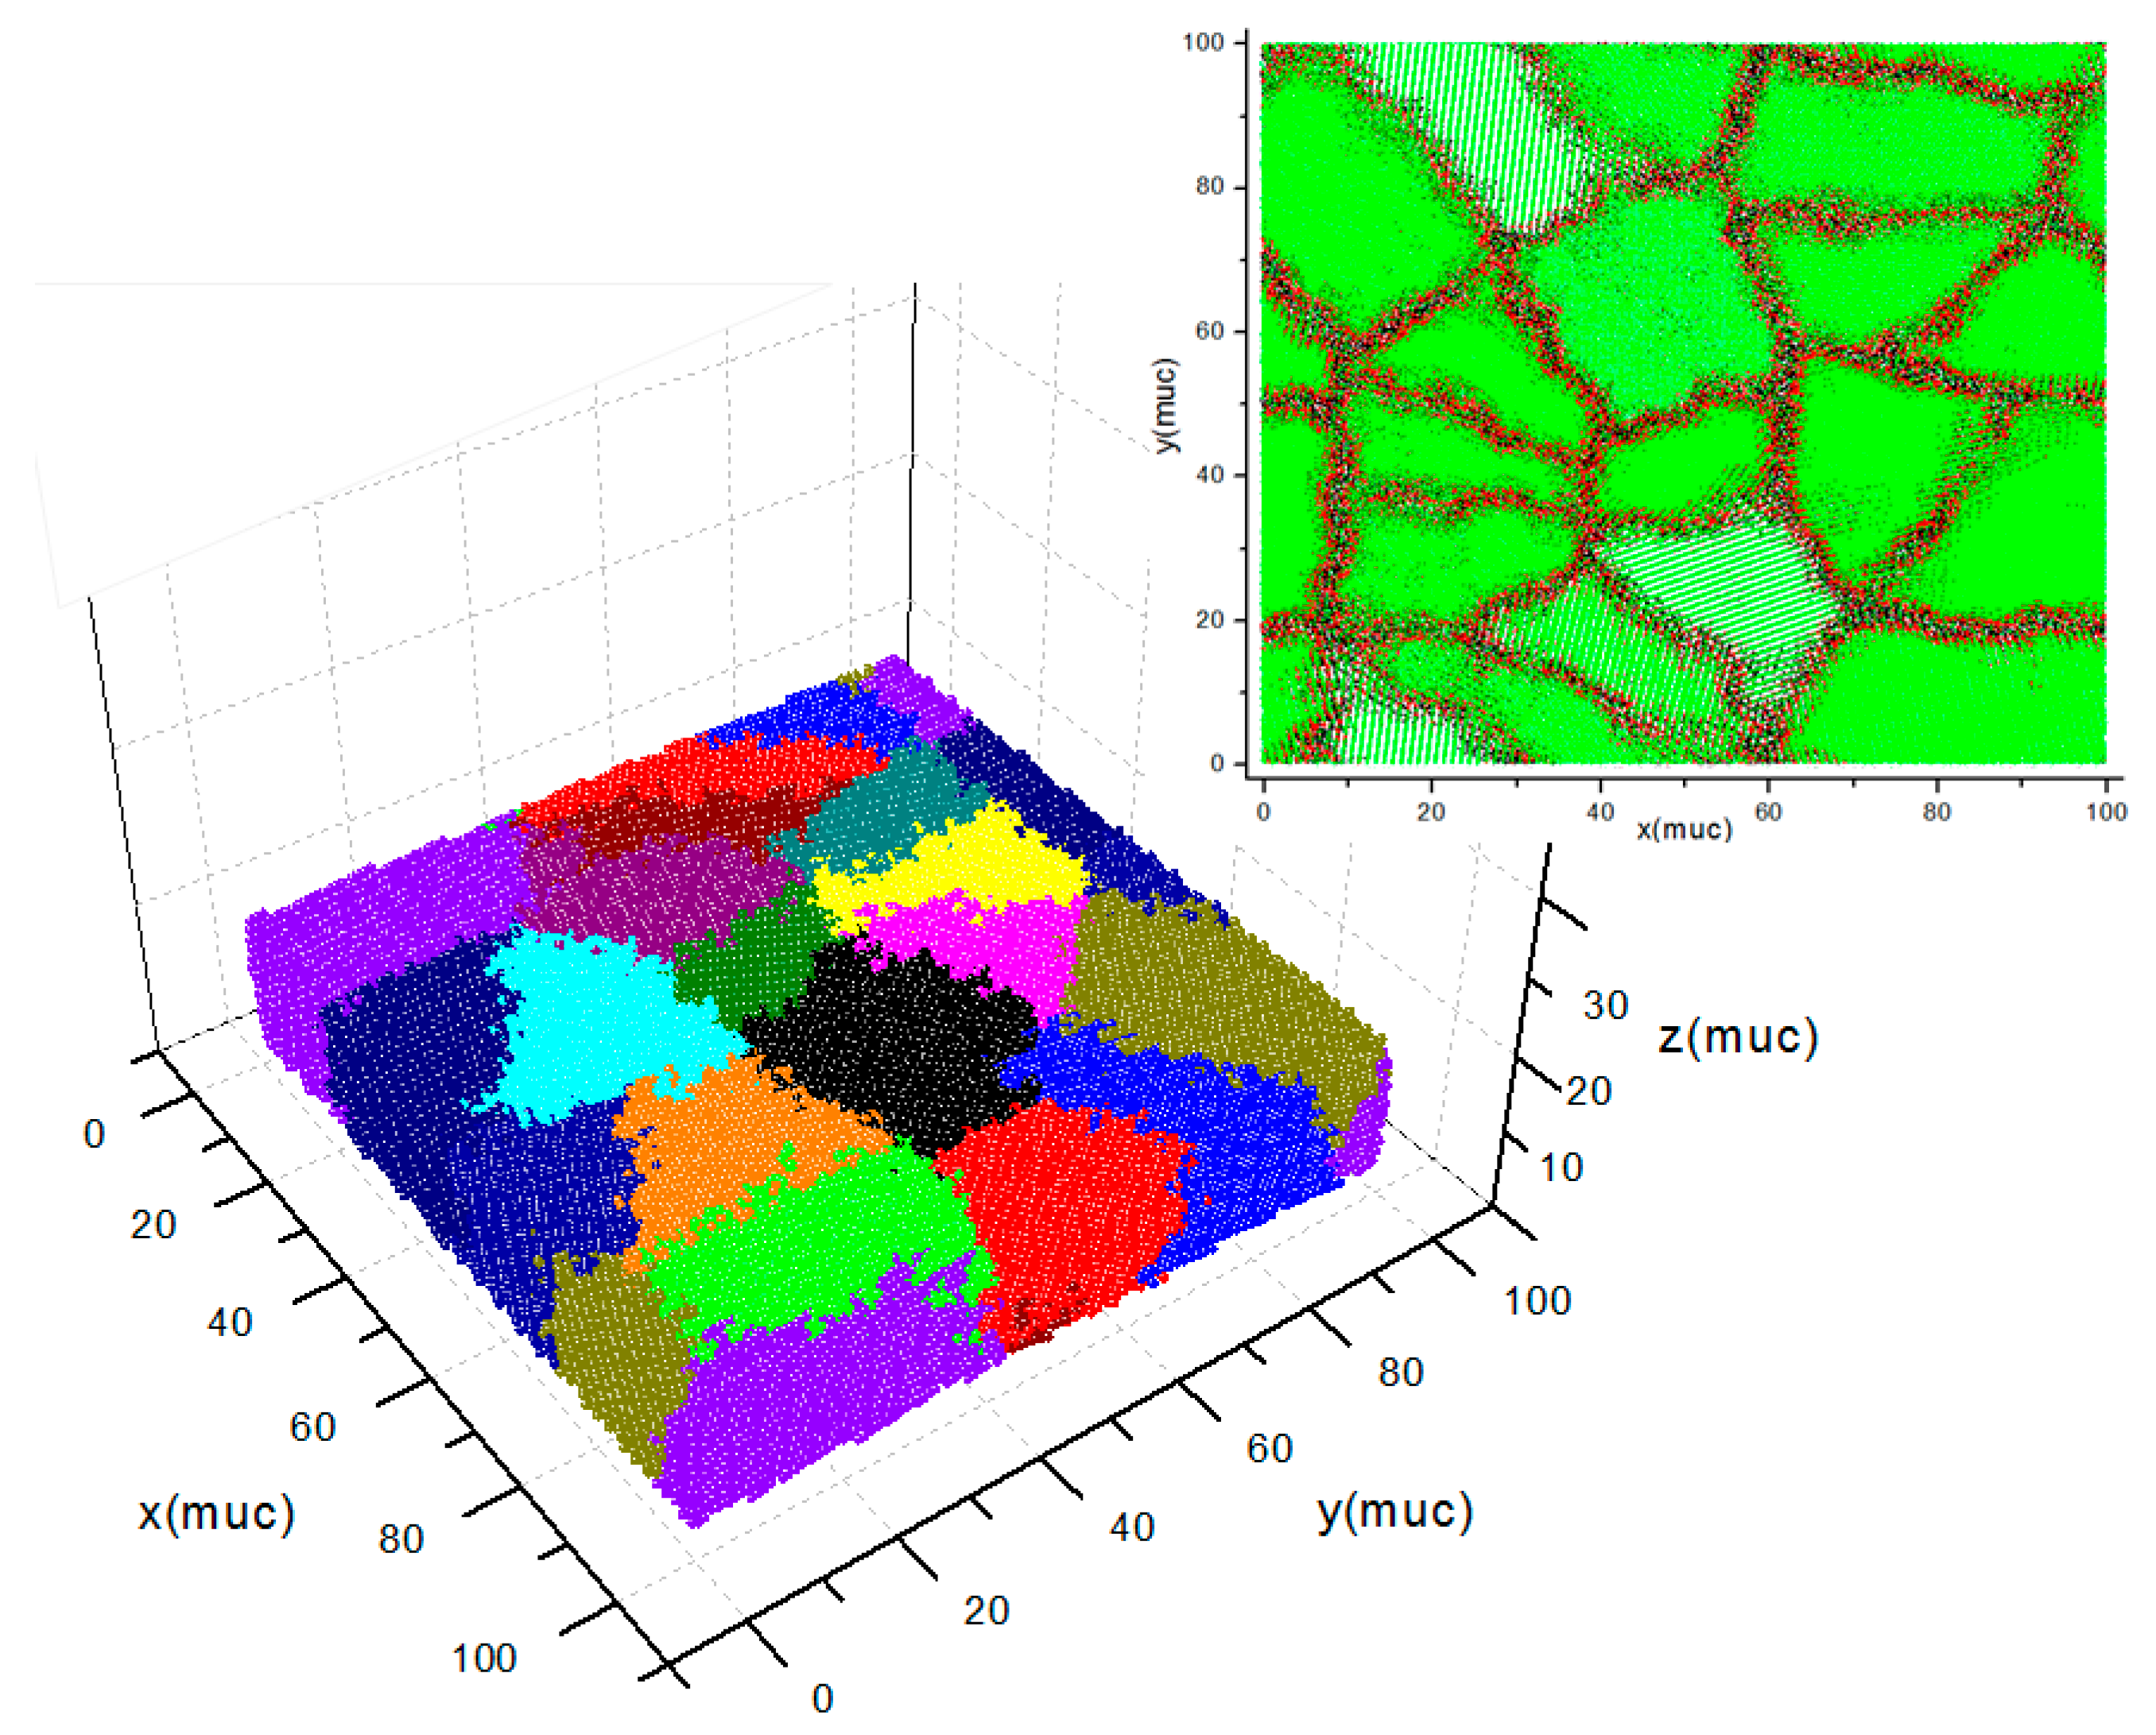
Figure 1 shows a sample of a polycrystalline thin film simulated by considering a simple cubic (SC) lattice structure. The inset figure shows an xy view, presenting the grain boundaries. The procedure for the sample construction can be observed in a previous work [
7]. Periodic boundary conditions (PBC) were implemented in the xy plane, where spin copies are located by means of replicas of the sample; then, the spins are placed at the edges, considering interactions in all directions under the limits of the thickness. The dimensions are given in magnetic unit cells (muc) according to the magnetic ion positions in a crystalline lattice. The sample’s dimensions were
L2d with
L = 100 muc and
d = 6, 8, …, 24 muc, where the number of atoms was
L2d, and the number of grains was
Ng = d in order to keep the atoms per grain constant at the value
L2. The Monte Carlo method was implemented using 10 cores with a shared memory, in which the sample was divided into cells for parallelization purposes. The number of Monte Carlo steps (MCS) was fixed at 32,000 per cell, rejecting 10,000 MCS, for averaging purposes. The magnetization versus temperature curves were developed between 400 K and 2 K, with a step of 0.25 K.
The model equation used is known as the Hamiltonian, and it correspond to the observable energy. This function describes the state of each element (spin moment) in the physical system in terms of the magnetic parameters, depending on the temperature. The solution of the system is a linear combination of individual states for each element of the system. The Monte Carlo method is used to generate spin fluctuations in the system; the state change is accepted or rejected according to the Metropolis algorithm. The range of energy fluctuations is given by transitions toward states of lower energy, or by the probabilities of changing to higher energy given by the expression exp(Δ
E/KBT) compared with a random number between 0 and 1. Here, Δ
E is the energy change given by the spin fluctuation, and
KB is the Boltzmann constant. These fluctuations cause the system to transit through the configuration space. The Hamiltonian for magnetic interactions reads as follows:
where
represent exchange interaction, different anisotropy components, the dipolar interaction, and the influence of an external magnetic field, respectively. The exchange interaction term is expressed according to Equation (2), where
represents the spin moments in a classical Heisenberg model, and
was fixed for simplicity. The
represents the exchange interaction, which is described using Equation (3) [
8]. The sum runs over neighbors with a cut-off radius of 3 muc. This model was reported in previous published work [
9].
The magnitude of
was calculated as a function of pair distances, according to an approximation to the RKKY interaction. Different studies performed using DFT in crystalline materials show that the interaction exhibits a similar tendency [
8,
10,
11,
12,
13,
14]. The expression is presented in Equation (3); the length of the Fermi wave vector was established in
, as a good approximation for metals [
8].
is a parameter fitted for obtaining
. The anisotropy Hamiltonian is specified in Equation (4), in which three contributions were considered, corresponding to
, and
, which refer to surface, cubic magneto-crystalline, and inter-granular boundary anisotropies, respectively.
Different studies involving ab-initio calculations have shown that interaction is highly influenced by the neighbors’ position lattice [
15,
16,
17,
18], in which small strains give rise to considerable anisotropies [
17,
19]. The
term is presented in Equation (5), where
,
and
are the directional cosines of
.
and
have temperature and crystalline disorder dependence, according to
[
8,
20,
21], where
is the magnitude of a distortion vector given by
.
The relationship given by Equation (6) is proposed in this work, being in agreement with experimental reports [
8,
22]. The parameter
was established at a temperature of 200 K.
Néel developed the basis for understanding the anisotropy produced by distortion effects, taking a sum of uniaxial anisotropy contributions for each nearest neighbor [
23]. A model with a similar approach is proposed here, where
was introduced for the consideration of the loss of neighbours at the grain boundaries and surface, and the deformations for each atom.
is an adjustment parameter, and
indicates the deformation in the surface and boundary anisotropies. The surface anisotropy equation is presented in (7), in which the effective surface value is given by
, where
, a parameter adjusted according to the change of the perpendicular and in-plane thickness dependence required, which is less than 10 muc [
4,
8].
In a similar way, a uniaxial anisotropy is considered for inter-granular boundaries, according to Equation (8), where
, where the value
is an approximation. It has been demonstrated that small changes in the grain boundary’s anisotropy produce a great influence on magnetic properties.
is a proportionality factor, included according to energy values reported [
24,
25], and previous results [
6].
A similar dipolar interaction implementation using the fast-multipole method (FMM) was performed under Cartesian coordinates [
8,
26]. The dipolar energy is given by:
where index
and
refer to interactions between spin–spin and spin–cell moments, respectively, and where
. The
region corresponds to the cell where
is located, and its nearest neighbour cells. The
region corresponds to the sample and replicas at a cut radius of five samples, considering periodic boundary conditions PBC.
meV was considered. Dipolar interactions are very weak at a short range, for influencing the spontaneous magnetization in a material. However, they are important for defining demagnetization effects, due to the sample’s shape. In the case of systems composed of particles, dipolar interaction becomes relevant due to the fact that the correlation caused by the exchange interaction is interrupted. In some cases, this dipolar interaction is enough to obtain alignments of the vortex type in isolated nanodisks [
8]. Magneto-rheological fluids are a set of soft magnetic particles of which the elastic limit increases in the presence of an external magnetic field. In the focus of this study, the dipole interaction plays an important role, mainly in the phase transition, in the absence of magnetic fields, in which the rearrangement is spontaneous. This dipolar interaction can produce a reordering by the dynamics of moments with external effects. Some important works on this subject can be consulted [
27,
28,
29,
30,
31]. Finally, the last term in the Hamiltonian shown in Equation (1) refers to the Zeeman interaction, as is presented in Equation (10) [
8], where
represents the external magnetic field.
Although the reader could think that the number of simulation parameters is high, it is difficult to limit them by the complexity of the system. Previous works evidenced this [
6,
7,
9], where it has also been concluded that the analysis can be obtained while parameters are kept in the experimental ranges. That is due to the fact that magnetic contributions exert influence in different ways; exchange interaction values are found in the meV; magneto-crystalline anisotropy values are found in the µeV; and dipolar interactions, with D in µeV per pair interaction, increase to medium range due to the number of interactions. The anisotropy boundary parameters were selected based on previous works in which the competence produced a single domain per grain with a disorder in an SPM state. In particular, the surface anisotropy parameter was obtained from different simulations in which it is known that the moment alignments change of perpendicular to the in-plane, at less than 10 muc.
For Hysteresis loop calculations, the number of Monte Carlo steps was fixed at 80,000, which was chosen taking into account the tendency of the coercive field to be stabilized, and the observable averages were calculated using the last 5000 MCS.
On the other hand, the Monte Carlo method continues to be used successfully to explain and predict the properties of materials at the nanoscale. For example, in [
32,
33], a Monte Carlo algorithm for solving the stochastic drift–diffusion–Poisson system is evaluated, and in [
34], a computational technique based on Bayesian estimation is used to determine the physical parameters of the nanowire field-effect sensors and the properties of the analyte molecules.
3. Results
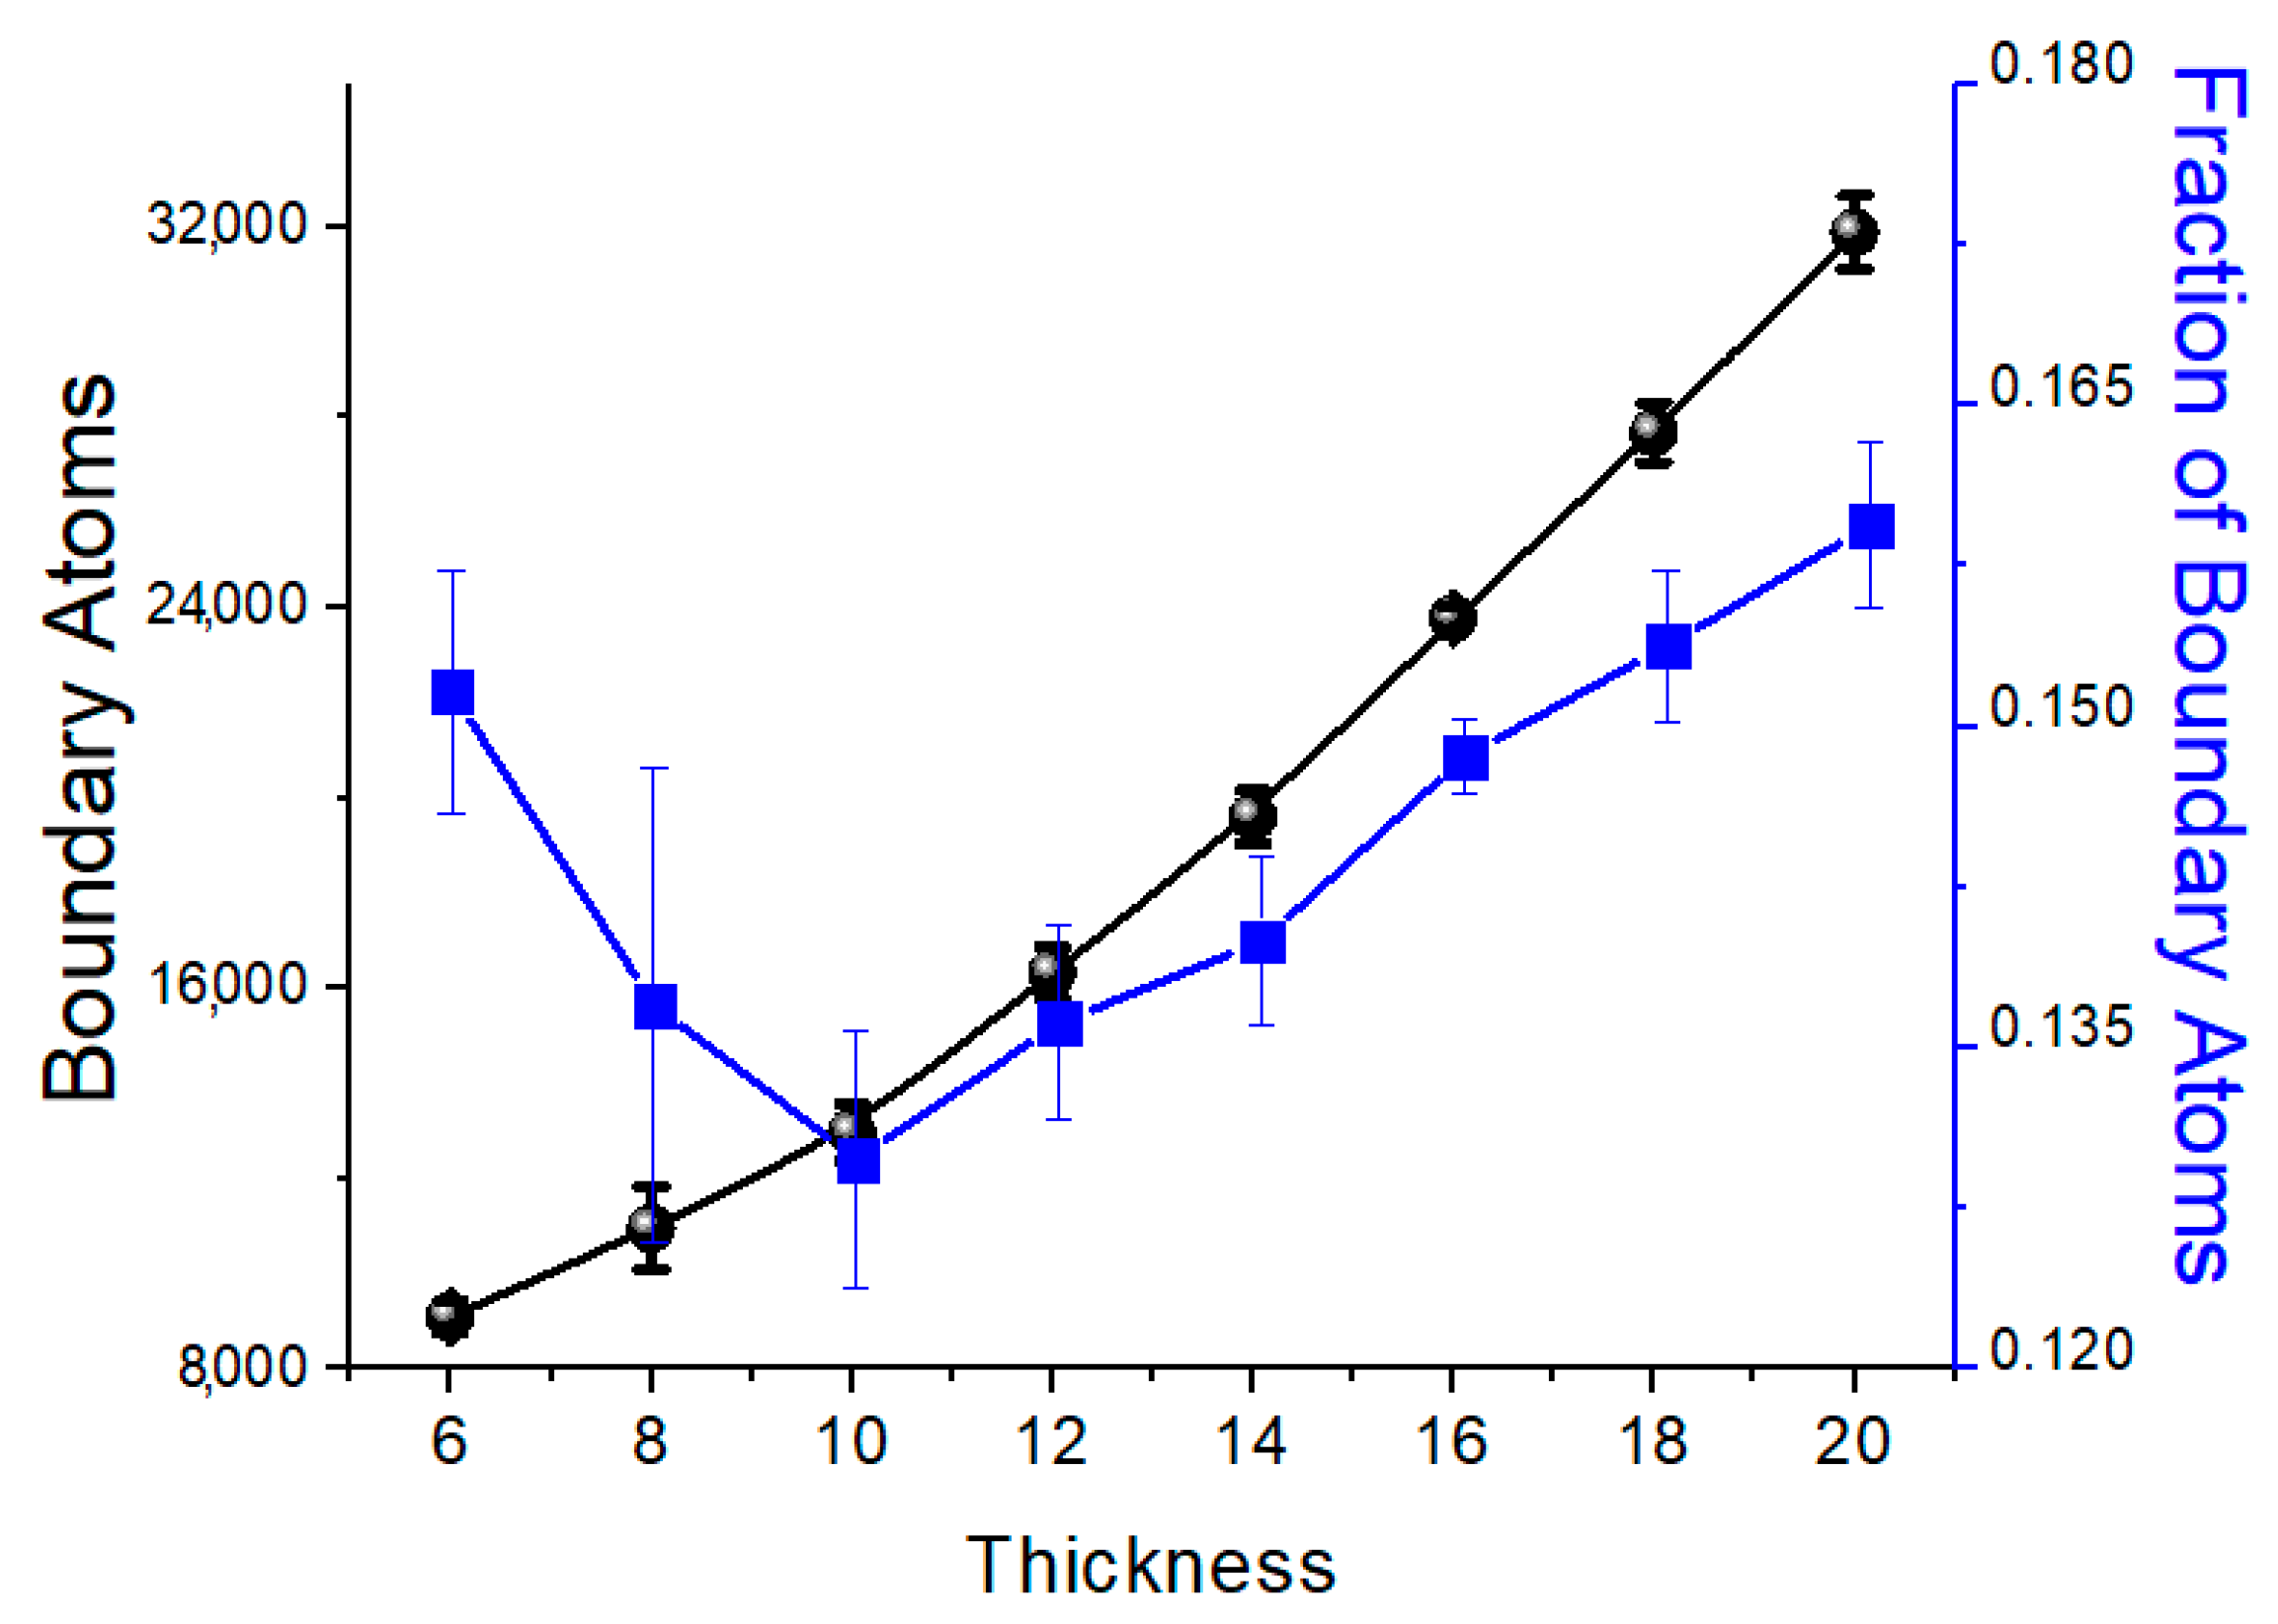
Before we analyse magnetic the response, it is appropriate to quantify the boundaries with respect to the thickness. The number of the boundary atoms as a function of the thickness is presented in
Figure 2. An increment tendency is well established. The fraction of boundary atoms with respect to the total sample atoms is presented in the same figure. This fraction presents a minimum in 8 muc. This is a result of keeping the same grain volume, a condition established in our simulations. That geometrical and structural implication is explained according to the relationship between the grain diameter and thickness, as established. If a grain is approximated to a spherical shape, the diameter is 13 muc approximately, according to the number of atoms per grain. Then, at low thickness values, the grains are forced to present an in-plane deformation, and the grains exhibit a high surface component. Therefore, it is expected that the surface and boundary effects’ competition is more relevant at a low thickness.
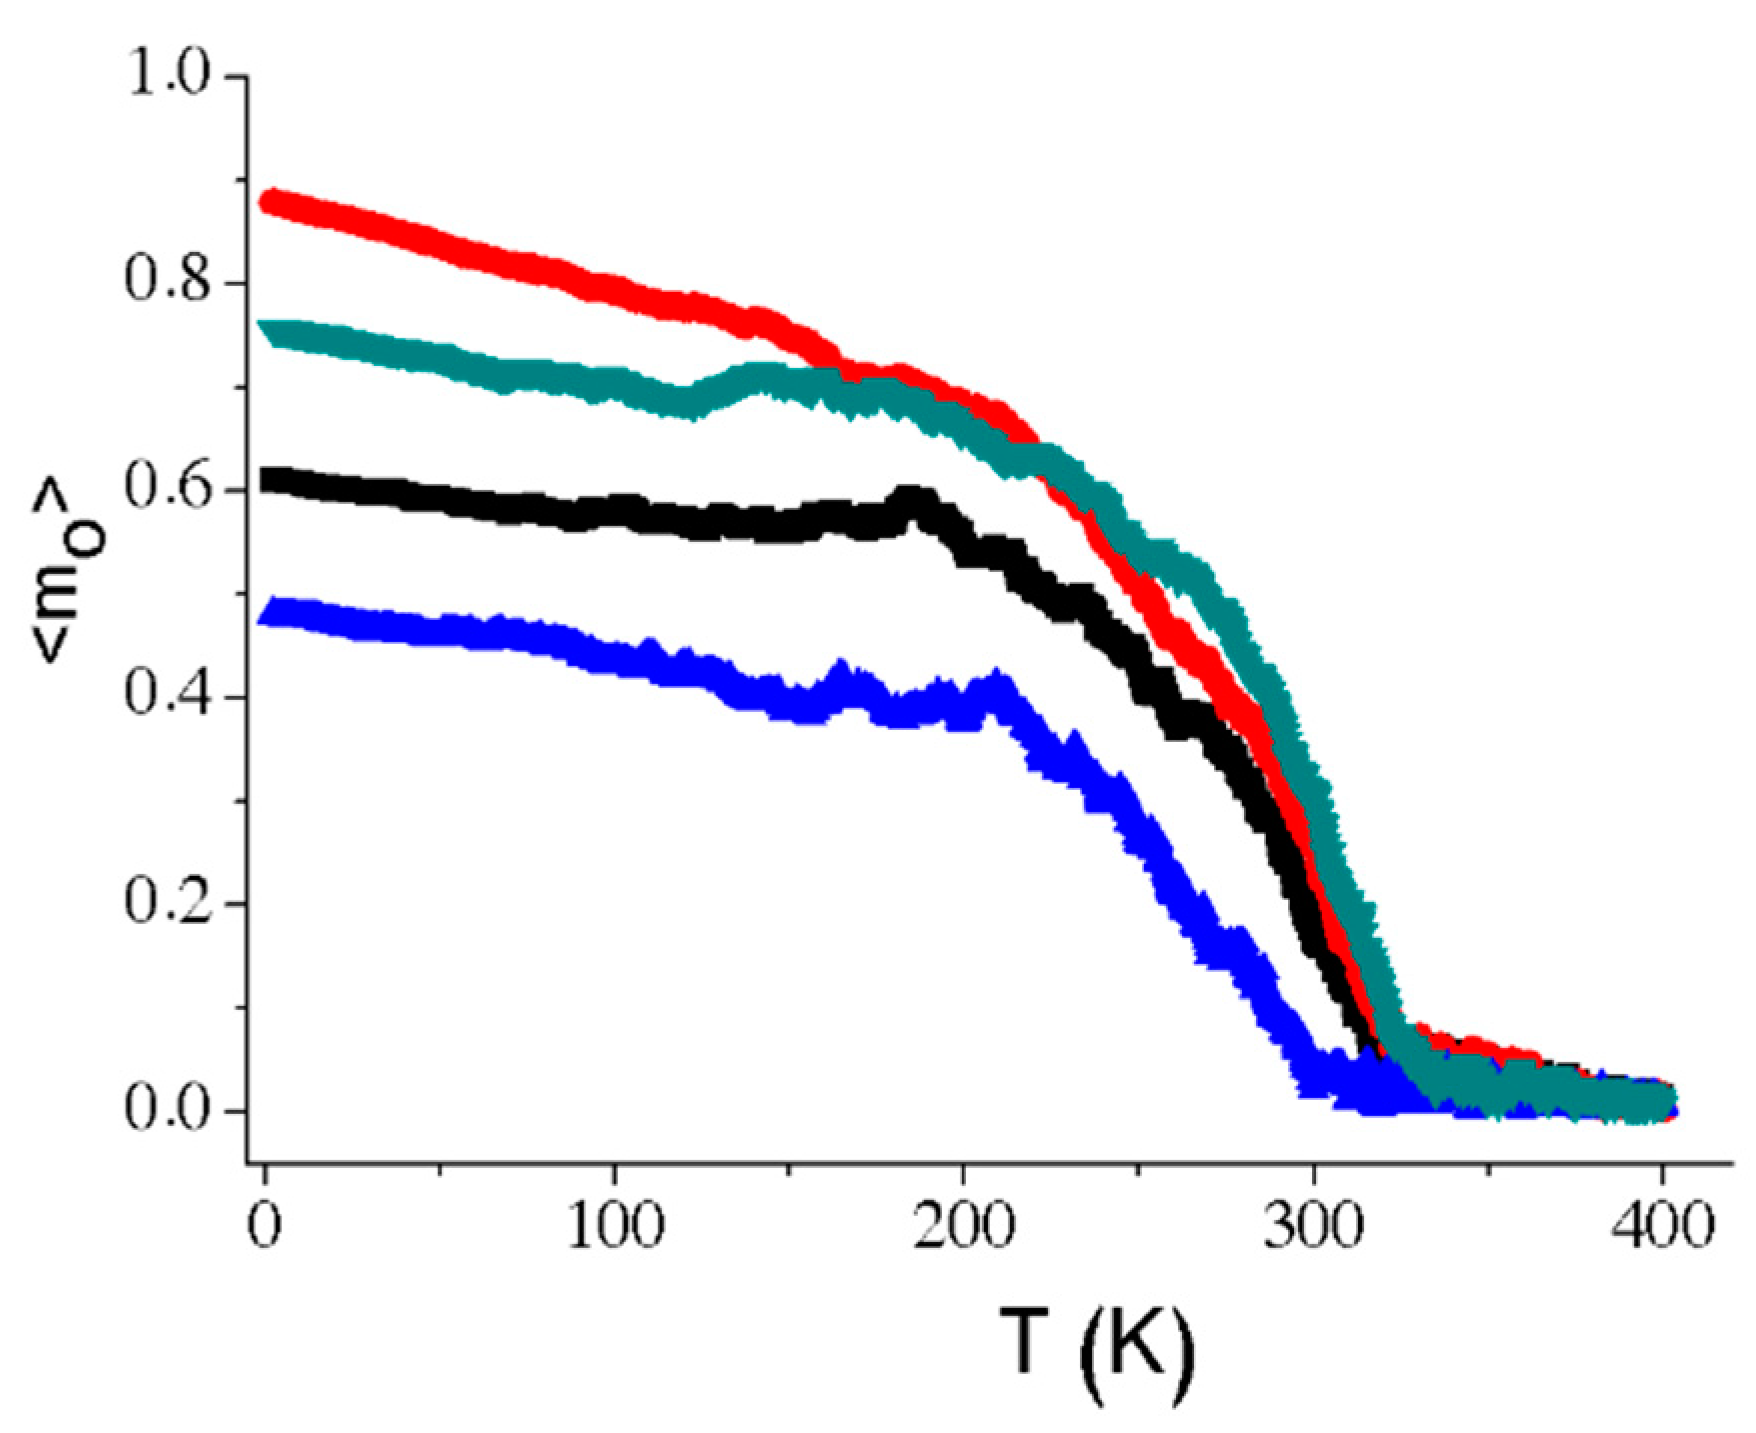
Figure 3 presents some curves of temperature dependence on the spontaneous magnetization at a thickness of 24 muc. In these curves, different samples and different initial configurations generated different routes in the cooling processes. This means that the system presents domains in different directions. Similar results are presented at others thicknesses, but at high thickness they are more evident. This loss of coupling gives rise to a meta-stability. This is mainly generated due to three reasons: (i) the magnetic moment disorder in the boundaries produces a loss of correlation between the grains; (ii) the generation of magnetic domains in each grain is randomly oriented in one of the six possible directions of the cubic magneto-crystalline anisotropy (MCA); (iii) an SPM state could be presented at intermediate temperatures, while at low temperatures, domains transit to a blocked state.
The magnetization at 2 K is considered as
mo. When
mo has a high value, the system tends to a mono-domain behaviour. In other cases, when the
mo is low, a tendency to a single-domain regime per particle with a loss of coupling between grains is observed.
Figure 4 presents the magnetization values at the lowest temperature, varying the thickness of the sample. In general, the <
mo> diminutions and the error bar increments are an indication of great meta-stability. Furthermore,
Figure 4 also presents the average of the absolute values
and the absolute value of the average
of magnetic moments in
z direction as a function of the thickness. The values were obtained from the final states of at least five simulations. The low <
mo> error bars in the figure indicate stability up until a thickness of 18 muc. From a thickness of 20 muc, the <
mo> and error bars increase considerably. At 6 muc, the tree parameters show a similar value, and
is in the range of the
error bar; this means a high alignment of spin moments in the perpendicular direction for the entire sample, which indicates a monodomain tendency.
In
Figure 4, between 6 and 16 muc, a decrement of
can be observed as the thickness increases. This behaviour indicates a loss of perpendicular alignment. Perpendicular magnetic anisotropy (PMA) is a phenomenon produced only by surface atoms; for this reason, the increment of the thickness produces a loss of surface influence. In contrast to PMA, the dipolar interaction produces an in-plane spin configuration. This behaviour is expected, according to the experimental results presented in the literature [
35]. Simulations of the competition between the PMA and the dipolar interaction for a mono-crystalline sample are presented in [
4]. The results show that there is a critical thickness for changing from perpendicular to in-plane alignments. In that work, a critical thickness can be obtained when both states, in-plane and out-plane, have the same probability of occurring. In case of polycrystalline samples, the local anisotropy of each grain could be in any of the cubic axes of an MCA, which is the reason for which the transition scenarios have different spin alignments per grain (or set of grains).
For values of thickness between 6muc and 16muc, different transition states can be observed.
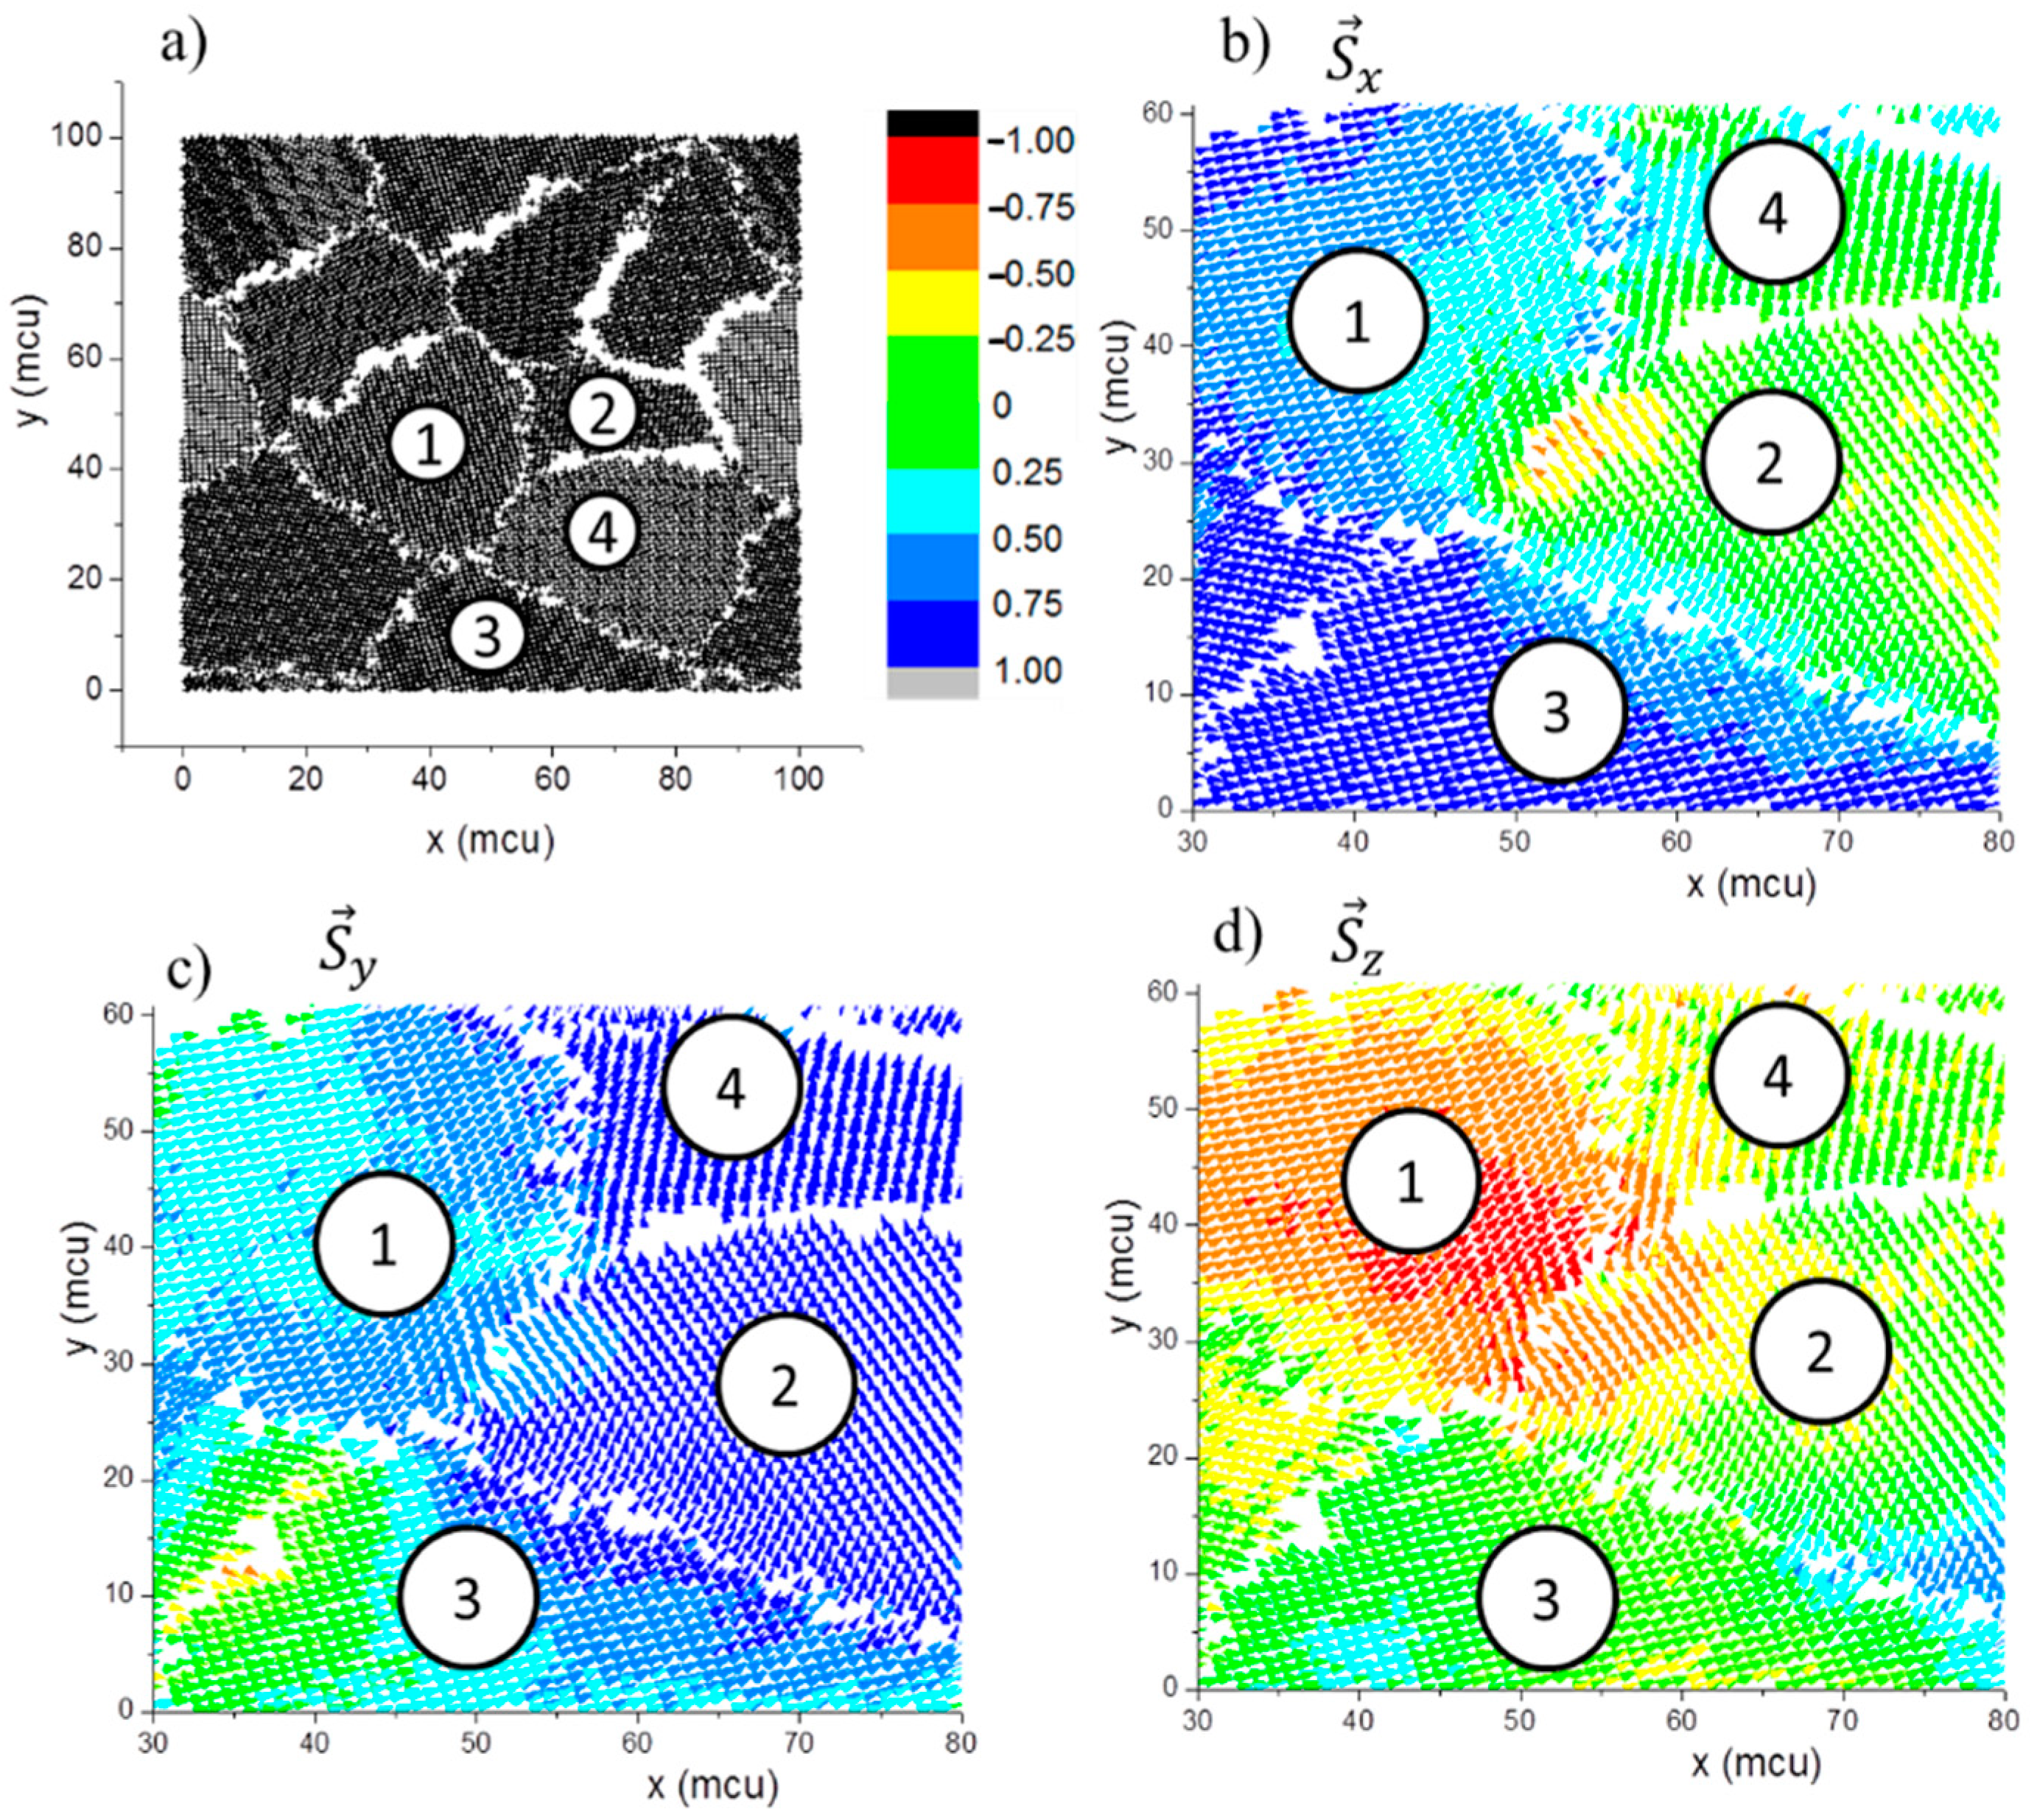
Figure 5 shows the final state of a film with a thickness of 10 muc.
Figure 5a represents the structural distribution of ab
x-y middle plane, where four grains have been selected for the analysis. The atoms in the grain boundaries have been suppressed for visualization purposes. The final spin moment states of
Sx,
Sy and
Sz at 2 K are represented by colour maps in
Figure 5b,c,d, respectively. It is observed that grains 1, 2, and 3 contain domains with different direction tendencies. Grain 1 tends toward −
z, grain 2 toward
y, and grain 3 toward
x. Although some similar tendencies can be found close to the grain boundaries, a single-domain regime per grain begins to appear. Normally, some grains can be influenced by others, mainly because they have a small grain size. That is the case for grain 4, which tends to be oriented in the same direction of grain 2.
Returning to
Figure 4, at a thickness of 14 muc,
is lower than
and out of its error bars; this represents the beginning of a mismatch between the grain moments in opposite
z directions, and the presence of a single-domain tendency per grain (or small set of grains). At a thickness of 16muc, the low value of
indicates that most of the spin moments are in-plane aligned. This indicates the strongest dipolar interaction influence.
At a thickness higher than 20 muc, in
Figure 4,
is lower than
, and is located out of the error bars. Therefore, it is considered that the grains have a high tendency to a single-domain regime per grain without correlation between them. It is also observed that
presents lower values due to an average of positive and negative magnitudes. Additionally,
takes values around 0.4, indicating a lower in-plane dipolar interaction effect. If the magnetic moments per grain were totally independent between them, the average value should be around 0.577, approximately. This tendency agrees with the decrease of <
mo> and the increment of
mo error bars presented in the same
Figure 4.
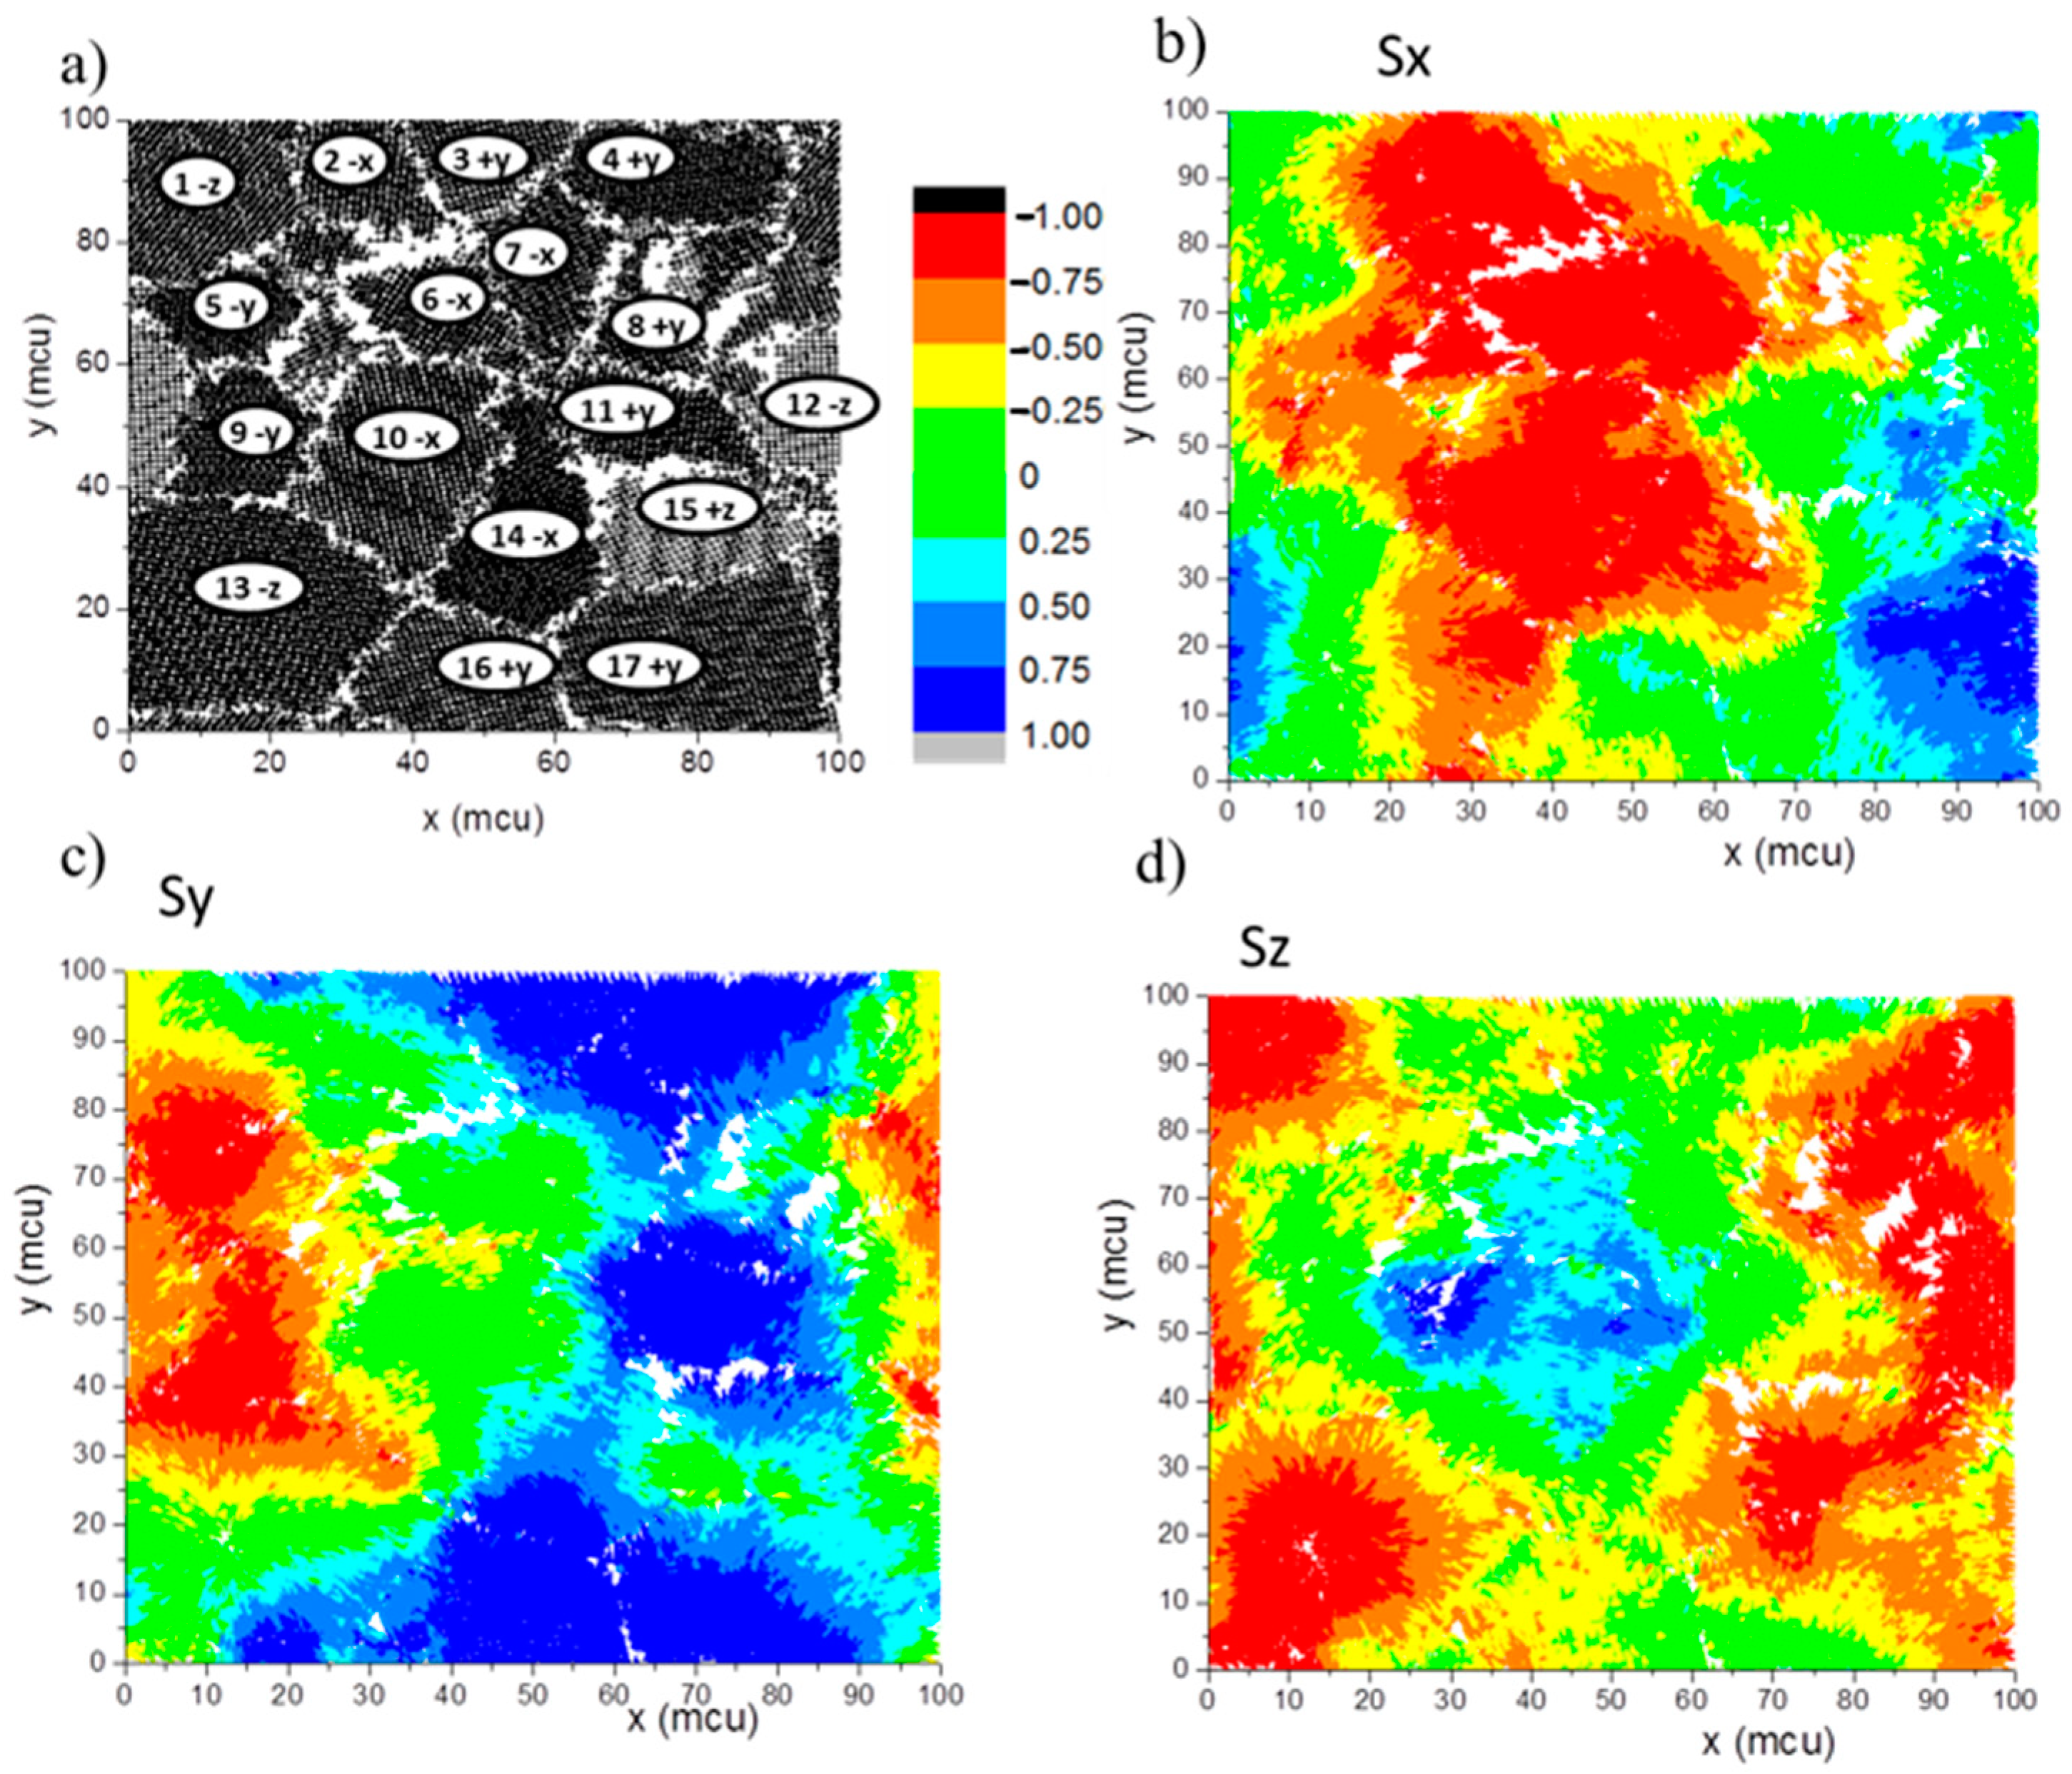
Figure 6 shows the middle plane of a final state of low-saturation magnetization. This figure corresponds to a thickness of 20 muc. This result is presented with the purpose to observe the three-dimensional domain distribution.
Figure 6a corresponds to the structural order, in which the boundary atoms are not included for visualization purposes.
Figure 6b–d are colour map distributions which identify
Sx,
Sy and
Sz magnitudes, respectively. The numbers in
Figure 6a identify the grains, while the letters indicate the preferential direction, according to
Figure 6b–d. For instance, grain 13 is preferentially oriented in the −
z direction, as is it possible to observe in
Figure 6d. The magnetic distribution in this figure shows domains formed by more than one grain in most of the cases. Furthermore, the domain limit regions have coincidence with the grain boundaries in most of the cases.
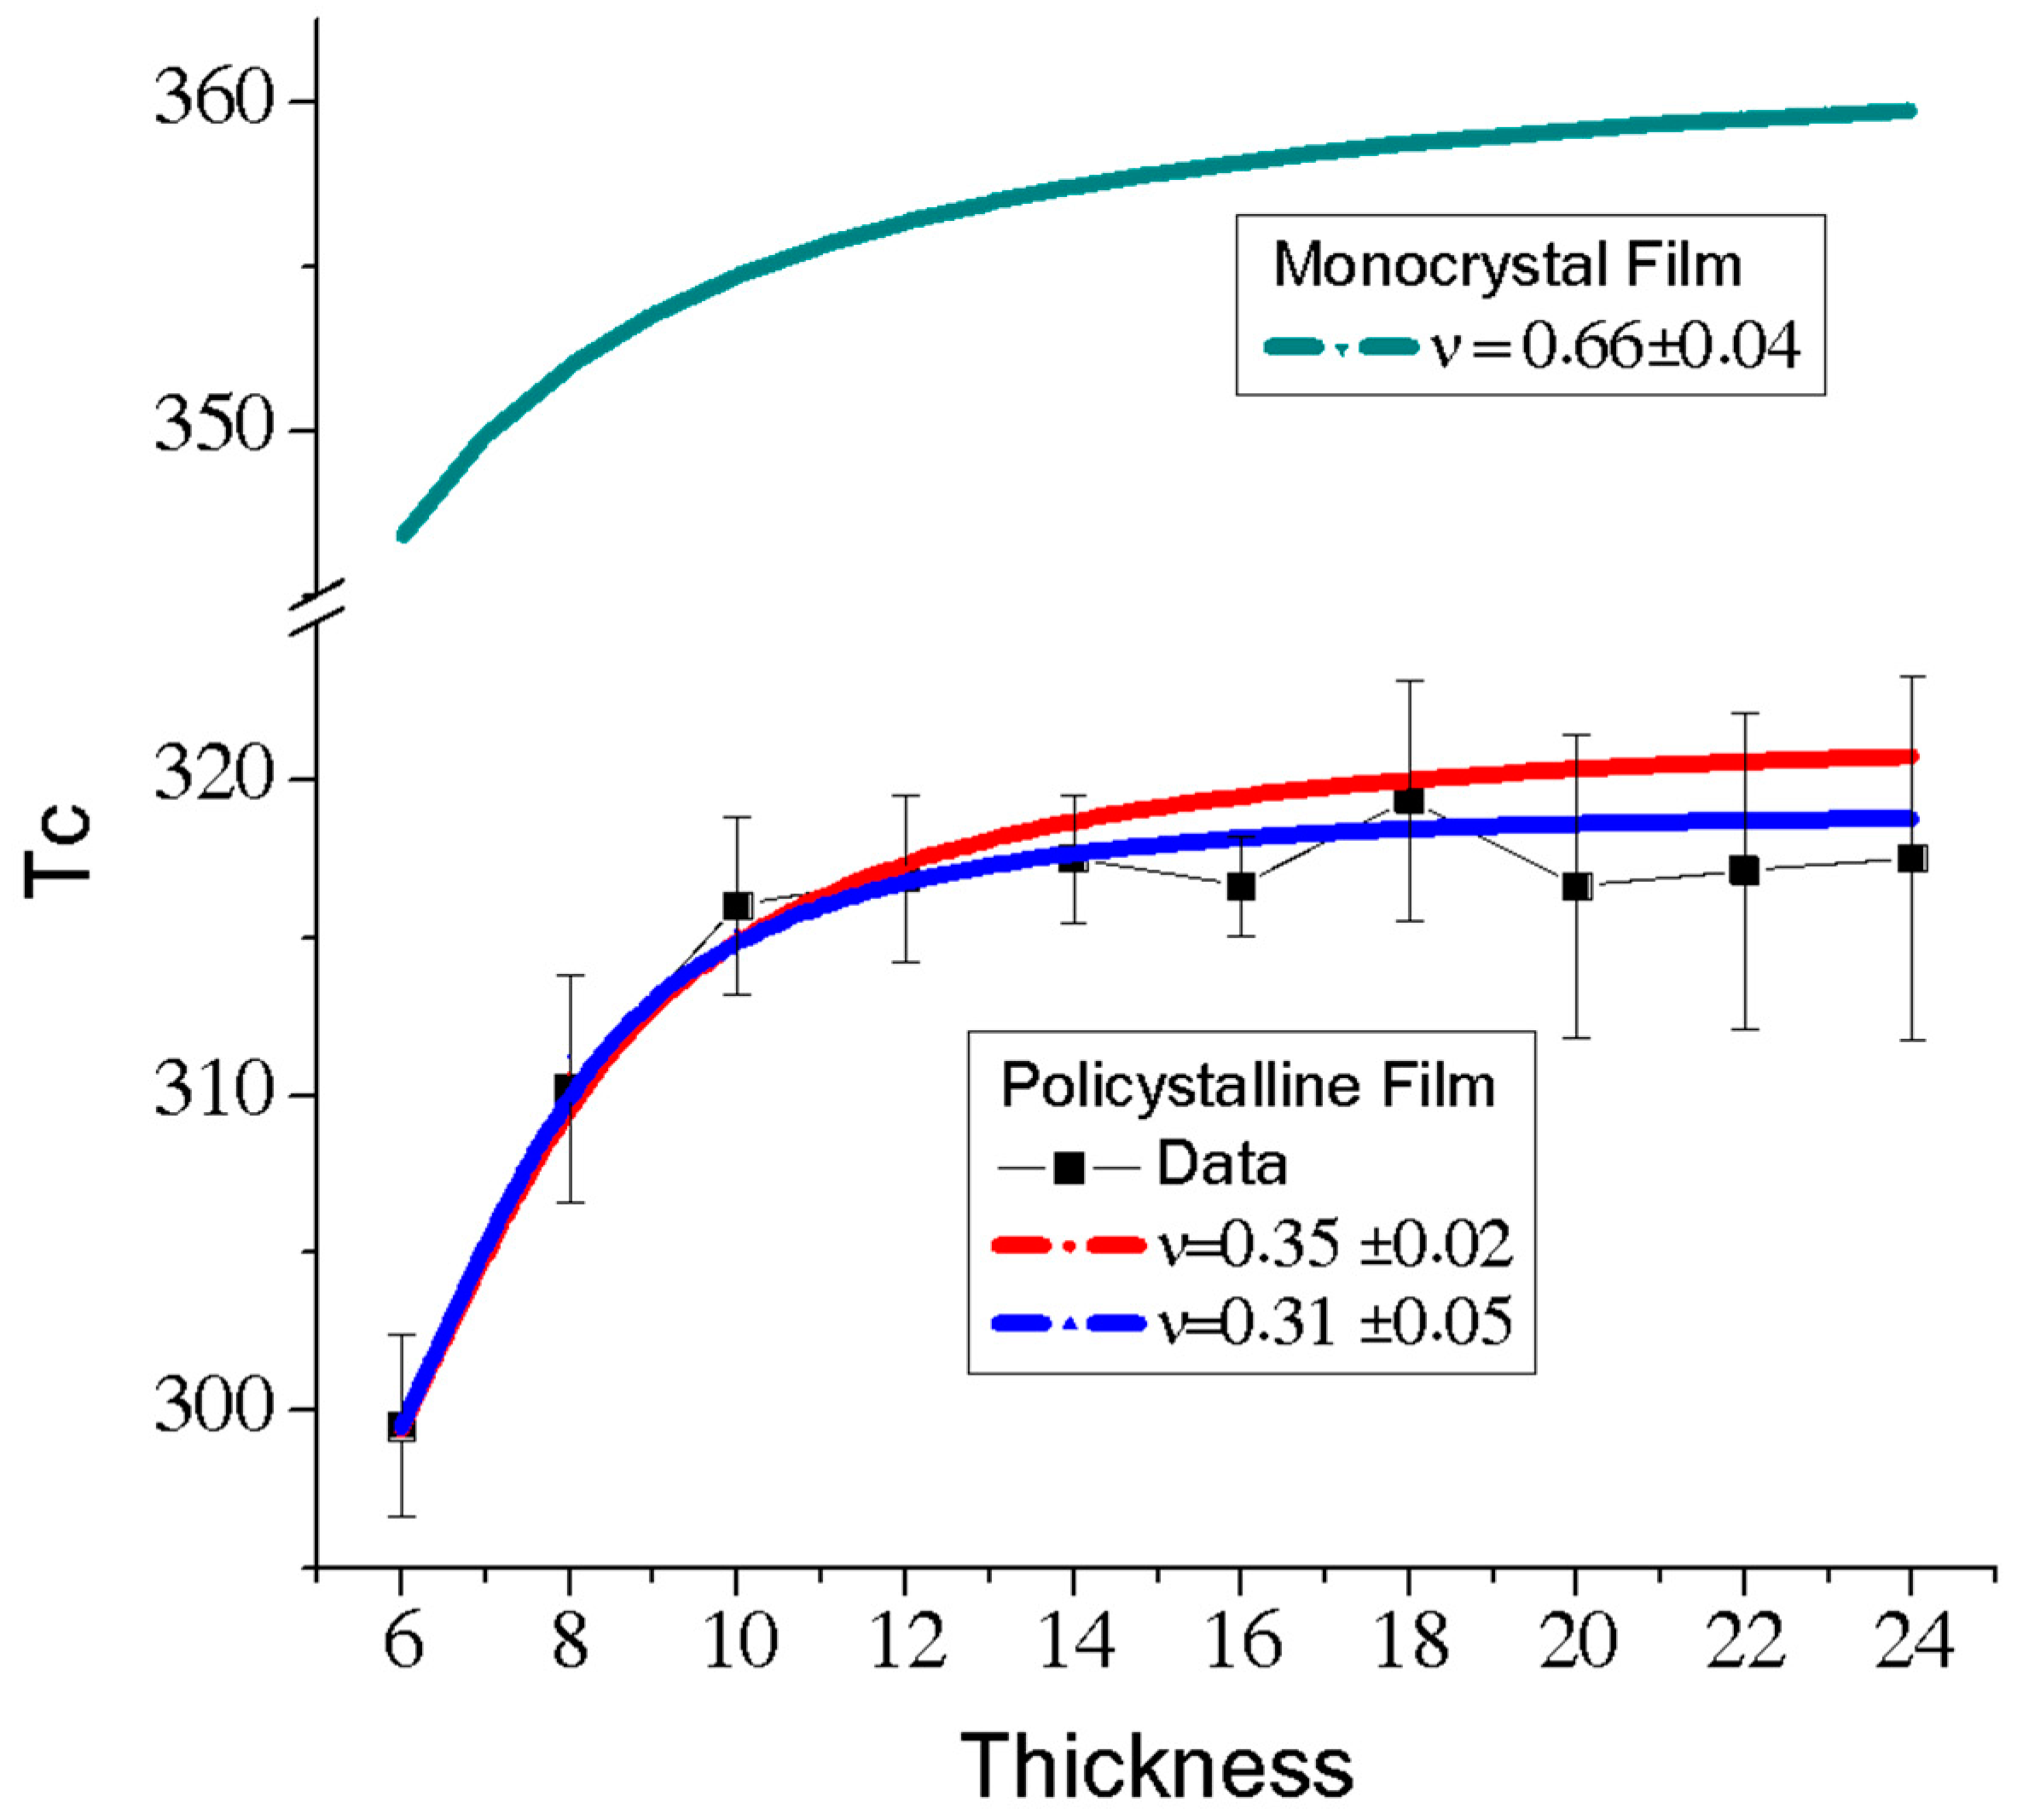
Figure 7 shows the critical temperatures at different thicknesses. The data for polycrystalline films were obtained with an external field 0.1 meV per atom in the
x direction. This external field is necessary to induce an alignment between grains with a collective magnetization response; due to the low magnitude of the field, it is possible to consider that the temperature obtained is very close to the critical temperature. A fitting of the magnetic monocrystal response is also introduced in the graph. The monocrystal samples present a higher critical temperature than the polycrystalline samples at the same thickness. Previous results evidenced that this behaviour is produced even without taking into account the anisotropy in the grain boundaries [
9]. Then, the reduction of temperature is due to the sample subdivision, with a reduction of magnetic correlation caused by the loss of symmetry in the grain boundaries. The results for the monocrystalline and poly-crystalline samples were in concordance with finite-size scaling theory (FSS) [
36,
37], in which
increases with the thickness. The
error bars are mainly related to the magnetic meta-stability. At thicknesses greater than 16 muc, the increment of error bars is correlated with the increment of the number of atoms in the grain boundaries, with a consequent loss of connectivity between the grains. Therefore, the grains are more magnetically independent, and the critical temperature distribution must be directly correlated with the average grain size distribution. A diminution of the error bar at 16muc is observed. This is due to the fact that domains prefer in-plane alignments by the effect of dipolar interactions (as it was mentioned before), similarly to the external field direction. According to FSS theory, we considered the relationship presented in Equation (11) in order to estimate the critical exponent [
37].
where
refers to the limit of the critical temperature at high thicknesses, and
is an adjusted parameter. The approximation was carried out by the Monte Carlo method under the minimum square criteria, with 10 × 10
6 combinations of
and
parameters. For a monocrystalline film, the critical exponent obtained was
. This value is between 0.71 and 0.5238, as reported for thin films under a classical Heisenberg model in [
38] and [
39], respectively. Due to the instability observed in polycrystalline samples, fitting above 16 muc is very complicated to obtain, as it presents high deviation. For a range between 6muc and 12 muc, the exponent obtained for the fitted data was
, while for a range between 6 muc and 14 muc, the exponent was
. The fitted data is presented as the red and blue lines in
Figure 7. This situation evidenced a diminution of the
exponent in polycrystalline samples with respect to the ideal monocrystalline samples.
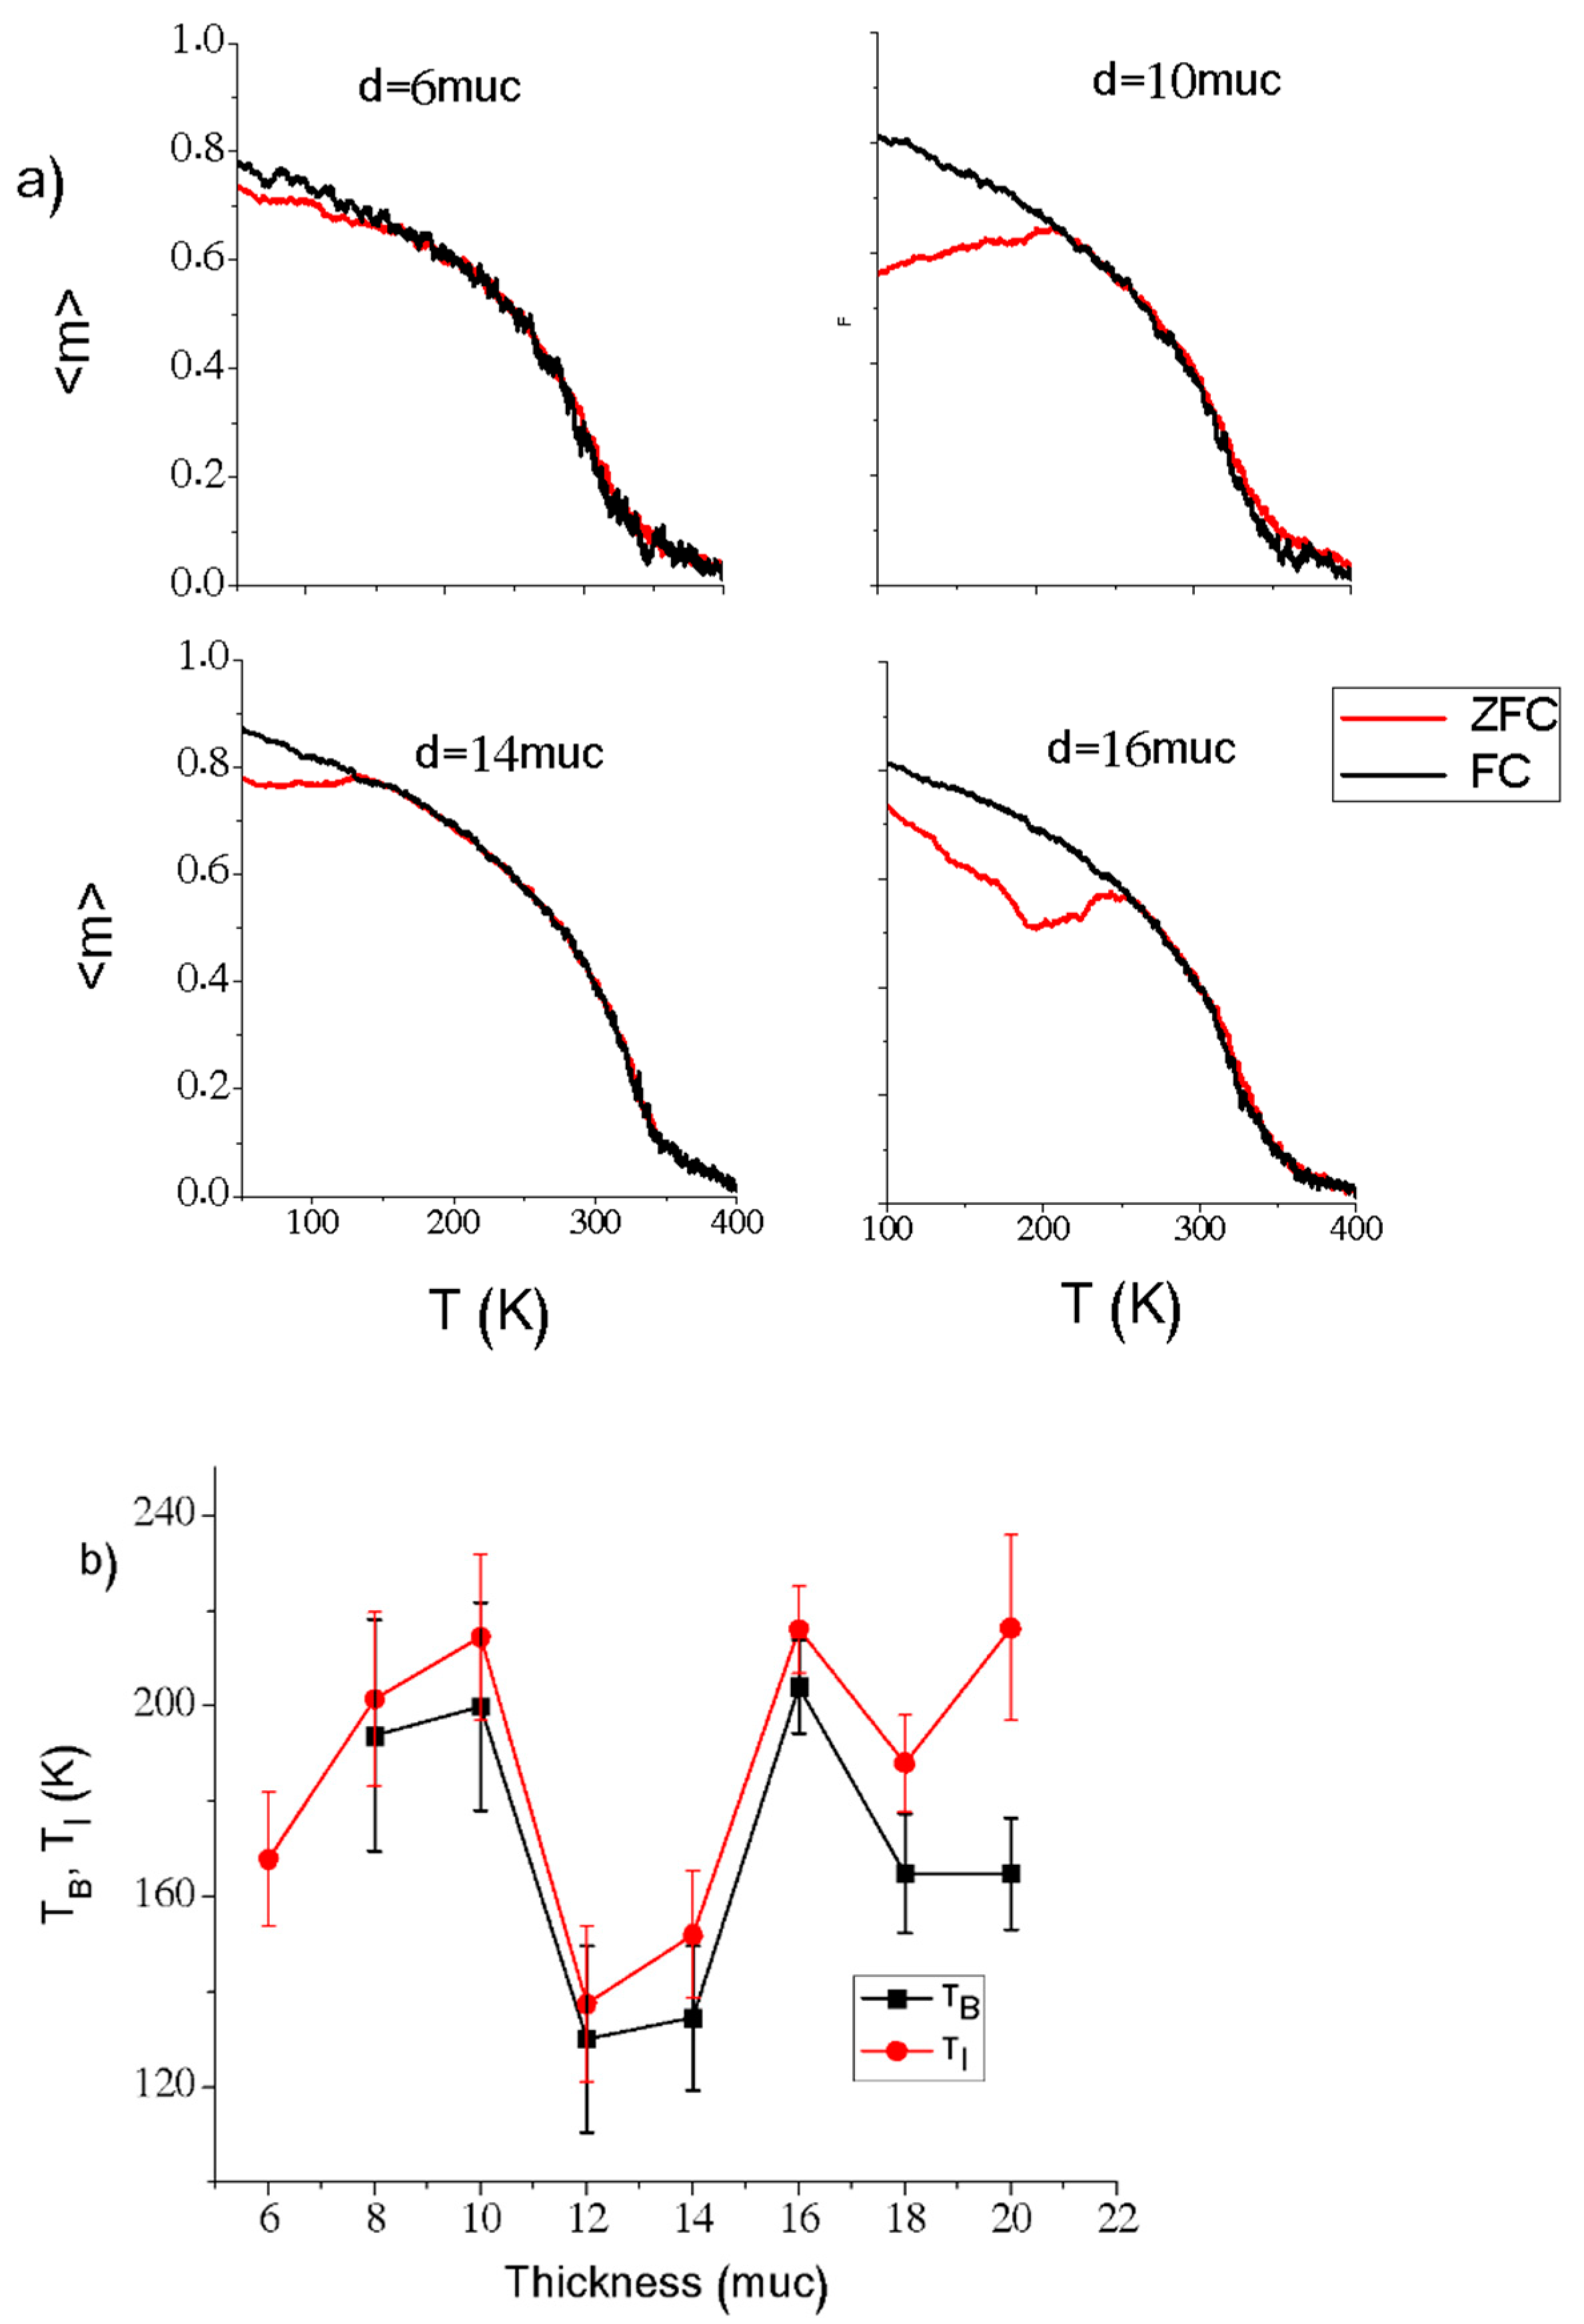
The measures of FC–ZFC also were obtained for the analysis of the transitions to SPM states. The sample is first cooled without-field until the lowest temperature. After that, an external field is applied while the temperature increases, and the magnetization is recorded. This record is denoted as zero-field cooled (ZFC). After the sample reached the highest temperature, the data are recorded during the cooling process to the lowest temperature, keeping the external field. This record is denoted as field cooling (FC). Both the data for heating and cooling can give information about first and second order transitions. The FC–ZFC curves at different thicknesses are presented in
Figure 8a, and additionally,
Figure 8b presents a summary of the blocking and irreversibility temperatures for several simulations,
TB and
TI, respectively.
TB is obtained from the maximum point in the FC curve. The external field was applied in the
x direction. Ideally,
and
should present the same value; nevertheless, the difference between them is attributed to the size distribution of the grains with different
[
40]. Under these circumstances, a loss in the magnetization due to the disorder of the magnetic moments in the grain boundaries and a mismatch between the grain magnetic moments is observed. The latter is produced by the different magneto-crystalline anisotropies in each grain.
However, at very low thicknesses, all of the grains are preferentially oriented in the
z direction by the surface anisotropy effect, and it is not possible to separate
TB and
TI. Although the applied external magnetic field is in the plane orientation, this is not strong enough to obtain a significant change in the spin orientations. As a result, the
begins to appear at 8 muc. According to
Figure 8b,
and
do not present a clear tendency. It is expected an increment of
and
with the thickness, in a similar way to
as is presented in this figure for low thicknesses. Then, comparing these results with the previous analysis, it is possible to deduce that
tends to disappear as the film tends to the mono-domain regime. That situation occurs when the thickness is very low, where perpendicular orientation is established.
Particularly, at 16 muc, when the dipolar interaction produces a strong in-plane alignment, a high is also obtained. This indicates a presence of SPM, but limited to two dimensions.
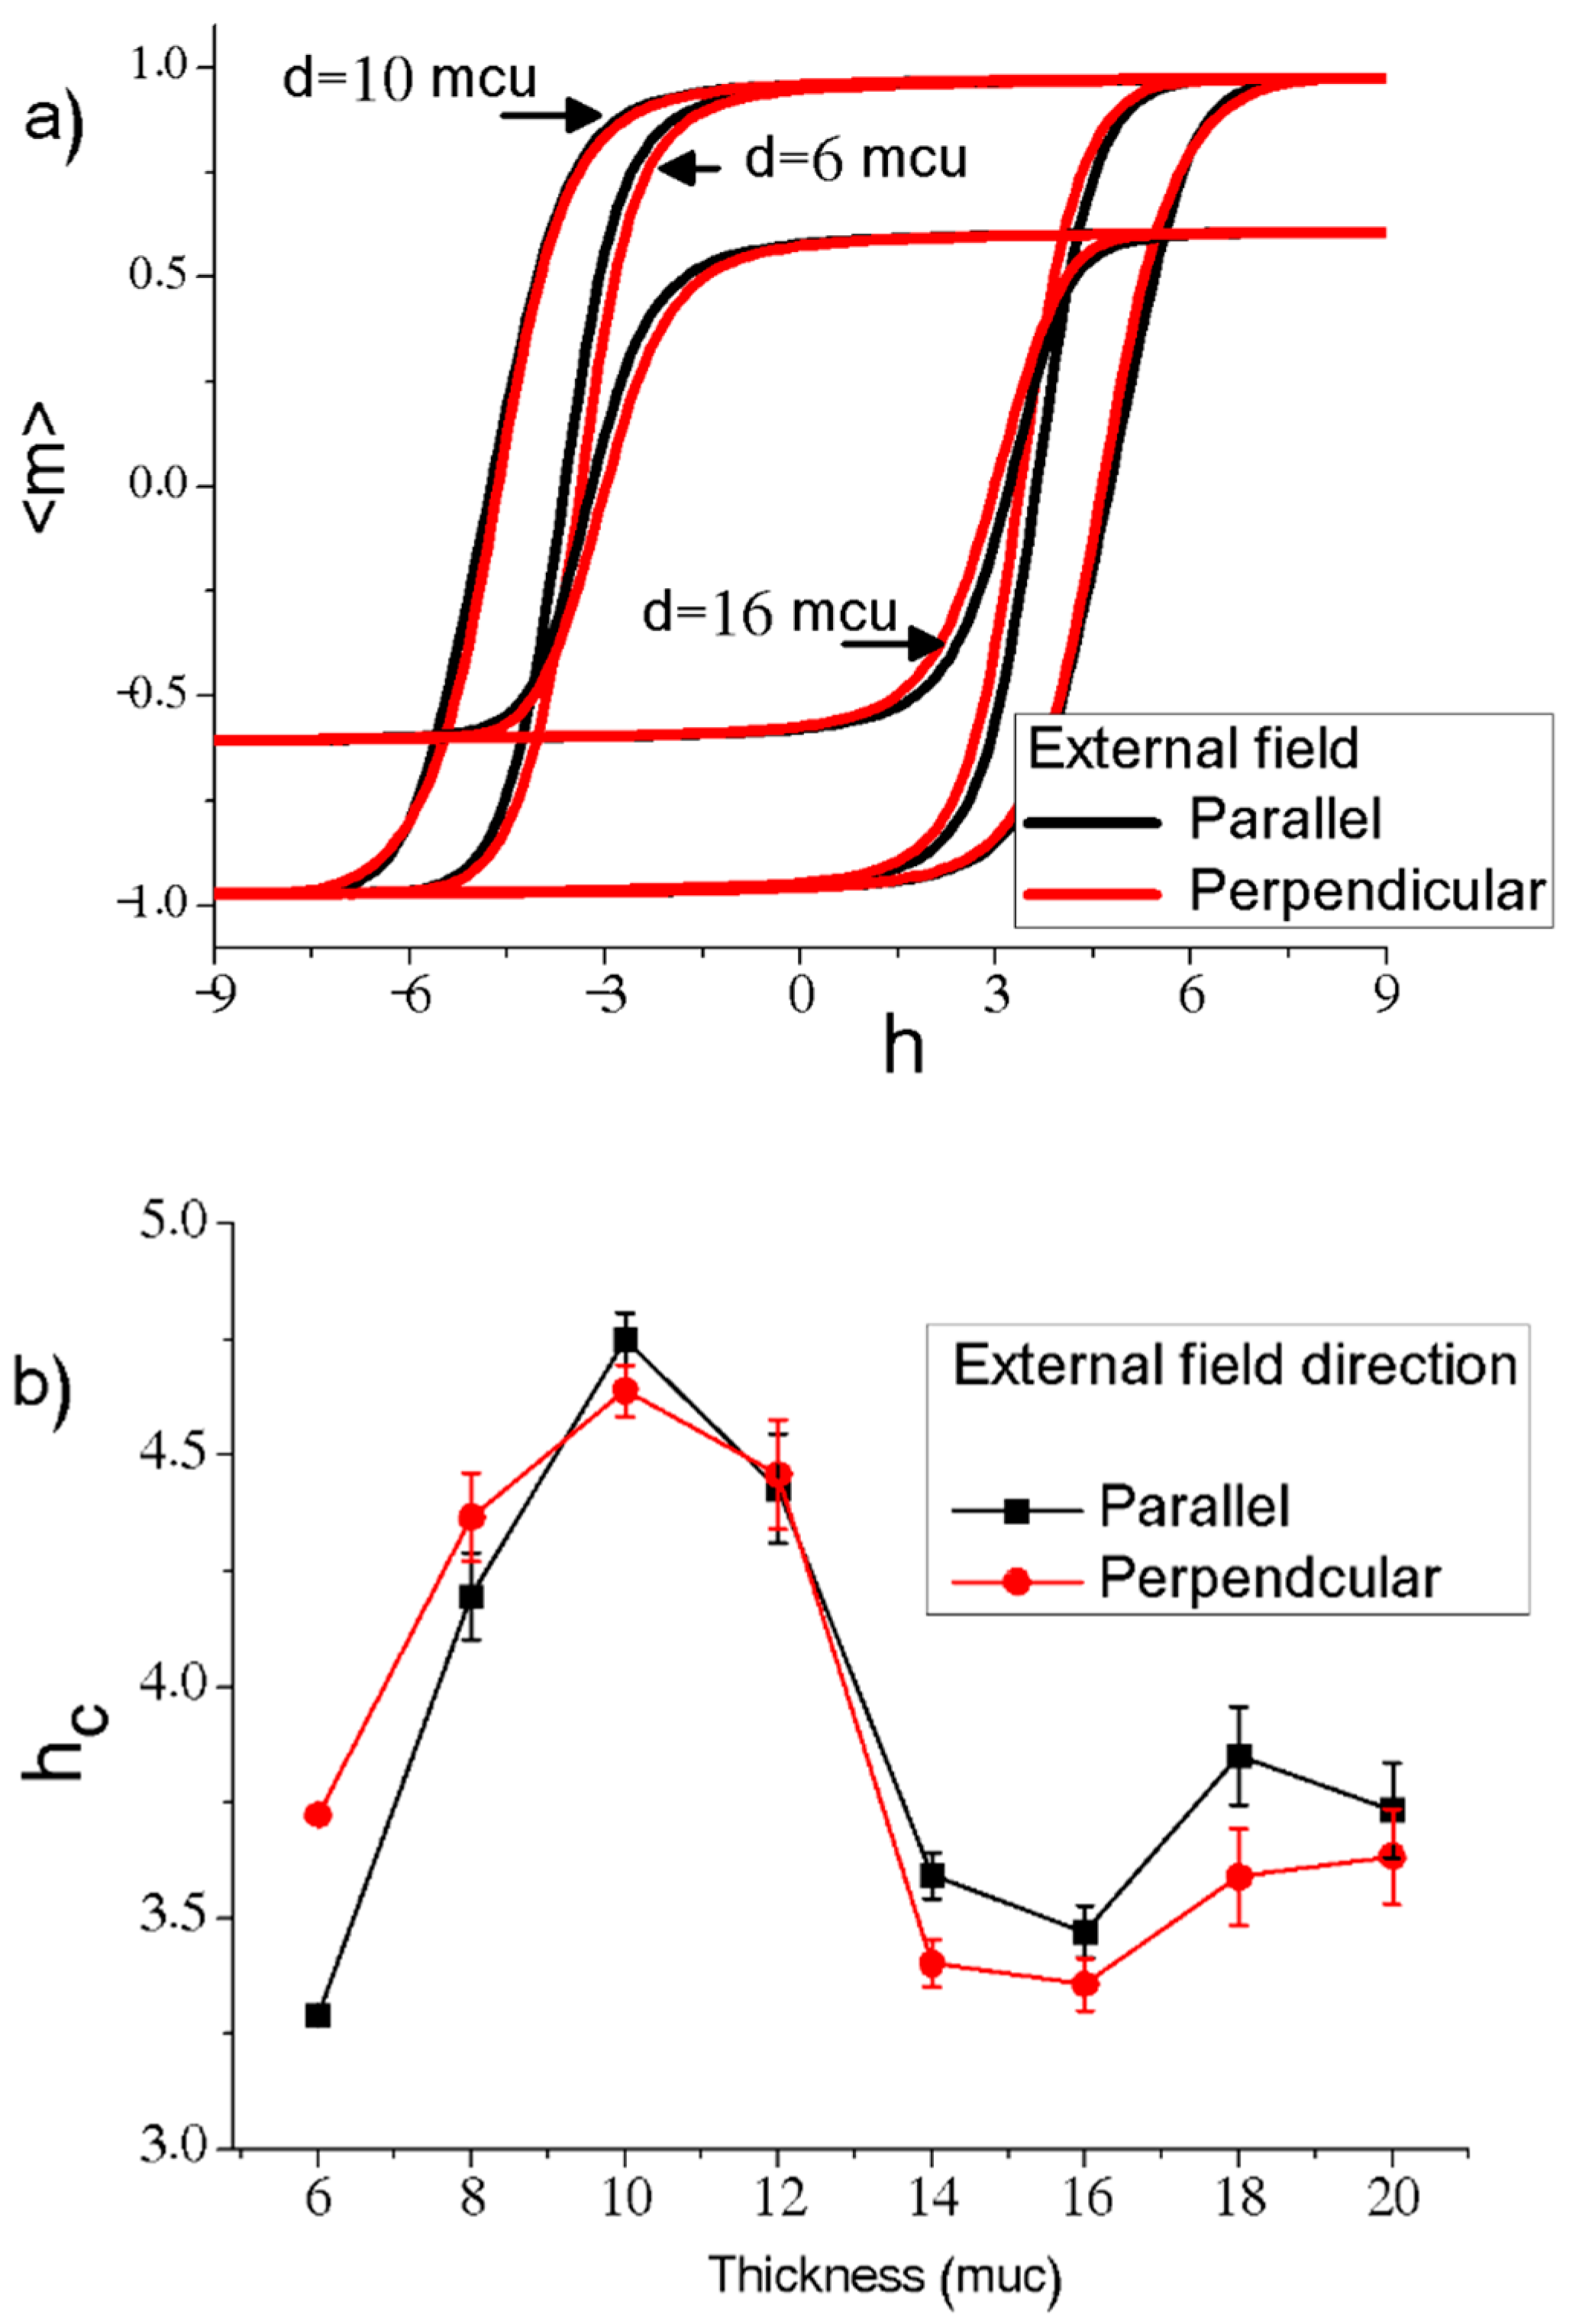
A complementary analysis based on the hysteresis loops’ behaviour, varying the thickness and the temperature, is presented.
Figure 9a presents hysteresis loops at 20 K for films at different thicknesses, for both perpendicular and parallel
xy plane directions. At the same thickness, the results show slight differences in the coercive fields for both cases. These differences are better observed in
Figure 9b, in which
vs thickness is presented. At low thicknesses, the perpendicular
is slightly greater than the parallel
. These variations are due to the preferential perpendicular direction of the film, as was aforementioned. A considerable increment of
is presented between 6 and 10 muc. As was mentioned before, the grains at this low thickness have an in-plane deformation. That situation contributes to an increment of the local anisotropy because of three reasons: (i) a monodomain state is preferentially observed at low thicknesses, (ii) these thicknesses correspond with a reduction of the fraction of atoms in the grain boundaries (as was presented in
Figure 2), and (iii) a magnetic correlation length increases in the in-plane direction, due to the in plain grain deformation. Some experimental results have presented changes in the coercive field for low thicknesses in the order of nm [
41,
42]. In particular, Neuweiler et al. [
41] argued that when the grains are coupled only in two dimensions (low thickness), due to the fact that both film thickness and grain size exhibit a similar order of magnitude an increase in the local anisotropy energy is observed, and therefore higher values of
Above 12 muc, an inverse effect is observed; the perpendicular is lower than the parallel due to the loss of the surface effect and preferential in-plane alignment caused by the dipolar interaction. With the presence of a multidomain regime at medium thicknesses, 14 and 16 muc, dipolar interaction appears to try to orient the grains with a low number of (or without) film surface atoms in in-plane alignments. As a result of the competition between surface anisotropy and dipolar interaction, the sample is weak magnetically, and decreases. At high thicknesses, above 18 muc, the surface anisotropy effect is minimum, and the dipolar interaction continues with an in-plane tendency. This increases in a parallel direction. However, perpendicular coercivity also presents increments with thickness. Then, this is a result of local anisotropies in the grains. This becomes more stable in the directions established by magnetocrystalline anisotropy for large grains. By the randomness of crystalline anisotropy, all of the grains have some grade of perpendicular contribution increasing the perpendicular .
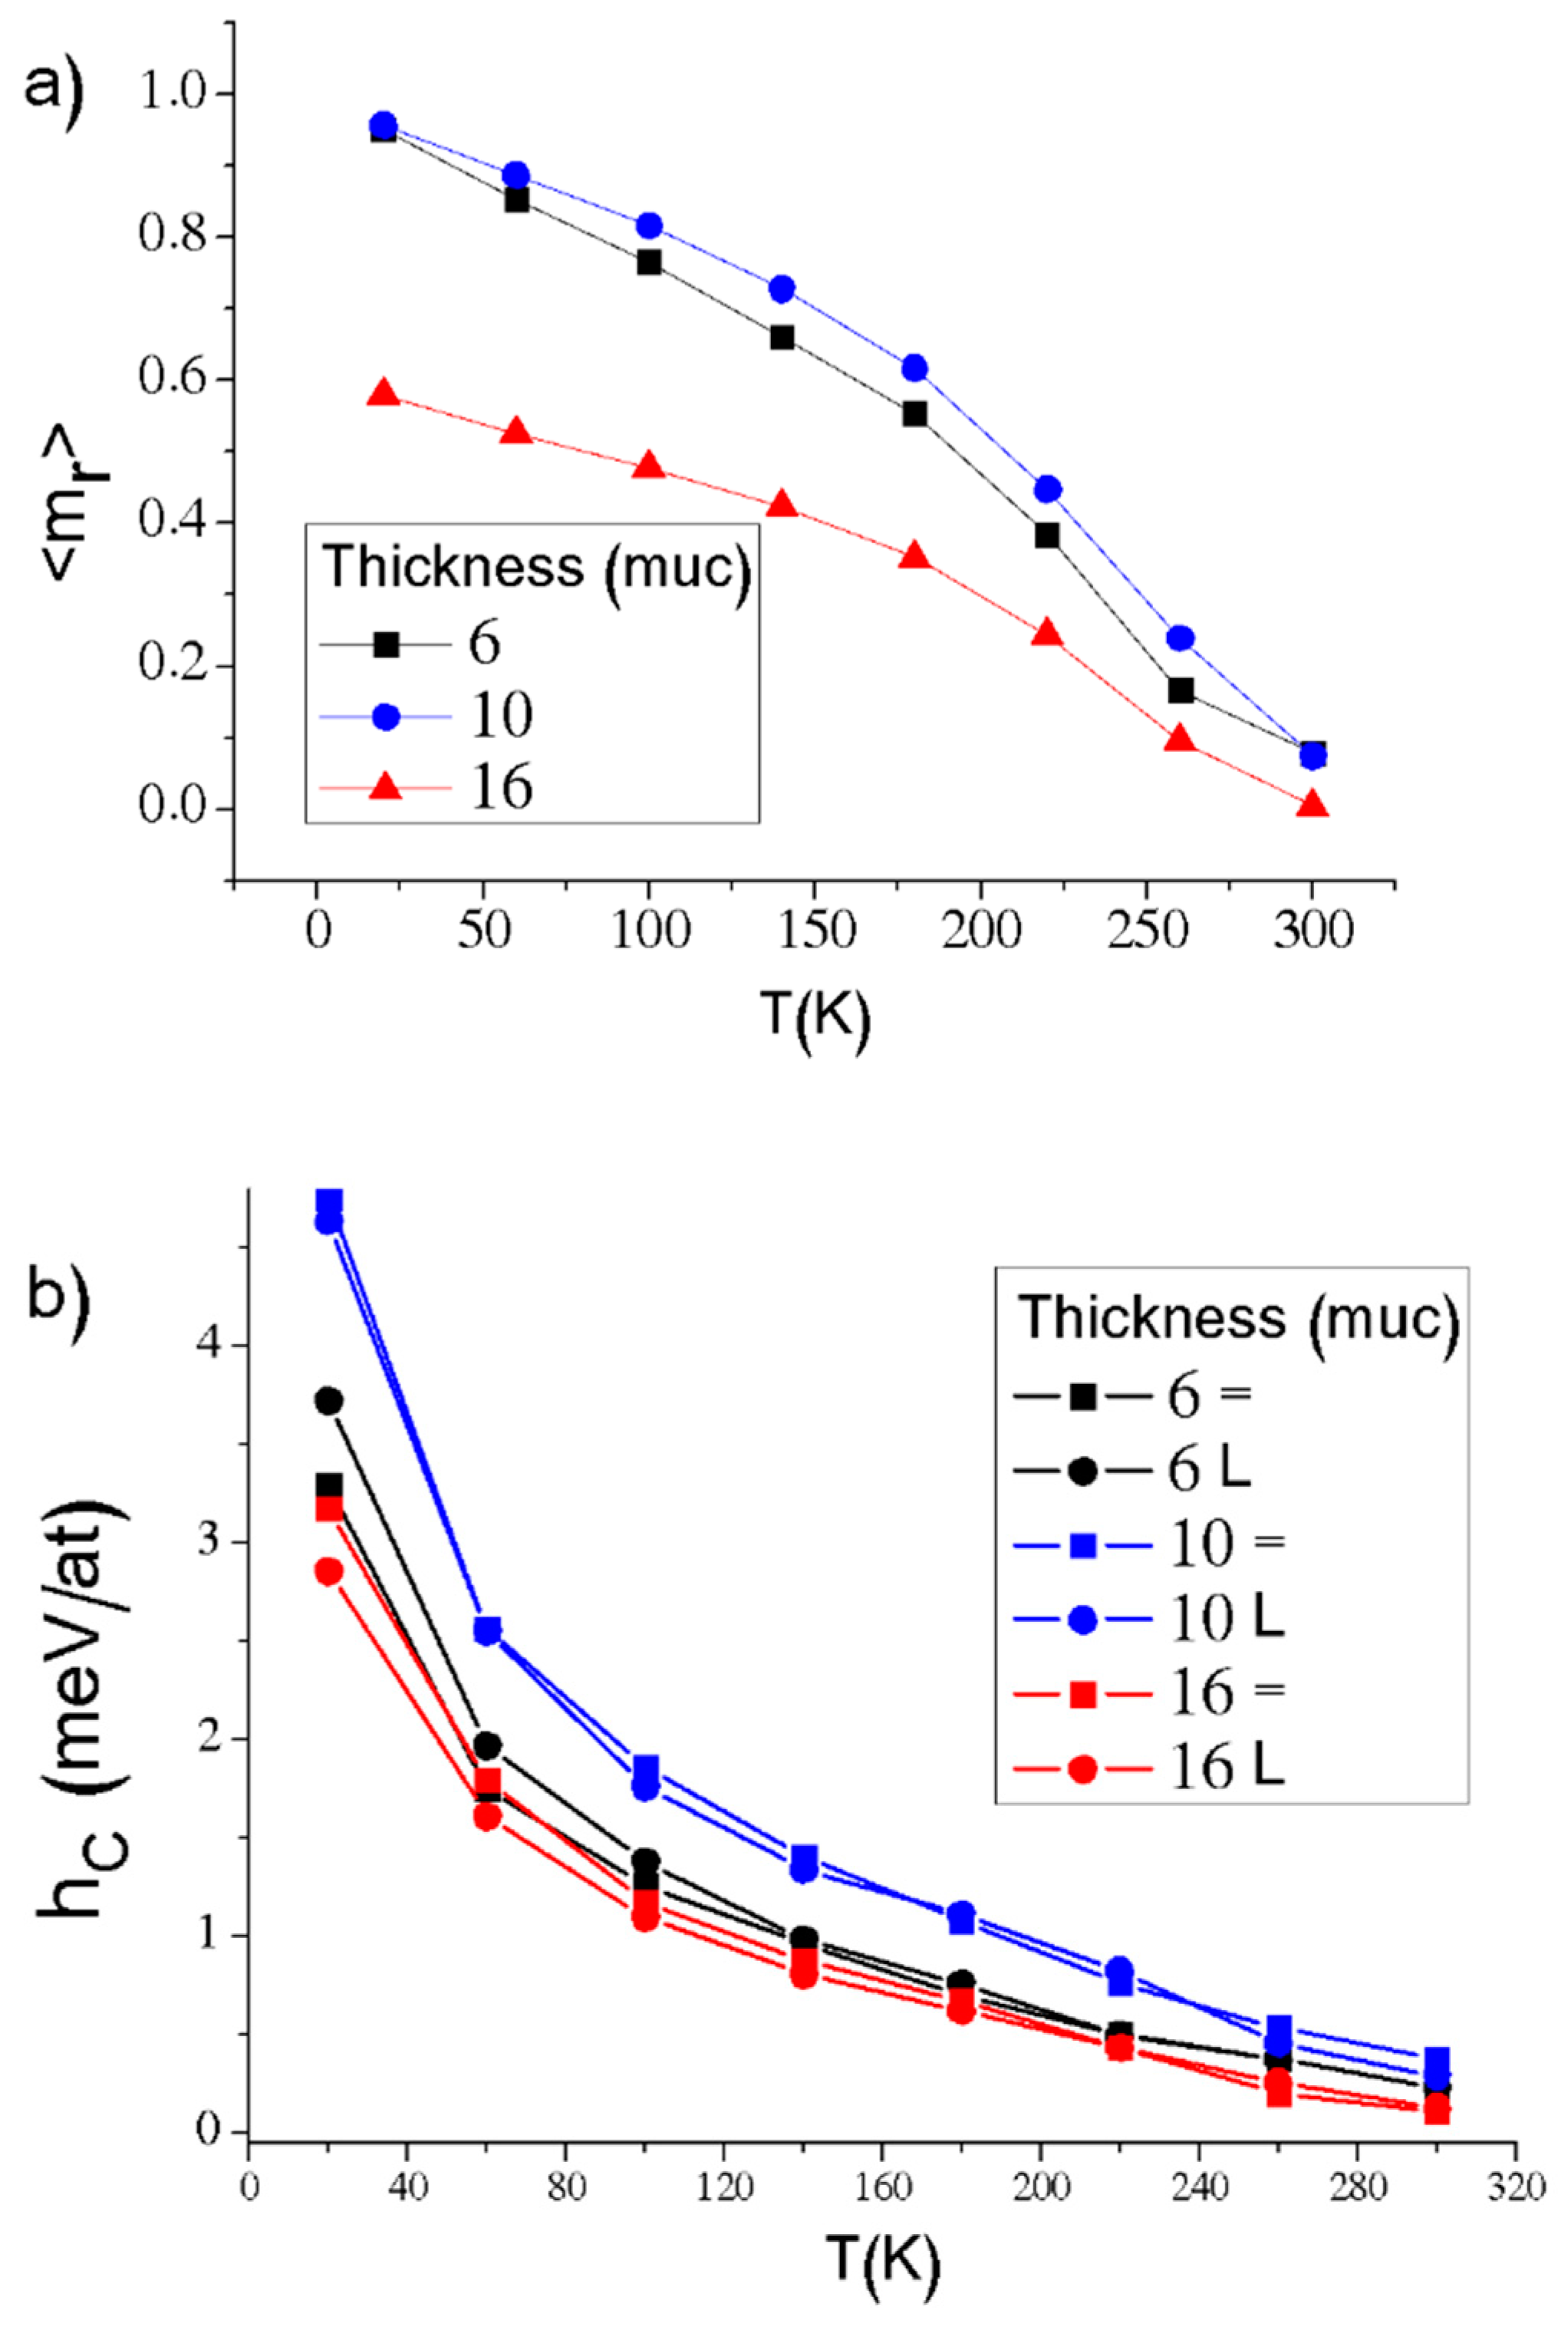
On the other hand,
Figure 10a,b show the remanence magnetization and coercive field depending on the temperature, respectively. Different thicknesses were simulated; nevertheless, only 6, 10 and 16 muc are presented. The error bars are not included because this size is in the order of the mark. At a fixed temperature,
makes that not present a defined tendency as a function of the thickness. However,
at 16 muc is presented, because this obtained the lowest value. That lower value is due to a high effect of dipolar interaction, where magnetic moments are localized parallel to the
xy plane, but in different directions, as a response to the strong single-domain tendency per grain (or small set of grains). The remanence is similar regardless of the external field’s direction, parallel or perpendicular to the film. Finally,
presents a typical exponential decreasing behaviour with the temperature [
43]. The slight differences between parallel
and perpendicular
can be observed mainly at low temperatures.


