Article

More is not Always Better: The Relation between Item Response and Item Response Time in Raven’s Matrices

1
German Institute for International Educational Research (DIPF), Centre for International Student Assessment (ZIB), Schloßstr. 29, 60486 Frankfurt am Main, Germany
2
Goethe-University of Frankfurt, Senckenberganlage 31, 60325 Frankfurt am Main, Germany
3
ECCS unit, University of Luxembourg, 11, Porte des Sciences, 4366 Esch, Luxembourg
*
Author to whom correspondence should be addressed.
Submission received: 28 November 2014 / Revised: 19 February 2015 / Accepted: 25 February 2015 / Published: 12 March 2015

Abstract

:
The role of response time in completing an item can have very different interpretations. Responding more slowly could be positively related to success as the item is answered more carefully. However, the association may be negative if working faster indicates higher ability. The objective of this study was to clarify the validity of each assumption for reasoning items considering the mode of processing. A total of 230 persons completed a computerized version of Raven’s Advanced Progressive Matrices test. Results revealed that response time overall had a negative effect. However, this effect was moderated by items and persons. For easy items and able persons the effect was strongly negative, for difficult items and less able persons it was less negative or even positive. The number of rules involved in a matrix problem proved to explain item difficulty significantly. Most importantly, a positive interaction effect between the number of rules and item response time indicated that the response time effect became less negative with an increasing number of rules. Moreover, exploratory analyses suggested that the error type influenced the response time effect.

1. Introduction

Response and response time are fundamental and complementary aspects of item performance. When thinking about how item response time relates to item response it is useful to distinguish between the within-person level (i.e., within a fixed person) and the level of a population of fixed persons [1].
At the within-person level, person parameters underlying item response and item response time, that is ability and speed, may change. Basically, it is assumed that for a given person working on a particular item, response time and response relate negatively to each other. That is, if the person takes or is given less time to complete the item, the probability to obtain a correct response is supposed to become smaller. This very common relation is a within-person phenomenon and known as speed-accuracy tradeoff (e.g., [2]). The tradeoff suggests that the validity of responses associated with extremely short response times, for instance, due to a lack of test-taking effort, is questionable. Thus, for ability measures, such (more or less random) responses are supposed to be excluded from the estimation of ability scores [3,4]. Similarly, in (experimental) response time research, trials with extreme response times may be trimmed to avoid nuisance variables such as attentional distraction affecting the skewness of the response time distribution [5]. In addition, response time measures may be solely based on response times from correct trials (e.g., [6]).
At the population level person parameters underlying item response time and item response are assumed to remain constant within persons (i.e., fixed persons). Thus, everything else held constant, the relation between response time and response depends on between-person differences whereas within-person differences are not expected. At the population level the relation between item response time and response can be very different depending, for example, on the respective construct and involved cognitive processes [7], on item characteristics [7,8] as well as person characteristics [7,9,10].
In the present study, the focus is on the level of a population of fixed persons showing differences in item response and item response time in a set of reasoning items. Reasoning, represents a main constituent of general cognitive ability [11]. We investigated how differences in the test takers’ item response times are related to their responses in reasoning items. Are short response times associated with incorrect responses and long response with correct responses or vice versa? Does this association depend on item and person characteristics, and how would these associations fit with previous research? Addressing these questions will firstly improve our understanding on the process of how reasoning items are solved. Secondly, it will further complete the heterogeneous picture on the relation between response times and responses by including the domain of reasoning. We address these questions by investigating responses and response times of high school and university students to Raven’s Advanced Progressive Matrices (APM) [12] assessing figural reasoning.

1.1. The Relation of Item Response Time to Item Responses

At the population level, one line of research investigated the relation between responses and response times by means of measurement models defining the latent person parameters slowness and ability. The obtained results show a wide range of slowness-ability correlations. For instance, for reasoning, positive correlations between slowness and ability were found (e.g., [13,14]), for arithmetic a zero correlation [15], and a negative correlation for basic computer skills [16]. In a recent study, a positive relation between the slowness and ability of complex problem solving was revealed [17]. These findings indicate that in tasks that require understanding new problem situations and in which the use of complex cognitive processes is mandatory, higher effective ability is usually associated with lower speed.
Based on observed response and response time data, Lasry, et al. [18] showed that response times when working on conceptual questions in physics were longer for incorrect than for correct answers, suggesting a negative relation between response time and response (see also [8]). As another example from a completely different domain, Sporer [19] demonstrated that in eyewitness identification the persons who accurately identified the correct target person were much faster than persons falsely identifying an innocent person, suggesting also a negative relation between response time and response.
Using an explanatory item-response modeling approach, Goldhammer, et al. [7] also found that the effect of item response time on item response depends on the investigated construct. They found negative (random) effects for reading literacy, whereas positive (random) effects were revealed for problem solving in technology-rich environments.
Despite the wealth of existing literature, theoretical accounts explaining and predicting the strength and the direction of the relation of response time to responses are sparse. In a recent approach presented by Goldhammer, et al. [7], dual processing theory [20,21,22] was used to predict the relation between responses and response times. The authors argued that the strength and direction of the item response time effect on the item response depends on the relative degree of controlled vs. automatic processing. In the mode of controlled processing long response times indicate thorough and engaged task completion increasing the probability for task success. This suggests a positive effect of response time on a successful response. However, in the mode of automatic processing short response times indicate that the skill has been automatized, which is associated with higher probability for task success, whereas long response times indicate less automatized and more error-prone processing [23]. From this a negative effect of response time on successful response follows.
Following Goldhammer, et al. [7], the degree to which an item is completed in the mode of controlled vs. automatic processing can be assumed to depend on the combination of the ability profile of the person completing the item and the demands of the item itself. If the item is relatively easy, information processing elements can pass to automatic processing. However, difficult tasks are expected to require controlled processing to a larger extent and information processing elements are less amenable to automatic processing. In a similar vein, very able persons are assumed to be in command of well-automatized procedures within task solution subsystems that are apt to automatization, whereas less able persons are expected to accomplish tasks with higher demands of controlled and strategic processing than very able persons. The theoretical assumptions posed by Goldhammer, et al. [7] were empirically confirmed in a large sample obtained from the large-scale study Programme for the International Assessment of Adult Competencies (PIAAC).

1.2. The Role of Response Time in Solving Reasoning Items

The empirical association between response times and responses in reasoning has been investigated in different ways over several decades (for a review see [11]). For instance, in the study by Hornke [10] data from an adaptive matrices test was used to explore the person’s mean response time for correct and incorrect responses and to relate them to person parameter estimates (representing the ability). Descriptive results revealed that incorrect responses took longer than correct responses, suggesting a negative relation of response time to response (for similar results in a verbal memory task see [24]). Interestingly, the negative difference between correct and incorrect response times decreased with decreasing ability suggesting that the relation of response time to response is moderated by person ability. Similarly, Beckmann [25] (see also [26]) could show that in reasoning items incorrect responses took longer than correct responses, and that this response time difference was decreased in groups showing a lower test score.
Neubauer [27] investigated the correlation between the average response time and the Raven’s test score indicating ability and found a zero correlation. However, for item clusters of low, medium, and high difficulty, he found a negative, zero, and positive correlation of the respective average response time with the test score. Thus, overall there was no association between average response time and test score, but it was moderated by the difficulty of items that were used for calculating average response times (for a similar moderation by item difficulty in a word recall task see [28]). He concluded that persons scoring high in the Raven test took less time to answer easy items, but tended to take more time for difficult items than persons with low Raven scores.
In the present study the relation of item response time to item responses in reasoning was investigated by means of the Raven test which is a standard measure of figural reasoning. Carpenter, et al. [29] presented a theoretical account of processing in the Raven test. They concluded that matrices items are solved by incremental (serial) processing including the encoding and induction of rules. Skilled persons do very well in the induction of abstract relations and in the simultaneous management of multiple goals in working memory. Thus, solving reasoning items can be expected to be completed primarily in the mode of controlled processing [30]. Following the dual processing theory account of response time effects as proposed by Goldhammer, et al. [7], this suggests an overall positive response time effect as opposed to the findings of Hornke [10] and Beckmann [25]. Furthermore, the dual processing theory account predicts that the response time effect varies across persons and items, which is also suggested by the results presented by Hornke [10], Beckmann [25], and Neubauer [27]. To improve the theoretical understanding of how the response time effect is moderated by item difficulty and person ability, the characteristics that are supposed to explain item difficulty and person ability and their interaction with response time can be tested. For instance, the number of rules to be induced can be expected to be a major determinant of item difficulty in matrices item (cf. [29]). In the present study, this item characteristic was used to explain the assumed moderation of the response time effect by item difficulty.
Note that the illustration of results on reasoning and other domains cannot be compared directly if the underlying methodological approaches differ. In the studies presented above, response times were related to responses by using separate measurement models, by explanatory item-response models taking item response time and further covariates at person and item level into account, or simply by comparing average responses times for correct and incorrect responses at different levels of aggregation. However, the examples within a certain methodological approach make clear that the heterogeneity in strength and direction of the relation between response time and response cannot be explained as a mere methodological artifact.

1.3. Research Goal and Hypotheses

Based on the dual processing theory account of response time effects [7], the overall goal of the present study was to investigate how the association of item response time to item response is moderated by item and person in Raven’s figural reasoning test.
In Hypothesis 1, we assumed that in reasoning item response time shows overall a positive effect. Completing reasoning items by definition requires controlled cognitive operations to a large extent [30] suggesting that test takers spending more time are more successful in solving items.
In Hypothesis 2, we assumed that the strength and direction of the item response time effect depended on person ability. For a given item, persons may differ in the extent to which information processing elements that can pass into automation are actually automatized. Skilled persons have effective routines available (cf. the speed to induce rules, [31]) whereas less skilled persons need to be in the mode of controlled processing. From this follows that for able persons the response time effect is adjusted to the negative direction and for less able persons to the positive direction.
In Hypothesis 3, we assumed that the strength and direction of the item response time effect depended also on item difficulty. Easy items were assumed to be more apt for automatic processing, whereas difficult items require more controlled processing. In an easy matrices item, for instance, with only a single and obvious rule governing the variation of graphical elements, the rule can probably be induced and the corresponding response alterative be derived quickly whereas longer response times would point to a wrong understanding of the problem. Thus, we assume that for easy items the response time effect is adjusted to the negative direction and for difficult items to the positive direction.
Finally, in Hypothesis 4, we assumed that the moderation of the item response time effect by item difficulty (see Hypothesis 3) could be explained by the item characteristic “number of rules to be induced” which can be expected to be a major determinant of item difficulty (cf. [29]). Thus, for items including less rules to be induced (i.e., easier items) the response time effect was expected to be adjusted to the negative direction and for items including more rules (i.e., more difficult items) it was expected to be adjusted to the positive direction.

2. Materials and Methods

2.1. Sample

Participants were 230 German high school and university students. Seventy-nine were male (34.35%) and 151 were female (65.65%). The average age was 24.48 years (SD = 3.98). Most of them received a financial reward for participation; a few participants who studied psychology received partial course credit for participation. Participants were assessed individually or in pairs in a lab room supervised by a student assistant.

2.2. Instruments

Reasoning performance was assessed by a fully computerized version of Raven’s [12] Advanced Progressive Matrices (APM). In the present study, Form 2, Set II of the APM, consisting of 36 items was used [32].
The figural APM items consist of 3 × 3 matrices composed of geometrical elements. For each item, one element is missing, and the task is to select the missing element from a set of eight figures so that the rule(s) indicated by the first eight elements in each item is fulfilled. The APM test was administered without a time limit to make sure that test takers’ decisions on response times were not confounded with individual differences in dealing with a time limit. The computer-based test system provided for each item the scored response (correct vs. incorrect), the response time (in seconds), and the choice of the response alternatives (correct response or one of seven distractors).
For testing Hypothesis 4, we derived an item level covariate representing the number of rules for each of the 36 APM items based on the taxonomy by Carpenter, et al. [29]. The taxonomy distinguishes five rules defining the variation of graphical objects in APM matrices: constant in a row, quantitative pairwise progression, figure addition or subtraction, distribution of three values, distribution of two values. APM items include multiple rules, which are different rule types or different instances of the same type of rule. Overall, Carpenter, et al. [29] classified 25 of 36 APM Set II items with respect to the kind and number of rules involved. The covariate number of rules was available for items with the Raven No. 1, 3, 4, 5, 6, 7, 8, 9, 10, 12, 13, 14, 16, 17, 22, 23, 26, 27, 29, 31, 32, 34, 35 and 36, and ranged from one to five rules per item. For testing Hypothesis 4 only these 25 items with a known number of rules were included, whereas for testing Hypotheses 1, 2 and 3, all items were used.
In addition to the APM, participants completed other cognitive measures, which were not included in the present study.

2.3. Statistical Analyses

Following Goldhammer, et al. [7], a random item response time modeling approach within the generalized linear mixed models (GLMM) framework (e.g., [33,34,35]) was used. The basis was a 1-Parameter Logistic (1PL) item response model with random persons 𝑝 and random items 𝑖 [36]: η p i = β 0 + b 0 p + b 0 i (model 0) where η p i denotes the logit of the probability for a correct response, β the fixed effects and 𝑏 the random effects, b p e r s o n ~ N ( 0 , Σ p e r s o n ) ,   b i t e m ~ N ( 0 , Σ i t e m ) , with Σ as the respective covariance matrix of the random effects. More specifically, b 0 p represents the person intercept (i.e., ability), b 0 i the item intercept (i.e., easiness), and β 0 the general intercept (i.e., logit for an average item completed by an average person).
For testing Hypothesis 1, 2 and 3 the 1PL model was extended to model 1 by introducing an item response time effect which may vary across persons 𝑝 and items 𝑖:
η p i = β 0 + b 0 p + b 0 i   +   ( β 1 + b 1 p + b 1 i ) t p i
The covariate t p i is the log-transformed item response time r t p i . The overall item response time effect is represented by the fixed effect β 1 . The random item response time effect b 1 p indicates how the fixed effect β 1 is adjusted by person. Similarly, effect b 1 i represents how the fixed effect β 1 is adjusted by item. As the by-person adjustment b 1 p and person intercept b 0 p are tied to the same observational unit, that is, to the same person, their correlation can be estimated as well tested whether the strength of the response time effect depends linearly on person ability. This holds true for the by-item adjustment b 1 i and the item intercept b 0 i .
For testing Hypothesis 4, the effect of the number of rules r i as well as the interaction of response time with number of rules was introduced to obtain model 2:
η p i = β 0 + b 0 p + b 0 i   +   ( β 1 + b 1 p + b 1 i ) t p i + β 2 r i   + β 3 r i t p i
where β 2 represents the fixed effect of number of rules and β 3 the interaction of response time and number of rules.
Note that the fixed effect β 1 represents the overall association between response time and the log-odds of the probability for a correct response. As emphasized by van der Linden [37], responses time represents a compound of person characteristics (slowness or speed) and item characteristics (time intensity). Thus, the effect β 1 cannot be interpreted directly and cannot be used to describe properties of persons and/or items, as the association depends both on the correlation between underlying person parameters, that is, ability and speed, and on the correlation of corresponding item parameters, that is, difficulty and time intensity [1,37]. This problem is resolved by modeling the effect of response time as an effect random across items and/or persons. Thereby, the response time effect by item ( β 1 + b 1 i ) turns response time into an item-specific speed covariate, and the response time effect by person ( β 1 + b 1 p ) turns response time into a person-specific item covariate.
To evaluate whether the 1PL item response model (model 0) basically fit the APM data, we investigated whether the assumption of local item independency was violated for the data by means of Yen’s Q3 statistic which represents the residuals’ Pearson product moment correlations between item pairs [38]. If local item independency holds, the Q3 value was expected to be −1/(n − 1), where n denotes the number of items [39]. For model 0 including 36 items the expected Q3 value was −0.03. As the observed Q3 values, M = −0.02 (SD = 0.08), were close to the expected ones local item independency was assumed.
For comparing nested GLMMs, the likelihood ratio (LR) test as well as Akaike information criterion (AIC) and Bayesian information criterion (BIC) were used [40]. Note there is a problem with the LR test when the null hypothesis implies the variance of a random effect to be zero. This means that the parameter value is on the boundary of the parameter space (boundary effect; cf. [33,34,40]. Using the chi-square reference distribution increases the risk of Type II errors; therefore, the LR test has to be considered as a conservative test for variance parameters. Information criteria such as AIC and BIC suffer from analogous problems (see [41,42]).
For estimation, the glmer function of the package lme4 [43] was used in the R environment [44].

2.4. Data Preparation

In line with Roskam [45] log-transformed response times r t p i were used as predictor, t p i = log  ( r t p i ) . As a next step, the (log-transformed) response time distribution of each item was inspected for outliers which were defined as observations with response times three standard deviations above (below) the mean. Outlier response times and related responses were omitted from data analysis; thus, only observations within the range of mean response time ∓3SD were included in the GLMM analyses. With this trimming approach, overall 0.08% of the data points were identified as outliers.
Furthermore, the (log-transformed) item response time, t p i , and the number of rules, r i , were grand mean centered. Thereby, the main effects of the two continuous predictor variables can easily be interpreted as the effect that is expected when the other variable shows an average value (of zero).
Note, there are other transformations than log  ( r t p i ) possible. For instance, a reciprocal transformation, 1 / r t p i , may be more suitable for power tests than log transformation (cf. [46]). In the case of log transformation the probability for success approaches 1 with infinite response time whereas in the case of reciprocal transformation the probability approaches just the probability of l o g i t 1   ( β 0 + b 0 p + b 0 i ) . Therefore, we conducted all analyses presented in the following also using the 1 / r t p i transformation. Exactly the same result pattern was obtained with response time effects and random effect correlations being reversed due to the reciprocal transformation. Thus, empirically the kind of transformation did not make a difference.

3. Results

3.1. Response Time Effect (Hypothesis 1)

Given that reasoning requires controlled cognitive processing, we expected item response time to show overall a positive effect. Disconfirming Hypothesis 1, model 1 revealed a significant negative fixed effect of item response time, β 1 = 0.65   ( z = 5.52 , p < 0.001 ) . Thus, everything else held constant, longer response times were associated with lower probability to obtain a correct response. As a second fixed effect, β 0 = 1.74   ( z = 6.81 , p < 0.001 ) was estimated (indicating the logit of the probability for success for a person showing average ability and spending average time when completing an item of average difficulty).

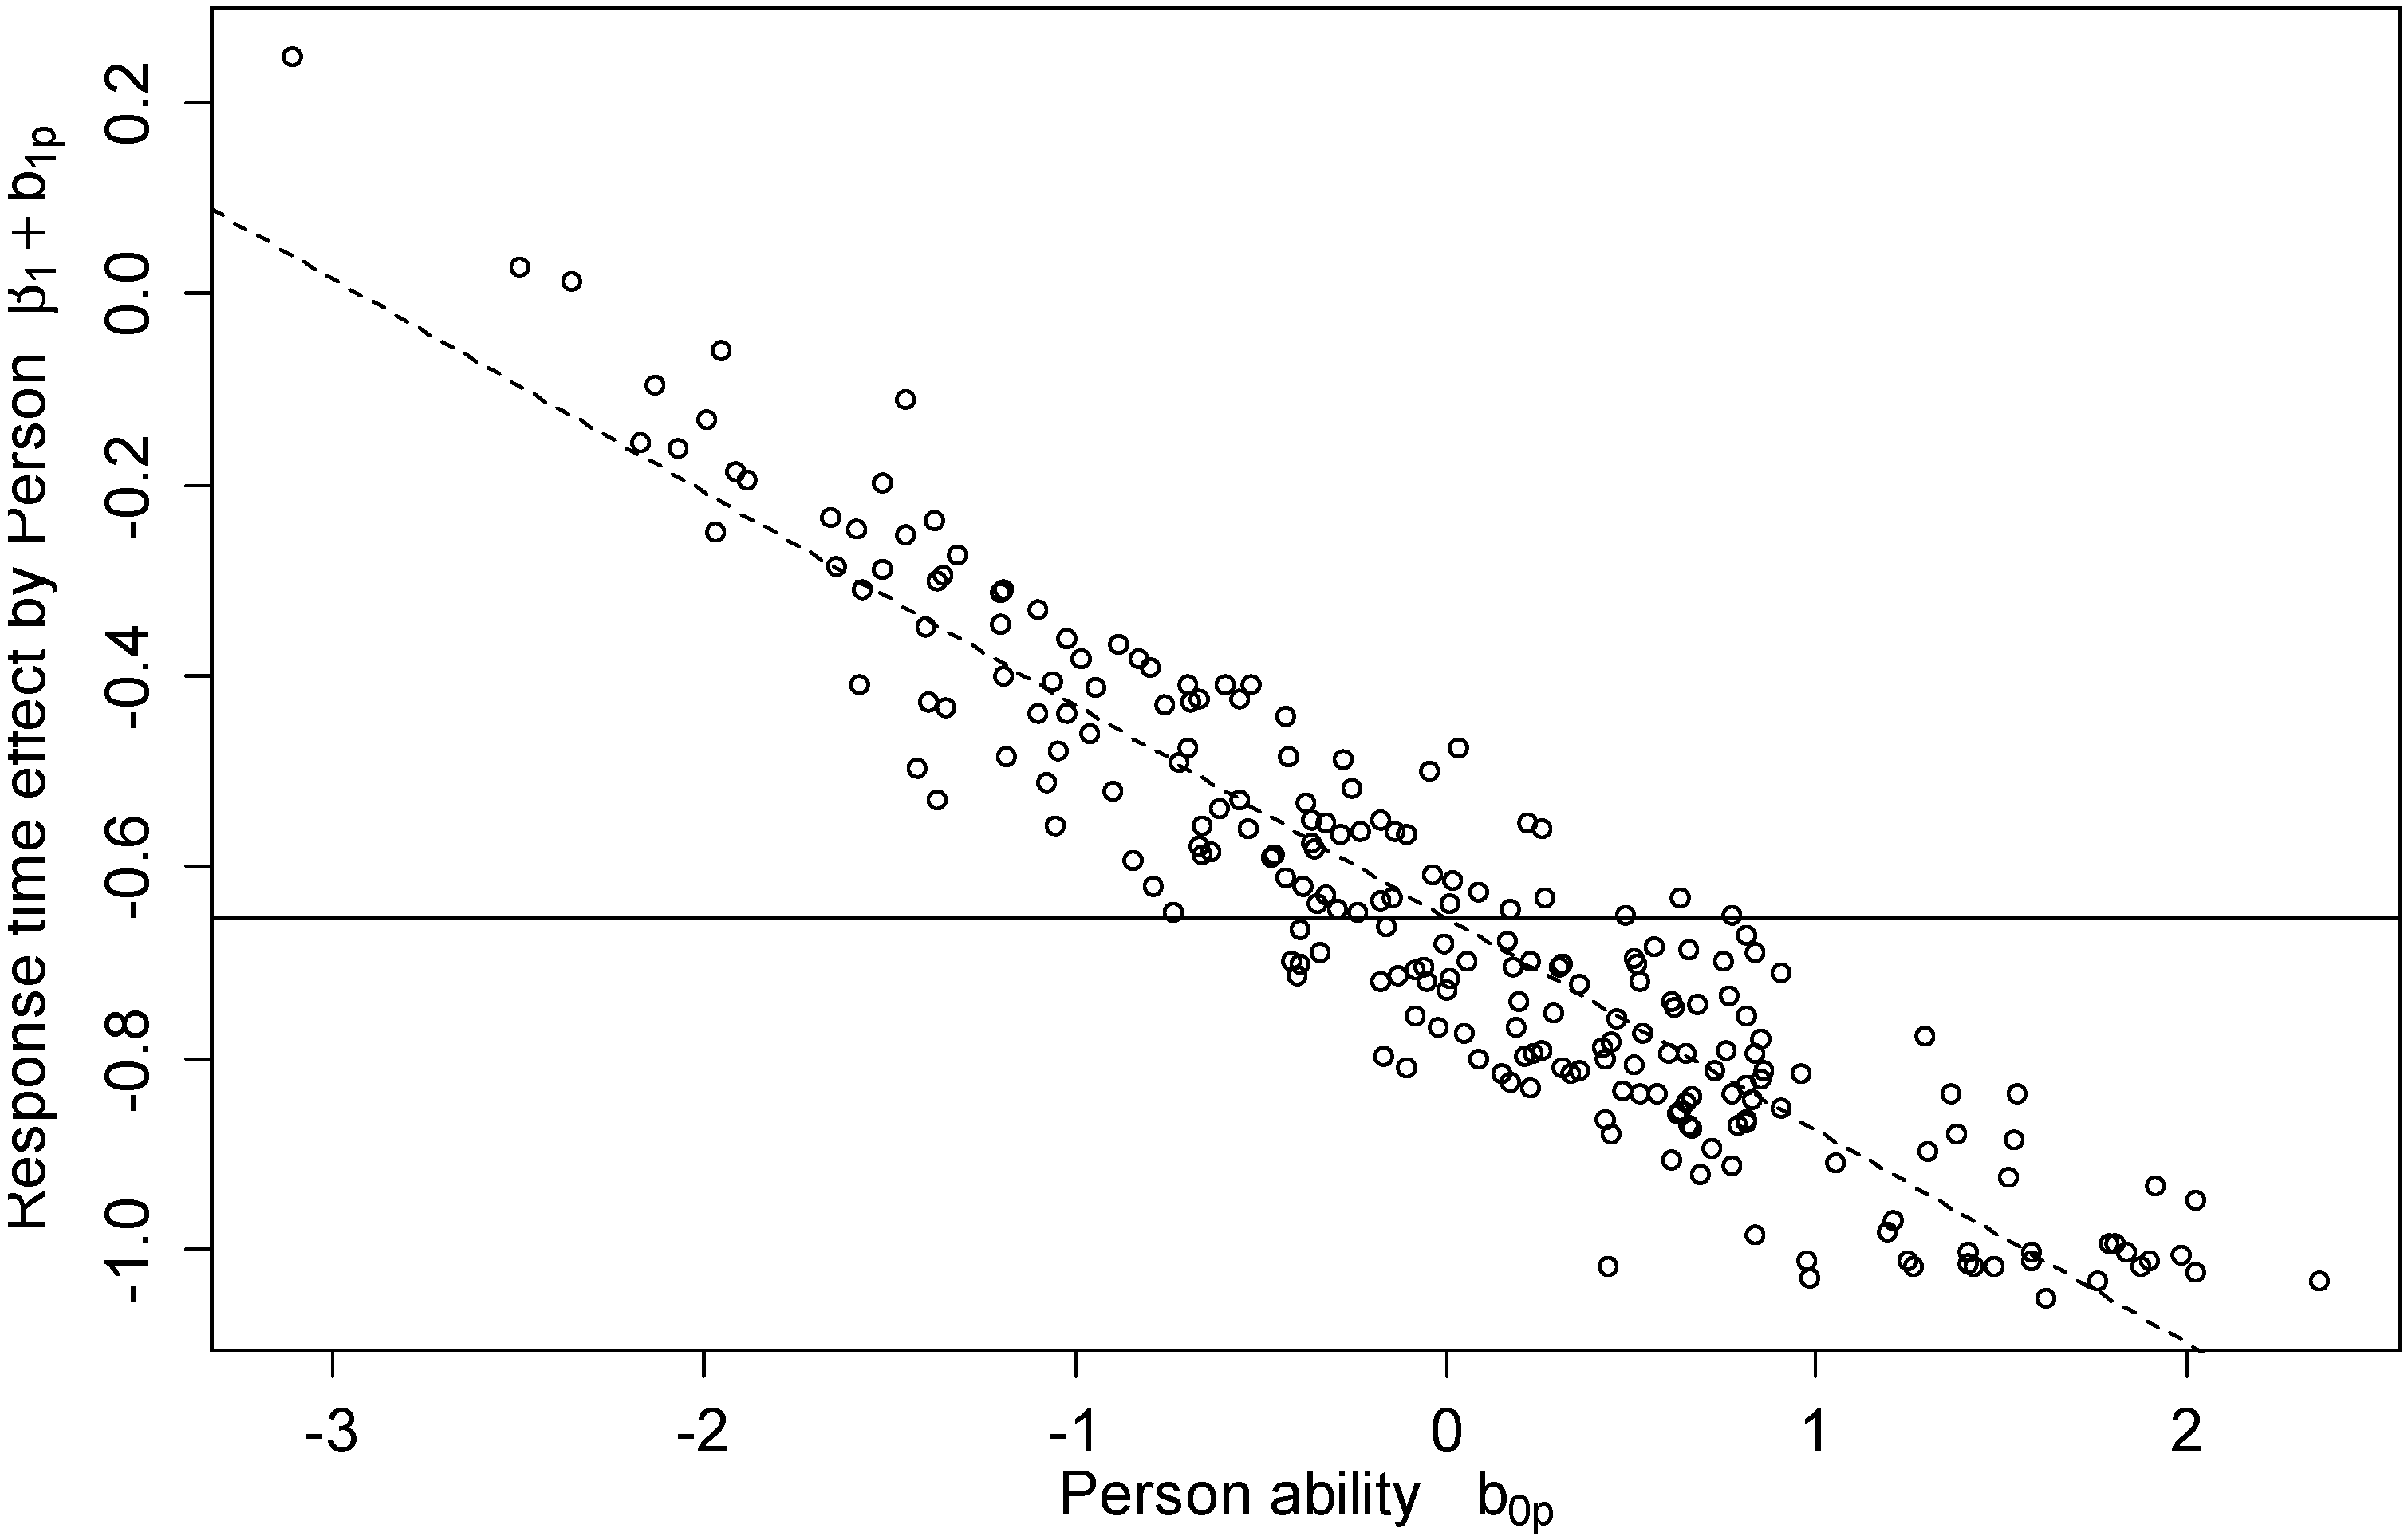
3.2. Response Time Effect Moderated by Person (Hypothesis 2)

Testing model 1 also revealed that the variance of the by-person adjustment to the item response time effect was V a r   ( b 1 p ) = 0.14 . Thus, the item response time effect varied across persons as expected in Hypothesis 2. Most importantly, a correlation between the by-person response time effect and by-person intercept of C o r ( b 0 p , b 1 p )   =   0.75 was estimated. That is, the overall negative item response time effect became stronger (i.e., more negative) in able persons, but was attenuated in less able persons. Figure 1 illustrates how the response time effect adjusted by person linearly decreases in more able persons. That is, for very able persons, there is strong negative response time effect, meaning that long response times are strongly associated with a lower probability for success. In contrast, for less able persons the response time effect approaches zero suggesting that there is no association between response time and task success.
To clarify whether model 1, including a random item response time effect, better fit the data, a parsimonious model without the random effect across person was tested as well. The model difference test revealed that the full model 1 fit the data significantly better than the restricted version, χ 2 ( 2 ) = 21.41 , p < 0.001 . Consistent to that, the information criteria were smaller for model 1 (AIC = 6842.70, BIC = 6898.80) than for the restricted version (AIC = 6860.10, BIC = 6902.20). To test the significance of the correlation, model 1 was compared with a restricted version without the correlation between by-person item response time effect and intercept. The model difference test revealed that model 1 without restrictions was the better fitting model, χ 2 ( 1 ) = 20.38 , p < 0.001 . The information criteria obtained for the restricted model (AIC = 6861.10, BIC = 6910.20) supported this conclusion.
Thus, Hypothesis 2 was supported. The item response time effect was moderated by person and this by-person adjustment was negatively correlated with person ability.
Figure 1. Item response time effect by person. The solid line indicates the fixed response time effect, the dots show how the response time effect is adjusted by person. For less able individuals the item response time effect gets more positive, whereas for able persons it gets more negative.
Jintelligence 03 00021 g001

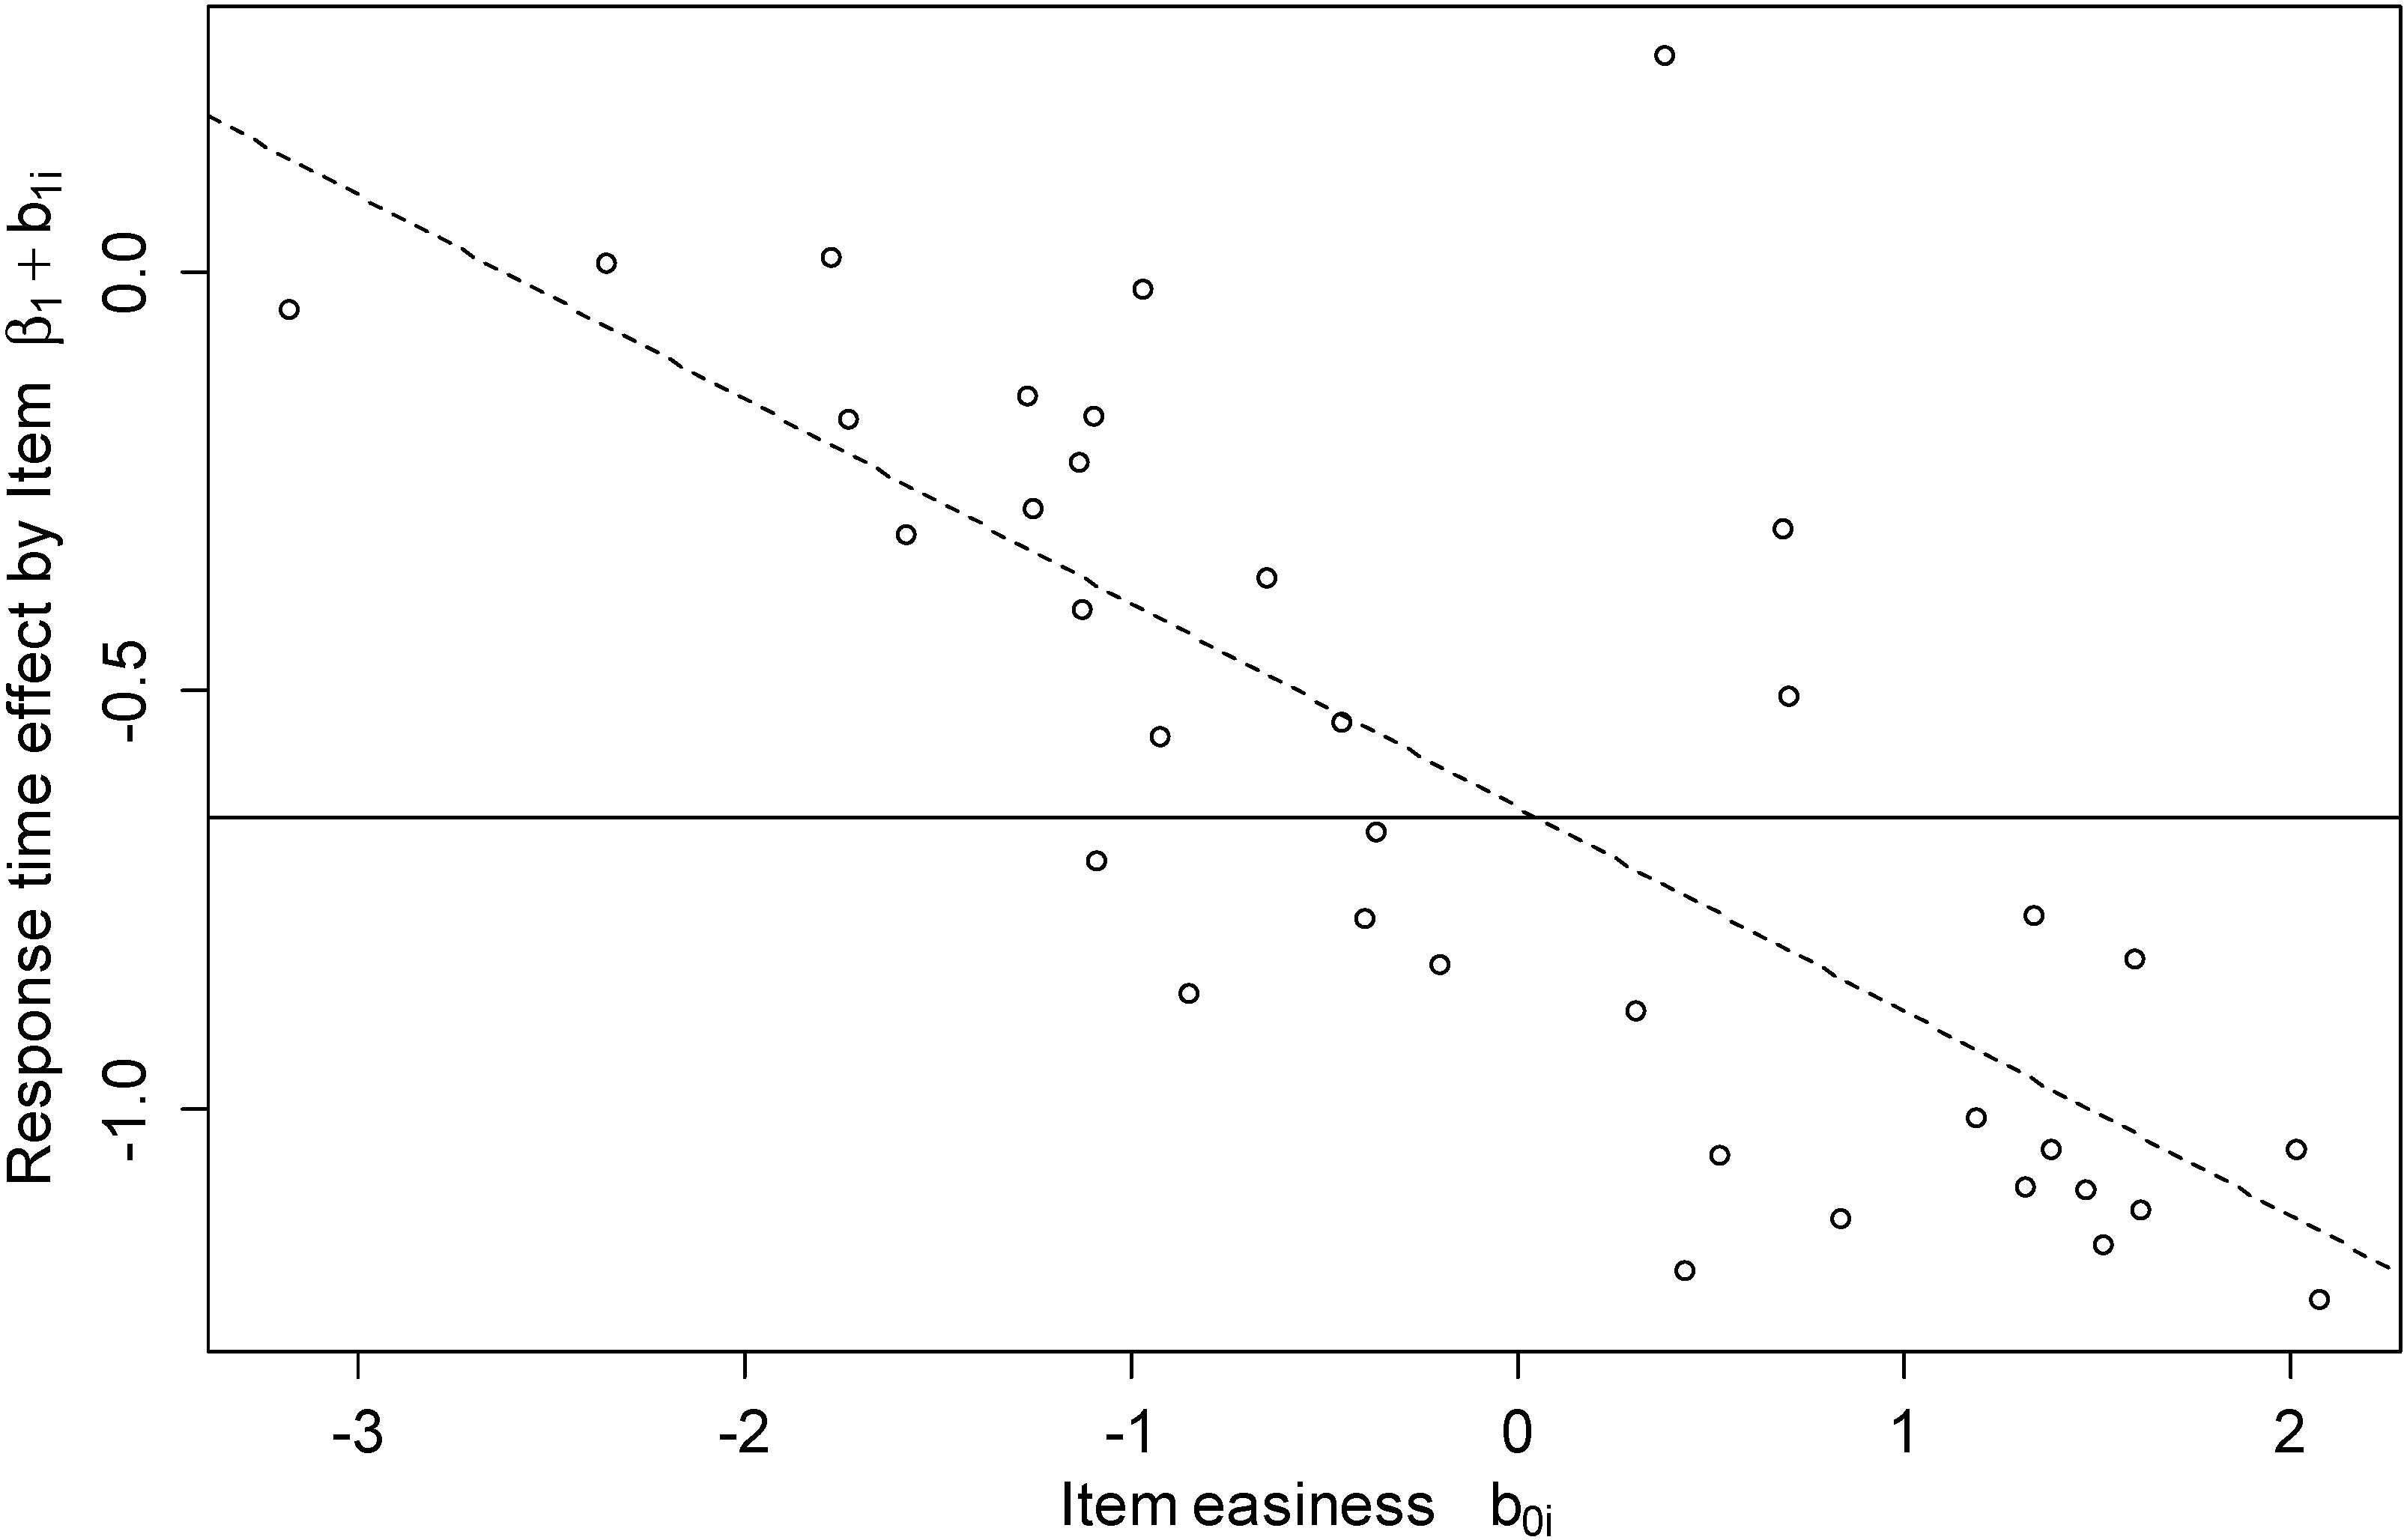
3.3. Response Time Effect Moderated by Item (Hypothesis 3)

In model 1, the variability of the by-item adjustment to the response time effect was estimated to be V a r ( b 1 i )   =   0.26 , suggesting that the response time effect varied across items as expected in Hypothesis 3. Most importantly, the by-item response time effect and intercept were negatively correlated, C o r ( b 0 i , b 1 i )   =   0.67 . That is, the overall negative response time effect became even stronger in easy items but was attenuated in hard items. Figure 2 illustrates how the response time effect was systematically adjusted by item. This means, for easy items, there was a strong negative response time effect meaning that long response times are strongly associated with a lower probability for success. For difficult items, however, the response time effect approached zero suggesting that there is no association between response time and task success.
To test whether the goodness of fit was improved by including a random item response time effect in model 1, we compared model 1 with a restricted version without such a random effect. The model difference test showed that model 1 fitted the data significantly better than the restricted model, χ 2 ( 2 ) = 41.06 , p < 0.001 . This was confirmed by the information criteria which were for the restricted version (AIC = 6879.80, BIC = 6921.80) greater than for model 1. To test whether the correlation parameter was actually needed to improve model fit, that is, to test the significance of the correlation, model 1 was compared to a restricted version, which did not assume a correlation between by-item response time effect and by-item intercept. The model difference test showed that model 1 had a better fit to the data than the restricted version without correlation, χ 2 ( 1 ) = 7.88 , p < 0.01 . Thus, the negative correlation between the by-item adjustment of the response time effect and the random item intercept (i.e., item easiness) was significant. The AIC obtained for the restricted model (AIC = 6848.60) confirmed this finding whereas the BIC of the restricted model (BIC = 6897.70) was slightly smaller than the BIC of model 1.
Taken together Hypothesis 3 was supported. The item response time effect was moderated by item and this by-item adjustment was negatively correlated with item easiness.
Figure 2. Item response time effect by item. The solid line indicates the fixed response time effect, the dots show how the response time effect is adjusted by item. For difficult items the item response time effect gets less negative, whereas it gets more negative for easy items.
Jintelligence 03 00021 g002

3.4. Response Time Effect Moderated by Item and Person (Integrating Hypotheses 2 and 3)

The curves in Figure 3 indicate how for a given participant and for a given APM item the logit of the probability for a correct response depends on response time. The range of the response time axis represents the range of observed item response times. The slope of the lines resulted from adding up the fixed response time effect and the adjustments to the response time effect by item and by person. Two sample persons were selected from the 10% best and the 10% worst test takers. Similarly, two sample items were drawn from the top and bottom quartile. When considering a strong participant (ability level of b 0 p =   1.54 corresponding a percentile rank of 94) and an easy reasoning item (easiness of b0i = 1.38 corresponding a percentile rank of 83), the negative effect of −0.65 became much stronger, resulting in a negative response time effect of −1.23 (solid line). However, in a situation of high demand, where a difficult reasoning item (easiness of b 0 i =   1.27 corresponding a percentile rank of 17) was completed by a weak participant (ability level of b 0 p =   1.57 corresponding a percentile rank of 7), the curve’s slope was no longer negative but even slightly positive, that is, 0.20 (dot and dash line). In situations of medium demand a weak person completes an easy item or a strong person completes a difficult item, the slopes are in between.
Figure 3. Item response time effect by item and person. For combinations of two items (easy vs. hard) with two persons (less able vs. able) the logit of the probability to obtain a correct response is plotted as a function of item response time.
Jintelligence 03 00021 g003

3.5. Response Time Effect Moderated by Items’ Number of Rules (Hypothesis 4)

In Hypothesis 4, we assumed that the moderation of the item response time effect by item difficulty (see results on Hypothesis 3) could be explained by the item characteristic number of rules.
As an initial step, we investigated the items’ difficulty descriptively. The proportion correct ranged from p = 0.18 to 0.99 with only five of 36 items showing p-values lower than 0.50. The average difficulty was p ¯ = 0.74 indicating that the APM items were relatively easy for the participants in this study. As expected, items at the beginning were very easy, whereas items presented later in the test became more and more difficult. Accordingly, the correlation between item position and item difficulty p was very high, r = −0.90 (t = −11.94, df = 34, p < 0.001).
In the next step we investigated as a precondition for testing Hypothesis 4 whether the variability in item easiness can actually be explained by the items’ number of rules. For this, we specified an explanatory item response model with the number of rules as item-level covariate and estimated how much the variance of item easiness, V a r ( b 0 i ) , dropped by introducing the item-level covariate number of rules, r i , into model 0 (1PL model). Note, only those 25 items of the 36 APM Set II items for which the number of rules was determined by Carpenter, et al. [29] were included in this model. Results revealed that the number of rules had a significant negative effect, β 2 = 1.01   ( z = 3.85 , p < 0.001 ) suggesting that by adding a rule or an instance of a rule the logit is reduced by −1.01. By adding the number of rules to the model V a r ( b 0 i ) decreased from 3.03 (model 0) to 1.87 (model 0 including covariate r i ), which means that rules accounted for 38.37% of the variance of item easiness. Thus, the number of rules was confirmed to be a major factor determining item difficulty.
Finally, model 2 was tested to investigate whether the item response time effect was moderated by the number of rules as claimed in Hypothesis 4. Similar to model 1, model 2 showed a significant negative fixed effect of item response time, β 1 = 0.70   ( z = 4.84 , p < 0.001 ) . The variance of the by-person adjustment to this effect was V a r ( b 1 p )   =   0.20 , and its correlation with the person intercept was negative, C o r ( b 0 p , b 1 p )   =   0.72 . Similarly, the variance of the by-item adjustment to the response time effect was V a r ( b 1 i )   =   0.25 , and its correlation with the item intercept was negative, C o r ( b 0 i , b 1 i )   =   0.46 . The main effect of the number of rules was significant and negative as assumed, β 2 = 0.89   ( z = 3.73 , p < 0.001 ) . Most importantly, the interaction of the number of rules with the item response time was significant and positive as expected, β 3 = 0.31   ( z = 2.71 , p < 0.01 ) . The positive interaction effect found for model 2 implies that adding a rule or an instance of a rule increases the response time effect by .31. If the by-person and the by-item adjustment to the response time effect were assumed to be average (i.e., zero), the response time effects for one to five rules would be −1.18, −0.87, −0.56, −0.25, and 0.06. This means, that in the case of only few rules longer response times were associated with lower probability for success whereas in the case of many rules longer response times were slightly associated with higher probability for success. These results supported Hypothesis 4.
To test whether the interaction with number of rules fully captured the cross-item variability of the item response time effect, we compared model 2 (AIC = 4497.30, BIC = 4563.70) with a restricted version omitting the random item response time effect. However, the restricted model fit the data significantly worse, χ 2 ( 2 ) = 26.38 , p < 0.001 , which was also reflected by the greater information criteria obtained for the restricted model (AIC = 4519.70, BIC = 4572.80). This suggested that also other item characteristics than the number of rules have an impact on the item response time effect.

3.6. Exploratory Analysis: Response Time Effect Moderated by Error Response Types

The item response time effect depended on person ability as well as item difficulty, and the item characteristic number of rules as hypothesized. The overall effect of response time, however, was negative although a positive effect was expected. How could this negative item response time effect be explained? An obvious explanation would be that the assumption on the amount of controlled mental operations required when completing reasoning tasks items was wrong. Indeed, the items proved to be relatively easy in the sample of high school and university students suggesting that the amount of controlled processing was lower than one could expect. However, as shown by Hornke [10] when matrices items were adapted to the individual’s ability level, that is, individual item difficulty corresponded to a success rate of only about 50%, response times still took longer for incorrect responses than correct responses. Furthermore, Hornke [24] presented response time differences for a series of figural matrices tests, ranging from very easy tests to one including very difficult figural matrices items for intellectually gifted persons [47]. In addition, for the latter test, the mean response time was greater for incorrect responses than for correct ones.
The estimated negative effect found in the present study indicated that wrong responses take longer than correct responses. One explanation for this pattern of results could be related to the multiple choice response format. It provides test takers with the possibility to test their hypotheses on the missing element by checking a set of eight figures. Test takers induce relevant rules incrementally and try to apply these different rules subsequently. Those giving an ultimately incorrect response might have been aware that they were struggling to find the correct response as the induced rules did not fit the presented response options. This made them go on and try to find the correct solution, thereby increasing the time taken for an incorrect response as compared to correct responses. However, this test-taking behavior requires the test taker to note that he or she has a problem in finding the solution. This would not be the case for a wrong response, which is partly correct pretending that the right solution has been found already. Thus, a test taker showing a particular level of ability and test-taking motivation would spend different amount of time on the task depending on the kind of error.
If this interpretation makes sense, the item response time effect can be supposed to depend on the type of error. We tested this assumption as a final step. Raven [12] distinguished four kinds of errors in APM items (see also [48]). The incomplete correlate error occurs when the solution is incomplete as not all required elements were grasped by the test taker. A figure is chosen which is only correct as far as the test taker was able to determine relevant elements. A wrong principle error occurs when the reasoning process is qualitatively different from the one needed to choose the correct response. The confluence of ideas error occurs when the test taker does not understand that some elements are irrelevant to the solution and, therefore, need to be ignored. Finally, the repetition error occurs when the test taker simply chooses a figure that is identical with one of the three figures adjacent to the empty cell.
The incomplete correlate error refers to an incomplete solution of the problem, whereas wrong principle, confluence of ideas, and repetition point to a wrong understanding of the problem. In the case of a wrong understanding, problems with finding the correct choice may be more salient making test takers to continue their attempt, which, in turn, increases error response time. That is, the item response time effect gets more negative. In the case of an incomplete solution error this cannot be expected as test takers may think erroneously they found the correct solution to the problem. That is, the item response time effect gets less negative or even positive.
To empirically test whether the error type affects the item response time effect, we derived an (centered) index e i representing the empirical rate of incomplete correlate errors for each item. Based on Babcock’s [48] work on error types, errors were classified along the four categories derived above. The proportion of the incomplete solution error was 47.60% across items and persons, and for the wrong understanding errors comprising the three remaining categories it was 52.40%. The correlation between the rate of incomplete correlate errors e i and item difficulty p i was small, r = −0.24 (t = −1.07, df = 18, p = 0.30), suggesting that the error rate covariate did not reflect item difficulty.
The following model 3 was tested:
η p i = β 0 + b 0 p + b 0 i   +   ( β 1 + b 1 i + b 1 p ) t p i + β 2 r i   + β 3 r i t p i + β 4 e i   + β 5 e i t p i
In this model β 4 represents the fixed effect of the incomplete correlate error rate and β 5 the interaction of response time and error rate. Note, as both rules and error rate were included as item-level covariate only those 20 items were considered for which both characteristics were defined by Carpenter, et al. [29] and Babcock [48]. These were the items with the Raven No. 1, 3, 4, 5, 6, 7, 8, 9, 10, 12, 13, 14, 16, 17, 22, 23, 26, 27, 29 and 31.
This exploratory and final analysis revealed a pattern of results that was highly consistent to those obtained for models 1 and 2. That is, there was a significant negative response time effect of β 1 = 0.81   ( z = 4.84 , p   <   0.001 ) . The variance of the by-item adjustment to the response time effect was V a r ( b 1 i ) = 0.24 , and of the by-person adjustment it was V a r ( b 1 p ) = 0.19 , that is, the response time effect varied across both items and persons. The correlation between item easiness and by-item adjustment was C o r ( b 0 i , b 1 i ) = 0.43 , and the correlation between individual ability and by-person adjustment was C o r ( b 0 p , b 1 p ) = 0.69 . Unlike model 2, in model 3 the main effect of the number of rules ( β 2 = 0.65   ( z = 1.65 , p = 0.10 ) ) and the interaction effect of the number of rules with response time ( β 3 = 0.21   ( z = 1.21 , p = 0.23 ) ) were no longer significant. Thus, by partialling out incomplete correlate error rate which shows a correlation of r = 0.48 (t = 2.32, df = 18, p = 0.03) with number of rules, the effects of number of rules became insignificant. In addition, the main effect of the covariate incomplete correlate error rate was insignificant, suggesting that variation in this predictor does not affect the probability for success. However, and most importantly, there was a positive interaction effect for response time and the error rate covariate, β 5 = 1.14   ( z = 2.52 , p = 0.01 ) . This interaction meant that in items with more incomplete correlate errors, the item-specific response time effect got less negative. Finally, model comparison tests supported that incomplete correlate error rate is the more relevant determinant of the item response time effect compared to number of rules. When dropping the interaction of item response time with number of rules in model 3 (AIC = 3215.10, BIC = 3292.20), the model did not get worse, χ 2 ( 1 ) = 1.40 ,   p = 0.24 (AIC = 3214.50, BIC = 3285.20), whereas when omitting the interaction of item response time with incomplete correlate error rate, it did, χ 2 ( 1 ) = 5.52 ,   p = 0.02 (AIC = 3218.60, BIC = 3289.30).

4. Discussion

The goal of the present study was to investigate the relation of item response time to item response in Raven’s matrices items. Based on a dual processing theory account of item response time effects [7], we assumed that the association of item response times and item responses was overall positive as the completion of reasoning tasks requires mostly controlled processing. Furthermore, we expected that the response time effect was moderated by item difficulty and person ability. Finally, we aimed to explain item difficulty by the number of rules included in a matrix problem, and, thereby, to determine whether this item characteristic also determines the moderating role of item difficulty.
Unexpectedly, the average response time effect was negative. That is, when everything else is held constant, longer response times were associated with lower probability to obtain a correct response. As hypothesized, the strength and the direction of the response time effect depended on the items’ difficulty as well as persons’ reasoning ability. For easy items and able persons, the effect was strongly negative, whereas for difficult items and less able persons it was less negative or even positive. The number of rules involved in a matrix problem proved to explain item difficulty significantly. Most importantly, a positive interaction effect between the number of rules and item response time was found. That is, the response time effect became less negative with increasing number of rules. Thus, moderation of the item response time effect could be linked to the requirement of rule generation. The more rules had to be induced the less negative (or even slightly positive) the response time effect was. The number of rules did not fully explain item difficulty and as a consequence the variation of the response time effect. That is, other item characteristics than the number of rules also had an impact on the item response time effect. For instance, also the rule type may determine the difficulty of a reasoning problem [29] inasmuch rules differ in difficulty [49]. In addition, perceptual complexity was shown to be a determinant of item difficulty [50].

4.1. Negative Response Time Effect

Following Goldhammer, et al. [7] a negative response time effect can be expected if person-item pairs work in the mode of automatic processing to a great extent. However, in the present study a negative response time effect was found also for reasoning which relates to previous studies showing that incorrect responses in reasoning take more time than correct responses. To our knowledge, for the negative response time effect in reasoning, no empirically supported explanation has been provided yet. However, there is empirical research work which observed and discussed this phenomenon with respect to reasoning and other constructs. Hornke [24] investigated what test takers do in the extra time taken for incorrect responses compared to correct responses. He considered correct responses with shorter latencies as eye-catching, incorrect responses in contrast may be preceded by an ongoing process of rumination: “Perhaps item details are repeatedly considered, then discarded, and finally forgotten. The effort to find the answer drags on, and in the end it might be terminated by a random guess” [24] (p. 286). In a recent study, Lasry, et al. [18] could show that incorrect responses to multiple-choice questions on conceptual understanding in Physics take longer than correct responses, and that this difference was stronger with increased confidence in the answer. The authors concluded that response time could be conceived as an indicator of how students think about a concept. Fast incorrect responses would point to automatic alternate conceptions (e.g., common-sense belief), whereas fast correct responses suggest a well-learned scientific concept. Slow responses are assumed to be due to a hybrid conceptual state, which does not enable any kind of automatic response process. In his eyewitness study, Sporer [19] discussed that quick correct responses are enabled by a strong memory trace, whereas incorrect (false positive) responses take much more time and, thus, suggest a poor fit between the memory trace of the target person and the image of the person to be judged. Sporer argued that weak memory representations could not prevent an incorrect (false positive) response, but evoke enough doubt to increase decision time.
Our approach in this study was to provide an explanation focusing the solution process in matrices items and taking the multiple choice response format with certain types of distractors into account. That is, the negative response time effect was assumed to depend on whether test takers were able to notice that they are on the wrong track. This can be assumed for errors based on a wrong understanding of the problem, for which in turn the search for an acceptable solution goes on. In contrast, when committing errors based on an incomplete solution of the problem (incomplete correlate errors) the test taker accepts a wrong response assuming it would be a correct one. Following the taxonomy of error types presented by Sutcliffe and Rugg [51], both kinds of errors occur in unfamiliar situations at the knowledge-based level. Errors of wrong understanding may be because, for instance, people select incorrect features to model (bounded rationality), whereas an incomplete solution of the problem may be because people ignore negative evidence (confirmation bias) or miss parts when the solution is mentally reviewed (biased reviewing) [51].
Our explanation based on how test takers respond wrongly connects to Hornke’s notion of rumination, to Lasry et al.’s idea of a hybrid conceptual state, and Sporer’s assumption on weak memory representations. They all suggest that test takers take more time to give an incorrect response because the (incorrect) response alternative did not appear to be clearly a correct or incorrect one.
A theoretical frame for interpreting the negative response time effect in matrices items can be provided by the mental model approach [52]. The process of inductive reasoning is assumed to comprise three phases. The first stage includes the determination of the premises (e.g., by perceptual observations), which at the second stage enable the formulation of a tentative conclusion. Finally, at the third stage the conclusion is evaluated which may result in keeping, updating, or abandoning it. The third phase includes the “process of reasoning from inconsistency to consistency” as described by Johnson-Laird, et al. [53]. Inconsistencies within a set of propositions typically represent a conflict between a conclusion (e.g., selected response alternative) and sources of evidence (e.g., rules induced from observing the variation of graphical elements). If inconsistencies are detected, they can be resolved by revising propositions and maybe also explained. This means that further time and effort is invested (with no guarantee for success) resulting in longer response times as a directly visible result of these underlying cognitive processes.
In our explanatory analysis, we aimed to strengthen this interpretation by investigating the response time effect for situations in which the detection of inconsistencies between conclusion and evidence is stimulated and those in which inconsistencies do not become manifest. We assumed that inconsistencies could be detected in error types of wrong understanding (wrong principle, confluence of ideas, repetition), whereas the error type of incomplete understanding (incomplete correlate) does not trigger the process of reasoning from inconsistency to consistency. In the latter case inconsistencies are not detected, as the partial correct solution is being mistaken for the correct solution. Accordingly, our results revealed that the item covariate reflecting the rate of incomplete correlate errors predicted the strength of the response time effect, that is, with increased rate of incomplete correlate error the response time effect became less negative.

4.2. Limitations

We assumed that the item response time effect depended on item difficulty such that for easier items the effect is adjusted to the negative direction. In the present sample, the APM items were relatively easy. To be able to generalize the results and interpretations it would be important to test the hypotheses based on matrices items covering a broader range of difficulty.
Furthermore, although the exploratory results supported our interpretation of the negative response time effect in a controlled processing task, the proposed explanation is still speculative and, therefore, further evidence is needed. This should be done at least by replicating the influence of the error type on the item response time effect based on an independent sample. To test the inconsistency hypothesis presented in the previous section more directly and experimentally, the item response time effects obtained by the classical multiple-choice response format could be compared with those obtained by a constructed response format which does not provide wrong response alternatives triggering the detection of inconsistencies. Such a study would help to further integrate the results of the present study and those from the previous study by Goldhammer, et al. [7], which did not include multiple-choice measures.
From a technical perspective, it would be interesting to use a more liberal item-response modeling approach which allows the influence of the person (ability) to vary across items (2PL model) as it is allowed for item response times.

5. Conclusions

In line with the dual processing theory account of response time effects [7] we could show that the response time effect in reasoning is moderated by item difficulty and person ability. This supports the assumption that the relative degree of automatic vs. controlled processing determines the strength of the response time effect. Furthermore, we discovered on average a negative response time effect. Given the assumed controlled processing demands even for easy matrices tasks, we conclude that there are further determinants of the response time effect above and beyond the processing mode. As suggested by different lines of research observing that responses for incorrect responses are longer than for correct ones and based on our exploratory error type analysis, we conclude that the extent to which persons address inconsistencies between evidence and conclusion (e.g., stimulated by the multiple choice response format) is another source for the direction of the response time effect.

Acknowledgments

This research work was made possible by the Centre for International Student Assessment (ZIB).

Author Contributions

Frank Goldhammer originated the idea for the study, conducted the analyses and wrote the most of the manuscript. Johannes Naumann contributed to the development of the conceptual framing, and the analysis framework; he also revised and reworked the manuscript. Samuel Greiff wrote some sections and revised and reworked the manuscript; he also made suggestions for additional analyses.

Conflicts of Interest

The authors declare no conflict of interest.

References

  1. Van der Linden, W.J. A hierarchical framework for modeling speed and accuracy on test items. Psychometrika 2007, 72, 287–308. [Google Scholar] [CrossRef]
  2. Wickelgren, W.A. Speed-accuracy tradeoff and information processing dynamics. Acta Psychol. 1973, 41, 67–85. [Google Scholar] [CrossRef]
  3. Wise, S.L.; DeMars, C.E. An application of item response time: The effort-moderated IRT model. J. Educ. Meas. 2006, 43, 19–38. [Google Scholar] [CrossRef]
  4. Wise, S.L.; Kong, X. Response time effort: A new measure of examinee motivation in computer-based tests. Appl. Meas. Educ. 2005, 18, 163–183. [Google Scholar] [CrossRef]
  5. Heathcote, A.; Popiel, S.J.; Mewshort, D.J.K. Analysis of response time distributions: An example using the Stroop task. Psychol. Bull. 1991, 109, 340–347. [Google Scholar] [CrossRef]
  6. Miyake, A.; Friedman, N.P.; Emerson, M.J.; Witzki, A.H.; Howerter, A.; Wager, T.D. The unity and diversity of executive functions and their contributions to complex “frontal lobe” tasks: A latent variable analysis. Cognit. Psychol. 2000, 41, 49–100. [Google Scholar] [CrossRef] [PubMed]
  7. Goldhammer, F.; Naumann, J.; Stelter, A.; Tóth, K.; Rölke, H.; Klieme, E. The time on task effect in reading and problem solving is moderated by task difficulty and skill: Insights from a computer-based large-scale assessment. J. Educ. Psychol. 2014, 106, 608–626. [Google Scholar] [CrossRef]
  8. Verbić, S.; Tomić, B. Test item response time and the response likelihood. 2009. Available online: http://arxiv.org/ftp/arxiv/papers/0901/0901.4356.pdf (accessed on 15 August 2014).
  9. Ebel, R.L. The use of item response time measurements in the construction of educational achievement tests. Educ. Psychol. Meas. 1953, 13, 391–401. [Google Scholar] [CrossRef]
  10. Hornke, L.F. Item response times in computerized adaptive testing. Psicológica 2000, 21, 175–189. [Google Scholar]
  11. Carroll, J.B. Human Cognitive Abilities. A Survey of Factor-Analytical Studies; Cambridge University Press: New York, NY, USA, 1993. [Google Scholar]
  12. Raven, J.C. Advanced Progressive Matrices; Lewis and Co. Ltd.: London, UK, 1962. [Google Scholar]
  13. Klein Entink, R.H.; Fox, J.P.; van der Linden, W.J. A multivariate multilevel approach to the modeling of accuracy and speed of test takers. Psychometrika 2009, 74, 21–48. [Google Scholar] [CrossRef] [PubMed]
  14. Goldhammer, F.; Klein Entink, R.H. Speed of reasoning and its relation to reasoning ability. Intelligence 2011, 39, 108–119. [Google Scholar] [CrossRef]
  15. Van der Linden, W.J.; Scrams, D.J.; Schnipke, D.L. Using response-time constraints to control for differential speededness in computerized adaptive testing. Appl. Psychol. Meas. 1999, 23, 195–210. [Google Scholar]
  16. Goldhammer, F.; Naumann, J.; Keßel, Y. Assessing individual differences in basic computer skills. Eur. J. Psychol. Assess. 2013, 29, 263–275. [Google Scholar] [CrossRef]
  17. Scherer, R.; Greiff, S.; Hautamäki, J. Exploring the relation between speed and ability in complex problem solving. Intelligence 2015, 48, 37–50. [Google Scholar] [CrossRef]
  18. Lasry, N.; Watkins, J.; Mazur, E.; Ibrahim, A. Response times to conceptual questions. Am. J. Phys. 2013, 81, 703. [Google Scholar] [CrossRef]
  19. Sporer, S.L. Eyewitness identification accuracy, confidence, and decision times in simultaneous and sequential lineups. J. Appl. Psychol. 1993, 78, 22–33. [Google Scholar] [CrossRef]
  20. Fitts, P.M.; Posner, M.I. Learning and Skilled Performance in Human Performance; Brooks/Cole: Belmont, CA, USA, 1967. [Google Scholar]
  21. Schneider, W.; Shiffrin, R.M. Controlled and automatic human information-processing: 1. Detection, search, and attention. Psychol. Rev. 1977, 84, 1–66. [Google Scholar] [CrossRef]
  22. Schneider, W.; Chein, J.M. Controlled & automatic processing: Behavior, theory, and biological mechanisms. Cognit. Sci. 2003, 27, 525–559. [Google Scholar] [CrossRef]
  23. Ackerman, P.L. Predicting individual differences in complex skill acquisition: Dynamics of ability determinants. J. Appl. Psychol. 1992, 77, 598–614. [Google Scholar] [CrossRef] [PubMed]
  24. Hornke, L.F. Response time in computer-aided testing: A “verbal memory” test for routes and maps. Psychol. Sci. 2005, 47, 280–293. [Google Scholar]
  25. Beckmann, J.F. Differentielle Latenzzeiteffekte bei der Bearbeitung von Reasoning-Items. Diagnostica 2000, 46, 124–129. (In German) [Google Scholar] [CrossRef]
  26. Beckmann, J.F.; Beckmann, N. Effects of feedback on performance and response latencies in untimed reasoning tests. Psychol. Sci. 2005, 47, 262–278. [Google Scholar]
  27. Neubauer, A.C. Speed of information processing in the Hick paradigm and response latencies in a psychometric intelligence test. Personal. Individ. Differ. 1990, 11, 147–152. [Google Scholar] [CrossRef]
  28. Dodonova, Y.A.; Dodonov, Y.S. Faster on easy items, more accurate on difficult ones: Cognitive ability and performance on a task of varying difficulty. Intelligence 2013, 41, 1–10. [Google Scholar] [CrossRef]
  29. Carpenter, P.A.; Just, M.A.; Shell, P. What one intelligence test measures: A theoretical account of the processing in the Raven progressive matrices test. Psychol. Rev. 1990, 97, 404–431. [Google Scholar] [CrossRef] [PubMed]
  30. McGrew, K.S. CHC theory and the human cognitive abilities project: Standing on the shoulders of the giants of psychometric intelligence research. Intelligence 2009, 37, 1–10. [Google Scholar] [CrossRef]
  31. Verguts, T.; de Boeck, P.; Maris, E. Generation speed in Raven’s progressive matrices test. Intelligence 1999, 27, 329–345. [Google Scholar] [CrossRef]
  32. Raven, J.C.; Raven, J.; Court, J.H. APM Manual (German Edition and Norming by H. Häcker and St. Bulheller); Swets Test Services: Frankfurt am Main, Germany, 1998. [Google Scholar]
  33. Baayen, R.H.; Davidson, D.J.; Bates, D.M. Mixed-effects modeling with crossed random effects for subjects and items. J. Mem. Lang. 2008, 59, 390–412. [Google Scholar] [CrossRef]
  34. De Boeck, P.; Bakker, M.; Zwitser, R.; Nivard, M.; Hofman, A.; Tuerlinckx, F.; Partchev, I. The estimation of item response models with the lmer function from the lme4 package in R. J. Statist. Softw. 2011, 39, 1–28. [Google Scholar]
  35. Doran, H.; Bates, D.; Bliese, P.; Dowling, M. Estimating the multilevel Rasch model: With the lme4 package. J. Statist. Softw. 2007, 20, 1–18. [Google Scholar]
  36. De Boeck, P. Random item IRT models. Psychometrika 2008, 73, 533–559. [Google Scholar]
  37. Van der Linden, W.J. Conceptual issues in response-time modeling. J. Educ. Meas. 2009, 46, 247–272. [Google Scholar] [CrossRef]
  38. Yen, W.M. Effects of local item dependence on the fit and equating performance of the three-parameter logistic model. Appl. Psychol. Meas. 1984, 8, 125–145. [Google Scholar] [CrossRef]
  39. Yen, W.M. Scaling performance assessments: Strategies for managing local item dependence. J. Educ. Meas. 1993, 30, 187–213. [Google Scholar] [CrossRef]
  40. Bolker, B.M.; Brooks, M.E.; Clark, C.J.; Geange, S.W.; Poulsen, J.R.; Stevens, M.H.; White, J.S. Generalized linear mixed models: A practical guide for ecology and evolution. Trends Ecol. Evol. 2009, 24, 127–135. [Google Scholar] [CrossRef] [PubMed]
  41. Greven, S.; Kneib, T. On the behaviour of marginal and conditional AIC in linear mixed models. Biometrika 2010, 97, 773–789. [Google Scholar] [CrossRef]
  42. Vaida, F.; Blanchard, S. Conditional Akaike information for mixed-effects models. Biometrika 2005, 92, 351–370. [Google Scholar] [CrossRef]
  43. Bates, D.; Maechler, M.; Bolker, B.; Walker, S. lme4: Linear Mixed-Effects Models Using Eigen and S4. 2013. Available online: http://cran.r-project.org/web/packages/lme4/citation.html (accessed on 11 March 2015).
  44. R Core Team. R: A Language and Environment for Statistical Computing; R Foundation for Statistical Computing: Vienna, Austria, 2013. [Google Scholar]
  45. Roskam, E.E. Models for speed and time-limit tests. In Handbook of Modern Item Response Theory; van der Linden, W.J., Hambleton, R., Eds.; Springer: New York, NY, USA, 1997; pp. 87–208. [Google Scholar]
  46. Wang, T.; Hanson, B.A. Development and calibration of an item response model that incorporates response time. Appl. Psychol. Meas. 2005, 29, 323–339. [Google Scholar] [CrossRef]
  47. Preckel, F. Diagnostik Intellektueller Hochbegabung. Testentwicklung zur Erfassung der Fluiden Intelligenz. Dissertation; Hogrefe: Göttingen, Germany, 2003. [Google Scholar]
  48. Babcock, R.L. Analysis of age differences in types of errors on the Raven’s advanced progressive matrices. Intelligence 2002, 30, 485–503. [Google Scholar] [CrossRef]
  49. Vodegel Matzen, L.B.L.; van der Molen, M.W.; Dudink, A.C.M. Error analysis of Raven test performance. Personal. Individ. Differ. 1994, 16, 433–445. [Google Scholar]
  50. Meo, M.; Roberts, M.J.; Marucci, F.S. Element salience as a predictor of item difficulty for Raven’s progressive matrices. Intelligence 2007, 35, 359–368. [Google Scholar] [CrossRef]
  51. Sutcliffe, A.; Rugg, G. A taxonomy of error types for failure analysis and risk assessment. Int. J. Hum. Comput. Interact. 1998, 10, 381–405. [Google Scholar] [CrossRef]
  52. Johnson-Laird, P.N. A model theory of induction. Int. Stud. Philos. Sci. 1994, 8, 5–29. [Google Scholar] [CrossRef]
  53. Johnson-Laird, P.N.; Girotto, V.; Legrenzi, P. Reasoning from inconsistency to consistency. Psychol. Rev. 2004, 111, 640–661. [Google Scholar] [CrossRef] [PubMed]

