Article

Comparison of the Surface Properties of Hydrothermally Synthesised Fe3O4@C Nanocomposites at Variable Reaction Times

1
School of Chemical Sciences, Universiti Sains Malaysia (USM), Penang 11800, Malaysia
2
Department of Applied Chemistry, Federal University Dutsin-Ma, Dutsinma P.M.B. 5001, Nigeria
*
Author to whom correspondence should be addressed.
Nanomaterials 2021, 11(10), 2742; https://0-doi-org.brum.beds.ac.uk/10.3390/nano11102742
Submission received: 1 September 2021 / Revised: 6 October 2021 / Accepted: 13 October 2021 / Published: 16 October 2021
(This article belongs to the Section Synthesis, Interfaces and Nanostructures)

Abstract

:
The influence of variable reaction time (tr) on surface/textural properties (surface area, total pore volume, and pore diameter) of carbon-encapsulated magnetite (Fe3O4@C) nanocomposites fabricated by a hydrothermal process at 190 °C for 3, 4, and 5 h was studied. The properties were calculated using the Brunauer–Emmett–Teller (BET) isotherms data. The nanocomposites were characterised using Fourier transform infrared spectroscopy, X-ray diffraction analysis, thermogravimetry, and scanning and transmission electron microscopies. Analysis of variance shows tr has the largest effect on pore volume (F value = 1117.6, p value < 0.0001), followed by the surface area (F value = 54.8, p value < 0.0001) and pore diameter (F value = 10.4, p value < 0.001) with R2-adjusted values of 99.5%, 88.5% and 63.1%, respectively. Tukey and Fisher tests confirmed tr rise to have caused increased variations in mean particle sizes (11–91 nm), crystallite sizes (5–21 nm), pore diameters (9–16 nm), pore volume (0.017–0.089 cm3 g−1) and surface area (7.6–22.4 m2 g−1) of the nanocomposites with individual and simultaneous confidence limits of 97.9 and 84.4 (p-adj < 0.05). The nanocomposites’ retained Fe–O vibrations at octahedral (436 cm−1) and tetrahedral (570 cm−1) cubic ferrite sites, modest thermal stability (37–60 % weight loss), and large volume-specific surface area with potential for catalytic application in advanced oxidation processes.

1. Introduction

In recent years, concerted efforts have been made to develop magnetite (Fe3O4) nanocomposite materials with improved surface properties suitable for specific applications in diverse fields. As nontoxic, biocompatible, and superparamagnetic materials of relatively high chemical stability, Fe3O4 nanocomposites find applications in biotherapy and biomedicine [1,2], drug targeting and delivery [3,4], catalysis [5,6,7], energy storage and release [8,9], environmental remediation [10], ultrafiltration membrane separation [11] and microwave absorption [12,13].
Fabrication of carbon-encapsulated magnetite nanocomposite materials (Fe3O4@C) by hydrothermal treatment is a popular method of rendering prevention to the parent Fe3O4 NPs from agglomeration and deterioration in chemical stability, thereby maintaining their effective surface properties, making them compatible for applications in both inorganic and organic processes. It involves synthesising Fe3O4@C nanostructures by heating at reaction temperatures and pressures above the ambient conditions of boiling water for a given reaction time, with the mixture of precursors in aqueous media as reported in the literature [14,15]. The method depends on precursor concentrations, the nature of the aqueous solvent, the stabilising agent, the type of precursor, the heating temperature, and the reaction time, which considerably influence the final products. It gives relatively low product yields compared to the co-precipitation that produces nanocomposites with a weak crystal structure [16,17]. However, unlike the “low temperature” co-precipitation technique, the temperature–pressure synergistic effect in the hydrothermal approach offers a one-step route for producing magnetic nanocomposites of high crystallinity and removing the need for post-annealing [18,19].
However, several works have reported hydrothermal treatments using one-off levels of the process parameters (reaction temperature, reaction time, etc.) without setting them at variable levels to optimise their influences and compare their efficiencies in the fabrication of Fe3O4@C nanocomposites with defined surface characteristics. For example, several heating temperature–reaction time pairs reported for hydrothermal synthesis of Fe3O4@C include 180 °C for 14 h [20], 170 °C for 4 h [21], 600 °C for 4 h [22], 210 °C for 48 h [23],160 °C for 10 h [24] and 180 °C for 24 h [25]. One-factor-at-a-time (OFAT) design optimisation of a hydrothermal process with few parameters furnishes optimal responses that are more reliable, minimises costs and maximises the utility of resources required to run the experiments. The lower the number of input parameters, the fewer are the runs and the resources for the experiments [26].
Therefore, fewer efforts were channelled into the use of OFAT design to optimise the effects of a limited number of independent factors (e.g., reaction time, temperature, amounts of Fe3O4 NPs precursor, amount of glucose precursor, etc.) on the surface characteristics of the carbon-encapsulated magnetite nanocomposites obtained via conventional hydrothermal synthesis. For instance, Subramanian et al. [27] accomplished the hydrothermal synthesis of MnO2 by starting with well-mixed aqueous solutions of MnSO4·H2O and KMnO4 by loading into an oven preheated at 140 °C to evaluate the influence of variable reaction time (1–18 h) on the end material.
Thus, the main objectives of this work are to conduct the hydrothermal synthesis of Fe3O4@C composite samples and to statistically compare the dependence of their selected surface properties (surface area, total pore volumes and pore diameters) on variable reaction time at a fixed temperature using one-way analyses of variance (ANOVA). Based on the data gathered from the literature, three different reaction times were selected (3, 4, and 5 h). Tukey simultaneous tests and Fisher individual tests were also conducted to determine the differences in the means of the properties for comparison. The reaction time dependent mesoporosity, monodispersity, shape controllability, and stability of the as-synthesised Fe3O4@C nanocomposite samples were further ascertained by performing morphological and structural elucidations using suitable instrumental analyses.

2. Materials and Methods

2.1. Materials

Nitric acid (HNO3), ethanol (C2H5OH, 95 %), anhydrous (D+)-glucose (C6H12O6) and ethylenediamine ((H2NCH2)2) were supplied by HmbG Chemicals, Kuala Lumpur, Malaysia. Ethylene glycol ((HOCH2)2), sodium acetate (CH3COONa) and ferric chloride hexahydrate (FeCl3·6H2O) were purchased from Bendosen Laboratory Chemicals, Kuala Lumpur, Malaysia. The as-received analytical grade pure chemical reagents and deionised water were used in the entire experimental procedures.

2.2. Synthesis of Fe3O4@C Nanocomposite

Following the procedure mentioned elsewhere in the literature, mesoporous Fe3O4@C nanoparticles were prepared using a two-step process involving solvothermal and hydrothermal processes [28,29]. A solvothermal approach was first utilised to fabricate magnetite NPs. Weighed amounts of FeCl3·6H2O (1.0 g) and anhydrous CH3COONa (4.0 g) were dissolved in a mixture of ethylene glycol (27 mL) and ethylenediamine (3 mL) under vigorous magnetic stirring at 1000 rpm for at least 30 min to form a homogenised clear yellow solution. The resulting solution was heated at 220 °C for 2 h in a 50mL tightly sealed, Teflon-lined stainless-steel autoclave before cooling to room temperature under a cold tap water jet. The as-synthesised black magnetite nanoparticles were separated from the mixture using a magnet, washed copiously six times in a row with deionised water and ethanol, oven dried at 70 °C for 12 h under vacuum, and stored in an air-tight sample bottle placed in a desiccator for further processing.
The synthesis of the Fe3O4@C nanocomposites was carried out by first immersing 0.23 g (0.001 mol) of Fe3O4 NPs in 0.1 M HNO3 solution for 5 min. Then, the nanoparticles were separated using a magnet and washed three times with deionised water. Then, the Fe3O4 NPs and 3.61 g (0.02 mol) of glucose were dissolved in 40 mL of deionised water under vigorous stirring for at least 10 min to homogenise the mixture. The mixture was oven-heated at 190 °C for the reaction time (tr) of 3 h in a 50 mL Teflon-sealed autoclave in an oven. The as-obtained magnetic composite was then allowed to cool naturally, separated with a magnet, washed three times with deionised water and ethanol and oven-dried at 60 °C for 12 h under vacuum. The same procedure was repeated two more times under the same hydrothermal conditions for tr values of 4 and 5 h. The three Fe3O4@C nanocomposites obtained were labelled as Fe3O4@C-T190t3, Fe3O4@C-T190t4 and Fe3O4@C-T190t5.

2.3. Instrumental Analyses

The characteristic chemical bonds in the Fe3O4@C-T190t3, Fe3O4@C-T190t4 and Fe3O4@C-T190t5 nanocomposites were elucidated in the range of 400–4000 cm−1 using a Fourier transform infrared (FTIR) spectrophotometer (Perkin Elmer System 2000 FTIR). The powdered samples of translucent pellets were prepared by mixing the sample with dry KBr followed by hydraulic compression and then inserted into the sample holder of the spectrophotometer for analyses.
The XRD tests of the as-synthesised nanocomposites samples were carried out on a fully automated X-Ray Diffractometer (Bruker’s D8 Advance, Bruker Corporation, Billerica, MA, USA) located at the Makmal Pencirian Bahan Bumi, Centre for Global Archaeological Research, Universiti Sains Malaysia. Powdered samples were first prepared in the shape of a circular disc (25 mm diameter) by hydraulic compression, followed by insertion into the sample holder for examination. Mounted flat on a glass slide, the circular discs were gently squeezed parallel to the holder’s surface. The XRD tests were conducted at a scanning velocity of 0.04 °C sec−1 for 25 min using the Cu-Kα radiation source (λ = 1.54060 Å), 40 kV voltage, 40mA current and 2θ scanning range of 10–70° at room temperature (25 °C).
Datasets on thermogravimetric analysis (TGA) and derivative thermogravimetry (DTG) were collected on a thermogravimetric analyser (Perkin Elmer STA 6000 model, PerkinElmer Inc., Waltham, MA, USA), domiciled at the School of Chemical Sciences, Universiti Sains Malaysia. The analyses were conducted by heating in air at 80 mL min−1. The heating was carried out from 30 to 900 °C at a rate of 10 °C min−1, followed by holding the temperature for 5.0 min at 900 °C.
A scanning electron microscope (Quanta FEG 650 SEM, FEI Company, Hillsboro, OR, USA) fitted with an energy-dispersive X-ray spectroscopy method (Oxford X-Max 50 mm2 EDX, Oxford Instruments, Oxford, UK) was used to investigate the morphology and elemental analysis of the nanocomposites. The surface morphologies of the nanocomposites were further observed by employing an energy-filtered transmission electron microscope (Zeiss Libra 120, Carl Zeiss NTS GmbH, Oberkochen, Germany). The resulting energy-filtered transmission electron microscopy (EFTEM) micrographs were used to study the particle size distribution of the nanocomposites. The samples were sonicated in ethanol for 5 min to prepare ethanolic dispersions of the nanocomposites, subsequently spread on the copper grid surfaces and inserted into the electron transmission microscope.
The porosimeter (ASAP 2020 V4.01 H, Micromeritics Instrument Corporations, Norcross, GA, USA) available at the School of Chemical Sciences, Universiti Sains Malaysia, was employed to perform nitrogen adsorption–desorption analyses on the samples. The multilayer adsorption isotherm plots obtained by applying the Brunauer-Emmett-Teller (BET) equation to the resulting nitrogen physisorption data were used to determine the specific pore volume, pore size and surface area of the dried powdered nanocomposite samples. The samples were degassed at 383 K for 6 h under vacuum before sample analysis and data collection.

3. Results and Discussion

3.1. Spectroscopic and Surface Characteristics of the Fe3O4@C Nanocomposites

The surface properties of the three as-synthesised nanocomposite samples Fe3O4@C-T190t3, Fe3O4@C-T190t4, and Fe3O4@C-T190t5 were evaluated following a one-factor-at-a-time (OFAT) design approach using various complementary instrumental methods of analysis.

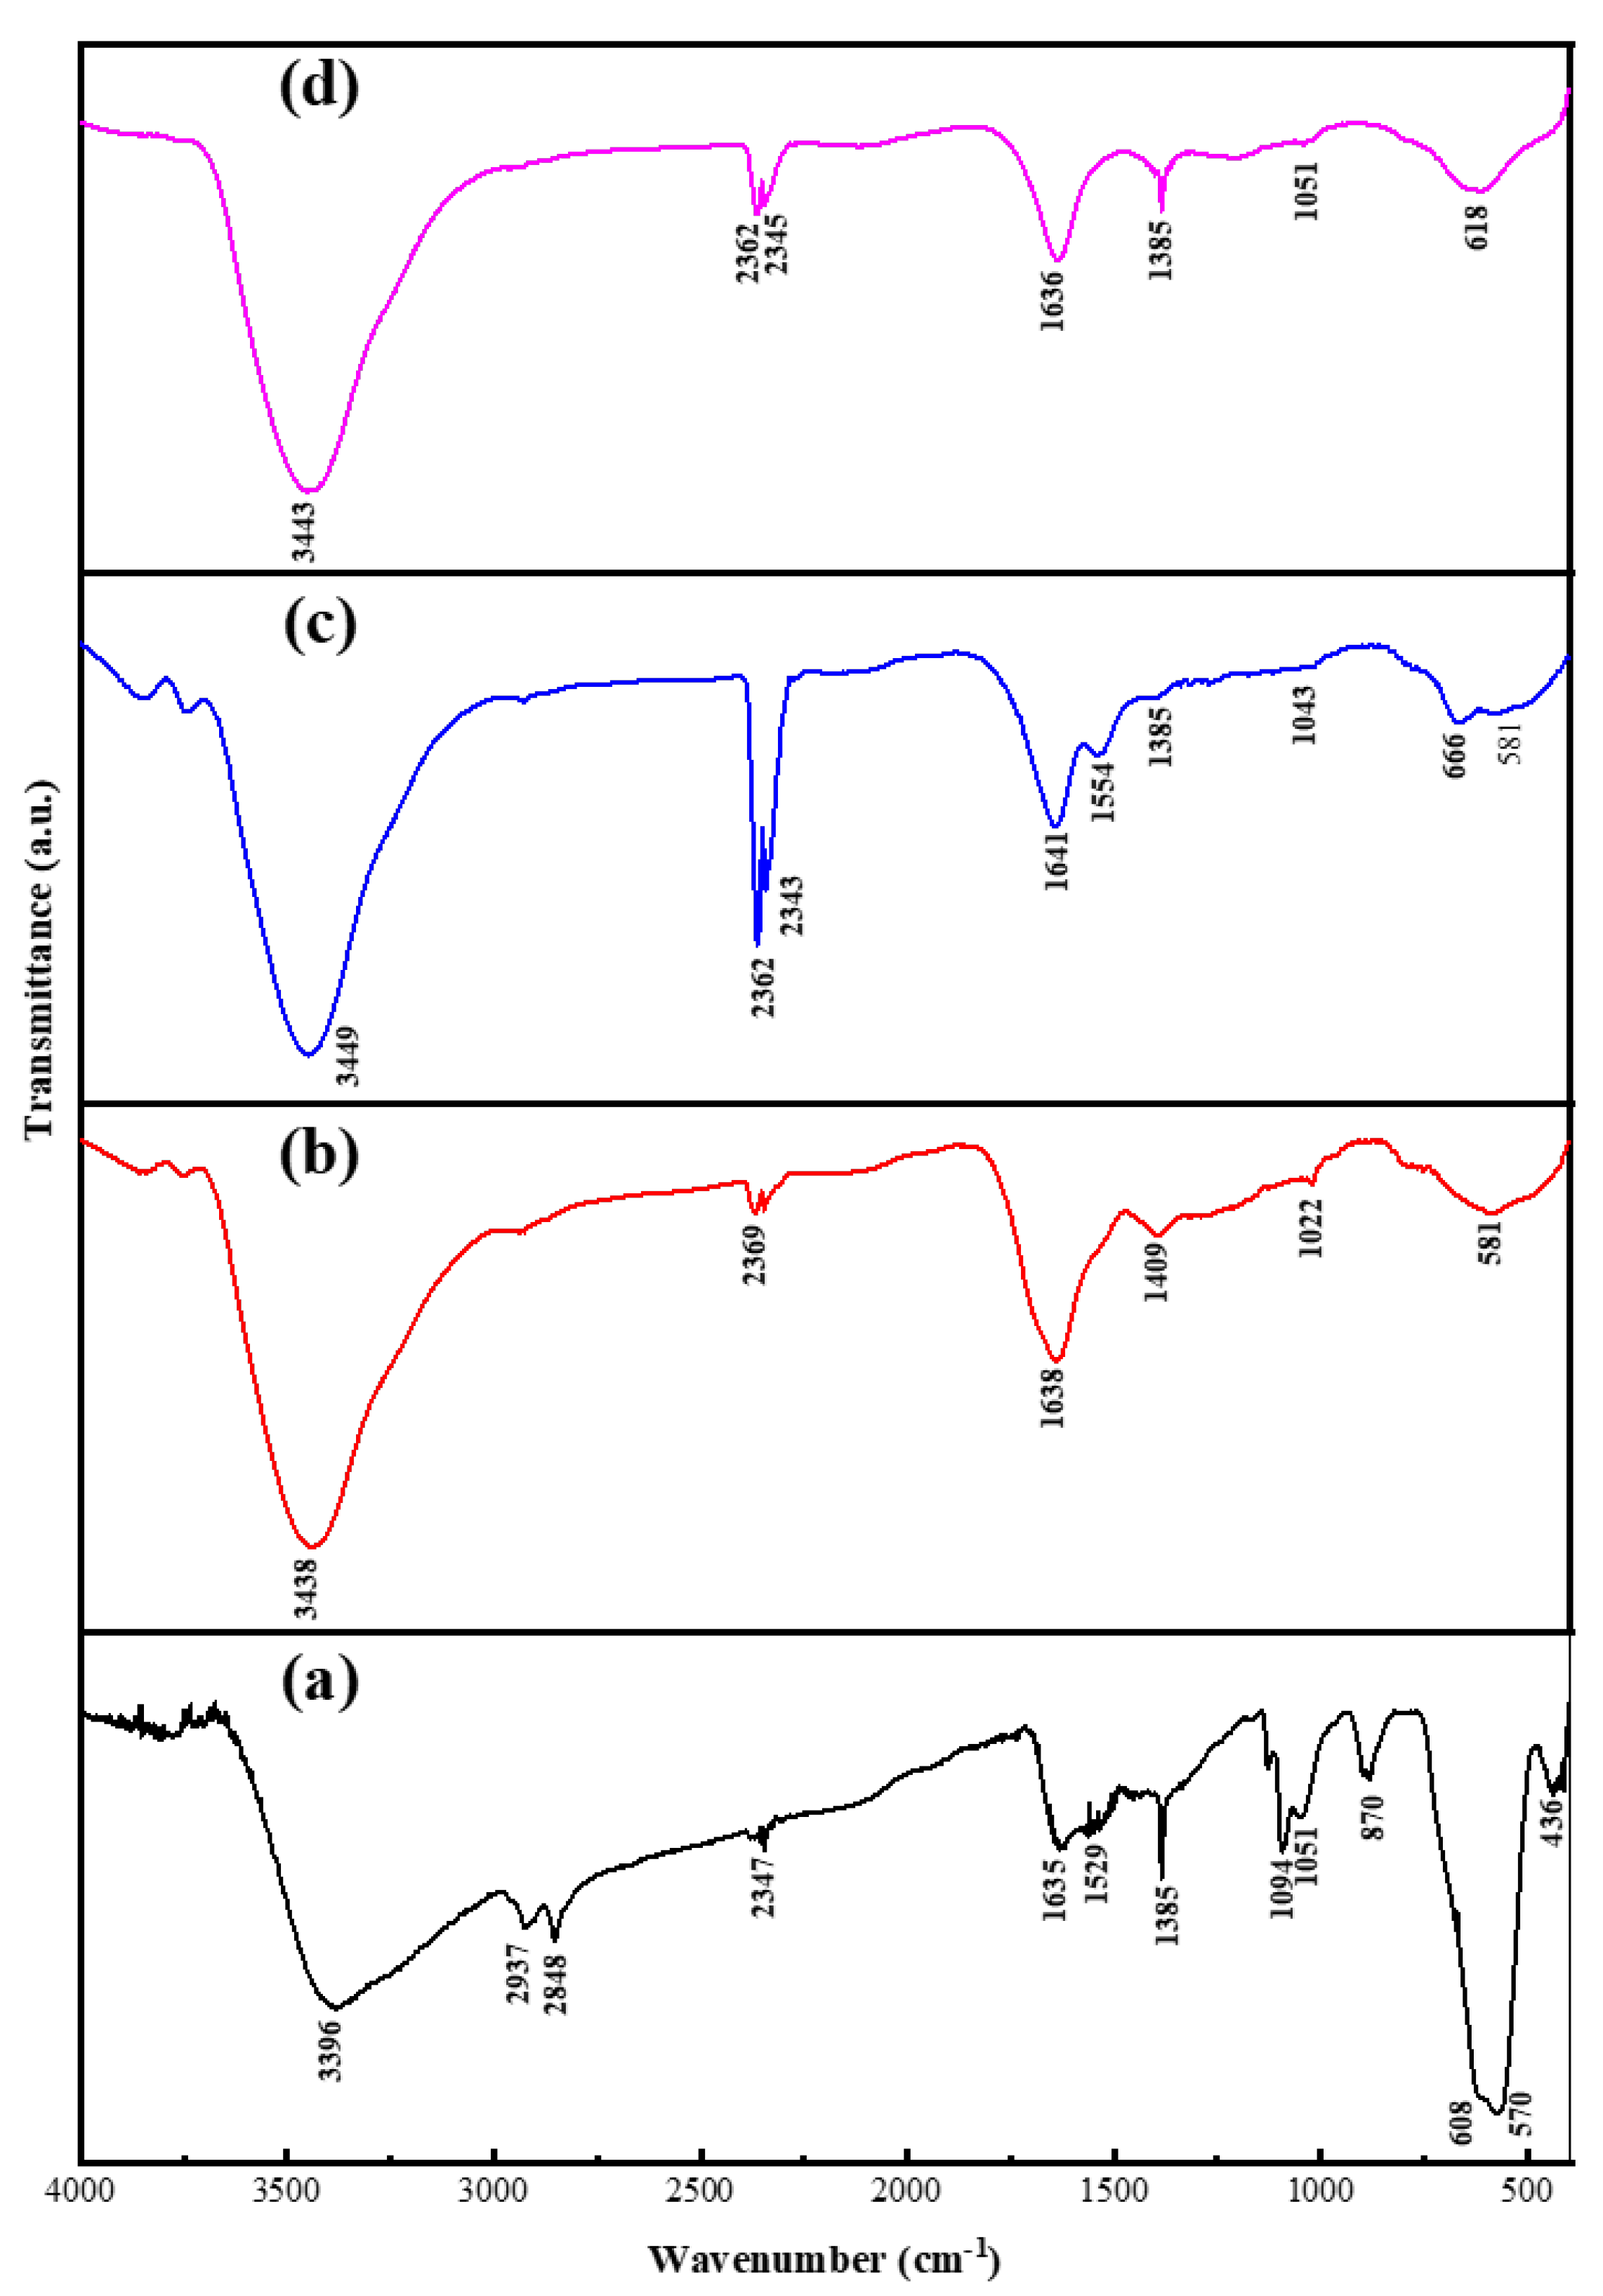
3.1.1. Fourier Transform Infrared Spectroscopy

Figure 1 illustrates the FTIR spectra of the as-synthesised Fe3O4 NPs and Fe3O4@C nanocomposites. Assignments of the major absorption bands observed at 436 and 570 cm−1 in the spectrum of the parent magnetite NPs (a) are the characteristic peak of the intrinsic stretching vibrations modes for Fe–O bonds at the octahedral and tetrahedral cubic ferrite sites, respectively [30,31,32]. Meanwhile, the bands at 3396, 2347 and 1635 cm−1 are assigned to OH vibrations at the surface of the as-prepared magnetite NPs. The OH groups were inherited from the ethylene glycol molecules [33,34,35] and has higher vibrational intensities in Fe3O4 NPs over Fe3O4@C. The reduced vibrational intensities of these bands in Fe3O4@C indicate that, during glucose carbonisation, the carbon composited and effectively shielded the OH groups [36]. The peaks at 2848 and 2937 cm−1 are attributed to the antisymmetric and symmetric stretching vibration of C–H bonds introduced by ethylenediamine molecules at the solvothermal step for Fe3O4 NPs fabrication [37,38]. Weak to medium intensity peak at the 1385 cm−1 was ascribed to the antisymmetric C–N stretching vibrations coupled with the out-of-plane H–NH and N–H vibrational modes [33]. The peak at 870 cm−1 was assigned to the in-plane and out-of-plane vibrational modes for residual C–H bonds deformation [34]. Several peaks disappeared, shifted to new wavenumbers, or were retained in the resulting nanocomposites. Negligible shifts recorded for Fe–O bonds at the tetrahedral cubic ferrite sites and OH vibrations to 581 cm−1 and 3438–3449 cm−1, respectively, indicate that the three nanocomposites retained the spectral characteristics of parent Fe3O4 NPs. The disappearance and shifting of some of the peaks in the spectra of the nanocomposites indicate the strong interaction between the parent Fe3O4 NPs core and the encapsulating carbon layer bounding its surface [35].

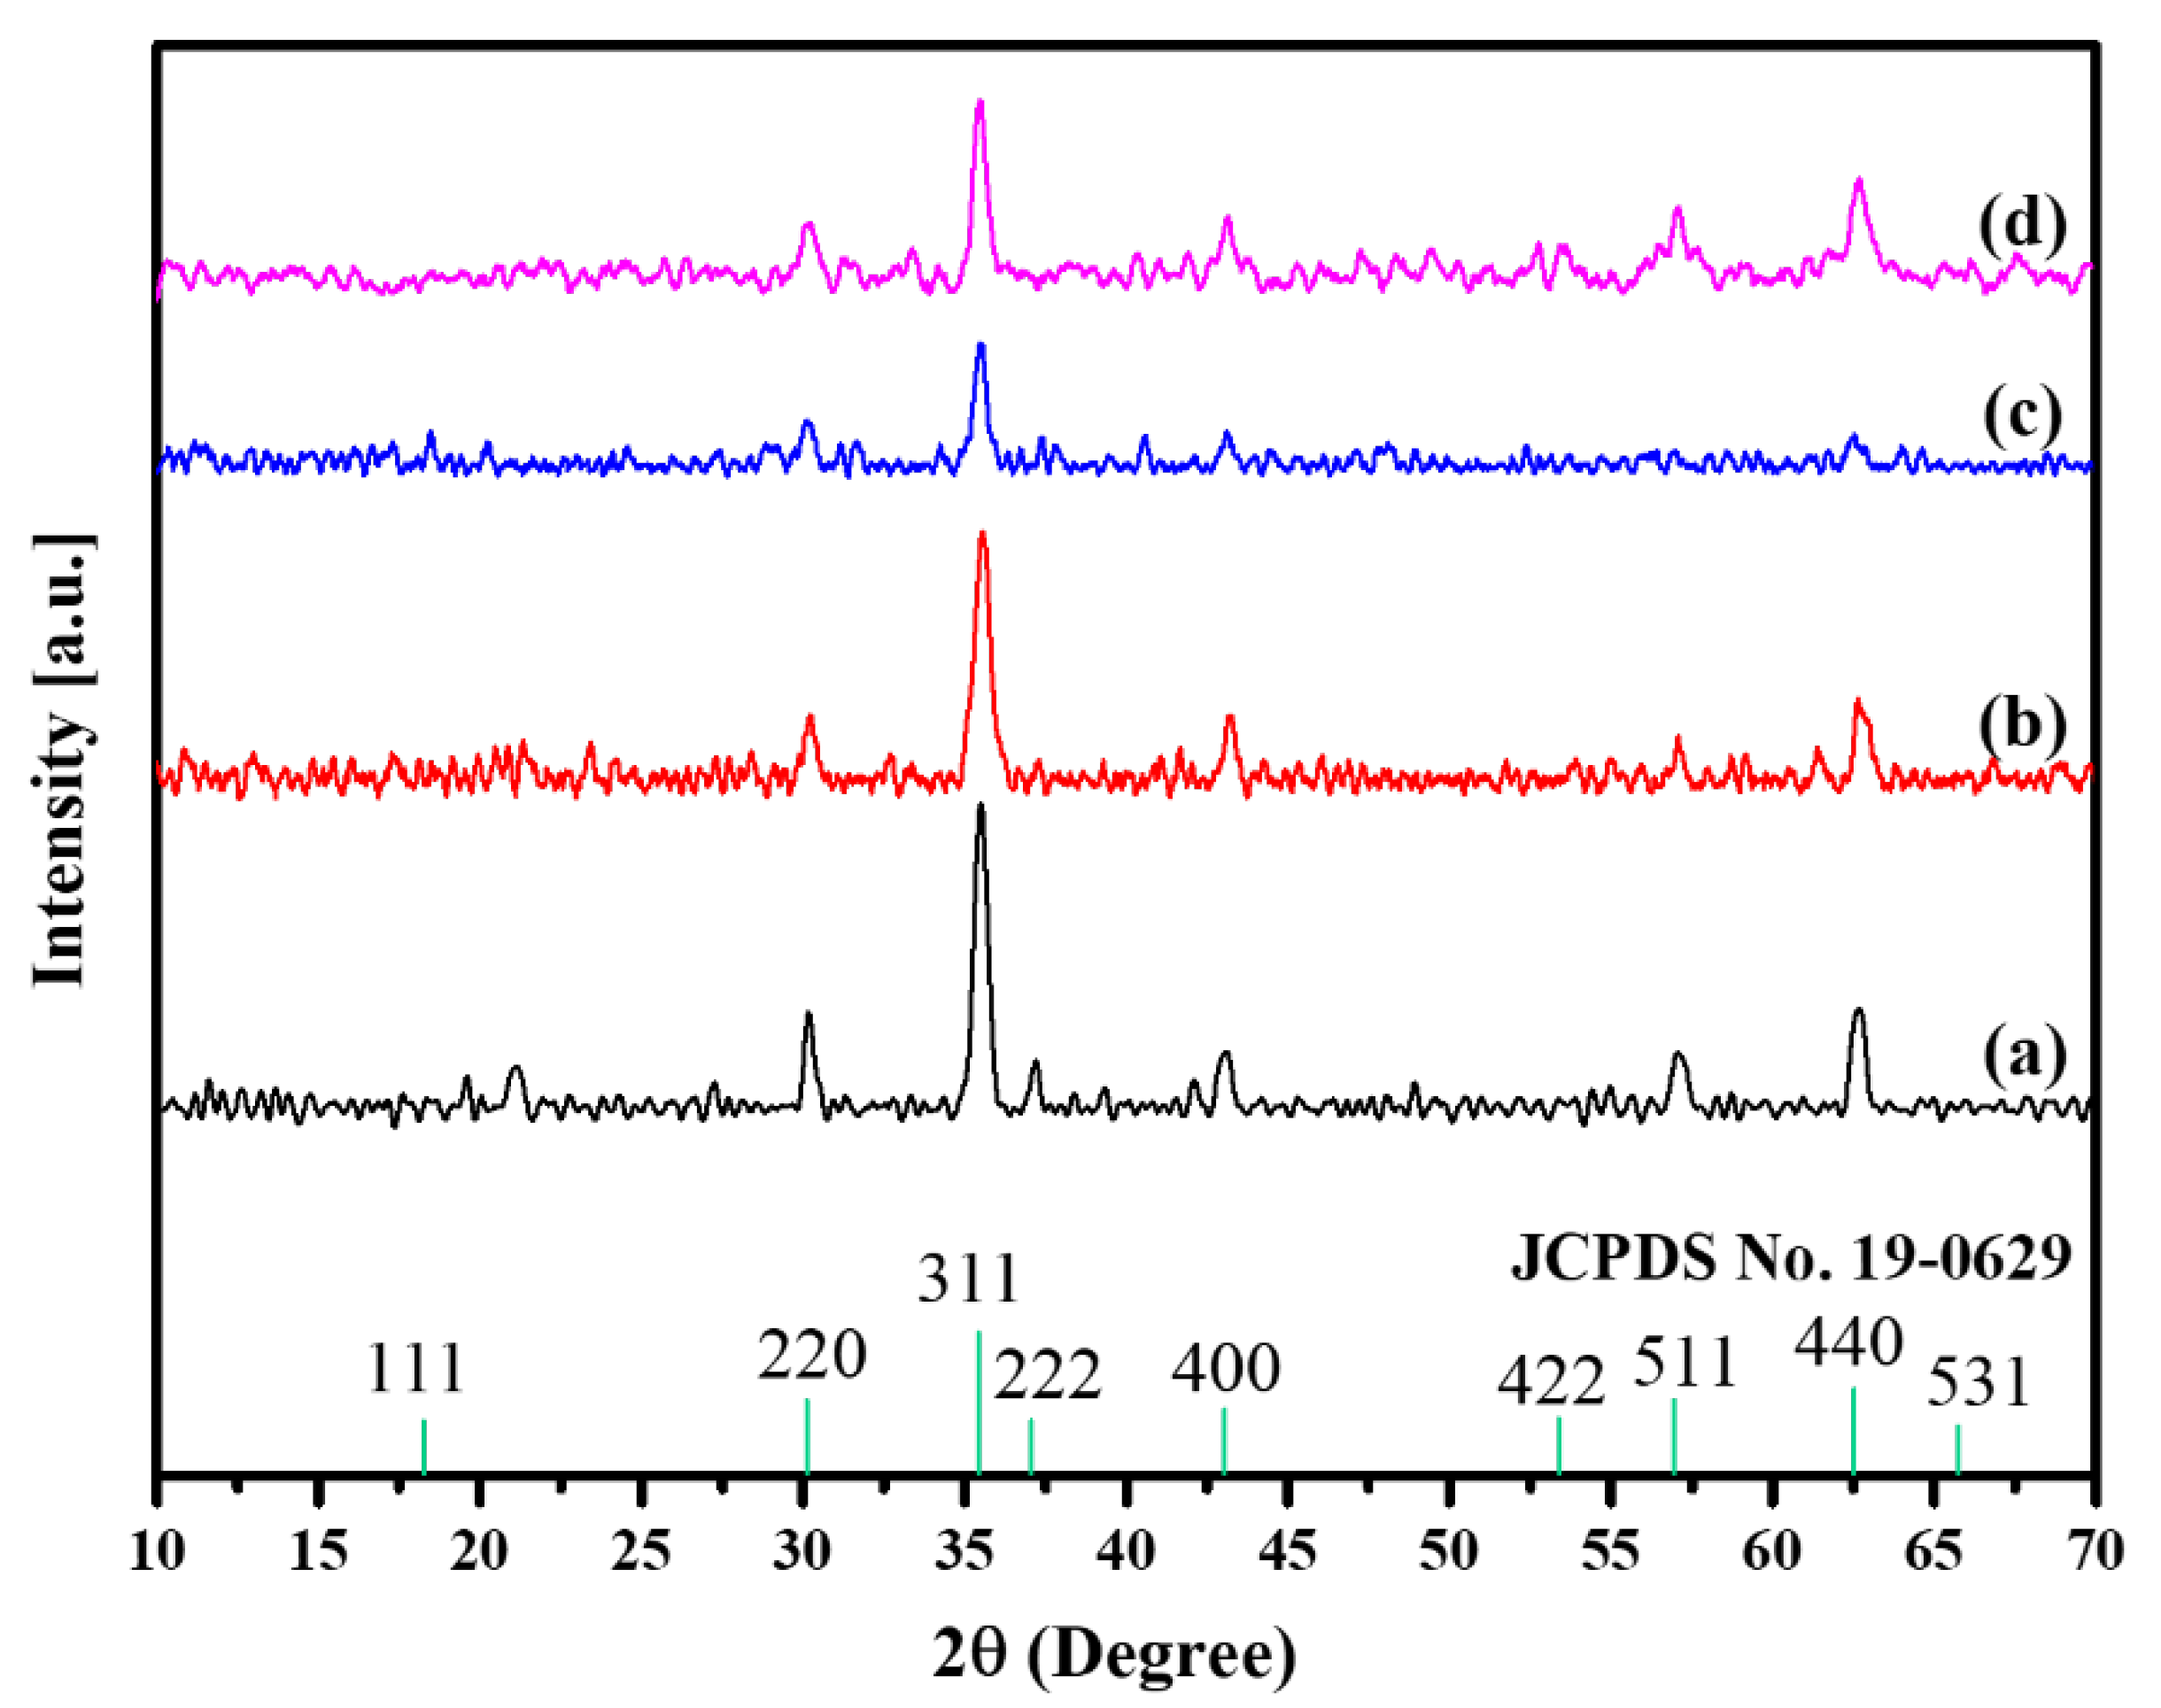
3.1.2. X-ray Diffraction Analysis

Crystal phases of the as-synthesised nanocomposites were investigated using an X-ray diffractometer, and the results are shown in Figure 2. The XRD patterns of Fe3O4@C-T190t3, Fe3O4@C-T190t4, and Fe3O4@C-T190t5 have diffraction peaks that matched the standard diffractogram of the magnetic Fe3O4 NPs (JCPDS No. 19-0629). The XRD peaks and crystal lattice constant (ao) in all the XRD patterns with the magnetite standards information indexed in the ICDD database [35] were compared. The ao values determined from the peaks with the highest intensity for Fe3O4@C-T190t3, Fe3O4@C-T190t4, Fe3O4@C-T190t5 were found to be 8.38, 8.37 and 8.38 Å, in agreement with the standard parameter for the magnetite (8.39 Å). The diffraction peaks at 2θ = 57.1°, 62.7°, 53.5°, 43.1°, 35.5°, 30.2° and 21.9° which can be assigned to the Miller indices planes (511), (440), (422), (400), (311), (220) and (111), respectively, corresponding to a cubic inverse spinel unit cell structure of Fe3O4 nanomaterials [36,37] were retained in all three Fe3O4@C nanocomposites. The ability of the nanocomposites to retain the characteristic Miller indices planes identified in the parent Fe3O4 NPs after the synthesis is an indicator of their phase purity with respect to the Fe3O4 NPs. The XRD patterns of the Fe3O4@C nanocomposites did not show sharp peaks at 2θ values of 26° and 54°, which are the characteristic peaks for crystalline carbons [38,39]. However, the broad background, typical of amorphous material, in the XRD diffractograms of the nanocomposites relative to that of the Fe3O4 NPs confirmed the amorphous nature of the encapsulating carbon layer [39,40,41] is also absent. Thus, the XRD peaks corresponding to the encapsulating carbons were not found in the XRD pattern because they were poorly crystallised [42]. While the nature of the carbon layer may be ambiguous, the presence of the carbon layer in the nanocomposites is evidenced, especially from the thermal and EFTEM analysis.
The crystallite sizes (Dhkl) of the nanocomposite samples were determined using the well-known Scherrer equation (Equation (1)):
D h k l = K λ β cos θ
where   θ is the half diffraction angle of 2 θ , K is the constant (=0.94), λ is the wavelength (=0.15406 nm), β is the full width at half maximum (FWHM) value of XRD diffraction peaks. The average crystallite size (DXRD) for each nanocomposite sample was calculated by dividing the total Dhkl values by the number of individual planes [26]. The average crystallite grain size (DXRD) for each of the three nanocomposites (Fe3O4@C-T190t3, Fe3O4@C-T190t4, Fe3O4@C-T190t5) was computed to be 13 ± 8, 11 ± 6 and 16 ± 5 nm, respectively. The variation in the DXRD values in the nanocomposites can be attributed to the extent of carbonisation of the carbons composited to the parent Fe3O4 NPs at different reaction times, which was also in line with the reported EFTEM outcomes. Previously, Xu et al. [43] reported similar values for the average Fe3O4 NPs crystallite size of their as-synthesised Fe3O4@C nanocomposites.

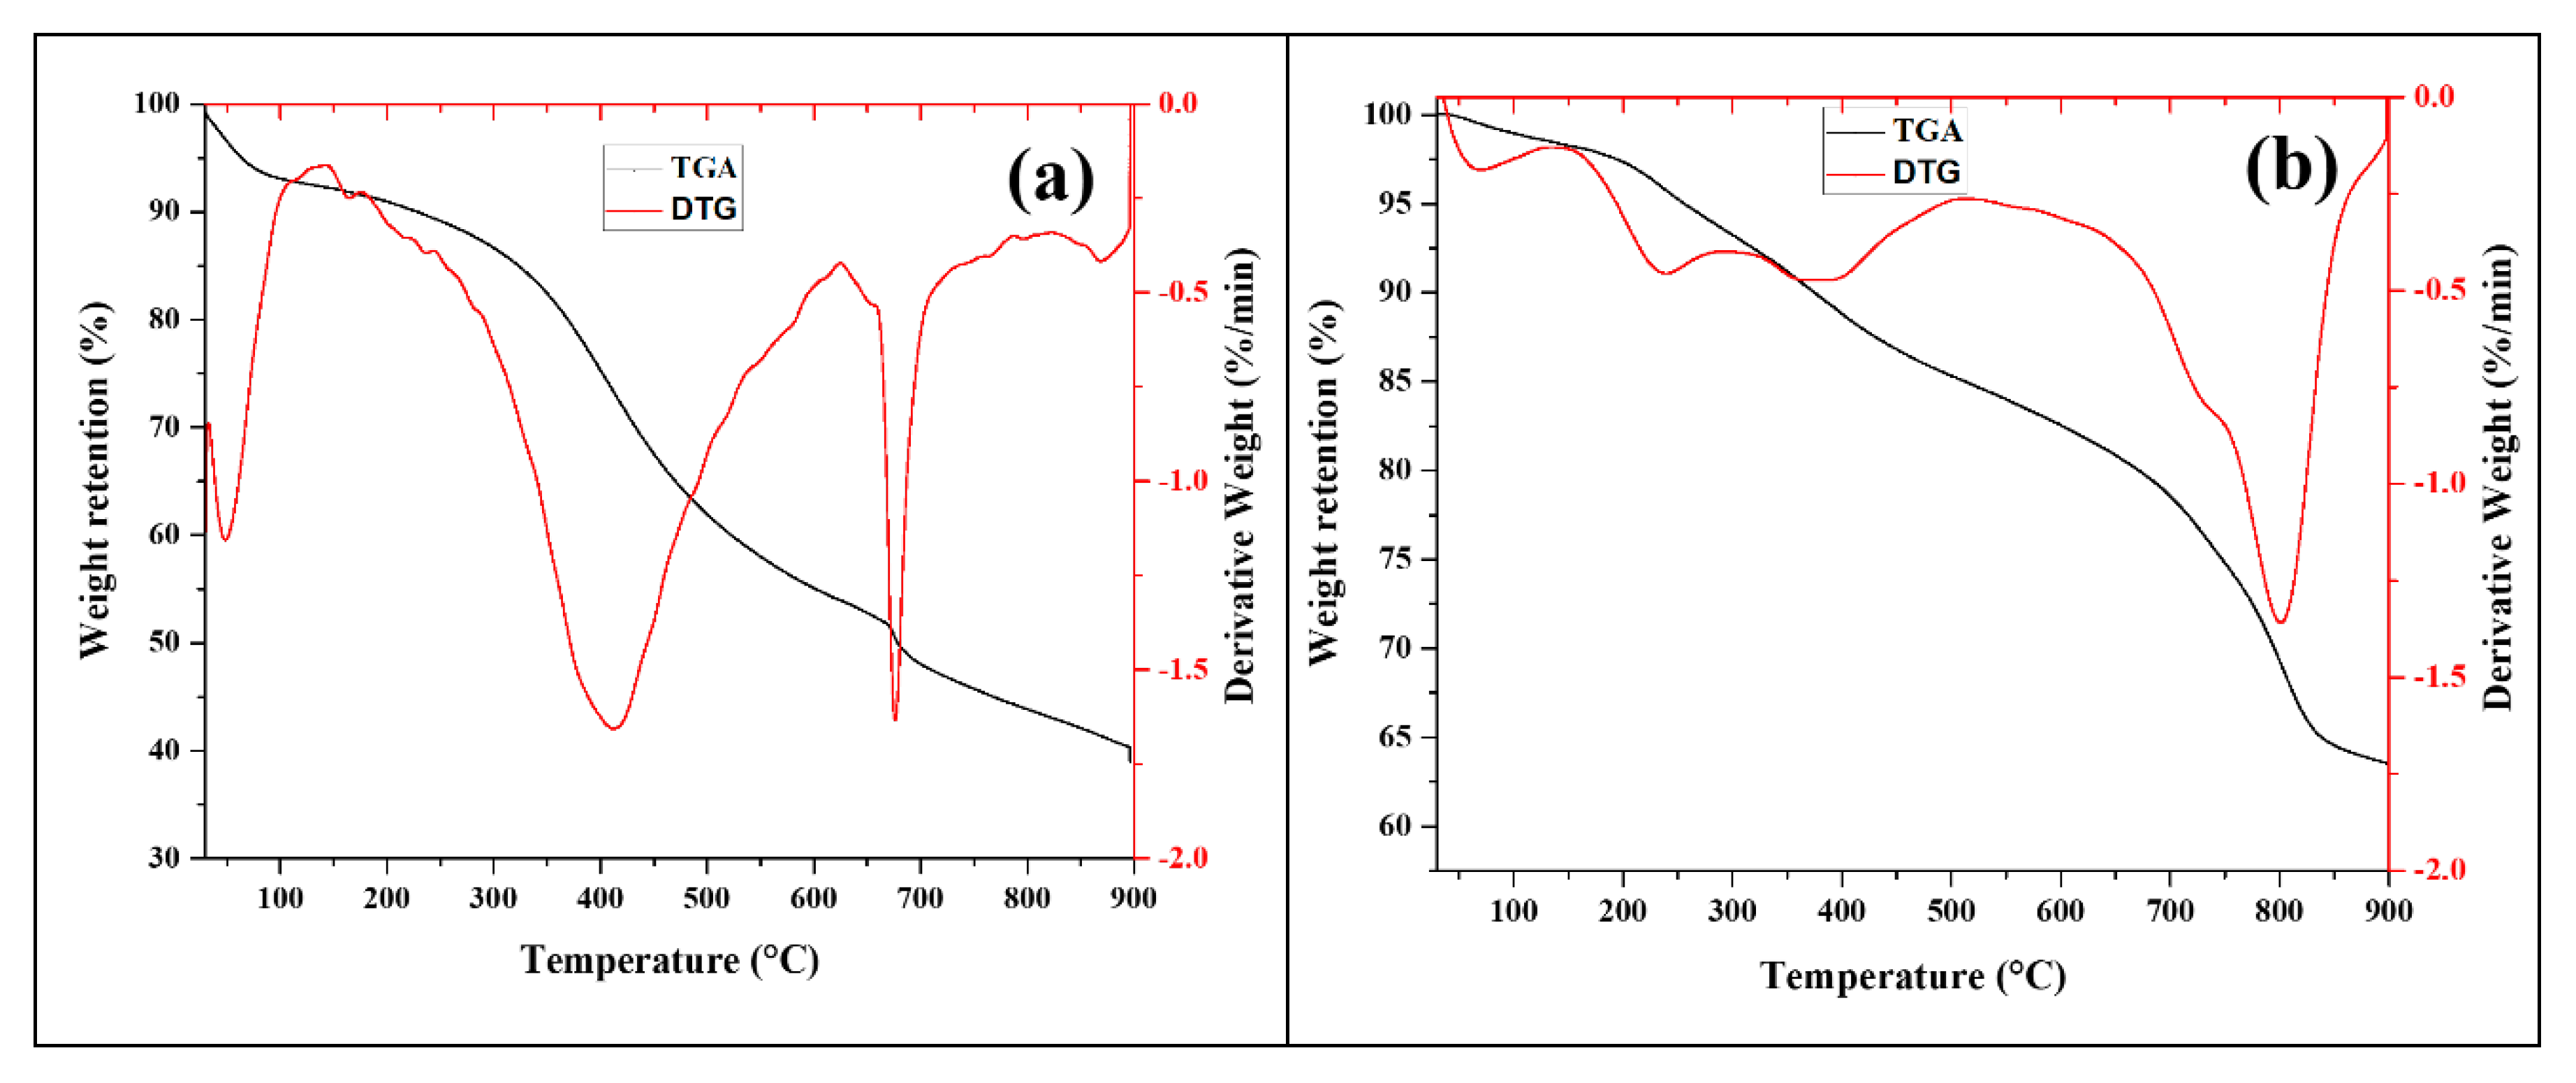
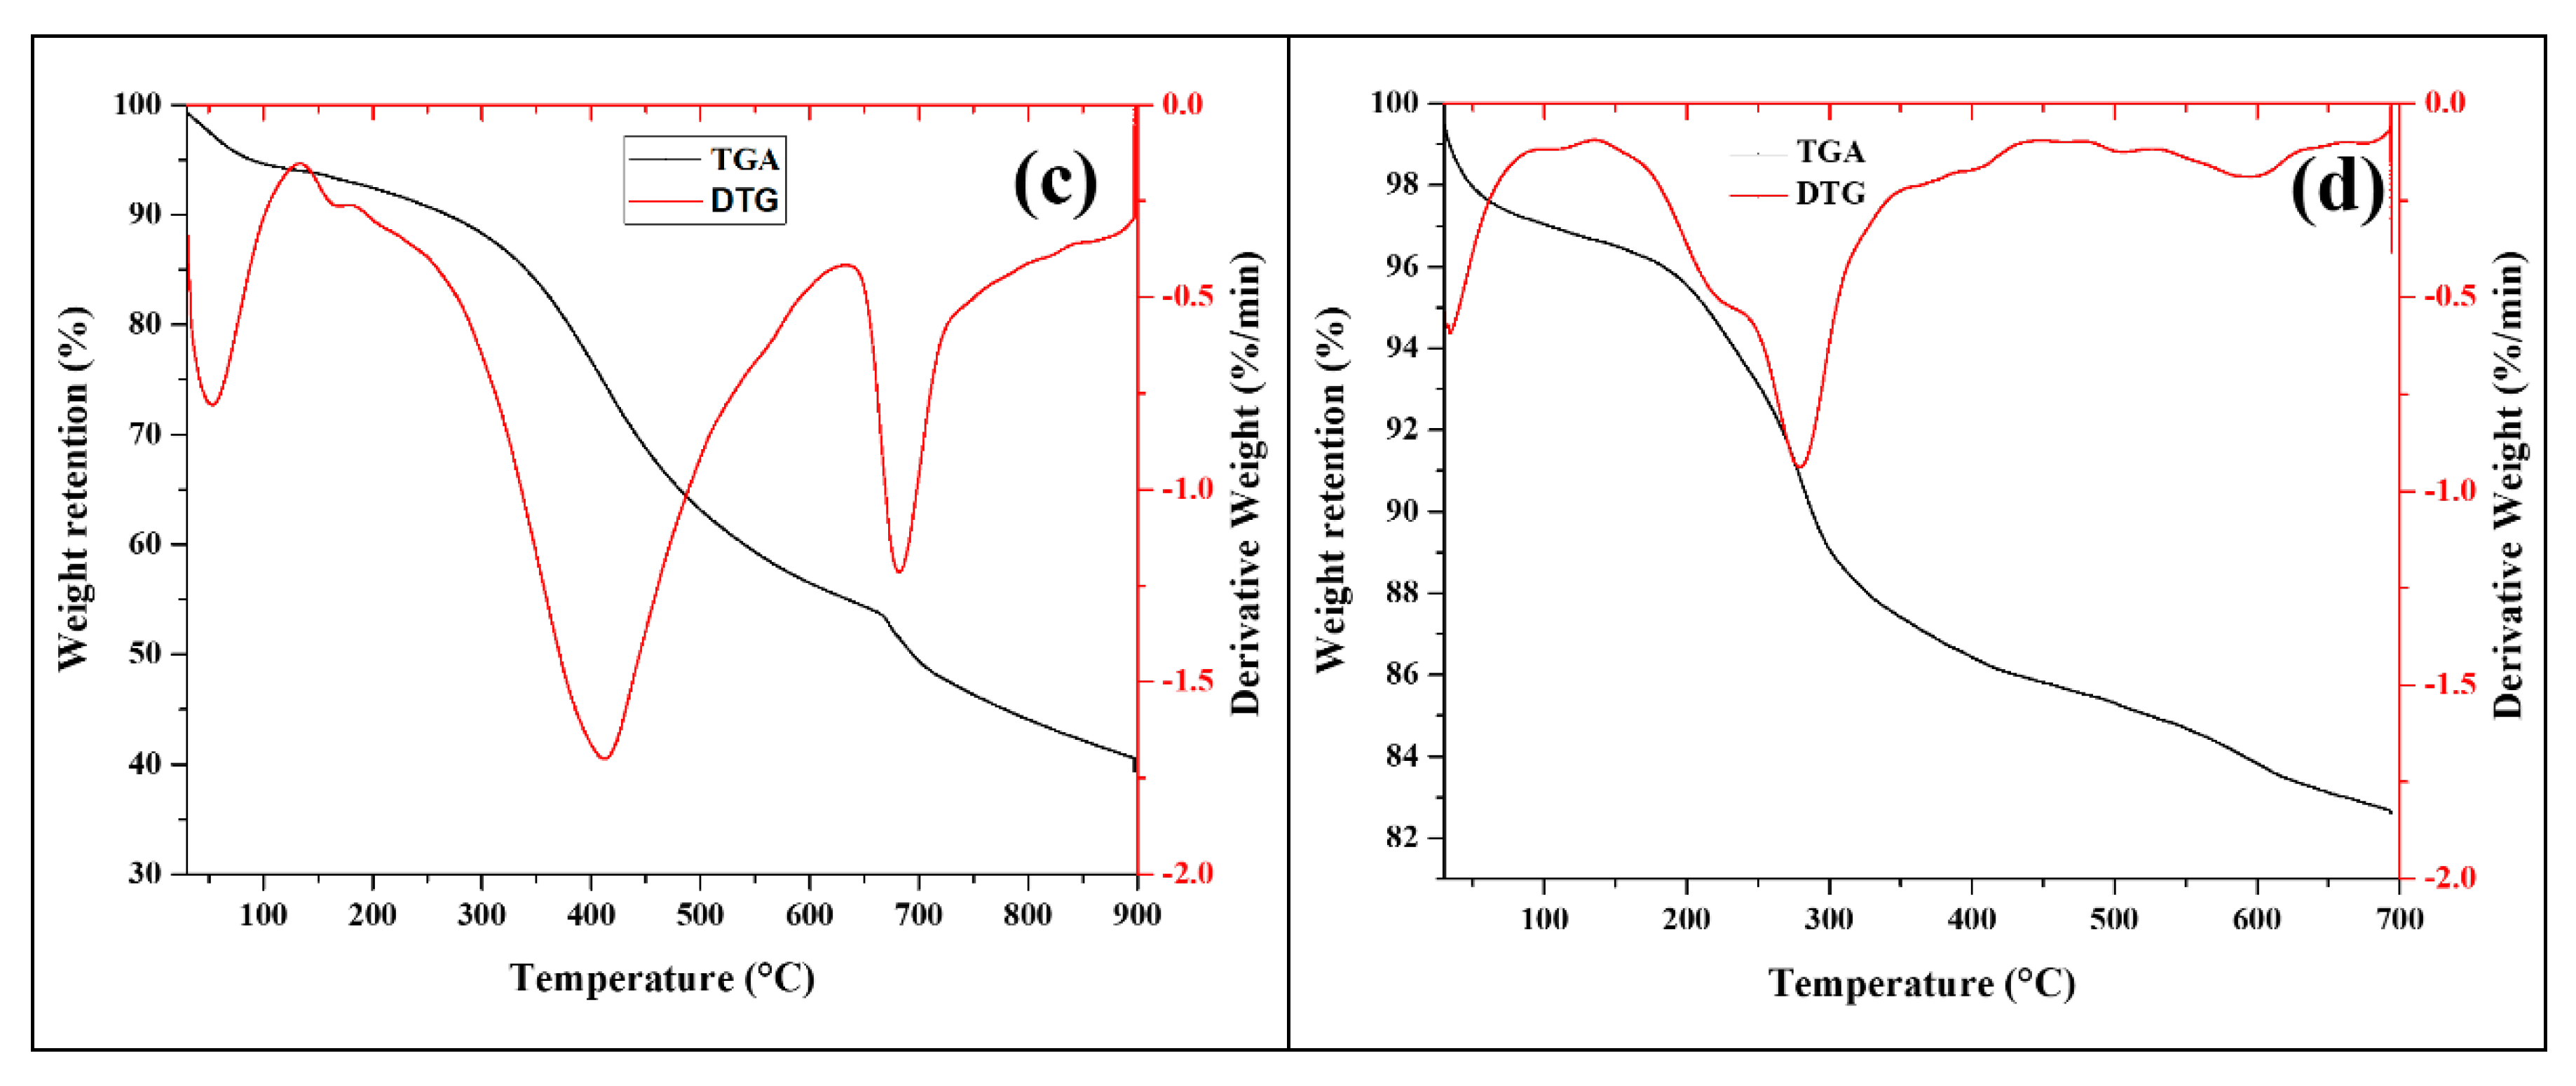
3.1.3. Thermogravimetric Analysis/Differential Thermogravimetry (TGA/DTG)

The thermograms of the as-synthesised Fe3O4@C nanocomposites and parent Fe3O4 NPs are illustrated in Figure 3. The recorded weight loss at 30–100 °C in Fe3O4@C-T190t3 (6.92%), Fe3O4@C-T190t4 (1.03%), and Fe3O4@C-T190t5 (5.37%) can be attributed to the evaporation of the water molecules physisorbed onto the surface of the samples. Degradation of the organic residue could probably be the factor responsible for the weight loss of 5.72–6.43% recorded within the temperature range of 100–300 °C for Fe3O4@C nanocomposites. The combustion of the encapsulating carbon was concurrently accomplished between 150 to 450 °C. The intensified degradation of organic residues and the carbonisation of the top layer of the Fe3O4@C nanocomposite surfaces could be asserted as the factor responsible for the weight loss recorded within the temperature range of 300–450 °C for Fe3O4@C-T190t3 (19.11%), Fe3O4@C-T190t4 (6.43%), and Fe3O4@C-T190t5 (19.55%). The uptake of carbon deposits from the in situ carbonisations of glucose precursor molecules onto the parent Fe3O4 NPs was more favourable during the hydrothermal synthesis of Fe3O4@C-T190t3 and Fe3O4@C-T190t5 than for Fe3O4@C-T190t4. As a result, the carbon content of the encapsulating layers in Fe3O4@C-T190t3 and Fe3O4@C-T190t5 was higher than in Fe3O4@C-T190t4. At 300~450 °C, gasification of the encapsulated carbon layer of the nanocomposites occurs. The gasification rate of the encapsulating carbon layer per minute in Fe3O4@C-T190t3 and Fe3O4@C-T190t5 was higher than in Fe3O4@C-T190t4 (as shown in red by plots in Figure 3) due to the higher carbon content in the composites. Further weight loss at higher temperatures, i.e., 450–900 °C, for Fe3O4@C-T190t3 (27.63%), Fe3O4@C-T190t4 (23.34%), and Fe3O4@C-T190t5 (28.54%), could be assigned to intensified carbonisation of the nanocomposite topmost layer and probable total exposure of the magnetite core of the nanocomposites [44]. Based on the overall weight loss throughout the entire heating profile of 30–900 °C, Fe3O4@C-T190t4 (36.5%) is the most stable sample in agreement with the carbon content shown in EDX analysis below. The thermal stability of both Fe3O4@C-T190t5 and Fe3O4@C-T190t3 are relatively similar, with a weight loss of as much as 60.0%. Moreover, the magnetite NPs from which the composites were fabricated recorded a far lower weight loss of 17.4% within the heating profile of 30–700 °C. The corresponding Fe3O4 NPs weight contents in the nanocomposites were estimated to be ~63.5% for Fe3O4@C-T190t4 and ~40.3% for both Fe3O4@C-T190t3 and Fe3O4@C-T190t5 within the heating profile. Fe3O4 NPs weight contents indicate the encapsulating carbon content composited in each as-synthesised nanocomposite material. However, relatively higher estimations of Fe3O4 NPs content (95.5%), thus signifying lower carbon content, were reported by Xu et al. [43].
The TGA/DTG analysis was used to monitor the weight loss and thermal stability of the sample as the temperature increased. As the increased weight loss with temperature could not allow estimations of the parent Fe3O4 NPs, the EDX analysis was employed in the semiquantitative estimation of the Fe3O4 NPs weights present in each nanocomposites sample. The major compositional component of the composites, Fe3O4 NPs, is completely transformed to hematite within the temperature range of 600–675 °C. Thus, comparisons between the weight loss in the nanocomposites and the parent Fe3O4 NPs precursor were performed by truncating the temperature axes of the nanocomposites to 700 °C, making the difference in the studied temperature range among the nanomaterials inconsequential. Change in weight of the composites within the range 675–900 °C could be attributed to the continued gasification of the encapsulating carbon layer and further transformations of the parent Fe3O4 NPs core [45].

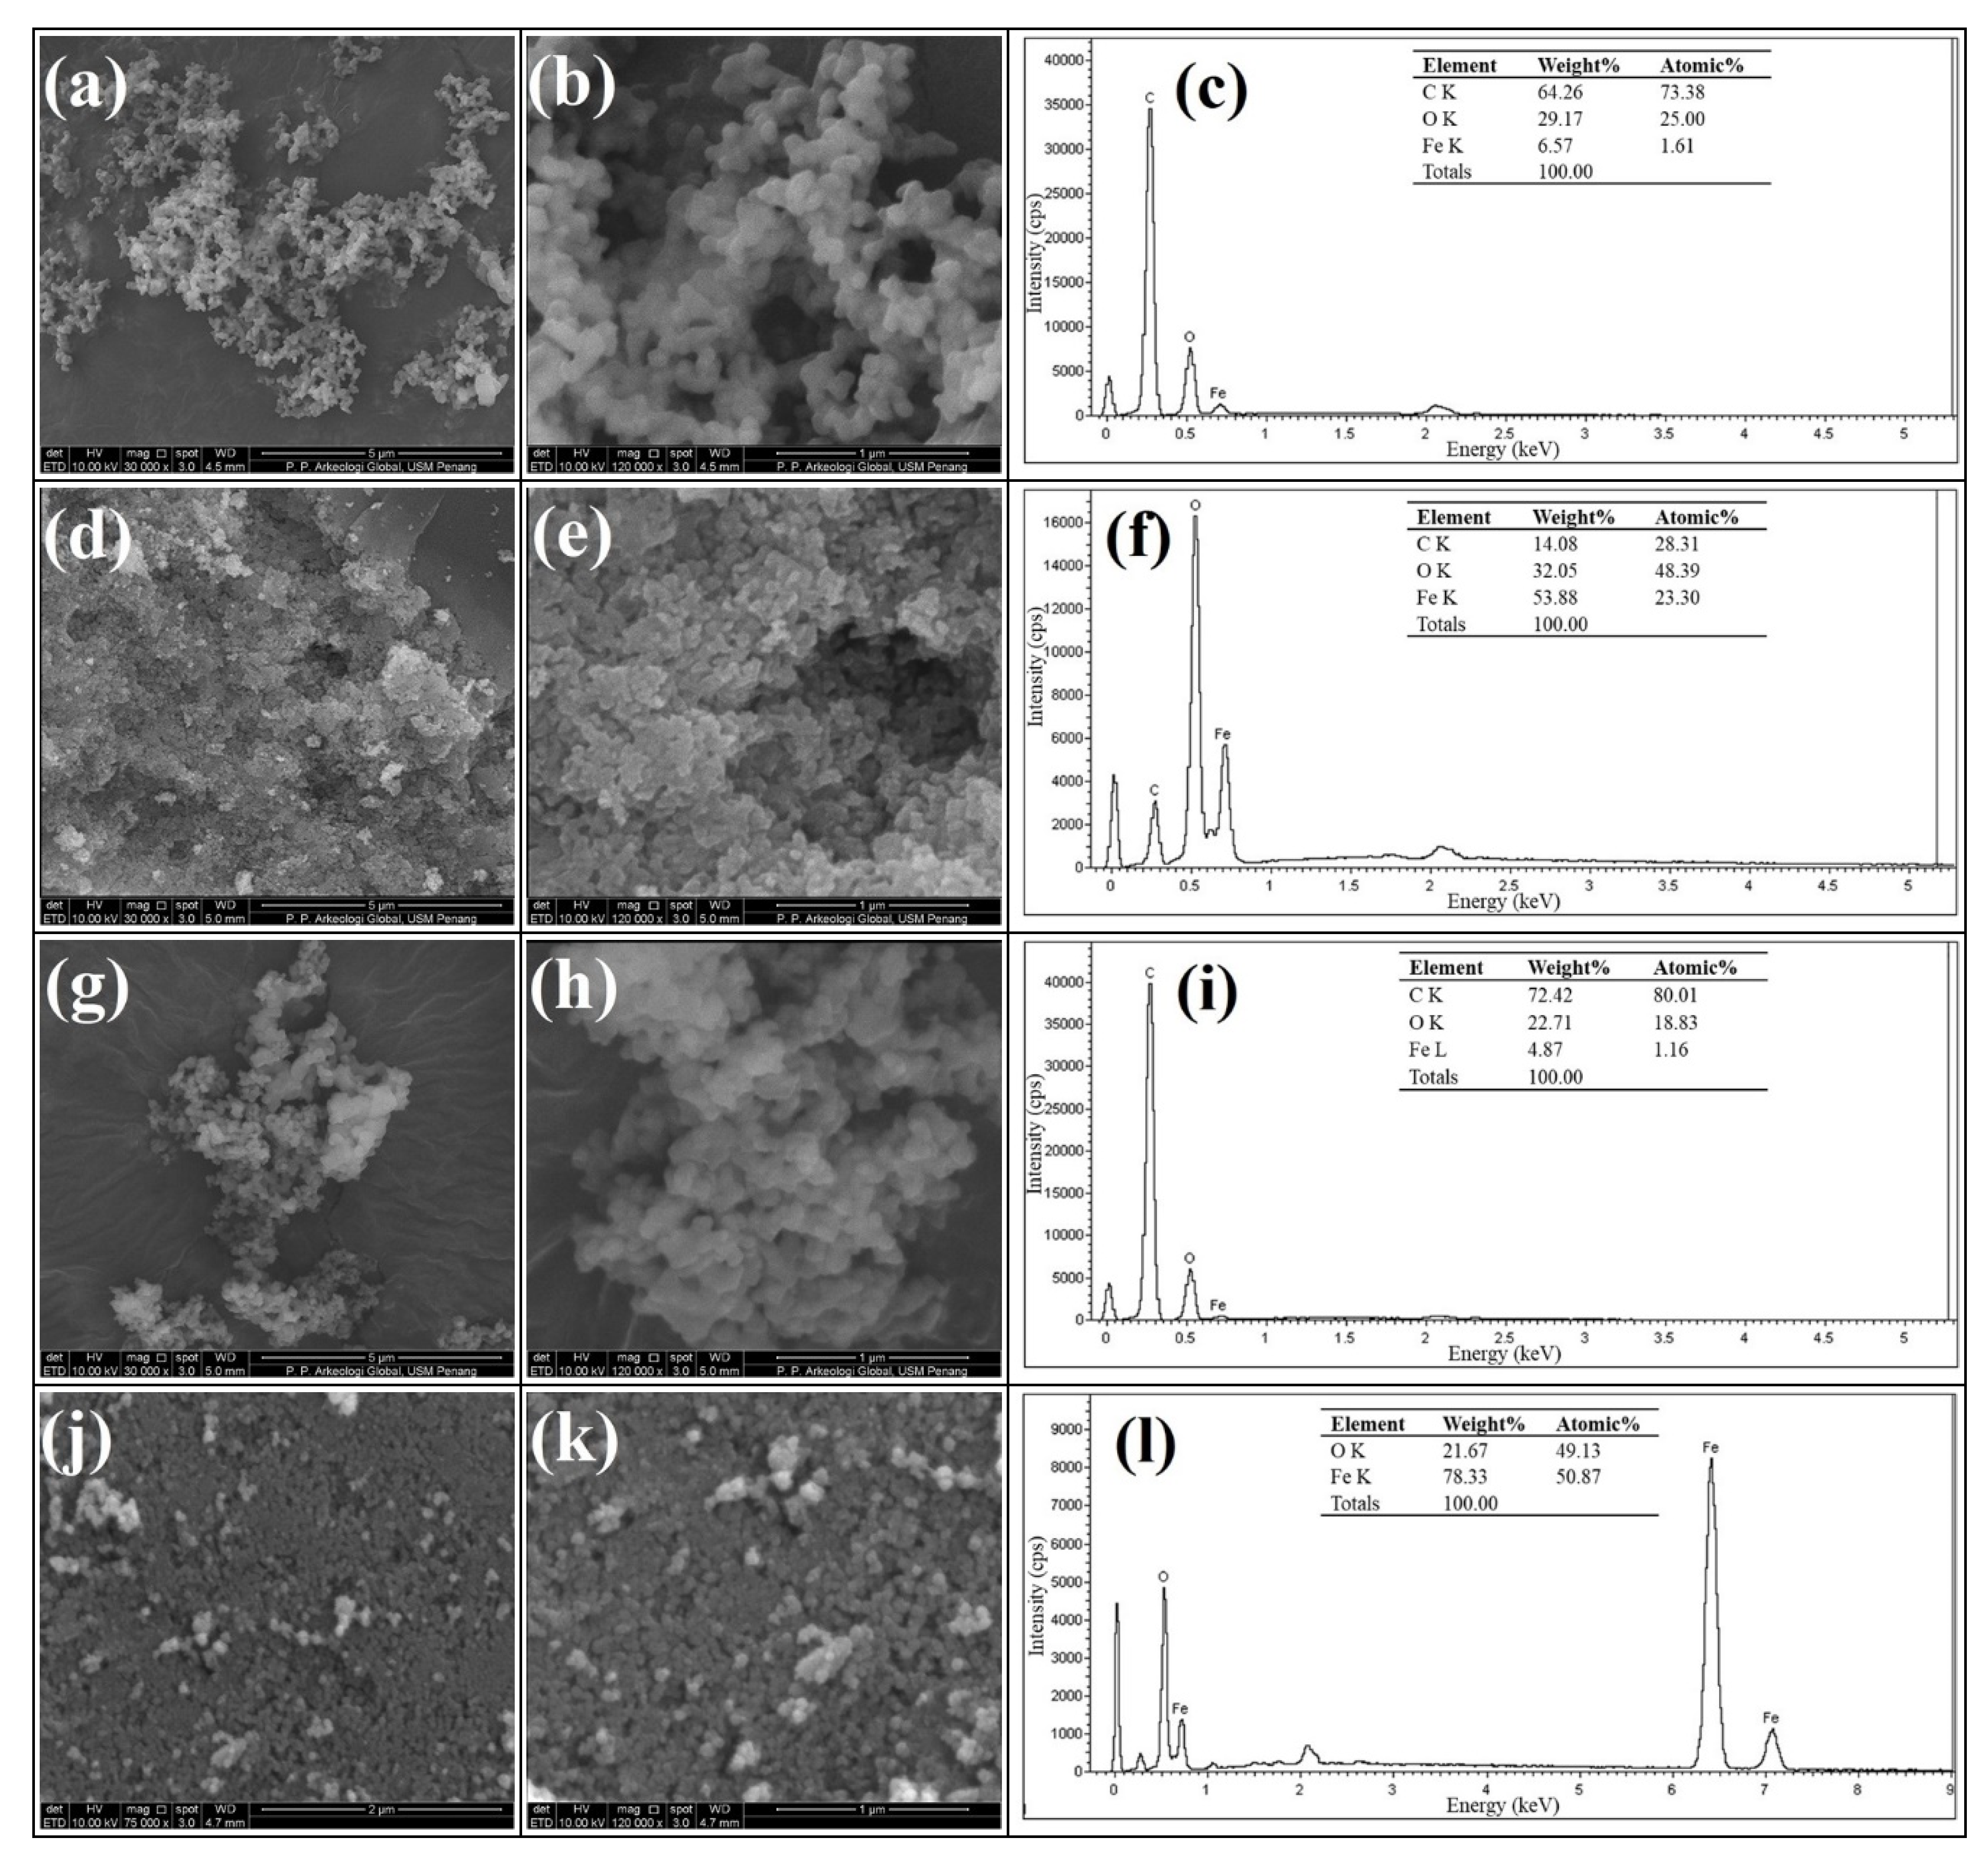
3.1.4. Scanning Electron Microscopy

Figure 4a–l compares the SEM micrographs of the as-synthesised Fe3O4@C nanocomposites and Fe3O4 NPs at low and high magnifications together with their EDX spectra. The SEM micrographs of Fe3O4@C-T190t3 (Figure 4a,b) and Fe3O4@C-T190t5 nanocomposites (Figure 4g,h) revealed the conspicuous formation of well-defined clusters of nanospheres during the hydrothermal process. In contrast, Fe3O4@C-T190t4 nanocomposite (Figure 4d,e) exhibit the formation of agglomerated clusters among the nanospheres. The nanocomposites show varying degrees of distributions in particle size, uniformity, and aggregation [46]. The nanocomposites possess larger distribution of particle size (11–91 nm) than the parent Fe3O4 NPs (21–39 nm), as indicated by supporting information from EFTEM, which is comparable to the observation reported by Liu et al. [44].
The EDX spectroscopic analyses (Figure 4c,f,i) carried out on the nanocomposites indicated the proportion by weight of carbon to increase in the order Fe3O4@C-T190t4 (14.1%) < Fe3O4@C-T190t3 (64.3%) < Fe3O4@C-T190t5 (72.4%). It could be observed that Fe3O4@C-T190t4 has the lowest carbon content and recorded the least weight loss. Although it was found to compose of a typical stoichiometry near the standard phase composition of Fe3O4 NPs (78.3% Fe, 21.7% O) by atomic weight, the as-synthesised magnetite NPs obtained at the solvothermal step has been observed to exhibit an experimental stoichiometric ratio O:Fe (0.28) a little less than the expected value (0.38) [47]. This observed deviation can be attributed to the fact that EDX is a semiquantitative analytical technique. Previously, based on EDX analysis, Liu et al. [44] reported that their as-synthesised Fe3O4@C nanocomposites contained 15.4% carbon, which is in agreement with Fe3O4@C-T190t4 (14.1%) but far lower than those observed for Fe3O4@C-T190t3 (64.3%) and Fe3O4@C-T190t5 (72.4%). This observation indicates that the deposition of the encapsulating carbon layer onto the parent Fe3O4 NPs was more favourable at 5 h, and the least favourable reaction time was at 4 h.

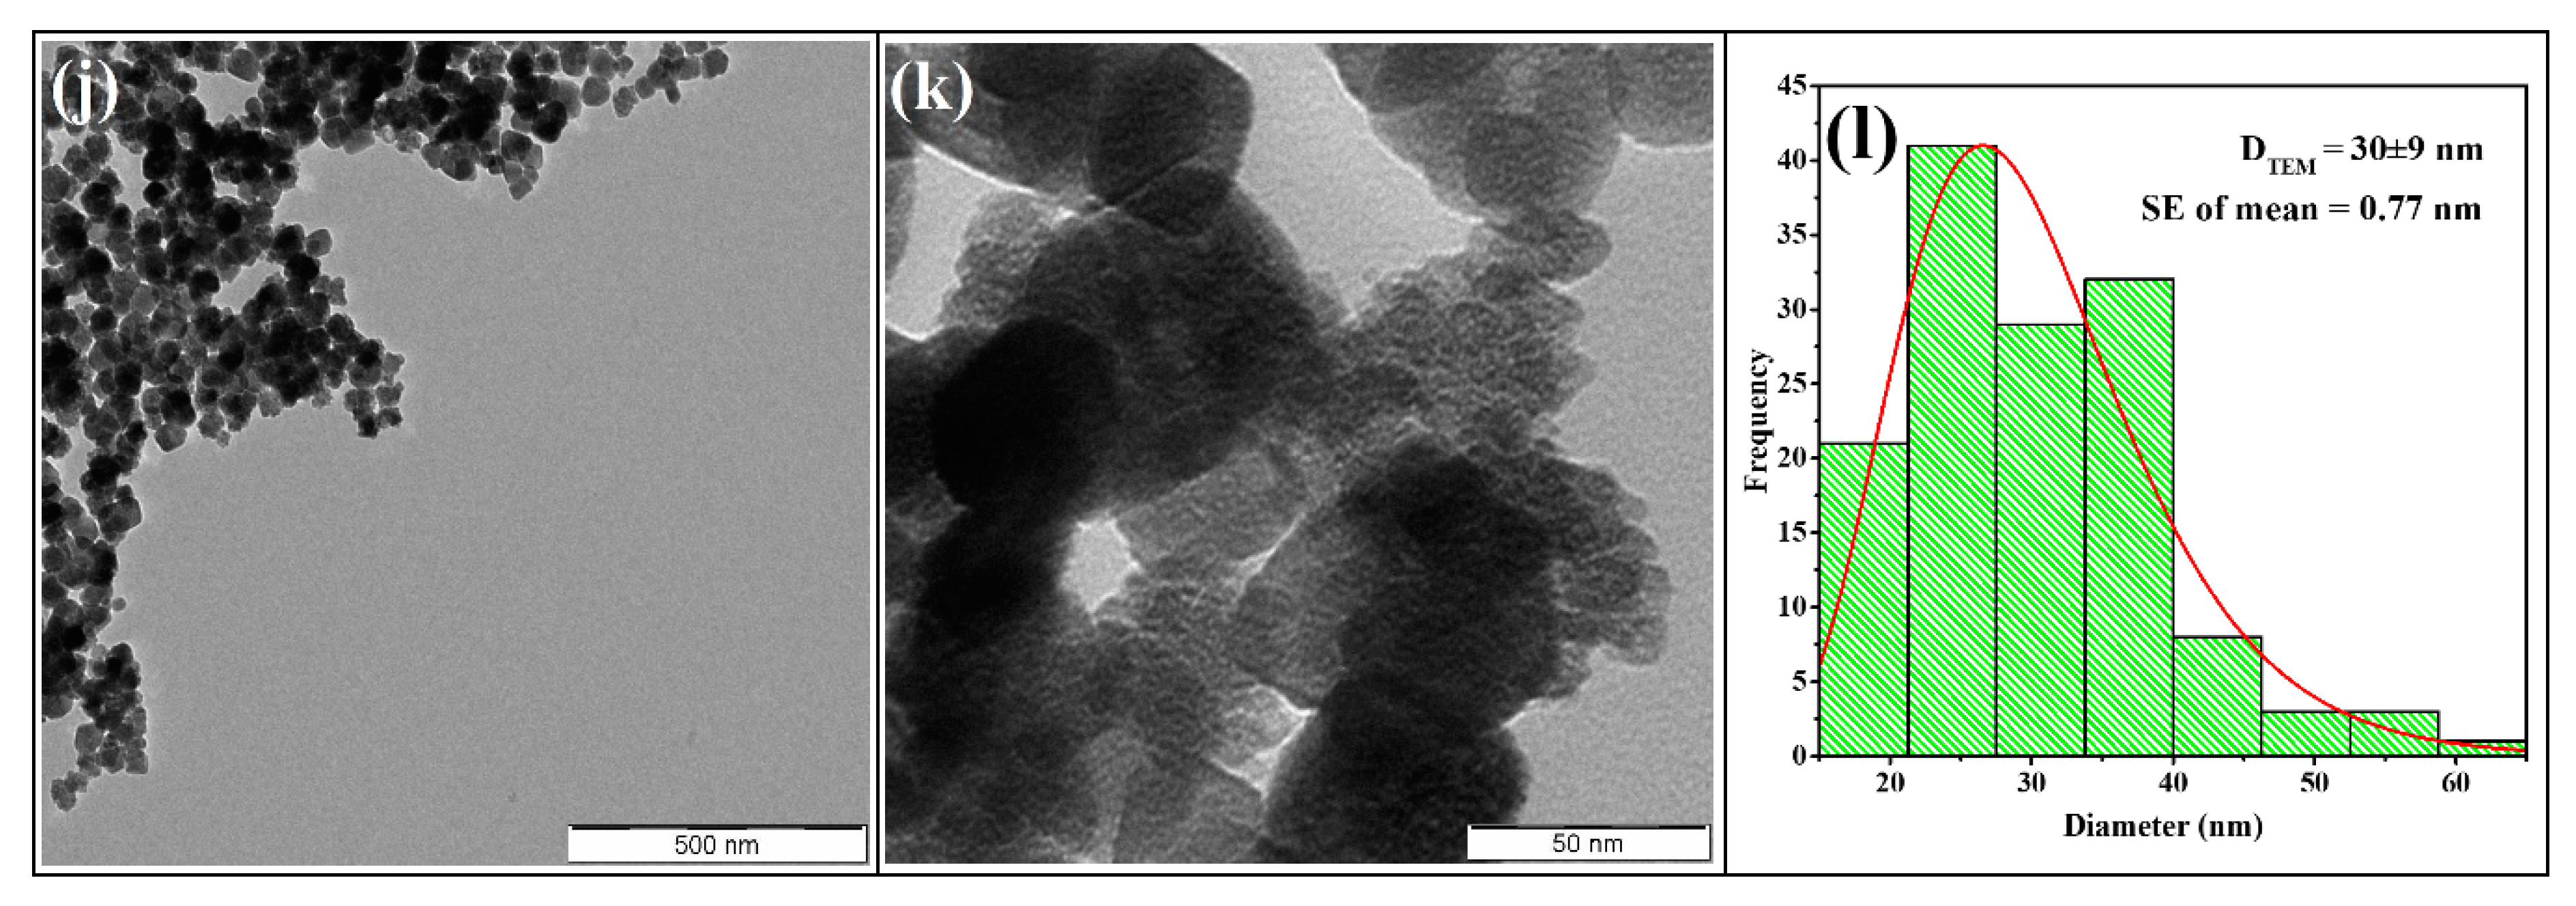
3.1.5. Transmission Electron Microscopy

Evaluations of particle size distribution and further morphological elucidation of the nanocomposites were carried out using the EFTEM characterisation technique. Figure 5 demonstrates differing compositions of spherical, rod-like, and cubic morphologies depending on the reaction time (tr). The formation of nanocomposites with larger grain sizes has been conspicuously observed to be more favourable at tr of 3 and 5 h, which in turn may be due to the amount of carbon in the nanocomposite. Figure 5a,d,g show the nanocomposites to appear as clusters of nanospheres while at higher magnifications (Figure 5b,e,h) they appear to be more cubic-like nanocomposites.
The nanocomposites’ particle size distributions were evaluated by fitting a lognormal distribution function over histograms constructed from the edge length (or diameter) data obtained via the measurements of 138 grains on the TEM micrograph of each sample. The Sturge’s rule, expressed in Equation (2), was applied to evaluate the number of bins ( k ) for the histograms [48,49]:
k = 1 + log2 N
where N is the sample size representing the number of measurements carried out on each EFTEM micrograph. The results show that the mean particle diameter (DTEM) for the nanocomposites Fe3O4@C-T190t3, Fe3O4@C-T190t4 and Fe3O4@C-T190t5 were 67 ± 19, 16 ± 5, and 77 ± 14 nm, respectively, in contrast to the mean diameter of 30 ± 9 nm recorded for the parent Fe3O4 NPs (Figure 5l). Fe3O4@C-T190t3 and Fe3O4@C-T190t5 composites exhibited carbon shells of 37 and 47 nm in thickness, which were shells probably not observable in Fe3O4@C-T190t4 composite under the current microscopic settings as evidenced by its lowest carbon content from EDX analysis and lowest weight loss from the thermal analysis. Thus, the thickness of the carbon encapsulation at 3 h decreased at 4 h and then increased at 5 h, indicating that the thickness of the carbon layer from glucose resources can be controlled by increasing the reaction time [40]. The small standard error of the mean (0.41–1.59 nm) indicates that the values of the mean particle size (DTEM) are accurate and reliable representations of measurements in each sample size [50]. Furthermore, nanocomposites with similar particle size distribution (30 ± 19 nm) were also reported in the literature [44].

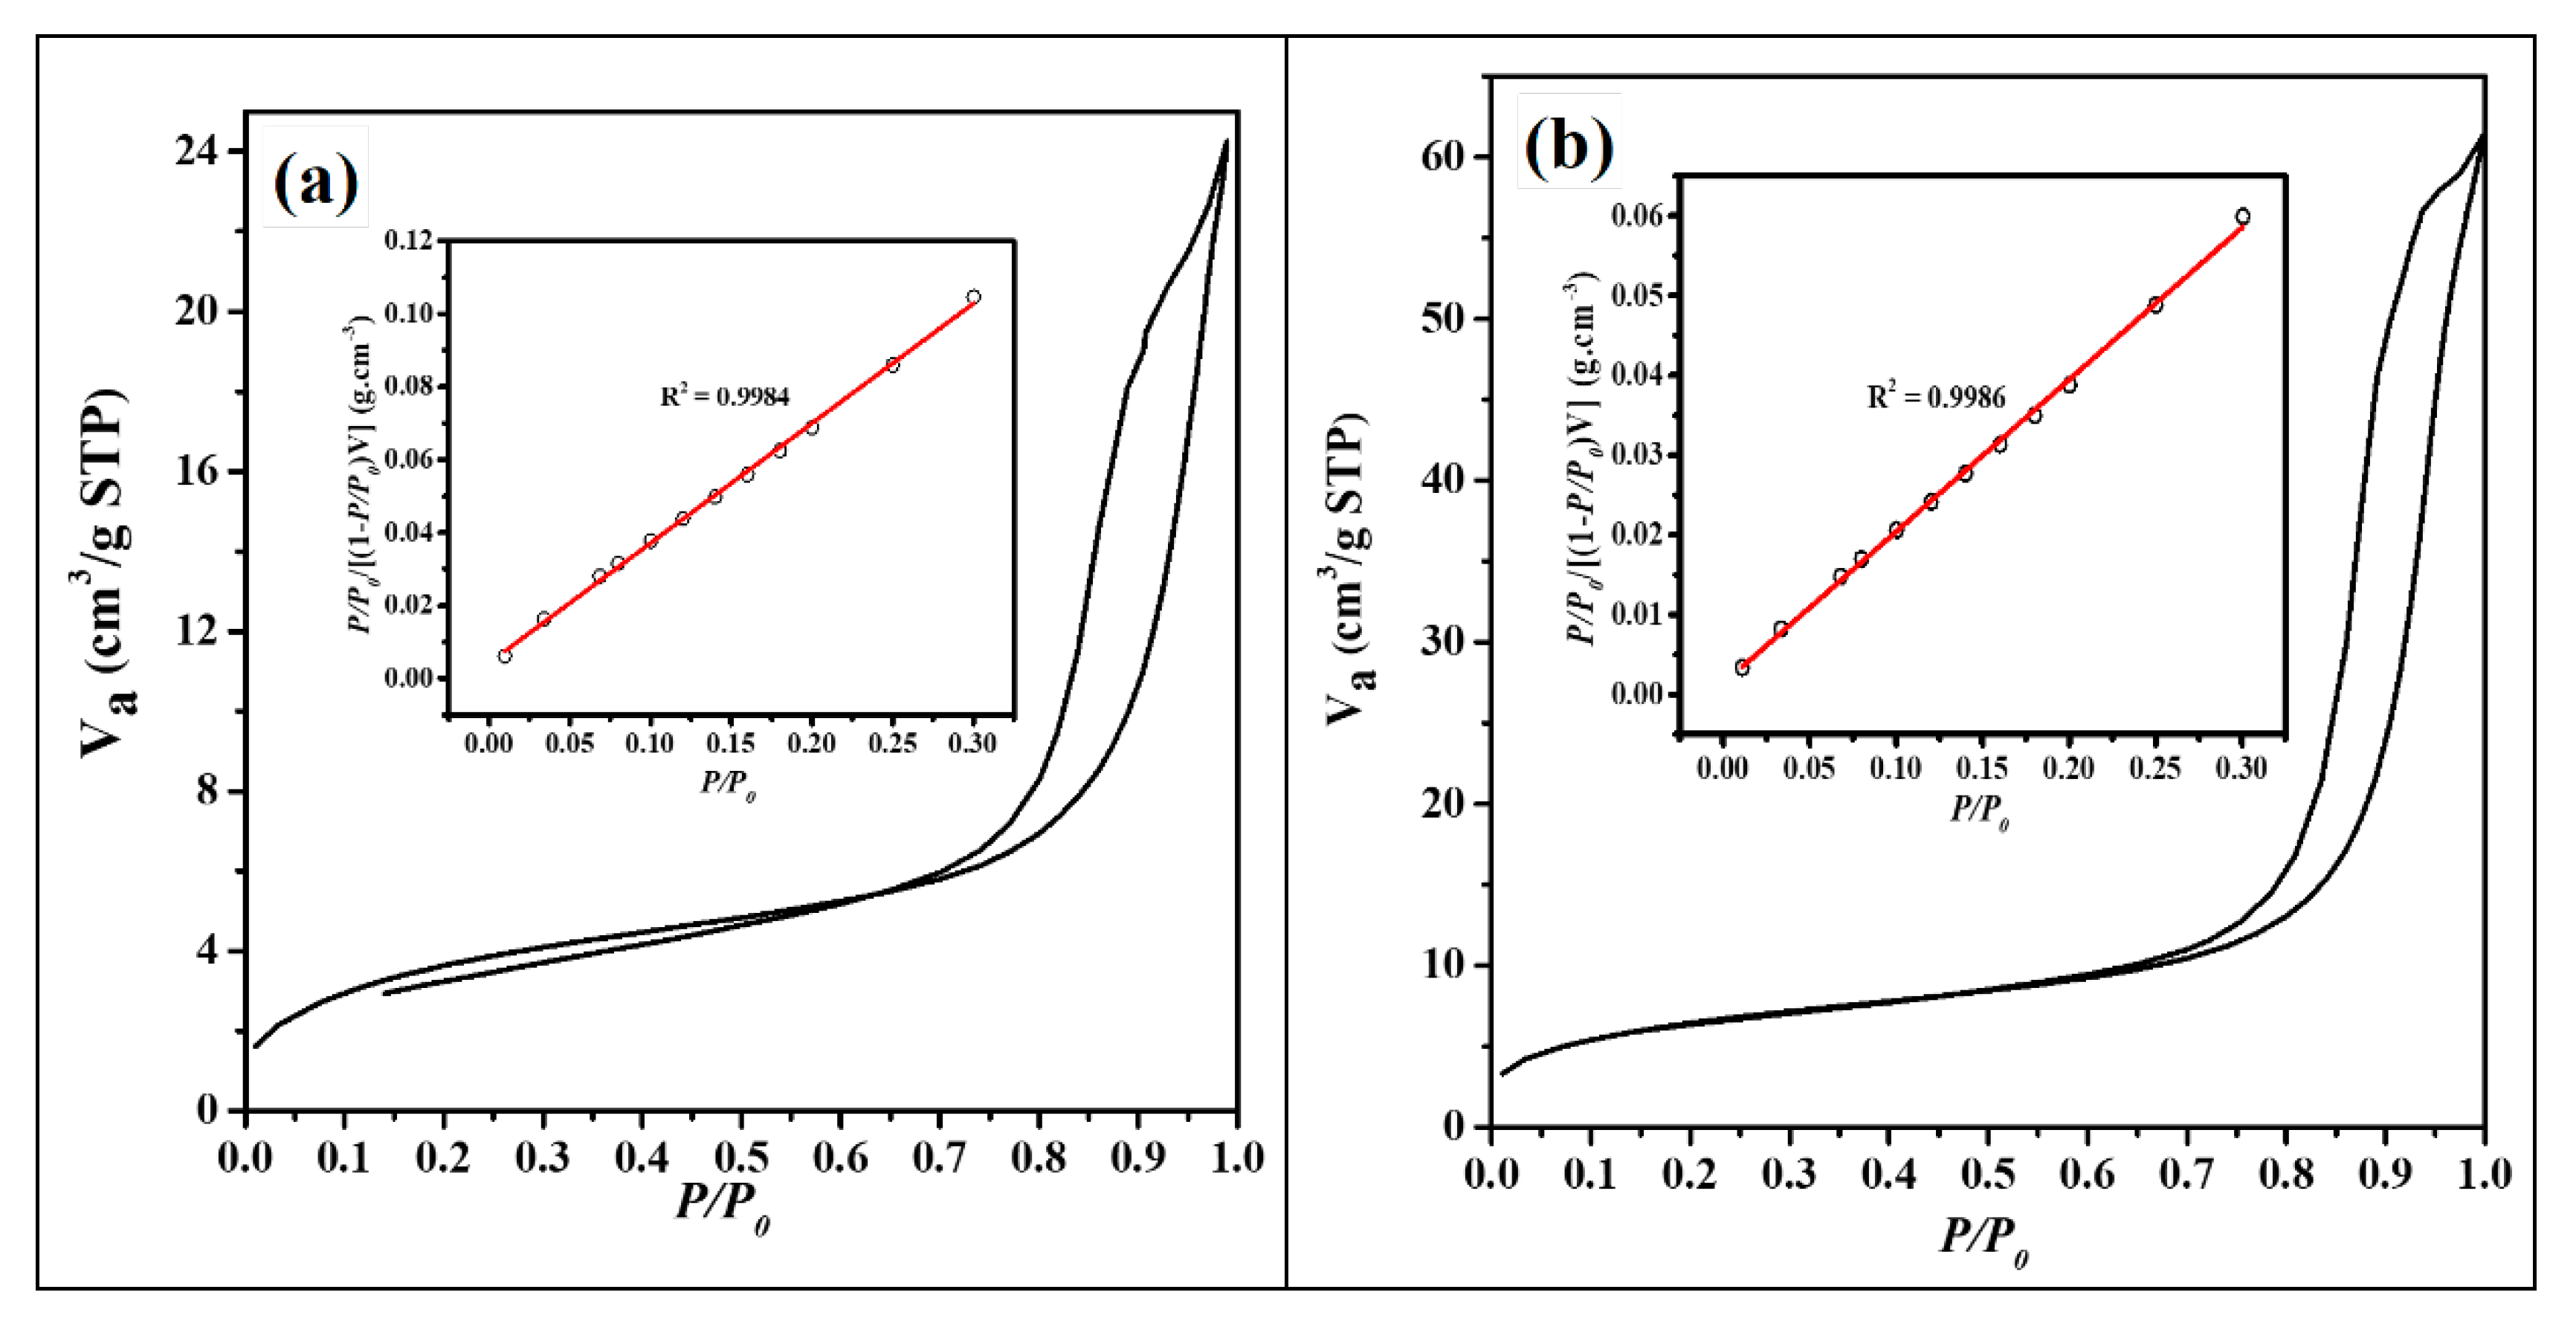
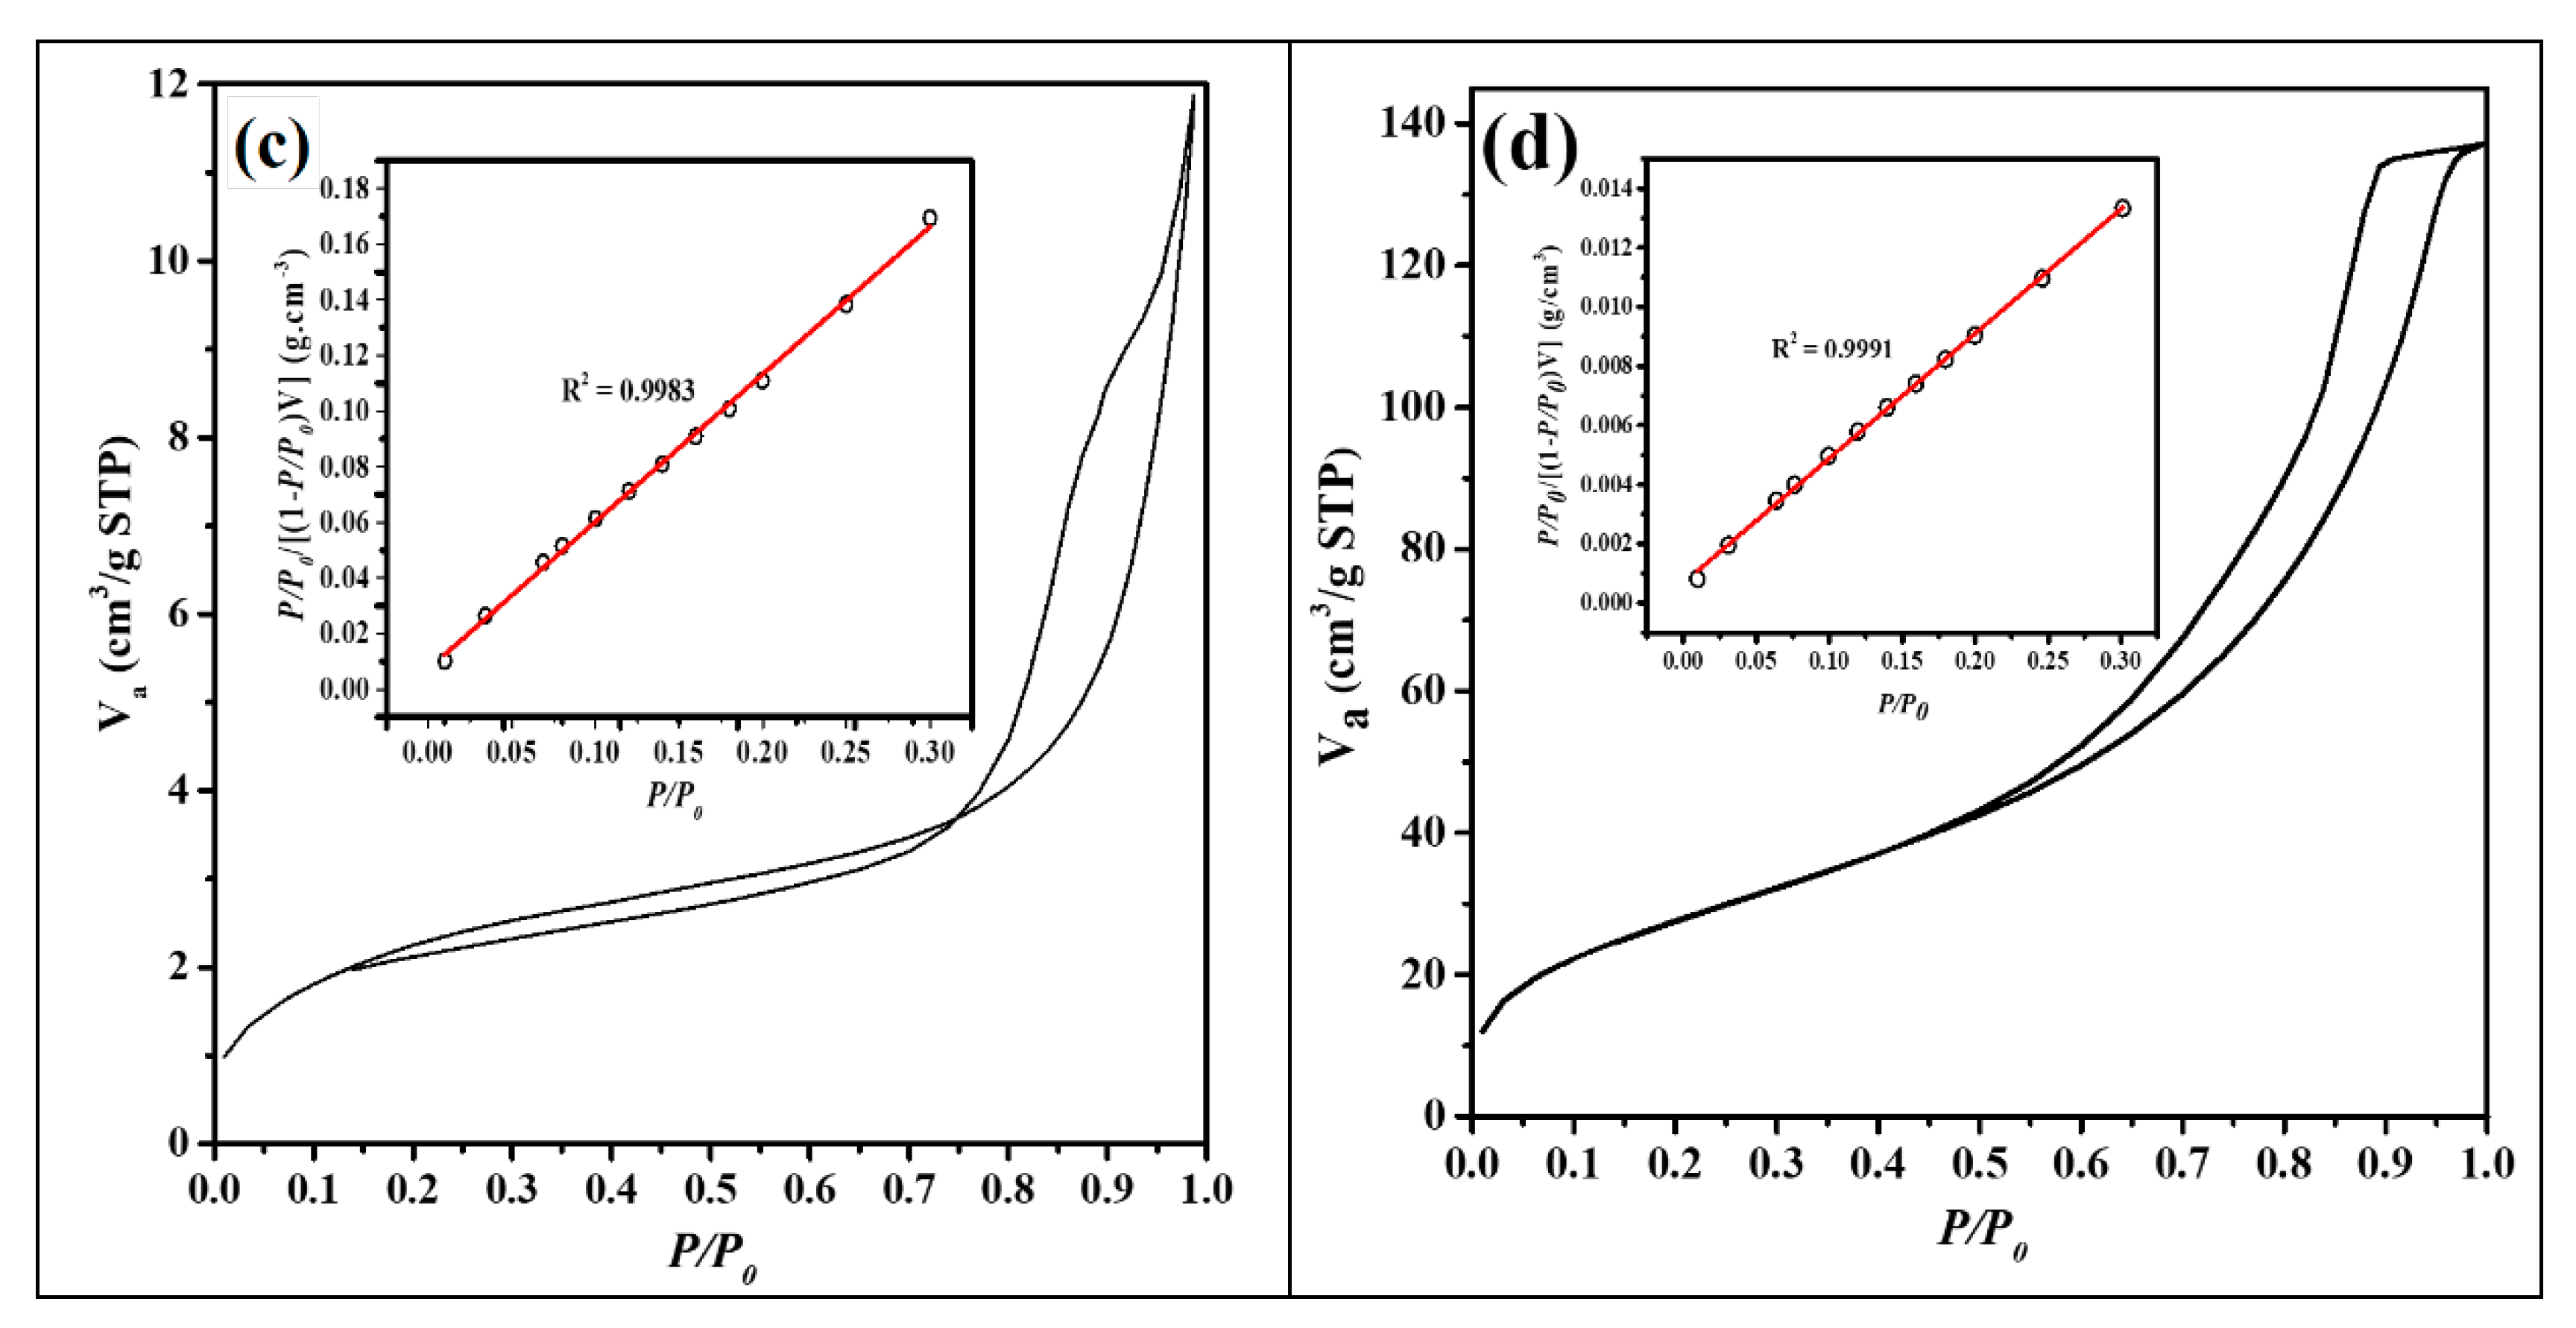
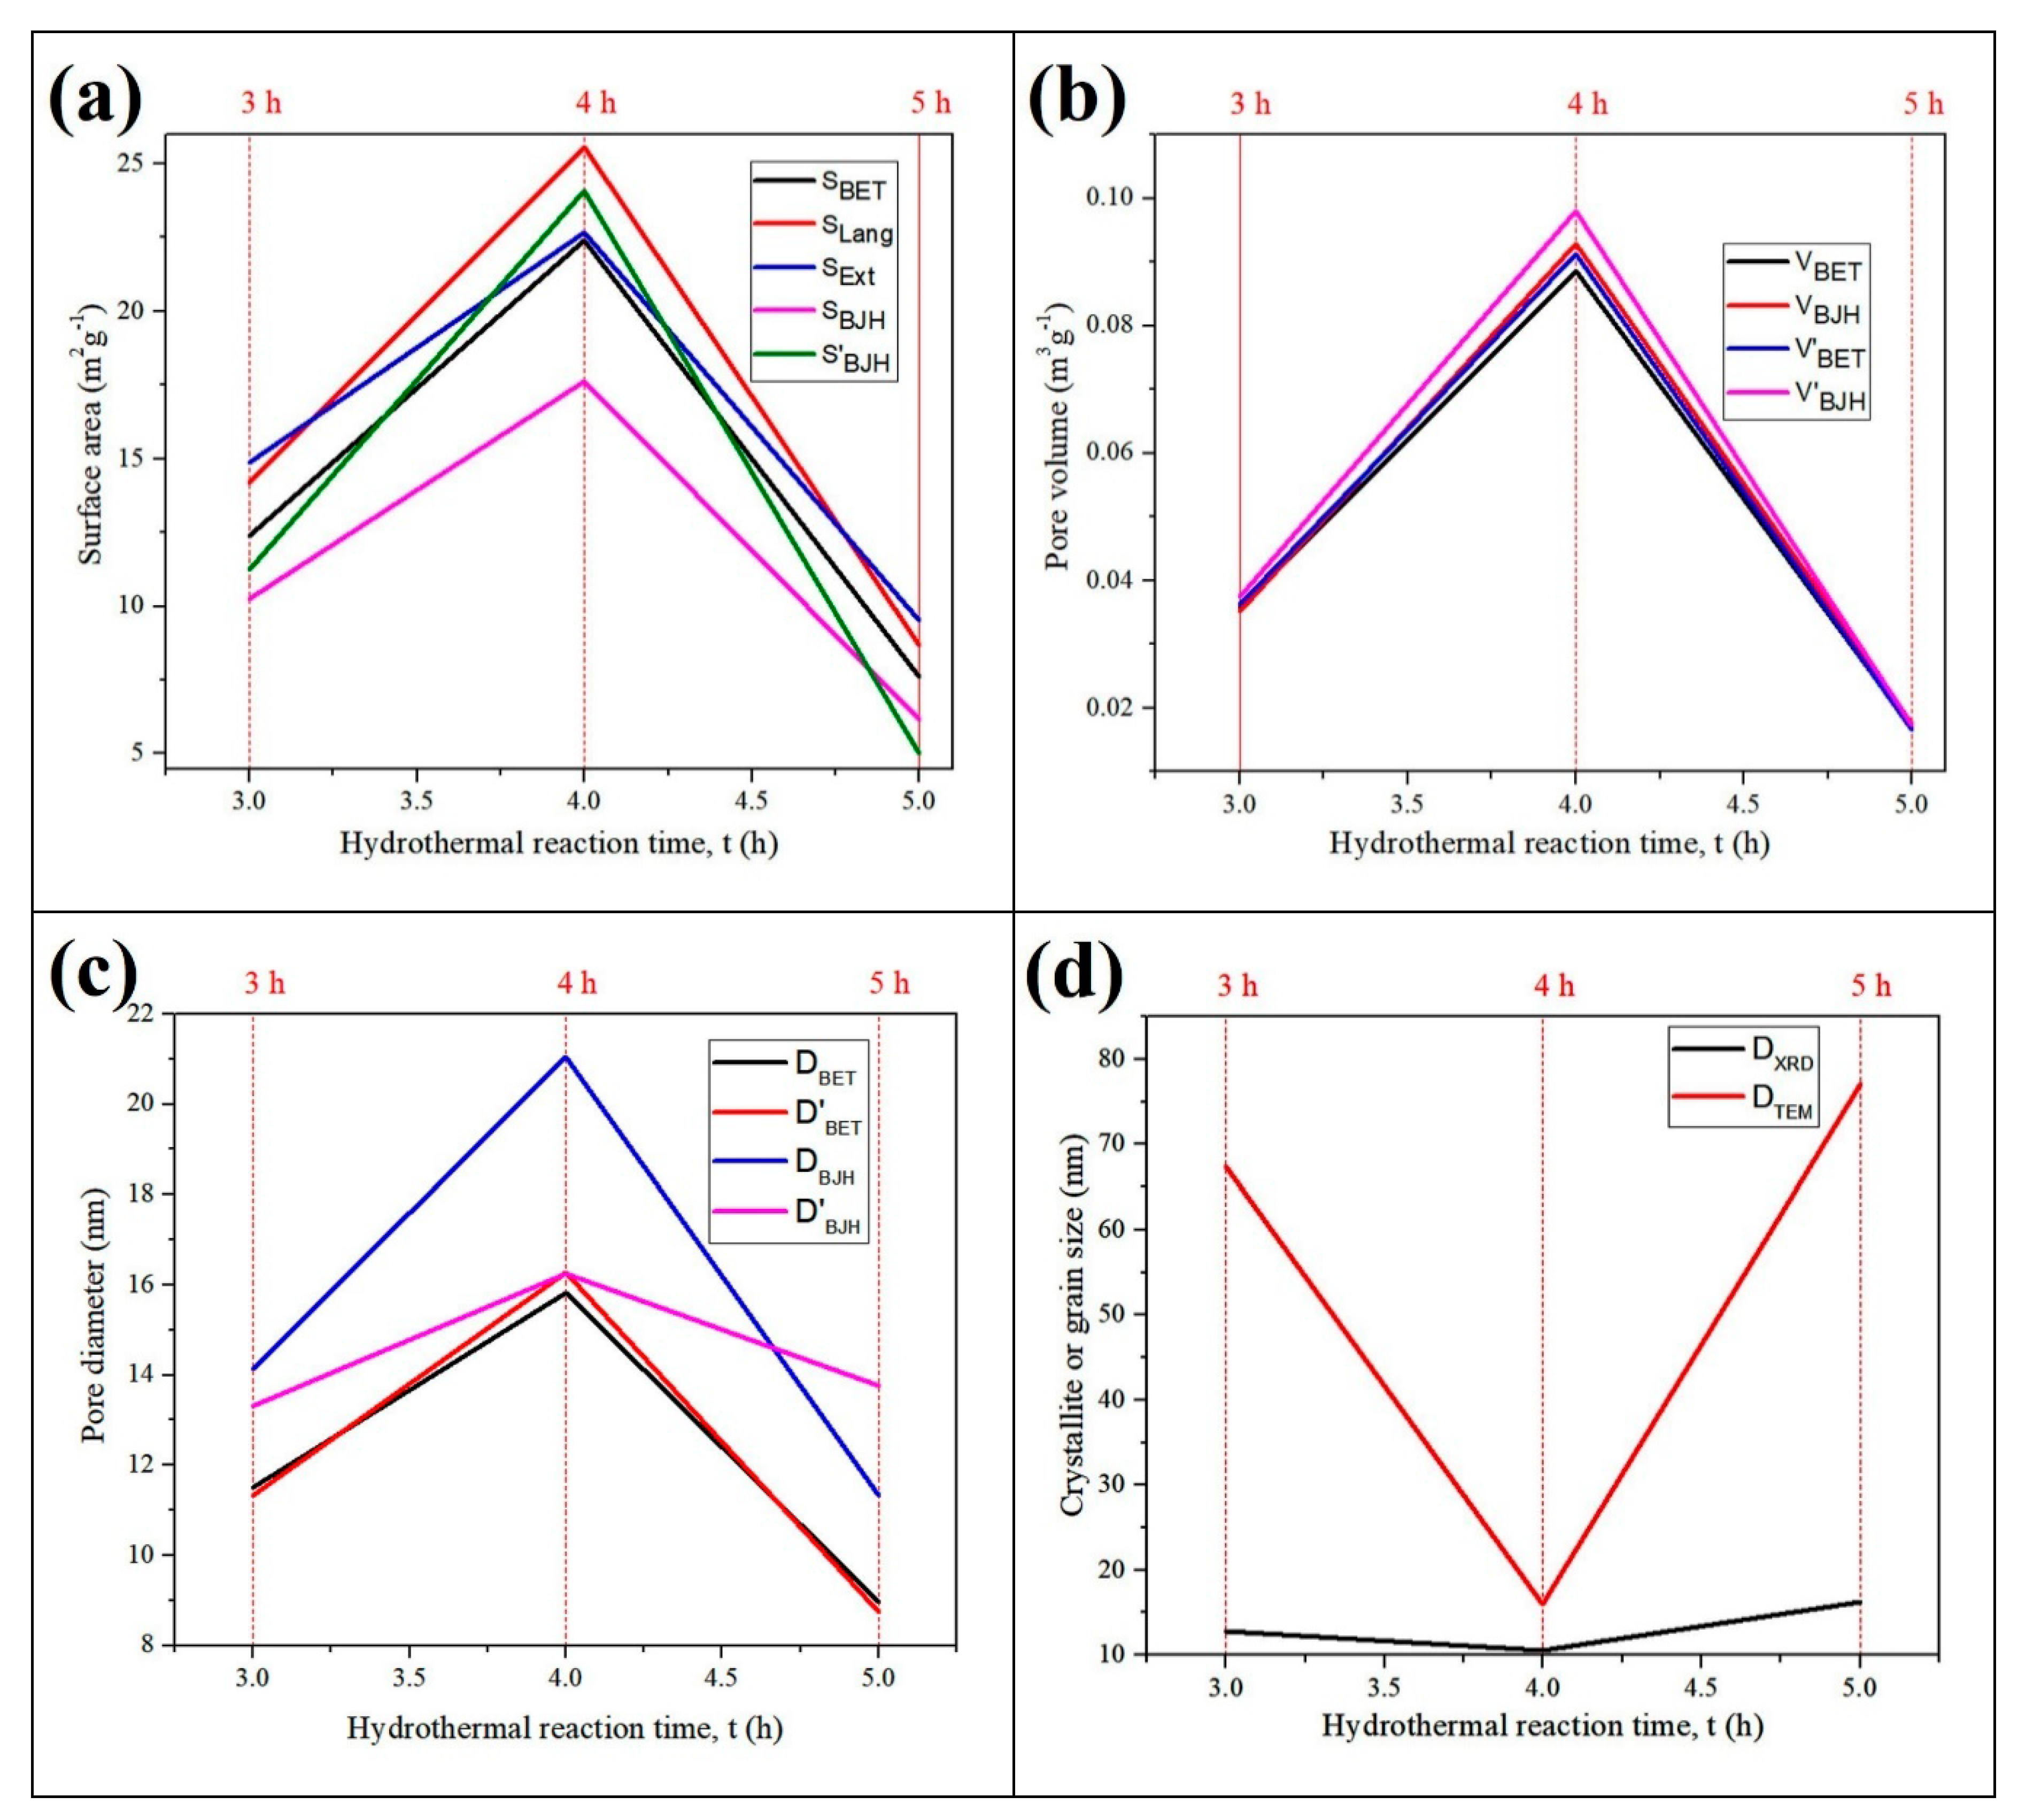
3.1.6. Brunauer–Emmett–Teller (BET) Nitrogen Adsorption–Desorption Analysis

Figure 6 illustrates the comparison of the nitrogen adsorption–desorption isotherms for the as-synthesised Fe3O4@C nanocomposites and the magnetite NPs (Figure 6d). The BET isotherms of all the three nanocomposites exhibited an H3 hysteresis loop and were classified as Type II adsorption isotherms in line with International Union of Pure and Applied Chemistry (IUPAC). It is the characteristic of mesoporous materials whose mesopore volumes are not well defined because of the low-degree pore curvature and non-rigid structure of the aggregate nanocomposites [51,52,53]. The BET surface areas for the as-prepared magnetite composites are 12.39 m2 g−1 (Fe3O4@C-T190t3), 22.41 m2 g−1 (Fe3O4@C-T190t4), 7.61 m2 g−1 (Fe3O4@C-T190t5), compared to 5.6 m2 g−1 reported by Zeng and co-workers [20]. However, values as high as ∼342.7 m2 g−1 have been reported by Zhuang and co-workers [23].
Various surface properties of the nanocomposites were further compared (Figure 7a–d). Different forms of the surface area including the BET surface area (SBET), Langmuir surface area (SLang), t-plot surface area (SExt), Barrett-Joyner-Halenda (BJH) adsorption cumulative surface area of pores (SBJH) and BJH desorption cumulative surface area of pores (S’BJH) were compared in Figure 7a. Meanwhile, Figure 7b shows the comparison between the BET adsorption total pore volume (VBET) with BJH adsorption total pore volume (VBJH), BET desorption total pore volume (V’BET), and BJH desorption total pore volume (V’BJH) as pore volumes equivalents. In addition to that, the comparative distinction among BET adsorption average pore width (DBET), BET desorption average pore width (D’BET), BJH adsorption average pore width (DBJH), and BJH desorption average pore width (D’BJH) were presented in Figure 7c. Comparison between the mean crystallite size from XRD (DXRD) and mean particle size from TEM (DTEM) among the nanocomposites was presented in Figure 7d. The results show that Fe3O4@C-T190t4 has the highest surface area, total pore volumes and pore diameters and the smallest crystallite grain size and particle size among the three Fe3O4@C nanocomposites. However, the average surface area (114 m2 g−1), pore volume (0.21 cm3 g−1), and crystallite size (19 nm) of the parent Fe3O4 NPs were greater than those of the resulting composites. On the contrary, the average values of pore diameter and grain size of the parent Fe3O4 NPs (8.4, 30 nm) were both smaller than that of the Fe3O4@C-T190t3 (12.6, 67 nm) and Fe3O4@C-T190t5 (10.7, 77 nm) nanocomposites. Although the pore diameter of the Fe3O4 NPs (8.4 nm) was also less than that of the Fe3O4@C-T190t4 nanocomposite (17.4 nm), the grain size of the parent NPs (30 nm) was larger than in the nanocomposite (16 nm).

3.2. Two-Step Fe3O4@C NCs Formation Mechanism

The mechanism of the process was accomplished in two steps. The solvothermal method was used to synthesise the mesoporous Fe3O4 NPs in the first step, whose mechanism was proposed by Li et al. [29]. According to the mechanism proposed, EG is employed both as a reducing agent and high boiling point solvent. Sodium acetate is incorporated in the reaction mixture to act as a structure-directing agent, while ethylenediamine (EDA) is added as a chelating solvent to the parent Fe3O4 NPs [54]. Specifically, glycolaldehyde is produced by oxidising EG in solvothermal heating. The glycolaldehyde obtained reduces Fe3+ to Fe2+ ion, resulting in glyoxal. The acetate anions (CH3COO) combine with the free Fe3+ and Fe2+ cations in the mixture to produce the acetates, Fe[CH3COO]3 and Fe[CH3COO]2, as the temperature rises. At such high temperatures, hydrolysis and alcoholysis convert Fe[CH3COO]3 and Fe[CH3COO]2 into Fe(OH)3 and Fe(OH)2. Dehydration of the hydrolytic products eventually produces the parent Fe3O4 NPs. As a chelating agent, EDA facilitates the growth of the encapsulating carbon particles on the Fe3O4 NPs under hydrothermal reaction to fabricate Fe3O4@C NCs samples at various reaction times [54].

3.3. Statistical Analysis of the Surface Properties

3.3.1. Analysis of Variance (ANOVA)

Analysis of variance (ANOVA) was carried out to test the null hypothesis (H0) that all means for the surface area, total pore volume and pore diameter for the three nanocomposites were equal at the 0.05 statistical level of significance (α). The corresponding alternative hypothesis (H1) asserts that not all means of these surface properties of the nanocomposites were equal.
From the ANOVA results (Table 1), the hydrothermal tr has been ascertained to affect the surface area significantly, total pore volumes and pore diameters for the three samples of the Fe3O4@C nanocomposites (p < 0.05). The summary of the model statistic (Table 2) was able to explain most of the variables to a great extent in total pore volumes (R2 = 99.60%) of the Fe3O4@C nanocomposites among the fabricated samples, followed by surface area (R2 = 90.13%). In comparison, the least variability was observed in the pore diameters (R2 = 69.83%).

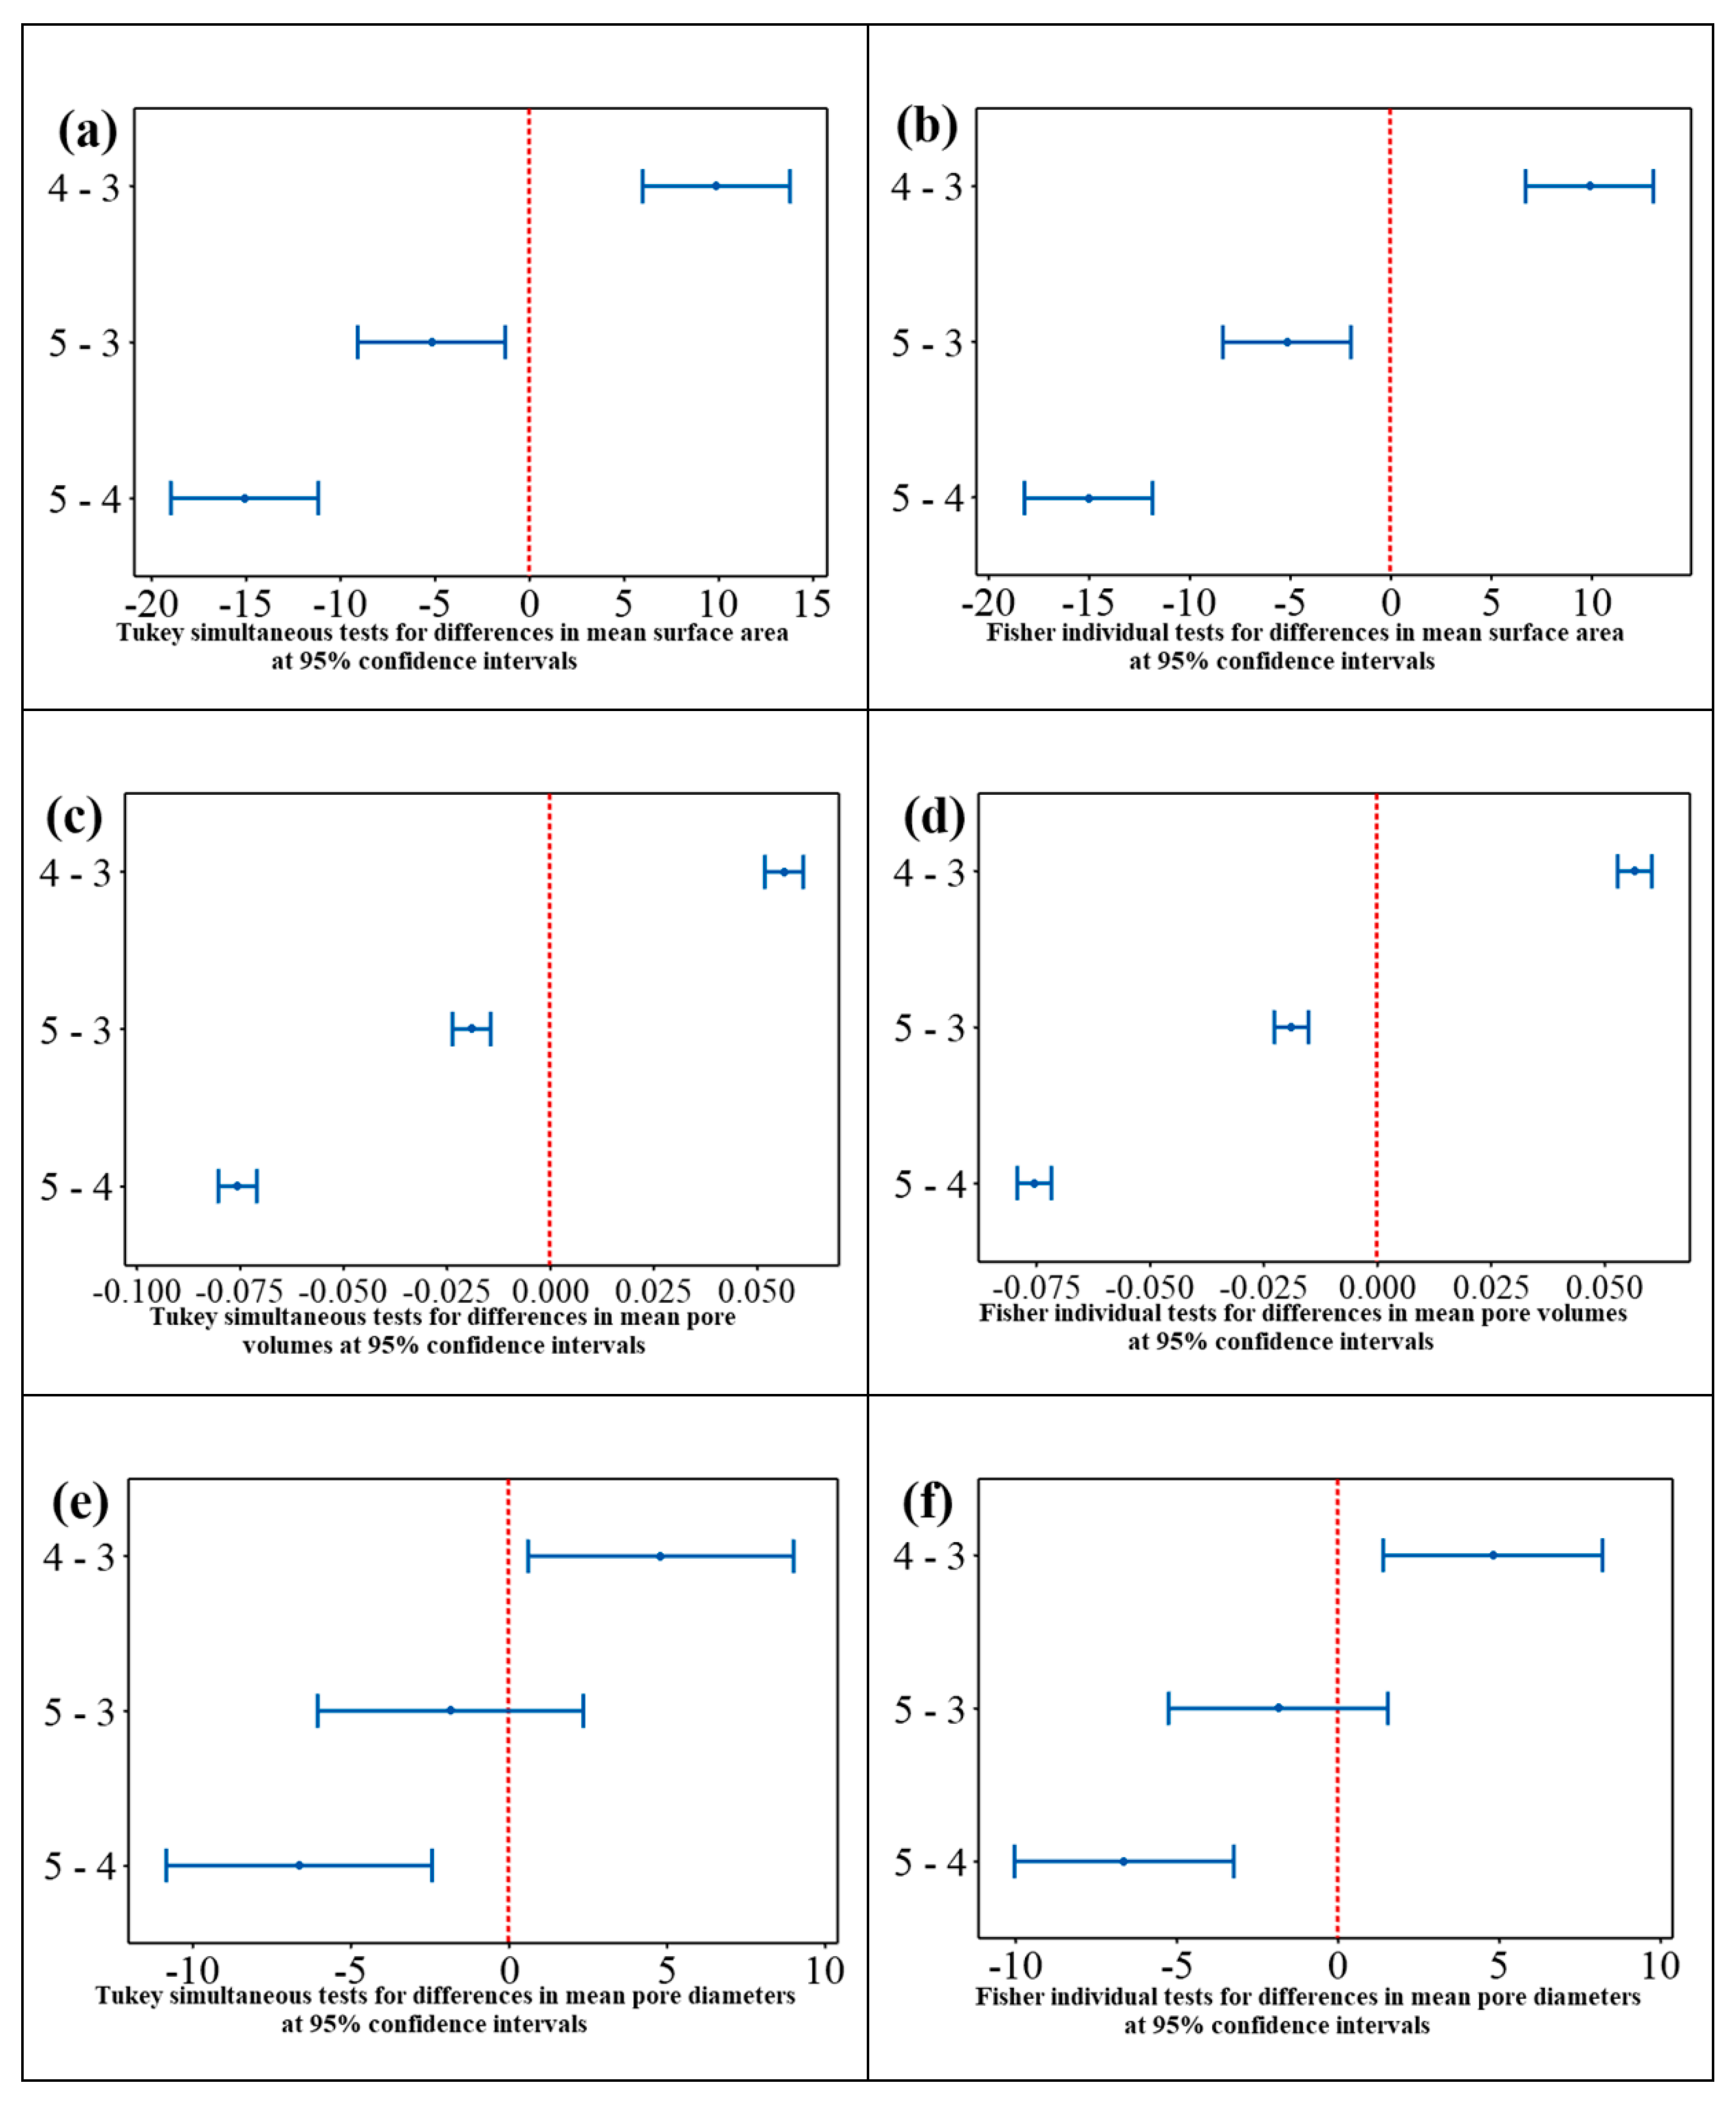
3.3.2. Pairwise Comparisons for Surface Properties

Figure 8 presents the plots for the Tukey simultaneous tests and Fisher individual tests for pairwise differences between means surface properties (surface areas, pore volumes, pore diameters) of the nanocomposite samples obtained at various hydrothermal tr values (Fe3O4@C-T190t3, Fe3O4@C-T190t4 and Fe3O4@C-T190t5) at 95% confidence intervals (CIs).
The confidence intervals (CIs) observed in the Tukey test plots (Figure 8a,c,e) for the difference in the pore diameter means ((0.59, 8.98), (−6.07, 2.33), (−10.85, −2.45)), total pore volume means ((0.05193, 0.06122), (−0.02365, −0.01435), −0.08022, −0.07093)), surface area means ((5.98, 13.77), (−9.08, −1.28), (−18.95, −11.16)) between the nanocomposites Fe3O4@C-T190t4 and Fe3O4@C-T190t3 (4–3), Fe3O4@C-T190t5 and Fe3O4@C-T190t3 (5–3), and Fe3O4@C-T190t5 and Fe3O4@C-T190t4 (5–4) do not include zero in their interval except for the difference in the pore diameter means (−6.07, 2.33) between Fe3O4@C-T190t5 and Fe3O4@C-T190t3 (5–3), respectively. Similarly, the observed confidence intervals (CIs) in the Fisher test plots (Figure 8b,d,f) for the difference in the means of pore diameter ((1.38, 8.19), (−5.27, 1.53), (−10.05, −3.25)), the means for the total pore volume ((0.05281, 0.06034), (−0.02276, −0.01524), (−0.07934, −0.07181)), the means of the surface area ((6.69, 13.06), (−8.36, −2.00), (−18.24, −11.87)) between the nanocomposites Fe3O4@C-T190t4 and Fe3O4@C-T190t3 (4–3), Fe3O4@C-T190t5 and Fe3O4@C-T190t3 (5–3), and Fe3O4@C-T190t5 and Fe3O4@C-T190t4 (5–4) exclude zero in their interval with exception to the difference in the pore diameter means (−5.27, 1.53) between Fe3O4@C-T190t5 and Fe3O4@C-T190t3 (5–3), respectively. These outcomes indicate that for all the pairwise comparisons under Tukey and Fisher tests, the mean surface properties between the nanocomposite samples are significantly different statistically except for the mean total pore volumes between nanocomposites Fe3O4@C-T190t5 and Fe3O4@C-T190t3 (5–3).
Table 3 tabulates the t values, individual confidence levels, adjusted p values, and simultaneous confidence levels from the Tukey and Fisher tests for all the pairwise differences in means for pore diameter, total pore volume and surface area of the nanocomposites. The t value test statistic measures the ratio between the difference in means of the surface properties and their standard errors in both the pairwise Tukey and Fisher tests between the nanocomposites. Observed absolute t values in both Tukey and Fisher tests for the difference in the pore diameter means (|3.18|, |1.24|, |4.42|), total pore volume means (|34.02|, |11.42|, |45.44|), surface area means (|6.76|, |3.54|, |10.30|) between the nanocomposites; Fe3O4@C-T190t4 and Fe3O4@C-T190t3 (4–3), Fe3O4@C-T190t5 and Fe3O4@C-T190t3 (5–3), and Fe3O4@C-T190t5 and Fe3O4@C-T190t4 (5–4) were found to be greater than their corresponding critical t values of 3.18, 3.18 and 2.78, respectively. This disparity indicates that the null hypothesis (H0) that the mean properties are the same should be rejected, and the alternative hypothesis (H1) that they are different should be accepted for all the nanocomposites in the pairwise comparative tests except for the difference in the pore diameter means between Fe3O4@C-T190t5 and Fe3O4@C-T190t3 (5–3). Since the absolute t values (|1.24|) for the difference in the pore diameter means between Fe3O4@C-T190t5 and Fe3O4@C-T190t3 (5–3) were less than the critical t values (3.18), the H0 should be accepted.
The simultaneous confidence levels (SCLs) for pore diameter (88.66%), pore volume (88.66%) and surface area (88.44%) indicate that we can be 88.66%, 88.66% and 88.44% confident that all the corresponding confidence intervals contain the true difference for specific pairwise comparison of the nanocomposite properties. Meanwhile, the individual confidence levels (ICLs) for pore diameter (97.91%), pore volume (97.91%) and surface area (97.94) indicate that we can be 97.91%, 97.91%, and 97.94% confident that each of the corresponding confidence intervals contains the true difference.
The adjusted p values (p-adj) observed in both the Tukey and Fisher tests for the differences in means of the surface properties show that all the properties between the compared pairs of nanocomposites were statistically different (p-adj < 0.05), except for the difference in the mean total pore volumes between nanocomposites Fe3O4@C-T190t5 and Fe3O4@C-T190t3 (5–3), which is found to be statistically inconsequential (p-adj > 0.05).
The reaction time-dependent hydrothermal synthesis performed for surface properties optimisation produced mesoporous as-synthesised nanocomposites with high volume-specific surface area (VSSA) values. The order of the VSSA values for the nanocomposites are Fe3O4@C-T190t5 (4.48 × 10⁻⁸) > Fe3O4@C-T190t3 (3.48 × 10⁻⁸) > Fe3O4@C-T190t4 (2.53 × 10⁻⁸). Large VSSA generally imparts nanomaterials unique surface characteristics, including enhanced thermal, electrical, mechanical, and optical properties [55]. Moreover, the Fe3O4@C nanocomposites could be biocompatible with high response electrochemical activity, thermal stability, and enhanced thermal and electrical conductivity [56]. Such carbon-encapsulated magnetite nanomaterials have the potential for diverse applications in various fields. They can be used as drug carriers in targeted drug delivery therapeutic systems [57,58], anodes materials in the construction of electrochemical lithium-ion batteries [59], microwave absorbing material for the treatment of microwave radiation pollution [60,61,62,63], and coolants for heat transfer applications in various systems (e.g., automobile radiators, refrigerators, electronic devices, solar energy heaters, etc.) [56]. Fe3O4@C can also be applied as photothermal contrasting-agents in proton magnetic resonance imaging for cancer treatment [64], peroxidase enzymatic mimics for glucose sensing in human body fluids [65], and in the remediation of wastewater containing recalcitrant organic compounds either as adsorbent material [66,67] or as the catalyst [68,69]. The utilisation of Fe3O4@C nanocomposites as the catalysts for treating recalcitrant pollutants in palm oil mill effluent (POME) by advanced oxidation processes (AOPs) is a potential area for application of the nanocomposites.

4. Conclusions

Hydrothermal fabrications of carbon-encapsulated magnetite nanocomposites under a fixed temperature (190 °C) at reaction time (tr) of 3 h (Fe3O4@C-T190t3), 4 h (Fe3O4@C-T190t4), and 5 h (Fe3O4@C-T190t5) have been accomplished. The influences of tr on mean surface properties (surface area, total pore volumes and pore diameters) of the nanocomposites were evaluated using one-way analyses of variance (ANOVA), Tukey simultaneous tests and Fisher individual tests for differences in mean properties of nanocomposite pairs. The ANOVA test shows that the hydrothermal reaction time (tr) significantly affected the surface area, total pore volumes and the particles size of the three Fe3O4@C nanocomposites samples (p < 0.05), and the model could explain almost 100%, 90% and 70% of the variability in the total pore volumes, surface area and pore diameters of the fabricated Fe3O4@C nanocomposites, respectively. These absolute t values from the pairwise comparison of the nanocomposites using Tukey and Fisher tests indicate the mean surface properties of nanocomposite pairs to be significantly different except for the mean total pore diameter of the pair Fe3O4@C-T190t5–Fe3O4@C-T190t3 (5-3). The adjusted p values (p-adj < 0.05) observed in the ANOVA for the pairwise difference in the mean properties further corroborated the outcome.
The levels of the mesoporosity, monodispersity, shape-controllability, and stability of the as-synthesised Fe3O4@C nanocomposite samples were established using FTIR, XRD, TGA/DTG, SEM/EDX, EFTEM and BET adsorption–desorption analyses. The as-synthesised nanocomposites largely retained the characteristic FTIR vibrations of the major absorption bands observed for Fe–O bond vibrations at the octahedral (436 cm−1) and tetrahedral (570 cm−1) cubic ferrite sites in the parent magnetite NPs with a shift in the latter band to 581 cm−1 and the shift in the OH vibrational assignments from 3396 to 3438–3449 cm−1. The Fe3O4@C-T190t5 nanocomposite (16.3 ± 5.3 nm) recorded the largest mean for crystallite size, followed by Fe3O4@C-T190t3 (12.8 ± 7.8 nm) and finally Fe3O4@C-T190t4 (10.5 ± 6.4 nm). The TGA/DTG analyses revealed the Fe3O4@C-T190t4 nanocomposite to have the highest thermal stability with the lowest weight loss (36.5%). In comparison, Fe3O4@C-T190t5 and Fe3O4@C-T190t3 were less stable to heat with the higher weight loss (59.8–60.1%) in agreement with the carbon content of the Fe3O4@C composites from EDX analysis.

Author Contributions

Conceptualisation, S.S. and R.A.; methodology, S.S., R.A., W.-D.O. and A.I.; validation, S.S., R.A., W.-D.O. and A.I.; formal analysis, S.S. and R.A.; investigation, S.S.; resources, S.S., R.A., W.-D.O. and A.I.; data curation, S.S. and R.A.; writing—original draft preparation, S.S.; writing—review and editing, R.A.; visualisation, S.S. and R.A.; supervision, R.A.; project administration, R.A.; funding acquisition, S.S. and R.A. All authors have read and agreed to the published version of the manuscript.

Funding

This research was funded by Nigerian Tertiary Education Trust Fund (TETFUND), award reference number TETF/ES/UNIV/DUTSIN-MA/ASTD/2018 and Universiti Sains Malaysia through the RUI grant no. 1001/PKIMIA/8011117.

Acknowledgments

R.A., W.O. and A.I. gratefully acknowledge support from Universiti Sains Malaysia. S.S. would like to acknowledge the Nigerian Tertiary Education Trust Fund (TETFUND) under the Academic Staff Training and Development (AST&D) Scheme for sponsorship.

Conflicts of Interest

The authors declare no conflict of interest. The funders had no role in the design of the study; in the collection, analyses, or interpretation of data; in the writing of the manuscript; or in the decision to publish the results.

References

  1. Asab, G.; Zereffa, E.A.; Seghne, T.A. Synthesis of silica-coated Fe3O4 nanoparticles by microemulsion method: Characterization and evaluation of antimicrobial activity. Int. J. Biomater. 2020, 2020, 11. [Google Scholar] [CrossRef] [Green Version]
  2. Abdel Maksoud, M.I.A.; Elgarahy, A.M.; Farrell, C.; Al-Muhtaseb, A.H.; Rooney, D.W.; Osman, A.I. Insight on water remediation application using magnetic nanomaterials and biosorbents. Coord. Chem. Rev. 2020, 403, 213096. [Google Scholar] [CrossRef]
  3. Qi, M.; Zhang, K.; Li, S.; Wu, J.; Pham-Huy, C.; Diao, X.; Xiao, D.; He, H. Superparamagnetic Fe3O4 nanoparticles: Synthesis by a solvothermal process and functionalization for a magnetic targeted curcumin delivery system. New J. Chem. 2016, 40, 4480–4491. [Google Scholar] [CrossRef]
  4. Yew, Y.P.; Shameli, K.; Miyake, M.; Ahmad Khairudin, N.B.B.; Mohamad, S.E.B.; Naiki, T.; Lee, K.X. Green biosynthesis of superparamagnetic magnetite Fe3O4 nanoparticles and biomedical applications in targeted anticancer drug delivery system: A review. Arab. J. Chem. 2020, 13, 2287–2308. [Google Scholar] [CrossRef]
  5. Qin, L.; Ru, R.; Mao, J.; Meng, Q.; Fan, Z.; Li, X.; Zhang, G. Assembly of MOFs/polymer hydrogel derived Fe3O4-CuO@hollow carbon spheres for photochemical oxidation: Freezing replacement for structural adjustment. Appl. Catal. B Environ. 2020, 269, 118754. [Google Scholar] [CrossRef]
  6. Xiong, L.L.; Huang, R.; Chai, H.H.; Yu, L.; Li, C.M. Facile synthesis of Fe3O4@Tannic Acid@Au nanocomposites as a catalyst for 4-nitrophenol and methylene blue removal. ACS Omega 2020, 5, 20903–20911. [Google Scholar] [CrossRef]
  7. Vinodhkumar, G.; Wilson, J.; Inbanathan, S.S.R.; Potheher, I.V.; Ashokkumar, M.; Peter, A.C. Solvothermal synthesis of magnetically separable reduced graphene oxide/Fe3O4 hybrid nanocomposites with enhanced photocatalytic properties. Phys. B Condens. Matter 2020, 580, 411752. [Google Scholar] [CrossRef]
  8. Ballarin, B.; Boanini, E.; Montalto, L.; Mengucci, P.; Nanni, D.; Parise, C.; Ragazzini, I.; Rinaldi, D.; Sangiorgi, N.; Sanson, A.; et al. PANI/Au/Fe3O4 nanocomposite materials for high performance energy storage. Electrochim. Acta 2019, 322, 134707. [Google Scholar] [CrossRef]
  9. Pawar, S.P.; Melo, G.; Sundararaj, U. Dual functionality of hierarchical hybrid networks of multiwall carbon nanotubes anchored magnetite particles in soft polymer nanocomposites: Simultaneous enhancement in charge storage and microwave absorption. Compos. Sci. Technol. 2019, 183, 107802. [Google Scholar] [CrossRef]
  10. Wang, L.; Lei, T.; Ren, Z.; Jiang, X.; Yang, X.; Bai, H.; Wang, S. Fe3O4@PDA@MnO2 core-shell nanocomposites for sensitive electrochemical detection of trace Pb(II) in water. J. Electroanal. Chem. 2020, 864, 114065. [Google Scholar] [CrossRef]
  11. Zhu, J.; Zhou, S.; Li, M.; Xue, A.; Zhao, Y.; Peng, W.; Xing, W. PVDF mixed matrix ultrafiltration membrane incorporated with deformed rebar-like Fe3O4–palygorskite nanocomposites to enhance strength and antifouling properties. J. Memb. Sci. 2020, 612, 118467. [Google Scholar] [CrossRef]
  12. Ebrahimi-Tazangi, F.; Hekmatara, S.H.; Seyed-Yazdi, J. Synthesis and remarkable microwave absorption properties of amine-functionalized magnetite/graphene oxide nanocomposites. J. Alloy. Compd. 2019, 809, 151779. [Google Scholar] [CrossRef]
  13. An, B.H.; Park, B.C.; Yassi, H.A.; Lee, J.S.; Park, J.R.; Kim, Y.K.; Ryu, J.E.; Choi, D.S. Fabrication of graphene-magnetite multi-granule nanocluster composites for microwave absorption application. J. Compos. Mater. 2019, 53, 4097–4103. [Google Scholar] [CrossRef]
  14. Ma, C.; Liu, F.Y.; Wei, M.B.; Zhao, J.H.; Zhang, H.Z. Synthesis of novel core-shell magnetic Fe3O4@C nanoparticles with carboxyl function for use as an immobilisation agent to remediate lead-contaminated soils. Polish J. Environ. Stud. 2020, 29, 2273–2283. [Google Scholar] [CrossRef]
  15. Suchanek, W.L.; Lencka, M.M.; Riman, R.E. Hydrothermal synthesis of ceramic materials. In Aqueous Systems at Elevated Temperatures and Pressures; Palmer, D.A., Prini, R.F., Harvey, A.H., Eds.; Elsevier Ltd.: Amsterdam, The Netherlands, 2004; pp. 716–744. [Google Scholar]
  16. Moradiganjeh, J.; Aghajani, Z. Synthesis and characterization of novel magnetic Fe3O4/C through the co-precipitation method and investigation of its desulfurization application. J. Mater. Sci. Mater. Electron. 2016, 27, 5948–5953. [Google Scholar] [CrossRef]
  17. Diodati, S.; Dolcet, P.; Casarin, M.; Gross, S. Pursuing the crystallization of mono- and polymetallic nanosized crystalline inorganic compounds by low-temperature wet-chemistry and colloidal routes. Chem. Rev. 2015, 115, 11449–11502. [Google Scholar] [CrossRef] [PubMed]
  18. Darr, J.A.; Zhang, J.; Makwana, N.M.; Weng, X. Continuous hydrothermal synthesis of inorganic nanoparticles: Applications and future directions. Chem. Rev. 2017, 117, 11125–11238. [Google Scholar] [CrossRef] [Green Version]
  19. Shi, W.; Song, S.; Zhang, H. Hydrothermal synthetic strategies of inorganic semiconducting nanostructures. Chem. Soc. Rev. 2013, 42, 5714–5743. [Google Scholar] [CrossRef]
  20. Zeng, H.; Qiao, T.; Zhai, L.; Zhang, J.; Li, D. Fe3O4@C particles synthesized with iron-containing water treatment residuals and its potential for methylene blue removal. J. Chem. Technol. Biotechnol. 2019, 94, 3970–3980. [Google Scholar] [CrossRef]
  21. Heidari, H.; Razmi, H. Multi-response optimization of magnetic solid phase extraction based on carbon coated Fe3O4 nanoparticles using desirability function approach for the determination of the organophosphorus pesticides in aquatic samples by HPLC-UV. Talanta 2012, 99, 13–21. [Google Scholar] [CrossRef]
  22. Meng, X.; Yang, W.; Han, G.; Yu, Y.; Ma, S.; Liu, W.; Zhang, Z. Three-dimensional foam-like Fe3O4@C core-shell nanocomposites: Controllable synthesis and wideband electromagnetic wave absorption properties. J. Magn. Magn. Mater. 2020, 502, 1–10. [Google Scholar] [CrossRef]
  23. Zhuang, Y.; Liu, J.; Yuan, S.; Ge, B.; Du, H.; Qu, C.; Chen, H.; Wu, C.; Li, W.; Zhang, Y. Degradation of octane using an efficient and stable core-shell Fe3O4@C during Fenton processes: Enhanced mass transfer, adsorption and catalysis. Appl. Surf. Sci. 2020, 515, 146083. [Google Scholar] [CrossRef]
  24. Khoshsang, H.; Ghaffarinejad, A.; Kazemi, H.; Jabarian, S. Synthesis of mesoporous Fe3O4 and Fe3O4/C nanocomposite for removal of hazardous dye from aqueous media. J. Water Environ. Nanotechnol. 2018, 3, 191–206. [Google Scholar] [CrossRef]
  25. Han, S.; Hu, L.; Liang, Z.; Wageh, S.; Al-Ghamdi, A.A.; Chen, Y.; Fang, X. One-step hydrothermal synthesis of 2D hexagonal nanoplates of α-Fe2O3/graphene composites with enhanced photocatalytic activity. Adv. Funct. Mater. 2014, 24, 5719–5727. [Google Scholar] [CrossRef]
  26. Cao, B.; Adutwum, L.A.; Oliynyk, A.O.; Luber, E.J.; Olsen, B.C.; Mar, A.; Buriak, J.M. How to optimize materials and devices via design of experiments and machine learning: Demonstration using organic photovoltaics. ACS Nano 2018, 12, 7434–7444. [Google Scholar] [CrossRef] [Green Version]
  27. Subramanian, V.; Zhu, H.; Vajtai, R.; Ajayan, P.M.; Wei, B. Hydrothermal synthesis and pseudocapacitance properties of MnO2 nanostructures. J. Phys. Chem. B 2005, 109, 20207–20214. [Google Scholar] [CrossRef] [PubMed]
  28. He, Q.; Liu, J.; Liang, J.; Liu, X.; Ding, Z.; Tuo, D.; Li, W. Sodium acetate orientated hollow/mesoporous magnetite nanoparticles: Facile synthesis, characterization and formation mechanism. Appl. Sci. 2018, 8, 292. [Google Scholar] [CrossRef] [Green Version]
  29. Li, S.K.; Huang, F.Z.; Wang, Y.; Shen, Y.H.; Qiu, L.G.; Xie, A.J.; Xu, S.J. Magnetic Fe3O4@C@Cu2O composites with bean-like core/shell nanostructures: Synthesis, properties and application in recyclable photocatalytic degradation of dye pollutants. J. Mater. Chem. 2011, 21, 7459–7466. [Google Scholar] [CrossRef]
  30. Karaoǧlu, E.; Baykal, A.; Erdemi, H.; Alpsoy, L.; Sozeri, H. Synthesis and characterization of dl-thioctic acid (DLTA)-Fe3O4 nanocomposite. J. Alloys Compd. 2011, 509, 9218–9225. [Google Scholar] [CrossRef]
  31. Unal, B.; Durmus, Z.; Kavas, H.; Baykal, A.; Toprak, M.S. Synthesis, conductivity and dielectric characterization of salicylic acid-Fe3O4 nanocomposite. Mater. Chem. Phys. 2010, 123, 184–190. [Google Scholar] [CrossRef]
  32. Unal, B.; Toprak, M.S.; Durmus, Z.; Sözeri, H.; Baykal, A. Synthesis, structural and conductivity characterization of alginic acid-Fe3O4 nanocomposite. J. Nanoparticle Res. 2010, 12, 3039–3048. [Google Scholar] [CrossRef]
  33. Samadaei, F.; Salami-Kalajahi, M.; Roghani-Mamaqani, H.; Banaei, M. A structural study on ethylenediamine- and poly(amidoamine)-functionalized graphene oxide: Simultaneous reduction, functionalization, and formation of 3D structure. RSC Adv. 2015, 5, 71835–71843. [Google Scholar] [CrossRef]
  34. Shen, L.; Li, B.; Qiao, Y.; Song, J. Monodisperse Fe3O4/SiO2 and Fe3O4/SiO2/PPy core-shell composite nanospheres for IBU loading and release. Materials 2019, 12, 828. [Google Scholar] [CrossRef] [PubMed] [Green Version]
  35. Ardelean, I.L.; Stoencea, L.B.N.; Ficai, D.; Ficai, A.; Trusca, R.; Vasile, B.S.; Nechifor, G.; Andronescu, E. Development of Stabilized Magnetite Nanoparticles for Medical Applications. J. Nanomater. 2017, 2017. [Google Scholar] [CrossRef] [Green Version]
  36. Zhang, D.; Shang, L.; Shen, J.; Shi, Z.; Wu, L.; Tung, C.; Zhang, T. A mild one-step solvothermal route to truncated octahedral magnetite crystals. Particuology 2014, 15, 51–55. [Google Scholar] [CrossRef]
  37. Xu, J.; Yang, H.; Fu, W.; Du, K.; Sui, Y.; Chen, J.; Zeng, Y.; Li, M.; Zou, G. Preparation and magnetic properties of magnetite nanoparticles by sol–gel method. J. Magn. Magn. Mater. 2007, 309, 307–311. [Google Scholar] [CrossRef]
  38. Saraswati, T.E.; Maharani, D.; Widiyandari, H. Copper oxide-based carbonaceous nanocomposites: Electrochemical synthesis and characterization. AIP Conf. Proc. 2020, 2243. [Google Scholar] [CrossRef]
  39. Itoh, M.; Liu, J.R.; Horikawa, T.; Machida, K.I. Electromagnetic wave absorption properties of nanocomposite powders derived from intermetallic compounds and amorphous carbon. J. Alloys Compd. 2006, 408–412, 1400–1403. [Google Scholar] [CrossRef]
  40. Shi, D.; Yang, H.; Ji, S.; Jiang, S.; Liu, X.; Zhang, D. Preparation and characterization of core-shell structure Fe3O4@C magnetic nanoparticles. Procedia Eng. 2015, 102, 1555–1562. [Google Scholar] [CrossRef] [Green Version]
  41. Yuan, S.M.; Li, J.X.; Yang, L.T.; Su, L.W.; Liu, L.; Zhou, Z. Preparation and lithium storage performances of mesoporous Fe3O4@C microcapsules. ACS Appl. Mater. Interfaces 2011, 3, 705–709. [Google Scholar] [CrossRef] [PubMed]
  42. Zhang, W.M.; Wu, X.L.; Hu, J.S.; Guo, Y.G.; Wan, L.J. Carbon coated Fe3O4 nanospindles as a superior anode material for lithium-ion batteries. Adv. Funct. Mater. 2008, 18, 3941–3946. [Google Scholar] [CrossRef]
  43. Xu, J.L.; Zhang, X.; Miao, Y.X.; Wen, M.X.; Yan, W.J.; Lu, P.; Wang, Z.R.; Sun, Q. In-situ plantation of Fe3O4@C nanoparticles on reduced graphene oxide nanosheet as high-performance anode for lithium/sodium-ion batteries. Appl. Surf. Sci. 2021, 546, 149163. [Google Scholar] [CrossRef]
  44. Liu, J.; Dong, S.; He, Q.; Yang, S.; Xie, M.; Deng, P.; Xia, Y.; Li, G. Facile preparation of Fe3O4/C nanocomposite and its application for cost-effective and sensitive detection of tryptophan. Biomolecules 2019, 9, 245. [Google Scholar] [CrossRef] [PubMed] [Green Version]
  45. Ong, B.H.; Devaraj, N.K.; Matsumoto, M.; Abdullah, M.H. Thermal stability of magnetite (Fe3O4) nanoparticles. Mater. Res. Soc. Symp. Proc. 2009, 1118, 1–7. [Google Scholar] [CrossRef]
  46. Fatima, H.; Lee, D.W.; Yun, H.J.; Kim, K.S. Shape-controlled synthesis of magnetic Fe3O4 nanoparticles with different iron precursors and capping agents. RSC Adv. 2018, 8, 22917–22923. [Google Scholar] [CrossRef] [Green Version]
  47. Arenas-Alatorre, J.; Tehuacanero, C.S.; Lukas, O.; Rodríguez-Gómez, A.; Hernández Reyes, R.; Tapia-del León, C.; Lara V., J. Synthesis and characterization of iron oxide nanoparticles grown via a non-conventional chemical method using an external magnetic field. Mater. Lett. 2019, 242, 13–16. [Google Scholar] [CrossRef]
  48. Aragón, F.H.; Coaquira, J.A.H.; Villegas-Lelovsky, L.; Da Silva, S.W.; Cesar, D.F.; Nagamine, L.C.C.M.; Cohen, R.; Menéndez-Proupin, E.; Morais, P.C. Evolution of the doping regimes in the Al-doped SnO2 nanoparticles prepared by a polymer precursor method. J. Phys. Condens. Matter 2015, 27. [Google Scholar] [CrossRef]
  49. Maboudi, S.A.; Shojaosadati, S.A.; Arpanaei, A. Synthesis and characterization of multilayered nanobiohybrid magnetic particles for biomedical applications. Mater. Des. 2017, 115, 317–324. [Google Scholar] [CrossRef]
  50. Biau, D.J. In brief: Standard deviation and standard error. Clin. Orthop. Relat. Res. 2011, 469, 2661–2664. [Google Scholar] [CrossRef] [PubMed] [Green Version]
  51. Mohan, D.; Sarswat, A.; Singh, V.K.; Alexandre-Franco, M.; Pittman, C.U. Development of magnetic activated carbon from almond shells for trinitrophenol removal from water. Chem. Eng. J. 2011, 172, 1111–1125. [Google Scholar] [CrossRef]
  52. Wang, W.; Liu, P.; Zhang, M.; Hu, J.; Xing, F. The pore structure of phosphoaluminate cement. Open J. Compos. Mater. 2012, 02, 104–112. [Google Scholar] [CrossRef] [Green Version]
  53. Kumari, M.; Pittman, C.U.; Mohan, D. Heavy metals [chromium (VI) and lead (II)] removal from water using mesoporous magnetite (Fe3O4) nanospheres. J. Colloid Interface Sci. 2015, 442, 120–132. [Google Scholar] [CrossRef] [PubMed]
  54. Zhu, J.; Nan, Z. Zn-Doped Fe3O4 nanosheet formation induced by EDA with high magnetization and an investigation of the formation mechanism. Am. Chem. Soc. 2017, 121. [Google Scholar] [CrossRef]
  55. Wohlleben, W.; Mielke, J.; Bianchin, A.; Ghanem, A.; Freiberger, H.; Rauscher, H.; Gemeinert, M.; Hodoroaba, V.D. Reliable nanomaterial classification of powders using the volume-specific surface area method. J. Nanoparticle Res. 2017, 19. [Google Scholar] [CrossRef] [Green Version]
  56. Imran, M.; Zouli, N.; Ahamad, T.; Alshehri, S.M.; Chandan, M.R.; Hussain, S.; Aziz, A.; Dar, M.A.; Khan, A. Carbon-coated Fe3O4 core-shell superparamagnetic nanoparticle-based ferrofluid for heat transfer applications. Nanoscale Adv. 2021, 3, 1962–1975. [Google Scholar] [CrossRef]
  57. Sousa, A.C.C.; Romo, A.I.B.; Almeida, R.R.; Silva, A.C.C.; Fechine, L.M.U.; Brito, D.H.A.; Freire, R.M.; Pinheiro, D.P.; Silva, L.M.R.; Pessoa, O.D.L.; et al. Starch-based magnetic nanocomposite for targeted delivery of hydrophilic bioactives as anticancer strategy. Carbohydr. Polym. 2021, 264. [Google Scholar] [CrossRef]
  58. Asmatulu, R.; Fakhari, A.; Wamocha, H.L.; Chu, H.Y.; Chen, Y.Y.; Eltabey, M.M.; Hamdeh, H.H.; Ho, J.C. Drug-carrying magnetic nanocomposite particles for potential drug delivery systems. J. Nanotechnol. 2009, 2009, 1–6. [Google Scholar] [CrossRef] [Green Version]
  59. Zhang, R.; Bao, S.; Tan, Q.; Li, B.; Wang, C.; Shan, L.; Wang, C.; Xu, B. Facile synthesis of a rod-like porous carbon framework confined magnetite nanoparticle composite for superior lithium-ion storage. J. Colloid Interface Sci. 2021, 600, 602–612. [Google Scholar] [CrossRef] [PubMed]
  60. Xu, J.; Liu, Z.; Li, Q.; Wang, Y.; Shah, T.; Ahmad, M.; Zhang, Q.; Zhang, B. Wrinkled Fe3O4@C magnetic composite microspheres: Regulation of magnetic content and their microwave absorbing performance. J. Colloid Interface Sci. 2021, 601, 397–410. [Google Scholar] [CrossRef]
  61. Zhang, M.; Ling, H.; Ding, S.; Xie, Y.; Cheng, T.; Zhao, L.; Wang, T.; Bian, H.; Lin, H.; Li, Z.; et al. Synthesis of CF@PANI hybrid nanocomposites decorated with Fe3O4 nanoparticles towards excellent lightweight microwave absorber. Carbon 2021, 174, 248–259. [Google Scholar] [CrossRef]
  62. Li, Z.; Lin, H.; Ding, S.; Ling, H.; Wang, T.; Miao, Z.; Zhang, M.; Meng, A.; Li, Q. Synthesis and enhanced electromagnetic wave absorption performances of Fe3O4@C decorated walnut shell-derived porous carbon. Carbon 2020, 167, 148–159. [Google Scholar] [CrossRef]
  63. Zhou, X.; Zhang, C.; Zhang, M.; Feng, A.; Qu, S.; Zhang, Y.; Liu, X.; Jia, Z.; Wu, G. Synthesis of Fe3O4/carbon foams composites with broadened bandwidth and excellent electromagnetic wave absorption performance. Compos. Part A Appl. Sci. Manuf. 2019, 127, 105627. [Google Scholar] [CrossRef]
  64. Wu, F.; Sun, B.; Chu, X.; Zhang, Q.; She, Z.; Song, S.; Zhou, N.-L.; Zhang, J.; Yi, X.; Wu, D.; et al. Hyaluronic acid-modified porous carbon-coated Fe3O4 nanoparticles for magnetic resonance imaging-guided photothermal/chemotherapy of tumors. Langmuir 2019, 35, 13135–13144. [Google Scholar] [CrossRef]
  65. Li, Q.; Tang, G.; Xiong, X.; Cao, Y.; Chen, L.; Xu, F.; Tan, H. Carbon coated magnetite nanoparticles with improved water-dispersion and peroxidase-like activity for colorimetric sensing of glucose. Sensors Actuators, B Chem. 2015, 215, 86–92. [Google Scholar] [CrossRef]
  66. Bao, X.; Qiang, Z.; Chang, J.H.; Ben, W.; Qu, J. Synthesis of carbon-coated magnetic nanocomposite (Fe3O4@C) and its application for sulfonamide antibiotics removal from water. J. Environ. Sci. 2014, 26, 962–969. [Google Scholar] [CrossRef]
  67. Wang, Y.; Ding, G.; Lin, K.; Liu, Y.; Deng, X.; Li, Q. Facile one-pot synthesis of ultrathin carbon layer encapsulated magnetite nanoparticle and graphene oxide nanocomposite for efficient removal of metal ions. Sep. Purif. Technol. 2021, 266. [Google Scholar] [CrossRef]
  68. Chishti, A.N.; Guo, F.; Aftab, A.; Ma, Z.; Liu, Y.; Chen, M.; Gautam, J.; Chen, C.; Ni, L.; Diao, G. Synthesis of silver doped Fe3O4/C nanoparticles and its catalytic activities for the degradation and reduction of methylene blue and 4-nitrophenol. Appl. Surf. Sci. 2021, 546, 149070. [Google Scholar] [CrossRef]
  69. Kakavandi, B.; Takdastan, A.; Jaafarzadeh, N.; Azizi, M.; Mirzaei, A.; Azari, A. Application of Fe3O4@C catalyzing heterogeneous UV-Fenton system for tetracycline removal with a focus on optimization optimisation by a response surface method. J. Photochem. Photobiol. A Chem. 2016, 314, 178–188. [Google Scholar] [CrossRef]
Figure 1. FTIR spectra for (a) Fe3O4 NPs; (b) Fe3O4@C-T190t3; (c) Fe3O4@C-T190t4; (d) Fe3O4@C-T190t5.
Nanomaterials 11 02742 g001
Figure 2. X-ray diffraction patterns of (a) Fe3O4 NPs; (b) Fe3O4@C-T190t3; (c) Fe3O4@C-T190t4; (d) Fe3O4@C-T190t5.
Nanomaterials 11 02742 g002
Figure 3. TGA/DTG curves for (a) Fe3O4@C-T190t3; (b) Fe3O4@C-T190t4; (c) Fe3O4@C-T190t5; (d) Fe3O4 NPs.
Nanomaterials 11 02742 g003aNanomaterials 11 02742 g003b
Figure 4. SEM images with different resolutions (30 k × , 120 k × ) and EDX elemental composition of Fe3O4@C-T190t3 (ac), Fe3O4@C-T190t4 (df), Fe3O4@C-T190t5 (gi), and Fe3O4 NPs (jl), respectively.
Nanomaterials 11 02742 g004
Figure 5. TEM images with different resolutions (12.5 k × , 100 k × ) and particle size distributions of Fe3O4@C-T190t3 (ac), Fe3O4@C-T190t4 (df), Fe3O4@C-T190t5 (gi), and Fe3O4 NPs (jl), respectively.
Nanomaterials 11 02742 g005aNanomaterials 11 02742 g005b
Figure 6. BET nitrogen adsorption–desorption hysteresis curves and linear isotherms (in the inset) of (a) Fe3O4@C-T190t3; (b) Fe3O4@C-T190t4; (c) Fe3O4@C-T190t5; (d) Fe3O4 NPs.
Nanomaterials 11 02742 g006aNanomaterials 11 02742 g006b
Figure 7. Effects of reaction time on the (a) surface area, (b) pore volume, (c) pore diameter and (d) crystallite or grain size of Fe3O4@C-T190t3, Fe3O4@C-T190t4 and Fe3O4@C-T190t5 nanocomposites obtained by hydrothermal synthesis.
Nanomaterials 11 02742 g007
Figure 8. Tukey and Fisher tests of differences in means at 95% confidence intervals for (a,b) surface area, (c,d) pore volume, and (e,f) pore diameter of Fe3O4@C nanocomposite samples obtained at various hydrothermal reaction times, respectively.
Nanomaterials 11 02742 g008
Table 1. Analysis of variance for the surface properties of the nanocomposites.
SourceDF 1SS 2MS 3F Valuep Value
Surface area
Reaction time, tr (h)2585.25292.62654.790.000
Error1264.095.341
Total14649.34
Total pore volume
Reaction time, tr (h)20.0123640.0061821117.550.000
Error90.0000500.000006
Total110.012414
Pore diameter
Reaction time, tr (h)294.1947.09310.420.005
Error940.684.520
Total11134.87
1 DF, degree of freedom; 2 SS, sum of squares; 3 MS, mean square.
Table 2. Model statistic summary for the surface properties of the nanocomposites throughout the hydrothermal reaction time profile.
StatisticSurface Property
Surface AreaTotal Pore VolumePore Diameter
S2.311070.0023522.12613
R290.13%99.60%69.83%
R2-adj88.48%99.51%63.13%
R2-pred84.58%99.29%46.37%
Table 3. Significance statistic for Fisher individual tests and Tukey simultaneous tests on surface properties of the Fe3O4@C nanocomposite samples.
DOL 1DOM 2DSE 3T ValueFisher TestTukey Test
ICL (%) 4p-adj 5SCL (%) 6p-adj 5
Pore diameter
4–34.791.503.1897.910.01188.660.027
5–3−1.871.50−1.24 0.246 0.460
5–4−6.651.50−4.42 0.002 0.004
Pore volume
4–30.056580.0016634.0297.910.00088.660.000
5–3−0.019000.00166−11.42 0.000 0.000
5–4−0.075580.00166−45.44 0.000 0.000
Surface area
4–39.881.466.7697.940.00088.440.000
5–3−5.181.46−3.54 0.004 0.010
5–4−15.061.46−10.30 0.000 0.000
1 DOL, difference of levels; 2 DOM, difference of means; 3 DSE, SE of difference; 4 ICL, individual confidence level; 5 p-adj, adjusted p value; 6 SCL, simultaneous confidence level.
Publisher’s Note: MDPI stays neutral with regard to jurisdictional claims in published maps and institutional affiliations.

