
Nonenzymatic Hydrogen Peroxide Detection Using Surface-Enhanced Raman Scattering of Gold–Silver Core–Shell-Assembled Silica Nanostructures

 , , and
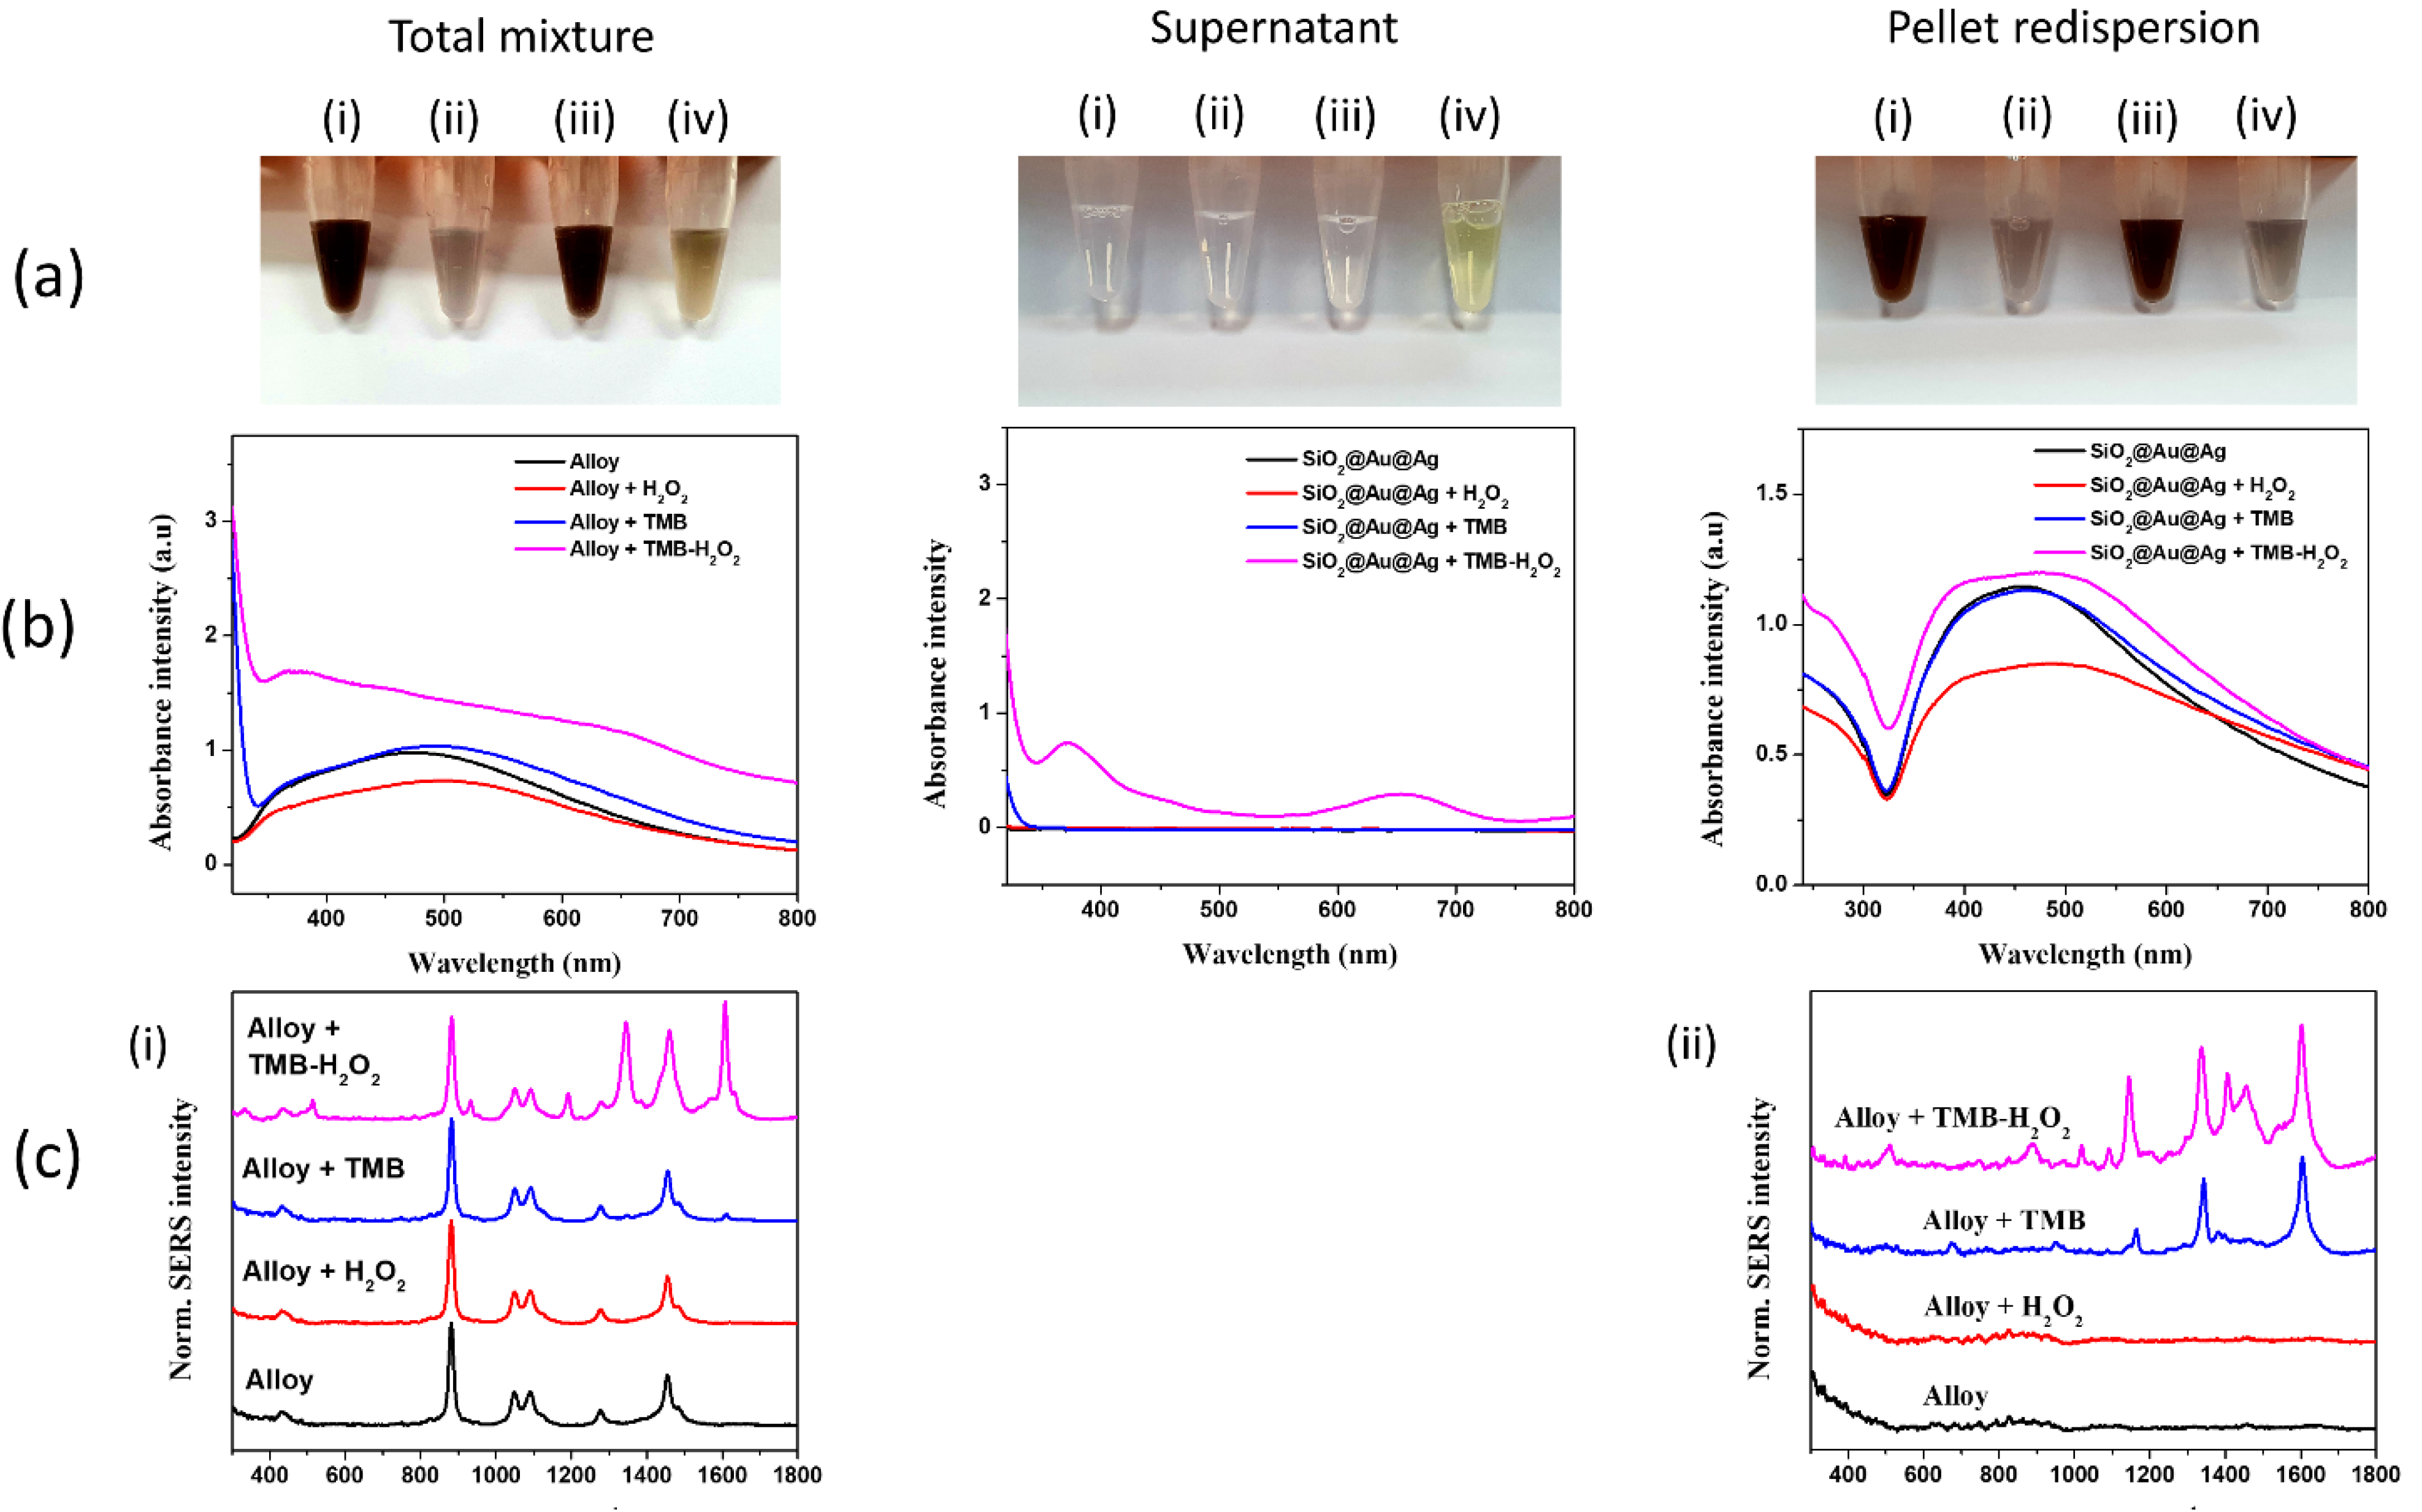
Abstract
:1. Introduction
2. Materials and Methods
2.1. Preparation of SiO2@Au@Ag Alloy NPs
2.2. Peroxidase-like Activity of SiO2@Au@Ag Alloy NPs in the TMB and H2O2 Mixture in Various Reaction Conditions
2.3. Optimal Peroxidase-like Activity of SiO2@Au@Ag in Various Reaction Conditions
2.3.1. TMB Concentration
2.3.2. Reaction Time
2.3.3. Amount of SiO2@Au@Ag Alloy NPs
2.3.4. pH Buffer
2.3.5. Concentration of SiO2@Au@Ag Alloy NPs for Raman Measurement
2.3.6. Detection of H2O2 using SiO2@Au@Ag Alloy NPs
2.3.7. Long-Term Stability of SiO2@Au@Ag Alloy NPs
2.4. SERS Measurement
3. Results and Discussion
3.1. Peroxidase-Mimicking Nanozyme Activity of SiO2@Au@Ag Alloy NPs in the TMB–H2O2 Mixture
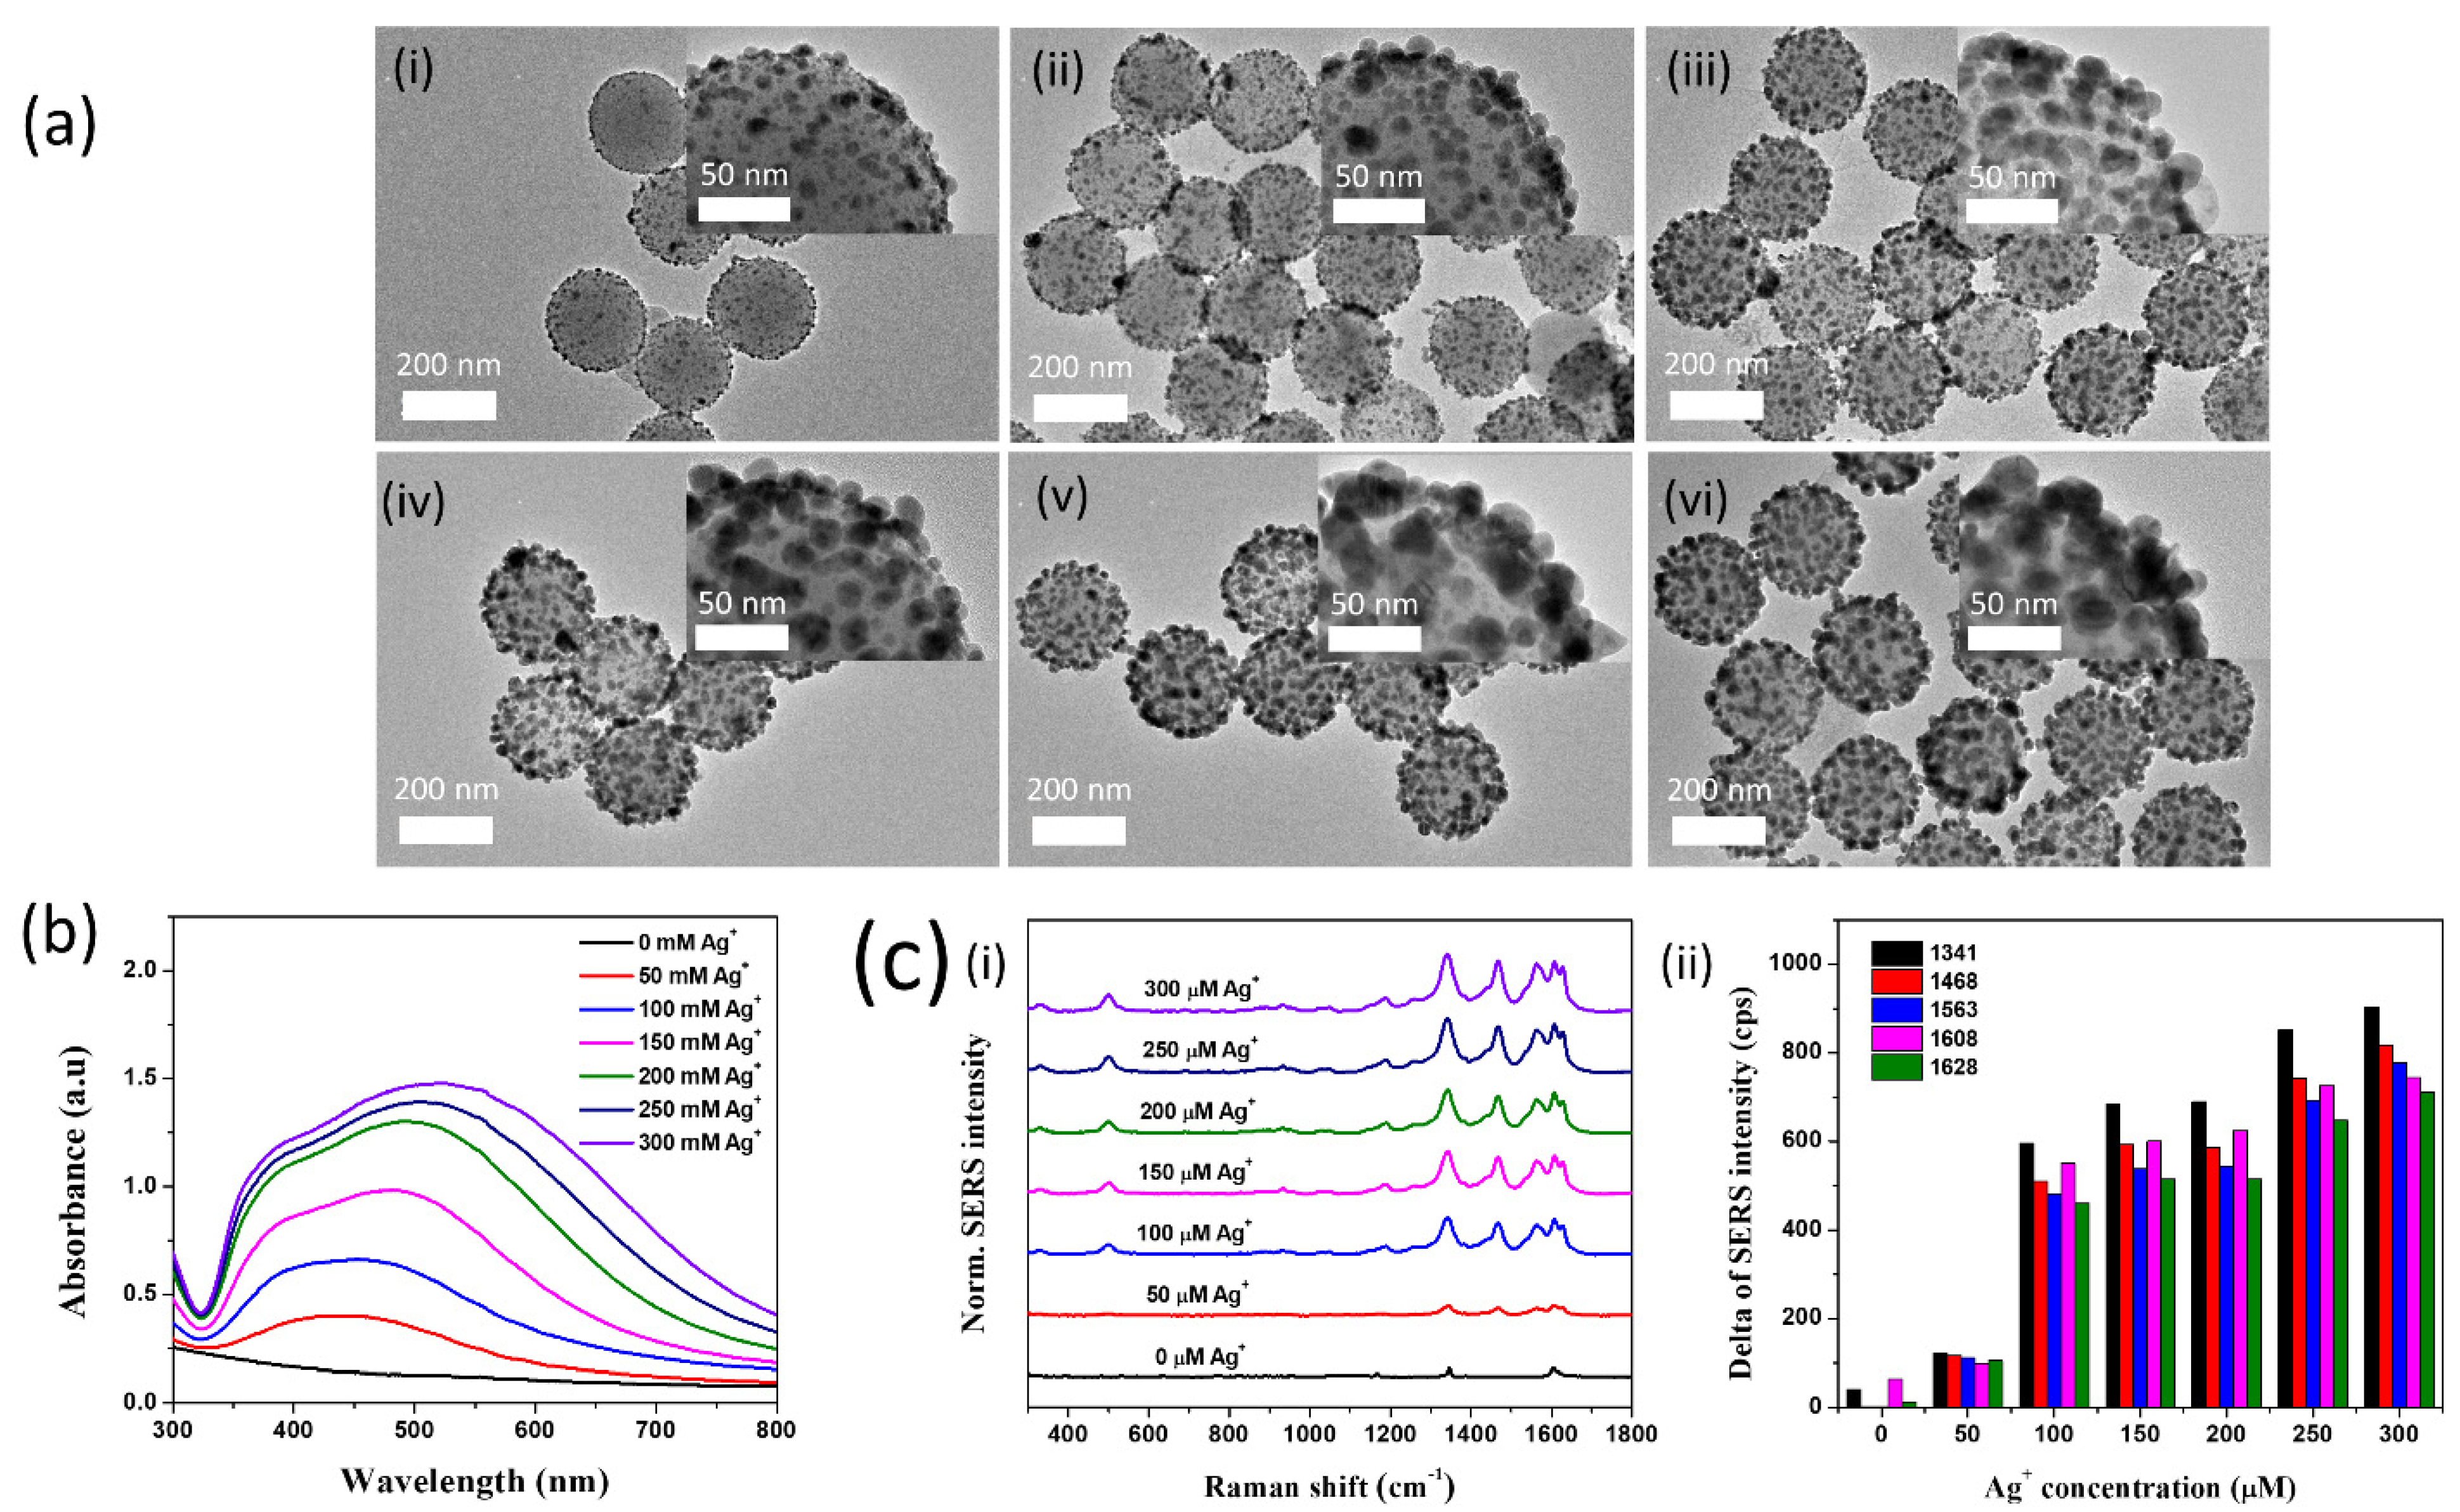
3.2. Effect of Ag+ Concentration on the Detection of H2O2 by SiO2@Au@Ag Alloy NPs
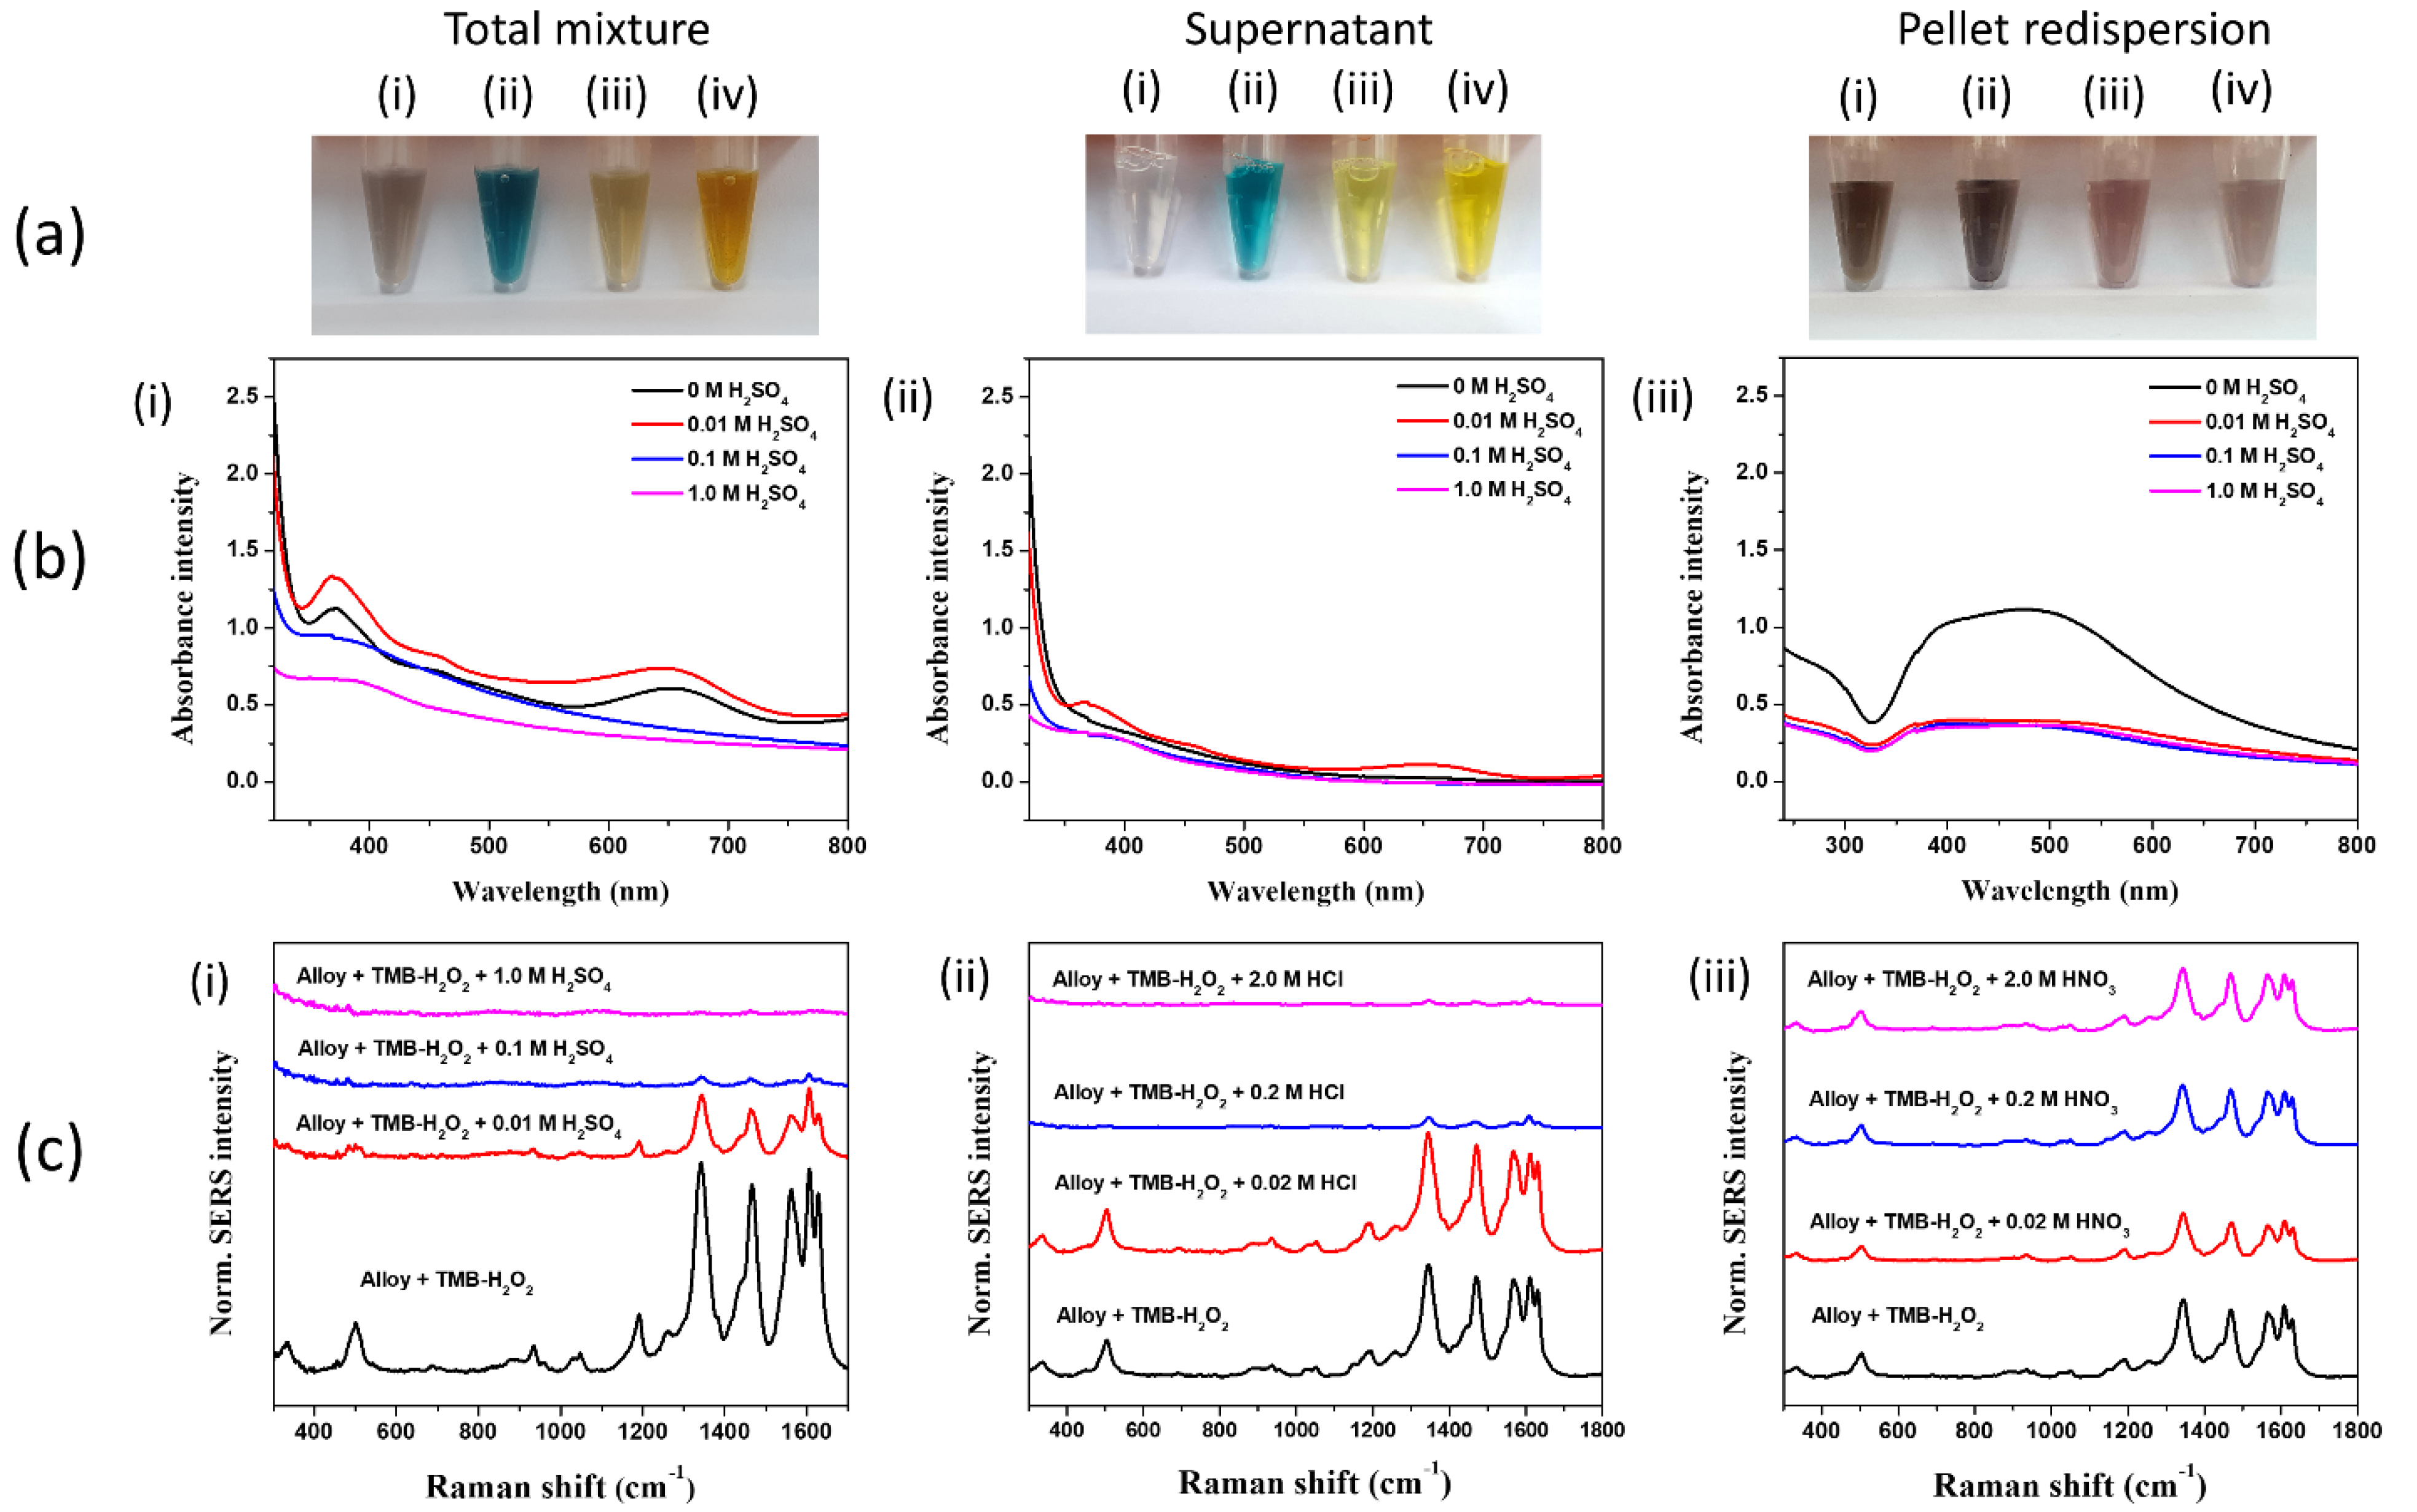
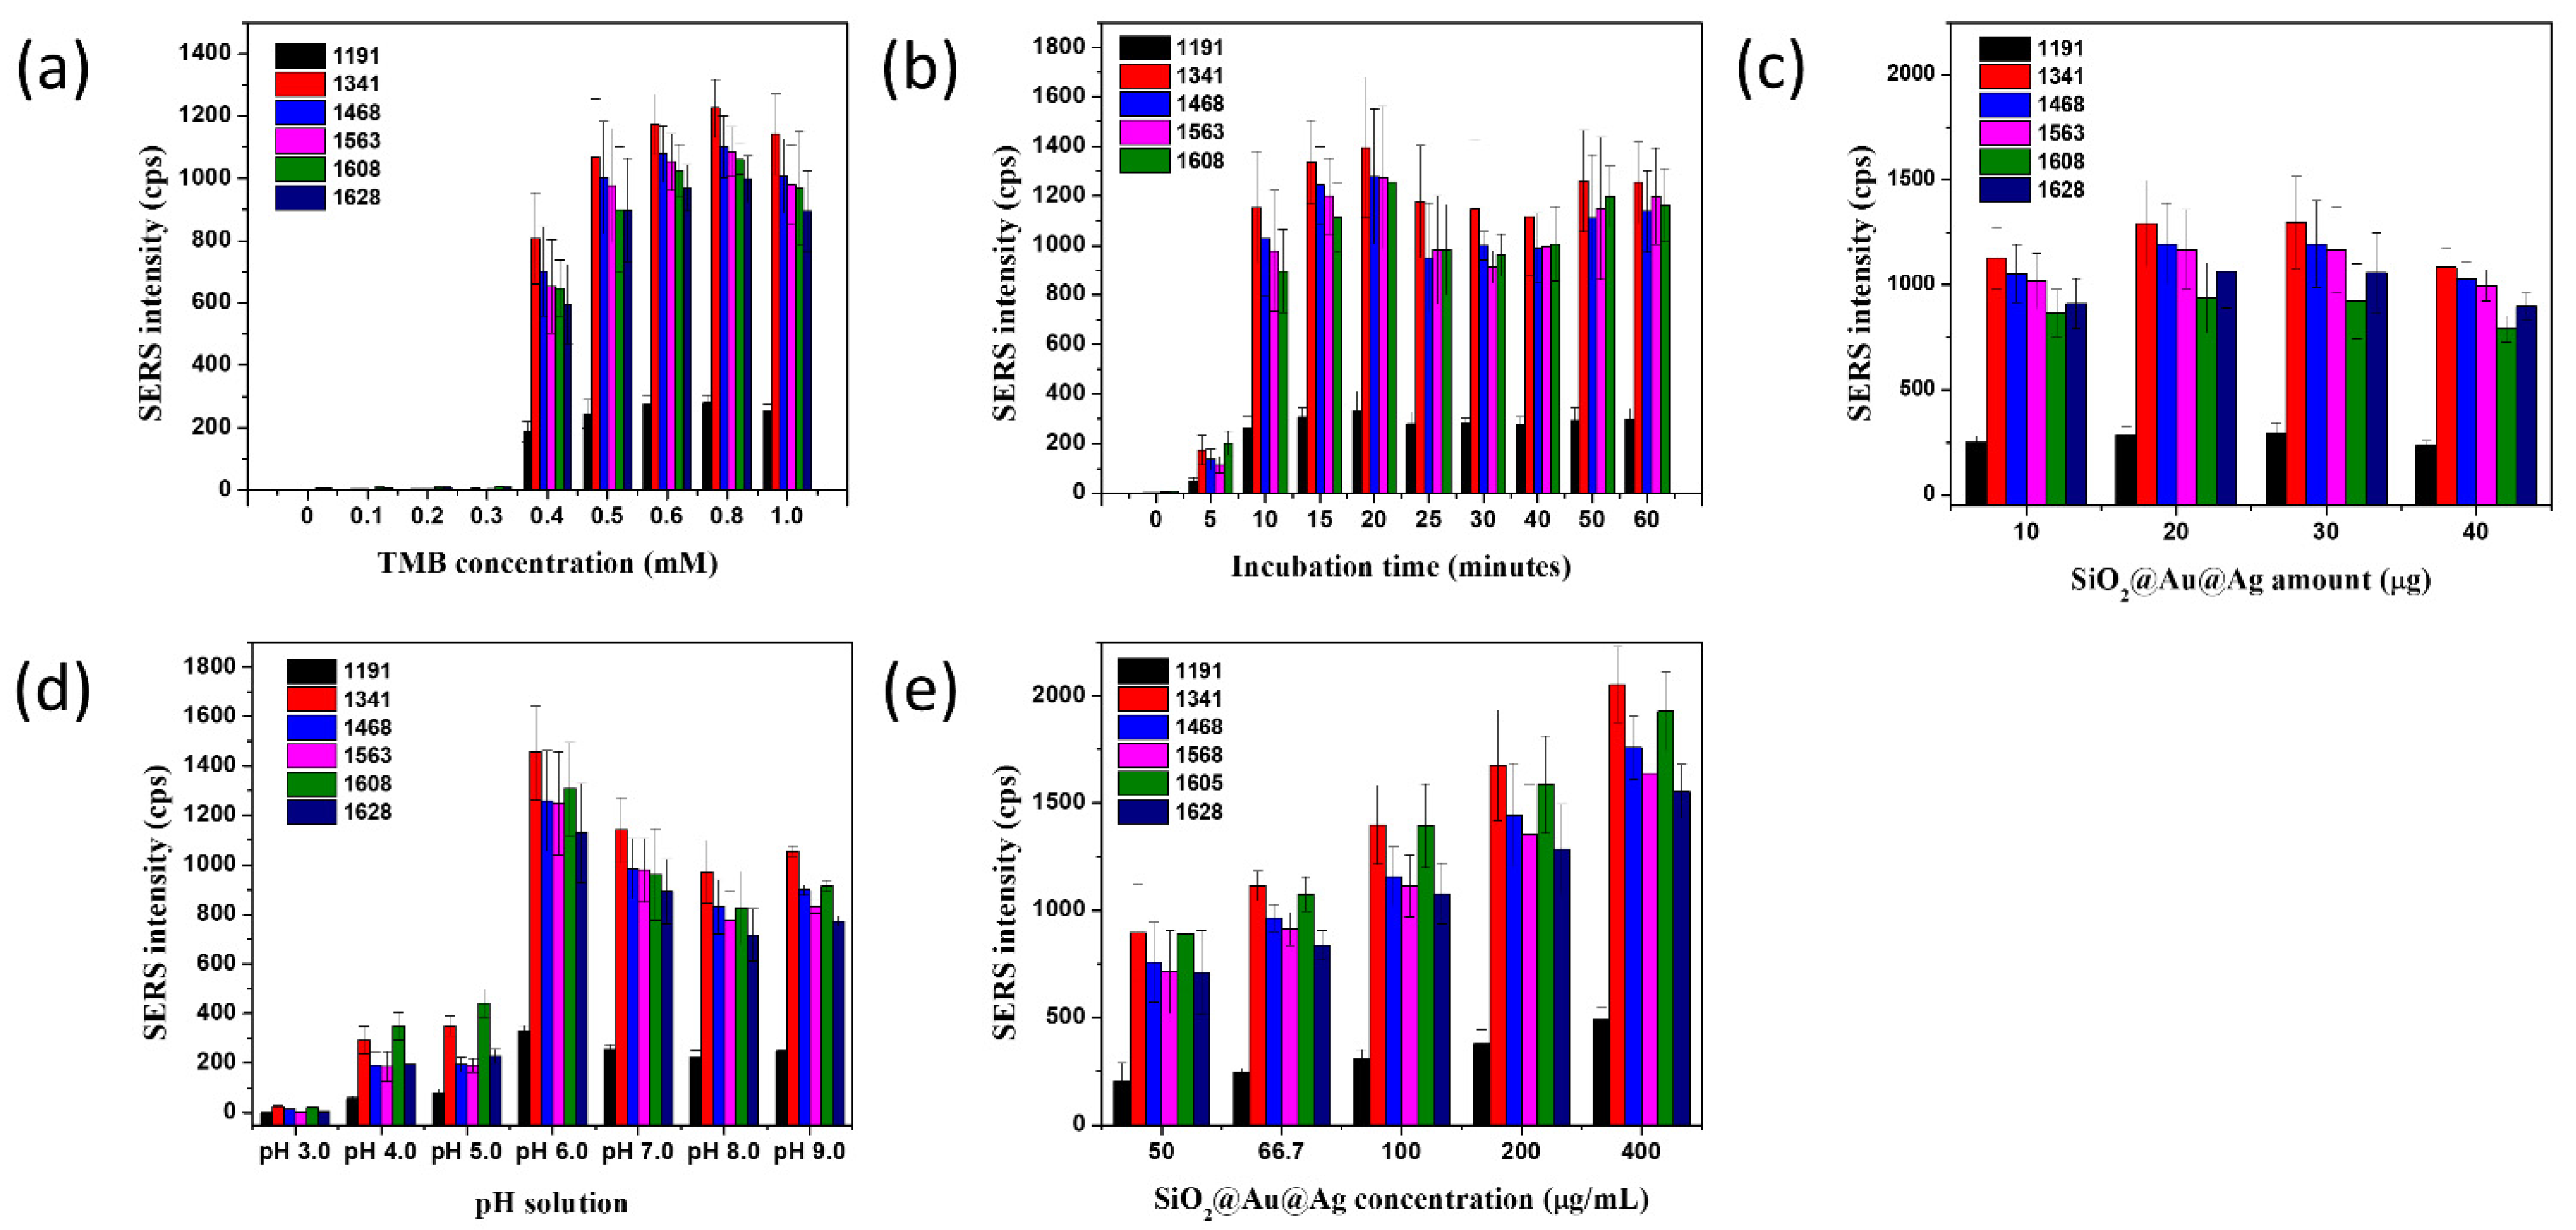
3.3. Optimization of SiO2@Au@Ag Alloy NPs for Detecting H2O2
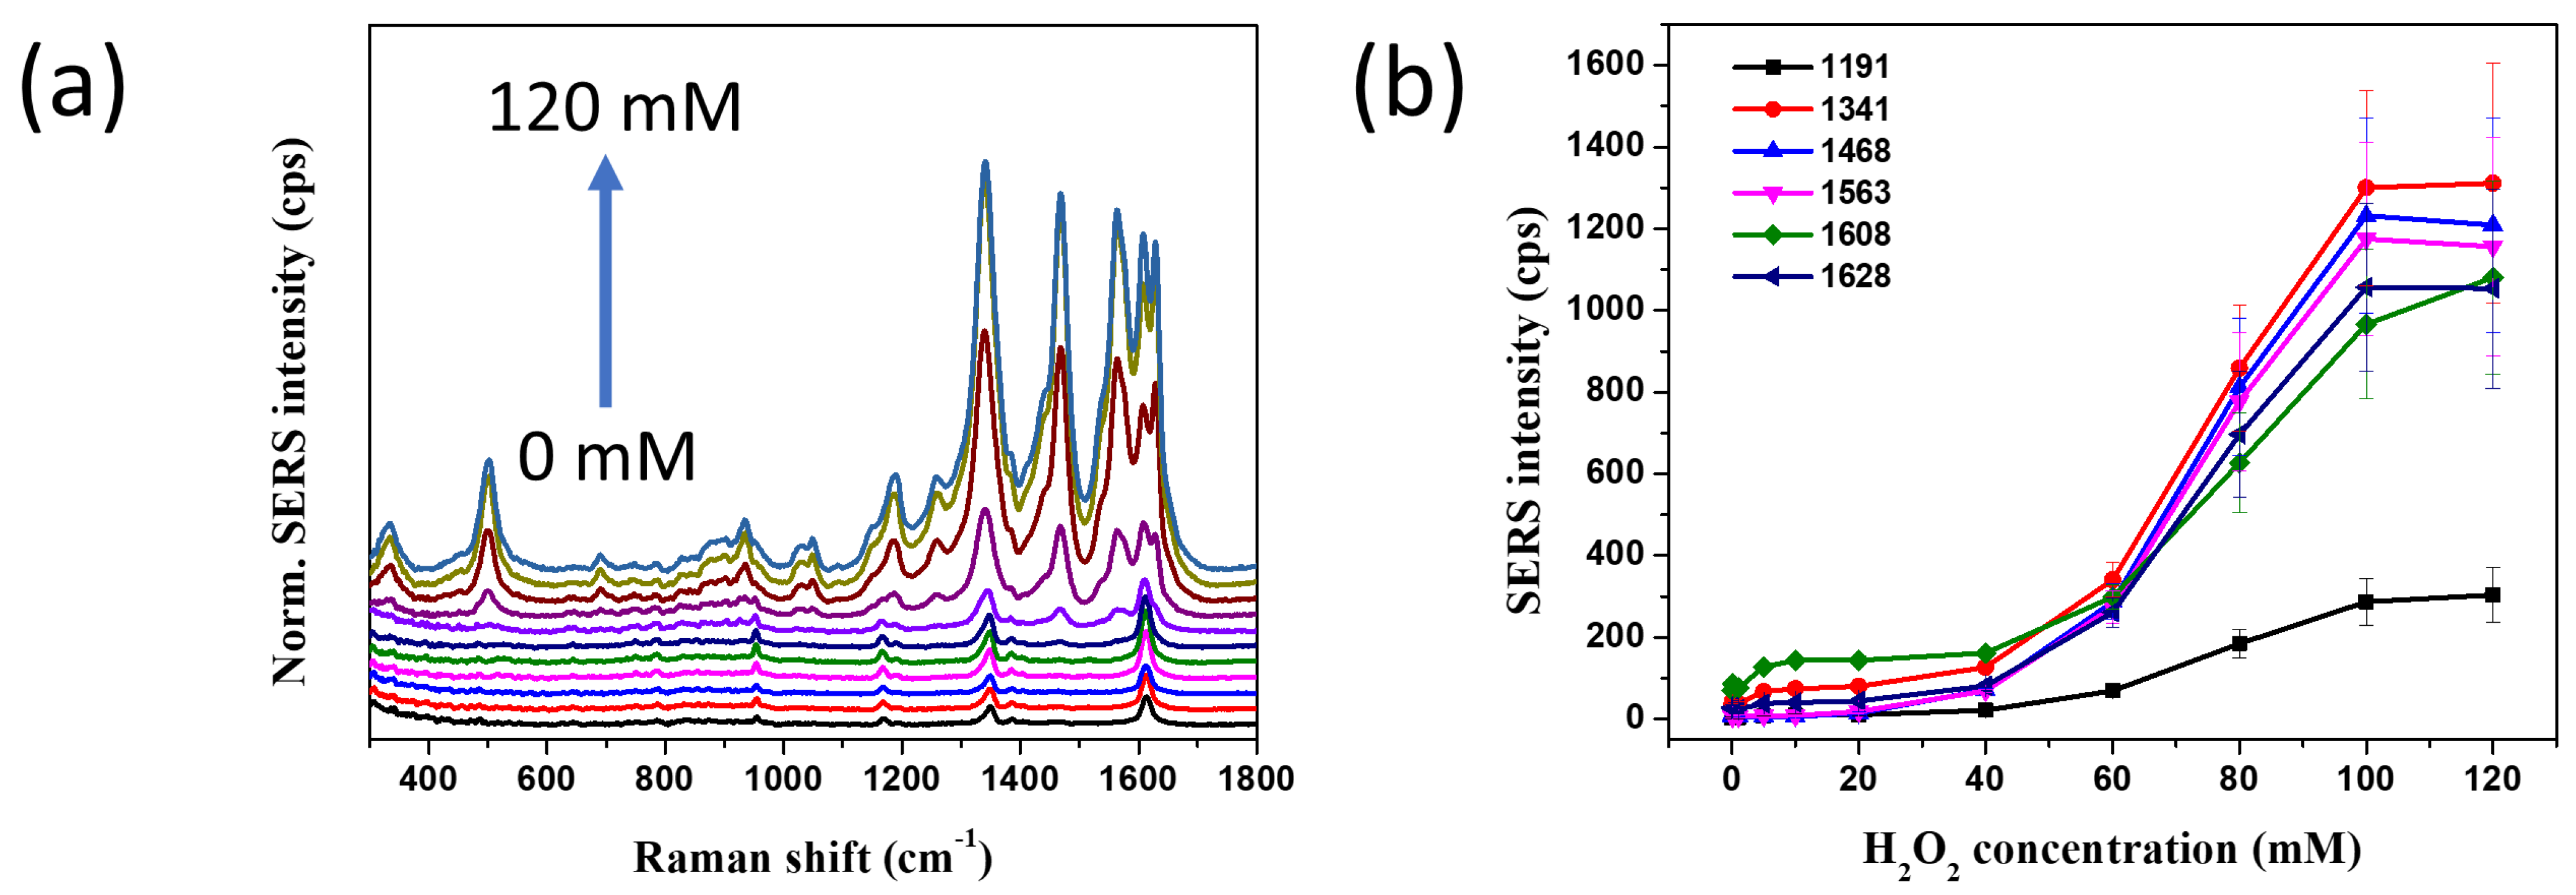
3.4. Calibration Curve for Detecting H2O2
4. Conclusions
Supplementary Materials
Author Contributions
Funding
Data Availability Statement
Acknowledgments
Conflicts of Interest
References
- Gao, L.; Zhuang, J.; Nie, L.; Zhang, J.; Zhang, Y.; Gu, N.; Wang, T.; Feng, J.; Yang, D.; Perrett, S.; et al. Intrinsic peroxidase-like activity of ferromagnetic nanoparticles. Nat. Nanotechnol. 2007, 2, 577–583. [Google Scholar] [CrossRef] [PubMed]
- Chen, Q.; Rao, Y.; Ma, X.; Dong, J.; Qian, W. Raman spectroscopy for hydrogen peroxide scavenging activity assay using gold nanoshell precursor nanocomposites as SERS probes. Anal. Methods 2011, 3, 274–279. [Google Scholar] [CrossRef]
- Jv, Y.; Li, B.; Cao, R. Positively-charged gold nanoparticles as peroxidiase mimic and their application in hydrogen peroxide and glucose detection. Chem. Commun. 2010, 46, 8017–8019. [Google Scholar] [CrossRef]
- Huang, Z.; Liu, B.; Liu, J. Enhancing the peroxidase-like activity and stability of gold nanoparticles by coating a partial iron phosphate shell. Nanoscale 2020, 12, 22467–22472. [Google Scholar] [CrossRef]
- Zhuang, Z.; Du, C.; Li, P.; Zhang, Z.; Fang, Z.; Guo, J.; Chen, W. Pt21(C4O4SH5)21 clusters: Atomically precise synthesis and enhanced electrocatalytic activity for hydrogen generation. Electrochim. Acta 2021, 368, 137608. [Google Scholar] [CrossRef]
- Deng, M.; Xu, S.; Chen, F. Enhanced chemiluminescence of the luminol-hydrogen peroxide system by BSA-stabilized Au nanoclusters as a peroxidase mimic and its application. Anal. Methods 2014, 6, 3117–3123. [Google Scholar] [CrossRef]
- Nugraha, M.; Pupon, S.; Setyasmara, N. A Study of Palladium-Nickel Catalyst for Direct Synthesis of Hydrogen Peroxide: A DFT Approach. J. Phys. Sci. Eng. 2020, 5, 10. [Google Scholar] [CrossRef]
- Chang, X.; Batchelor-McAuley, C.; Compton, R.G. Hydrogen peroxide reduction on single platinum nanoparticles. Chem. Sci. 2020, 11, 4416–4421. [Google Scholar] [CrossRef] [Green Version]
- Hu, Y.; Hojamberdiev, M.; Geng, D. Recent advances in enzyme-free electrochemical hydrogen peroxide sensors based on carbon hybrid nanocomposites. J. Mater. Chem. C 2021, 9, 6970–6990. [Google Scholar] [CrossRef]
- Zhao, J.; Yang, H.; Wu, W.; Shui, Z.; Dong, J.; Wen, L.; Wang, X.; Yang, M.; Hou, C.; Huo, D. Flexible nickel–cobalt double hydroxides micro-nano arrays for cellular secreted hydrogen peroxide in-situ electrochemical detection. Anal. Chim. Acta 2021, 1143, 135–143. [Google Scholar] [CrossRef]
- Ma, X.; Tang, K.-l.; Yang, M.; Shi, W.; Zhao, W. A controllable synthesis of hollow pumpkin-like CuO/Cu2O composites for ultrasensitive non-enzymatic glucose and hydrogen peroxide biosensors. New J. Chem. 2020, 44, 20411–20418. [Google Scholar] [CrossRef]
- Liu, Y.L.; Zhao, X.J.; Yang, X.X.; Li, Y.F. A nanosized metal–organic framework of Fe-MIL-88NH2 as a novel peroxidase mimic used for colorimetric detection of glucose. Analyst 2013, 138, 4526–4531. [Google Scholar] [CrossRef] [PubMed]
- Hou, C.; Wang, Y.; Ding, Q.; Jiang, L.; Li, M.; Zhu, W.; Pan, D.; Zhu, H.; Liu, M. Facile synthesis of enzyme-embedded magnetic metal–organic frameworks as a reusable mimic multi-enzyme system: Mimetic peroxidase properties and colorimetric sensor. Nanoscale 2015, 7, 18770–18779. [Google Scholar] [CrossRef] [Green Version]
- Chen, S.; Zhao, P.; Jiang, L.; Zhou, S.; Zheng, J.; Luo, X.; Huo, D.; Hou, C. Cu2O-mediated assembly of electrodeposition of Au nanoparticles onto 2D metal-organic framework nanosheets for real-time monitoring of hydrogen peroxide released from living cells. Anal. Bioanal. Chem. 2021, 413, 613–624. [Google Scholar] [CrossRef] [PubMed]
- Li, B.; Liu, L.-H.; Zhang, X.-F.; Gao, Y.; Deng, Z.-P.; Huo, L.-H.; Gao, S. Novel neuron-network-like Cu–MoO2/C composite derived from bimetallic organic framework for highly efficient detection of hydrogen peroxide. Anal. Chim. Acta 2021, 1143, 73–83. [Google Scholar] [CrossRef] [PubMed]
- Ding, Q.; Wang, J.; Chen, X.; Liu, H.; Li, Q.; Wang, Y.; Yang, S. Quantitative and Sensitive SERS Platform with Analyte Enrichment and Filtration Function. Nano Lett. 2020, 20, 7304–7312. [Google Scholar] [CrossRef] [PubMed]
- Maduraiveeran, G.; Jin, W. Carbon nanomaterials: Synthesis, properties and applications in electrochemical sensors and energy conversion systems. Mater. Sci. Eng. B Solid-State Mater. Adv. Technol. 2021, 272, 115341. [Google Scholar] [CrossRef]
- Speranza, G. Carbon Nanomaterials: Synthesis, Functionalization and Sensing Applications. Nanomaterials 2021, 11, 967. [Google Scholar] [CrossRef]
- Simsek, M.; Wongkaew, N. Carbon nanomaterial hybrids via laser writing for high-performance non-enzymatic electrochemical sensors: A critical review. Anal. Bioanal. Chem. 2021, 413, 6079–6099. [Google Scholar] [CrossRef]
- Tao, Y.; Lin, Y.; Huang, Z.; Ren, J.; Qu, X. Incorporating Graphene Oxide and Gold Nanoclusters: A Synergistic Catalyst with Surprisingly High Peroxidase-Like Activity Over a Broad pH Range and its Application for Cancer Cell Detection. Adv. Mater. 2013, 25, 2594–2599. [Google Scholar] [CrossRef]
- Long, Y.J.; Li, Y.F.; Liu, Y.; Zheng, J.J.; Tang, J.; Huang, C.Z. Visual observation of the mercury-stimulated peroxidase mimetic activity of gold nanoparticles. Chem. Commun. 2011, 47, 11939–11941. [Google Scholar] [CrossRef]
- Biswas, A.; Eilers, H.; Hidden, F.; Aktas, O.C.; Kiran, C.V.S. Large broadband visible to infrared plasmonic absorption from Ag nanoparticles with a fractal structure embedded in a Teflon AF® matrix. Appl. Phys. Letts. 2006, 88, 013103. [Google Scholar] [CrossRef]
- Trujillo, R.M.; Barraza, D.E.; Zamora, M.L.; Cattani-Scholz, A.; Madrid, R.E. Nanostructures in Hydrogen Peroxide Sensing. Sensors 2021, 21, 2204. [Google Scholar] [CrossRef] [PubMed]
- Tian, J.; Liu, S.; Luo, Y.; Sun, X. Fe(iii)-based coordination polymer nanoparticles: Peroxidase-like catalytic activity and their application to hydrogen peroxide and glucose detection. Catal. Sci. Technol. 2012, 2, 432–436. [Google Scholar] [CrossRef]
- Shim, S.; Pham, X.-H.; Cha, M.G.; Lee, Y.-S.; Jeong, D.H.; Jun, B.-H. Size effect of gold on Ag-coated Au nanoparticle-embedded silica nanospheres. RSC Adv. 2016, 6, 48644–48650. [Google Scholar] [CrossRef]
- Bong-Hyun, J.; Gunsung, K.; Sinyoung, J.; Suk, N.M.; Xuan-Hung, P.; Homan, K.; Myung-Haing, C.; Jong-Ho, K.; Yoon-Sik, L.; Hong, J.D. Silica Core-based Surface-enhanced Raman Scattering (SERS) Tag: Advances in Multifunctional SERS Nanoprobes for Bioimaging and Targeting of Biomarkers#. Bull. Korean Chem. Soc. 2015, 36, 963–978. [Google Scholar] [CrossRef]
- Pham, X.-H.; Lee, M.; Shim, S.; Jeong, S.; Kim, H.-M.; Hahm, E.; Lee, S.H.; Lee, Y.-S.; Jeong, D.H.; Jun, B.-H. Highly sensitive and reliable SERS probes based on nanogap control of a Au–Ag alloy on silica nanoparticles. RSC Adv. 2017, 7, 7015–7021. [Google Scholar] [CrossRef] [Green Version]
- Chou Chau, Y.-F.; Chou Chao, C.-T.; Chiang, H.-P. Ultra-broad bandgap metal-insulator-metal waveguide filter with symmetrical stubs and defects. Results Phys. 2020, 17, 103116. [Google Scholar] [CrossRef]
- Chou Chau, Y.-F.; Chou Chao, C.-T.; Huang, H.J.; Anwar, U.; Lim, C.M.; Voo, N.Y.; Mahadi, A.H.; Kumara, N.T.R.N.; Chiang, H.-P. Plasmonic perfect absorber based on metal nanorod arrays connected with veins. Results Phys. 2019, 15, 102567. [Google Scholar] [CrossRef]
- Chou Chau, Y.-F.; Chou Chao, C.-T.; Huang, H.J.; Kooh, M.R.R.; Kumara, N.T.R.N.; Lim, C.M.; Chiang, H.-P. Ultrawide Bandgap and High Sensitivity of a Plasmonic Metal-Insulator-Metal Waveguide Filter with Cavity and Baffles. Nanomaterials 2020, 10, 2030. [Google Scholar] [CrossRef]
- Chou Chau, Y.-F.; Chou Chao, C.-T.; Rao, J.-Y.; Chiang, H.-P.; Lim, C.M.; Lim, R.C.; Voo, N.Y. Tunable Optical Performances on a Periodic Array of Plasmonic Bowtie Nanoantennas with Hollow Cavities. Nanoscale Res. Lett. 2016, 11, 411. [Google Scholar] [CrossRef] [Green Version]
- Chou Chau, Y.-F.; Chou Chao, C.-T.; Huang, H.J.; Kooh, M.R.R.; Kumara, N.T.R.N.; Lim, C.M.; Chiang, H.-P. Perfect Dual-Band Absorber Based on Plasmonic Effect with the Cross-Hair/Nanorod Combination. Nanomaterials 2020, 10, 493. [Google Scholar] [CrossRef] [Green Version]
- Chou Chao, C.-T.; Chou Chau, Y.-F.; Huang, H.J.; Kumara, N.T.R.N.; Kooh, M.R.R.; Lim, C.M.; Chiang, H.-P. Highly Sensitive and Tunable Plasmonic Sensor Based on a Nanoring Resonator with Silver Nanorods. Nanomaterials 2020, 10, 1399. [Google Scholar] [CrossRef]
- Pham, X.-H.; Hahm, E.; Kang, E.; Ha, Y.N.; Lee, S.H.; Rho, W.-Y.; Lee, Y.-S.; Jeong, D.H.; Jun, B.-H. Gold-silver bimetallic nanoparticles with a Raman labeling chemical assembled on silica nanoparticles as an internal-standard-containing nanoprobe. J. Alloy. Compd. 2019, 779, 360–366. [Google Scholar] [CrossRef]
- Pham, X.-H.; Hahm, E.; Kang, E.; Son, B.S.; Ha, Y.; Kim, H.-M.; Jeong, D.H.; Jun, B.-H. Control of Silver Coating on Raman Label Incorporated Gold Nanoparticles Assembled Silica Nanoparticles. Int. J. Mol. Sci. 2019, 20, 1258. [Google Scholar] [CrossRef] [PubMed] [Green Version]
- Pham, X.-H.; Hahm, E.; Huynh, K.-H.; Son, B.S.; Kim, H.-M.; Jeong, D.H.; Jun, B.-H. 4-Mercaptobenzoic Acid Labeled Gold-Silver-Alloy-Embedded Silica Nanoparticles as an Internal Standard Containing Nanostructures for Sensitive Quantitative Thiram Detection. Int. J. Mol. Sci. 2019, 20, 4841. [Google Scholar] [CrossRef] [PubMed] [Green Version]
- Pham, X.-H.; Seong, B.; Hahm, E.; Huynh, K.-H.; Kim, Y.-H.; Kim, J.; Lee, S.H.; Jun, B.-H. Glucose Detection of 4-Mercaptophenylboronic Acid-Immobilized Gold-Silver Core-Shell Assembled Silica Nanostructure by Surface Enhanced Raman Scattering. Nanomaterials 2021, 11, 948. [Google Scholar] [CrossRef] [PubMed]
- Pham, X.-H.; Hahm, E.; Kim, T.H.; Kim, H.-M.; Lee, S.H.; Lee, S.C.; Kang, H.; Lee, H.-Y.; Jeong, D.H.; Choi, H.S.; et al. Enzyme-amplified SERS immunoassay with Ag-Au bimetallic SERS hot spots. Nano Res. 2020, 13, 3338–3346. [Google Scholar] [CrossRef]
- Pham, X.-H.; Hahm, E.; Kim, T.H.; Kim, H.-M.; Lee, S.H.; Lee, Y.-S.; Jeong, D.H.; Jun, B.-H. Enzyme-catalyzed Ag Growth on Au Nanoparticle-assembled Structure for Highly Sensitive Colorimetric Immunoassay. Sci. Rep. 2018, 8, 6290. [Google Scholar] [CrossRef] [Green Version]
- Yang, H.; Wang, J.; Li, X.; Zhang, L.; Yu, H.; Zhang, L.; Ge, S.; Yu, J.; Zhang, Y. Self-Circulation Oxygen–Hydrogen Peroxide–Oxygen System for Ultrasensitive Cathode Photoelectrochemical Bioassay Using a Stacked Sealed Paper Device. ACS Appl. Mater. Interfaces 2021, 13, 19793–19802. [Google Scholar] [CrossRef]
- Liu, H.; Weng, L.; Yang, C. A review on nanomaterial-based electrochemical sensors for H2O2, H2S and NO inside cells or released by cells. Microchim. Acta 2017, 184, 1267–1283. [Google Scholar] [CrossRef]
- Elias, H.; Vayssié, S. Reactive Peroxo Compounds Generated in Situ from Hydrogen Peroxide: Kinetics and Catalytic Application in Oxidation Processes. In Peroxide Chemistry; Wiley: Hoboken, NJ, USA, 2000; pp. 128–138. [Google Scholar] [CrossRef]
- Yang, H.; Hu, M.; Li, Z.; Zhao, P.; Xie, L.; Song, X.; Yu, J. Donor/Acceptor-Induced Ratiometric Photoelectrochemical Paper Analytical Device with a Hollow Double-Hydrophilic-Walls Channel for microRNA Quantification. Anal. Chem. 2019, 91, 14577–14585. [Google Scholar] [CrossRef]
- Wu, Q.; Zhang, C.; Li, F. Preparation of spindle-shape silver core-shell particles. Mater. Lett. 2005, 59, 3672–3677. [Google Scholar] [CrossRef]
- Jackson, J.B.; Halas, N.J. Silver Nanoshells: Variations in Morphologies and Optical Properties. J. Phys. Chem. B 2001, 105, 2743–2746. [Google Scholar] [CrossRef]
- Duanghathaipornsuk, S.; Farrell, E.J.; Alba-Rubio, A.C.; Zelenay, P.; Kim, D.-S. Detection Technologies for Reactive Oxygen Species: Fluorescence and Electrochemical Methods and Their Applications. Biosensors 2021, 11, 30. [Google Scholar] [CrossRef]
- Jiang, Z.-J.; Liu, C.-Y. Seed-Mediated Growth Technique for the Preparation of a Silver Nanoshell on a Silica Sphere. J. Phys. Chem. B 2003, 107, 12411–12415. [Google Scholar] [CrossRef]
- Ghosal, K.; Sarkar, K. Biomedical Applications of Graphene Nanomaterials and Beyond. ACS Biomater. Sci. Eng. 2018, 4, 2653–2703. [Google Scholar] [CrossRef]
- Jiang, X.; Wang, H.; Yuan, R.; Chai, Y. Functional Three-Dimensional Porous Conductive Polymer Hydrogels for Sensitive Electrochemiluminescence in Situ Detection of H2O2 Released from Live Cells. Anal. Chem. 2018, 90, 8462–8469. [Google Scholar] [CrossRef] [PubMed]
- Genov, D.A.; Sarychev, A.K.; Shalaev, V.M. Metal-dielectric Composite Filters With Controlled Spectral Windows of Transparency. J. Nonlinear Opt. Phys. 2003, 12, 419–440. [Google Scholar] [CrossRef]
- Prodan, E.; Radloff, C.; Halas, N.J.; Nordlander, P. A Hybridization Model for the Plasmon Response of Complex Nanostructures. Science 2003, 302, 419–422. [Google Scholar] [CrossRef] [PubMed]
- Yu, Z.; Park, Y.; Chen, L.; Zhao, B.; Jung, Y.M.; Cong, Q. Preparation of a Superhydrophobic and Peroxidase-like Activity Array Chip for H2O2 Sensing by Surface-Enhanced Raman Scattering. ACS Appl. Mater. Interfaces 2015, 7, 23472–23480. [Google Scholar] [CrossRef]
- Harper, M.M.; McKeating, K.S.; Faulds, K. Recent developments and future directions in SERS for bioanalysis. Phys. Chem. Chem. Phys. 2013, 15, 5312–5328. [Google Scholar] [CrossRef]
- Gong, X.; Bao, Y.; Qiu, C.; Jiang, C. Individual nanostructured materials: Fabrication and surface-enhanced Raman scattering. Chem. Commun. 2012, 48, 7003–7018. [Google Scholar] [CrossRef] [Green Version]
- Wu, D.-Y.; Li, J.-F.; Ren, B.; Tian, Z.-Q. Electrochemical surface-enhanced Raman spectroscopy of nanostructures. Chem. Soc. Rev. 2008, 37, 1025–1041. [Google Scholar] [CrossRef] [PubMed] [Green Version]
- Schlücker, S. Surface-Enhanced Raman Spectroscopy: Concepts and Chemical Applications. Angew. Chem. Int. Ed. 2014, 53, 4756–4795. [Google Scholar] [CrossRef] [PubMed]
- Cardinal, M.F.; Vander Ende, E.; Hackler, R.A.; McAnally, M.O.; Stair, P.C.; Schatz, G.C.; Van Duyne, R.P. Expanding applications of SERS through versatile nanomaterials engineering. Chem. Soc. Rev. 2017, 46, 3886–3903. [Google Scholar] [CrossRef] [PubMed] [Green Version]
- Zhan, L.; Zhen, S.J.; Wan, X.Y.; Gao, P.F.; Huang, C.Z. A sensitive surface-enhanced Raman scattering enzyme-catalyzed immunoassay of respiratory syncytial virus. Talanta 2016, 148, 308–312. [Google Scholar] [CrossRef]
- Sloan-Dennison, S.; Laing, S.; Shand, N.C.; Graham, D.; Faulds, K. A novel nanozyme assay utilising the catalytic activity of silver nanoparticles and SERRS. Analyst 2017, 142, 2484–2490. [Google Scholar] [CrossRef] [Green Version]
- Ortiz-Castillo, J.E.; Gallo-Villanueva, R.C.; Madou, M.J.; Perez-Gonzalez, V.H. Anisotropic gold nanoparticles: A survey of recent synthetic methodologies. Coord. Chem. Rev. 2020, 425, 213489. [Google Scholar] [CrossRef]
- Josephy, P.D.; Eling, T.; Mason, R.P. The horseradish peroxidase-catalyzed oxidation of 3,5,3′,5′-tetramethylbenzidine. Free radical and charge-transfer complex intermediates. J. Biol. Chem. 1982, 257, 3669–3675. [Google Scholar] [CrossRef]
- Xia, X.; Weng, Y.; Zhang, L.; Tang, R.; Zhang, X. A facile SERS strategy to detect glucose utilizing tandem enzyme activities of Au@Ag nanoparticles. Spectrochim. Acta A Mol. Biomol. Spectrosc. 2021, 259, 119889. [Google Scholar] [CrossRef]
- Frey, A.; Meckelein, B.; Externest, D.; Schmidt, M.A. A stable and highly sensitive 3,3′,5,5′-tetramethylbenzidine-based substrate reagent for enzyme-linked immunosorbent assays. J. Immunol. Methods 2000, 233, 47–56. [Google Scholar] [CrossRef]
- Bastús, N.G.; Merkoçi, F.; Piella, J.; Puntes, V. Synthesis of Highly Monodisperse Citrate-Stabilized Silver Nanoparticles of up to 200 nm: Kinetic Control and Catalytic Properties. Chem. Mater. 2014, 26, 2836–2846. [Google Scholar] [CrossRef]
- Chau, Y.-F.C.; Chao, C.-T.C.; Chiang, H.-P.; Lim, C.M.; Voo, N.Y.; Mahadi, A.H. Plasmonic effects in composite metal nanostructures for sensing applications. J. Nanoparticle Res. 2018, 20, 190. [Google Scholar] [CrossRef]
- Asati, A.; Kaittanis, C.; Santra, S.; Perez, J.M. pH-Tunable Oxidase-Like Activity of Cerium Oxide Nanoparticles Achieving Sensitive Fluorigenic Detection of Cancer Biomarkers at Neutral pH. Anal. Chem. 2011, 83, 2547–2553. [Google Scholar] [CrossRef] [PubMed] [Green Version]
- Ge, C.; Fang, G.; Shen, X.; Chong, Y.; Wamer, W.G.; Gao, X.; Chai, Z.; Chen, C.; Yin, J.-J. Facet energy versus enzyme-like activities: The unexpected protection of palladium nanocrystals against oxidative damage. ACS Nano 2016, 10, 10436–10445. [Google Scholar] [CrossRef] [PubMed]
- Lin, L.; Song, X.; Chen, Y.; Rong, M.; Zhao, T.; Wang, Y.; Jiang, Y.; Chen, X. Intrinsic peroxidase-like catalytic activity of nitrogen-doped graphene quantum dots and their application in the colorimetric detection of H2O2 and glucose. Anal. Chim. Acta 2015, 869, 89–95. [Google Scholar] [CrossRef]
- Wang, H.; Zheng, L.; Peng, C.; Guo, R.; Shen, M.; Shi, X.; Zhang, G. Computed tomography imaging of cancer cells using acetylated dendrimer-entrapped gold nanoparticles. Biomaterials 2011, 32, 2979–2988. [Google Scholar] [CrossRef]
- Shah, V.; Shah, S.; Shah, H.; Rispoli, F.J.; McDonnell, K.T.; Workeneh, S.; Karakoti, A.; Kumar, A.; Seal, S. Antibacterial activity of polymer coated cerium oxide nanoparticles. PLoS ONE 2012, 7, 47827. [Google Scholar] [CrossRef] [Green Version]
- Lin, W.-C.; Jen, H.-C.; Chen, C.-L.; Hwang, D.-F.; Chang, R.; Hwang, J.-S.; Chiang, H.-P. SERS Study of Tetrodotoxin (TTX) by Using Silver Nanoparticle Arrays. Plasmonics 2009, 4, 187–192. [Google Scholar] [CrossRef]


Publisher’s Note: MDPI stays neutral with regard to jurisdictional claims in published maps and institutional affiliations. |
© 2021 by the authors. Licensee MDPI, Basel, Switzerland. This article is an open access article distributed under the terms and conditions of the Creative Commons Attribution (CC BY) license (https://creativecommons.org/licenses/by/4.0/).
Share and Cite
Pham, X.-H.; Seong, B.; Bock, S.; Hahm, E.; Huynh, K.-H.; Kim, Y.-H.; Kim, W.; Kim, J.; Kim, D.-E.; Jun, B.-H. Nonenzymatic Hydrogen Peroxide Detection Using Surface-Enhanced Raman Scattering of Gold–Silver Core–Shell-Assembled Silica Nanostructures. Nanomaterials 2021, 11, 2748. https://0-doi-org.brum.beds.ac.uk/10.3390/nano11102748
Pham X-H, Seong B, Bock S, Hahm E, Huynh K-H, Kim Y-H, Kim W, Kim J, Kim D-E, Jun B-H. Nonenzymatic Hydrogen Peroxide Detection Using Surface-Enhanced Raman Scattering of Gold–Silver Core–Shell-Assembled Silica Nanostructures. Nanomaterials. 2021; 11(10):2748. https://0-doi-org.brum.beds.ac.uk/10.3390/nano11102748
Chicago/Turabian StylePham, Xuan-Hung, Bomi Seong, Sungje Bock, Eunil Hahm, Kim-Hung Huynh, Yoon-Hee Kim, Wooyeon Kim, Jaehi Kim, Dong-Eun Kim, and Bong-Hyun Jun. 2021. "Nonenzymatic Hydrogen Peroxide Detection Using Surface-Enhanced Raman Scattering of Gold–Silver Core–Shell-Assembled Silica Nanostructures" Nanomaterials 11, no. 10: 2748. https://0-doi-org.brum.beds.ac.uk/10.3390/nano11102748