
Evaluation of Optical and Acoustical Properties of Ba1−xSrxTiO3 Thin Film Material Library via Conjugation of Picosecond Laser Ultrasonics with X-ray Diffraction, Energy Dispersive Spectroscopy, Electron Probe Micro Analysis, Scanning Electron and Atomic Force Microscopies

 , , and
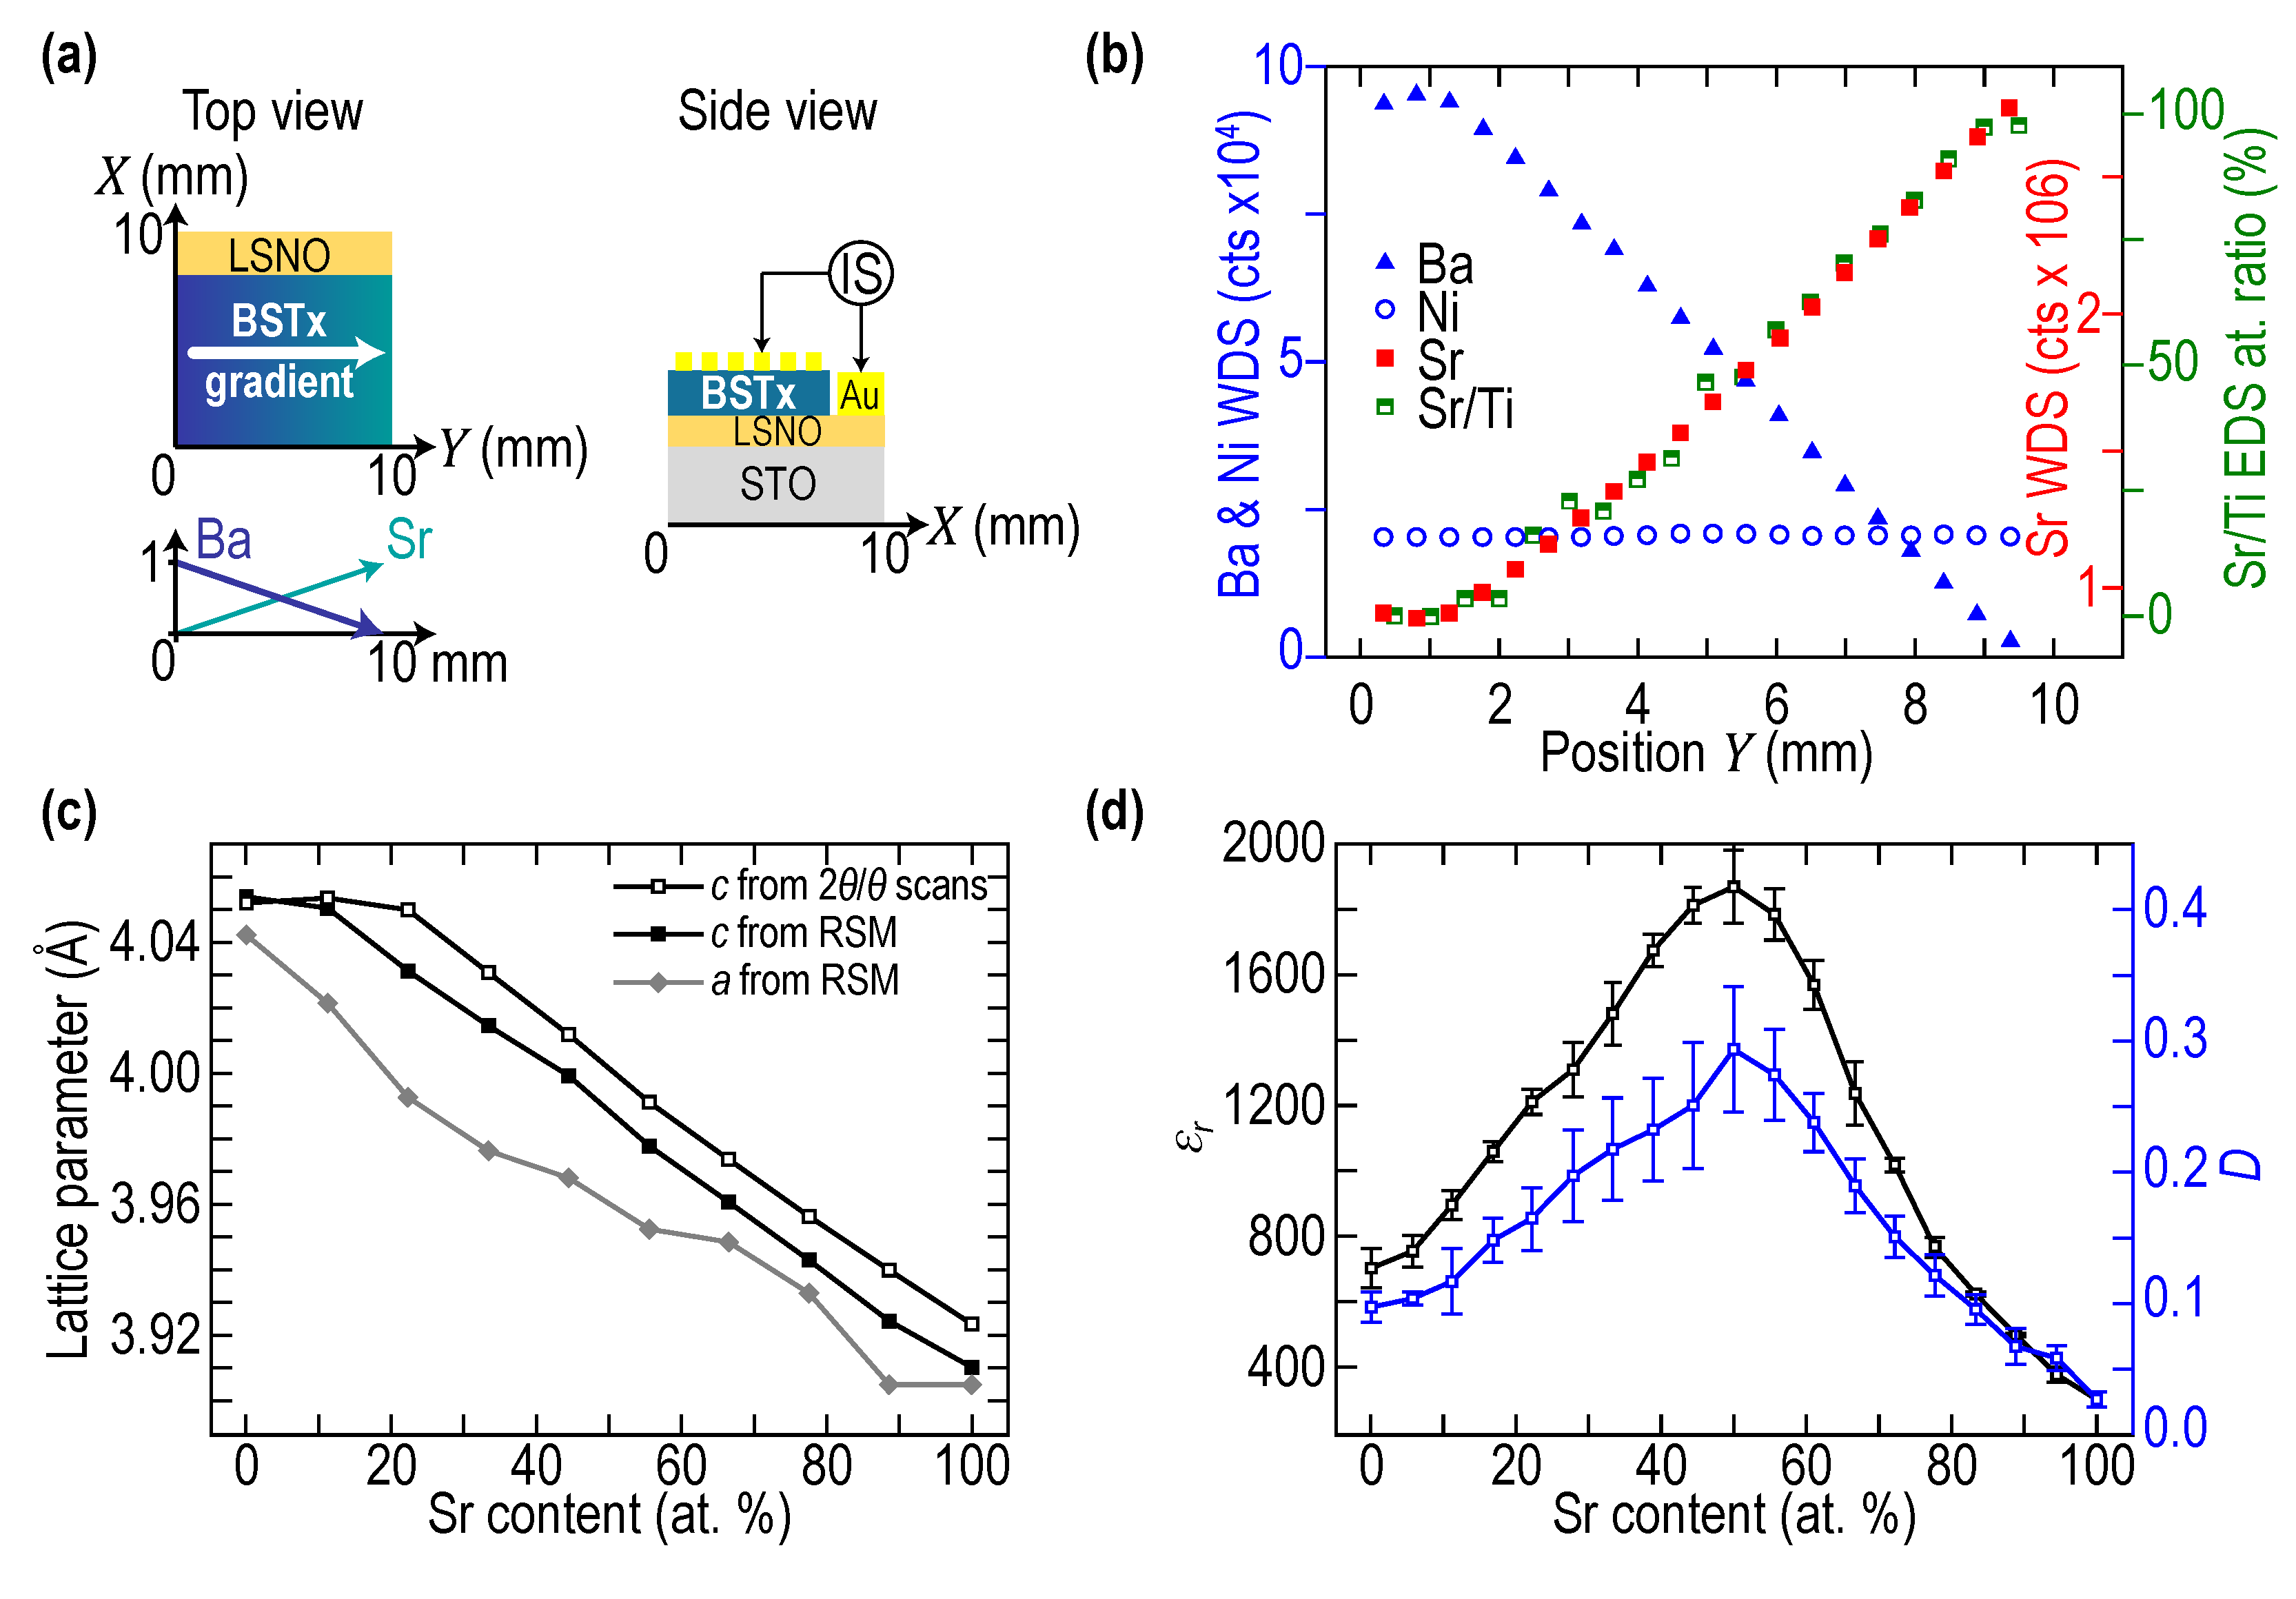
Abstract
:1. Introduction
1.1. Graded Nanofilms and Nanocoatings with Continuously Varying Chemical Composition
1.2. Picosecond Laser Ultrasonics
1.3. Multi-Technique Approaches including Picosecond Laser Ultrasonics for Thin Film Characterization
2. Methods and Experimental Results of Characterizing Laterally Graded Ba1−xSrxTiO3 (BSTx) Library
2.1. Characterization of the Laterally-Graded Ba1−xSrxTiO3 (BSTx) Library by X-ray Diffraction, Energy Dispersive Spectroscopy, Electron Probe Microanalysis and Scanning Electron Microscopy
2.2. Characterization of the Laterally Graded Ba1−xSrxTiO3 (BSTx) Library by Picosecond Laser Ultrasonics
2.2.1. Two-Laser Experimental Setup Based on Asynchronous Optical Sampling
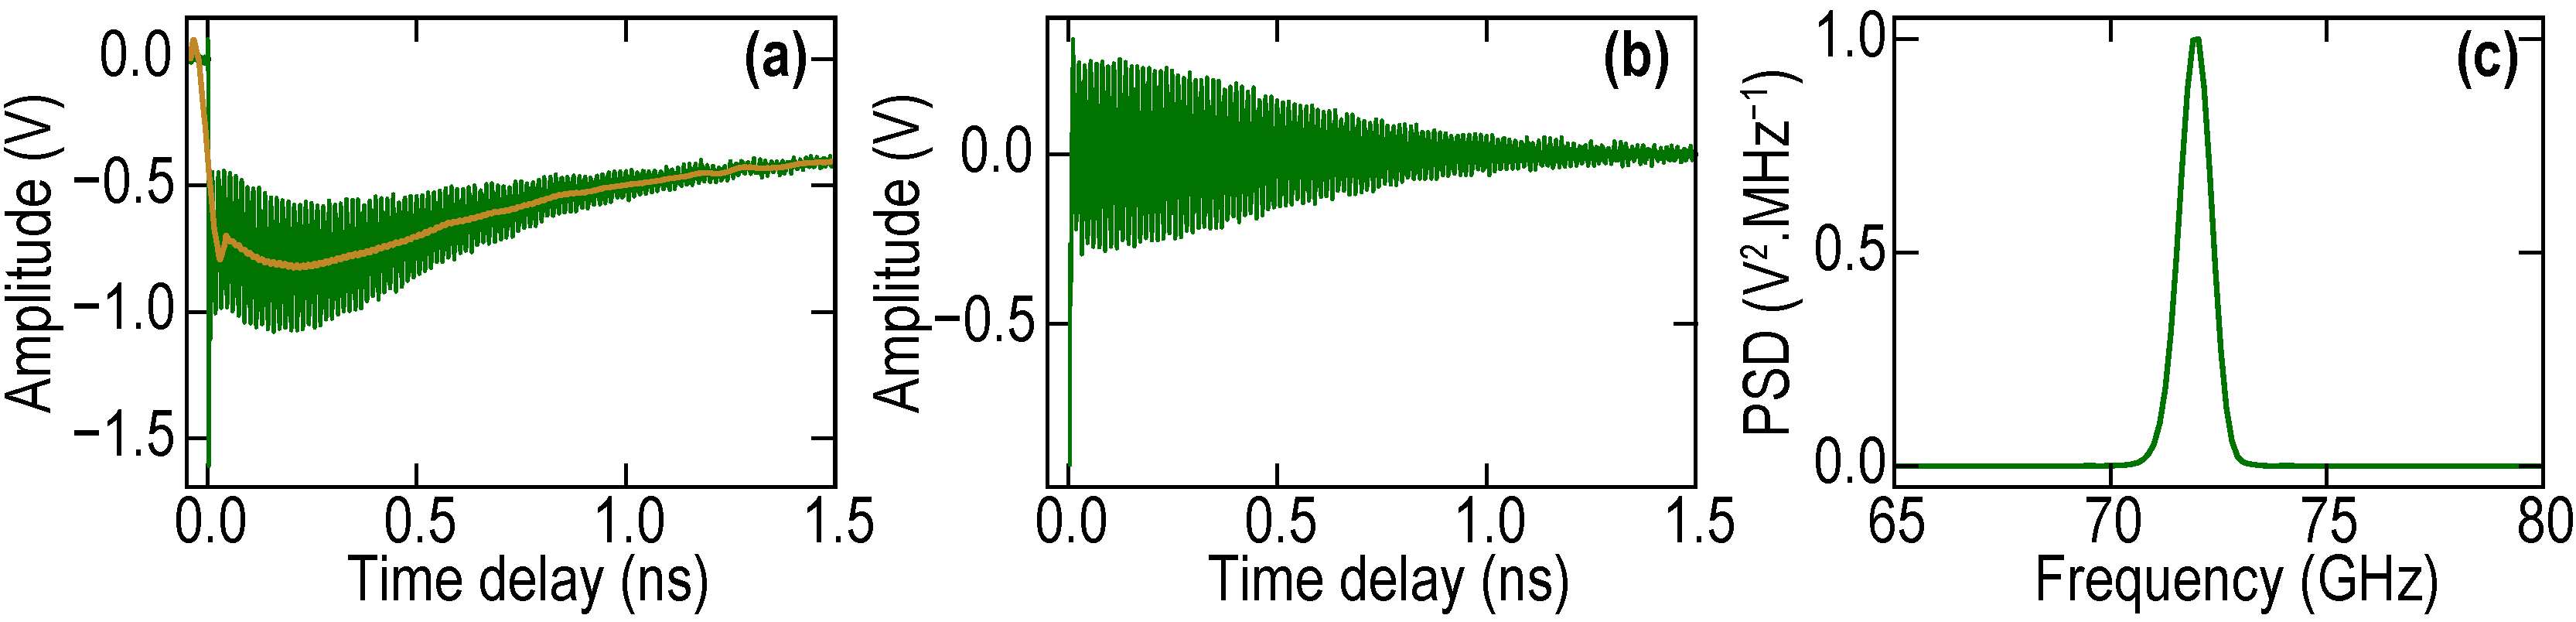
2.2.2. Preliminary Experiments on Bulk STO and Homogeneous Ba0.6Sr0.4TiO3 Thin Film
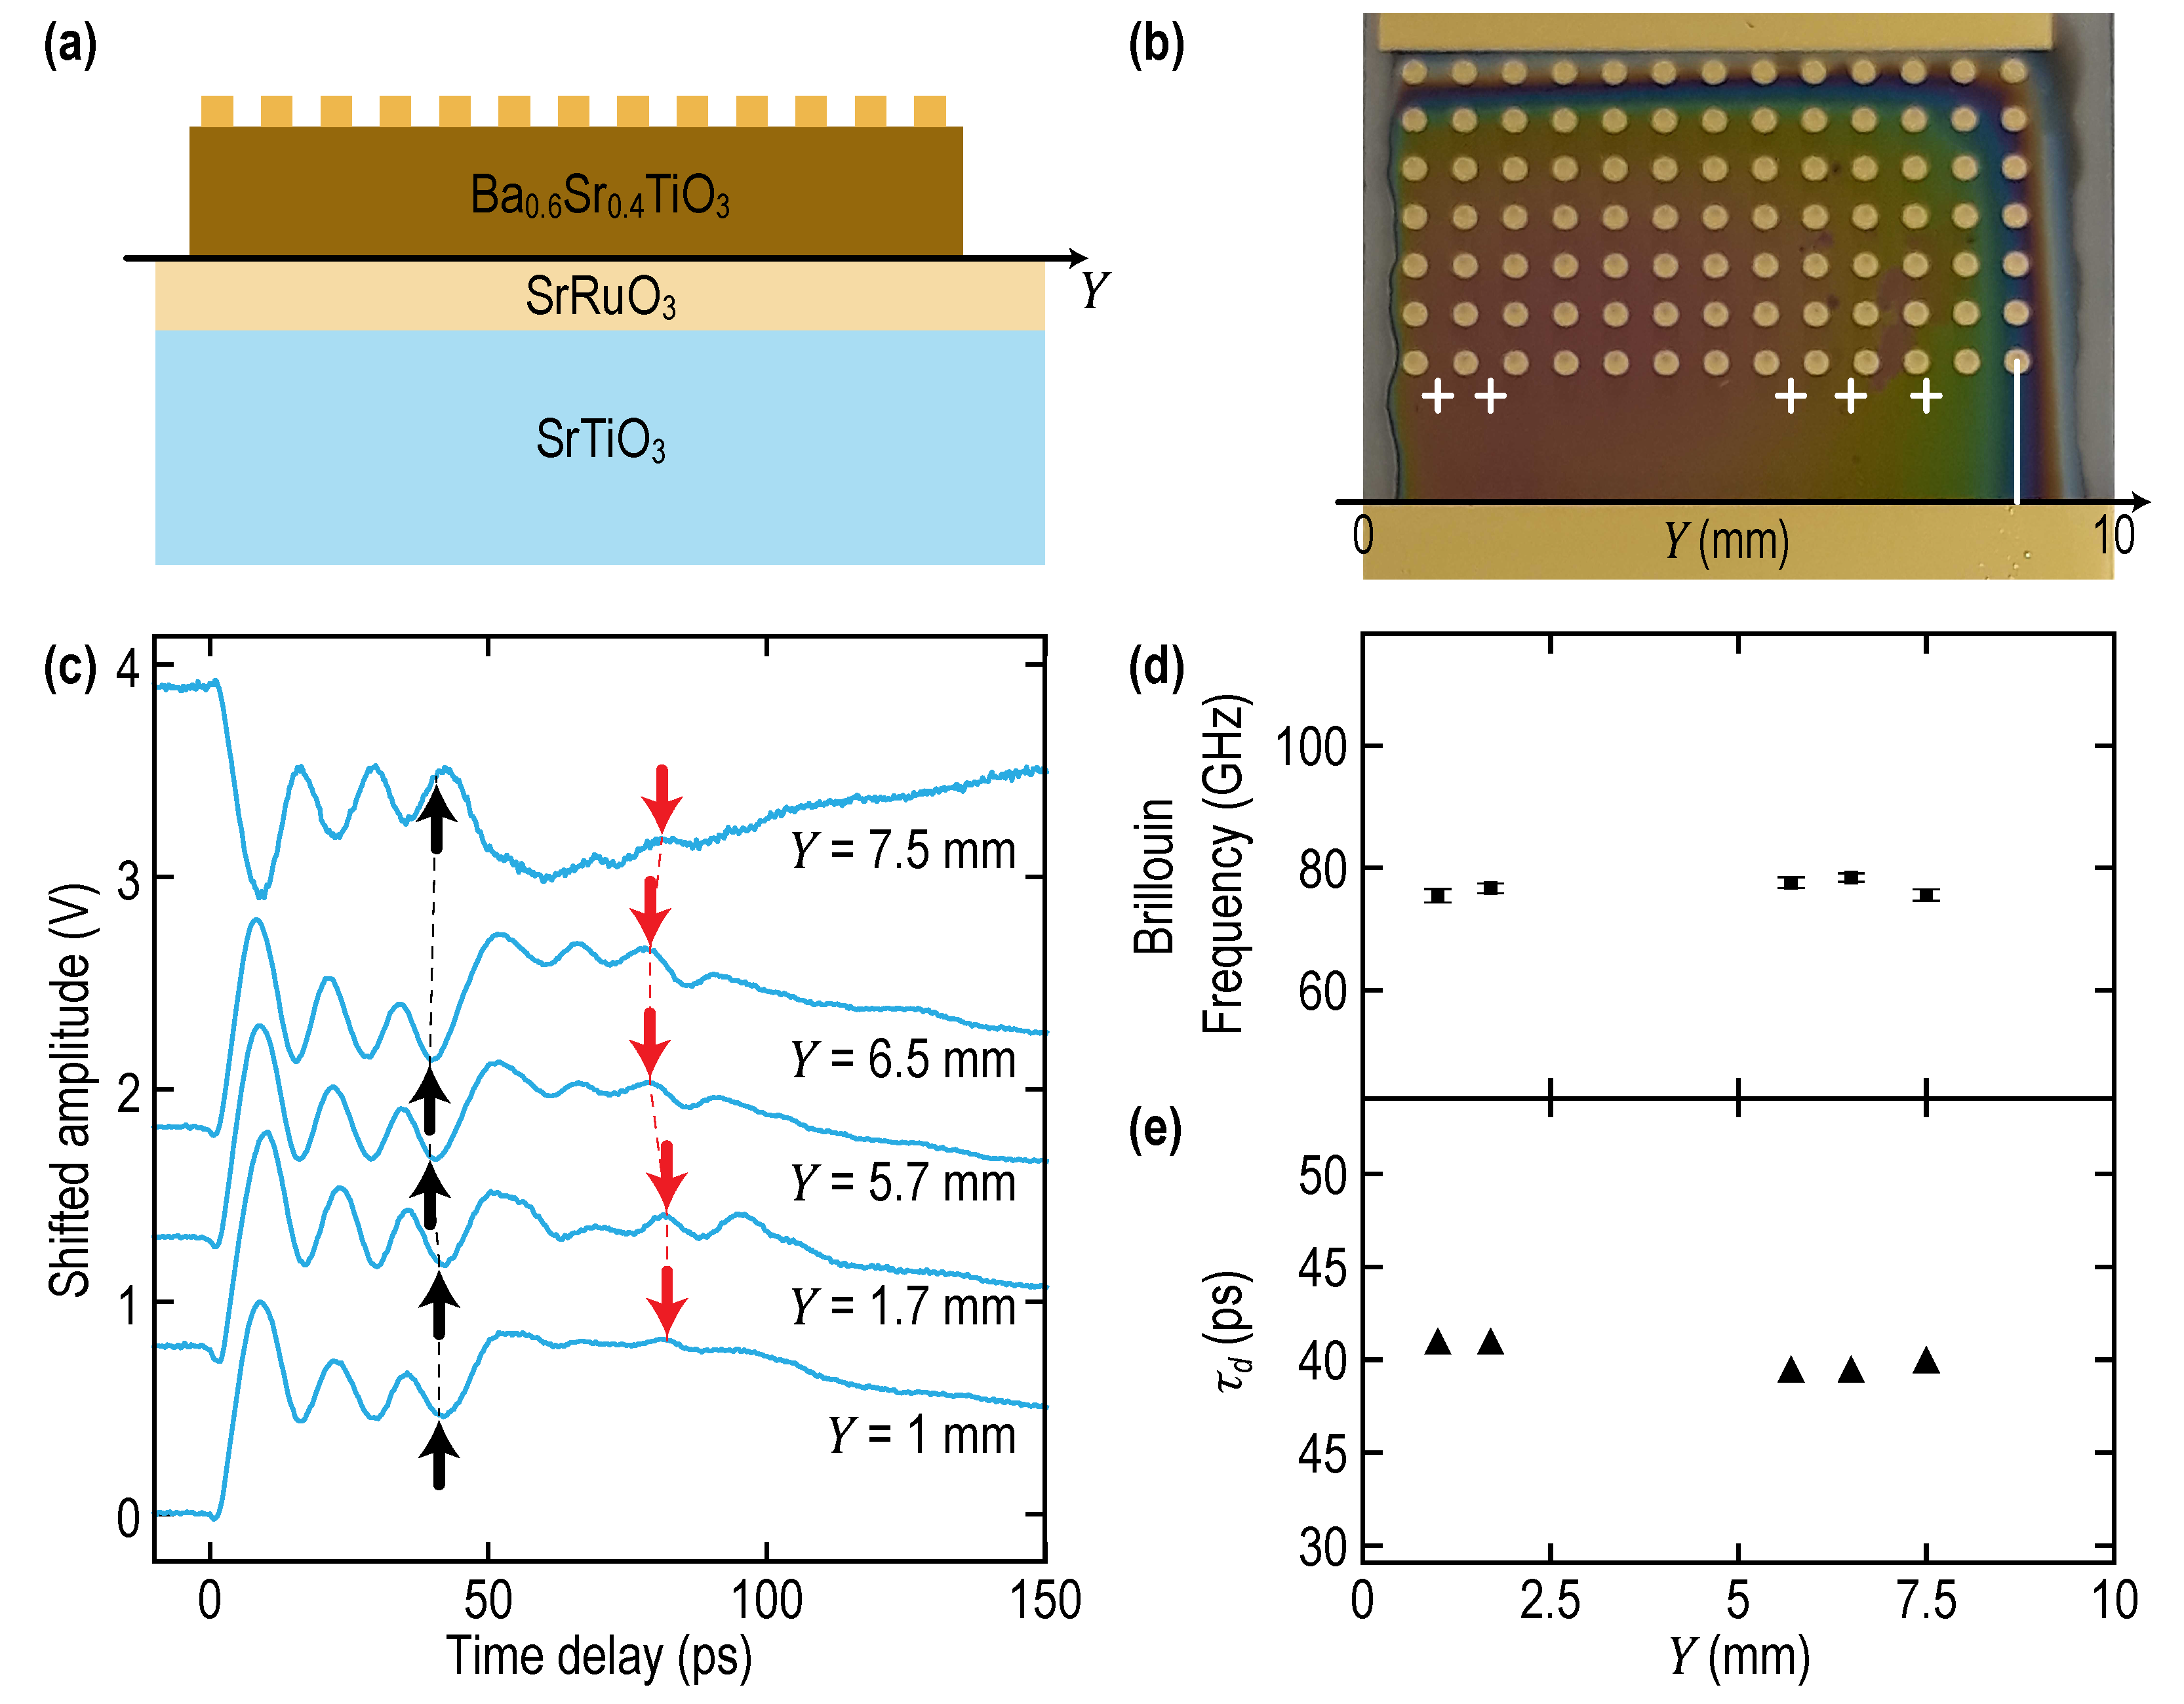
- The Brillouin oscillation is clearly visible in the first 30–40 ps and is due to the scattering of probe light by CAP propagating from the SRO optoacoustic transducer towards the free surface of the film (see Figure 2c). The frequency of this oscillation (about 77 GHz, corresponding to BF of the epitaxial BST0.4 film 40% lower than in STO substrate) is straightforward and distinguishable from the BF of 128 GHz in the STO substrate (Figure 4b). The latter could be revealed only as a small feature by the Fourier transform in the complete experimental time window (not shown). The experimentally revealed Brillouin frequencies are presented in Figure 5d. They were evaluated using the following fitting procedure. First, the raw signal is filtered from 7 ps to its end using a Savitzky-Golay filter with a window made of 121 points (~28.8 ps duration) and a polynomial of third order. Second, the filtered signal is subtracted to the raw one in order to only keep the acoustic contribution to the relative reflectivity changes, and a Fourier transform is done on this acoustic signal over a time interval spanning from 7 to 40 ps in order to obtain a first estimate of the Brillouin frequency. Third, this estimated frequency is used as a starting point for fitting the raw signal on the same time interval using the Levenberg-Marquardt algorithm to perform least squares minimization with a model signal of the form . Here the decaying exponential with parameter accounts for the amplitude decay with time of the oscillations, is a phase shift and the affine function allows to account for potential DC bias and slow overall amplitude variations owing to the non-subtracted slowly varying background. The revealed BF varies less than 4% relative to the average across the 7.5 mm distance along the BST0.4 film (Figure 5d). These results demonstrate the absence of significant gradients in BF and consequently in the film composition in the part of the sample with an almost homogeneous thickness, as could have been expected from the sample preparation.
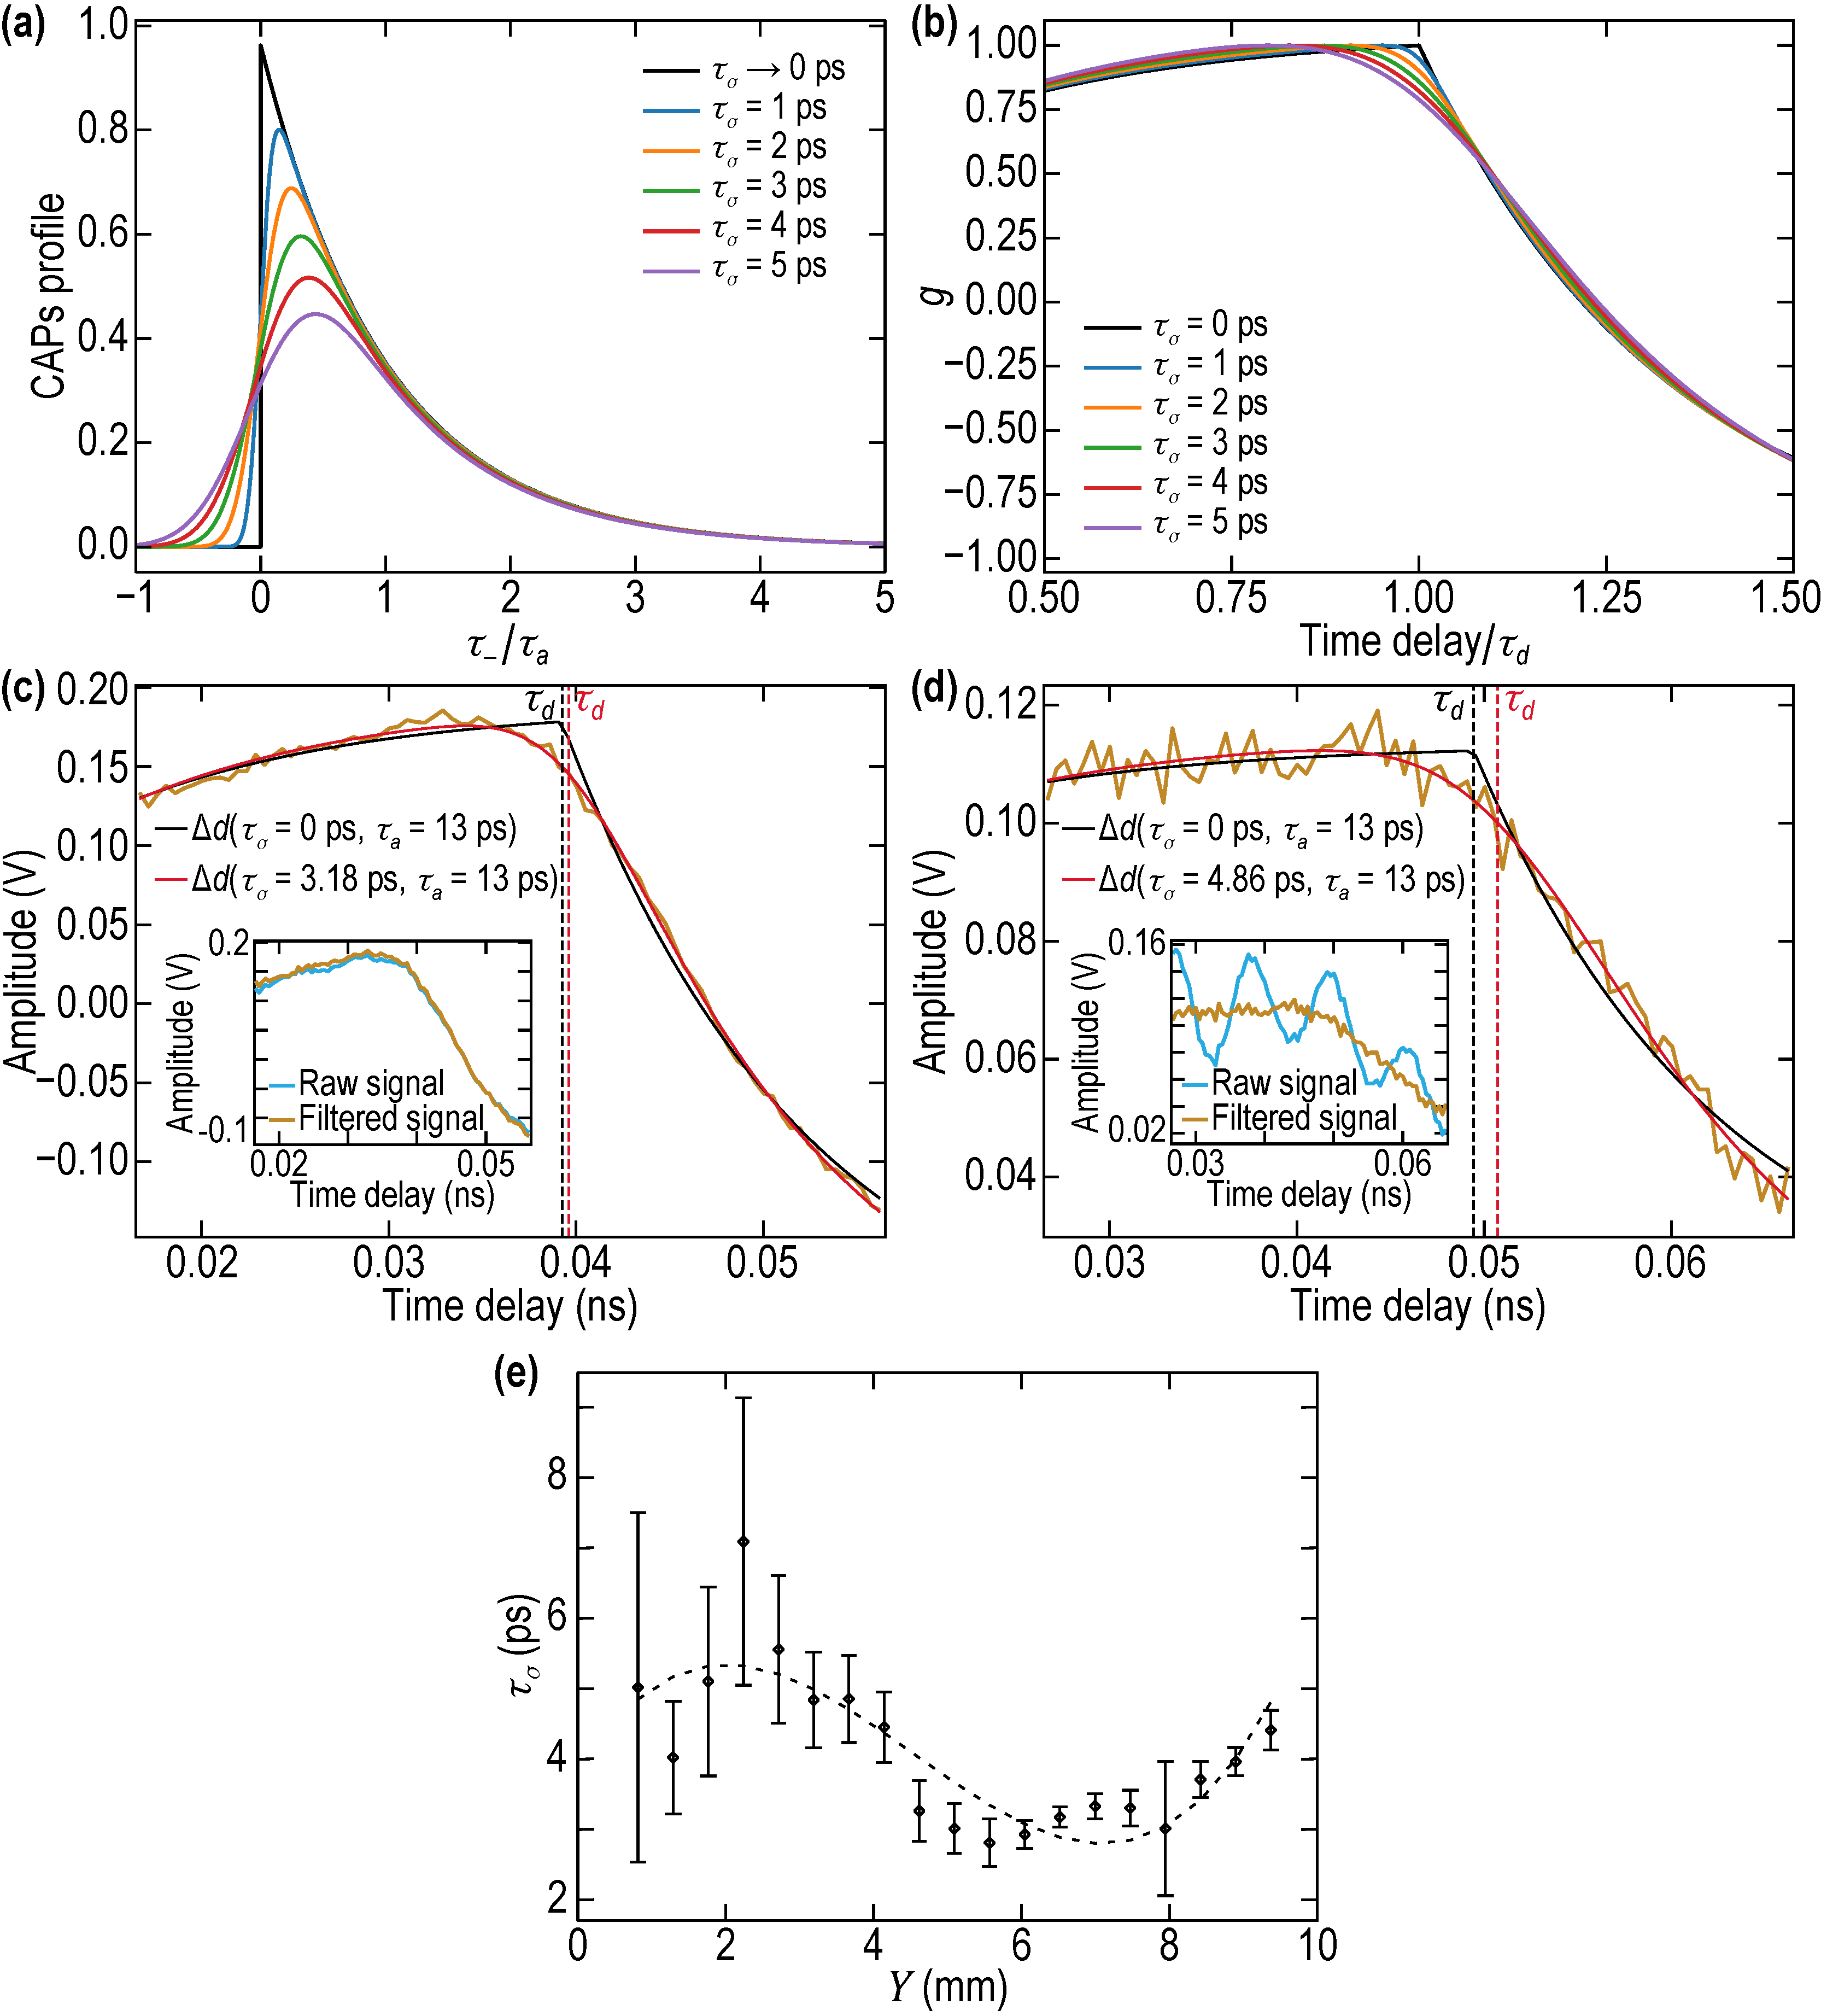
- The background signal, on which Brillouin oscillations are superimposed, exhibits a step-like variation in the process of CAP reflection from the free surface. This variation accompanies the variation of the BST0.4 film optical thickness. It modifies the so-called interferometric contribution of the CAP in the transient reflectivity signal. The signal features corresponding to the arrival time of the CAP on the mechanically free surface of the film , when the strong variations in the background signals starts, are tentatively marked by black arrows in Figure 5c. Here, d denotes the transparent film thickness. The estimated arrival times are presented in Figure 5e. The arrival times and, consequently, the film thicknesses vary less than 3% relative to the average across the 7.5 mm distance along the BST0.4 film.
- At time delays , which are about twice the time of the CAP reflection from the free surface and are tentatively marked by red arrows in Figure 5c, there are features in the signal due to the CAP incidence on the surface of the SRO transducer, which are both of photoelastic and interferometric origins. For example, the peaks in the transient reflectivity signal, following the time of CAP return to the SRO optoacoustic transducer, are commonly attributed to the photoelastic detection of the CAP transmitted inside the opaque transducer [60,61]. The photoelastic contribution to ∆R/R from the CAP reflected from the transducer could be significantly smaller because the photoelastic effect in a material, which is opaque for the probe light, is commonly stronger than in a transparent material. In particular, the stronger photoelasticity of the SRO for the probe light was reported in comparison with the rather common values of the photoelastic coefficients of the STO [59]. In our samples, the contribution to ∆R/R from the CAP reflected by SRO transducer is expected to be nearly completely suppressed due to the well-known close-to-perfect matching of the longitudinal acoustic impedance of SRO to that of STO and BaTiO3 (BTO) [46,49,64]. This expected, nearly perfect matching of the BST0.4 film, of the SRO optoacoustic generator and of the STO substrate is the reason for the absence of any pronounced temporal oscillations corresponding to the vibrational eigen modes of the film and of the optoacoustic transducer in the signals presented in Figure 5c [28,30,31,65,66].
2.2.3. Characterization of the BSTx Library
3. Discussions
3.1. On the Role of the Surface Roughness
3.2. On the Revealed Duration of the Photo-Generated Coherent Acoustic Pulse
3.3. On the Brillouin Frequencies, Sound Velocities and Optical Refractive Indices of BSTx Library
4. Conclusions and Perspectives
Author Contributions
Funding
Data Availability Statement
Conflicts of Interest
References
- Erko, A.; Abrosimov, N.V.; Alex, V. Laterally-graded SiGe crystals for high resolution synchrotron optics. Cryst. Res. Technol. J. Exp. Ind. Crystallogr. 2002, 37, 685–704. [Google Scholar] [CrossRef]
- Konagai, M.; Takahashi, K. Graded-band-gap p Ga1−xAlxAs-n GaAs heterojunction solar cells. J. Appl. Phys. 1975, 46, 3542–3546. [Google Scholar] [CrossRef]
- Dullweber, T.; Rau, U.; Schock, H.W. A new approach to high-efficiency solar cells by band gap grading in Cu (In, Ga) Se2 chalcopyrite semiconductors. Solar Energy Mater. Solar Cells 2001, 67, 145–150. [Google Scholar] [CrossRef]
- Xiang, X.D.; Sun, X.; Briceno, G.; Lou, Y.; Wang, K.A.; Chang, H.; Wallace-Freedman, W.G.; Chen, S.-W.; Schultz, P.G. A combinatorial approach to materials discovery. Science 1995, 268, 1738–1740. [Google Scholar] [CrossRef] [PubMed]
- Qiu, J.; Liu, G.Z.; Wolfman, J.; Autret-Lambert, C.; Roger, S.; Gao, J. Structure and dielectric characteristics of continuous composition spread Ba1−xSrxTiO3 thin films by combinatorial pulsed laser deposition. Ceram. Int. 2016, 42, 6408–6412. [Google Scholar] [CrossRef]
- Bao, P.; Jackson, T.J.; Wang, X.; Lancaster, M. Barium strontium titanate thin film varactors for room-temperature microwave device applications. J. Phys. D Appl. Phys. 2008, 41, 063001. [Google Scholar] [CrossRef]
- Jin, K.J.; Lu, H.B.; Zhao, K.; Ge, C.; He, M.; Yang, G.Z. Novel multifunctional properties induced by interface effects in perovskite oxide heterostructures. Adv. Mater. 2009, 21, 4636–4640. [Google Scholar] [CrossRef]
- Sakai, J.; Autret-Lambert, C.; Sauvage, T.; Courtois, B.; Wolfman, J.; Gervais, F. Epitaxial composition-graded perovskite films grown by a dual-beam pulsed laser deposition method. J. Cryst. Growth 2013, 380, 106–110. [Google Scholar] [CrossRef]
- Bouyanfif, H.; Wolfman, J.; El Marssi, M.; Yuzyuk, Y.; Bodeux, R.; Gervais, M.; Gervais, F. Combinatorial (Ba, Sr)TiO3 thin film growth: X-ray diffraction and Raman spectroscopy. J. Appl. Phys. 2009, 106, 034108. [Google Scholar] [CrossRef]
- Jaber, N.; Wolfman, J.; Daumont, C.; Négulescu, B.; Ruyter, A.; Feuillard, G.; Bavencoffe, M.; Fortineau, J.; Sauvage, T.; Courtois, B.; et al. Enhancement of piezoelectric response in Ga doped BiFeO3 epitaxial thin films. J. Appl. Phys. 2015, 117, 244107. [Google Scholar] [CrossRef]
- Venimadhav, A.; Yates, K.A.; Blamire, M.G. Scanning Raman spectroscopy for characterizing compositionally spread films. J. Comb. Chem. 2005, 7, 85–89. [Google Scholar] [CrossRef] [PubMed] [Green Version]
- Grahn, H.T.; Maris, H.J.; Tauc, J. Picosecond ultrasonics. IEEE J. Quantum Electron. 1989, 25, 2562–2569. [Google Scholar] [CrossRef]
- Akhmanov, S.A.; Gusev, V.É. Laser excitation of ultrashort acoustic pulses: New possibilities in solid-state spectroscopy, diagnostics of fast processes, and nonlinear acoustics. Sov. Phys. Uspekhi 1992, 35, 153. [Google Scholar] [CrossRef]
- Matsuda, O.; Larciprete, M.C.; Voti, R.L.; Wright, O.B. Fundamentals of picosecond laser ultrasonics. Ultrasonics 2015, 56, 3–20. [Google Scholar] [CrossRef] [PubMed]
- Wolfman, J.; Negulescu, B.; Ruyter, A.; Niang, N.; Jaber, N. Interface combinatorial pulsed laser deposition to enhance heterostructures functional properties. In Practical Applications of Laser Ablation, 1st ed.; Yang, D., Ed.; IntechOpen Ltd: London, UK, 2020; Volume 1, pp. 3–21. [Google Scholar]
- Schenck, P.K.; Kaiser, D.L.; Davydov, A.V. High throughput characterization of the optical properties of compositionally graded combinatorial films. Appl. Surf. Sci. 2004, 223, 200–205. [Google Scholar] [CrossRef] [Green Version]
- Wang, J.; Xiang, J.; Bai, L.; Liu, T.; Yang, G.; Zhang, T.J. Microstructure, dielectric and optical properties of compositionally graded Ba1−xSrxTiO3 thin film. Mater. Chem. Phys. 2008, 112, 542–545. [Google Scholar] [CrossRef]
- Wang, G.S.; Zhang, Y.Y.; Mao, C.L.; Dong, X.L.; Chu, J.H. Composition dependence of structural and optical properties for sol-gel derived (100)-oriented Ba1−xSrxTiO3 thin films. Appl. Phys. Lett. 2007, 91, 061104. [Google Scholar] [CrossRef]
- Miranda, F.A.; Van Keuls, F.W.; Romanofsky, R.R.; Mueller, C.H.; Alterovitz, S.; Subramanyam, G. Ferroelectric Thin Films-Based Technology for Frequency- and Phase-Agile Microwave Communication Applications. Integr. Ferroelectr. 2002, 42, 131–149. [Google Scholar] [CrossRef]
- Smiga, W.; Garbarz-Glos, B.; Kalvane, A.; Antonova, M.; Suchanicz, W.; Sternberg, A. Strontium Concentration Dependence of Selected Structural and Mechanical Properties of Polycrystalline Ba1−xSrxTiO3. Integr. Ferroelectr. 2009, 108, 77. [Google Scholar] [CrossRef]
- NETA. Available online: https://www.neta-tech.com/en/ (accessed on 19 November 2021).
- Thomsen, C.; Grahn, H.T.; Maris, H.J.; Tauc, J. Surface generation and detection of phonons by picosecond light pulses. Phys. Rev. B 1986, 34, 4129–4138. [Google Scholar] [CrossRef]
- Gusev, V. Laser hypersonics in fundamental and applied research. Acustica 1996, 82, 37–45. [Google Scholar]
- Devos, A. Colored ultrafast acoustics: From fundamentals to applications. Ultrasonics 2015, 56, 90–97. [Google Scholar] [CrossRef] [PubMed]
- Ruello, P.; Gusev, V.E. Physical mechanisms of coherent acoustic phonons generation by ultrafast laser action. Ultrasonics 2015, 56, 21–35. [Google Scholar] [CrossRef] [PubMed]
- Nye, J.F. Physical Properties of Crystals: Their Representation by Tensors and Matrices; Oxford University Press: Oxford, UK, 1985. [Google Scholar]
- Born, M.; Wolf, E. Principles of Optics: Electromagnetic Theory of Propagation, Interference and Diffraction of Light; Elsevier: Amsterdam, The Netherlands, 2013. [Google Scholar]
- Antonelli, G.A.; Perrin, B.; Daly, B.C.; Cahill, D.G. Characterization of Mechanical and Thermal Properties Using Ultrafast Optical Metrology. MRS Bull. 2006, 31, 607–613. [Google Scholar] [CrossRef]
- Thomsen, C.; Strait, J.; Vardeny, Z.; Maris, H.J.; Tauc, J.; Hauser, J.J. Coherent Phonon Generation and Detection by Picosecond Light Pulses. Phys. Rev. Lett. 1984, 53, 989–992. [Google Scholar] [CrossRef]
- Thomsen, C.; Maris, H.; Tauc, J. Picosecond acoustics as a non-destructive tool for the characterization of very thin films. Thin Solid Film. 1987, 154, 217–223. [Google Scholar] [CrossRef]
- Schubert, M.; Grossmann, M.; He, C.; Brick, D.; Scheel, P.; Ristow, O.; Gusev, V.; Dekorsy, T. Generation and detection of gigahertz acoustic oscillations in thin membranes. Ultrasonics 2015, 56, 109–115. [Google Scholar] [CrossRef] [PubMed]
- Wright, O.B.; Hyoguchi, T. Ultrafast vibration and laser acoustics in thin transparent films. Opt. Lett. 1991, 16, 1529–1531. [Google Scholar] [CrossRef]
- Wright, O.B. Thickness and sound velocity measurement in thin transparent films with laser picosecond acoustics. J. Appl. Phys. 1992, 71, 1617–1629. [Google Scholar] [CrossRef]
- Drain, L.E. The Laser Doppler Techniques; Wiley-Interscience: Chichester, UK; New York, NY, USA, 1980. [Google Scholar]
- Dil, J.G. Brillouin scattering in condensed matter. Rep. Prog. Phys. 1982, 45, 285–334. [Google Scholar] [CrossRef]
- Thomsen, C.; Grahn, H.; Maris, H.; Tauc, J. Picosecond interferometric technique for study of phonons in the brillouin frequency range. Opt. Commun. 1986, 60, 55–58. [Google Scholar] [CrossRef]
- Gusev, V.E.; Ruello, P. Advances in applications of time-domain Brillouin scattering for nanoscale imaging. Appl. Phys. Rev. 2018, 5, 031101. [Google Scholar] [CrossRef] [Green Version]
- Rossignol, C.; Perrin, B.; Laborde, S.; Vandenbulcke, L.; De Barros, M.I.; Djemia, P. Nondestructive evaluation of micrometric diamond films with an interferometric picosecond ultrasonics technique. J. Appl. Phys. 2004, 95, 4157–4162. [Google Scholar] [CrossRef]
- Côte, R.; Devos, A. Refractive index, sound velocity and thickness of thin transparent films from multiple angles picosecond ultrasonics. Rev. Sci. Instrum. 2005, 76, 053906. [Google Scholar] [CrossRef]
- Lomonosov, A.M.; Ayouch, A.; Ruello, P.; Vaudel, G.; Baklanov, M.R.; Verdonck, P.; Zhao, L.; Gusev, V.E. Nanoscale Noncontact Subsurface Investigations of Mechanical and Optical Properties of Nanoporous; Low-k Material Thin Film. ACS Nano 2012, 6, 1410–1415. [Google Scholar] [CrossRef]
- Abadias, G.; Djemia, P.; Belliard, L. Alloying effects on the structure and elastic properties of hard coatings based on ternary transition metal (M = Ti, Zr or Ta) nitrides. Surf. Coat. Technol. 2014, 257, 129–137. [Google Scholar] [CrossRef]
- Doig, K.I.; Aguesse, F.; Axelsson, A.K.; Alford, N.M.; Nawaz, S.; Palkar, V.R.; Jones, S.P.P.; Johnson, R.D.; Synowicki, R.A.; Lloyd-Hughes, J. Coherent magnon and acoustic phonon dynamics in tetragonal and rare-earth-doped BiFeO3 multiferroic thin films. Phys. Rev. B 2013, 88, 094425. [Google Scholar] [CrossRef] [Green Version]
- Raetz, S.; Lomonosov, A.; Avanesyan, S.; Chigarev, N.; de Lima Savi, E.; Bulou, A.; Gusev, V. Evaluation of the structural phase transition in multiferroic (Bi1−x Prx)(Fe0.95 Mn0.05) O3 thin films by a multi-technique approach including picosecond laser ultrasonics. Appl. Sci. 2019, 9, 736. [Google Scholar] [CrossRef] [Green Version]
- Dilhaire, S.; Claeys, W.; Rampnoux, J.-M.; Rossignol, C. Optical heterodyne sampling device having probe and pump beams. US Patent 007728317 B2, 1 June 2010. Available online: https://patentimages.storage.googleapis.com/0f/06/9d/8025f78bb9ec81/US7728317.pdf (accessed on 19 November 2021).
- Bartels, A.; Cerna, R.; Kistner, C.; Thoma, A.; Hudert, F.; Janke, C.; Dekorsy, T. Ultrafast time-domain spectroscopy based on high-speed asynchronous optical sampling. Rev. Sci. Instrum. 2007, 78, 035107. [Google Scholar] [CrossRef] [Green Version]
- Scarcelli, G.; Yun, S. Confocal Brillouin microscopy for three-dimensional mechanical imaging. Nat. Photonics 2008, 2, 39–43. [Google Scholar] [CrossRef]
- Ballmann, C.W.; Meng, Z.; Traverso, A.J.; Scully, M.O.; Yakovlev, V.V. Impulsive Brillouin microscopy. Optica 2017, 4, 124–128. [Google Scholar] [CrossRef]
- Yan, G.; Bazir, A.; Margueritat, J.; Dehoux, T. Evaluation of commercial virtually imaged phase array and Fabry-Pérot based Brillouin spectrometers for applications to biology. Biomed. Opt. Express 2020, 11, 6933–6944. [Google Scholar] [CrossRef] [PubMed]
- Lanzillotti-Kimura, N.D.; Fainstein, A.; Perrin, B.; Jusserand, B.; Soukiassian, A.; Xi, X.X.; Schlom, D.G. Enhancement and inhibition of coherent phonon emission of a Ni film in a BaTiO3/SrTiO3 cavity. Phys. Rev. Lett. 2010, 104, 187402. [Google Scholar] [CrossRef] [PubMed]
- Fischer, G.; Wang, Z.; Karato, S.-I. Elasticity of CaTiO3, SrTiO3 and BaTiO3 perovskites up to 3.0 Gpa: The effect of crystallographic structure. Phys. Chem. Miner. 1993, 20, 97–103. [Google Scholar] [CrossRef]
- Yang, C.-Y.; Lin, K.-H. Temperature-dependence of hypersound dynamics in SrRuO3/SrTiO3 heterostructures. Phys. Rev. B 2018, 98, 064308. [Google Scholar] [CrossRef]
- Cardona, M. Optical Properties and Band Structure of SrTiO3 and BaTiO3. Phys. Rev. 1965, 140, A651. [Google Scholar] [CrossRef]
- Dodge, M.J. Refractive Index. In Handbook of Laser Science and Technology; Weber, M.J., Ed.; CRC Press: Boca Raton, FL, USA, 1986; Volume IV. [Google Scholar]
- Dejneka, A.; Tyunina, M.; Narkilahti, J.; Levoska, J.; Chvostova, D.; Jastrabík, L.; Trepakov, V.A. Tensile strain induced changes in the optical spectra of SrTiO3 epitaxial thin films. Phys. Solid State 2010, 52, 2082–2089. [Google Scholar] [CrossRef]
- Chernova, E.; Brooks, C.; Chvostova, D.; Bryknar, Z.; Dejneka, A.; Tyunina, M. Optical NIR-VIS-VUV constants of advanced substrates for thin-film devices. Opt. Mater. Express 2017, 7, 3844. [Google Scholar] [CrossRef]
- Lee, S.; Apgar, B.A.; Martin, L.W. Strong visible-light absorption and hot-carrier injection in TiO2/SrRuO3 heterostructures. Adv. Energy Mater. 2013, 3, 1084–1090. [Google Scholar] [CrossRef] [Green Version]
- Kostic, P.; Okada, Y.; Collins, N.C.; Schlesinger, Z.; Reiner, J.W.; Klein, L.; Beasley, M.R. Non-Fermi-liquid behavior of SrRuO3: Evidence from infrared conductivity. Phys. Rev. Lett. 1998, 81, 2498. [Google Scholar] [CrossRef] [Green Version]
- Bojahr, A.; Schick, D.; Maerten, L.; Herzog, M.; Vrejoiu, I.; Schmising, C.V.K.; Milne, C.; Johnson, S.; Bargheer, M. Comparing the oscillation phase in optical pump-probe spectra to ultrafast X-ray diffraction in the metal-dielectric SrRuO3/SrTiO3 superlattice. Phys. Rev. B 2012, 85, 224302. [Google Scholar] [CrossRef] [Green Version]
- O’Hara, K.E.; Hu, X.; Cahill, D.G. Characterization of nanostructured metal films by picosecond acoustics and interferometry. J. Appl. Phys. 2001, 90, 4852–4858. [Google Scholar] [CrossRef]
- Devos, A.; Robillard, J.-F.; Côte, R.; Emery, P. High-laser-wavelength sensitivity of the picosecond ultrasonic response in transparent thin films. Phys. Rev. B 2006, 74, 064114. [Google Scholar] [CrossRef]
- Mechri, C.; Ruello, P.; Gusev, V. Confined coherent acoustic modes in a tubular nanoporous alumina film probed by picosecond acoustics methods. New J. Phys. 2012, 14, 023048. [Google Scholar] [CrossRef]
- Wen, Y.-C.; Hsieh, C.-L.; Lin, K.-H.; Chen, H.-P.; Chin, S.-C.; Hsiao, C.-L.; Lin, Y.-T.; Chang, C.-S.; Chang, Y.-C.; Tu, L.-W.; et al. Specular scattering probability of acoustic phonons in atomically flat interfaces. Phys. Rev. Lett. 2009, 103, 264301. [Google Scholar] [CrossRef] [Green Version]
- Cuffe, J.; Ristow, O.; Chávez-Ángel, E.; Shchepetov, A.; Chapuis, P.-O.; Alzina, F.; Hettich, M.; Prunnila, M.; Ahopelto, J.; Dekorsy, T.; et al. Lifetimes of confined acoustic phonons in ultrathin silicon membranes. Phys. Rev. Lett. 2013, 110, 095503. [Google Scholar] [CrossRef] [Green Version]
- Mudiyanselage, R.R.H.H.; Magill, B.A.; Burton, J.; Miller, M.; Spencer, J.; McMillan, K.; Khodaparast, G.A.; Kang, H.B.; Kang, M.G.; Maurya, D.; et al. Coherent acoustic phonons and ultrafast carrier dynamics in hetero-epitaxial BaTiO3–BiFeO3 films and nanorods. J. Mater. Chem. C 2019, 7, 14212–14222. [Google Scholar] [CrossRef]
- Akimov, A.V.; Young, E.S.K.; Sharp, J.S.; Gusev, V.; Kent, A. Coherent hypersonic closed-pipe organ like modes in supported polymer films. Appl. Phys. Lett. 2011, 99, 021912. [Google Scholar] [CrossRef]
- Ayouch, A.; Dieudonné, X.; Vaudel, G.; Piombini, H.; Vallé, K.; Gusev, V.; Belleville, P.; Ruello, P. Elasticity of an assembly of disordered nanoparticles interacting via either van der Waals-bonded or covalent-bonded coating layers. ACS Nano 2012, 6, 10614–10621. [Google Scholar] [CrossRef]
- Yang, C.-Y.; Wu, P.-C.; Chu, Y.-H.; Lin, K.-H. Generation and coherent control of terahertz acoustic phonons in superlattices of perovskite oxides. New J. Phys. 2021, 23, 053009. [Google Scholar] [CrossRef]
- Aulika, I.; Pokorný, J.; Zauls, V.; Kundzins, K.; Rutkis, M.; Petzelt, J. Structural and optical characterization of Ba0.8Sr0.2TiO3 PLD deposited films. Opt. Mater. 2008, 30, 1017–1022. [Google Scholar] [CrossRef]
- Hiltunen, J.; Seneviratne, D.; Tuller, H.L.; Lappalainen, J.; Lantto, V. Crystallographic and dielectric properties of highly oriented BaTiO3 films: Influence of oxygen pressure utilized during pulsed laser deposition. J. Electroceramics 2009, 22, 395–404. [Google Scholar] [CrossRef]
- Chen, A.P.; Khatkhatay, F.; Zhang, W.; Jacob, C.; Jiao, L.; Wang, H. Strong oxygen pressure dependence of ferroelectricity in BaTiO3/SrRuO3/SrTiO3 epitaxial heterostructures. J. Appl. Phys. 2013, 114, 124101. [Google Scholar] [CrossRef]
- Bhushan, B. Surface roughness analysis and measurement techniques. In Modern Tribology Handbook, Two Volume Set; CRC Press: Boca Raton, FL, USA, 2000; pp. 79–150. [Google Scholar]
- Newville, M.; Stensitzki, T.; Allen, D.B.; Ingargiola, A. LMFIT: Non-Linear Least-Square Minimization and Curve-Fitting for Python (0.8.0). Zenodo. 2014. Available online: https://0-dx-doi-org.brum.beds.ac.uk/10.5281/zenodo.11813 (accessed on 19 November 2021).
- Shinomori, S.; Kawasaki, M.; Tokura, Y. Orientation-controlled epitaxy and anisotropic properties of La2−xSrxNiO4 with 0.5⩽ x⩽ 1.5 covering the insulator–metal transition. Appl. Phys. Lett. 2002, 80, 574–576. [Google Scholar] [CrossRef]
- Ido, T.; Magoshi, K.; Eisaki, H.; Uchida, S. Optical study of the La2−xSrxNiO4 system: Effect of hole doping on the electronic structure of the NiO2 plane. Phys. Rev. B 1991, 44, 12094. [Google Scholar] [CrossRef]
- Schilling, A.; Dell’Amore, R.; Karpinski, J.; Bukowski, Z.; Medarde, M.; Pomjakushina, E.; Müller, K.A. LaBaNiO4: A Fermi glass. J. Phys. Condens. Matter 2008, 21, 015701. [Google Scholar] [CrossRef] [PubMed] [Green Version]
- Ohnishi, T.; Shibuya, K.; Yamamoto, T.; Lippmaa, M. Defects and transport in complex oxide thin films. J. Appl. Phys. 2008, 103, 103703. [Google Scholar] [CrossRef]
- Lee, H.N.; Seo, S.S.A.; Choi, W.S.; Rouleau, C.M. Growth control of oxygen stoichiometry in homoepitaxial SrTiO3 films by pulsed laser epitaxy in high vacuum. Sci. Rep. 2016, 6, 1–7. [Google Scholar] [CrossRef] [PubMed] [Green Version]
- Chan, N.-H.; Sharma, R.K.; Smyth, D.M. Nonstoichiometry in SrTiO3. J. Electrochem. Soc. 1981, 128, 1762. [Google Scholar] [CrossRef]
- Samara, G.A. Pressure and Temperature Dependences of the Dielectric Properties of the Perovskites BaTiO3 and SrTiO3. Phys. Rev. 1966, 151, 378. [Google Scholar] [CrossRef]
- Ko, J.-H.; Kim, T.H.; Roleder, K.; Rytz, D.; Kojima, S. Precursor dynamics in the ferroelectric phase transition of barium titanate single crystals studied by Brillouin light scattering. Phys. Rev. B 2011, 84, 094123. [Google Scholar] [CrossRef]
- Wemple, S.H.; Didomenico Jr, M.; Camlibel, I. Dielectric and optical properties of melt-grown BaTiO3. J. Phys. Chem. Solids 1968, 29, 1797–1803. [Google Scholar] [CrossRef]
- Wang, J.J.; Meng, F.Y.; Ma, X.Q.; Xu, M.X.; Chen, L.Q. Lattice, elastic, polarization, and electrostrictive properties of BaTiO3 from first-principles. J. Appl. Phys. 2010, 108, 034107. [Google Scholar] [CrossRef] [Green Version]
- Soukiassian, A.; Tian, W.; Tenne, D.; Xi, X.X.; Schlom, D.G.; Lanzillotti-Kimura, N.D.; Bruchhausen, A.; Fainstein, A.; Sun, H.P.; Pan, X.; et al. Acoustic Bragg mirrors and cavities made using piezoelectric oxides. Appl. Phys. Lett. 2007, 90, 042909. [Google Scholar] [CrossRef] [Green Version]
- Bruchhausen, A.; Fainstein, A.; Soukiassian, A.; Schlom, D.G.; Xi, X.X.; Bernhagen, M.; Reiche, P.; Uecker, R. Ferroelectricity-Induced Coupling between Light and Terahertz-Frequency Acoustic Phonons inBaTiO3/SrTiO3 Superlattices. Phys. Rev. Lett. 2008, 101, 197402. [Google Scholar] [CrossRef] [Green Version]
- Bruchhausen, A.E.; Lanzillotti-Kimura, N.D.; Jusserand, B.; Soukiassian, A.; Xie, L.; Pan, X.Q.; Dekorsy, T.; Schlom, D.G.; Fainstein, A. Acoustic confinement phenomena in oxide multifunctional nanophononic devices. Phys. Rev. Mater. 2018, 2, 106002. [Google Scholar] [CrossRef] [Green Version]


Publisher’s Note: MDPI stays neutral with regard to jurisdictional claims in published maps and institutional affiliations. |
© 2021 by the authors. Licensee MDPI, Basel, Switzerland. This article is an open access article distributed under the terms and conditions of the Creative Commons Attribution (CC BY) license (https://creativecommons.org/licenses/by/4.0/).
Share and Cite
Sandeep, S.; Raetz, S.; Wolfman, J.; Negulescu, B.; Liu, G.; Longuet, J.-L.; Thréard, T.; Gusev, V.E. Evaluation of Optical and Acoustical Properties of Ba1−xSrxTiO3 Thin Film Material Library via Conjugation of Picosecond Laser Ultrasonics with X-ray Diffraction, Energy Dispersive Spectroscopy, Electron Probe Micro Analysis, Scanning Electron and Atomic Force Microscopies. Nanomaterials 2021, 11, 3131. https://0-doi-org.brum.beds.ac.uk/10.3390/nano11113131
Sandeep S, Raetz S, Wolfman J, Negulescu B, Liu G, Longuet J-L, Thréard T, Gusev VE. Evaluation of Optical and Acoustical Properties of Ba1−xSrxTiO3 Thin Film Material Library via Conjugation of Picosecond Laser Ultrasonics with X-ray Diffraction, Energy Dispersive Spectroscopy, Electron Probe Micro Analysis, Scanning Electron and Atomic Force Microscopies. Nanomaterials. 2021; 11(11):3131. https://0-doi-org.brum.beds.ac.uk/10.3390/nano11113131
Chicago/Turabian StyleSandeep, Sathyan, Samuel Raetz, Jerome Wolfman, Beatrice Negulescu, Guozhen Liu, Jean-Louis Longuet, Théo Thréard, and Vitalyi E. Gusev. 2021. "Evaluation of Optical and Acoustical Properties of Ba1−xSrxTiO3 Thin Film Material Library via Conjugation of Picosecond Laser Ultrasonics with X-ray Diffraction, Energy Dispersive Spectroscopy, Electron Probe Micro Analysis, Scanning Electron and Atomic Force Microscopies" Nanomaterials 11, no. 11: 3131. https://0-doi-org.brum.beds.ac.uk/10.3390/nano11113131