
Enhancement of Temperature Fluorescence Brightness of Zn@Si Core-Shell Quantum Dots Produced via a Unified Strategy

 ,
,  , ,
, ,  and
and
Abstract
:1. Introduction
2. Materials and Methods
2.1. Materials
2.2. Preparation of ZnPSi and Suspension ZnSiQDs in the Presence/Absence of NH4OH
2.3. Characterization of ZnPSi and ZnSiQDs Colloids
3. Results and Discussion
3.1. Morphology and Structure of ZnPSi
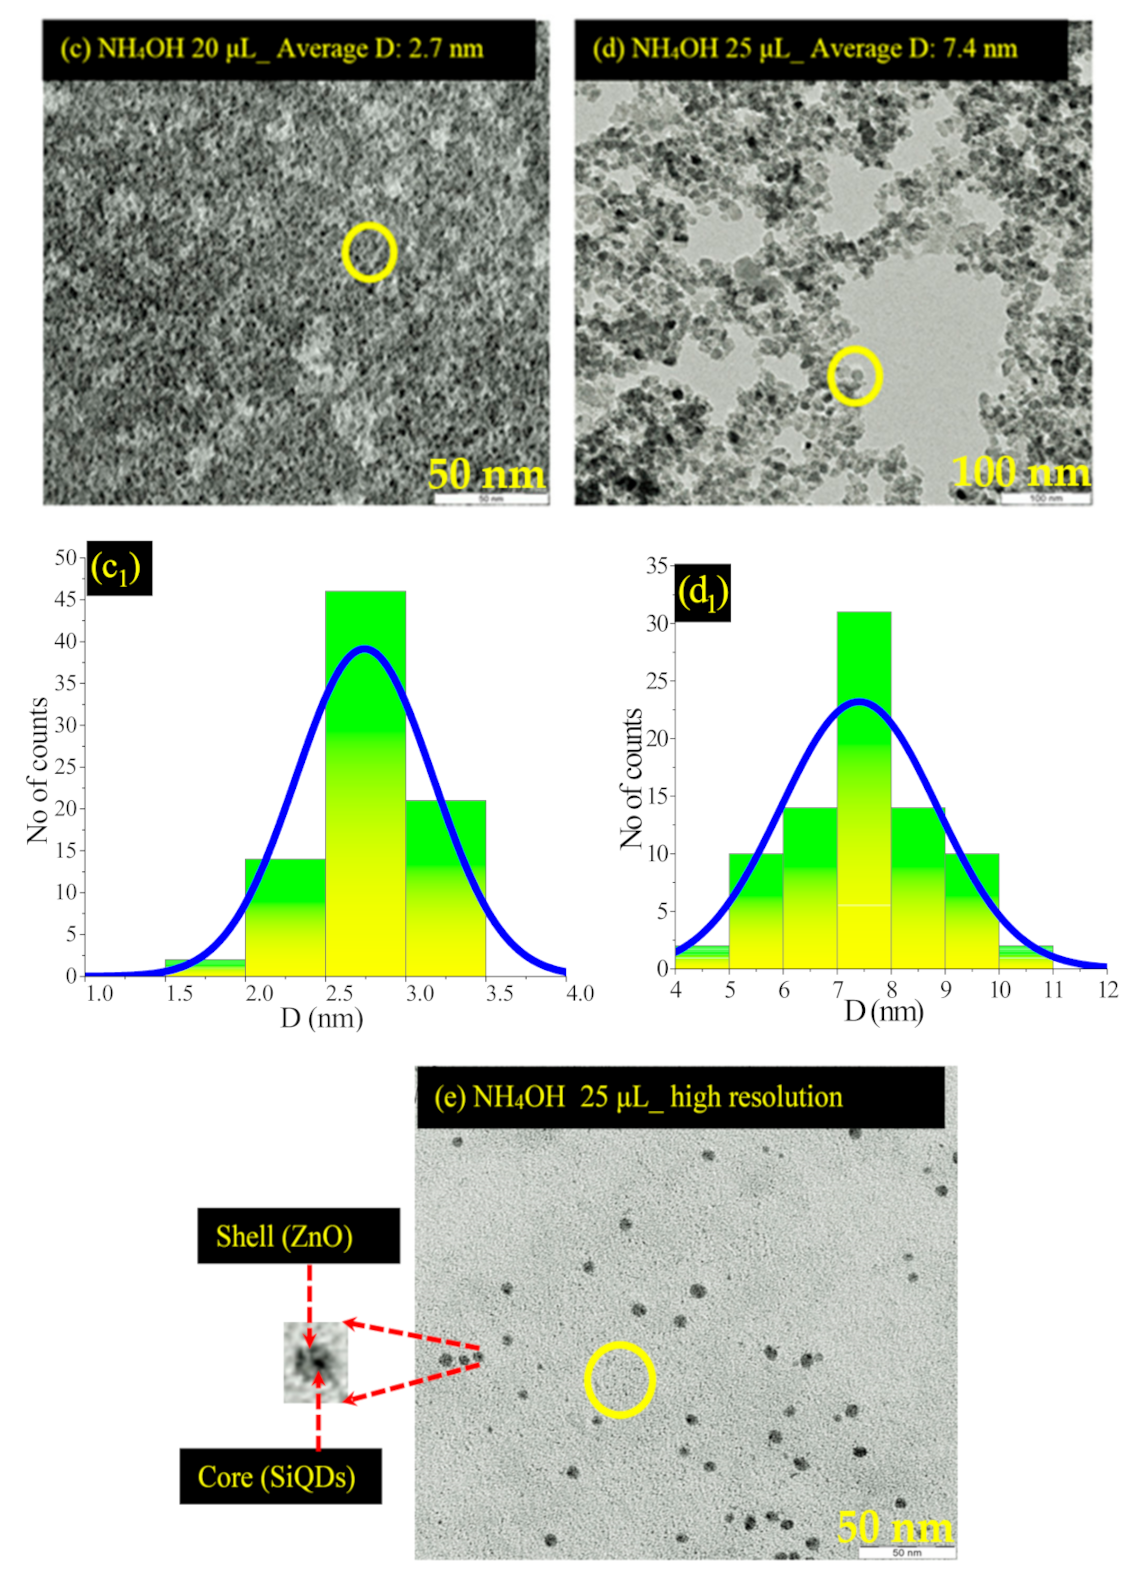
3.2. Morphology and Structure of ZnSiQDs
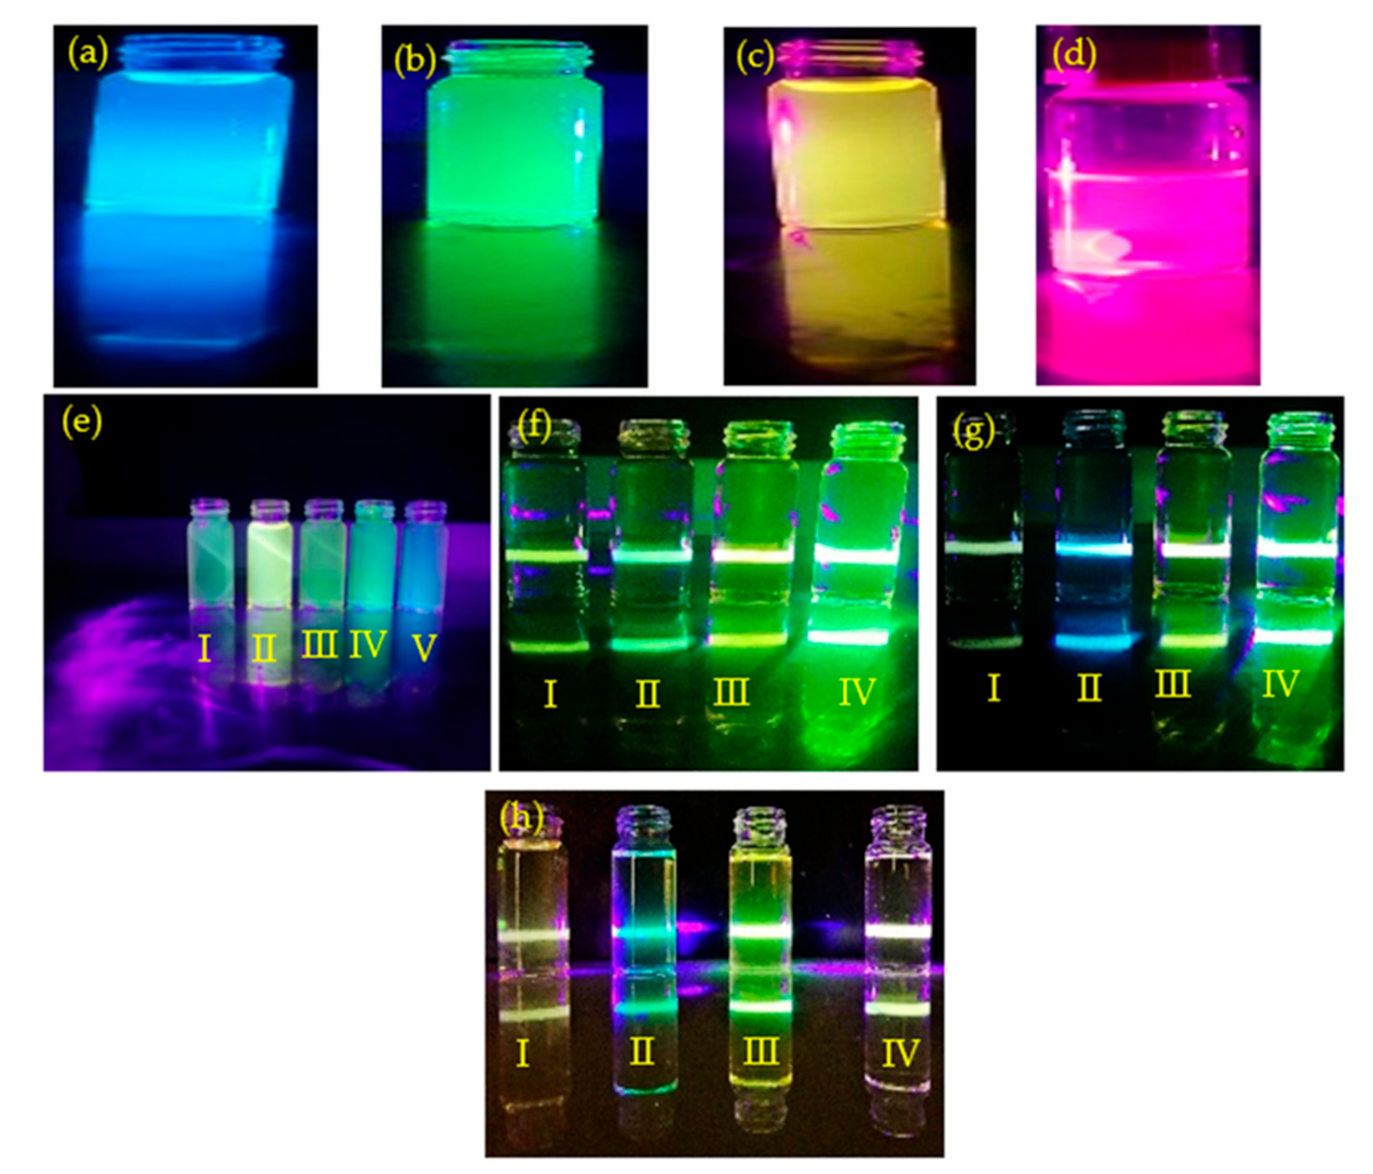
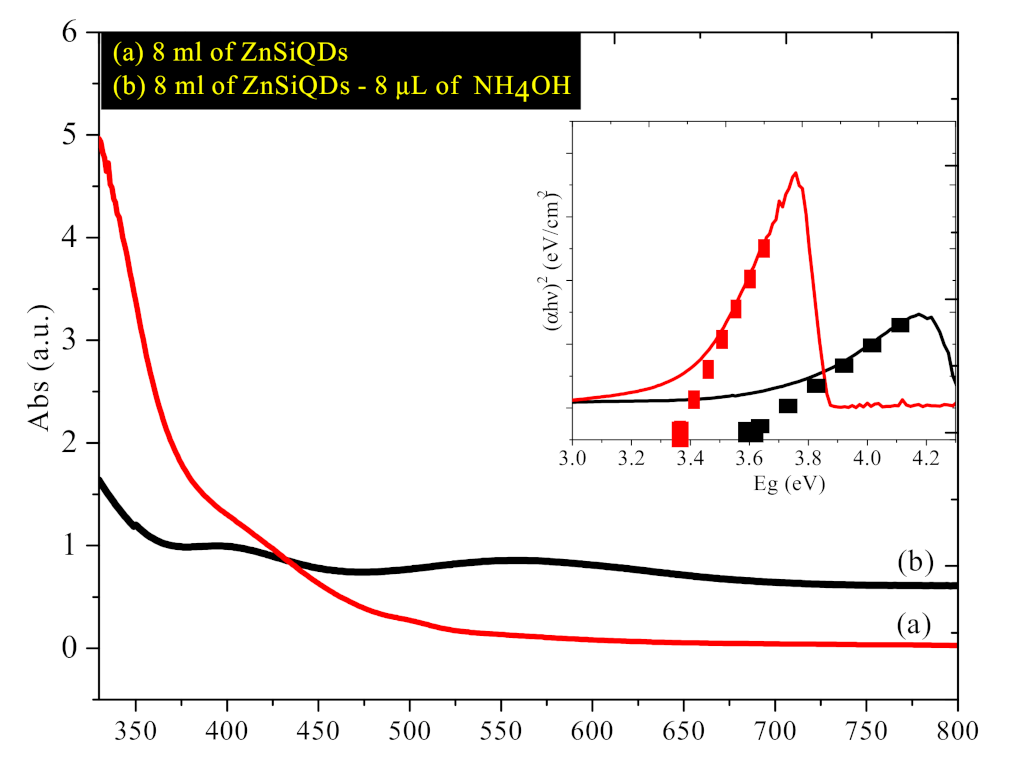
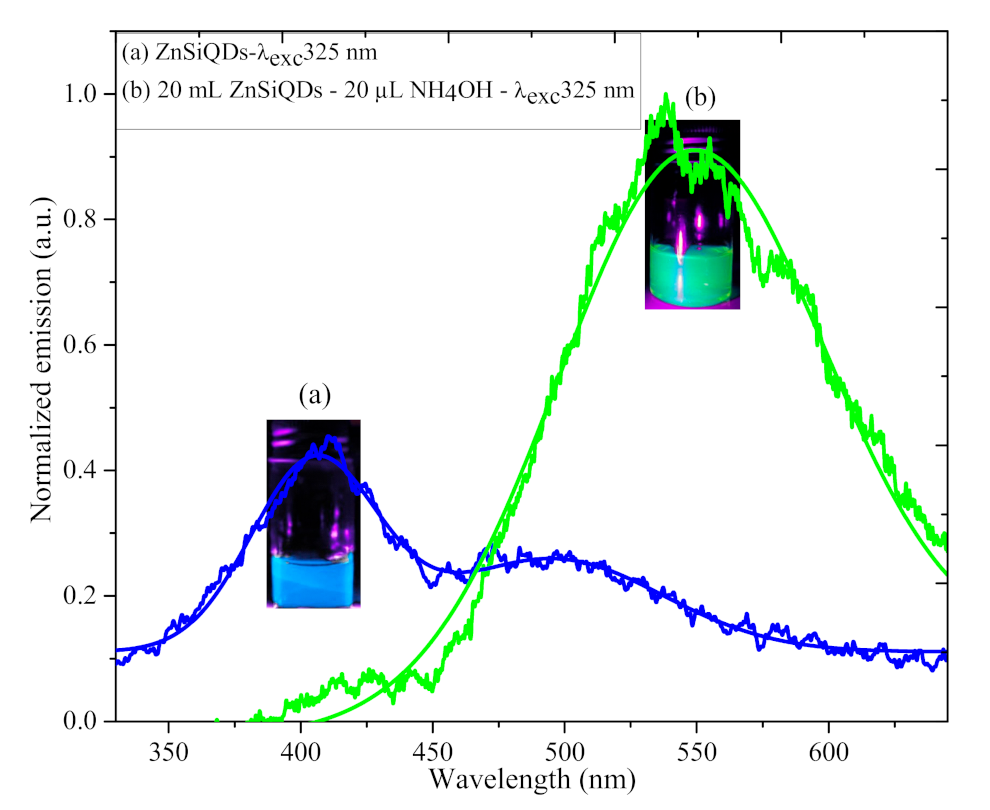
3.3. Optical Characteristics of ZnSiQDs
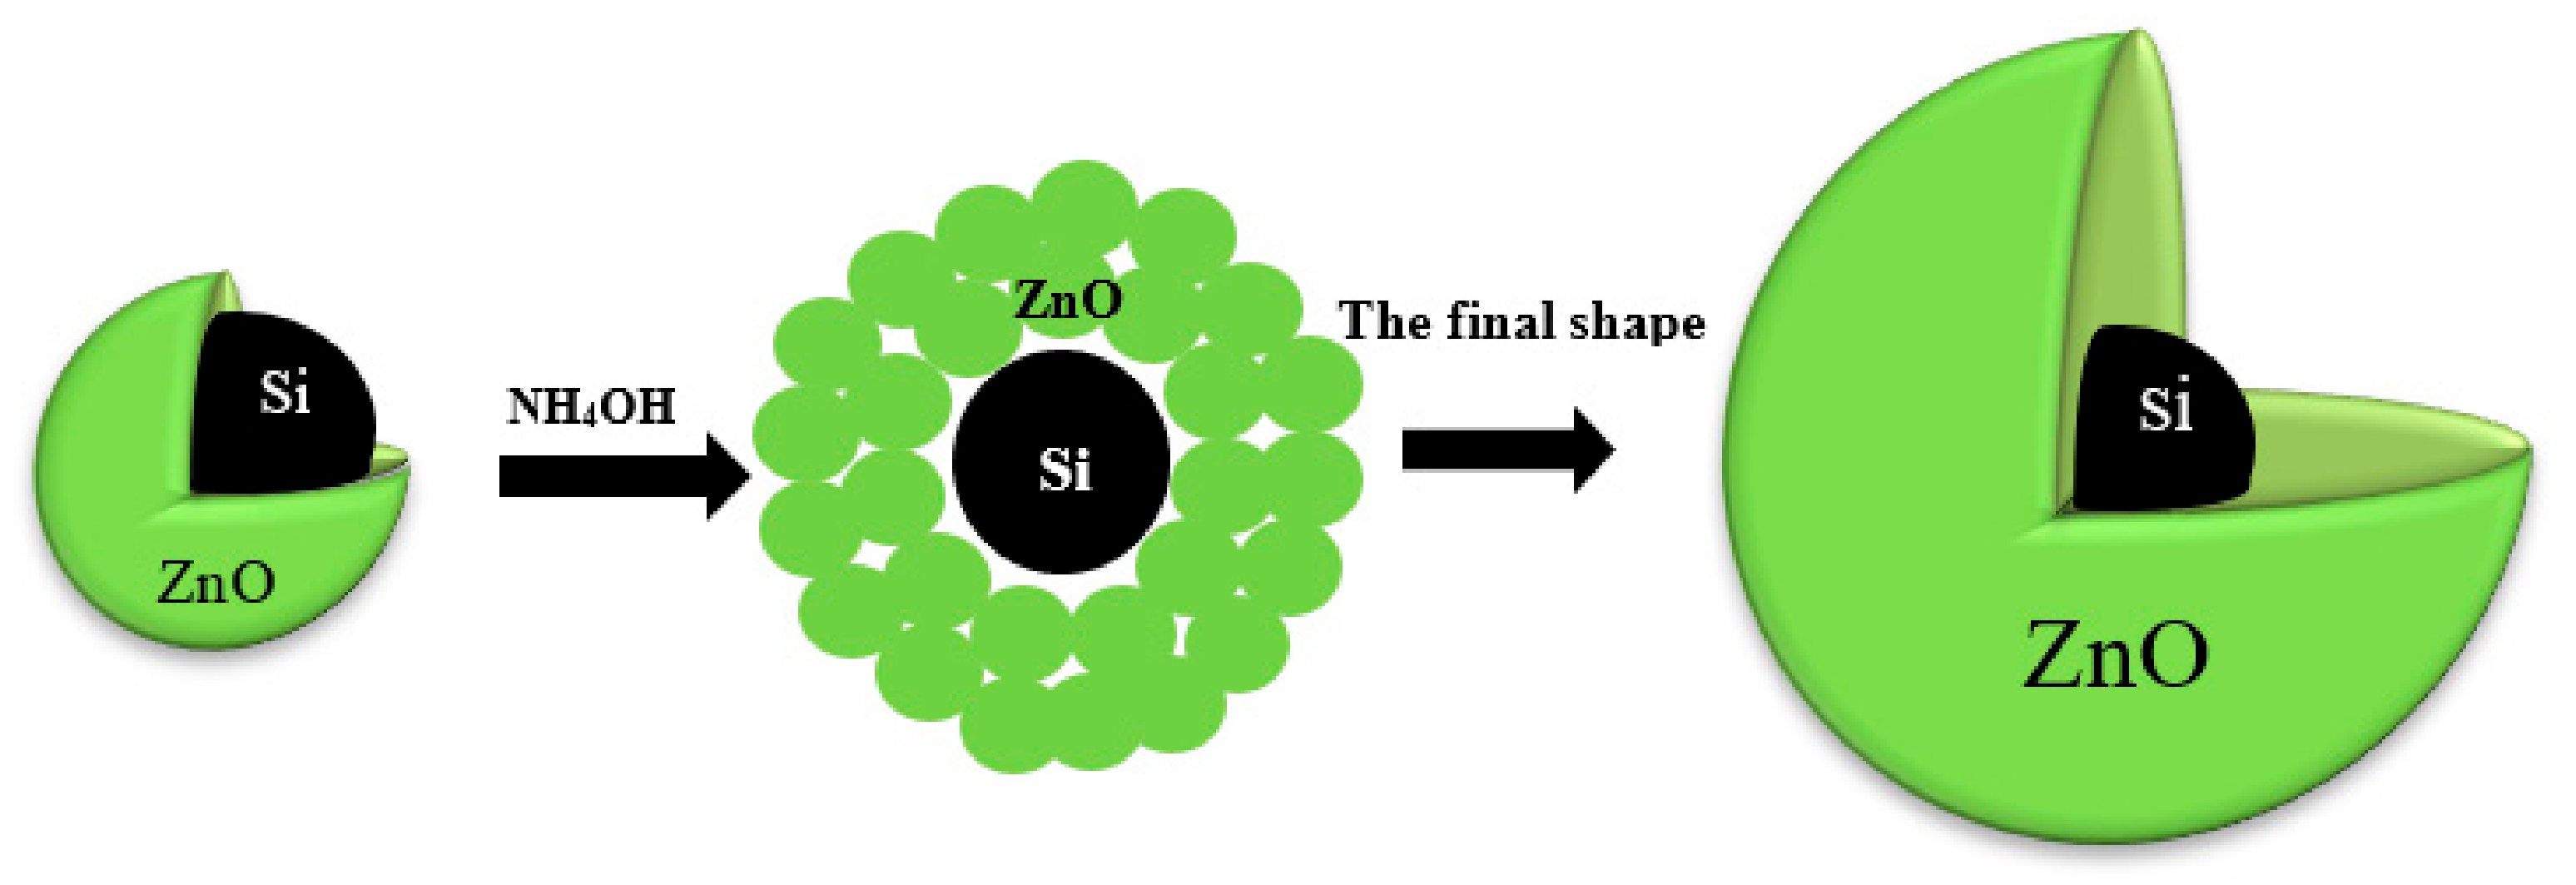
3.4. Mechanism of ZnSiQDs Formation with NH4OH
4. Conclusions
Author Contributions
Funding
Acknowledgments
Conflicts of Interest
References
- Rizzi, F.; Castaldo, R.; Latronico, T.; Lasala, P.; Gentile, G.; Lavorgna, M.; Striccoli, M.; Agostiano, A.; Comparelli, R.; Depalo, N.; et al. High Surface Area Mesoporous Silica Nanoparticles with Tunable Size in the Sub-Micrometer Regime: Insights on the Size and Porosity Control Mechanisms. Molecules 2021, 26, 4247. [Google Scholar] [CrossRef] [PubMed]
- Mangolini, L. Synthesis, properties, and applications of silicon nanocrystals. J. Vac. Sci. Technol. B 2013, 31, 020801. [Google Scholar] [CrossRef]
- Ghosh, B.; Shirahata, N. Colloidal silicon quantum dots: Synthesis and luminescence tuning from the near-UV to the near-IR range. Sci. Technol. Adv. Mater. 2014, 15, 014207. [Google Scholar] [CrossRef] [PubMed]
- Terada, S.; Xin, Y.; Saitow, K.-I. Cost-Effective Synthesis of Silicon Quantum Dots. Chem. Mater. 2020, 32, 8382–8392. [Google Scholar] [CrossRef]
- Kang, Z.; Tsang, A.C.H.; Zhang, Z.; Zhang, M.; Wong, N.-B.; Zapien, J.A.; Shan, Y.; Lee, S.-T. A Polyoxometalate-Assisted Electrochemical Method for Silicon Nanostructures Preparation: From Quantum Dots to Nanowires. J. Am. Chem. Soc. 2007, 129, 5326–5327. [Google Scholar] [CrossRef]
- Heinrich, J.L.; Curtis, C.L.; Credo, G.M.; Sailor, M.J.; Kavanagh, K.L. Luminescent Colloidal Silicon Suspensions from Porous Silicon. Science 1992, 255, 66–68. [Google Scholar] [CrossRef]
- Roy, D.; Mukhuty, A.; Fouzder, C.; Bar, N.; Chowdhury, S.; Kundu, R.; Chowdhury, P. Multi-emissive biocompatible silicon quantum dots: Synthesis, characterization, intracellular imaging and improvement of two fold drug efficacy. Dye. Pigment. 2020, 186, 109004. [Google Scholar] [CrossRef]
- Sychugov, I.; Pevere, F.; Luo, J.-W.; Zunger, A.; Linnros, J. Single-dot absorption spectroscopy and theory of silicon nanocrystals. Phys. Rev. B 2016, 93, 161413. [Google Scholar] [CrossRef] [Green Version]
- Almomani, M.S.; Ahmed, N.M.; Rashid, M.; Almessiere, M.; Altowyan, A.S. Broadband visible emission from photoelectrochemical etched porous silicon quantum dots containing zinc. Mater. Chem. Phys. 2020, 258, 123935. [Google Scholar] [CrossRef]
- Yamada, H.; Saitoh, N.; Ghosh, B.; Masuda, Y.; Yoshizawa, N.; Shirahata, N.E. Improved Brightness and Color Tunability of Solution-Processed Silicon Quantum Dot Light-Emitting Diodes. J. Phys. Chem. C 2020, 124, 23333–23342. [Google Scholar] [CrossRef]
- Norazmi, F.S.; Chaudhary, K.T.; Mazalan, E.; Hader, Z.; Ali, J. Effect of various amount of ammonium hydroxide on morphology of silica nanoparticles grown by sol-gel. Malays. J. Fundam. Appl. Sci. 2018, 14, 482–484. [Google Scholar] [CrossRef]
- Sasirekha, N.; Rajesh, B.; Chen, Y.-W. Synthesis of TiO2 sol in a neutral solution using TiCl4 as a precursor and H2O2 as an oxidizing agent. Thin Solid Films 2009, 518, 43–48. [Google Scholar] [CrossRef]
- Harris, M.T.; Brunson, R.R.; Byers, C.H. The base-catalyzed hydrolysis and condensation reactions of dilute and concentrated TEOS solutions. J. Non-Cryst. Solids 1990, 121, 397–403. [Google Scholar] [CrossRef]
- Peternele, W.S.; Fuentes, V.M.; Fascineli, M.L.; Da Silva, J.R.; Silva, R.C.; Lucci, C.; De Azevedo, R.B. Experimental Investigation of the Coprecipitation Method: An Approach to Obtain Magnetite and Maghemite Nanoparticles with Improved Properties. J. Nanomater. 2014, 2014, 94. [Google Scholar] [CrossRef] [Green Version]
- Zeng, H.; Zhai, L.; Qiao, T.; Yu, Y.; Zhang, J.; Li, D. Efficient removal of As(V) from aqueous media by magnetic nanoparticles prepared with Iron-containing water treatment residuals. Sci. Rep. 2020, 10, 9335. [Google Scholar] [CrossRef]
- Almomani, M.S.; Ahmed, N.M.; Rashid, M.; Almessiere, M.A.; Altowyan, A.S. White, blue and green emission from Si QDs derived from zinc incorporated porous silicon. J. Lumin. 2020, 232, 117845. [Google Scholar] [CrossRef]
- Green, D.; Lin, J.; Lam, Y.-F.; Hu, M.; Schaefer, D.W.; Harris, M. Size, volume fraction, and nucleation of Stober silica nanoparticles. J. Colloid Interface Sci. 2003, 266, 346–358. [Google Scholar] [CrossRef]
- Dalvand, R.; Mahmud, S.; Alimanesh, M.; Vakili, A.H. Optical and structural properties of well-aligned ZnO nanoneedle arrays grown on porous silicon substrates by electric field-assisted aqueous solution method. Ceram. Int. 2017, 43, 1488–1494. [Google Scholar] [CrossRef]
- Graniel, O.; Iatsunskyi, I.; Coy, E.; Humbert, C.; Barbillon, G.; Michel, T.; Maurin, D.; Balme, S.; Miele, P.; Bechelany, M. Au-Covered hollow urchin-Like ZnO nanostructures for surface-Enhanced Raman scattering sensing. J. Mater. Chem. C 2019, 7, 15066–15073. [Google Scholar] [CrossRef]
- Shirahata, N. Colloidal Si nanocrystals: A controlled organic–inorganic interface and its implications of color-tuning and chemical design toward sophisticated architectures. Phys. Chem. Chem. Phys. 2011, 13, 7284–7294. [Google Scholar] [CrossRef]
- Salcedo, W.J.; Braga, M.S.; Jaimes, R.F. Huge enhancement of photoluminescence emission from porous silicon film doped with Cr(III) ions. J. Lumin. 2018, 199, 109–111. [Google Scholar] [CrossRef]
- Koch, F.; Petrova-Koch, V.; Muschik, T. The luminescence of porous Si: The case for the surface state mechanism. J. Lumin. 1993, 57, 271–281. [Google Scholar] [CrossRef]
- Sarswat, P.K.; Free, M.L. Light emitting diodes based on carbon dots derived from food, beverage, and combustion wastes. Phys. Chem. Chem. Phys. 2015, 17, 27642–27652. [Google Scholar] [CrossRef]
- Brachmann, E.; Seifert, M.; Oswald, S.; Menzel, S.B.; Gemming, T. Evaluation of Surface Cleaning Procedures for CTGS Substrates for SAW Technology with XPS. Materials 2017, 10, 1373. [Google Scholar] [CrossRef] [Green Version]
- Joo, B.S.; Gu, M.; Han, J.; Jung, N.; Kim, S.; Park, D.-W.; Han, M. Decay time dynamics of red and blue luminescence of surface-functionalized silicon quantum dots. J. Lumin. 2021, 236, 118121. [Google Scholar] [CrossRef]
- Aslanov, L.A.; Zaytsev, V.B.; Zakharov, V.N.; Kudryavtsev, I.K.; Senyavin, V.M.; Lagov, P.B.; Pavlov, Y.S. Nanosilicon stabilized with ligands: Effect of high-energy electron beam on luminescent properties. Surf. Interface Anal. 2020, 52, 957–961. [Google Scholar] [CrossRef]
- Hussein, M.J.; Yunus, W.M.M.; Kamari, H.M.; Zakaria, A.; Oleiw, H.F. Effect of current density and etching time on photoluminescence and energy band gap of p-type porous silicon. Opt. Quantum Electron. 2016, 48, 194. [Google Scholar] [CrossRef]
- Ramesh, M.; Nagaraja, H. Effect of current density on morphological, structural and optical properties of porous silicon. Mater. Today Chem. 2017, 3, 10–14. [Google Scholar] [CrossRef]
- Ingham, B.; Toney, M.F. X-ray diffraction for characterizing metallic films. In Metallic Films for Electronic, Optical and Magnetic Applications: Structure, Processing and Properties; Elsevier: Amsterdam, The Netherlands, 2014; pp. 3–38. [Google Scholar]
- Barbagiovanni, E.; Lockwood, D.J.; Simpson, P.J.; Goncharova, L.V. Quantum confinement in Si and Ge nanostructures: Theory and experiment. Appl. Phys. Rev. 2014, 1, 011302. [Google Scholar] [CrossRef] [Green Version]
- Babu, K.S.; Reddy, A.R.; Sujatha, C.; Reddy, K.V.; Mallika, A.N. Synthesis and optical characterization of porous ZnO. J. Adv. Ceram. 2013, 2, 260–265. [Google Scholar] [CrossRef] [Green Version]
- Xiong, H.-M.; Shchukin, D.G.; Möhwald, H.; Xu, Y.; Xia, Y.-Y. Sonochemical Synthesis of Highly Luminescent Zinc Oxide Nanoparticles Doped with Magnesium(II). Angew. Chem. Int. Ed. 2009, 48, 2727–2731. [Google Scholar] [CrossRef] [PubMed]
- Nandi, S.K.; Chakraborty, S.; Bera, M.K.; Maiti, C.K. Structural and optical properties of ZnO films grown on silicon and their applications in MOS devices in conjunction with ZrO2 as a gate dielectric. Bull. Mater. Sci. 2007, 30, 247–254. [Google Scholar] [CrossRef]
- Suwatthanarak, T.; Than-Ardna, B.; Danwanichakul, D.; Danwanichakul, P. Synthesis of silver nanoparticles in skim natural rubber latex at room temperature. Mater. Lett. 2016, 168, 31–35. [Google Scholar] [CrossRef]
- Rashid, M.; Ahmed, N.M.; Noor, N.A.M.; Pakhuruddin, M.Z. Silicon quantum dot/black silicon hybrid nanostructure for broadband reflection reduction. Mater. Sci. Semicond. Process. 2020, 115, 105113. [Google Scholar] [CrossRef]
- Devine, R. Macroscopic and microscopic effects of radiation in amorphous SiO2. Nucl. Instrum. Methods Phys. Res. Sect. B Beam Interact. Mater. At. 1994, 91, 378–390. [Google Scholar] [CrossRef]
- Wagner, C.D.; Passoja, D.E.; Hillery, H.F.; Kinisky, T.G.; Six, H.A.; Jansen, W.T.; Taylor, J.A. Auger and photoelectron line energy relationships in aluminum–oxygen and silicon–oxygen compounds. J. Vac. Sci. Technol. 1982, 21, 933–944. [Google Scholar] [CrossRef]
- Dake, L.S.; Baer, D.R.; Zachara, J.M. Auger parameter measurements of zinc compounds relevant to zinc transport in the environment. Surf. Interface Anal. 1989, 14, 71–75. [Google Scholar] [CrossRef]
- Wu, J.; Dai, J.; Shao, Y.; Sun, Y. One-step synthesis of fluorescent silicon quantum dots (Si-QDs) and their application for cell imaging. RSC Adv. 2015, 5, 83581–83587. [Google Scholar] [CrossRef]
- Fujii, M.; Minami, A.; Sugimoto, H. Precise size separation of water-soluble red-to-near-infrared-luminescent silicon quantum dots by gel electrophoresis. Nanoscale 2020, 12, 9266–9271. [Google Scholar] [CrossRef]
- Proot, J.P.; Delerue, C.; Allan, G. Electronic structure and optical properties of silicon crystallites: Application to porous silicon. Appl. Phys. Lett. 1992, 61, 1948–1950. [Google Scholar] [CrossRef]
- Cheng, X.; Lowe, S.B.; Reece, P.J.; Gooding, J.J. Colloidal silicon quantum dots: From preparation to the modification of self-assembled monolayers (SAMs) for bio-applications. Chem. Soc. Rev. 2014, 43, 2680–2700. [Google Scholar] [CrossRef] [Green Version]
- Peng, X.; Manna, L.; Yang, W.; Wickham, J.; Scher, E.; Kadavanich, A.; Alivisatos, A.P. Shape control of CdSe nanocrystals. Nature 2000, 404, 59–61. [Google Scholar] [CrossRef] [PubMed]
- Taheri, M.; Mansour, N. Silicon Nanoparticles Produced by Two-Step Nanosecond Pulsed Laser Ablation in Ethanol for Enhanced Blue Emission Properties. Silicon 2019, 12, 789–797. [Google Scholar] [CrossRef]
- Jacobsson, T.J.; Viarbitskaya, S.; Mukhtar, E.; Edvinsson, T. A size dependent discontinuous decay rate for the exciton emission in ZnO quantum dots. Phys. Chem. Chem. Phys. 2014, 16, 13849–13857. [Google Scholar] [CrossRef]
- Singh, M.; Goyal, M.; Devlal, K. Size and shape effects on the band gap of semiconductor compound nanomaterials. J. Taibah Univ. Sci. 2018, 12, 470–475. [Google Scholar] [CrossRef] [Green Version]
- Thein, M.T.; Pung, S.-Y.; Aziz, A.; Itoh, M. The role of ammonia hydroxide in the formation of ZnO hexagonal nanodisks using sol–gel technique and their photocatalytic study. J. Exp. Nanosci. 2014, 10, 1068–1081. [Google Scholar] [CrossRef] [Green Version]
- van Dijken, A.; Meulenkamp, E.; Vanmaekelbergh, D.; Meijerink, A. The luminescence of nanocrystalline ZnO particles: The mechanism of the ultraviolet and visible emission. J. Lumin. 2000, 87–89, 454–456. [Google Scholar] [CrossRef]


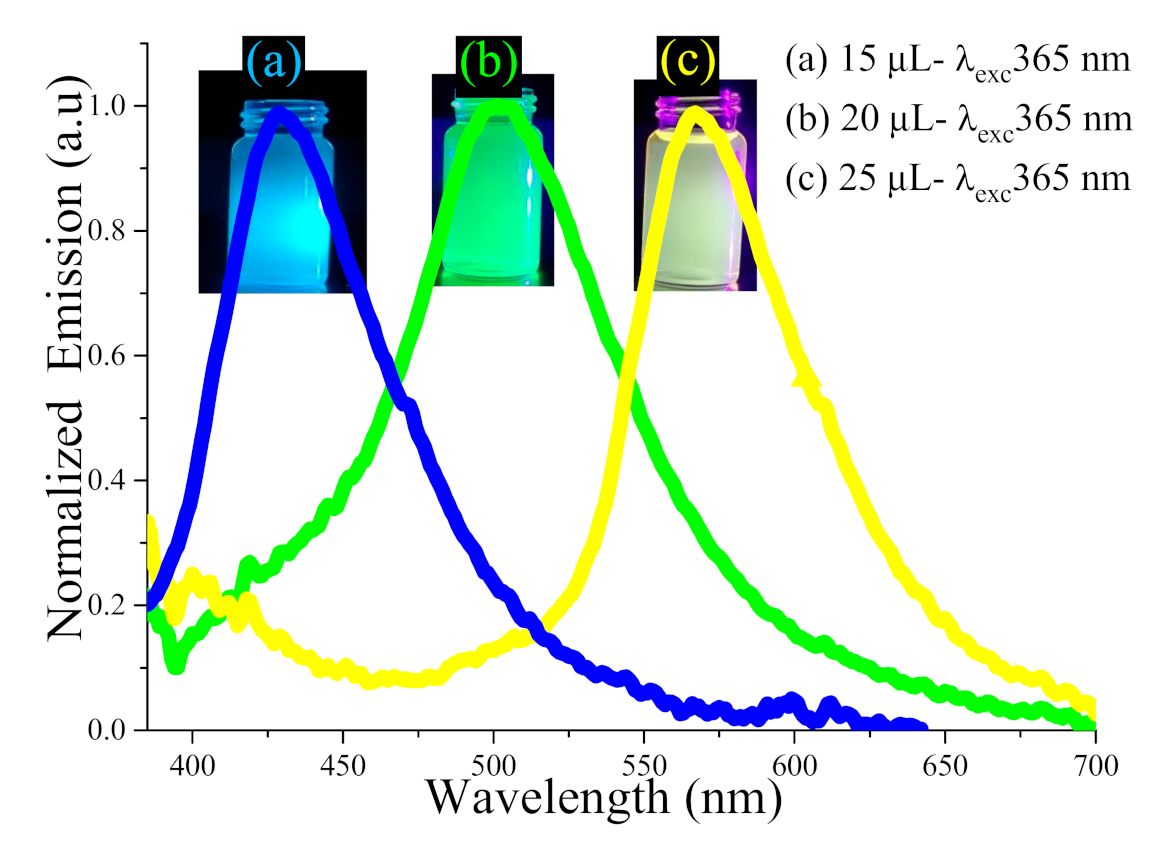
| NH4OH (µL) | λpeak (nm) | FWHM (nm) |
|---|---|---|
| 15 | 428 | 68 |
| 20 | 501 | 87 |
| 25 | 567 | 80 |
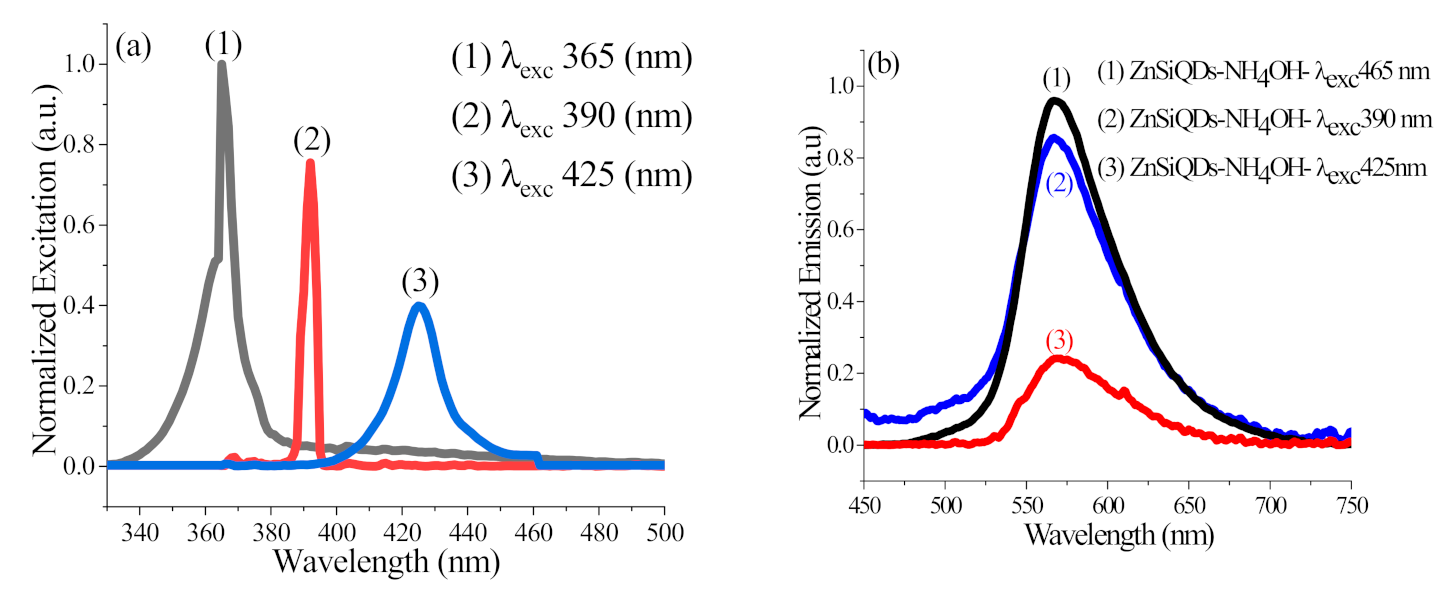
| λexc (nm) | λpeak (nm) | FWHM (nm) |
|---|---|---|
| 425 | 567 | 70 |
| 390 | 567 | 57 |
| 365 | 567 | 62 |
Publisher’s Note: MDPI stays neutral with regard to jurisdictional claims in published maps and institutional affiliations. |
© 2021 by the authors. Licensee MDPI, Basel, Switzerland. This article is an open access article distributed under the terms and conditions of the Creative Commons Attribution (CC BY) license (https://creativecommons.org/licenses/by/4.0/).
Share and Cite
Almomani, M.S.; Ahmed, N.M.; Rashid, M.; Ali, M.K.M.; Akhdar, H.; Aldaghri, O.; Ibnaouf, K.H. Enhancement of Temperature Fluorescence Brightness of Zn@Si Core-Shell Quantum Dots Produced via a Unified Strategy. Nanomaterials 2021, 11, 3158. https://0-doi-org.brum.beds.ac.uk/10.3390/nano11113158
Almomani MS, Ahmed NM, Rashid M, Ali MKM, Akhdar H, Aldaghri O, Ibnaouf KH. Enhancement of Temperature Fluorescence Brightness of Zn@Si Core-Shell Quantum Dots Produced via a Unified Strategy. Nanomaterials. 2021; 11(11):3158. https://0-doi-org.brum.beds.ac.uk/10.3390/nano11113158
Chicago/Turabian StyleAlmomani, Mohammad S., Naser M. Ahmed, Marzaini Rashid, M. K. M. Ali, H. Akhdar, O. Aldaghri, and K. H. Ibnaouf. 2021. "Enhancement of Temperature Fluorescence Brightness of Zn@Si Core-Shell Quantum Dots Produced via a Unified Strategy" Nanomaterials 11, no. 11: 3158. https://0-doi-org.brum.beds.ac.uk/10.3390/nano11113158