Article

Amorphous MoSxOy/h-BNxOy Nanohybrids: Synthesis and Dye Photodegradation

by
Andrei T. Matveev
1,*,
Anton S. Konopatsky
1,
Denis V. Leybo
1,
Ilia N. Volkov
1,
Andrey M. Kovalskii
1,
Liubov A. Varlamova
1,
Pavel B. Sorokin
1,
Xiaosheng Fang
2,
Sergei A. Kulinich
3,4,* and
Dmitry V. Shtansky
1
1
Laboratory of Inorganic Nanomaterials, National University of Science and Technology “MISIS”, Leninskiy Prospect 4, 119049 Moscow, Russia
2
Department of Materials Science, Fudan University, Shanghai 200433, China
3
Research Institute of Science and Technology, Tokai University, Hiratsuka 259-1292, Kanagawa, Japan
4
School of Engineering, Far Eastern Federal University, 690041 Vladivostok, Russia
*
Authors to whom correspondence should be addressed.
Nanomaterials 2021, 11(12), 3232; https://0-doi-org.brum.beds.ac.uk/10.3390/nano11123232
Submission received: 2 November 2021 / Revised: 22 November 2021 / Accepted: 24 November 2021 / Published: 28 November 2021

Abstract

:
Molybdenum sulfide is a very promising catalyst for the photodegradation of organic pollutants in water. Its photocatalytic activity arises from unsaturated sulfur bonds, and it increases with the introduction of structural defects and/or oxygen substitutions. Amorphous molybdenum sulfide (a-MoSxOy) with oxygen substitutions has many active sites, which create favorable conditions for enhanced catalytic activity. Here we present a new approach to the synthesis of a-MoSxOy and demonstrate its high activity in the photodegradation of the dye methylene blue (MB). The MoSxOy was deposited on hexagonal boron oxynitride (h-BNO) nanoflakes by reacting h-BNO, MoCl5, and H2S in dimethylformamide (DMF) at 250 °C. Both X-ray diffraction analysis and high-resolution TEM show the absence of crystalline order in a-MoSxOy. Based on the results of Raman and X-ray photoelectron spectroscopy, as well as analysis by the density functional theory (DFT) method, a chain structure of a-MoSxOy was proposed, consisting of MoS3 clusters with partial substitution of sulfur by oxygen. When a third of the sulfur atoms are replaced with oxygen, the band gap of a-MoSxOy is approximately 1.36 eV, and the valence and conduction bands are 0.74 eV and −0.62 eV, respectively (relative to a standard hydrogen electrode), which satisfies the conditions of photoinduced splitting of water. When illuminated with a mercury lamp, a-MoSxOy/h-BNxOy nanohybrids have a specific mass activity in MB photodegradation of approximately 5.51 mmol g−1 h−1, which is at least four times higher than so far reported values for nonmetal catalysts. The photocatalyst has been shown to be very stable and can be reused.

Graphical Abstract

1. Introduction

Overall, solar dissociation of water can be expressed by two half reactions: the hydrogen evolution reaction (HER) and the oxygen evolution reaction (OER). HER is being thoroughly investigated as a potential green energy source that could reduce the environmental crisis caused by carbon dioxide emissions from the use of hydrocarbons for energy production. Pollution of the aquatic environment by industrial emissions, as well as wastes from the chemical, pharmaceutical and cosmetic industries lead to catastrophic consequences for the flora and fauna [1]. OER not only generates oxygen gas, but is also used to purify and sterilize water through the generation of reactive oxygen species. Photocatalytic degradation by sunlight using safe catalytic materials is a green technology with minimal environmental impact. To increase the efficiency of solar energy harvesting new materials, their microstructure, chemical composition, electronic band structure, as well as heterojunction with other materials and architecture of photoelectrochemical cells are being thoroughly studied [2,3,4].
In recent years, molybdenum disulfide has been actively studied as a catalyst for photo- and electrochemical processes, such as HER [5,6]. Both theoretical and experimental studies show that its activity in HER arises from the presence of unsaturated sulfur at the edges [5,6,7]. Thus, decreasing the size of MoS2 clusters is a promising strategy for increasing catalyst efficiency. In addition to edge defects, the disordered crystal structure provides many active sites with complex atomic configurations that increase activity [6]. The high catalytic activity of amorphous molybdenum sulfide has been proven, which is explained by the high density of active centers in the disordered structure [7,8,9,10]. Another widely used approach is to adjust local charge distribution by atomic substitutions [11]. In the case of molybdenum sulfide, it was shown that the incorporation of oxygen in the MoS2 structure leads to a noticeable increase in the HER activity [8,10]. An increased reactivity of hydrogen evolution was observed in oxygen-incorporated MoS2-based nanostructures, obtained as a result of the interfacial reaction between MoS2 and MoO3 [12]. With the use of MoS2/WS2 heterostructures, the possibility of hydrogen formation in seawater under sunlight has recently been shown [13]. Thus, structural disorder and oxygen substitutions in molybdenum sulfide, as well as the adjacent of its energy bands due to interaction with other materials, are a prerequisite for high catalytic activity in HER.
In addition to its high activity in HER, molybdenum sulfide also has a high activity in the OER. Computational analysis of the positions of the conduction and valence band edges of single-layer MoS2 predicted that it is a potential photocatalyst for water splitting [14,15]. Shortly thereafter, it was confirmed that MoS2 exhibits excellent OER performance in acidic solution, the 1T-MoS2 polymorph exhibits catalytic efficiency comparable to the most well-known IrO2 electrocatalyst, and DFT calculations showed that the activity originates from edge sites [16,17,18]. Atomically thin MoS2 layers oxidize water when exposed to sunlight in an acidic environment, releasing O2 gas [19]. Remarkable OER activity was found in MoS2 quantum dots. Theoretical analysis showed that in this case, the vertices are active sites, and sulfur vacancies play an important role in the catalytic activity [20]. Nanostructured molybdenum sulfide appears to be a very promising material for photodegradation of anthropogenic organic waste [21,22,23]. At the same time, it was noted that the photooxidative ability of MoS2 is impeded by insufficient generation of ·OH radicals and this obstacle can be overcome by creating heterojunctions [24]. More recently, an increase in overall water splitting was demonstrated through the design of heterogeneous interfaces in CoS/MoS2 binary composites [25].
Amorphous molybdenum sulfide (a-MoSx) films were obtained by various physical deposition methods, such as magnetron sputtering, pulsed laser deposition, and atomic layer deposition [26,27]. These methods are difficult to adapt for film deposition on the surface of dispersed powders. An alternative strategy is to obtain a-MoSx films in an aqueous media using a chemical reaction with MoO3. For example, a-MoSx thin films were prepared at room temperature by electrochemical deposition from aqueous solutions [28,29]. a-MoS3 powder containing MoS2 domains was synthesized by wet chemistry in an acidic aqueous media at room temperature [11]. The hydrothermal process was also used to synthesize a-MoSx quantum dots [30]. All these chemical methods were carried out in aqueous media, and the synthesis of molybdenum sulfide occurred due to the reduction of MoO3 clusters. This largely determines the direction of chemical transformations and consequently, the local atomic structure of the resulting product.
In this paper, we have developed a new method for the synthesis of a-MoSxOy/h-BNxOy nanohybrids and studied their activity in the process of photodegradation of methylene blue (MB) as a model organic pollutant. Nanohybrid materials were synthesized by a chemical reaction between h-BNxOy, MoCl5 and H2S dissolved in dimethylformamide (DMF). The main difference of this method is that the synthesis of molybdenum sulfide proceeds through the reaction of MoCl5 with H2S, and the MoO3 clusters are not involved in the synthesis. This can lead to a different local atomic order compared to the reduction of MoO3. The use of liquid media for synthesis provides homogeneous deposition of a-MoSxOy, and a relatively low synthesis temperature ensures its amorphous state. h-BN was chosen as a substrate because of its pronounced synergistic properties as an adsorbent-photoactive material [31]. Oxygen-substituted BN (h-BNxOy) was used because of its improved wettability. In addition, the reaction of oxygen defects with sulfur results in the formation of S-doped BN, which itself has impressive photodegradation efficiency even under visible light illumination [32].
Herein, nanohybrids based on amorphous molybdenum oxysulfide (a-MoOxSy) and hexagonal boron nitride (h-BN) are studied as a promising photocatalytic material. Both components are non-toxic and chemically stable [33,34]. h-BN is very slowly hydrolyzed in water to form boric acid, which has antimicrobial and antibacterial properties. Molybdenum oxysulfide is a narrow bandgap semiconductor, while BN is a wide bandgap semiconductor that maximizes the use of the solar spectrum in both the visible and ultraviolet regions.

2. Materials and Methods

2.1. Raw Materials

h-BNxOy nanopowder (Plasmotherm, Moscow, Russia) consisted of nanoflakes with a thickness of several atomic layers and a lateral size of approximately 20 nm. As-received material was dried under vacuum at 200 °C for 3 h to remove absorbed water.
Chemical grade dimethylformamide (DMF, 99.9% purity) was used as the medium for the synthesis of a-MoSxOy/h-BNxOy nanohybrids. DMF was chosen because of its high ability to dissolve both MoCl5 and H2S. Among common solvents, DMF has almost the highest solubility for hydrogen sulfide—at 25 °C 1 mol of DMF dissolves 0.12 mol of H2S [35]. It has also been reported that the dielectric constant of DMF over 99.8% purity at 25 °C is 37.3 [36], which allows microwave heating to be used instead of conventional heating in a resistive oven. This makes the synthesis process more flexible.

2.2. Fabrication of a-MoSxOy/h-BNxOy Nanohybrids

DMF was dried for one week using silica gel, then 50 mL of dried DMF was poured into a thin long tube and hydrogen disulfide was bubbled through the liquid for at least 40 min to ensure complete saturation, which is reached in less than 20 min [31]. Hydrogen disulfide was prepared by heating of a mixture of paraffin (5 g) and sulfur (3 g) at 200 °C using an Ar flow (99.99%) as a transport gas. 0.5 g of MoCl5 was dissolved in 20 mL of dried DMF, then 1 mL of this solution with 30 mL of DMF saturated with H2S, and 300 mg of dried h-BNxOy nanopowder were placed in a Teflon vessel in a microwave oven (ETHOS EASY, Milestone S.r.l., Sorisole, Italy) and tightly closed. All manipulations were carried out in an Ar atmosphere. The vessel was subjected to microwave heating to a temperature of 250 °C at a rate of 15 °C/min and held at this temperature for 30 min, after which it was allowed to cool spontaneously. The temperature during the experiment was controlled by a thermocouple immersed in the liquid. This selected synthesis temperature is below the temperature at which the formation of crystalline molybdenum sulfide from MoCl5 and H2S was observed during the chemical vapor deposition (CVD) process [37]. After synthesis, the liquid turned black and had pH of 8. The resulting product was thoroughly washed, first five times in distilled water, and then several times in ethanol using an ultrasound bath. After centrifugation, the powder was dried under vacuum at 200 °C. The powder thus obtained was gray in color.

2.3. Material Characterization

Chemical analysis of a-MoSxOy was performed using an iCAP 6300 inductively coupled plasma atomic emission spectroscope (Thermo Fisher Scientific Inc., Waltham, MA, USA). The microstructure and distribution of elements were studied using scanning transmission electron microscopy (STEM) and high-angle annular dark-field imaging (HAADF) in combination with energy dispersive X-ray spectroscopy (EDXS) using a Tecnai Osiris S/TEM 200 kV microscope (FEI, Hillsboro, OR, USA). The phase composition was determined on a SmartLab diffractometer (Rigaku, Tokyo, Japan) using Cu-Kα radiation and a graphite monochromator. X-ray diffraction (XRD) patterns were recorded in the symmetrical mode and analyzed using PDXL software (Rigaku). Fourier-transform infrared (FTIR) spectra were recorded on powder samples using a Vertex 70v vacuum spectrometer (Bruker, Billerica, MA, USA) in the range of 400–4000 cm−1 using a partial internal reflection device. Raman spectra were collected using a DXR3 Raman spectrometer (Thermo Fisher Scientific Inc.) with a wavelength of 532 nm. Surface chemical bonds were analyzed by means of X-ray photoelectron spectroscopy (XPS) using a Versa Probe III (PHI, 18725 Lake Drive East, Chanhassen, MN 55317, USA) equipped with a monochromatic Al Kα X-ray source (hν =1486.6 eV). The binding energy values were calibrated using the C 1s line (284.8 eV) derived from the adventitious carbon. The spectra were processed in the Casa XPS.

2.4. Photocatalytic Measurements

For photocatalytic measurements, 6 mg of the synthesized MoSxOy/h-BNxOy nanohybrids and 1 mg of methylene blue (MB) were dissolved in 50 mL of distilled water in quartz glass and dispersed in an ultrasound bath for 5 min. pH of the solution was neutral. Then the mixture was stirred with a magnetic stirrer for 30 min until the sorption-desorption equilibrium was reached. All these manipulations were carried out in the dark. The resulting solution was illuminated with UV radiation for 60 min using a mercury lamp (145 W) with constant stirring. Photocatalytic degradation was analyzed by measuring the intensity of the ultraviolet-visible (UV-vis) absorption spectra recorded on a UVmini-1240 spectrophotometer (Shimadzu). During irradiation, 1 mL of the filtered solution was taken after 5, 15, 30 and 60 min. For comparison, the photocatalytic degradation of the initial h-BNxOy nanoparticles (without MoSxOy) was studied using the same protocol. The specific catalyst mass activity was calculated as the number of moles of degraded MB divided by the weight of catalyst (calculated for the weight of a-MoSxOy) per hour. The stability and reusability of the photocatalysts were evaluated using three consequent photocatalytic degradation tests. After each test, the catalyst was collected by centrifugation and placed in fresh dye solution without washing for retesting.

2.5. DFT Analysis

Density functional theory (DFT) calculations were performed in the Viena Ab initio Simulation Package (VASP, version 5.4.4) with the Perdew–Burke-Ernzerhof (PBE) functional and a plane wave cutoff of 400 eV [38,39,40].

3. Results

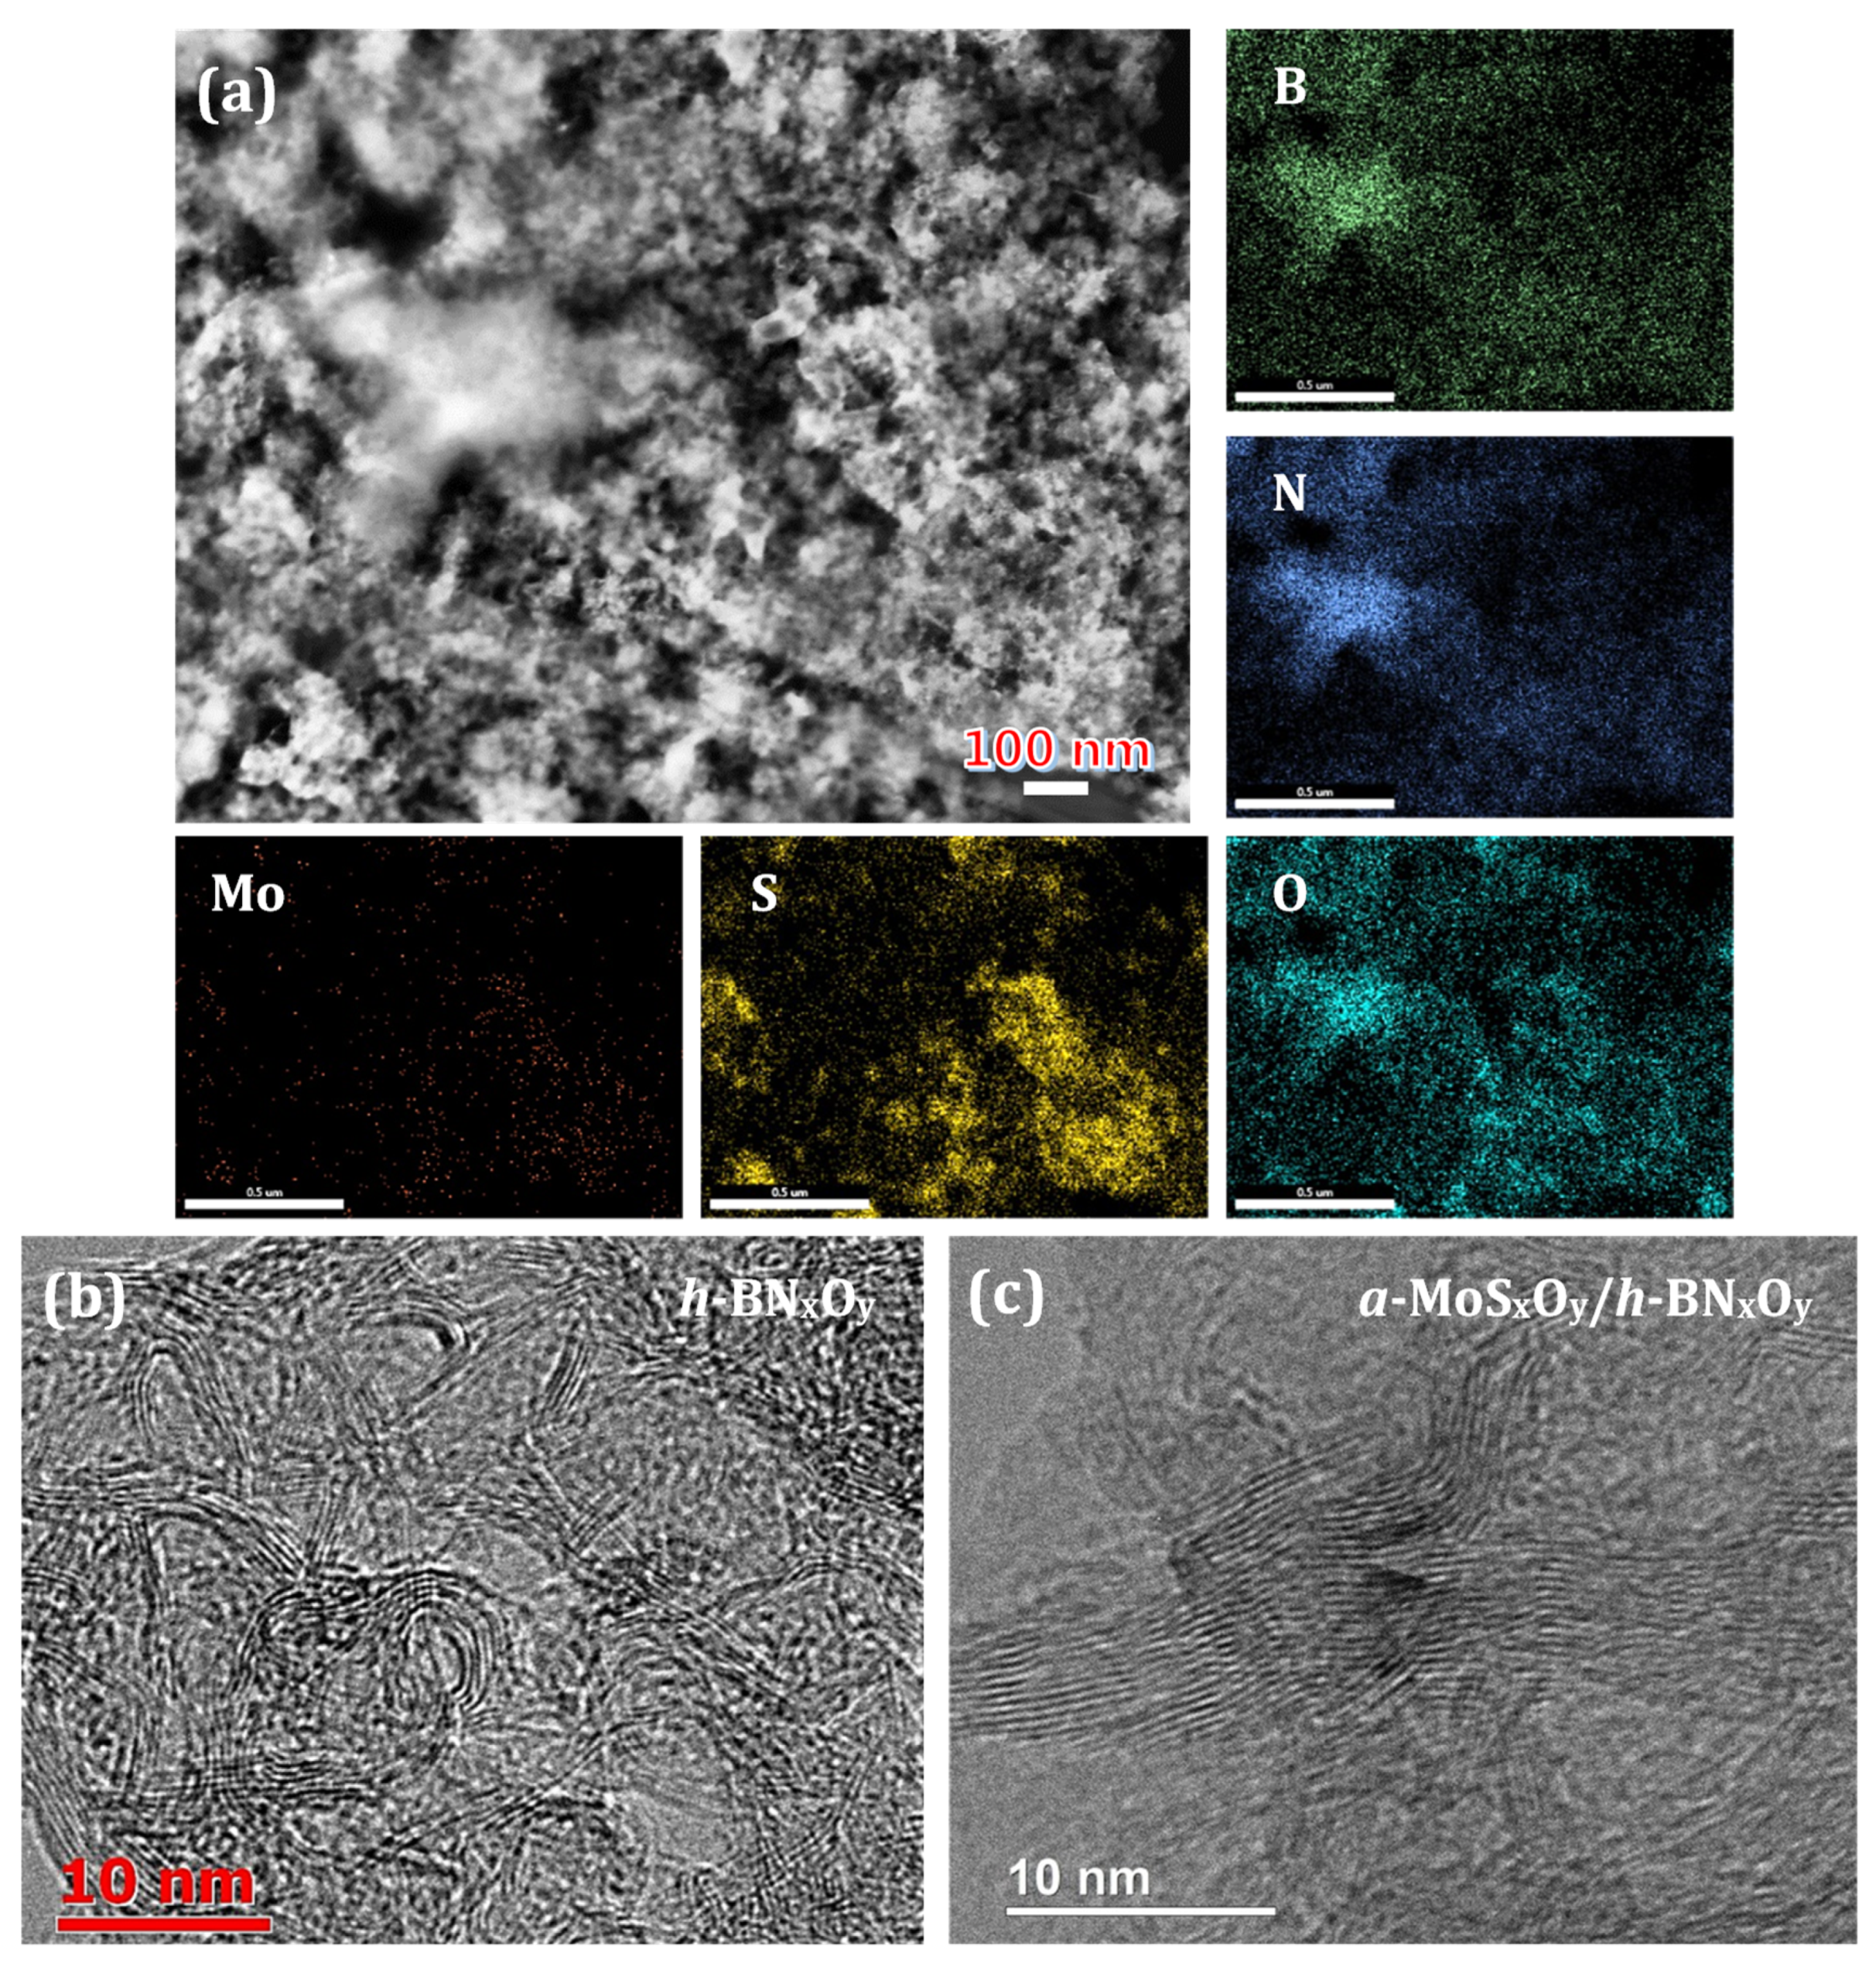
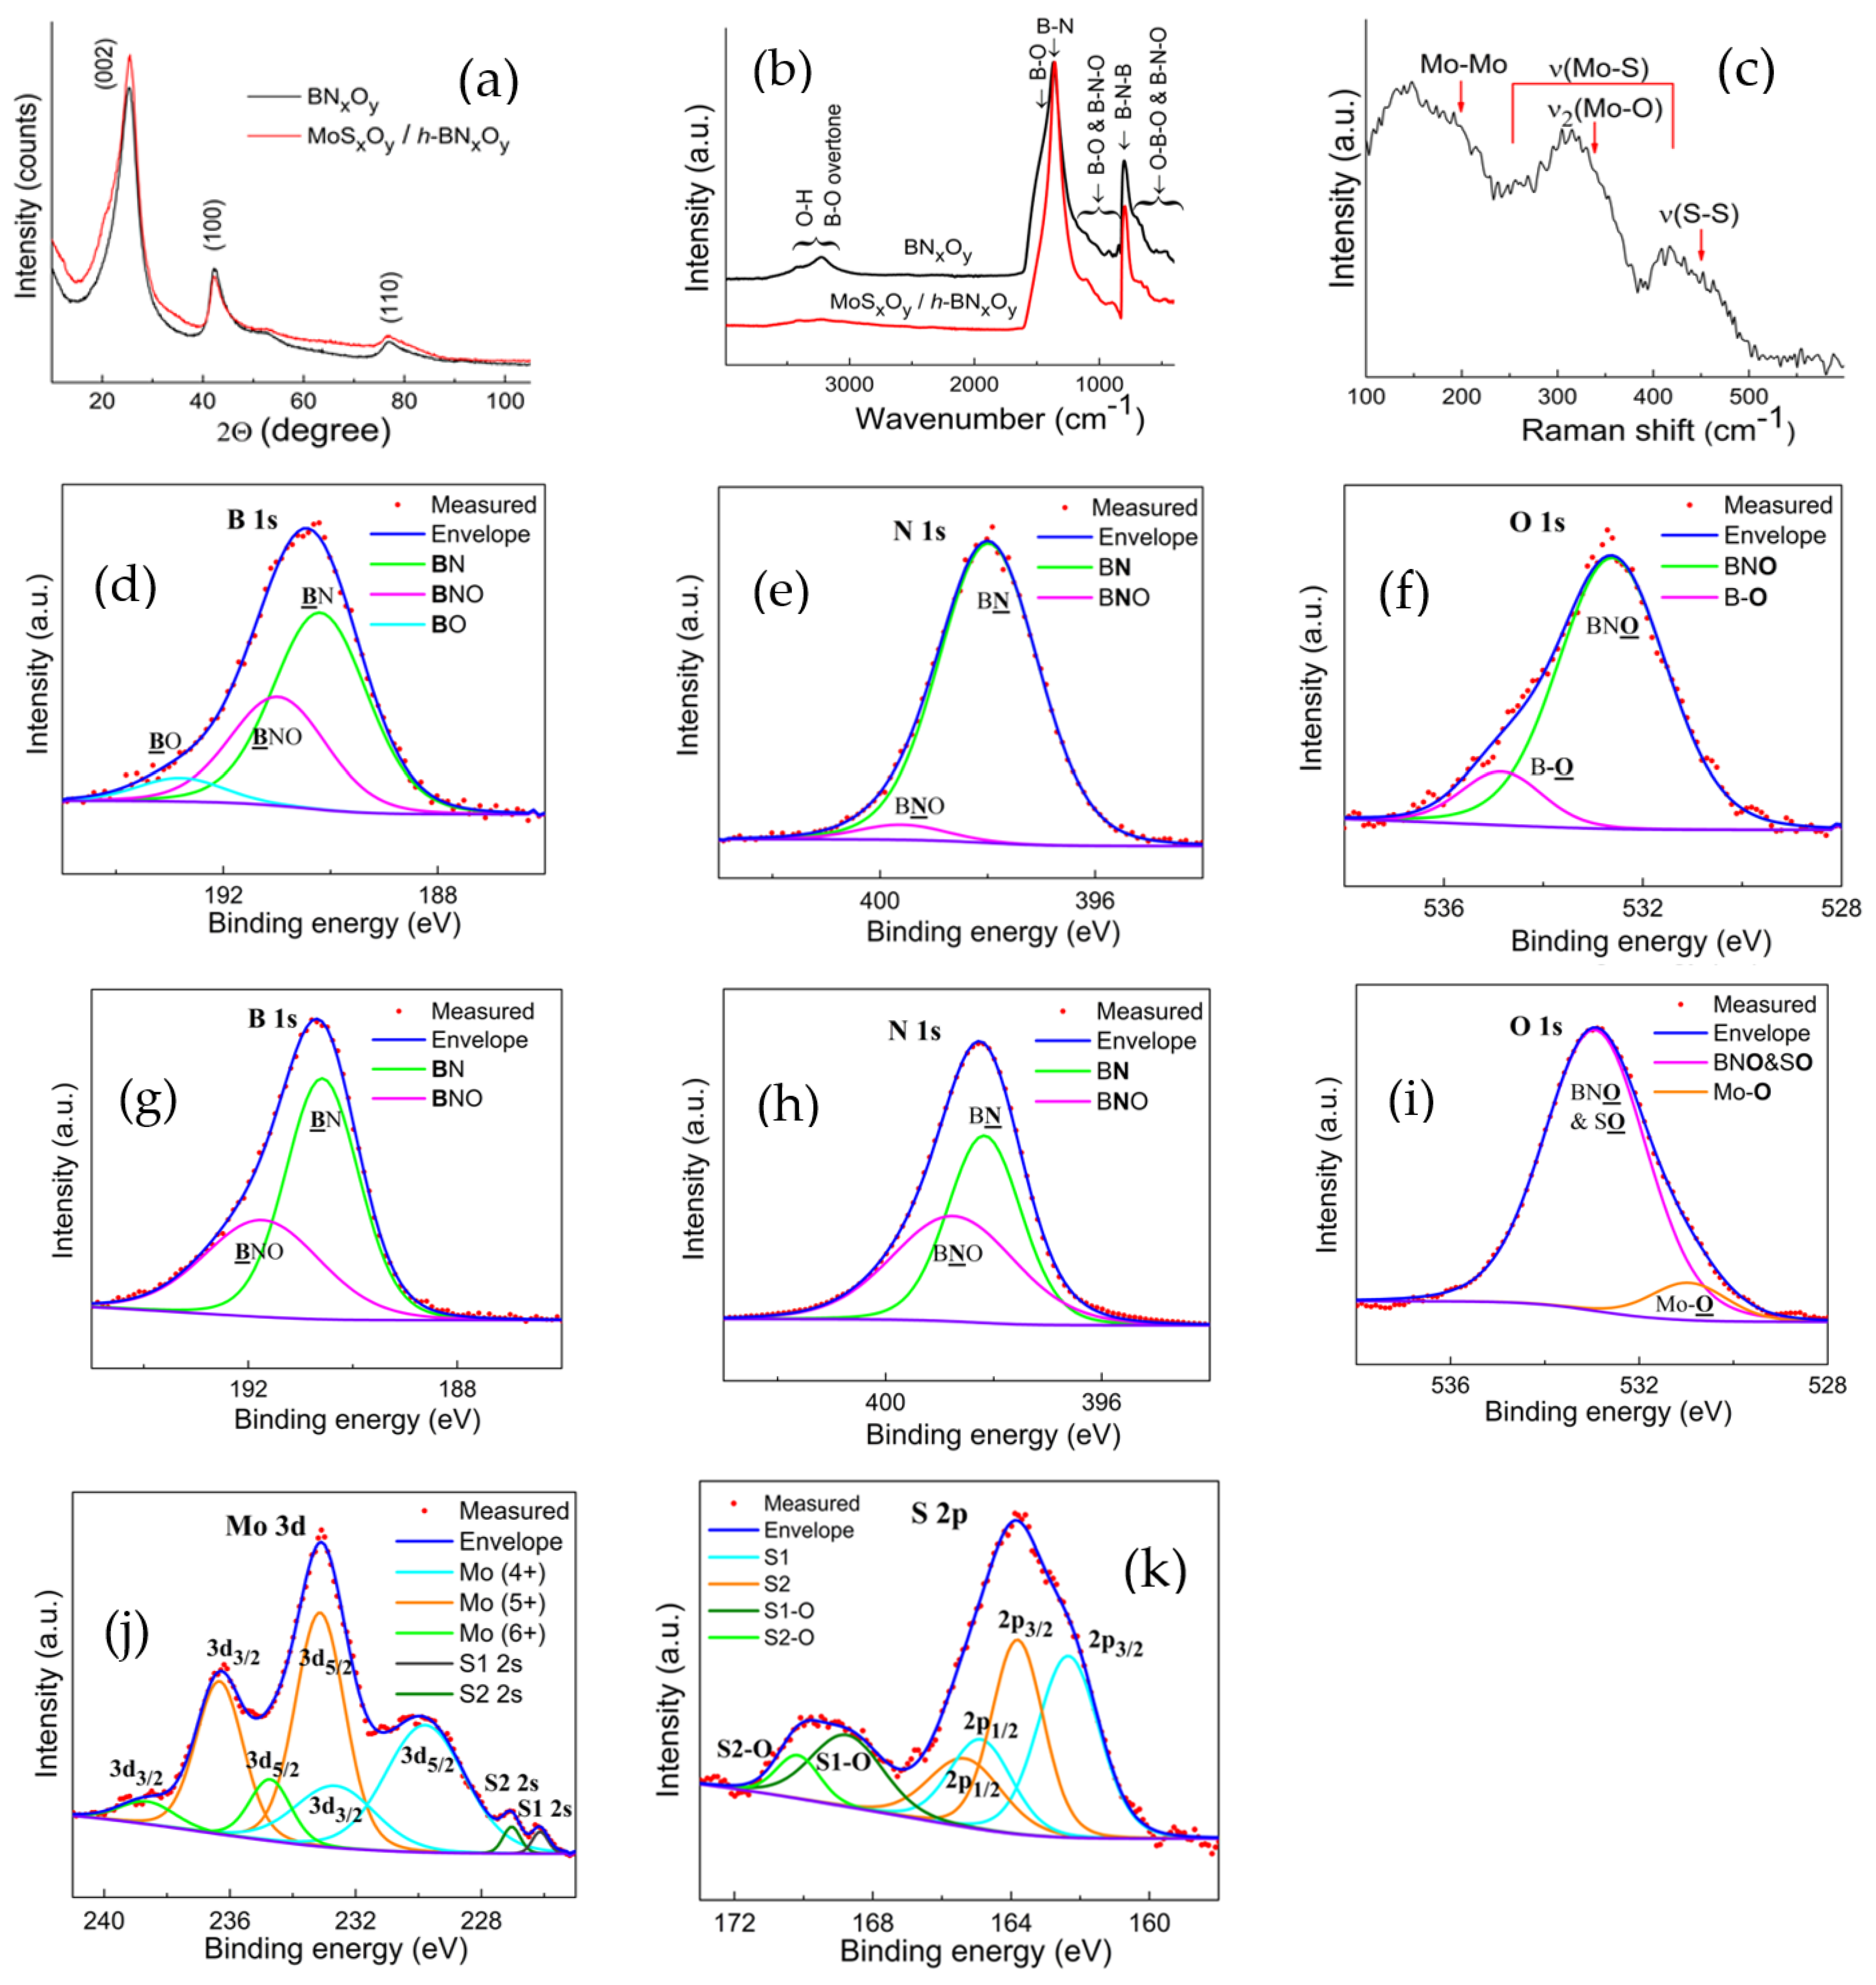
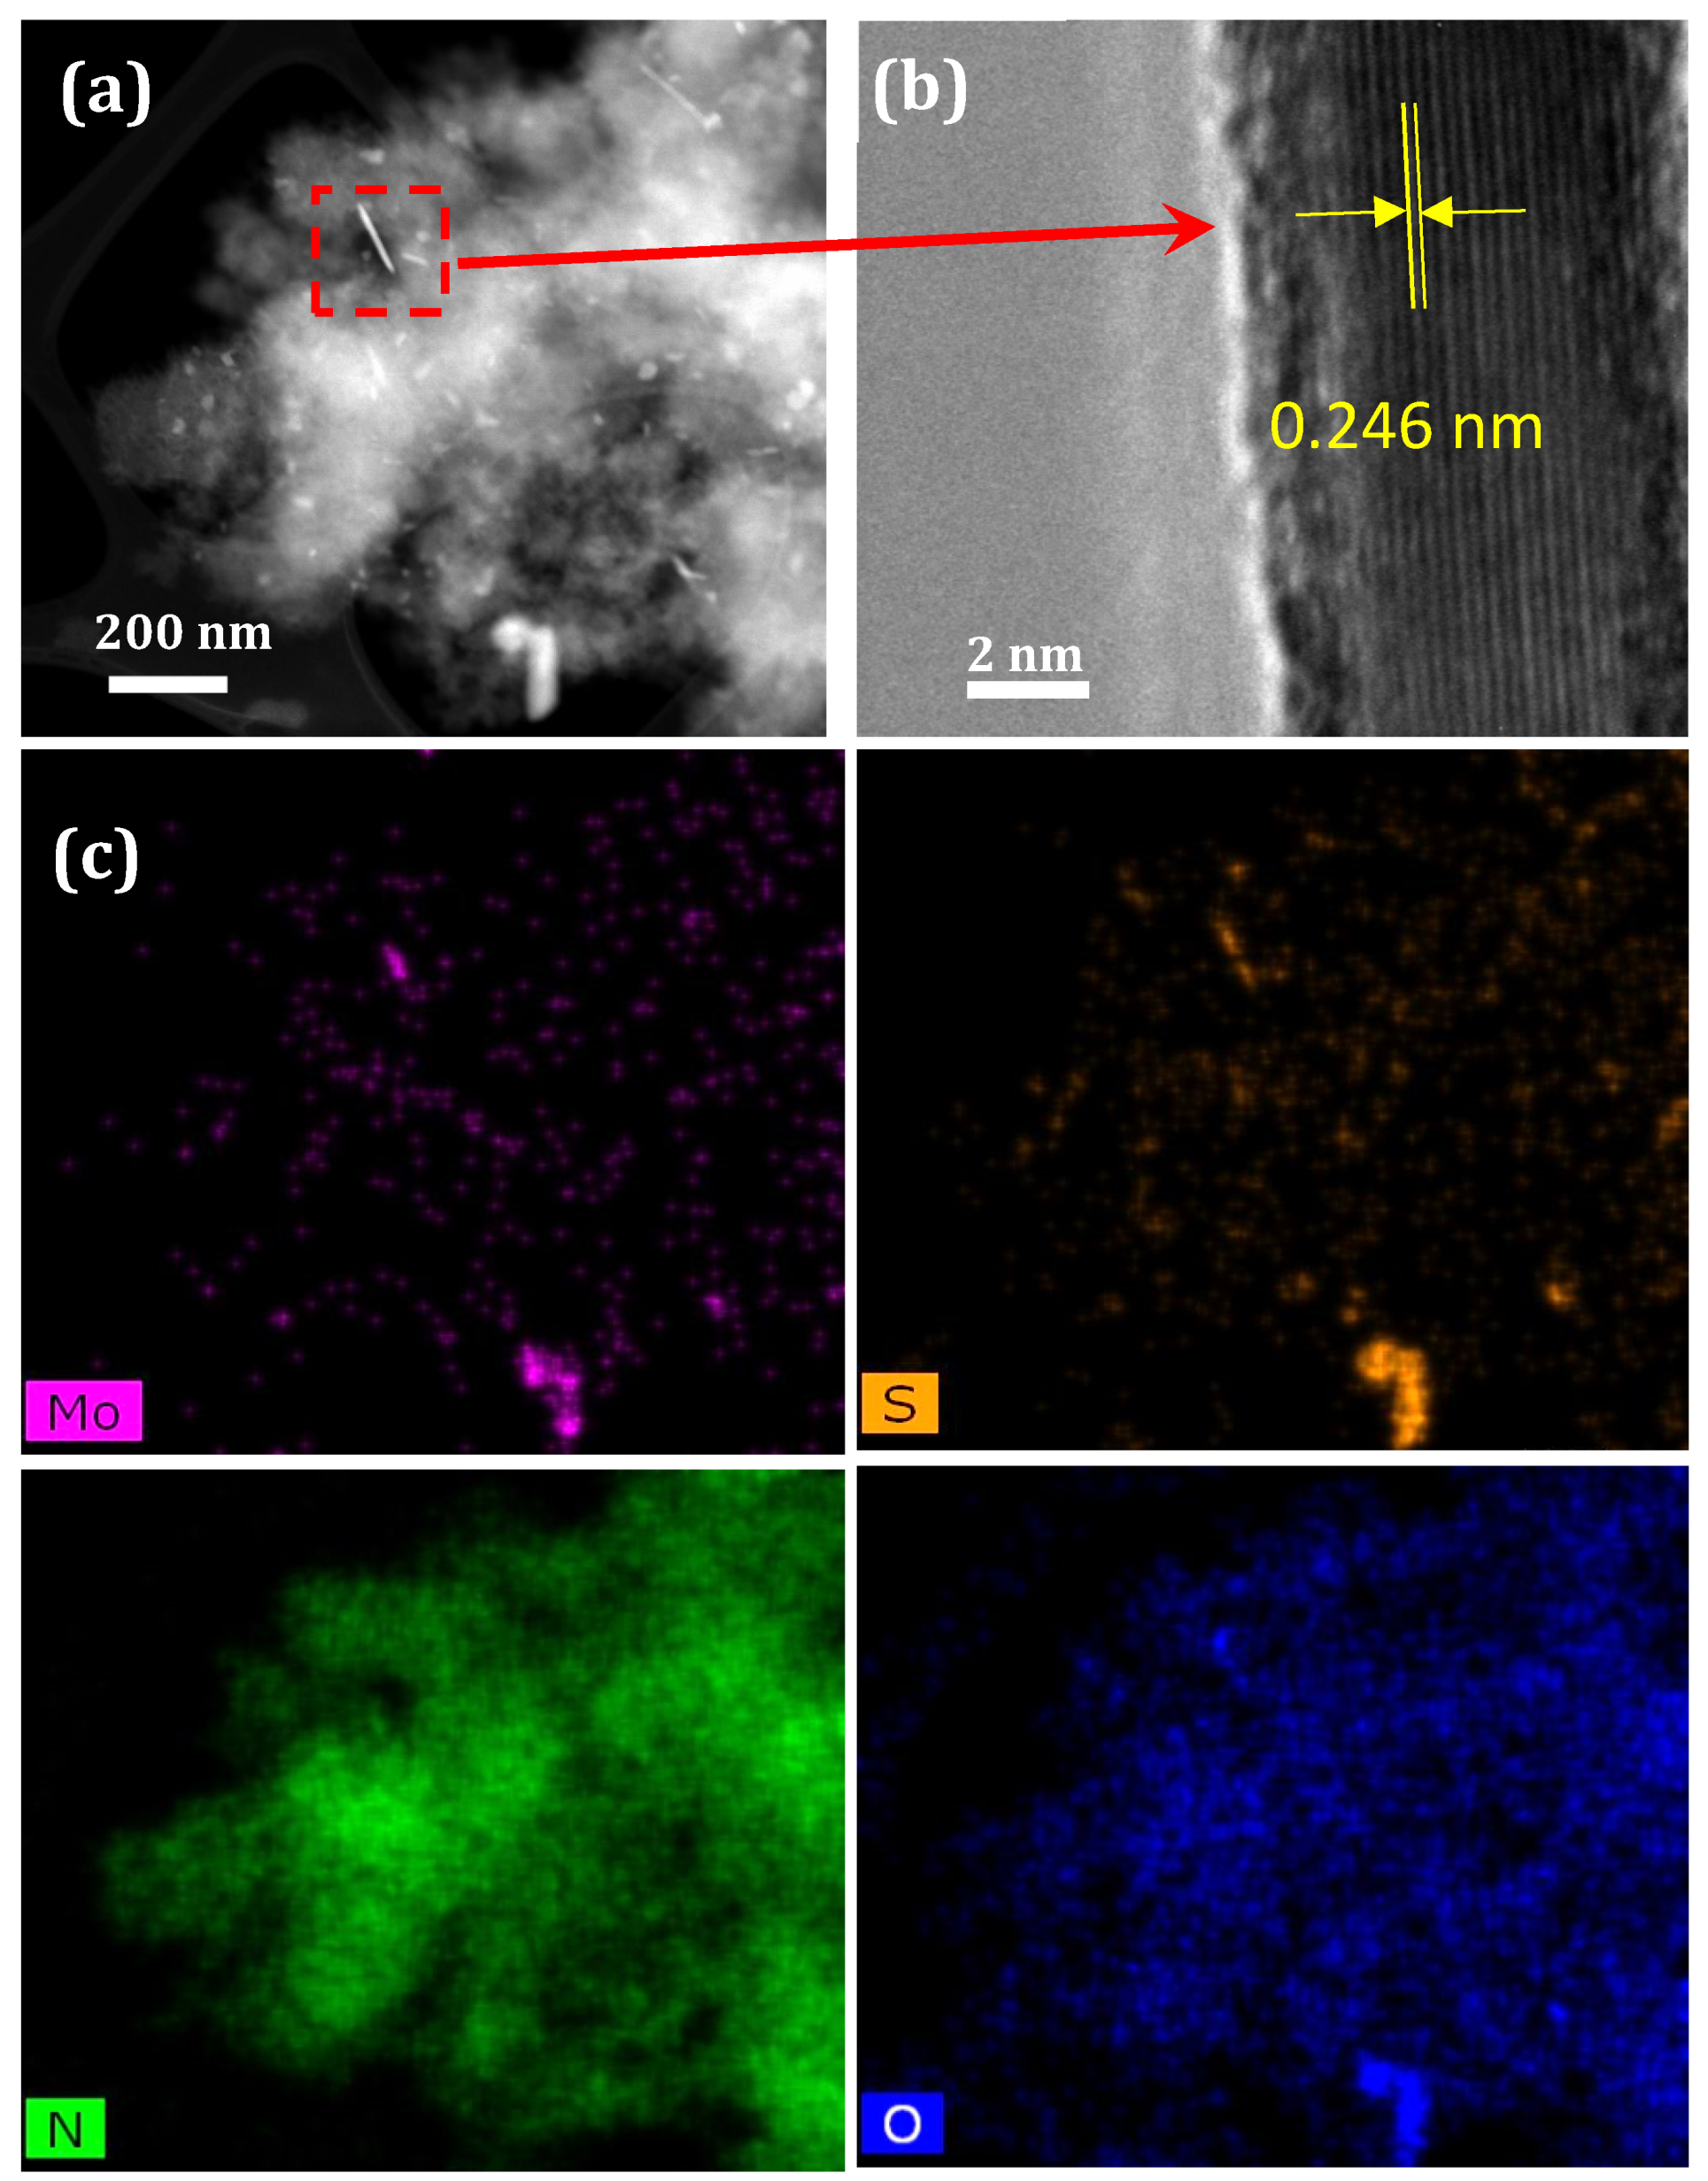
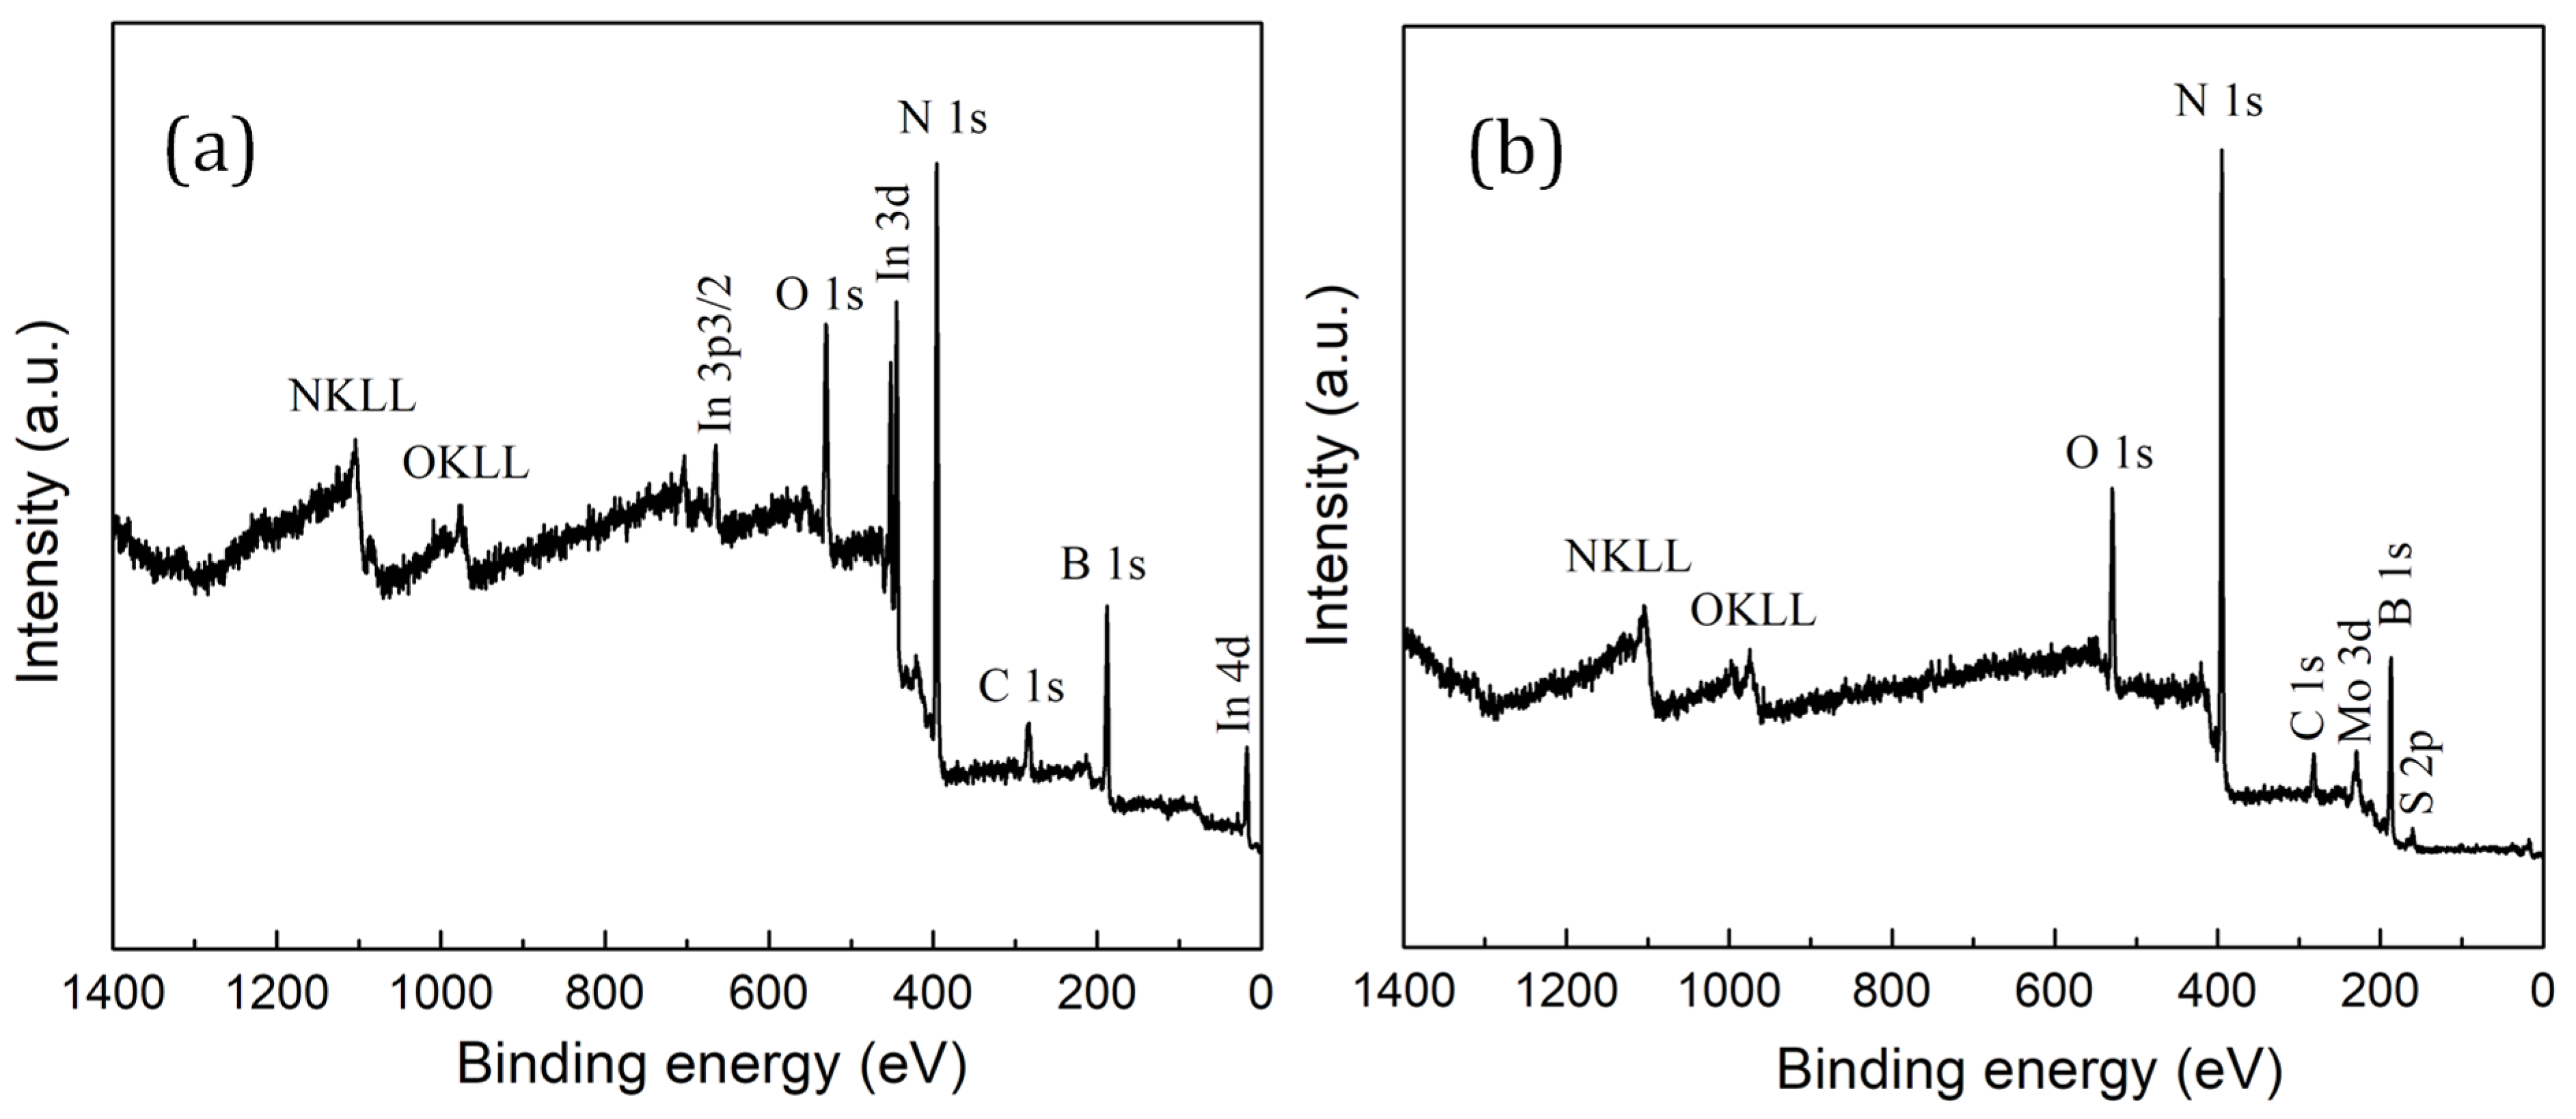
3.1. Characterization of BNO and a-MoSxOy/h-BNxOy Materials

According to energy dispersive X-ray spectroscopy (EDXS) analysis, the h-BNxOy contains ~10 at.% of oxygen. ICP analysis of a-MoSxOy shows 3.06 wt.% of Mo and 2.01 wt. % of S, which corresponds to a Mo/S ratio of approximately 0.51.
A HAADF-STEM image with the corresponding EDXS elemental maps of a-MoSxOy/h-BNxOy nanohybrids is shown in Figure 1a. The distributions of boron, nitrogen, and oxygen correlate with each other, indicating the presence of h-BNxOy phase. Areas rich in molybdenum, sulfur and oxygen also overlap, implying their chemical bonding. The high resolution transmission electron microscopy (HRTEM) image confirms that the initial h-BNxOy consists of curled flakes with an average thickness of several atomic layers and a length of ~20 nm (Figure 1b). It can be seen that after synthesis, the full width at the half maximum (FWHM) of the XRD peak increases slightly, which indicates a decrease in the average size of h-BNxOy nanocrystals (Figure 2a). We believe that this is due to hydroxylation and partial etching of h-BNxOy nanocrystals in the alkaline synthesis medium (pH 8) at 250 °C [41]. It should be noted that no diffraction peaks from molybdenum sulfide are seen in the XRD pattern. According to the ICP AES analysis, the concentration of molybdenum sulfide is 5 wt.%. The crystalline molybdenum sulfide in such an amount should be detected by XRD. The absence of reflection from molybdenum sulfide suggests an amorphous state. For proof, the nanohybrids were vacuum annealed at 600 °C for 1 h. The HAADF-STEM image and the corresponding EDXS elemental maps are presented in Figure 3. After annealing S, Mo, and O are concentrated in separate nanoparticles due to segregations. Rod-like precipitates observed in Figure 3a, are identified as crystalline nanoparticles with a characteristic d spacing of 0.246 nm, typical of the MoS2 phase (Figure 3b).
The presence of oxygen-substituted h-BNxOy phase (as evidenced from the EDXS analysis) was also confirmed by FTIR spectroscopy. The FTIR spectrum of initial h-BNxOy nanopowder exhibits strong peaks at ~1360 and ~798 cm−1, corresponding to the stretching and bending vibrations of B–N bonds in the B–N–B network [42] (Figure 2b). In addition, weak bands in the ranges of ~450–750 cm−1 and 860–1130 cm−1 are observed, which are associated with B-O vibrations. Two broad bands of moderate intensities in the range of ~3070–3500 cm−1 are attributed to the overtones of B–O and O–H vibrations. After the synthesis of a-MoSxOy/h-BNxOy nanohybrids, the FTIR spectrum changed noticeably. The bands in the high frequency range (~3070–3500 cm−1) have almost disappeared, and the shoulder at ~1400 cm−1 is not visible. A small band at about 700 cm−1 also became less pronounced. All these changes indicate that boron oxide and terminated hydroxyl groups formed as a result of partial hydrolysis of the h-BNxOy phase are reduced. However, some small peaks in the ranges of 1100–850 cm−1 and 700–400 cm−1 are still visible. We believe that these peaks are associated with the oxygen-substituted h-BNxOy phase.
XRD analysis suggested that the molybdenum sulfide was in an amorphous state. The absence of crystalline MoS2 was also confirmed by Raman spectroscopy. Raman spectrum of the a-MoSxOy/h-BNxOy nanohybrids is shown in Figure 2c. Three broad bands are observed in the ranges of 100–250 cm−1, 250–380 cm−1, and 380–500 cm−1. The low peak of the Raman shift can be ascribed to Mo–Mo vibrations [43,44,45]. The second band (250–380 cm−1) is associated with coupled ν(Mo–S) [43,44] and terminal Mo-St vibrations [43,44,45,46,47]. Mo–O bonds have also been reported in the range of 300–340 cm−1 [48]. The maximum of the third band (380–500 cm−1) is located at ~415 cm−1, which is close to the A1g vibrations in MoS2 observed at 407–411 cm−1. However, this band should be accompanied by the E12g feature at ~380 cm−1 [12,47], which is not visible in the spectrum. Therefore, we assume that there is no hexagonal MoS2 in the sample. Maximum in the range of 380–500 cm−1 can be attributed to the ν(Mo3-µS) vibrations [9]. However, the terminal and bridging S-S bonds in the Mo3Sx complexes have vibrations at 515, 546, 552 cm−1 [44,45] which are not visible in our spectrum, which indicates the absence of triangular complexes of molybdenum sulfides. Thus, from the Raman spectroscopy analysis it can be concluded that the material consists of molybdenum oxysulfide clusters [MoxSyOz], but, apparently, without apical sulfur. The large width of bands indicates that the clusters have a high degree of chemical nonuniformity both in stoichiometry and in the coordination environment of the elements. It should be noted, that in the case of an amorphous material, assignment of the observed Raman shifts is a challenge, since the selection rules based on crystal symmetry are weakened. In addition, some of the bands observed in the crystalline material may disappear, while new bands may appear, which further complicates the analysis [47,49]. Therefore, for a deeper insight in the chemical bonding, XPS method was employed.
The survey XPS spectra of h-BNxOy and a-MoSxOy/h-BNxOy materials placed on an In substrate are shown in Figure 4. In addition to the small XPS C 1s peak from adsorbed carbonaceous species, the h-BNxOy XPS spectrum shows O 1s, N 1s, and B 1s peaks as well as In substrate peaks. The XPS spectrum of a-MoSxOy/h-BNxOy nanohybrids additionally contains Mo and S. Peaks of Cl are not observed.
High-resolution XPS spectra of the h-BNxOy and a-MoSxOy/h-BNxOy materials are depicted in Figure 2d–k. The XPS B 1s spectrum of h-BNxOy was deconvoluted into three components: B–O (192.8 eV), BNO (191 eV), and BN (190.2 eV) [50]. The XPS N 1s peak (Figure 2e) was approximated by two peaks at ~398 eV (BN) and at ~399 eV (BNO). Two peaks observed in the XPS O 1s spectrum at ~532.6 eV and ~534.8 eV were ascribed to the BNO and BO phases, respectively (Figure 2f). Thus, the results of XPS analysis of the h-BNxOy sample are in good agreement with the IR spectra (Figure 2b) and confirm the presence of BN (main component), BNO (secondary component) and BO (minor phase).
In a-MoSxOy/h-BNxOy nanohybrids, the XPS B 1s peak (Figure 2g) was deconvoluted into two components located at 190.6 eV (BN) and 191.7 eV (BNO). Boron oxide is not observed, and the BNO peak has slightly shifted towards a higher binding energy as compared to the peak of the h-BNxOy material. It can be assumed that boron oxide reacted with boron oxynitride phase, which led to an increase in its doping with oxygen. Nitrogen in the XPS N 1s spectrum appears in two chemical environments with binding energies of 398.8 eV and 398.2 eV, which corresponds to the BNO and BN phase, respectively (Figure 2h). Deconvolution of the XPS O 1s spectrum shows two components at 531 eV (Mo–O) and at 532.9 eV (BNO). Since the binding energy of the S–O bond also has a peak at 531 eV, it is difficult to distinguish between the BNO and SO bonds. Figure 2i also shows that the B–O bond disappeared and a new Mo–O bond appeared (Table 1).
XPS analysis also showed that Mo and S are present in various types of coordination within an amorphous MoOxSy phase. The XPS Mo 3d spectrum exhibits three strong peaks (Figure 2j). Their best fitting is obtained by deconvolution the spectrum into three overlapping spin-orbit doublets 3d5/2 and 3d3/2 at (i) 234.8 and 237.9 eV, (ii) 233.1 and 236.2 eV, (iii) (229.8 and 232.9 eV) corresponding to three oxidation states of molybdenum: Mo (6+), Mo (5+), and Mo (4+) (Table 2). The relative content of these states is calculated as 10, 49, and 39%, respectively, which means that the average oxidation state of Mo is (+4.61). The highest oxidation state of Mo (6+) is apparently associated with MoO3, the formation of which is also revealed by the Mo–O bond in the O 1s spectrum (Figure 2i). The second Mo (3d) doublet at 233,1 and 236, 3 eV, corresponding to Mo (3d5/2) and Mo (3d3/2), belongs to the Mo (5+) state in MoOxSy. We attribute Mo in the oxidation state (4+) to MoS3 and not to MoS2, because the latter phase is not identified by Raman analysis. In MoS3, sulfur is present in at least two states, including the S2− and S22− ligands in various types of coordination [51]. Indeed, two peaks in the XPS S 2s spectrum are observed at 226.1 and 227.0 eV (Figure 2j). We attribute these peaks to the bridging and terminal S22− in Mo–S3 clusters. The XPS S 2p spectrum (Figure 2k) also contains two spin-orbit 2p3/2 and 2p1/2 doublets. The doublet at 162.4 and 164.9 eV originates from the terminal S22− ligands, and the doublet at 163.8 and 165.3 eV is associated with bridging or shared S22− ligands [9,51,52,53]. Also, the doublet at higher BE values can be explained by polysulfide clusters. The remaining high-energy peaks in the XPS S 2p spectrum at 168.8 eV and 170.1 eV are attributed to S–O bonds (Table 3).

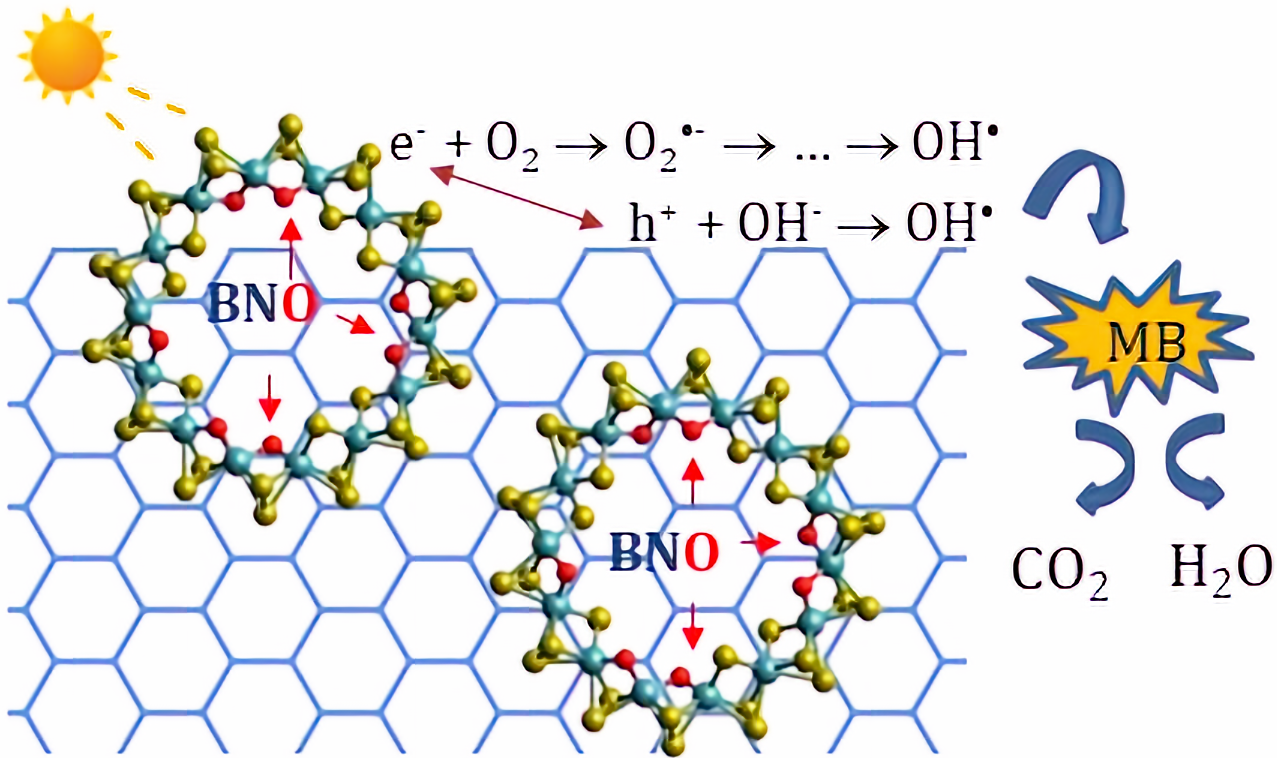
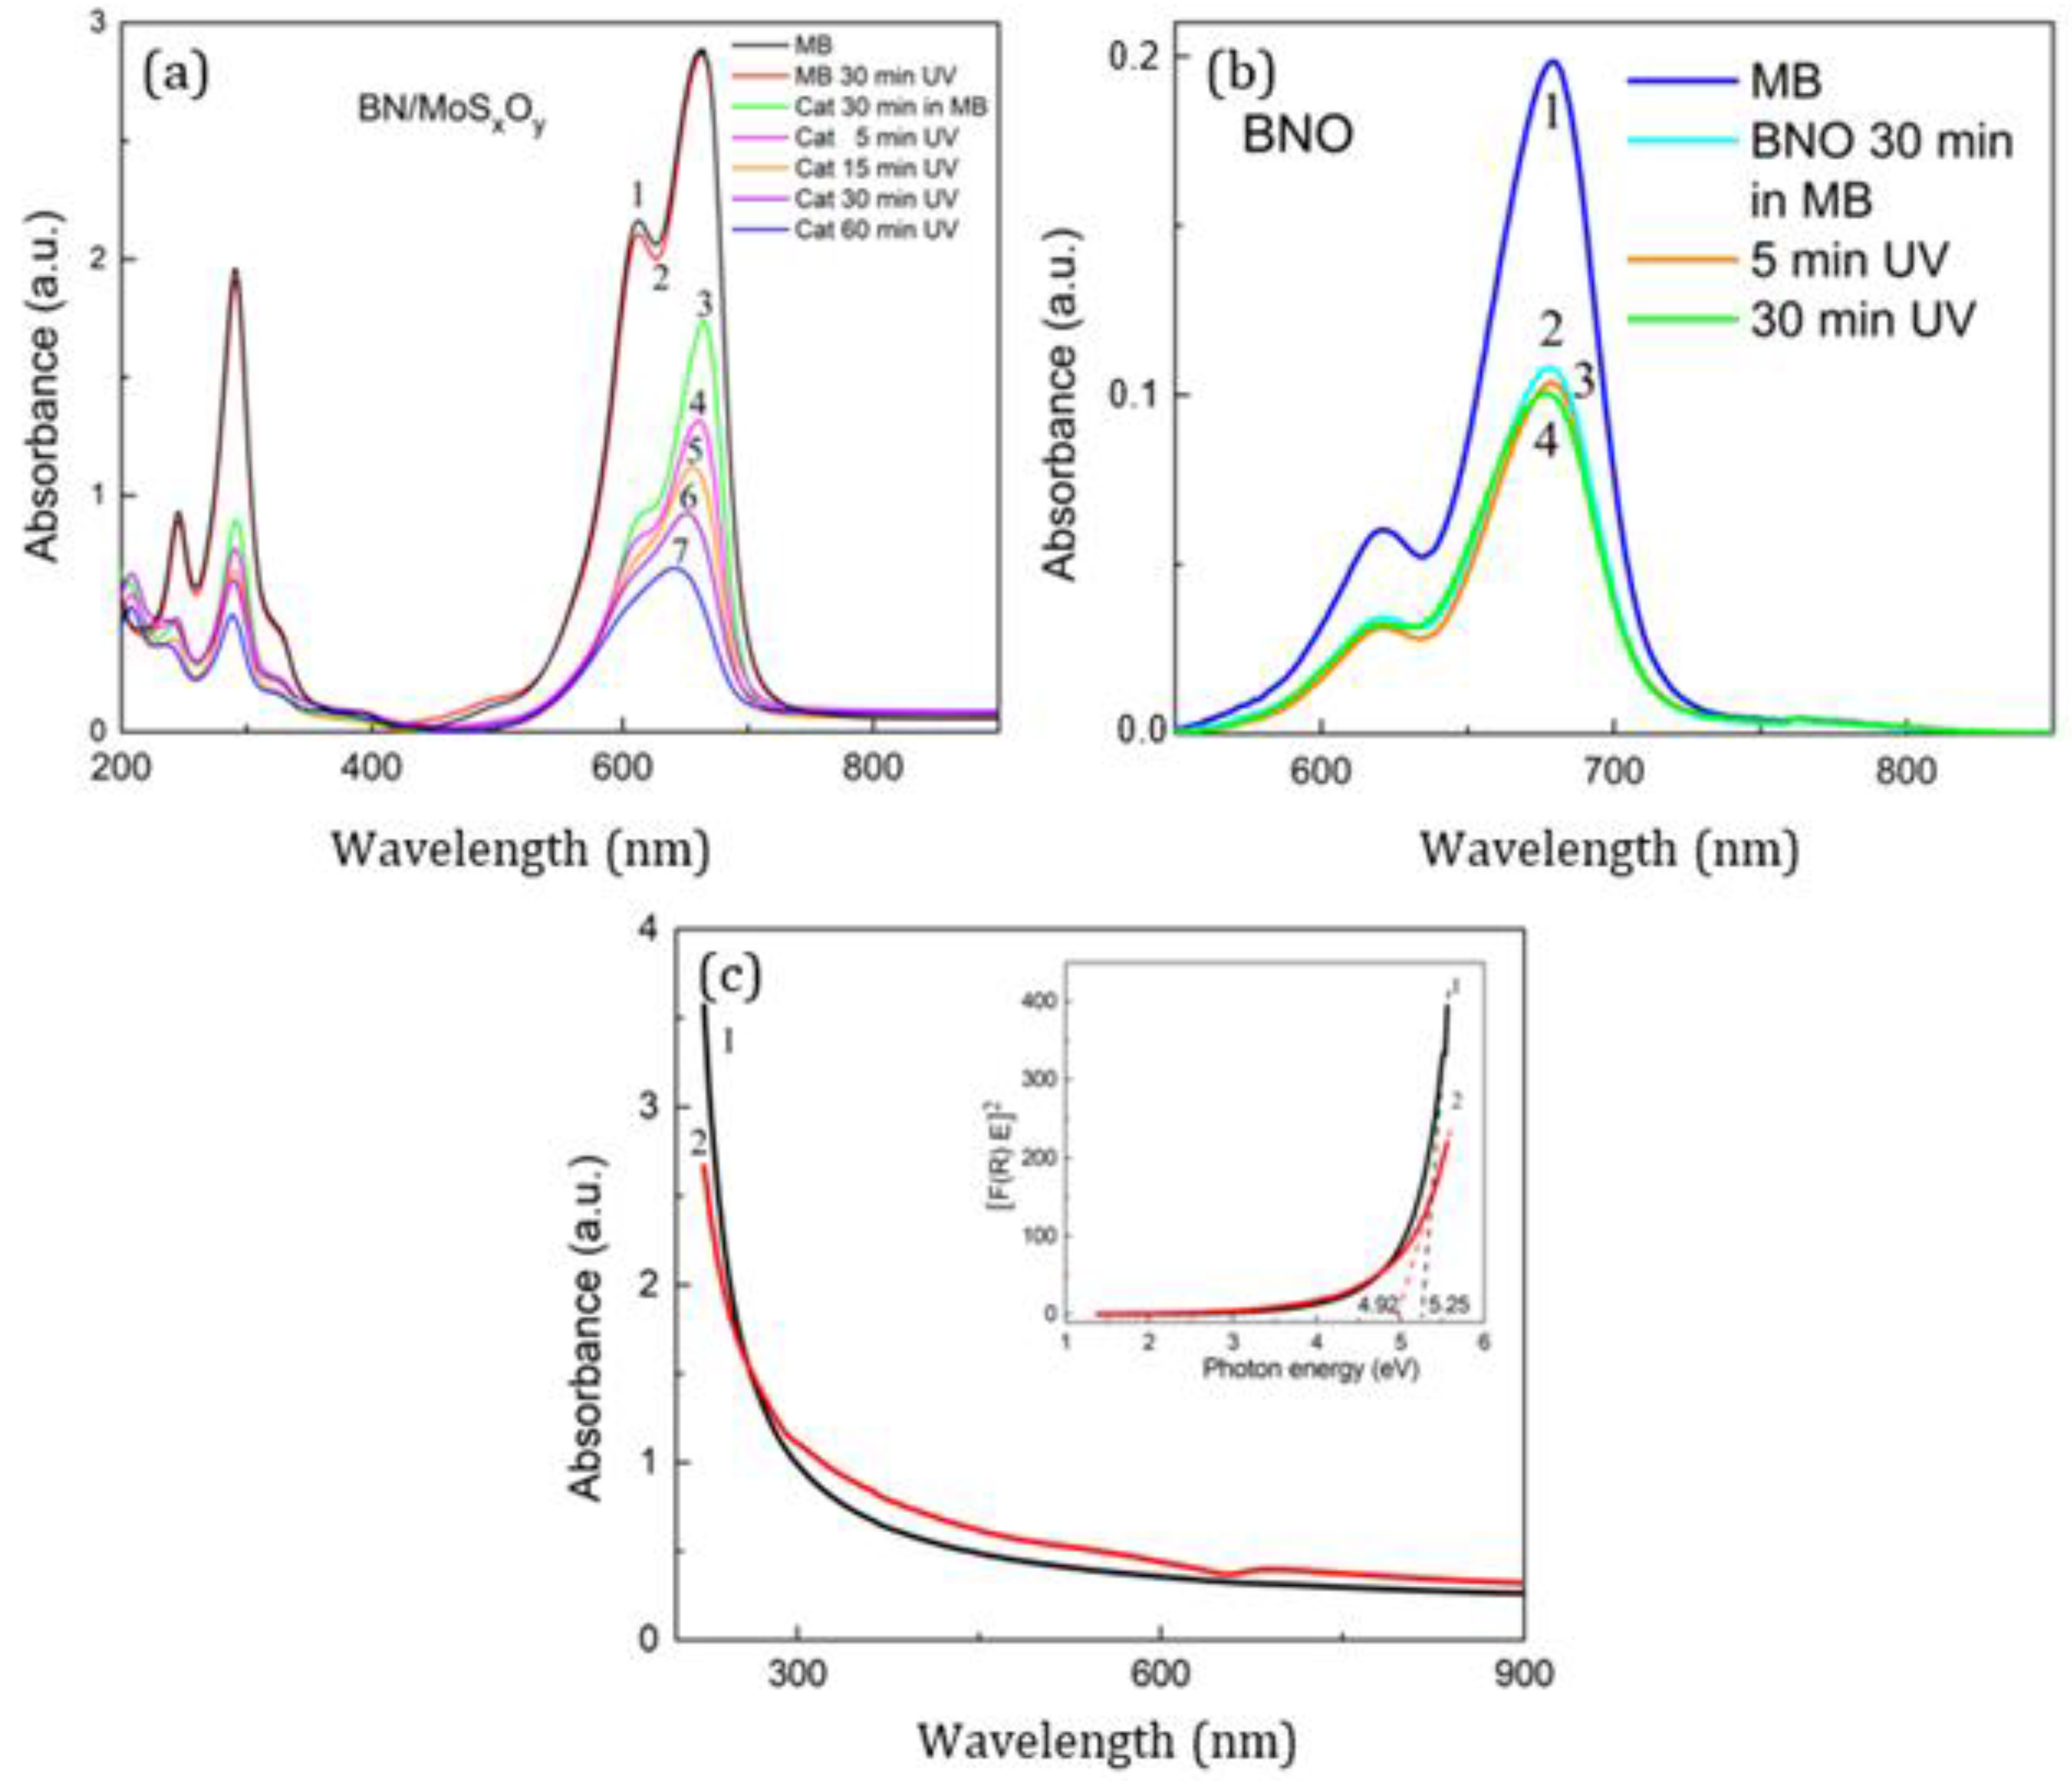
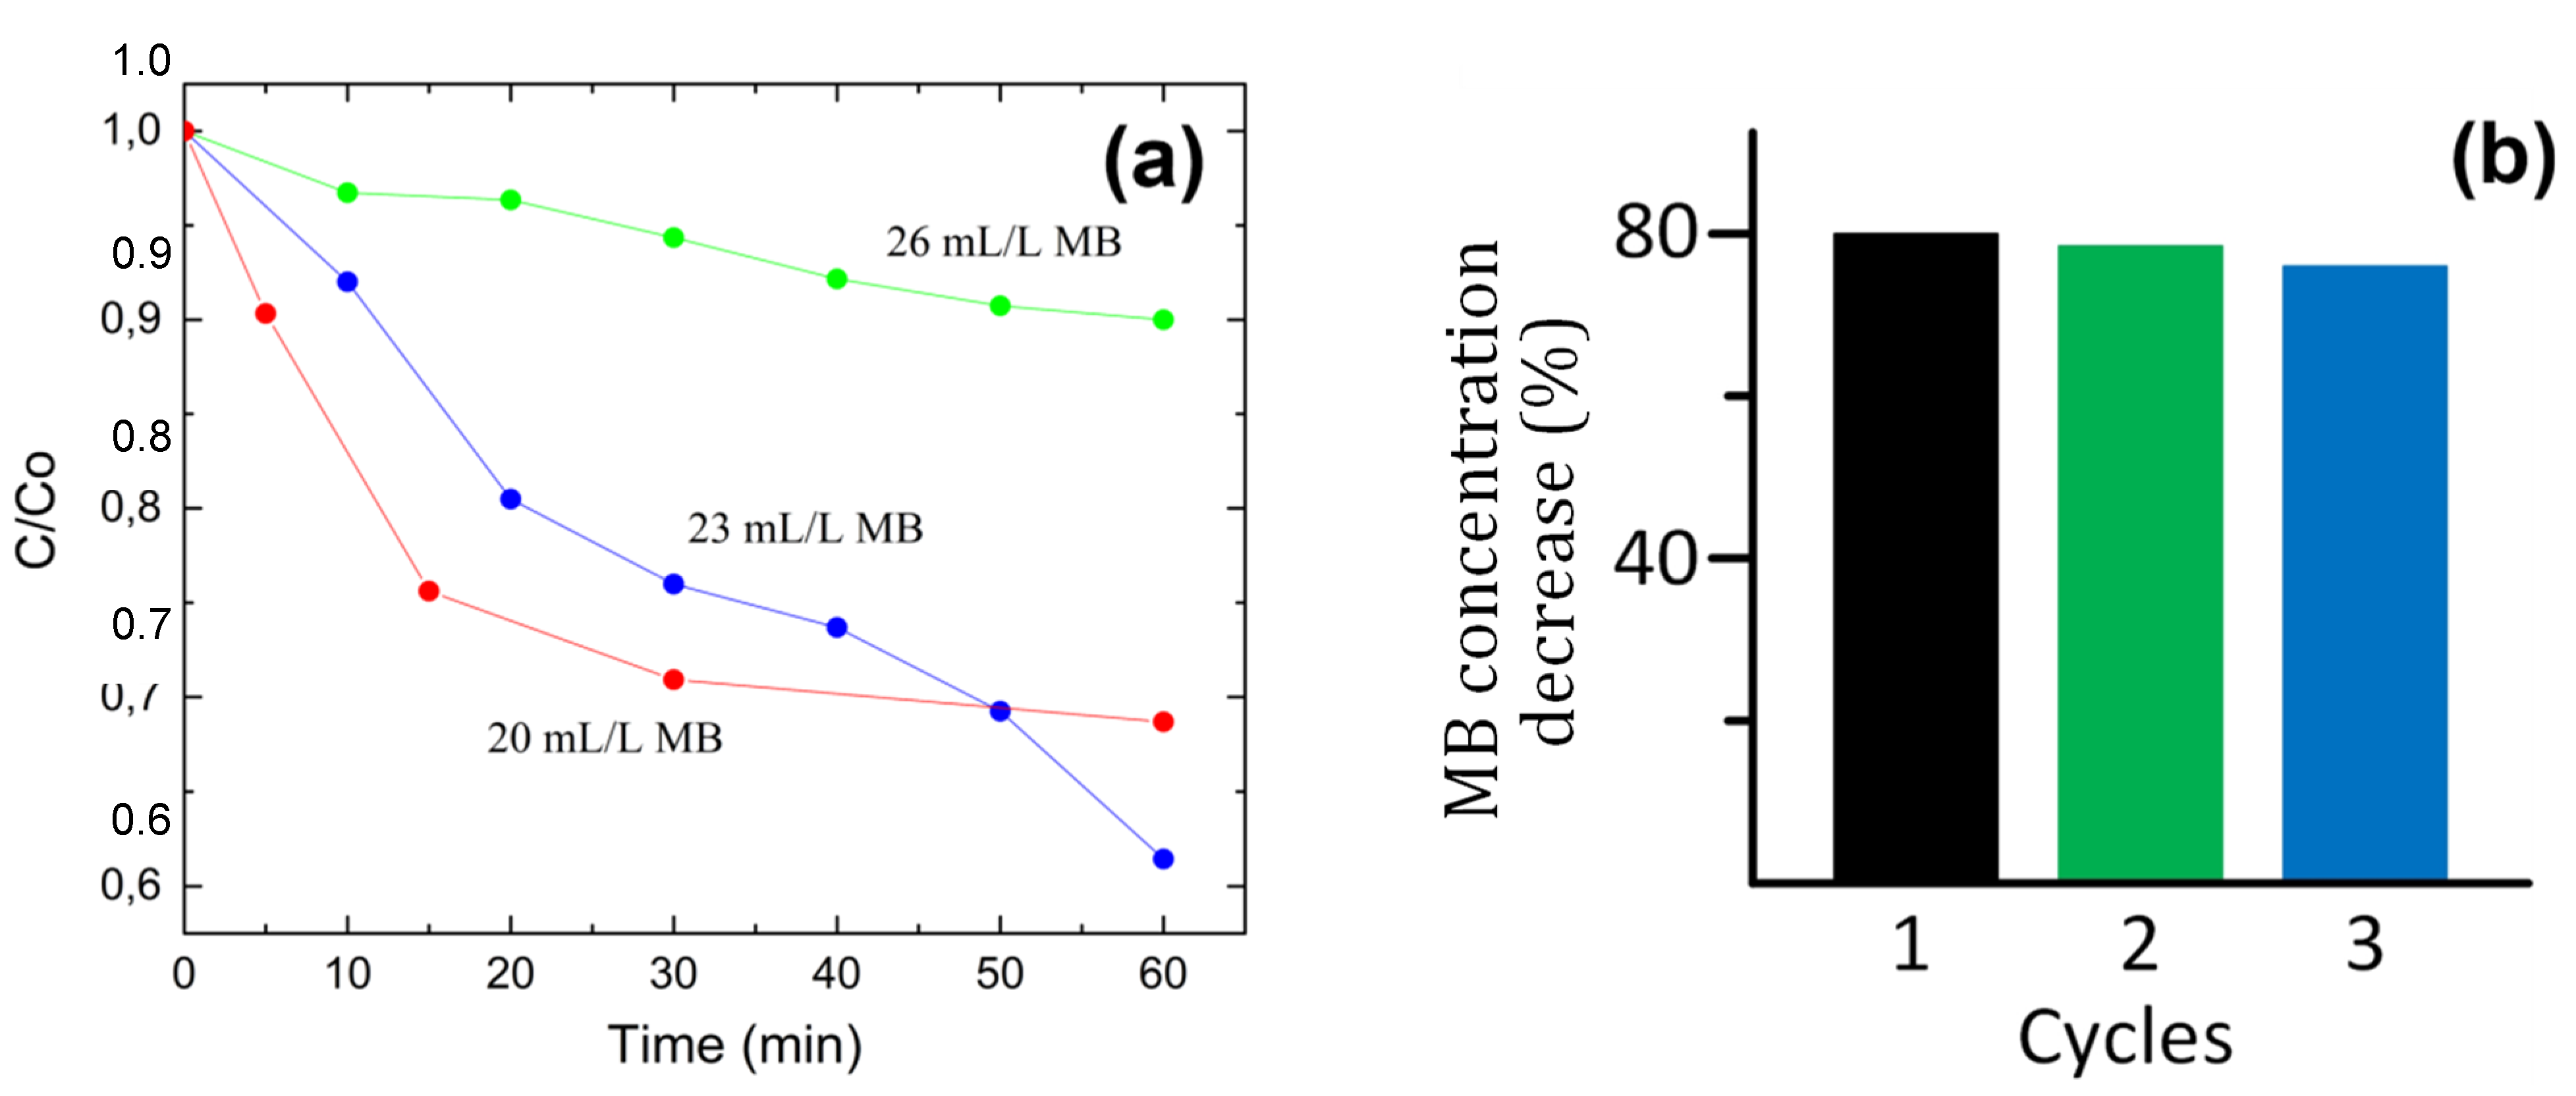
3.2. Photocatalytic Activity

The photocatalytic activity of the a-MoSxOy/h-BNxOy heterostructures was studied using methylene blue (MB) as a model pollutant. Figure 5a shows the UV-vis absorption spectra of an MB aqueous solution (1 mL MB per 50 mL of water, which corresponds to concentration of 62.5 mmol/L) before UV irradiation (curve 1), after irradiation for 30 min (curve 2), as well as the solution of MB + a-MoSxOy/h-BNxOy (hereafter denoted as Cat) after 30 min exposure in the dark (curve 3) and after UV irradiation for 5, 15, 30, and 60 min (curves 4–7). MB + h-BNxOy suspension (designated as Cat_free) was use as a control (Figure 5b). The h-BNxOy sorption capacity was assessed by comparing the spectrum before and after exposure in the dark. An almost twofold decrease in intensity indicates a rather high sorption capacity of the nanomaterial.
The concentration of MB molecules is directly proportional to UV-vis absorption. The intensity of absorption spectrum of sample Cat_free does not change with UV irradiation, while sample Cat demonstrates a sequential decrease in the spectrum intensity as the duration of irradiation increases due to the MB degradation with specific catalyst mass activity of 4.58 mmol·g−1·h1.
To test the effect of MB concentration on its photodegradation activity, additional experiments were carried out at increased MB concentrations of 1.15 and 1.30 mL per 50 mL of water, which corresponds to molar concentrations of 71.9 and 81.3 mmol/L, respectively. The concentration of catalyst in these experiments was 6 mg per 50 mL and pH of the solution was neutral. Figure 6a shows the photocatalytic degradation of MB at the three investigated concentrations. At a MB concentration of 71.9 mmol/L (23 mL/L), MB photodegradation in the first 30 min proceeds more slowly than at a MB concentration of 62.5 mmol/L (20 mL/L). However, with further irradiation, MB decomposition proceeds faster. This may be due to the recombination of photogenerated active species, the kinetics of which depends on their concentration, and at a relatively low MB concentration, some active species can be deactivated before they reach the dye molecules. With a further increase in the MB concentration to 81.3 mmol/L, the decomposition kinetics sharply slows down. This may be due to a decrease in the intensity of UV irradiation in the solution due to the MB absorption, which has a photoabsorption band in the UV range. Thus, the highest degradation rate is observed at a MB concentration of 71.9 mmol/L, which corresponds to an activity as high as 5.51 mmol·g−1·h−1. Table 4 compares the photodegradation efficiency of a-MoSxOy/h-BNxOy with other catalytic systems. It can be seen that the efficiency of a-MoSxOy/h-BNxOy system is at least 4 times higher than that of other nonmetal catalysts that have been reported so far.
The reusability of the photocatalyst was evaluated from three successive photocatalytic tests during 90 min of UV irradiation of solutions with a MB concentration of 23 mL/L (71.9 mmol/L). According to the obtained results, the photocatalytic activity reaches 80 wt. % and slightly decreases after three cycles, which indicates good stability and the reusability of the material (Figure 6b).
Photocatalytic degradation of MB in water occurs due to its reaction with hydroxyl radicals (·OH), formed as a result of photochemical reactions, as described elsewhere [2]. Electron-hole pares are generated in the MoSxOy film due to the photon absorption. Photogenerated electrons remain in MoSxOy, while holes are captured by h-BNxOy, which prevents electron-hole recombination (1). Electrons react with adsorbed oxygen dissolved in water and form superoxide radicals (O2) (2). These radicals react with water to form a hydroperoxyl radical and a hydroxyl ion (3); two hydroperoxyl radicals produce hydrogen peroxide and molecular oxygen (4). Under UV irradiation, hydrogen peroxide dissociates into two hydrogen radicals (5). The hydroxyl ion is oxidized by a hole to a hydroxide radical (6). Finally, hydroxyl radicals react with MB, decomposing it into CO2 and H2O (7):
MoSxOy/h-BNxOy + hν → MoSxOy(e)/h-BNxOy(h+)
MoSxOy(e) + O2(ads) → O2·
O2· + H2O → HO2· + OH
2HO2· → H2O2 + O2
H2O2 + hν → 2 ·OH
OH + h+ → ·OH
MB + ·OH → CO2 + H2O
For the reactions described above to occur, the following conditions must be met [59]:
E g a p 1.23   eV
E C B E 0 ( O 2 ( a d s ) / O ˙ 2 )
E V B E 0 ( OH / O ˙ H )
where Egap—is the band gap, EVB and ECB—are the positions of valence and conducting bands, respectively.

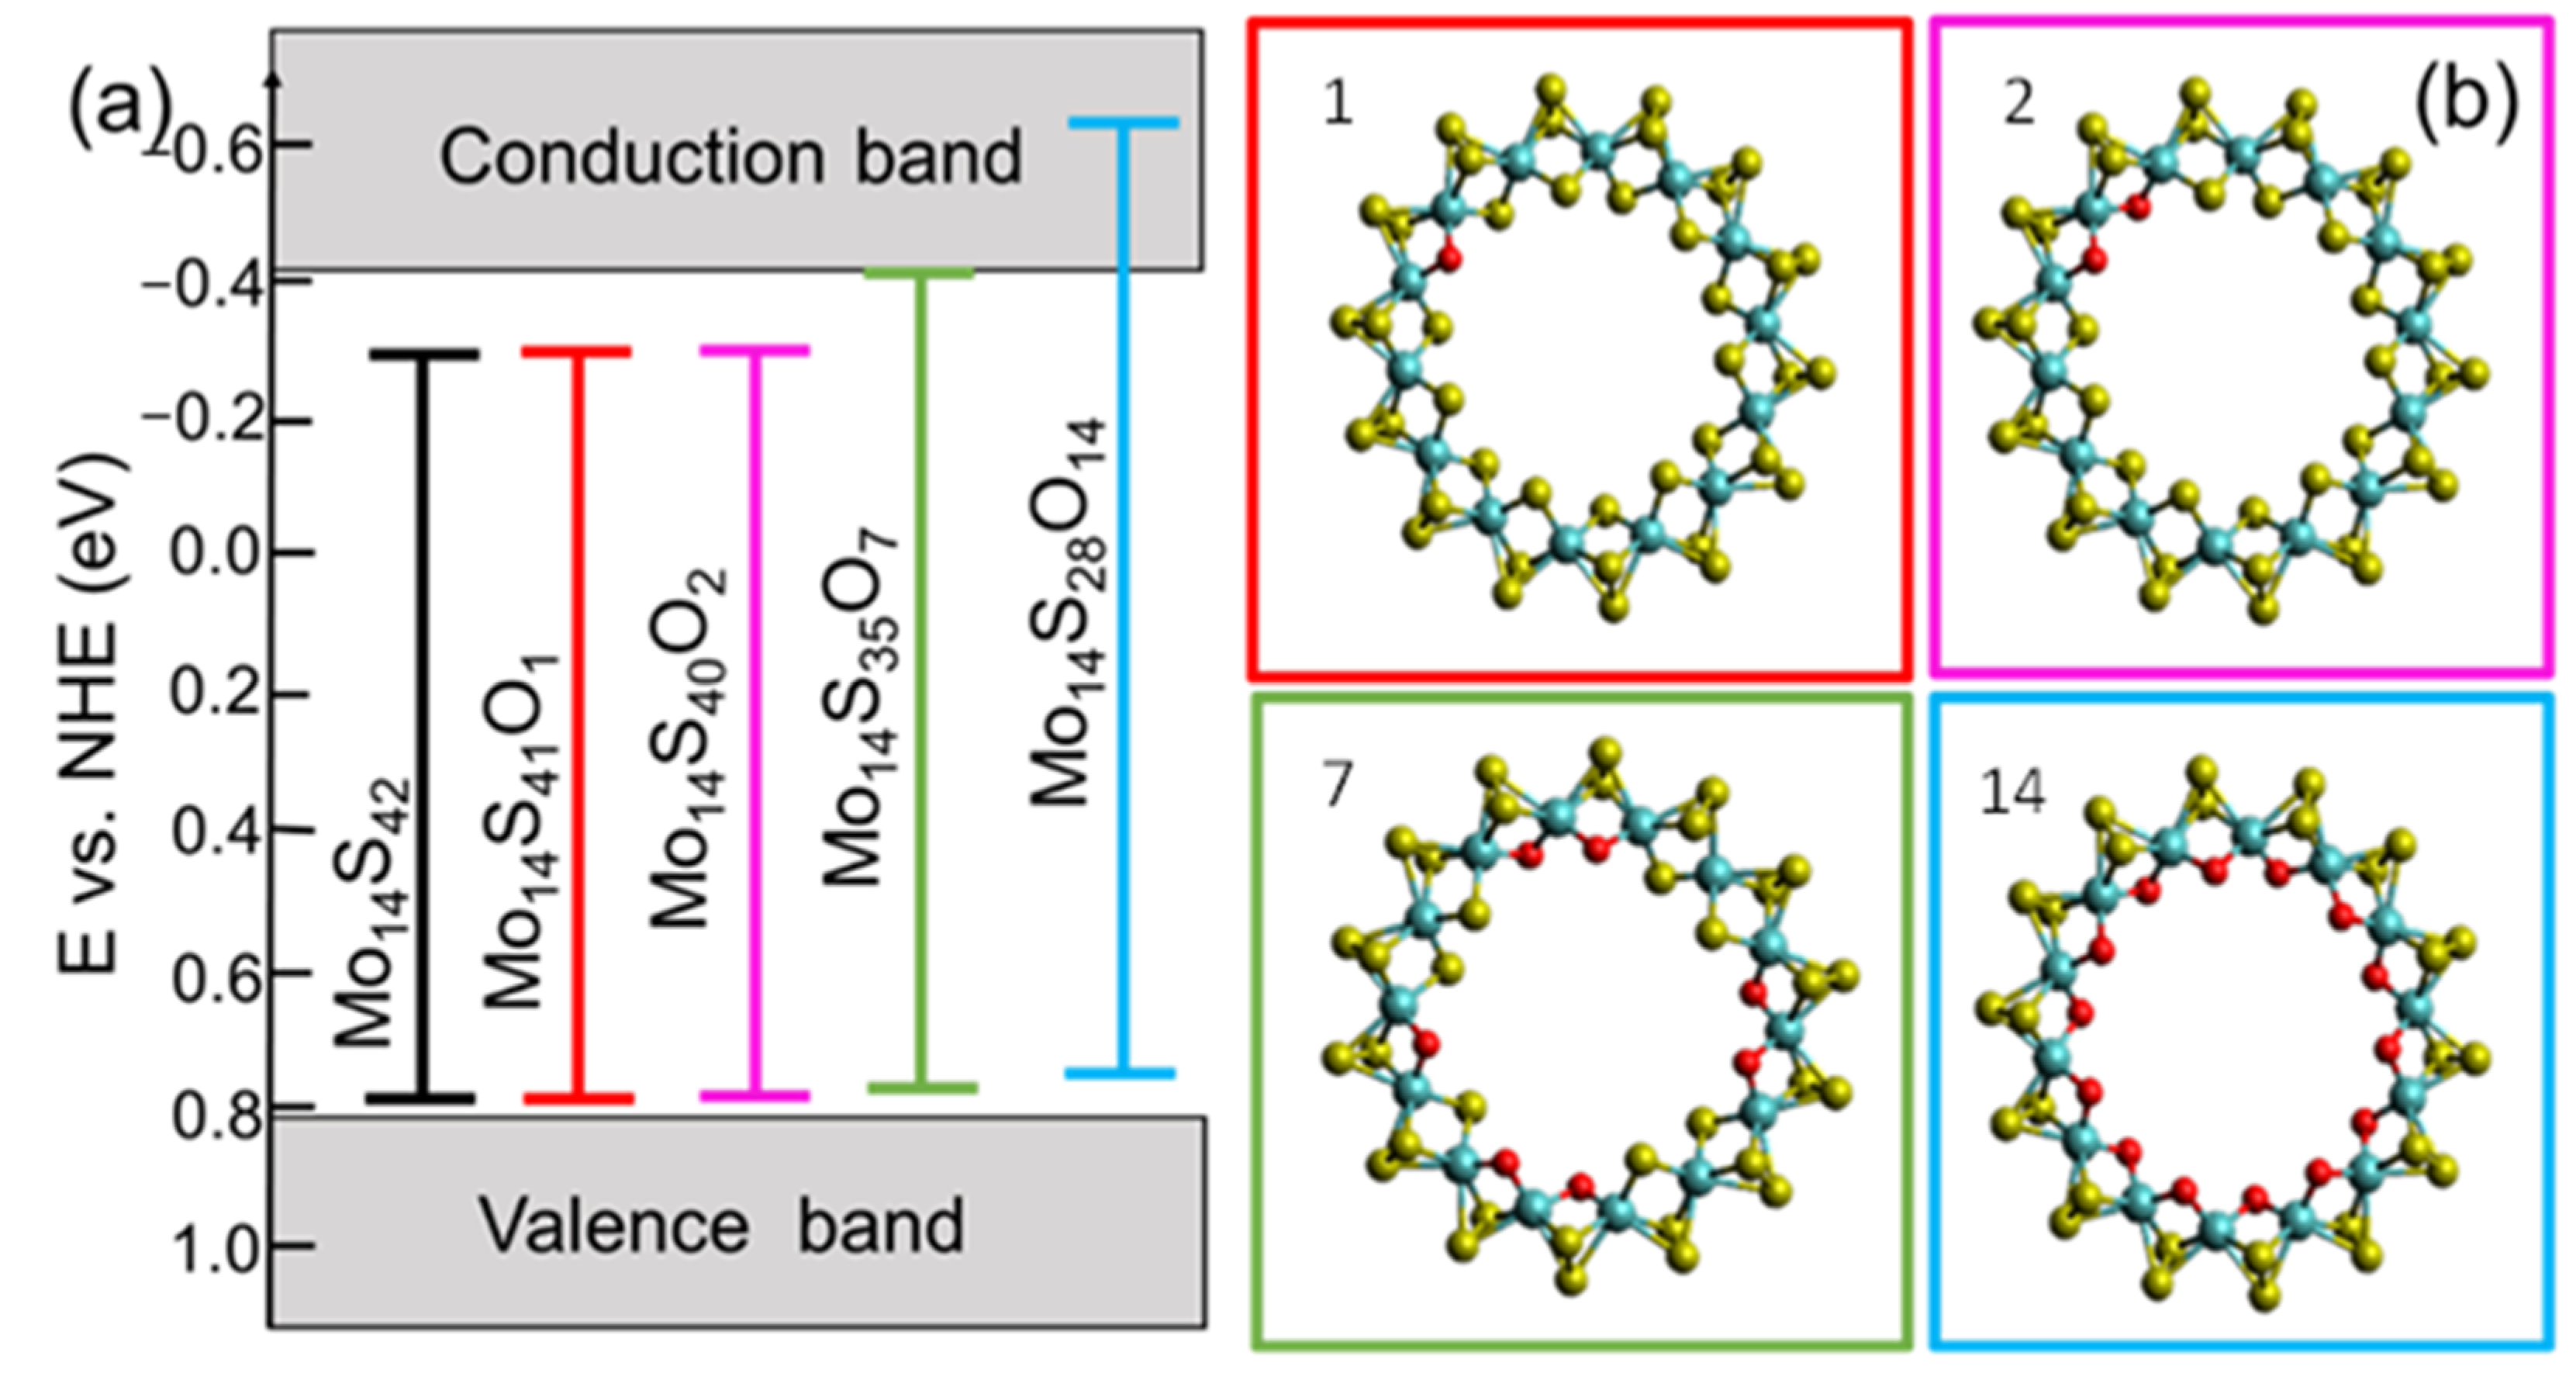
3.3. Theoretical Investigation

DFT analysis was performed to simulate the energy band structure and oxygen substitution level in MoSxOy, providing photoinduced water splitting. When constructing the structural model, we took into account that apical sulfur is not observed, and the MoS3 cluster is the most stable in the Mo–S system [60]. Therefore, the MoSxOy structure was modeled as a chain of MoS3 clusters with different oxygen substitutions for sulfur. Since the main form of structure organization of amorphous molybdenum sulfide is randomly wave-linked chains consisting of MoS3 monomers, a structure representing a closed ring with a constant radius of curvature was chosen as a model system with a minimum energy [61]. This ring-shape MoS3 structure was used for further calculations. The chosen stoichiometries are also confirmed by the experimentally found oxidation states of molybdenum: Mo+4 and Mo+5. The Mo14S42 cluster was considered as isolated. For the subsequent modeling of substitutional defects, sulfur was successively replaced by oxygen. The Mo14S42-XOX structure at x = 1, 2, 7, and 14 is shown in Figure 7b. Each of the presented structures corresponds to the minimum energy for a given stoichiometry.
According to Bader’s charge analysis [60], upon doping of MoS3 clusters, the partial charge on sulfur atoms ranges from −0.30 to −0.25, and its formal charge is −2. This charge redistribution shows that the sulfur valence electrons contribute to the Mo–S and S–S bonds, resulting in the formation of unsaturated sulfur bond.
The calculation of the band structure shows that the band gap of the isolated Mo14S42 cluster is 1.08 eV, which is insufficient for the photocatalytic splitting of water. With an increase in the fraction of impurity oxygen, the band gap increases and in the case of Mo14S28O14 (33%) it is 1.38 eV, which satisfies condition (8). However, in addition to the band gap, the photocatalyst must meet certain requirements for the position of the edges of the valence and conduction bands. To satisfy conditions (9) and (10), their positions must be respectively lower and higher than the potentials of the reactions catalyzed by the generated electron and hole. For each of the structures, the HOMO and LUMO values were calculated according to work [62] and correlated with the equilibrium potentials of hydrogen and oxygen evolution for pH 7. The found positions of the conduction and valence bands relative to the standard hydrogen electrode are −0.62 eV and 0.74 eV, respectively (Figure 7a).
Thus, DFT analysis shows that chained MoSxOy, consisting of MoS3 clusters with approximately 33% oxygen substitutions, has a band structure suitable for water photodissociation. It should be noted that MoSxOy was modeled as a linear chain, but it may look like a branched structure with a certain number of branch points. The formation of such a chain structure can occur as a result of the reaction between MoCl5 and H2S. Five-fold coordination of Mo in MoCl5 promotes the formation of a chain structure. Hydroxyl groups existing on the h-BNxOy surface supply oxygen to replace sulfur and form MoSxOy. When a relatively large MoSxOy chain is formed, it is chemically adsorbed on h-BNxOy and anchored through the formation of a chemical bond between the sulfur in the chain and oxygen in h-BNxOy. If the concentration of S–O bond is high, this leads to a redistribution of the electron density in h-BNxOy. This leads to a narrowing of the band gap. Figure 5c shows the UV-vis absorption spectra of the initial h-BNxOy (curve 1) and a-MoSxOy/h-BNxOy (curve 2) nanopowders suspended in methanol. The inset represents Tauc plot. It is seen that the band gap decreases from 5.25 eV (h-BNxOy) to 4.92 eV (a-MoSxOy/h-BNxOy).

4. Conclusions

A new approach to the synthesis of amorphous molybdenum sulfide based on the reaction between MoCl5 and H2S in dimethylformamide has been developed. a-MoSxOy/h-BNxOy nanohybrids were obtained, consisting of amorphous molybdenum oxysulfide deposited on nanoflakes of hexagonal boron oxynitride (h-BNxOy). Based on Raman and X-ray photoelectron spectroscopy results, as well as DFT analysis, a model of the amorphous structure of MoSxOy, consisting of chains of MoS3 clusters with partial substitution of oxygen for sulfur, has been constructed. When oxygen is substituted, the band gap in MoSxOy increases and at a substitution level of ~33% reaches 1.36 eV. The positions of the valence and conduction bands relative to the standard hydrogen electrode correspond to 0.74 eV and −0.62 eV. This zonal structure provides photoinduced water splitting, which is a necessary stage in the photodegradation of organic pollutants. a-MoSxOy/h-BNxOy nanohybrids are highly active in the photocatalytic degradation of methylene blue with a specific mass activity of 5.51 mmol g−1 h−1 under illumination with a mercury lamp, which is at least four times higher than so far reported values for nonmetal catalysts. The a-MoSxOy/h-BNxOy photocatalyst is very stable and can be reused.

Author Contributions

Methodology, A.T.M.; Investigation, A.T.M., D.V.L. and I.N.V.; Visualization, A.S.K.; Validation, L.A.V. and P.B.S.; Conceptualization, A.T.M. and A.S.K.; Formal analysis, S.A.K.; Writing—original draft, A.T.M.; Resources, A.M.K.; Review & editing, X.F. and D.V.S.; Supervision, D.V.S.; Editing, D.V.S.; Funding acquisition, D.V.S.; Project administration, D.V.S. All authors have read and agreed to the published version of the manuscript.

Funding

The authors gratefully acknowledge the financial support from the Russian Science Foundation (No. 21-49-00039). X.F. thanks the financial support from National Natural Science Foundation of China (No. 12061131009). The calculations were performed at the supercomputer cluster provided by the Materials Modeling and Development Laboratory at NUST “MISiS” and the Joint Supercomputer Center of the Russian Academy of Sciences.

Institutional Review Board Statement

Not applicable.

Informed Consent Statement

Not applicable.

Data Availability Statement

The data presented in this study are available on request from the corresponding author. The data are not publicly available due to privacy.

Conflicts of Interest

The authors declare no conflict of interest.

References

  1. Amoatey, P.; Baawain, M.S. Effects of Pollution on Freshwater Aquatic Organisms. Water Environ. Res. 2019, 91, 1272–1287. [Google Scholar] [CrossRef] [PubMed] [Green Version]
  2. Agbe, H.; Nyankson, E.; Raza, N.; Dodoo-Arhin, D.; Chauhan, A.; Osei, G.; Kumar, V.; Kim, K.-H. Recent Advances in Photoinduced Catalysis for Water Splitting and Environmental Applications. J. Ind. Eng. Chem. 2019, 72, 31–49. [Google Scholar] [CrossRef]
  3. Ahmad, R.; Ahmad, Z.; Khan, A.U.; Mastoi, N.R.; Aslam, M.; Kim, J. Photocatalytic Systems as an Advanced Environmental Remediation: Recent Developments, Limitations and New Avenues for Applications. J. Environ. Chem. Eng. 2016, 4, 4143–4164. [Google Scholar] [CrossRef]
  4. Li, J.; Wu, N. Semiconductor-Based Photocatalysts and Photoelectrochemical Cells for Solar Fuel Generation: A Review. Catal. Sci. Technol. 2015, 5, 1360–1384. [Google Scholar] [CrossRef]
  5. Hinnemann, B.; Moses, P.G.; Bonde, J.; Jørgensen, K.P.; Nielsen, J.H.; Horch, S.; Chorkendorff, I.; Nørskov, J.K. Biomimetic Hydrogen Evolution:  MoS2 Nanoparticles as Catalyst for Hydrogen Evolution. J. Am. Chem. Soc. 2005, 127, 5308–5309. [Google Scholar] [CrossRef]
  6. Laursen, A.B.; Kegnæs, S.; Dahl, S.; Chorkendorff, I. Molybdenum Sulfides—Efficient and Viable Materials for Electro–and Photoelectrocatalytic Hydrogen Evolution. Energy Environ. Sci. 2012, 5, 5577–5591. [Google Scholar] [CrossRef]
  7. Jaramillo, T.F.; Jørgensen, K.P.; Bonde, J.; Nielsen, J.H.; Horch, S.; Chorkendorff, I. Identification of Active Edge Sites for Electrochemical H2 Evolution from MoS2 Nanocatalysts. Science 2007, 317, 100–102. [Google Scholar] [CrossRef] [Green Version]
  8. Xie, J.; Zhang, J.; Li, S.; Grote, F.; Zhang, X.; Zhang, H.; Wang, R.; Lei, Y.; Pan, B.; Xie, Y. Controllable Disorder Engineering in Oxygen-Incorporated MoS2 Ultrathin Nanosheets for Efficient Hydrogen Evolution. J. Am. Chem. Soc. 2013, 135, 17881–17888. [Google Scholar] [CrossRef]
  9. Tran, P.D.; Tran, T.V.; Orio, M.; Torelli, S.; Truong, Q.D.; Nayuki, K.; Sasaki, Y.; Chiam, S.Y.; Yi, R.; Honma, I.; et al. Coordination Polymer Structure and Revisited Hydrogen Evolution Catalytic Mechanism for Amorphous Molybdenum Sulfide. Nat. Mater. 2016, 15, 640–646. [Google Scholar] [CrossRef] [PubMed]
  10. Pető, J.; Ollár, T.; Vancsó, P.; Popov, Z.I.; Magda, G.Z.; Dobrik, G.; Hwang, C.; Sorokin, P.B.; Tapasztó, L. Spontaneous Doping of the Basal Plane of MoS2 Single Layers through Oxygen Substitution under Ambient Conditions. Nat. Chem. 2018, 10, 1246–1251. [Google Scholar] [CrossRef] [PubMed]
  11. Benck, J.D.; Chen, Z.; Kuritzky, L.Y.; Forman, A.J.; Jaramillo, T.F. Amorphous Molybdenum Sulfide Catalysts for Electrochemical Hydrogen Production: Insights into the Origin of Their Catalytic Activity. ACS Catal. 2012, 2, 1916–1923. [Google Scholar] [CrossRef]
  12. Kumar, P.; Singh, M.; Reddy, G.B. Oxidized Core–Shell MoO2–MoS2 Nanostructured Thin Films for Hydrogen Evolution. ACS Appl. Nano Mater. 2020, 3, 711–723. [Google Scholar] [CrossRef] [Green Version]
  13. Chen, I.-W.P.; Lai, Y.-M.; Liao, W.-S. One-Pot Synthesis of Chlorophyll-Assisted Exfoliated MoS2/WS2 Heterostructures via Liquid-Phase Exfoliation Method for Photocatalytic Hydrogen Production. Nanomaterials 2021, 11, 2436. [Google Scholar] [CrossRef] [PubMed]
  14. Wu, L.; Longo, A.; Dzade, N.Y.; Sharma, A.; Hendrix, M.M.R.M.; Bol, A.A.; de Leeuw, N.H.; Hensen, E.J.M.; Hofmann, J.P. The Origin of High Activity of Amorphous MoS2 in the Hydrogen Evolution Reaction. ChemSusChem 2019, 12, 4383–4389. [Google Scholar] [CrossRef] [Green Version]
  15. Le, D.; Rawal, T.B.; Rahman, T.S. Single-Layer MoS2 with Sulfur Vacancies: Structure and Catalytic Application. J. Phys. Chem. C 2014, 118, 5346–5351. [Google Scholar] [CrossRef]
  16. Singh, N.; Jabbour, G.; Schwingenschlögl, U. Optical and Photocatalytic Properties of Two-Dimensional MoS2. Eur. Phys. J. B 2012, 85, 392. [Google Scholar] [CrossRef]
  17. Li, Y.; Li, Y.-L.; Araujo, C.M.; Luo, W.; Ahuja, R. Single-Layer MoS2 as an Efficient Photocatalyst. Catal. Sci. Technol. 2013, 3, 2214–2220. [Google Scholar] [CrossRef] [Green Version]
  18. Zhang, X.; Shao, C.; Li, X.; Miao, F.; Wang, K.; Lu, N.; Liu, Y. 3D MoS2 Nanosheet/TiO2 Nanofiber Heterostructures with Enhanced Photocatalytic Activity under UV Irradiation. J. Alloy. Compd. 2016, 686, 137–144. [Google Scholar] [CrossRef]
  19. Pesci, F.M.; Sokolikova, M.S.; Grotta, C.; Sherrell, P.C.; Reale, F.; Sharda, K.; Ni, N.; Palczynski, P.; Mattevi, C. MoS2/WS2 Heterojunction for Photoelectrochemical Water Oxidation. ACS Catal. 2017, 7, 4990–4998. [Google Scholar] [CrossRef] [Green Version]
  20. Mohanty, B.; Ghorbani-Asl, M.; Kretschmer, S.; Ghosh, A.; Guha, P.; Panda, S.K.; Jena, B.; Krasheninnikov, A.V.; Jena, B.K. MoS2 Quantum Dots as Efficient Catalyst Materials for the Oxygen Evolution Reaction. ACS Catal. 2018, 8, 1683–1689. [Google Scholar] [CrossRef]
  21. Lalithambika, K.C.; Shanmugapriya, K.; Sriram, S. Photocatalytic Activity of MoS2 Nanoparticles: An Experimental and DFT Analysis. Appl. Phys. A 2019, 125, 817. [Google Scholar] [CrossRef]
  22. Zhang, Z.-G.; Liu, H.; Wang, X.-X.; Zhang, J.; Yu, M.; Ramakrishna, S.; Long, Y.-Z. One-Step Low Temperature Hydrothermal Synthesis of Flexible TiO2/PVDF@MoS2 Core-Shell Heterostructured Fibers for Visible-Light-Driven Photocatalysis and Self-Cleaning. Nanomaterials 2019, 9, 431. [Google Scholar] [CrossRef] [Green Version]
  23. Liu, L.; Wu, W.; Fang, Y.; Liu, H.; Chen, F.; Zhang, M.; Qin, Y. Functionalized MoS2 Nanoflowers with Excellent Near-Infrared Photothermal Activities for Scavenging of Antibiotic Resistant Bacteria. Nanomaterials 2021, 11, 2829. [Google Scholar] [CrossRef]
  24. Hasija, V.; Raizada, P.; Thakur, V.K.; Parwaz Khan, A.A.; Asiri, A.M.; Singh, P. An Overview of Strategies for Enhancement in Photocatalytic Oxidative Ability of MoS2 for Water Purification. J. Environ. Chem. Eng. 2020, 8, 104307. [Google Scholar] [CrossRef]
  25. Huang, W.-H.; Li, X.-M.; Yang, X.-F.; Zhang, H.-B.; Wang, F.; Zhang, J. Highly Efficient Electrocatalysts for Overall Water Splitting: Mesoporous CoS/MoS2 with Hetero-Interfaces. Chem. Commun. 2021, 57, 4847–4850. [Google Scholar] [CrossRef] [PubMed]
  26. Yang, Z.; Hao, J.; Lau, S.P. Synthesis, Properties, and Applications of 2D Amorphous Inorganic Materials. J. Appl. Phys. 2020, 127, 220901. [Google Scholar] [CrossRef]
  27. Chiawchan, T.; Ramamoorthy, H.; Buapan, K.; Somphonsane, R. CVD Synthesis of Intermediate State-Free, Large-Area and Continuous MoS2 via Single-Step Vapor-Phase Sulfurization of MoO2 Precursor. Nanomaterials 2021, 11, 2642. [Google Scholar] [CrossRef]
  28. Merki, D.; Fierro, S.; Vrubel, H.; Hu, X. Amorphous Molybdenum Sulfide Films as Catalysts for Electrochemical Hydrogen Production in Water. Chem. Sci. 2011, 2, 1262–1267. [Google Scholar] [CrossRef] [Green Version]
  29. Morales-Guio, C.G.; Hu, X. Amorphous Molybdenum Sulfides as Hydrogen Evolution Catalysts. Acc. Chem. Res. 2014, 47, 2671–2681. [Google Scholar] [CrossRef] [PubMed] [Green Version]
  30. Dinda, D.; Ahmed, M.E.; Mandal, S.; Mondal, B.; Saha, S.K. Amorphous Molybdenum Sulfide Quantum Dots: An Efficient Hydrogen Evolution Electrocatalyst in Neutral Medium. J. Mater. Chem. A 2016, 4, 15486–15493. [Google Scholar] [CrossRef]
  31. Mishra, N.S.; Saravanan, P. A Review on the Synergistic Features of Hexagonal Boron Nitride (White Graphene) as Adsorbent-Photo Active Nanomaterial. ChemistrySelect 2018, 3, 8023–8034. [Google Scholar] [CrossRef]
  32. Zhao, G.; Wang, A.; He, W.; Xing, Y.; Xu, X. 2D New Nonmetal Photocatalyst of Sulfur-Doped h-BN Nanosheeets with High Photocatalytic Activity. Adv. Mater. Interfaces 2019, 6, 1900062. [Google Scholar] [CrossRef]
  33. Liu, T.; Liu, Z. 2D MoS2 Nanostructures for Biomedical Applications. Adv. Healthc. Mater. 2018, 7, 1701158. [Google Scholar] [CrossRef] [PubMed]
  34. Wang, N.; Wang, H.; Tang, C.; Lei, S.; Shen, W.; Wang, C.; Wang, G.; Wang, Z.; Wang, L. Toxicity Evaluation of Boron Nitride Nanospheres and Water-Soluble Boron Nitride in Caenorhabditis Elegans. Int. J. Nanomed. 2017, 12, 5941–5957. [Google Scholar] [CrossRef] [Green Version]
  35. Gerrard, W. Solubility of Hydrogen Sulphide, Dimethyl Ether, Methyl Chloride and Sulphur Dioxide in Liquids. The Prediction of Solubility of All Gases. J. Appl. Chem. Biotechnol. 2007, 22, 623–650. [Google Scholar] [CrossRef]
  36. Hunger, J.; Buchner, R.; Kandil, M.E.; May, E.F.; Marsh, K.N.; Hefter, G. Relative Permittivity of Dimethylsulfoxide and N,N-Dimethylformamide at Temperatures from (278 to 328) K and Pressures from (0.1 to 5) MPa. J. Chem. Eng. Data 2010, 55, 2055–2065. [Google Scholar] [CrossRef]
  37. Endler, I.; Leonhardt, A.; König, U.; van den Berg, H.; Pitschke, W.; Sottke, V. Chemical Vapour Deposition of MoS2 Coatings Using the Precursors MoCl5 and H2S. Surf. Coat. Technol. 1999, 120–121, 482–488. [Google Scholar] [CrossRef]
  38. Kresse, G.; Furthmüller, J. Efficient Iterative Schemes for Ab Initio Total-Energy Calculations Using a Plane-Wave Basis Set. Phys. Rev. B 1996, 54, 11169–11186. [Google Scholar] [CrossRef]
  39. Kresse, G.; Furthmüller, J. Efficiency of Ab-Initio Total Energy Calculations for Metals and Semiconductors Using a Plane-Wave Basis Set. Comput. Mater. Sci. 1996, 6, 15–50. [Google Scholar] [CrossRef]
  40. Shimojo, F.; Hoshino, K.; Zempo, Y. Ab Initio Molecular-Dynamics Simulation Method for Complex Liquids. Comput. Phys. Commun. 2001, 142, 364–367. [Google Scholar] [CrossRef]
  41. Ren, J.; Stagi, L.; Innocenzi, P. Hydroxylated Boron Nitride Materials: From Structures to Functional Applications. J. Mater. Sci. 2021, 56, 4053–4079. [Google Scholar] [CrossRef]
  42. Matveev, A.T.; Permyakova, E.S.; Kovalskii, A.M.; Leibo, D.; Shchetinin, I.V.; Maslakov, K.I.; Golberg, D.V.; Shtansky, D.V.; Konopatsky, A.S. New Insights into Synthesis of Nanocrystalline Hexagonal BN. Ceram. Int. 2020, 46, 19866–19872. [Google Scholar] [CrossRef]
  43. Deng, Y.; Ting, L.R.L.; Neo, P.H.L.; Zhang, Y.-J.; Peterson, A.A.; Yeo, B.S. Operando Raman Spectroscopy of Amorphous Molybdenum Sulfide (MoSx) during the Electrochemical Hydrogen Evolution Reaction: Identification of Sulfur Atoms as Catalytically Active Sites for H+ Reduction. ACS Catal. 2016, 6, 7790–7798. [Google Scholar] [CrossRef]
  44. Müller, A.; Jaegermann, W.; Enemark, J.H. Disulfur Complexes. Coord. Chem. Rev. 1982, 46, 245–280. [Google Scholar] [CrossRef]
  45. Fedin, V.; Kolesov, B.; Mironov, Y.; Fedorov, V.Y. Synthesis and Vibrational (IR and Raman) Spectroscopic Study of Triangular Thio-Complexes [Mo3S13]2−Containing 92Mo, 100Mo and 34S Isotopes. Polyhedron 1989, 8, 2419–2423. [Google Scholar] [CrossRef]
  46. Fominski, V.; Demin, M.; Nevolin, V.; Fominski, D.; Romanov, R.; Gritskevich, M.; Smirnov, N. Reactive Pulsed Laser Deposition of Clustered-Type MoSx (x ~ 2, 3, and 4) Films and Their Solid Lubricant Properties at Low Temperature. Nanomaterials 2020, 10, 653. [Google Scholar] [CrossRef] [PubMed] [Green Version]
  47. Mignuzzi, S.; Pollard, A.J.; Bonini, N.; Brennan, B.; Gilmore, I.S.; Pimenta, M.A.; Richards, D.; Roy, D. Effect of Disorder on Raman Scattering of Single-Layer MoS2. Phys. Rev. B 2015, 91, 195411. [Google Scholar] [CrossRef] [Green Version]
  48. Griffith, W.P. Raman Studies on Rock-Forming Minerals. Part II. Minerals Containing MO3, MO4, and MO6 Groups. J. Chem. Soc. Inorg. Phys. Theor. 1970, 286–291. [Google Scholar] [CrossRef]
  49. Simon, G.; Hehlen, B.; Vacher, R.; Courtens, E. Hyper-Raman Scattering Analysis of the Vibrations in Vitreous Boron Oxide. Phys. Rev. B 2007, 76, 054210. [Google Scholar] [CrossRef] [Green Version]
  50. Gouin, X.; Grange, P.; Bois, L.; L’Haridon, P.; Laurent, Y. Characterization of the Nitridation Process of Boric Acid. J. Alloy. Compd. 1995, 224, 22–28. [Google Scholar] [CrossRef]
  51. Weber, T.; Muijsers, J.C.; Niemantsverdriet, J.W. Structure of Amorphous MoS3. J. Phys. Chem. 1995, 99, 9194–9200. [Google Scholar] [CrossRef] [Green Version]
  52. Xi, F.; Bogdanoff, P.; Harbauer, K.; Plate, P.; Höhn, C.; Rappich, J.; Wang, B.; Han, X.; van de Krol, R.; Fiechter, S. Structural Transformation Identification of Sputtered Amorphous MoSx as an Efficient Hydrogen-Evolving Catalyst during Electrochemical Activation. ACS Catal. 2019, 9, 2368–2380. [Google Scholar] [CrossRef]
  53. Kibsgaard, J.; Jaramillo, T.F.; Besenbacher, F. Building an Appropriate Active-Site Motif into a Hydrogen-Evolution Catalyst with Thiomolybdate [Mo3S13]2− Clusters. Nat. Chem. 2014, 6, 248–253. [Google Scholar] [CrossRef] [PubMed] [Green Version]
  54. Hao, R.; Wang, G.; Jiang, C.; Tang, H.; Xu, Q. In Situ Hydrothermal Synthesis of G-C3N4/TiO2 Heterojunction Photocatalysts with High Specific Surface Area for Rhodamine B Degradation. Appl. Surf. Sci. 2017, 411, 400–410. [Google Scholar] [CrossRef]
  55. Lin, J.; Luo, Z.; Liu, J.; Li, P. Photocatalytic Degradation of Methylene Blue in Aqueous Solution by Using ZnO-SnO2 Nanocomposites. Mater. Sci. Semicond. Process. 2018, 87, 24–31. [Google Scholar] [CrossRef]
  56. Solehudin, M.; Sirimahachai, U.; Ali, G.A.M.; Chong, K.F.; Wongnawa, S. One-Pot Synthesis of Isotype Heterojunction g-C3N4-MU Photocatalyst for Effective Tetracycline Hydrochloride Antibiotic and Reactive Orange 16 Dye Removal. Adv. Powder Technol. 2020, 31, 1891–1902. [Google Scholar] [CrossRef]
  57. Liu, X.; Xing, Z.; Zhang, H.; Wang, W.; Zhang, Y.; Li, Z.; Wu, X.; Yu, X.; Zhou, W. Fabrication of 3D Mesoporous Black TiO2/MoS2/TiO2 Nanosheets for Visible-Light-Driven Photocatalysis. ChemSusChem 2016, 9, 1118–1124. [Google Scholar] [CrossRef] [PubMed]
  58. Laouini, S.E.; Bouafia, A.; Soldatov, A.V.; Algarni, H.; Tedjani, M.L.; Ali, G.A.M.; Barhoum, A. Green Synthesized of Ag/Ag2O Nanoparticles Using Aqueous Leaves Extracts of Phoenix Dactylifera L. and Their Azo Dye Photodegradation. Membranes 2021, 11, 468. [Google Scholar] [CrossRef]
  59. Lakshmi, S.; Renganathan, R.; Fujita, S. Study on TiO2-Mediated Photocatalytic Degradation of Methylene Blue. J. Photochem. Photobiol. Chem. 1995, 88, 163–167. [Google Scholar] [CrossRef]
  60. Henkelman, G.; Arnaldsson, A.; Jónsson, H. A Fast and Robust Algorithm for Bader Decomposition of Charge Density. Comput. Mater. Sci. 2006, 36, 354–360. [Google Scholar] [CrossRef]
  61. Sahu, A.; Steinmann, S.N.; Raybaud, P. Size-Dependent Structural, Energetic, and Spectroscopic Properties of MoS3 Polymorphs. Cryst. Growth Des. 2020, 20, 7750–7760. [Google Scholar] [CrossRef]
  62. Cheriyan, S.; Balamurgan, D.; Sriram, S. Doping Effect on Monolayer MoS2 for Visible Light Dye Degradation—A DFT Study. Superlattices Microstruct. 2018, 116, 238–243. [Google Scholar] [CrossRef]
Figure 1. HAADF-STEM image with corresponding EDXS elemental maps of the as-synthesized a-MoSxOy/h-BNxOy nanohybrids (a). High-resolution TEM micrographs of the pristine h-BNxOy (b) and as-synthesized a-MoSxOy/h-BNxOy nanohybrids (c).
Nanomaterials 11 03232 g001
Figure 2. XRD patterns (a) and FTIR (b), Raman (c), and XPS (dk) spectra of h-BNxOy and a-MoSxOy/h-BNxOy materials. h-BNxOy—(a,b,df), a-MoSxOy/h-BNxOy—(ac,gk).
Nanomaterials 11 03232 g002
Figure 3. HAADF-STEM (a) and HRTEM (b) images with corresponding EDXS elemental maps (c) of a-MoSxOy/h-BNxOy nanohybrids after annealing in vacuum at 600 °C for 1 h.
Nanomaterials 11 03232 g003
Figure 4. Survey spectra of h-BNxOy (a) and a-MoSxOy/h-BNxOy materials (b).
Nanomaterials 11 03232 g004
Figure 5. UV-vis absorption spectra of MB water solution (a). 1—MB without UV-illumination, 2—MB after illumination for 30 min, 3—MB + a-MoSxOy/h-BNxOy (denoted as Cat) after 30 min exposure in the dark, 4–7—Cat after illumination for 5, 15, 30, and 60 min. UV-vis absorption spectra of MB + h-BNxOy suspension (b). UV-vis absorption spectra (c) of h-BNxOy (curve 1) and a-MoSxOy/h-BNxOy (curve 2) nanopowders suspended in methanol. The inset shows the Tauc plot and band gap values for h-BNxOy (curve 1) and a-MoSxOy/h-BNxOy (curve 2).
Nanomaterials 11 03232 g005
Figure 6. Photocatalytic performance of a-MoSxOy/h-BNxOy catalyst upon decolorization of three concentrations of MB aqueous solutions under UV irradiation (a). Reusability of a-MoSxOy/h-BNxOy catalyst during the degradation of a MB aqueous solution under UV irradiation (b).
Nanomaterials 11 03232 g006
Figure 7. Energy diagram of the valence and conduction bands of Mo14S42−XOX cluster at x = 0, 1, 2, 7, 14, in comparison with a normal hydrogen electrode (a) and changes in the amorphous structure of Mo14S42−XOX upon oxygen substitution for sulfur (b). (1) x = 1, (2) x = 2, (7) x = 7, (14) x =14.
Nanomaterials 11 03232 g007
Table 1. Binding energy values of B 1s, N 1s, and O 1s peaks of h-BNxOy and a-MoSxOy/h-BNxOy materials in accordance with the deconvolution of XPS spectra, as shown in Figure 2d–i.
MaterialBinding Energy (eV)
B 1sN 1sO 1s
h-BNxOy192.8191.0190.2399.0398.0534.8536.6
a-MoSxOy/h-BNO 191.7190.6398.8398.2 532.9531.0
Table 2. Binding energy values of Mo 3d and S 2s peaks in accordance with the deconvolution of XPS spectrum, as shown in Figure 2j.
Binding Energy (eV)
Mo(6+) Mo(5+) Mo(4+) S 2s
3d3/23d5/23d3/23d5/23d3/23d5/2
237.9234.8236.3233.1232.9229.8227.0226.1
Table 3. Binding energy values of S 2p peaks in accordance with the deconvolution of XPS spectrum, as shown in Figure 2k.
Binding Energy (eV)
S 2p S (I) S (II)
2p1/22p3/22p1/22p3/2
170.2168.8164.9162.3165.3163.8
Table 4. Photodegradation efficiency of various catalytic systems.
Catalytic System, (g L−1)Dye, (g L−1)LampSpecific Catalyst Mass Activity (mmol g−1 h−1)Reference
MoS2/TiO2 *) (0.045)RhB (0.01)high pressure Hg lamp, 50 W0.766[18]
MoS2/TiO2 *) (0.045)MO (0.01)λ = 313 nm1.33[18]
Nanosheets S-BN (0.5)RhB (0.02)Xenon lamp, 500 W, λ > 400 nm0.03[32]
g-C3N4/TiO2 (0.04)RhB (0.11)Xenon arc, 350 W, λ > 420 nm0.188[54]
Nano (ZnO-SnO2) (0.2)MB (0.02)Hg lamp, 250 W0.005[55]
g-C3N4/MU (1.0)RO16 (0.01)Xenon lamp, 55 W, λ > 420 nm0.009[56]
MBTiO2/MoS2/TiO2MO (0.01)Visible light0.014[57]
Ag/Ag2O nanoparticles (0.004) with NaBH4MB (~0.115)-~85[58]
a-MoSxOy/h-BNxOy **) (0.006)MB (0.02 g·L−1)Hg lamp, 145 W5.51This work
*) Calculated for the mass of MoS2. **) Calculated for the mass of a-MoSxOy.
Publisher’s Note: MDPI stays neutral with regard to jurisdictional claims in published maps and institutional affiliations.

