Article

The Biolog EcoPlate™ Technique for Assessing the Effect of Metal Oxide Nanoparticles on Freshwater Microbial Communities

Department of Applied Biotechnology and Food Science, Faculty of Chemical Technology and Biotechnology, Budapest University of Technology and Economics, H-1111 Budapest, Hungary
*
Author to whom correspondence should be addressed.
Submission received: 27 May 2021 / Revised: 5 July 2021 / Accepted: 6 July 2021 / Published: 8 July 2021
(This article belongs to the Special Issue Metallic and Metal Oxide Nanoparticles and Their Applications)

Abstract

:
The application of Biolog EcoPlate™ for community-level physiological profiling of soils is well documented; however, the functional diversity of aquatic bacterial communities has been hardly studied. The objective of this study was to investigate the applicability of the Biolog EcoPlate™ technique and evaluate comparatively the applied endpoints, for the characterisation of the effects of metal oxide nanoparticles (MONPs) on freshwater microbial communities. Microcosm experiments were run to assess the effect of nano ZnO and nano TiO2 in freshwater at 0.8–100 mg/L concentration range. The average well colour development, substrate average well colour development, substrate richness, Shannon index and evenness, Simpson index, McIntosh index and Gini coefficient were determined to quantify the metabolic capabilities and functional diversity. Comprehensive analysis of the experimental data demonstrated that short-term exposure to TiO2 and ZnO NPs affected the metabolic activity at different extent and through different mechanisms of action. TiO2 NPs displayed lower impact on the metabolic profile showing up to 30% inhibition. However, the inhibitory effect of ZnO NPs reached 99% with clearly concentration-dependent responses. This study demonstrated that the McIntosh and Gini coefficients were well applicable and sensitive diversity indices. The parallel use of general metabolic capabilities and functional diversity indices may improve the output information of the ecological studies on microbial communities.

Graphical Abstract

1. Introduction

Microbial diversity in aquatic and terrestrial environments is a key component of ecosystem functioning, consequently contamination of these environmental matrices poses potential threats to the structure and function of the respective ecosystems [1,2,3]. Nano titanium dioxide (nTiO2) and nano zinc oxide (nZnO) belong to the anthropogenic engineered metal oxide nanoparticles (MO-ENPs), the production and use of which was estimated to increase exponentially during the years owing to their extensive application in medicine, electronics, cosmetic and textile industry [4,5], but recently also in modern agriculture [6]. The likeliness of nTiO2 and nZnO release into the environment is higher than that of other ENPs, given their high global production and consumption volume among the MONPs [7] and the several transport pathways. Some studies have reported the presence of anthropogenic ENPs, particularly TiO2, in streams [8], wastewater treatment plants [9,10] and lakes [11]. Once released into the aquatic environment, MONPs have been reported to be involved in homo- and hetero-aggregation followed by precipitation or sedimentation and accumulation [12,13,14,15].
Furthermore, in the presence of ligands (Cl, SO42–, NO3– etc.), ENPs may form complexes and adsorb onto natural organic matter (NOM) [15]. Therefore, the stability of ENPs in the aquatic ecosystems is influenced by environmental factors and the properties of NPs [16], which in turn will influence their fate and effect on aquatic biota.
On the other hand, the effect of MONPs in the environment is different to their bulk size or dissolved ion counterparts, because of their high surface-to-volume ratio and surface characteristics, such as the intensified charge and reactivity [17]. In addition, the ecotoxicity of MONPs is also determined by further factors including size, oxidative state, exposure time, particle concentration and the target organism and its habitat [18,19,20,21]. As reviewed by Parada et al. [22], there are numerous nano-ecotoxicological studies on the potential toxicity of MONPs involving single species aquatic model organisms, such as daphnids, zebrafish, algae, freshwater bivalve, diatom.
The significance of microbial activity concerning the ecosystem functionality and services is well established, but microbial diversity of natural waters—especially the effect of NPs on the biodiversity and structure of the complex aquatic microbial community—has not been studied extensively. There are some valuable results on this topic based on various approaches focused on rivers [15,23], a stream [13], marine estuarine sediments [24], groundwater [25], and three Swedish lakes [11], nevertheless, the effect of nTiO2 and nZnO on complex aquatic microbial communities needs further investigations and novel approaches, and Biolog EcoPlate™ could be a great tool for this aim.
Battin et al. [13] provided the first evidence that nano-TiO2 significantly impacted natural microbial communities (bacteria stream biofilms) under natural levels of UV radiation and TiO2 concentrations expected in surface waters. To examine the effect of nano-TiO2 on the membrane integrity of planktonic microorganisms and biofilm cells in stream water microcosms, nucleic acid stains and epifluorescence microscopy was used [13].
Farkas et al. [11] conducted the first ecotoxicological study assessing the effect of nTiO2 on bacterial communities in situ, in three lakes, taking into consideration dissolved organic carbon (DOC) concentrations, element concentrations and light regimes. Bacterial growth after the termination of the exposure period was determined as abundance in the water samples analysed by flow cytometry. Their results demonstrated that TiO2 NPs could affect natural lake-water bacterial communities in terms of bacterial abundance and bacterial activity. The study also showed that nTiO2 significantly affected natural lake water bacteria and the effects varied among communities from lakes depending on the chemical parameters of the water.
To study the microbiological impact of zero-valent iron in the remediation of groundwater exposed to a trichloroethylene-degrading anaerobic microbial community Zabetakis et al. [25] monitored the changes in total bacterial and archaeal population numbers using qPCR.
Londono et al. [15] spiked TiO2 at 700 µg/L, ZnO at 70 µg/L either separately or combined to freshly collected river water samples to investigate effects of engineered nanoparticles (ENPs) at environmentally relevant concentrations to aquatic microbial communities. DNA extraction was employed followed by next-generation sequencing to understand the change of microbial distribution responding to the presence of the ENPs in river water samples. Species richness (S) was determined by a genera or species taxa count, while for each treatment the Shannon index (H) for species diversity and species evenness was calculated. Compared to controls where no ENPs were added, the addition of TiO2 NPs alone at the tested concentration had no statistically significant effect on both the bacterial and eukaryotic communities. The presence of added ZnO or ZnO + TiO2 led to significant shift of the microbial community structure and genus distribution. This shift was more obvious for the bacteria than the eukaryotes. Based on results from single particle–inductively coupled plasma–mass spectrometry (SP-ICP-MS), all ENPs aggregated rapidly in water and resulted in much larger particles sizes than the original counterparts. The “dissolved” (including particles smaller than the size detection limits and dissolved ions) concentrations of Ti and Zn also increased in the treatment groups vs. the controls [15].
Most of the conducted studies demonstrated that natural aquatic bacterial communities were more sensitive towards individual MONPs than single strains, due to differences in resistance, highlighting the importance of their investigation [11,15]. Comparing the effect of nTiO2 on complex bacterial communities with the effect on single species in other studies, Farkas et al. [11] assumed that in complex bacterial communities the sum of effects on different strains will determine the overall effect on bacterial abundance and productivity. However, in the case of bacterial communities the factors that are toxic to a subset of the community might affect negatively the functioning of the overall community, altering the interaction among the strains [2].
To study microbial diversity in the aquatic environment several biochemical or molecular techniques emerged, as seen in the articles cited above. However, the application of the Biolog EcoPlate™ for studying the MONPs-mediated influences on microbial diversity in aquatic systems was demonstrated only in a few studies. In spite of this, Biolog EcoPlate™ is a low-cost, convenient and rapid technique for investigating the physiological diversity in the environment and provides information about community-level physiological profiles (CLPP).
Christian and Lind [26] explored several aspects of Biolog EcoPlate™ use for freshwater bacterial assemblages including inoculum density, incubation temperature, non-bacterial colour development, and substrate selectivity and proposed a technique to allow EcoPlate™ use in anaerobic freshwater bacterial studies.
Xie et al. [27] recently explored bacterial diversity, community composition and metabolic function in Lake Tianmuhu, China, and in its upstream dammed river, using Illumina MiSeq sequencing and the Biolog EcoPlate™ method to identify the effects of anthropogenic disturbances, such as pollution discharge and damming on biodiversity.
Even though the above-mentioned studies did apply the Biolog EcoPlate™ method for soil bacterial community analysis, unfortunately, they did not report on some important parameters, such as the reagents, sample preparation, incubation time, applied dilutions and precise formulas for calculations. In addition, these studies usually only evaluated a few Biolog-derived endpoints (usually just AWCD and AUC, sometimes SR) in terms of biodiversity and microbial community structure. The majority of the conducted microbial community studies tested ENPs typically higher than 100 mg/L concentrations, and only some studies reported above 1 mg/L [15].
The objective of our work was the evaluation of the applicability of the Biolog EcoPlate™ technique, a promising tool for community-level physiological profiling, in the investigation of the concentration- and time-dependent effect of MONPs on the biodiversity and functionality of freshwater microbial communities.
The research was conducted in lab-scale aquatic microcosms including only water from Lake Balaton as a model for aquatic surface environments.
We hypothesised that: (i) the metallic NPs (nTiO2 and nZnO) added to Balaton water would alter the activity and community composition of microbes, (ii) the concentration of NPs as well as the exposure time would influence their effect, (iii) the applicability of Biolog EcoPlate™ for characterising the effect of metal oxide nanoparticles on freshwater microbial communities would be demonstrated based on substrate use patterns and that (iv) the applied Biolog-derived endpoints—characterising both the microbial activity and diversity—would provide reliable and a wide range of information about the microbial communities affected by NPs exposure.

2. Materials and Methods

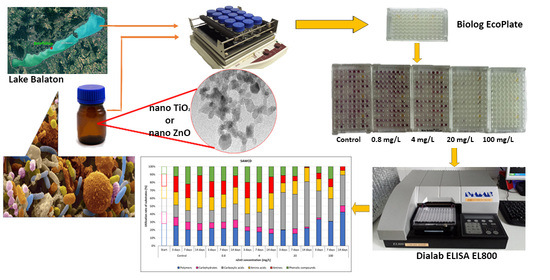
2.1. Freshwater Samples from Lake Balaton

Water samples from Lake Balaton, Révfülöp, Hungary (46°49′36.5″ N 17°37′50.5″ E) were collected in sterile bottles and kept at 4 °C for 24 h until the start of the experiments. For the investigation of the effect of nZnO and nTiO2 the water samples were taken in July and October 2020, respectively. A 3000 mL freshwater sample was collected in sterile glass bottles and transported to the lab. The main physico-chemical properties of the freshwater samples from Lake Balaton collected in July and October are shown in Table 1.

2.2. Characteristics of the Tested Nanomaterials

The examined nanoparticles were purchased from the manufacturers: nano zinc oxide (nZnO) from Sigma-Aldrich Inc. (Budapest, Hungary) (CAS number: 1314-13-2) and AERODISP® VP Disp. W2370X nano titanium dioxide (nTiO2) were purchased from Evonik Resource Efficiency GmbH (Essen, Germany) (CAS number: 13463-67-7). The particle size of nZnO was less than 100 nm with an average of ≤40 nm. The mean aggregate size of nTiO2 was ≤100 nm and the mean particle diameter by mass was 16 nm. Details and properties on the NPs were provided by the manufacturers. The NPs were sonicated for 15 min before usage.

2.3. Experimental Setup

Two separate series of experiments—with identical experimental setups—were run in triplicate to assess the effect of nZnO and nTiO2 in 100 mL microcosms. Samples of 45 mL Balaton water were transferred into sterile, 100 mL volume Schott-bottles. Then each bottle was completed to 50 mL with the studied NP suspension at different concentrations aiming to reach 0.8, 4, 20 and 100 mg/L final NP nominal concentration in each microcosm. The original NP suspensions were diluted with distilled water. Every treatment had 3 replicates. Distilled water (DW) was the control. The proportion of DW in the control microcosms was the same as in the NPs-containing microcosms.
During the experiment samples were shaken at 120 rpm and kept in the dark at room temperature (22 ± 2 °C). For monitoring the effect of NPs, the microcosms were sampled on the 3rd, 7th, and 14th days.

2.4. Monitoring

2.4.1. Physico-Chemical Methods

The pH and electric conductivity of the freshwater samples from Lake Balaton and the assembled microcosms were determined with a WTW (Wissenschaftlich Technische Werkstätten GmbH, Weilheim in Oberbayern, Germany) instrument using a pH 330 Meter including a precision Sentix 81 pH Electrode on the initial day and the 3rd, 7th, and 14th days in three parallels. Electric conductivity (EC) was determined with a Consort C535 instrument (Turnhout, Belgium).

2.4.2. Microbiological Methods

The enzymatic activity of viable cells [28,29] was measured by a tetrazolium reduction viability assay with ELISA Microplate Reader (Vienna, Austria) for assessing metabolic activity. Three 200 µL samples were introduced into the wells of a sterile microplate and the OD was measured at 630 nm.
Then 30 µL of 1 mg/mL 3-(4,5-dimethylthiazol 2-yl)-2,5-diphenyltetrazolium bromide (MTT) was transferred into every well, and the plate was incubated for 15 min in the dark at room temperature.
The absorbance was measured at 490 nm with DIALAB EL800 Microplate Reader. The inhibition percentage (I%) compared to control was calculated based on the absorbance values with the following Equation:
I % = C S C · 100 ,
where C is the absorbance of the control and S is the absorbance of the NP containing sample [30].

2.4.3. Biolog EcoPlate™

The Biolog EcoPlate™ test method [31] was applied to monitor the effect of zinc oxide and titanium dioxide nanoparticles on the microbial communities, and how they influence their substrate use (community-level physiological profiling, CLPP).
The EcoPlate™ includes three replicate wells containing 31 organic carbon substrates and a control well with redox-sensitive tetrazolium dye, but no substrate, for community-level physiological profiling (CLPP) of metabolically active heterotrophic bacterial assemblages able to grow in plate conditions [32]. Biolog-derived data for evaluation from CLPP include: the average well colour development (AWCD) and the Shannon diversity index (H) [32,33,34]. AWCD shows the general potential metabolic activity of the microbial community, thus it indicates the total bioactivity of the Biolog EcoPlate™ [33]. The Shannon diversity index (H) informs on the physiological diversity of bacterial communities [33]. Higher values of H indicate metabolically active microbial communities able to degrade more substrates [34]. Additional Biolog EcoPlate™-derived parameters include substrate richness (SR) and Shannon evenness (E) [35].
Although the Biolog EcoPlate™ methodology does not inform about the genetic composition of the microbial community, it provides valuable insight into bacterial substrate use patterns and metabolic functional potential in environmental matrices affected by stressing factors, such as contamination. In addition, it could be applied as a monitoring method, since it is rapid, low cost, reproducible and simple.
Therefore, this study aims to provide evidence to the applicability of the Biolog EcoPlate™ technique for the characterisation of the microbial activity and biodiversity of nTiO2- and nZnO-impacted freshwaters. We compared several endpoints, primarily those associated with the effects on biodiversity and microbial community structure. The conventional endpoints, such the AWCD, the substrate richness (SR), the area under the curve (AUC) and substrate average well colour development (SAWCD) were analysed, but microbial diversity and its changes triggered by stress factors were in focus. The endpoints studied and compared in terms of microbial diversity included: Shannon diversity index, Shannon evenness index, Simpson index, McIntosh index and Gini coefficient.
Measurements were carried out by pipetting 125 µL samples into each well of the EcoPlate. Plates were incubated in the dark at 25 °C, and the absorbance of the wells was measured every 24 h for 120 h at 490 nm wavelength by DIALAB EL800 Microplate Reader. Although the Biolog EcoPlate™ method usually measures optical density (OD) at 590 nm, because the highest absorbance of the tetrazolium dye could be measured at this wavelength [31,34,36], our microplate reader was equipped with 405, 450, 490 and 630 nm filters, and the optimal OD values were provided at 490 nm [37,38].
Because the 96 wells of the Biolog EcoPlate™ contain 31 carbon sources and control wells (blank) in 3 replicates, all measurements were done 3 times, 1–1 series from the 3 replicates of the experimental setup.
The measured absorbance values were corrected before evaluation. Firstly, the OD values of the control wells (which contain water to read the clear absorption value) were subtracted from the substrate containing wells’ OD values. Next, the initial OD value of each well, measured immediately after pipetting the suspension into the wells, was subtracted from each OD value corrected in the previous step. The aim was to eliminate the background effect (the effect of nanoparticles on the optical density values). OD values measured at 120 h were used for data evaluation because these indicated the optimal range of OD readings [35,37,39]. Different endpoints were calculated from the corrected data including average well colour development (AWCD), substrate average well colour development (SAWCD), substrate richness (SR), Shannon index (H), Shannon evenness (E), Simpson index (D), McIntosh index (U), and Gini coefficient (G).
Average well colour development (AWCD) was computed by the following equation for all carbon sources:
AWCD = i = 1 N OD i N
where ODi is the corrected OD value of each substrate-containing well, while N is the number of substrates, which in this case is N = 31 [35,38]. For further investigation of the AWCD, all carbon substrates were classified into six categories based on their characteristics according to Sala et al. [40]: polymers (alpha-cyclodextrin, glycogen, Tween 40, Tween 80), carbohydrates (D-cellobiose, i-erythritol, D-galactonic acid-gamma-lactone, N-acetyl-D-glucosamine, glucose-1-phosphate, beta-methyl-D-glucoside, D,L-alpha-glycerol phosphate, alpha-D-lactose, D-mannitol, D-xylose), carboxylic acids (gamma-hydroxybutyric acid, alpha-ketobutyric acid, D-galacturonic acid, D-glucosaminic acid, itaconic acid, D-malic acid, pyruvic acid methyl ester), amino acids (L-arginine, L-asparagine, glycyl-L-glutamic acid, L-phenylalanine, L-serine, L-threonine), amines (phenylethylamine, putrescine), and phenolic compounds (2-hydroxybenzoic acid, 4-hydroxybenzoic acid). For every substrate category the substrate average well colour development (SAWCD) value was calculated by the following equation:
SAWCD = i = 1 N OD i N ,
where ODi is the corrected OD value of the substrates within the substrate category and N is the number of substrates in the category [33].
Substrate richness (SR) is the number of oxidised substrates. It was computed as the total of the cells’ ODi value which was at least 0.5 after 120 h incubation [41].
The area under the curve (AUC) was computed by the following equation [42]:
AUC = i = 1 N j = 1 n OD i n + OD i n + 1 2   ·   ( t i n + 1 t i n ) ,
where N is the number of substrates, n is the number of measurements, ODi is the corrected OD value of each individual well, at two consecutive measurements at two different measurement times for tn and tn + 1.
Shannon index (H) was calculated according to the following equation:
H = i = 1 N P i · ln P i
where N is the number of substrates, Pi is the relative colour development of the well over the total colour development of each well of a plate [34,43,44].
P i = OD i i = 1 N OD i
Shannon evenness (E) was derived from the Shannon index by its partition based on the substrate richness according to Jałowieczki et al. [42]:
E = H ln ( SR )   ,
where H is the computed Shannon index, while SR is the calculated substrate richness.
Simpson index (D) was computed by the following equation:
D = ln i = 1 N ( P i ) 2 ,
where Pi and N are the same as in the Shannon index calculation [45].
McIntosh index (U) was calculated according to Manjunath et al. [46]:
U = i = 1 N ( OD i ) 2 ,
where N is the number of substrates, ODi, is the corrected OD value of each substrate containing well.
Gini coefficient (G) was calculated by the following equation:
G = i = 1 N j = 1 N | OD i OD j | 2 N 2   ·   ( AWCD )  
where N is the number of substrates, OD is the corrected OD value of each well, AWCD is the computed AWCD value as described previously [32].

2.4.4. Statistical Analysis of Data

Data were submitted to analysis of variance (ANOVA) using StatSoft® Statistica 13.1 (TIBCO Software, Inc., Palo Alto, CA, USA) to calculate if the effect of a treatment was significant. For this purpose, two types of statistical analyses were done, depending on the examination.
To investigate the significant differences with respect to enzymatic activity determined by MTT, one-way ANOVA was used. To verify the criteria for the homogeneity of variances Cochran’s C test was applied.
Repeated measures ANOVA (RMANOVA) was used to investigate the significant effects of the nZnO and nTiO2 treatments with Biolog EcoPlate™ tests. The Mauchley sphericity test was applied to confirm the criteria.
Both types of statistical analyses were performed at the p < 0.05 significance level. Fisher’s Least Significant Difference (LSD) was used for comparison of the effects of the various treatments. The significant effects are marked with letters on all figures in alphabetical order, where “a” is the smallest average value. Columns signed with the same letter indicate that there was no significant difference between them.
All measured microcosm data were subject to Pearson correlation analysis for detecting any coherence between the concentration of the applied NPs and diversity indices.

3. Results

3.1. Physico-Chemical Characteristics of Lake Balaton

The pH and electrical conductivity of the water samples did not change significantly compared to control after 14 days. In the case of the nTiO2 experimental series, the pH was 8.69 ± 0.03 and the EC was 632.0 ± 9.5 µS, while in the nZnO experimental series the pH was 8.97 ± 0.12 and the EC was 693.8 ± 32.9 µS after 14 days.

3.2. Effect of TiO2 and ZnO Nanoparticles on Enzymatic Activity

The results of the enzymatic activity test based on the tetrazolium reduction viability assay presented low sensitivity (data not shown).
TiO2 NPs triggered no significant inhibition (<5%), while ZnO NPs exhibited medium but concentration-dependent inhibition of the enzymatic activity. ZnO at 100 mg/L concentration resulted in the highest inhibition (60 ± 21%), followed by the lower nZnO doses such as 20 mg/L, 4 mg/L and 0.8 mg/L nZnO, which caused 48 ± 20%, 23 ± 5% and 12 ± 1% inhibition compared to control, respectively.

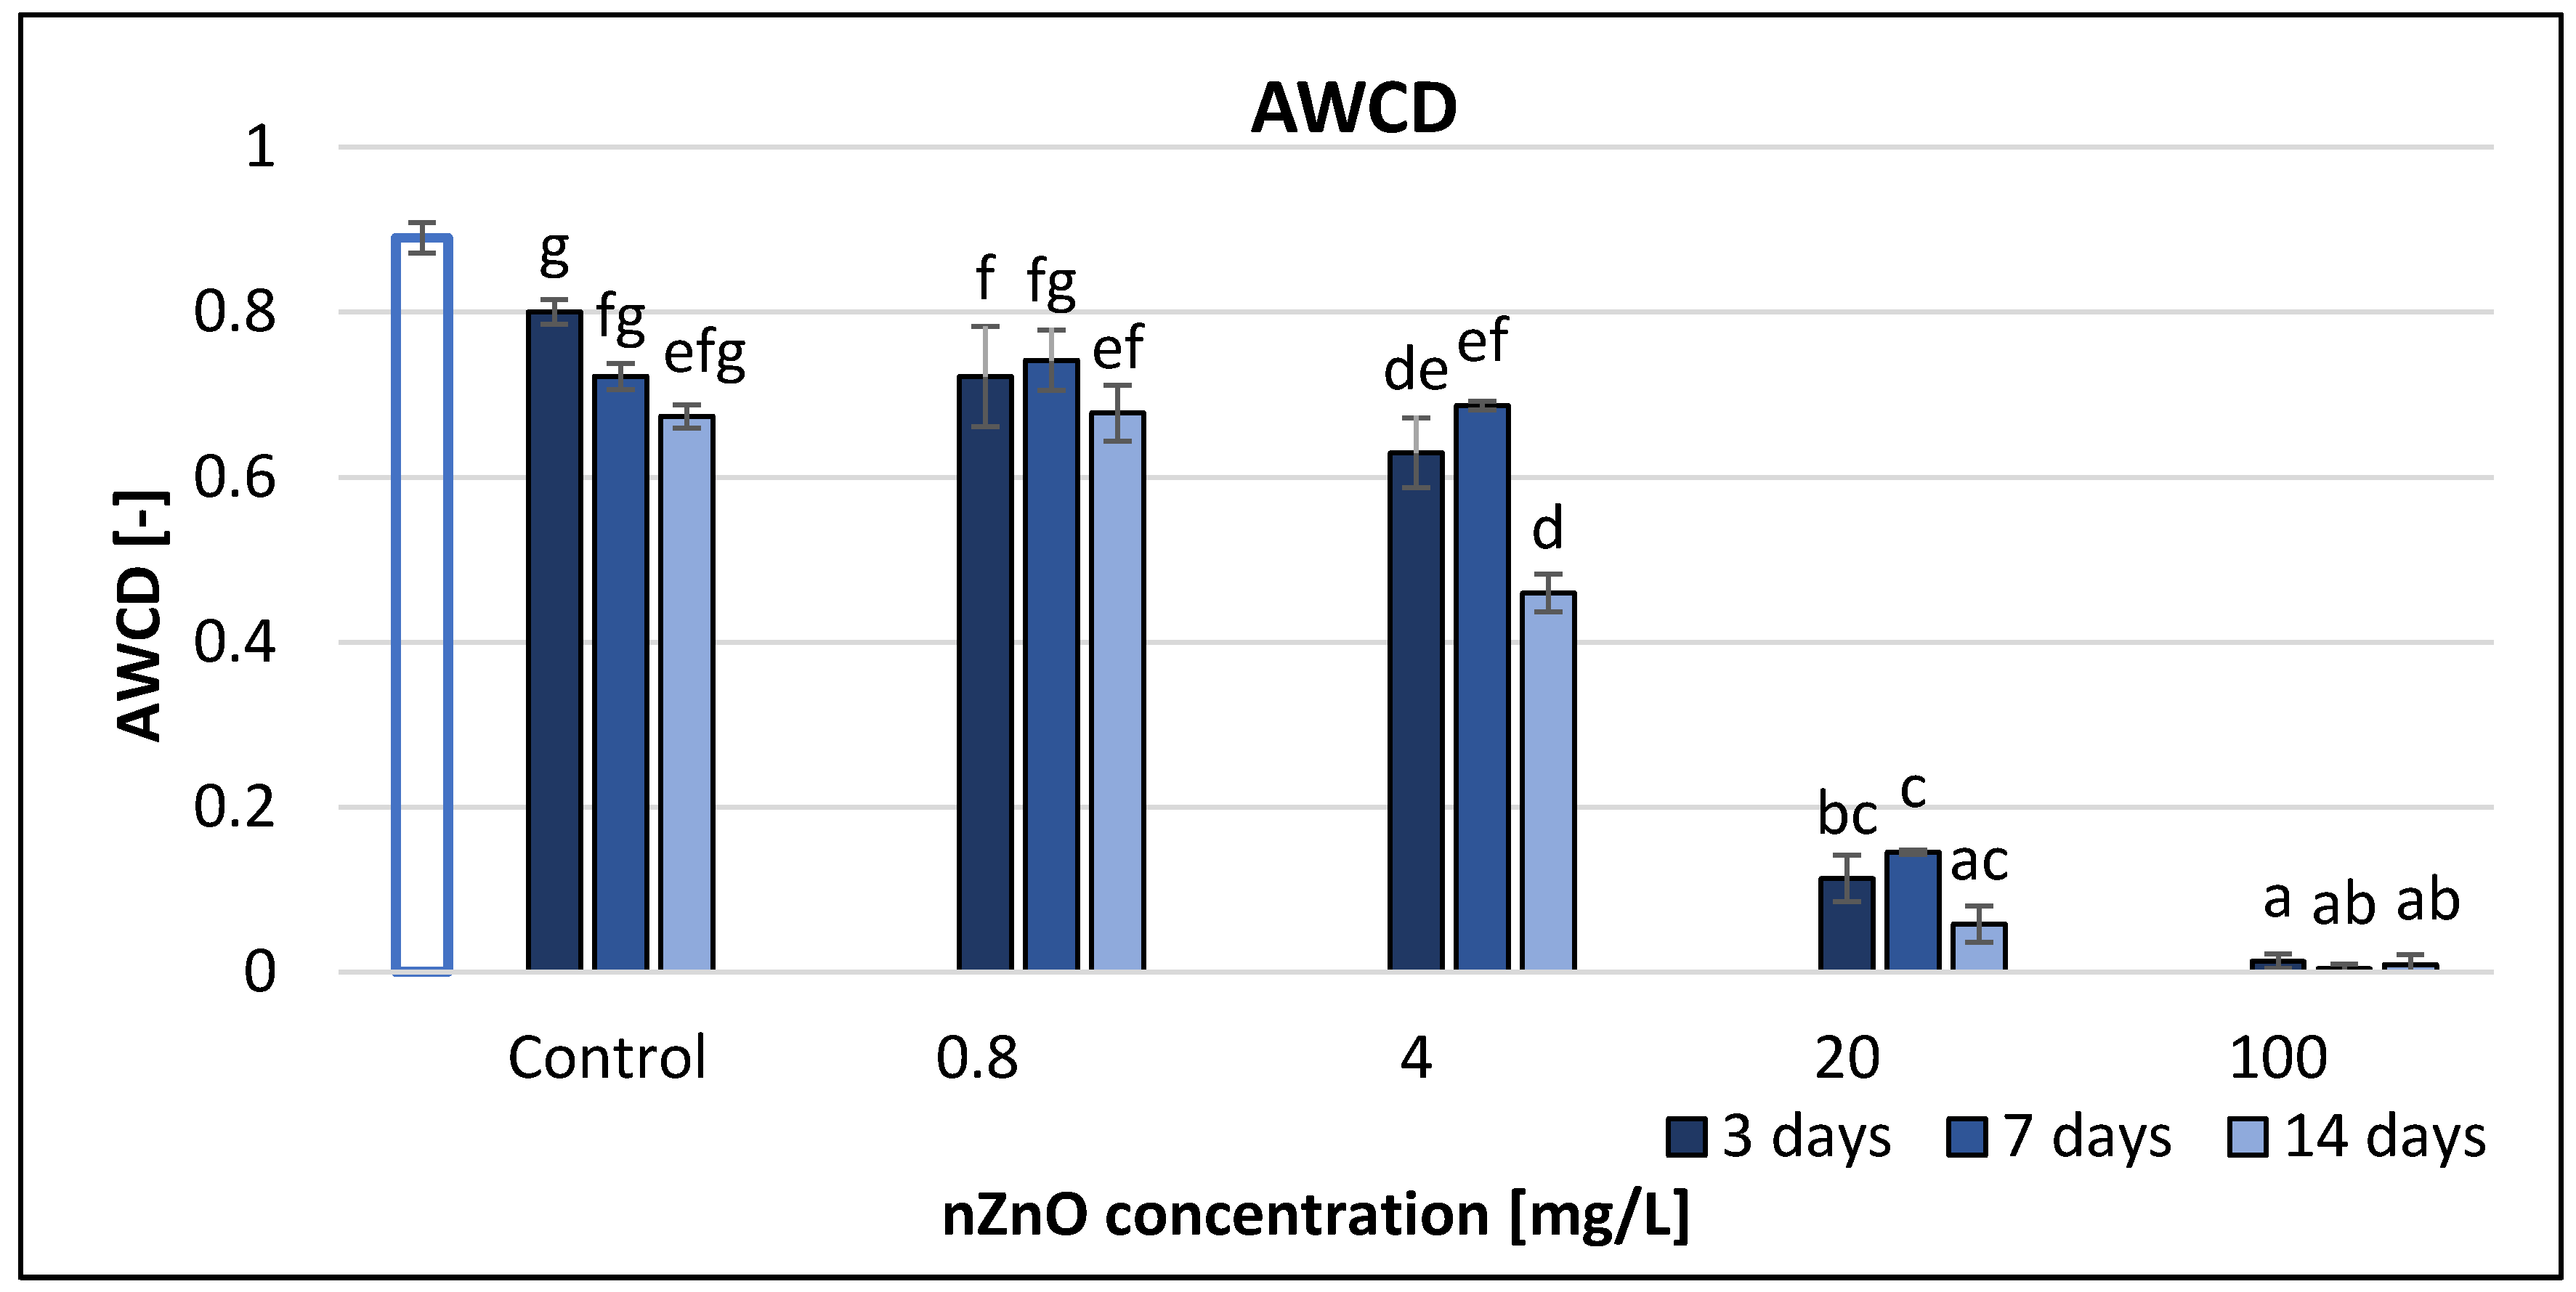
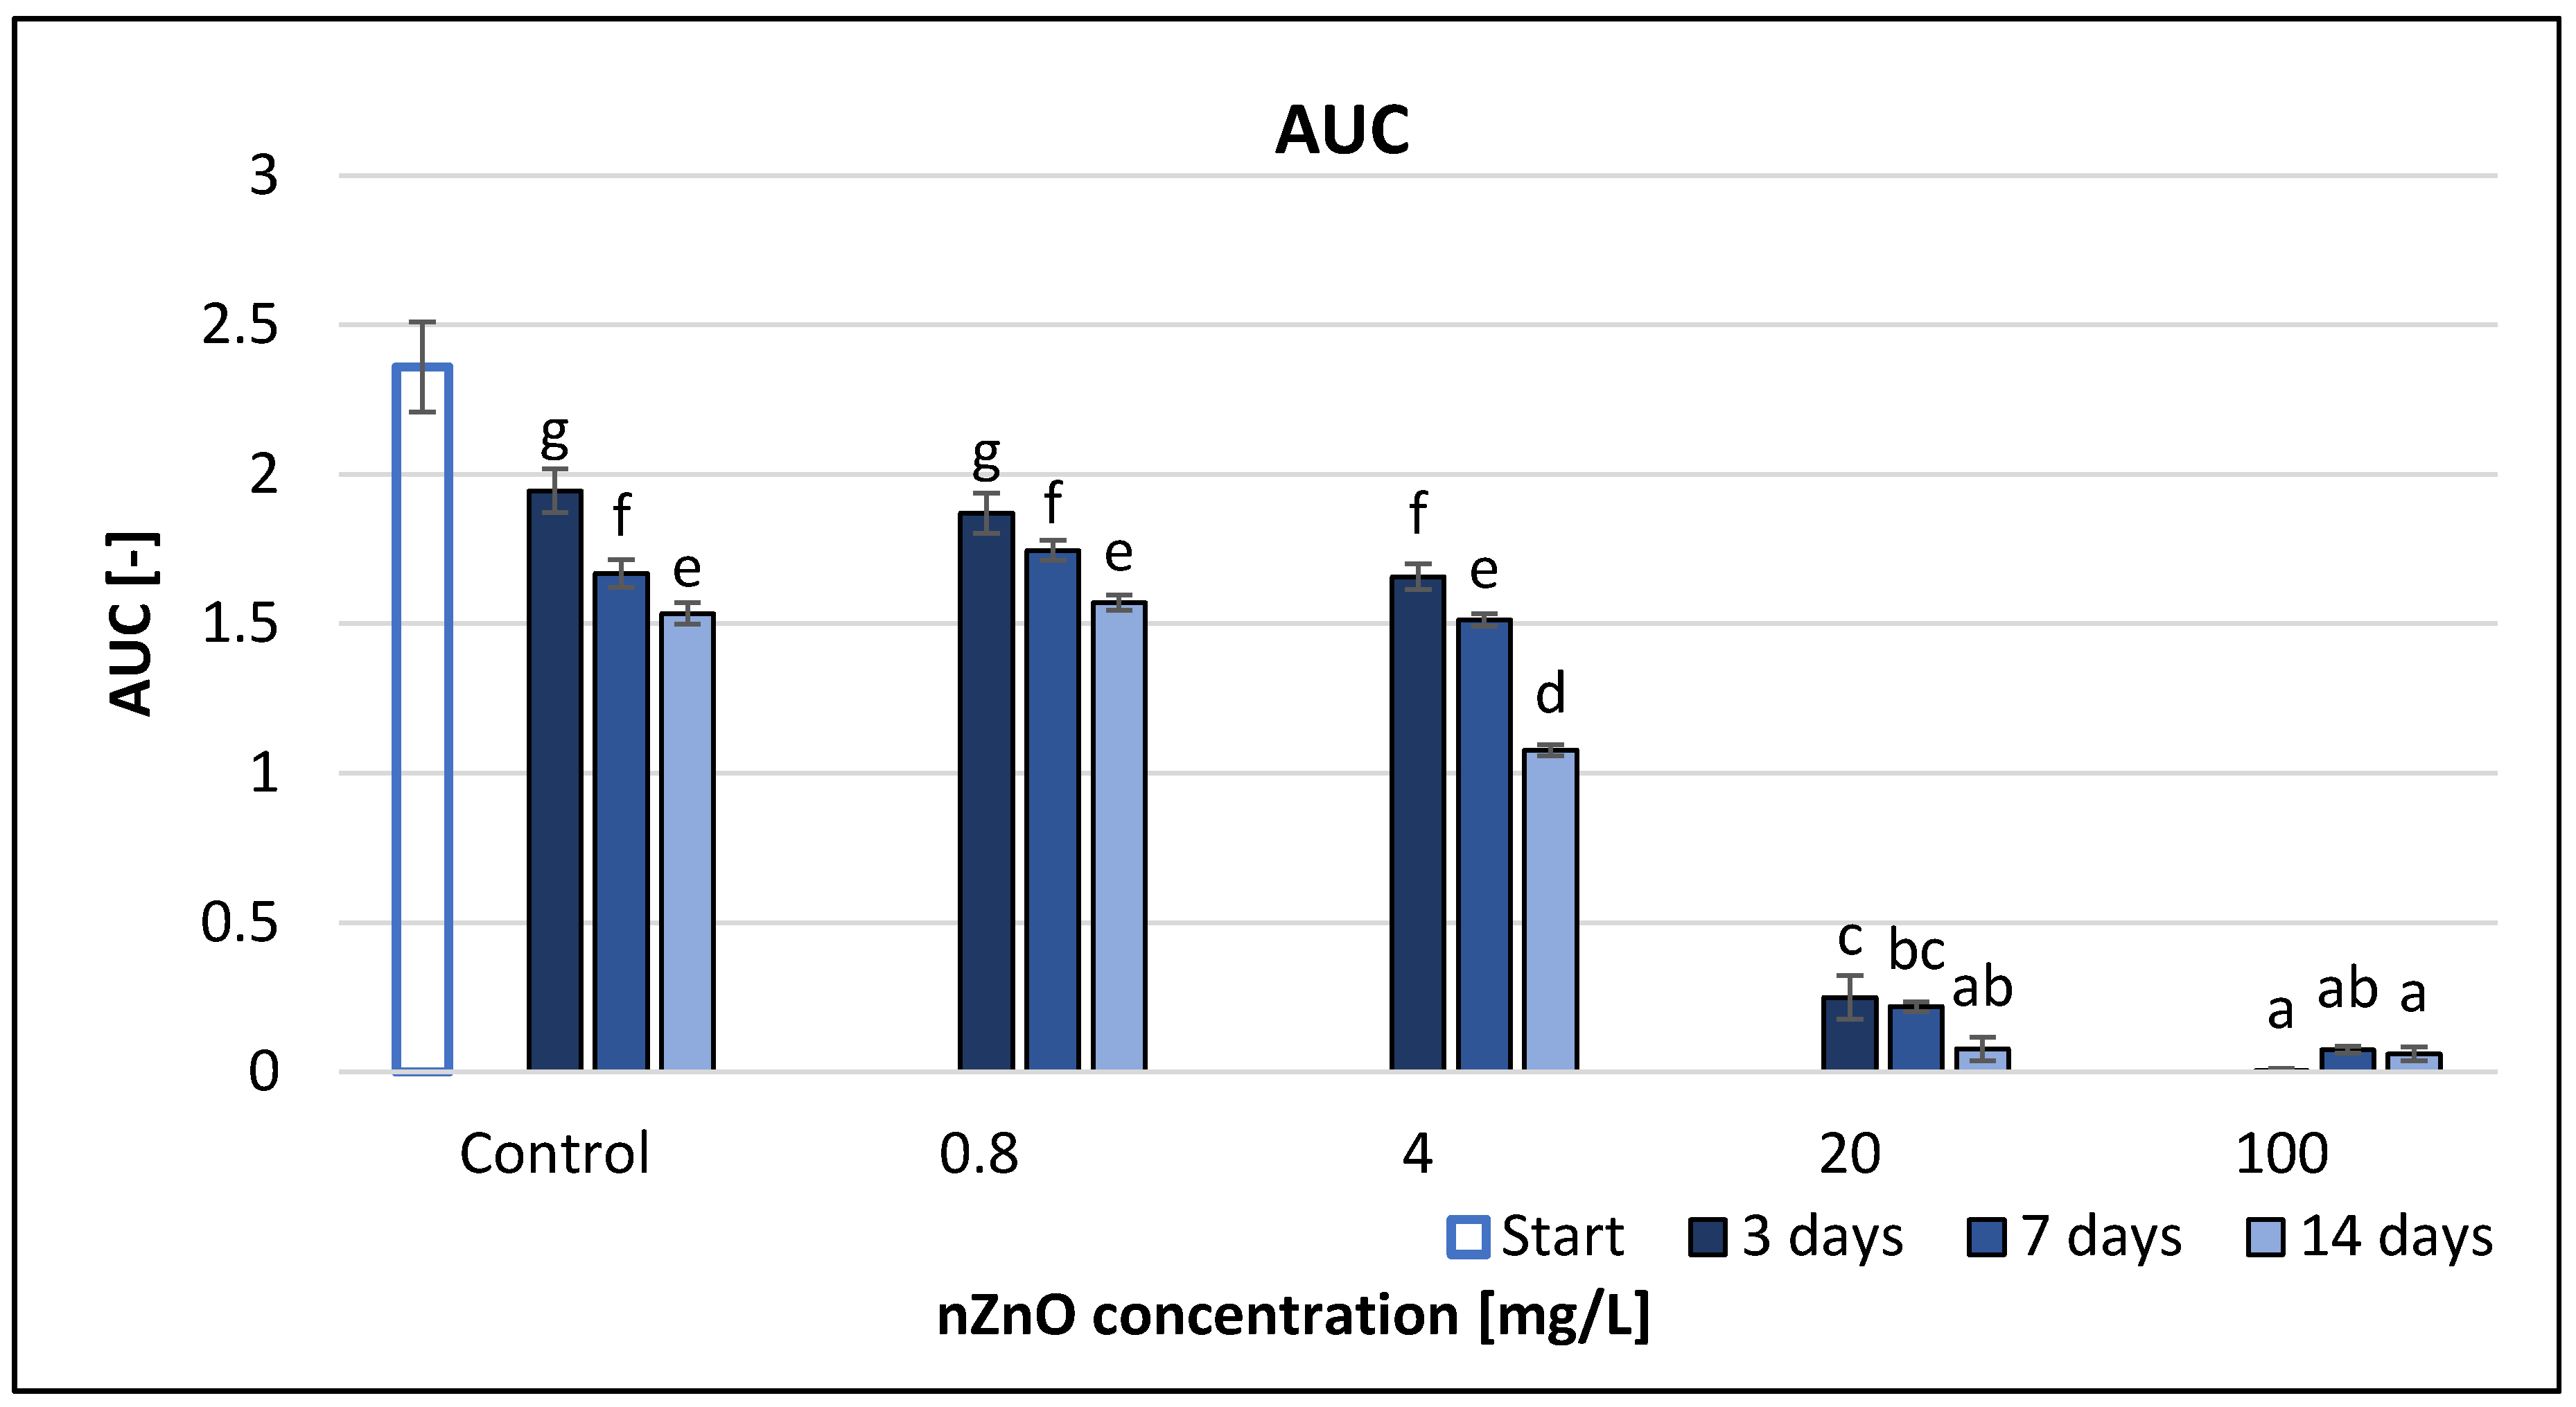
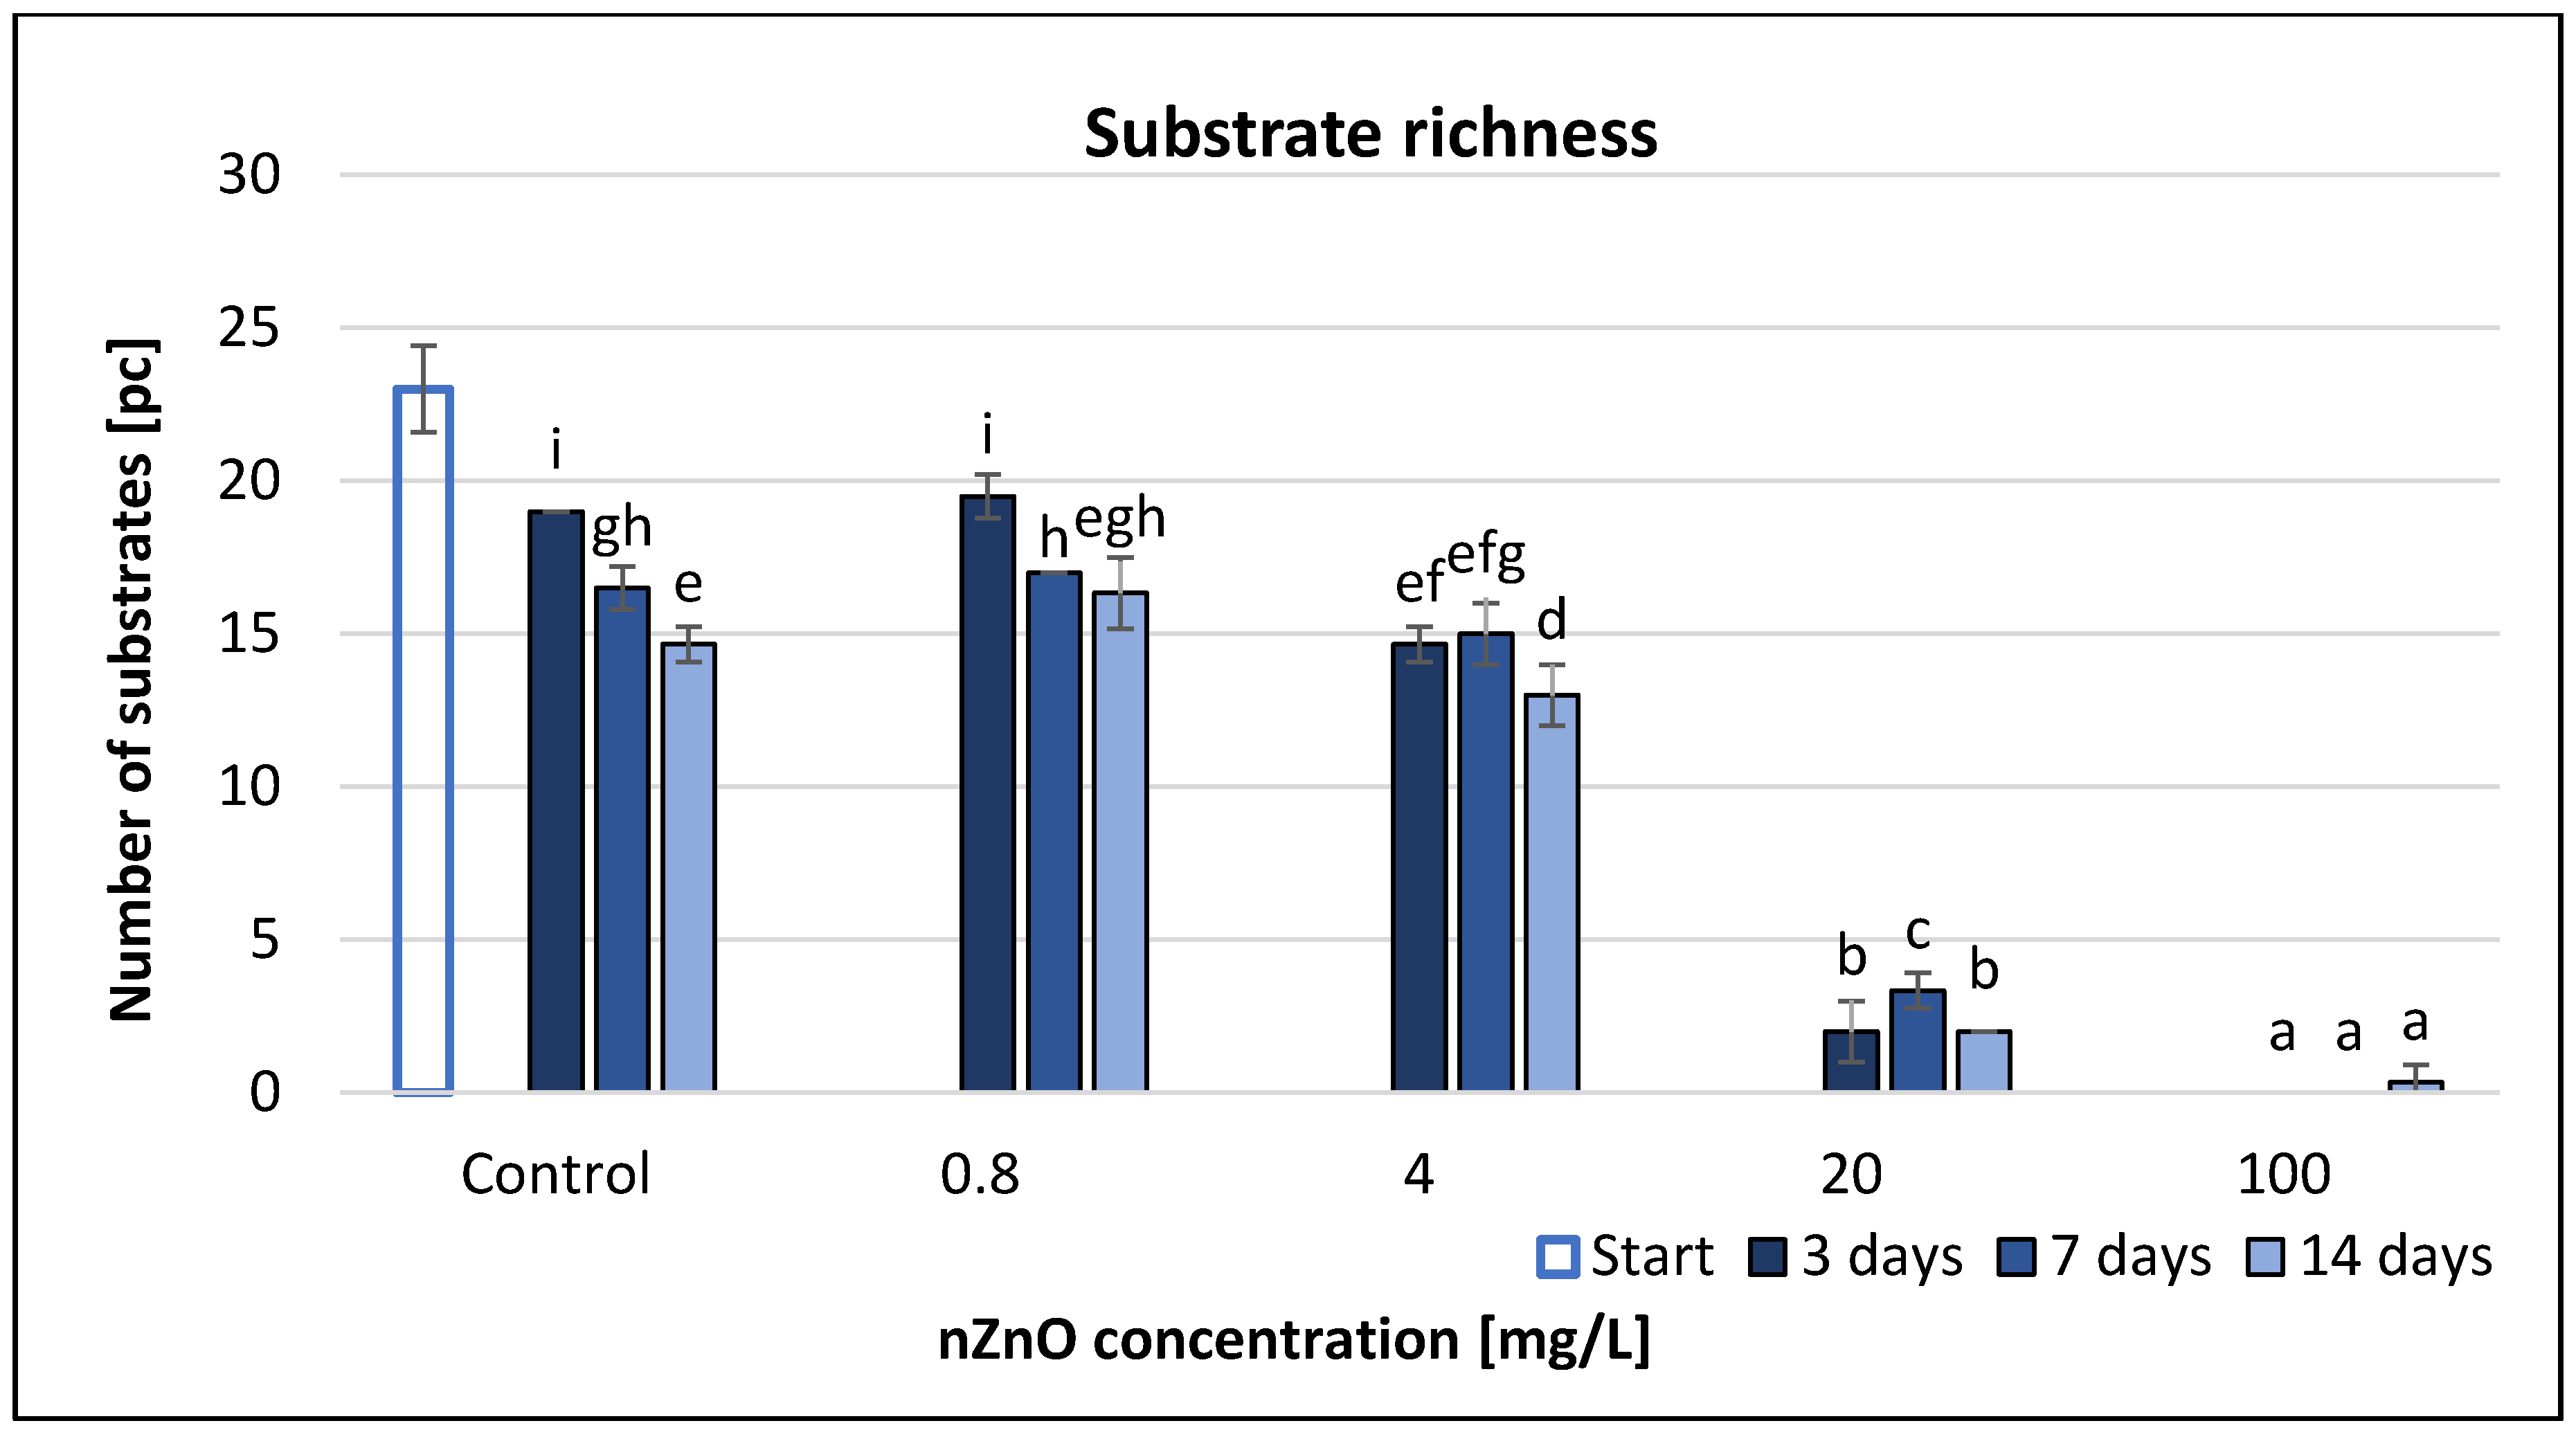
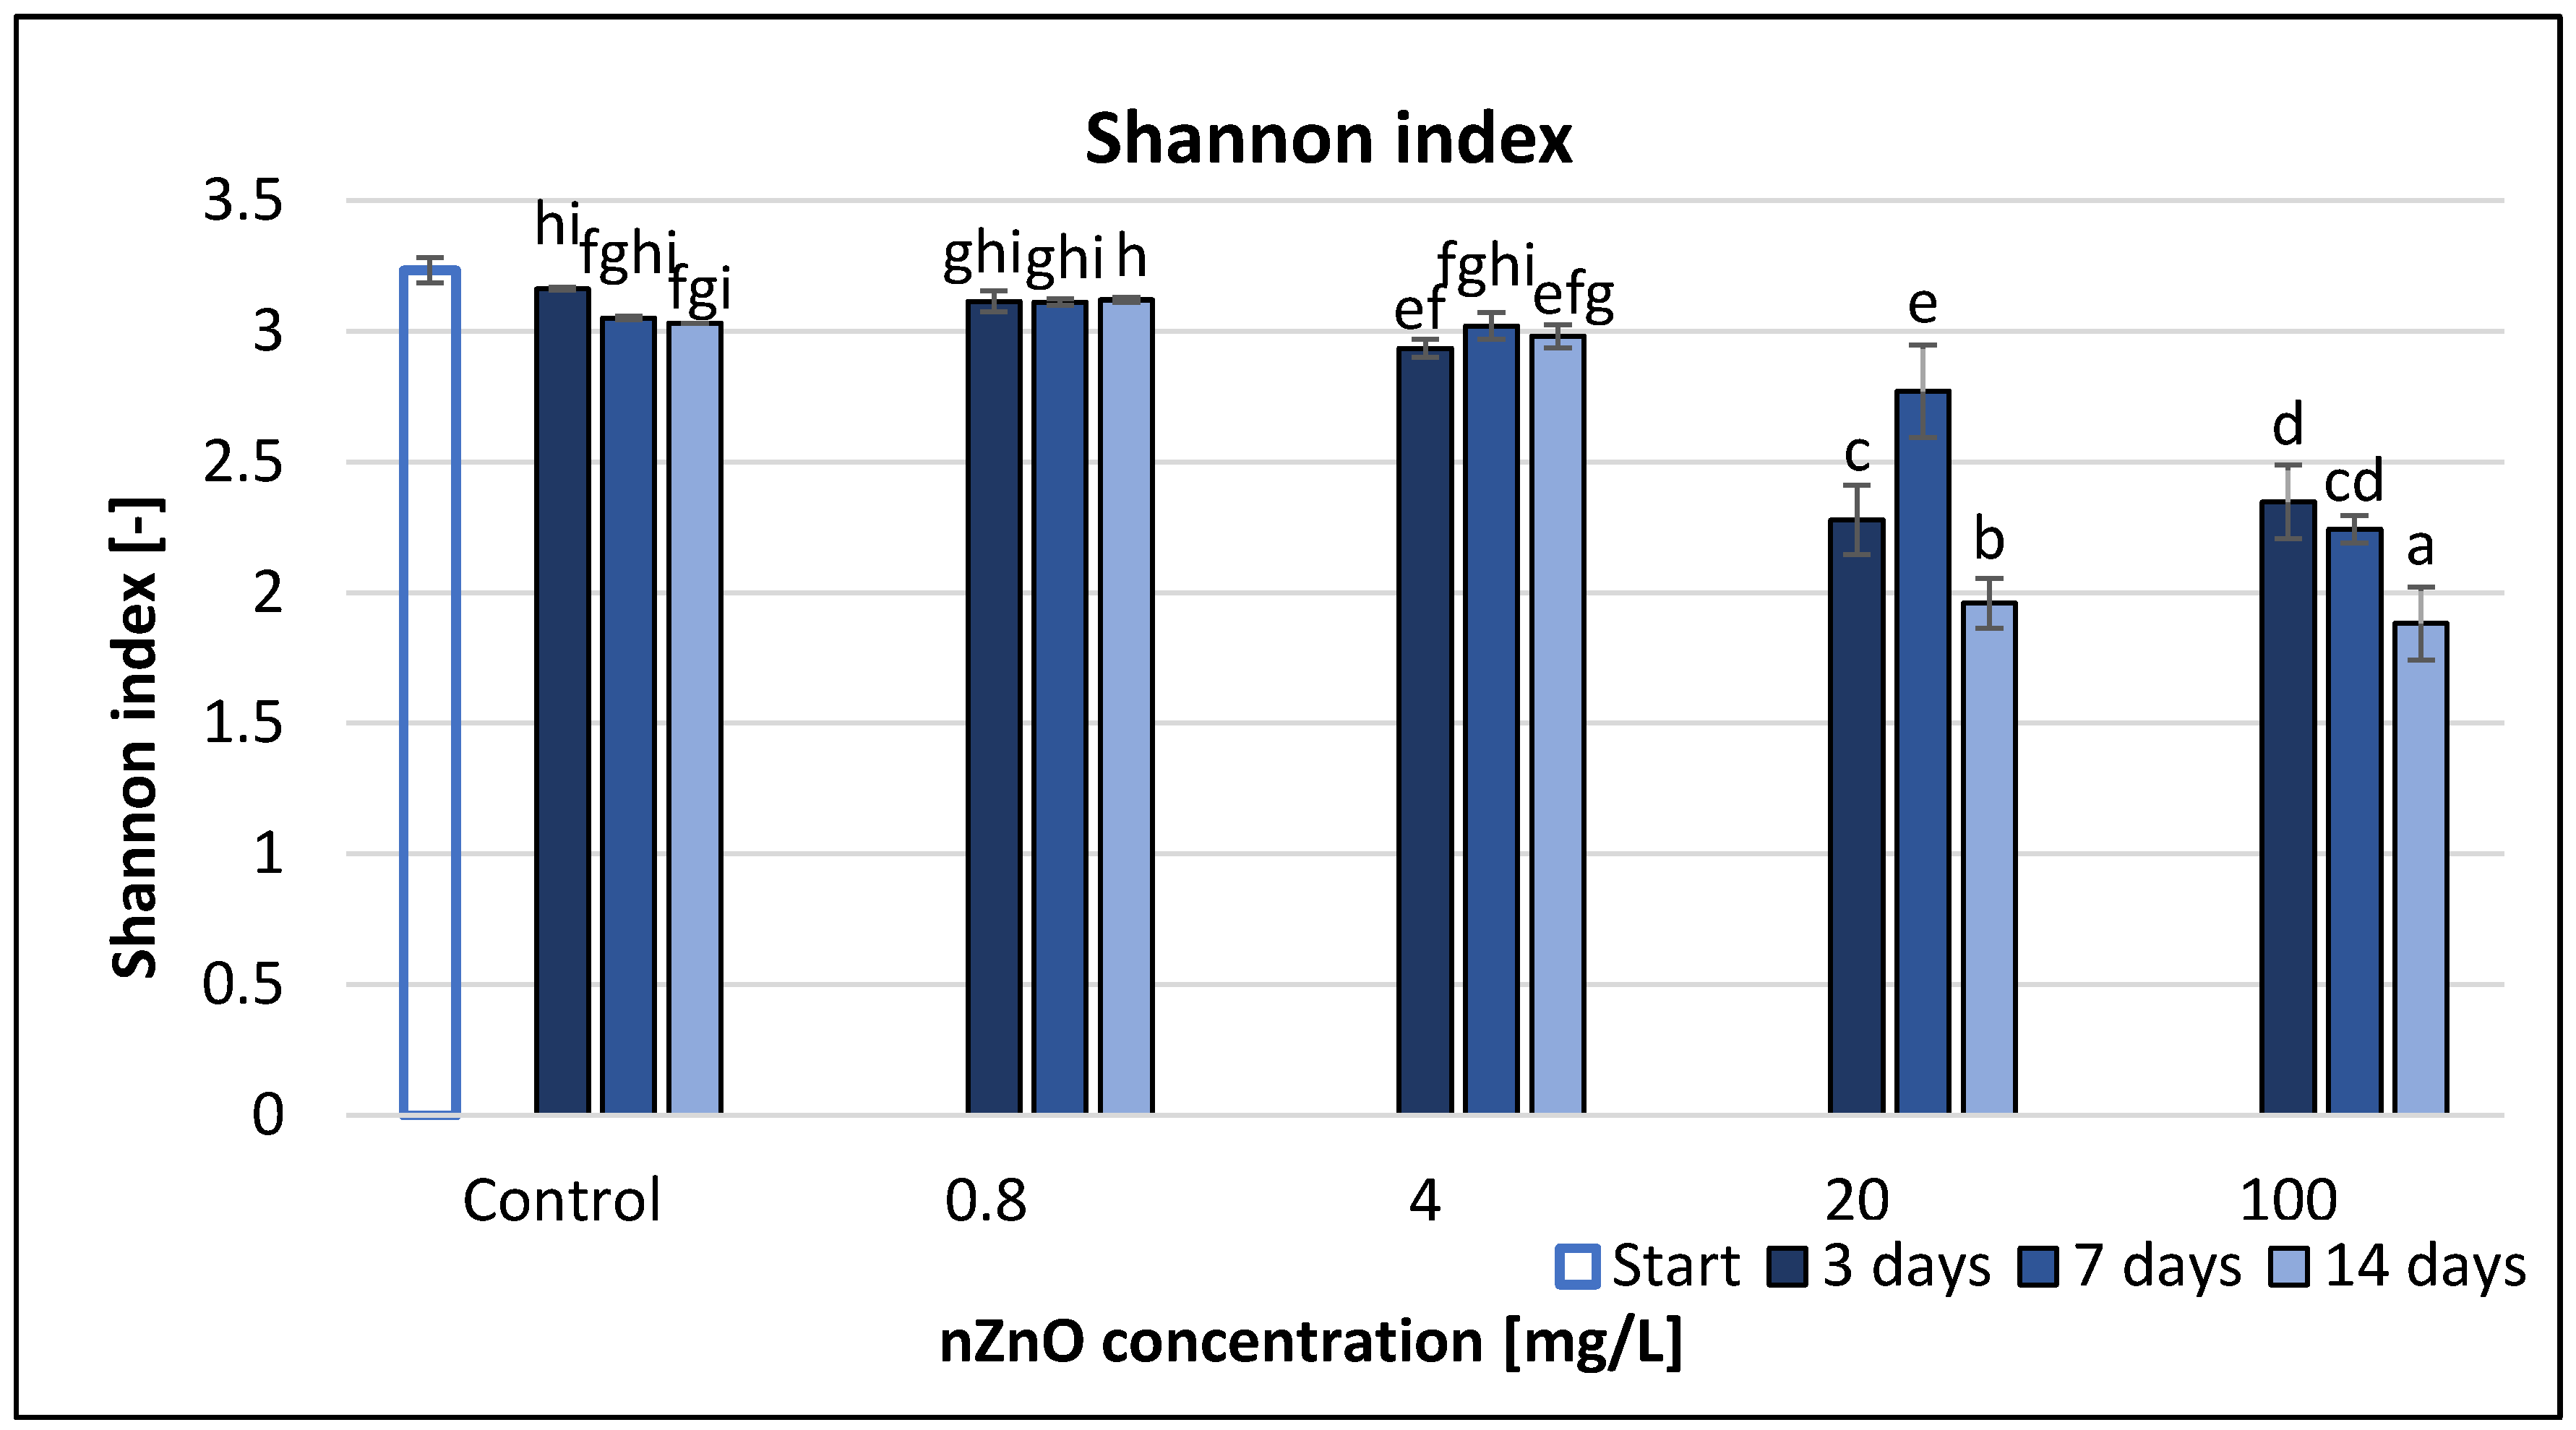
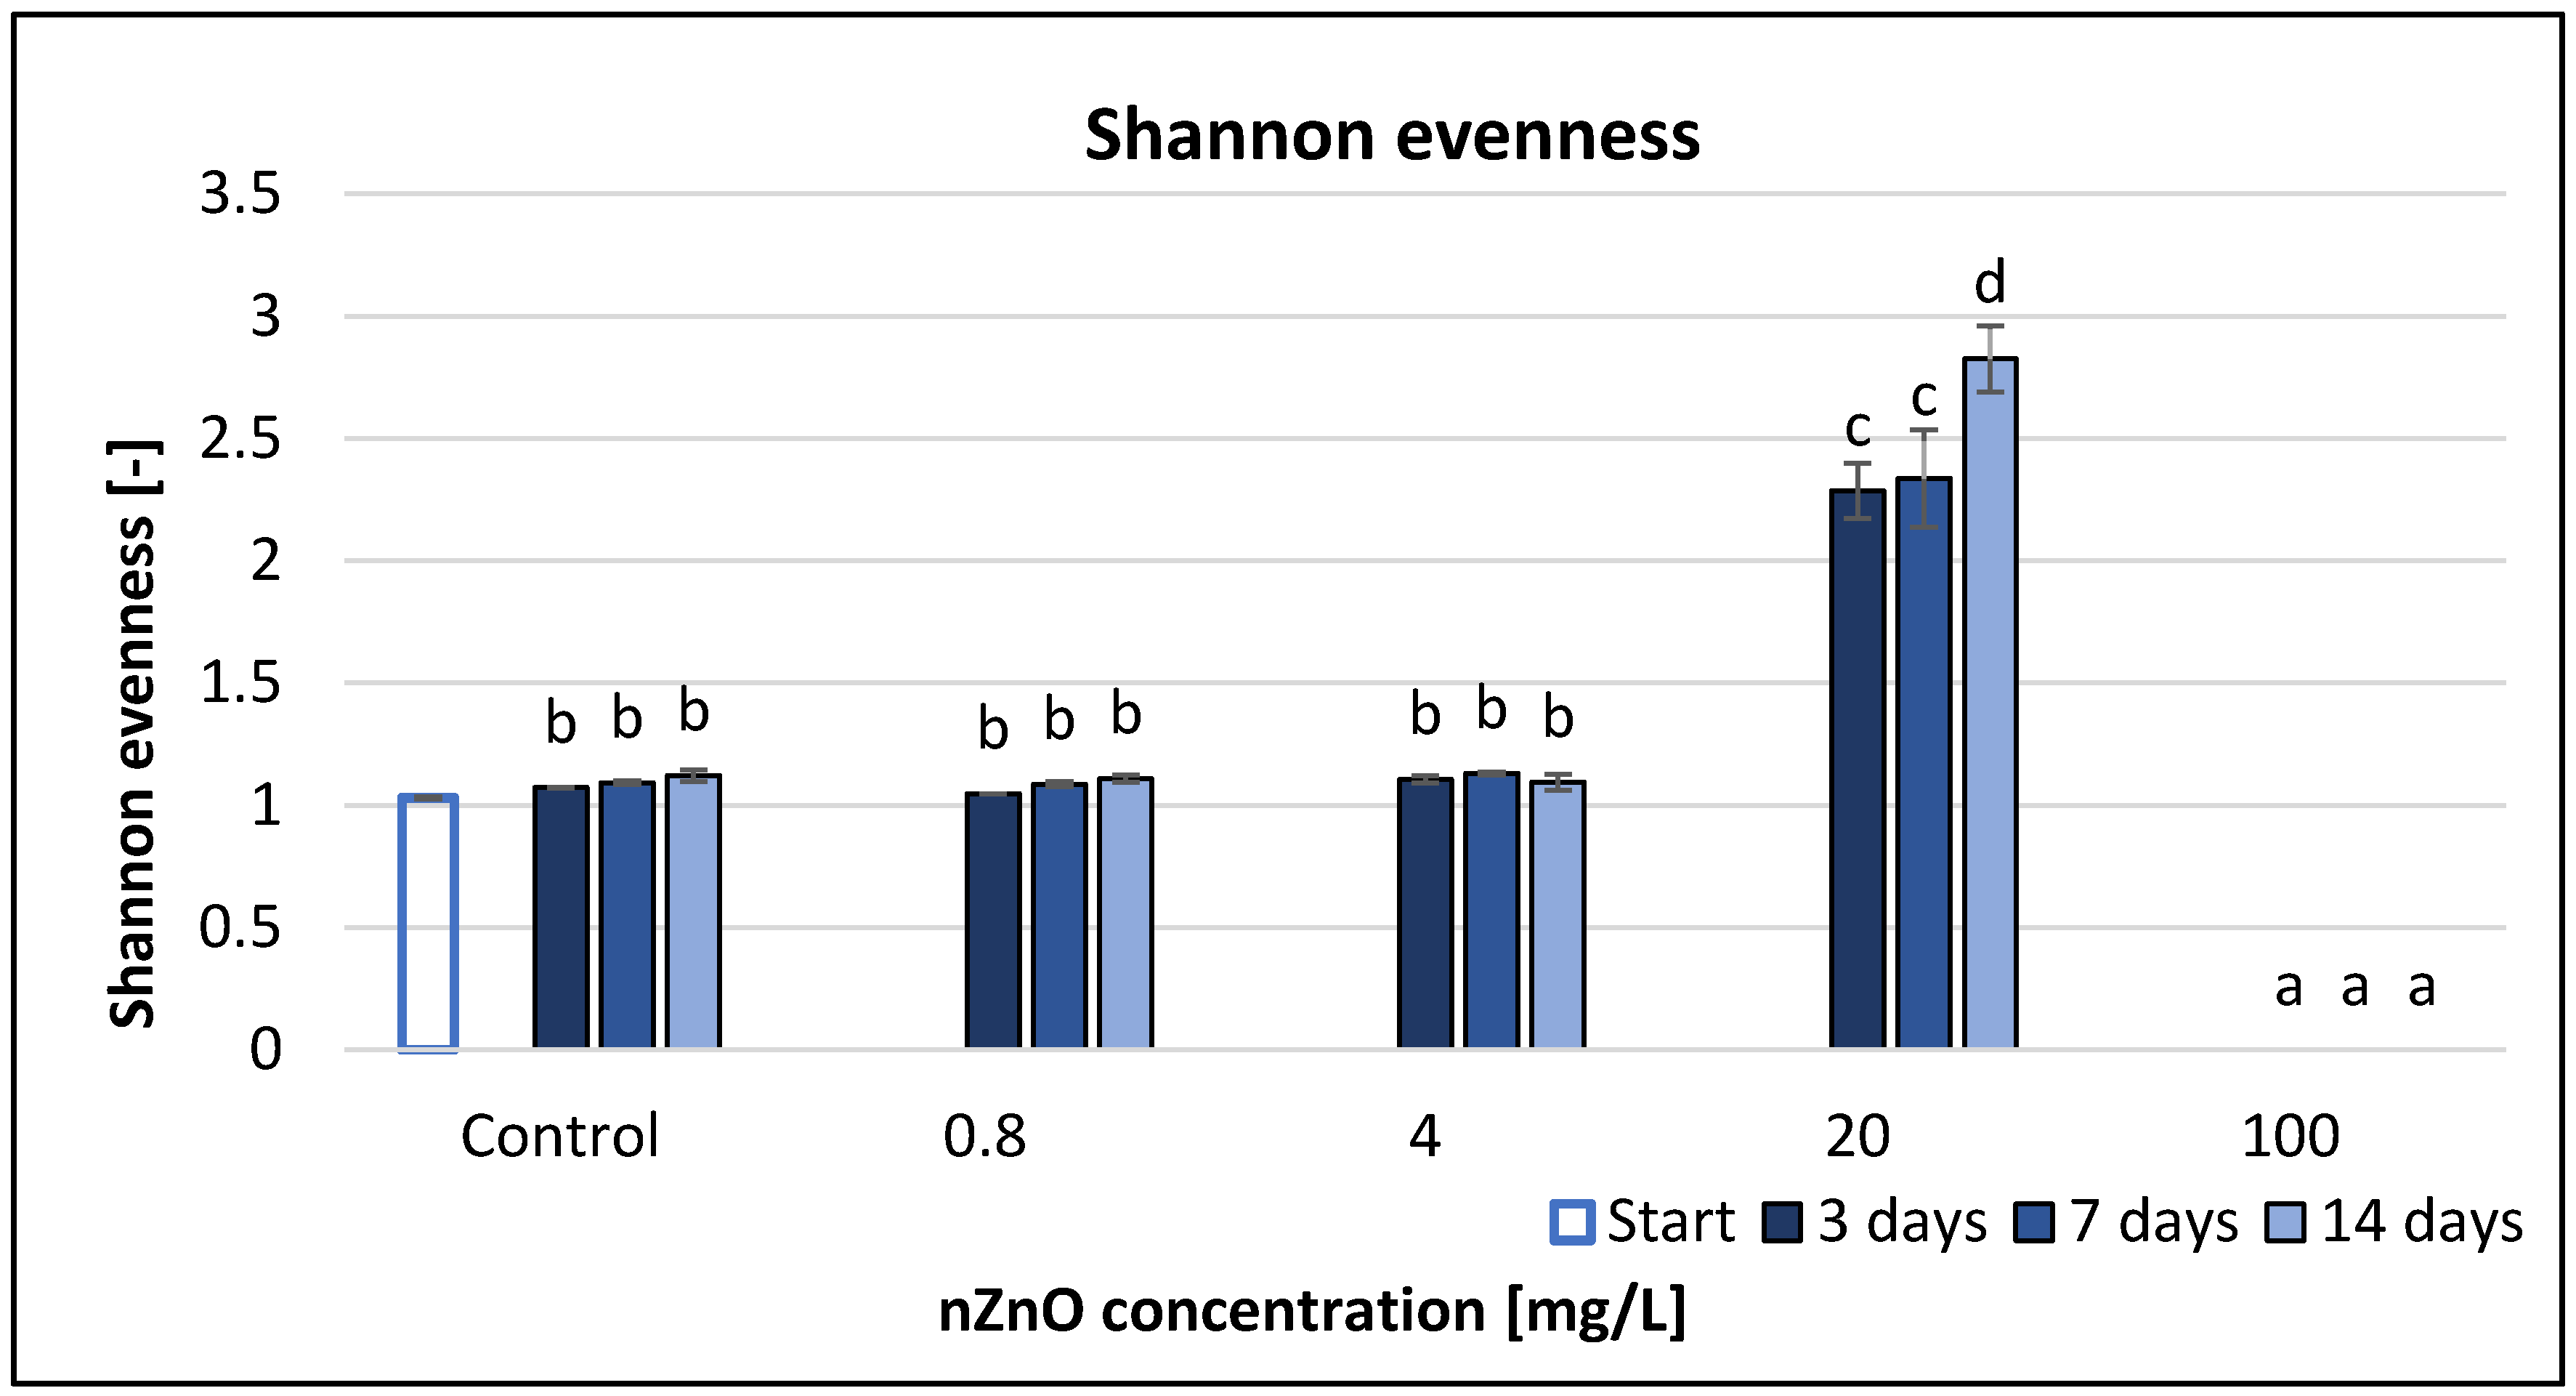
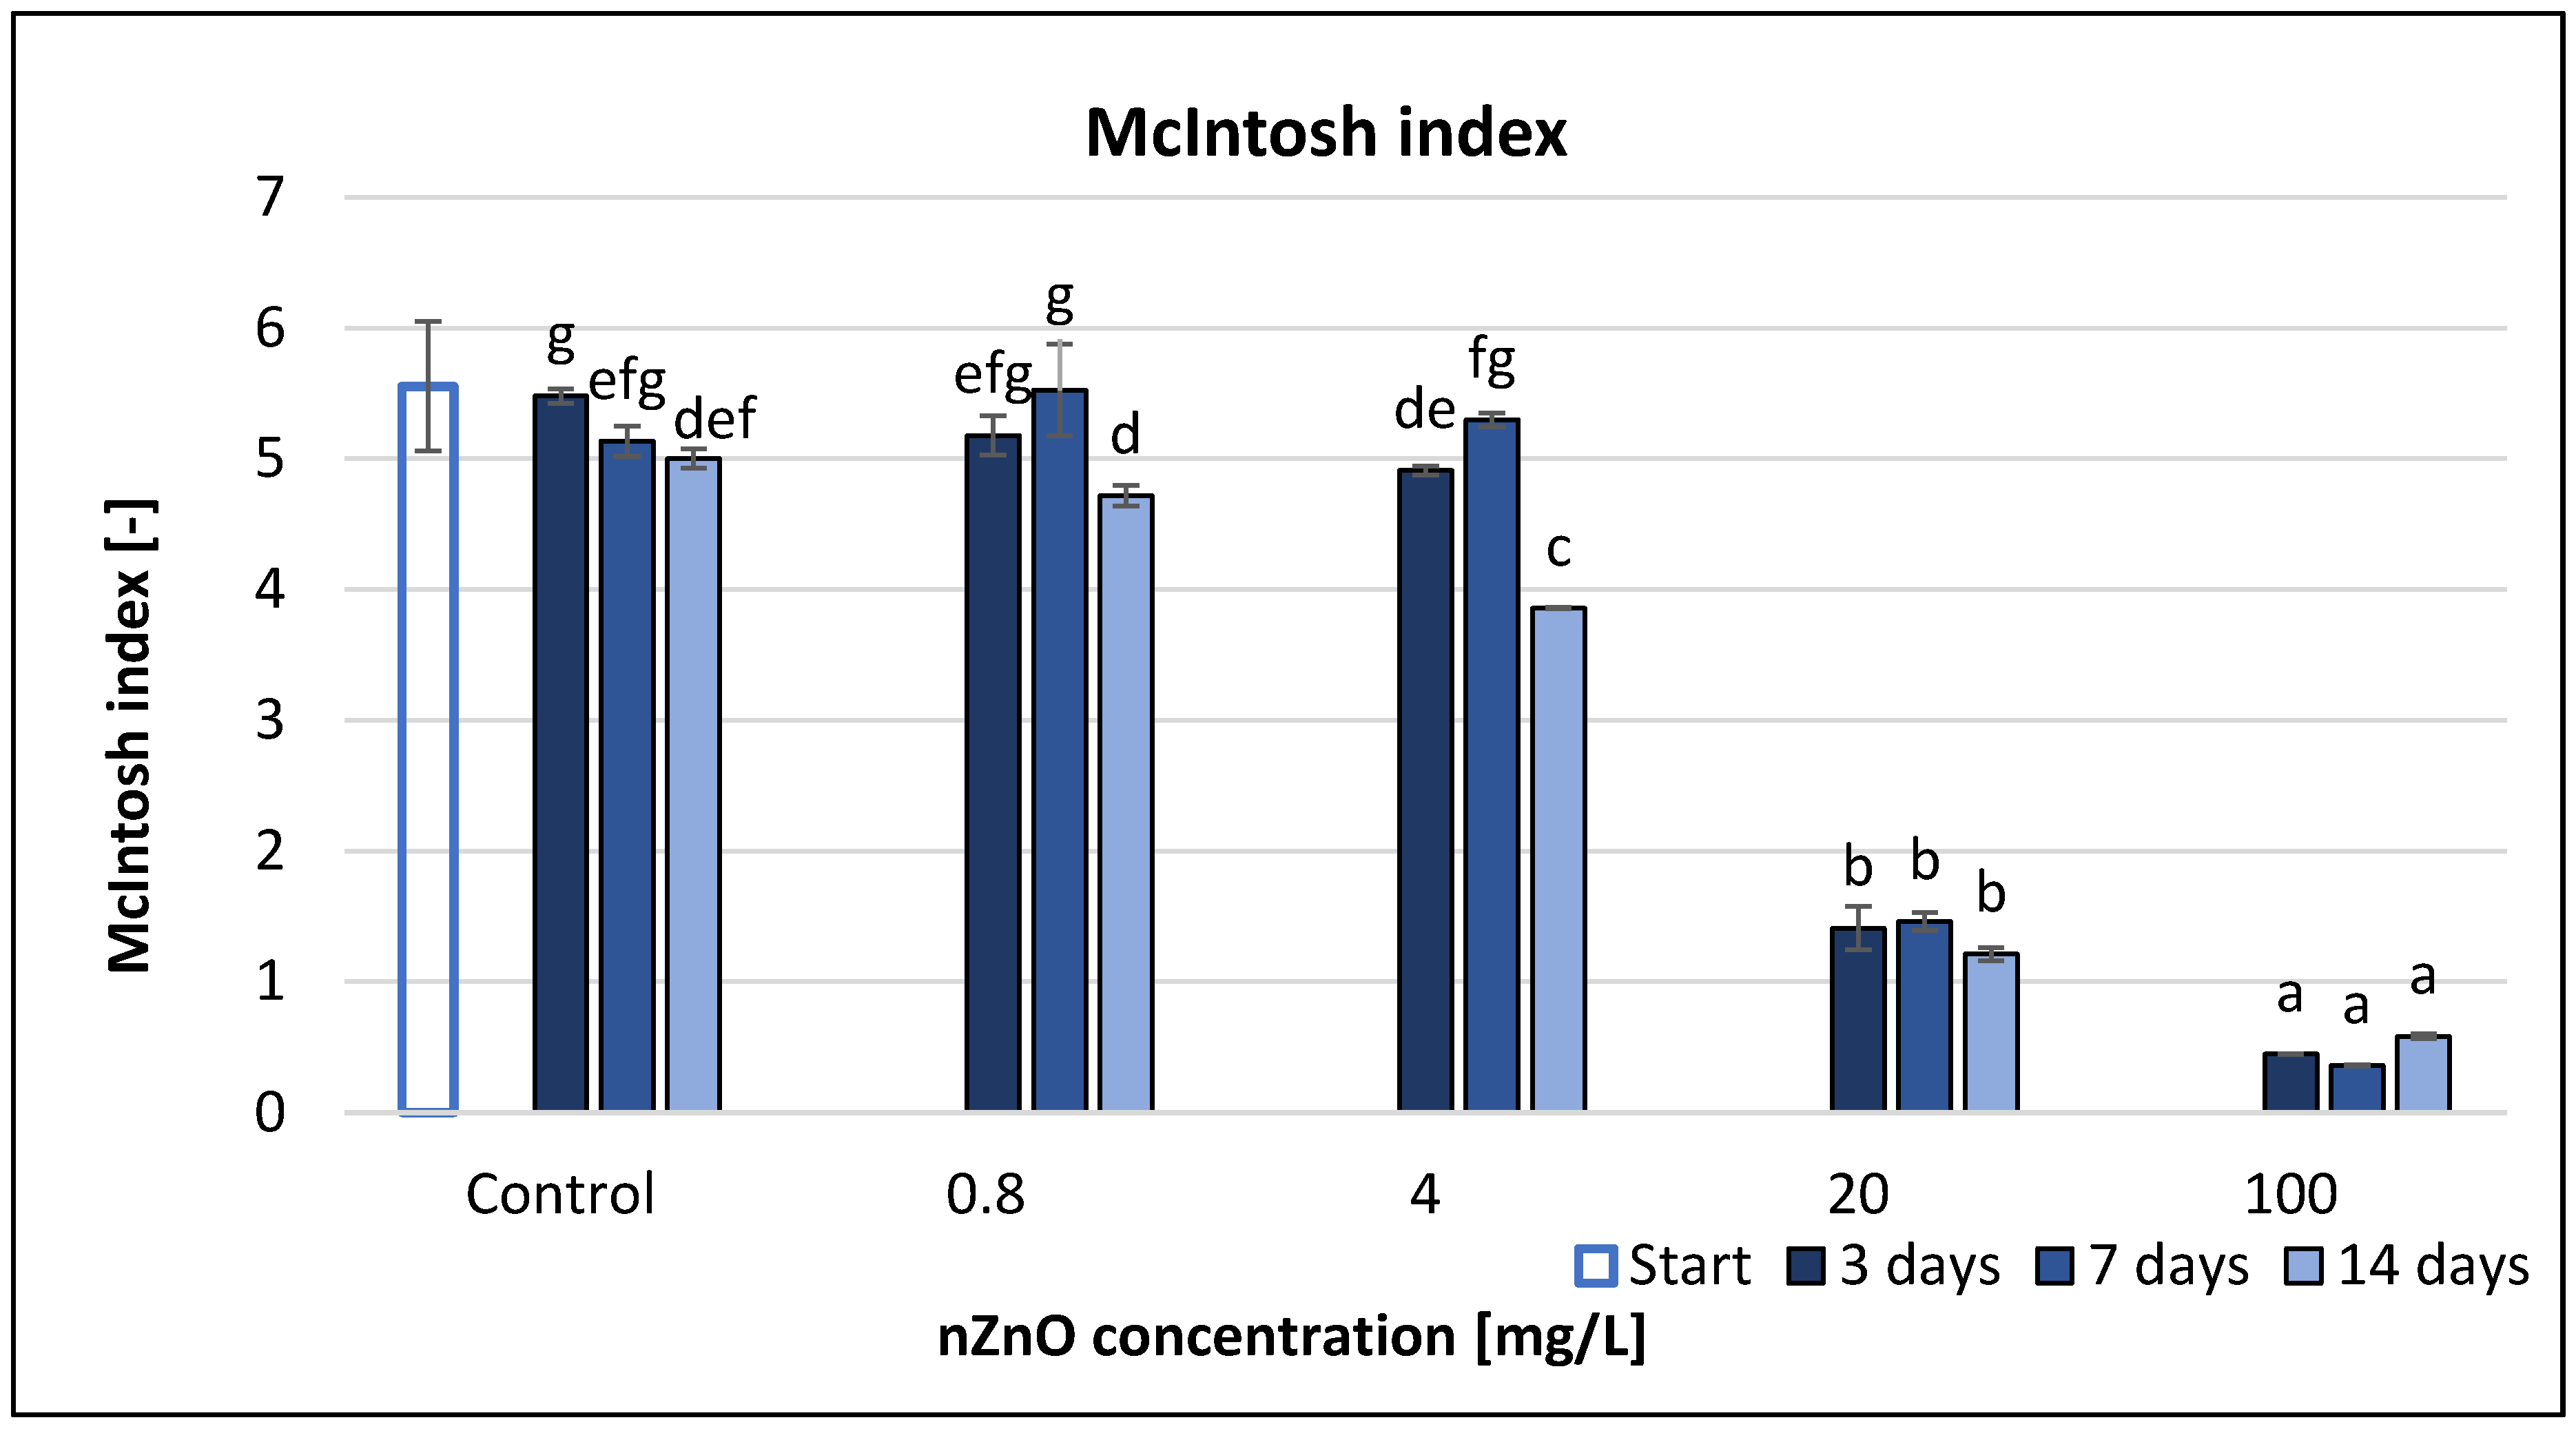
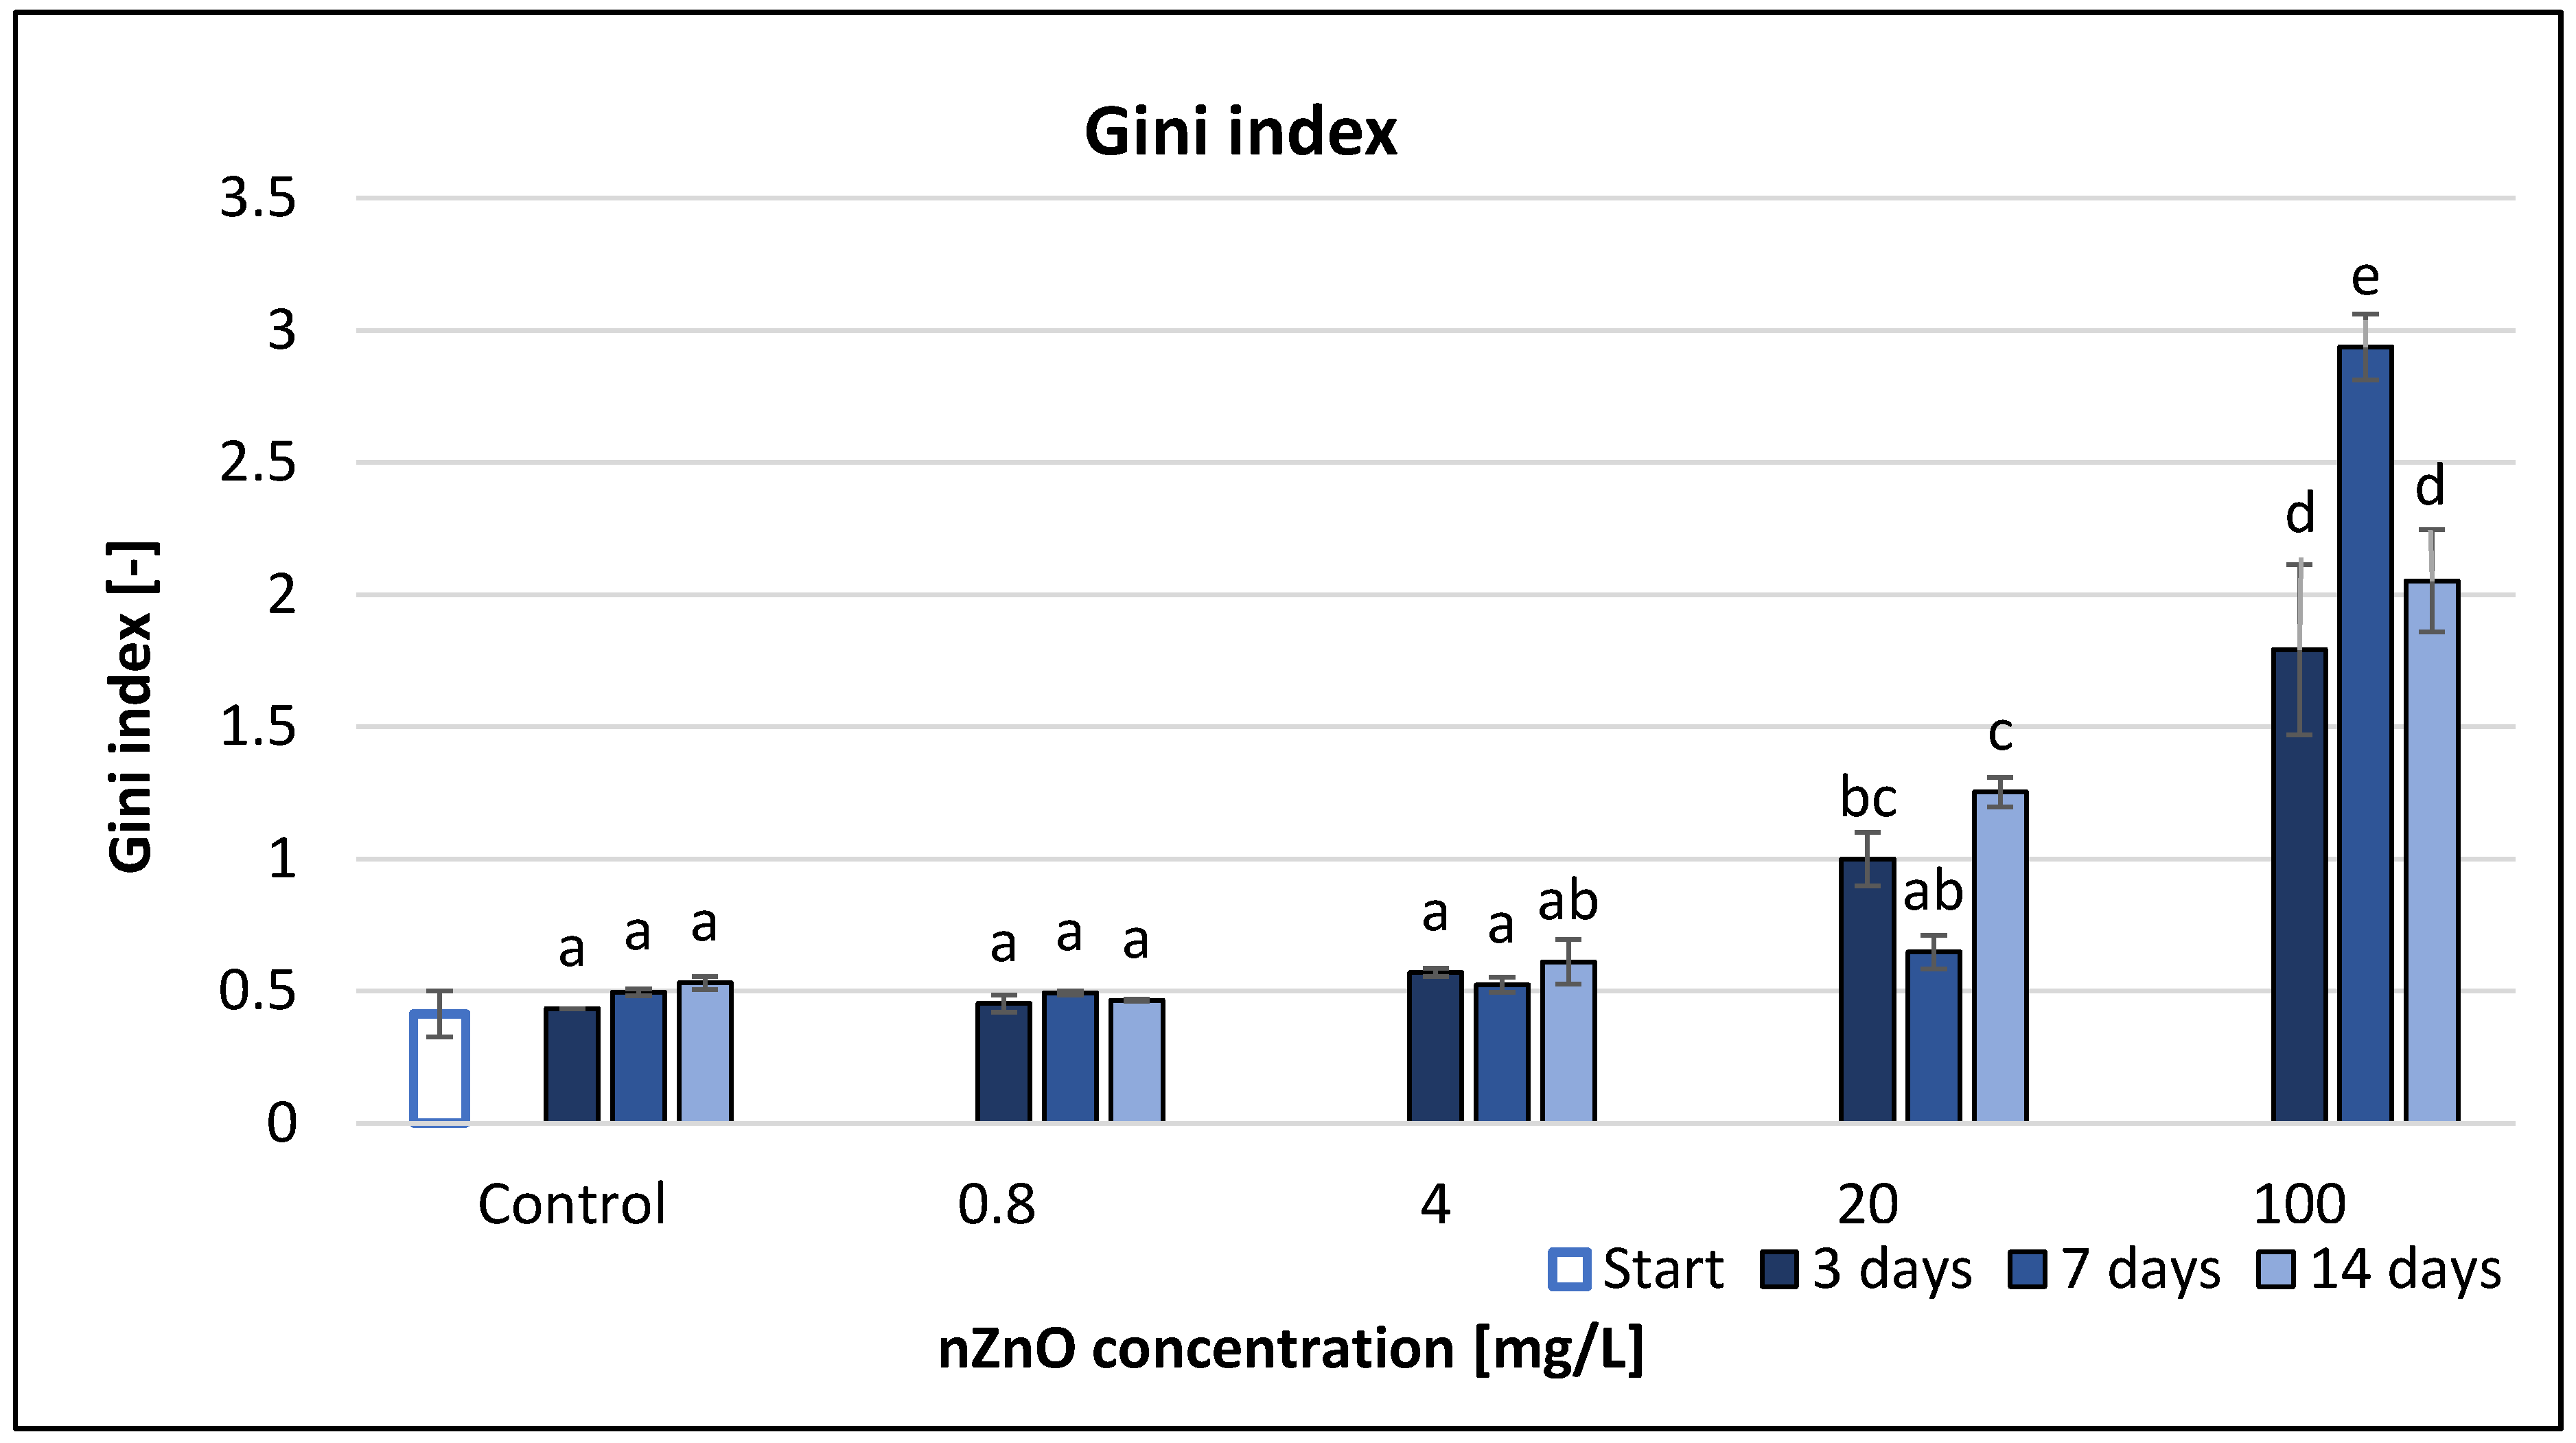
3.3. Effect of ZnO Nanoparticles on the Community-Level Physiological Profiles (CLPP)

Average well colour development (AWCD) significantly decreased from the start to the end of the experiment. The different nZnO concentrations had a significant effect on the AWCD, but the interaction of time and nZnO treatment in different concentrations did not (Table 2). According to Figure 1, 100 mg/L nZnO had the highest effect (98–99% inhibition), while 0.8 mg/L nZnO the smallest (11–58%). However, the lowest nZnO concentration (0.8 mg/L) resulted in a significant decrease compared to the control in the short term (after 3 days). nZnO had significant impact at 4, 20 and 100 mg/L nZnO concentrations after 14 days. Correlation analysis (Table S1) indicated strong linear negative association between ZnO NP concentration and AWCD at each sampling time (r = −0.99).
The area under the curve (AUC) had a similar trend to AWCD (Figure 2), but in this case the interaction of treatment and time also had a significant effect, similarly to the separate effect of time and treatment (Table 2). There was a decreasing trend in the detected AUC values at the same concentration on different sampling days, except for the 100 mg/L nZnO concentration, which showed a slight growth. However, the increasing nZnO amount significantly reduced the AUC values (Figure 2). The nZnO concentrations of 4 mg/L and above exhibited significant difference compared to control at each measurement time. The results of the correlation analysis (Table S1) showed that the AUC values negatively correlated (r = −0.98–1.00) with the nZnO concentration after 3, 7 and 14 days of exposure (p < 0.05).
The effect on substrate richness (SR) was similar to that on the AUC values (Figure 3). The high nZnO concentrations significantly decreased the usage of many substrates. A concentration of 100 mg/L nZnO resulted in no detectable substrate use on the 3rd and 7th day of the experiment, while on the 14th day a colour change occurred in one substrate (pyruvic acid methyl ester), which was consistent with the results of AUC. Time, treatment and their interaction had significant effect on the SR values based on RMANOVA analysis (Table 2). The correlation analysis (Table S1) showed strong and negative correlation between the nZnO concentration and the SR values (r = −0.97–0.99) after 3, 7 and 14 days of exposure (p < 0.05).
According to our results, Shannon index (H) had similar structure to the AWCD, AUC and SR pattern, although it seemed to be less sensitive at low concentrations, and it had a peak value at 20 mg/L nZnO concentration.
On the other hand, the difference between the H values at 20 and 100 mg/L nZnO was not as high as in case of the previous endpoints (AWCD, AUC and SR) at these concentrations. In addition, the H values at 20 and 100 mg/L nZnO were significantly lower than in case of lower nZnO concentrations (Figure 4). RMANOVA demonstrated the significant effect of time, treatment and their interaction (Table 2).
The correlation analysis (Table S1) displayed a strong significant correlation between the nZnO concentration and the H values (r = −0.99) only after 3 and 14 days exposure (p < 0.05).
Shannon evenness (E), derived from the Shannon index (H), did not show any significant effects compared to the control at the smallest applied nZnO concentrations (0.8 and 4 mg/L). However, the E value at 20 mg/L nZnO concentration indicated significant effect (Figure 5). The relevant Equation (7) and the involved SR values for the calculation of E did not result any E values at 100 mg/L nZnO. According to the RMANOVA statistical analysis, only the treatment with ZnO nanoparticles had significant effect (Table 2). The Pearson correlation analysis (Table S1) displayed significant strong correlation between the nZnO concentration and the E values but only after 7 and 14 days of exposure (r = −0.723 and −0.614 at p < 0.05, respectively).
Based on the Simpson index (D), similarly to the Shannon evenness, ZnO nanoparticles at 0.8 and 4 mg/L concentration had no significant effect compared to the control (Figure 6). The detectable significant effect occurred only at 20 and 100 mg/L concentrations; the highest decrease (18%) occurred at 100 mg/L nZnO concentration after 14 days. Although the highest tested concentration caused significant decrease compared to control at each sampling time, RMANOVA analysis illustrated that the time, treatment and their interaction had a significant effect on the Simpson index values (Table 2). Correlation analysis with coefficients r = −0.641 (3rd day), −0.887 (7th day) and −0.849 (14th day) illustrated significant linear negative relationship between the concentration and Simpson index (Table S1).
McIntosh index (U) was the most sensitive diversity index for indicating the effect of ZnO nanoparticles on microbial community according to Figure 7. Generally, the U values decreased with the increase of the applied nZnO concentrations and the elapsed time of the experiment. 20 mg/L nZnO concentration decreased the McIntosh index by 74–76% compared to the non-treated control, while 100 mg/L nZnO resulted in 90–92% reduction. The RMANOVA clearly illustrated the very strong significant effect (p value 0.000) of treatment and time, and even their interaction (Table 2.). Correlation analysis with coefficients r = −0.835 (3rd day), −0.838 (7th day) and −0.806 (14th day) illustrated strong linear negative relationship between the concentration and Simpson index, which was significant at p < 0.05 (Table S1).
The Gini index (G) increased with the applied nZnO concentration (Figure 8). Low Gini index values indicated high levels of functional diversity [47]. Gini index illustrated significant effects only at higher nZnO concentrations (20; 100 mg/L). Highest increase (493%) compared to control occurred at 100 mg/L concentration after 7 days. Statistical analysis showed that not just the treatment, but also the treatment-time interaction had a significant effect (Table 2). Correlation analysis (r = 0.824–0.903) revealed strong positive relationship between the concentration and Gini index, which was significant at p < 0.05 (Table S1).
The microbial metabolic pathways were also influenced by the ZnO nanoparticles, as confirmed by the substrate average well colour development values. The use ratio of each substrate category was illustrated in Figure 9, considering that total use of the six different substrate groups was 100%. The SAWCD ratio by substrate groups was highly influenced by nZnO concentration. The metabolism of polymers decreased with the elapsed days and the applied nZnO concentration, although, at 100 mg/L nZnO concentration the ratio of the total substrate use increased.
Use of amines had a similar pattern. At 20 mg/L nZnO dose the amine metabolism decreased, similarly to the phenolic compounds. On the other hand, the use ratio of carboxylic acids increased with the applied nZnO concentration, suggesting that use of these substrates was not influenced by ZnO nanoparticles, or it was intensified by the changed environmental parameters.
According to the results, the use of each substrate group was influenced by the presence of nZnO especially at 20 and 100 mg/L concentrations.
Although carbohydrates were the most represented substrate class in Biolog EcoPlate™, they were the least used (0–14.5%)—while polymers (15–43%) and carboxylic acids (15–56%) had the highest contribution to CLPP.

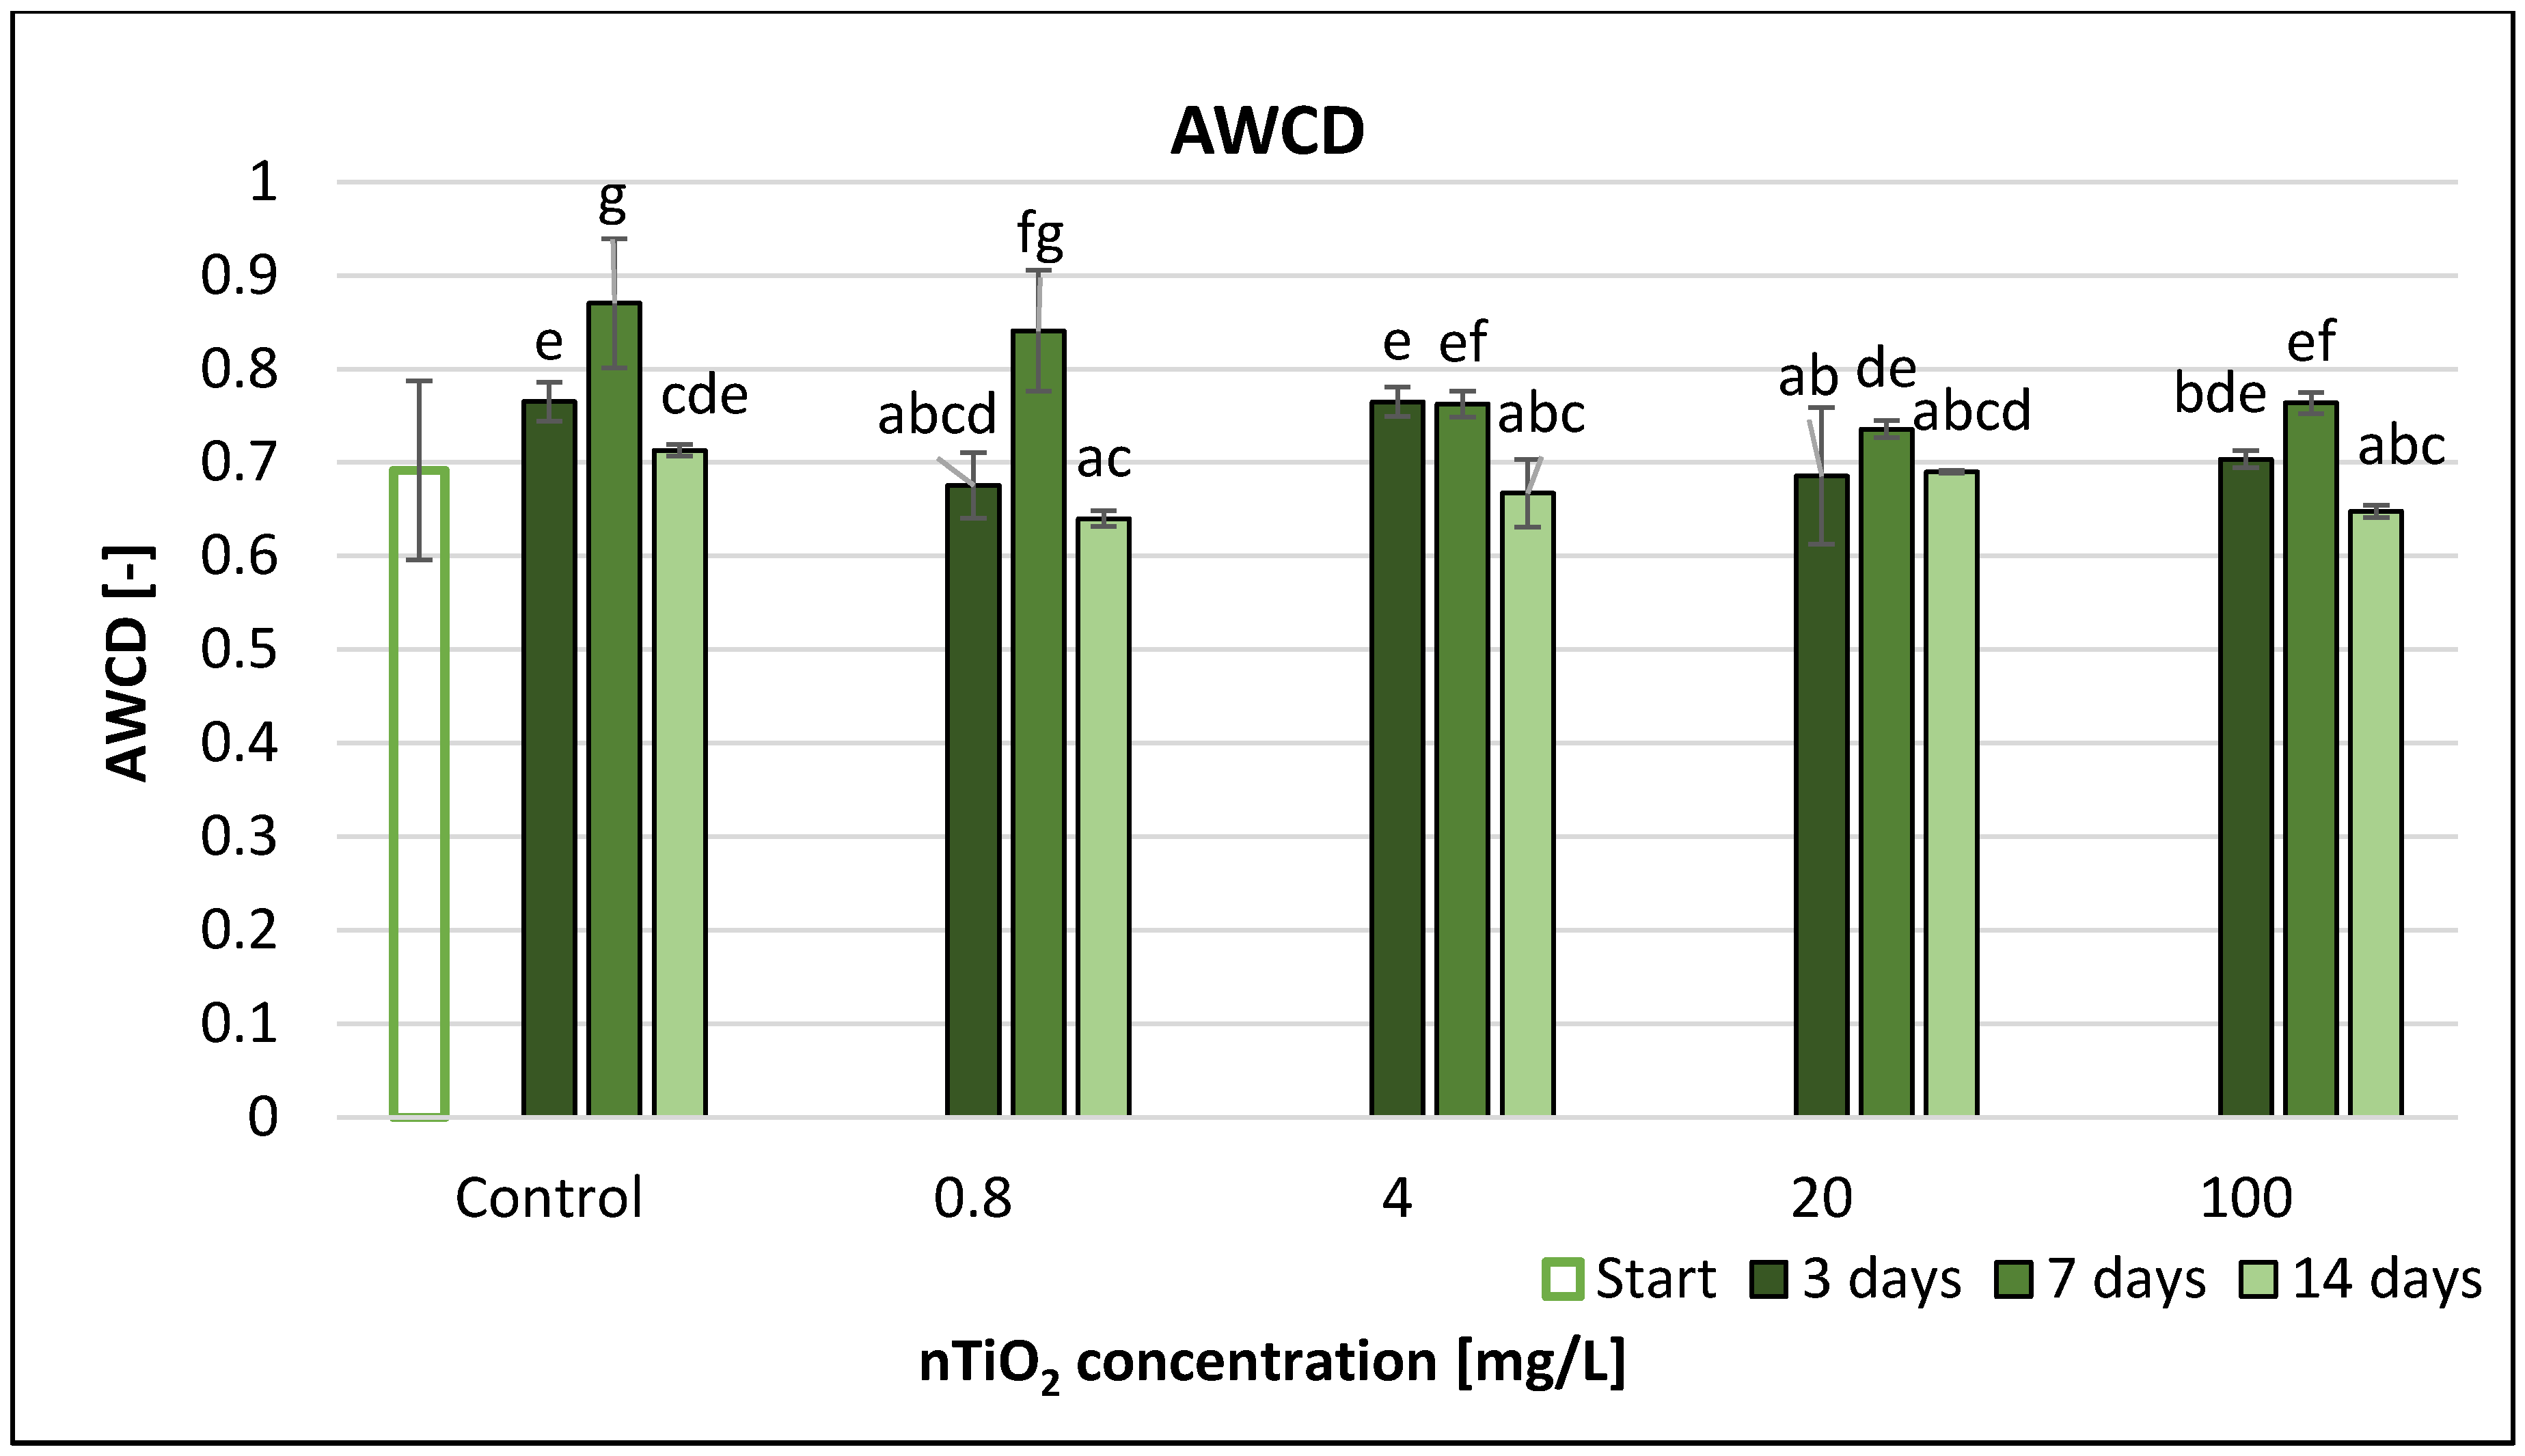
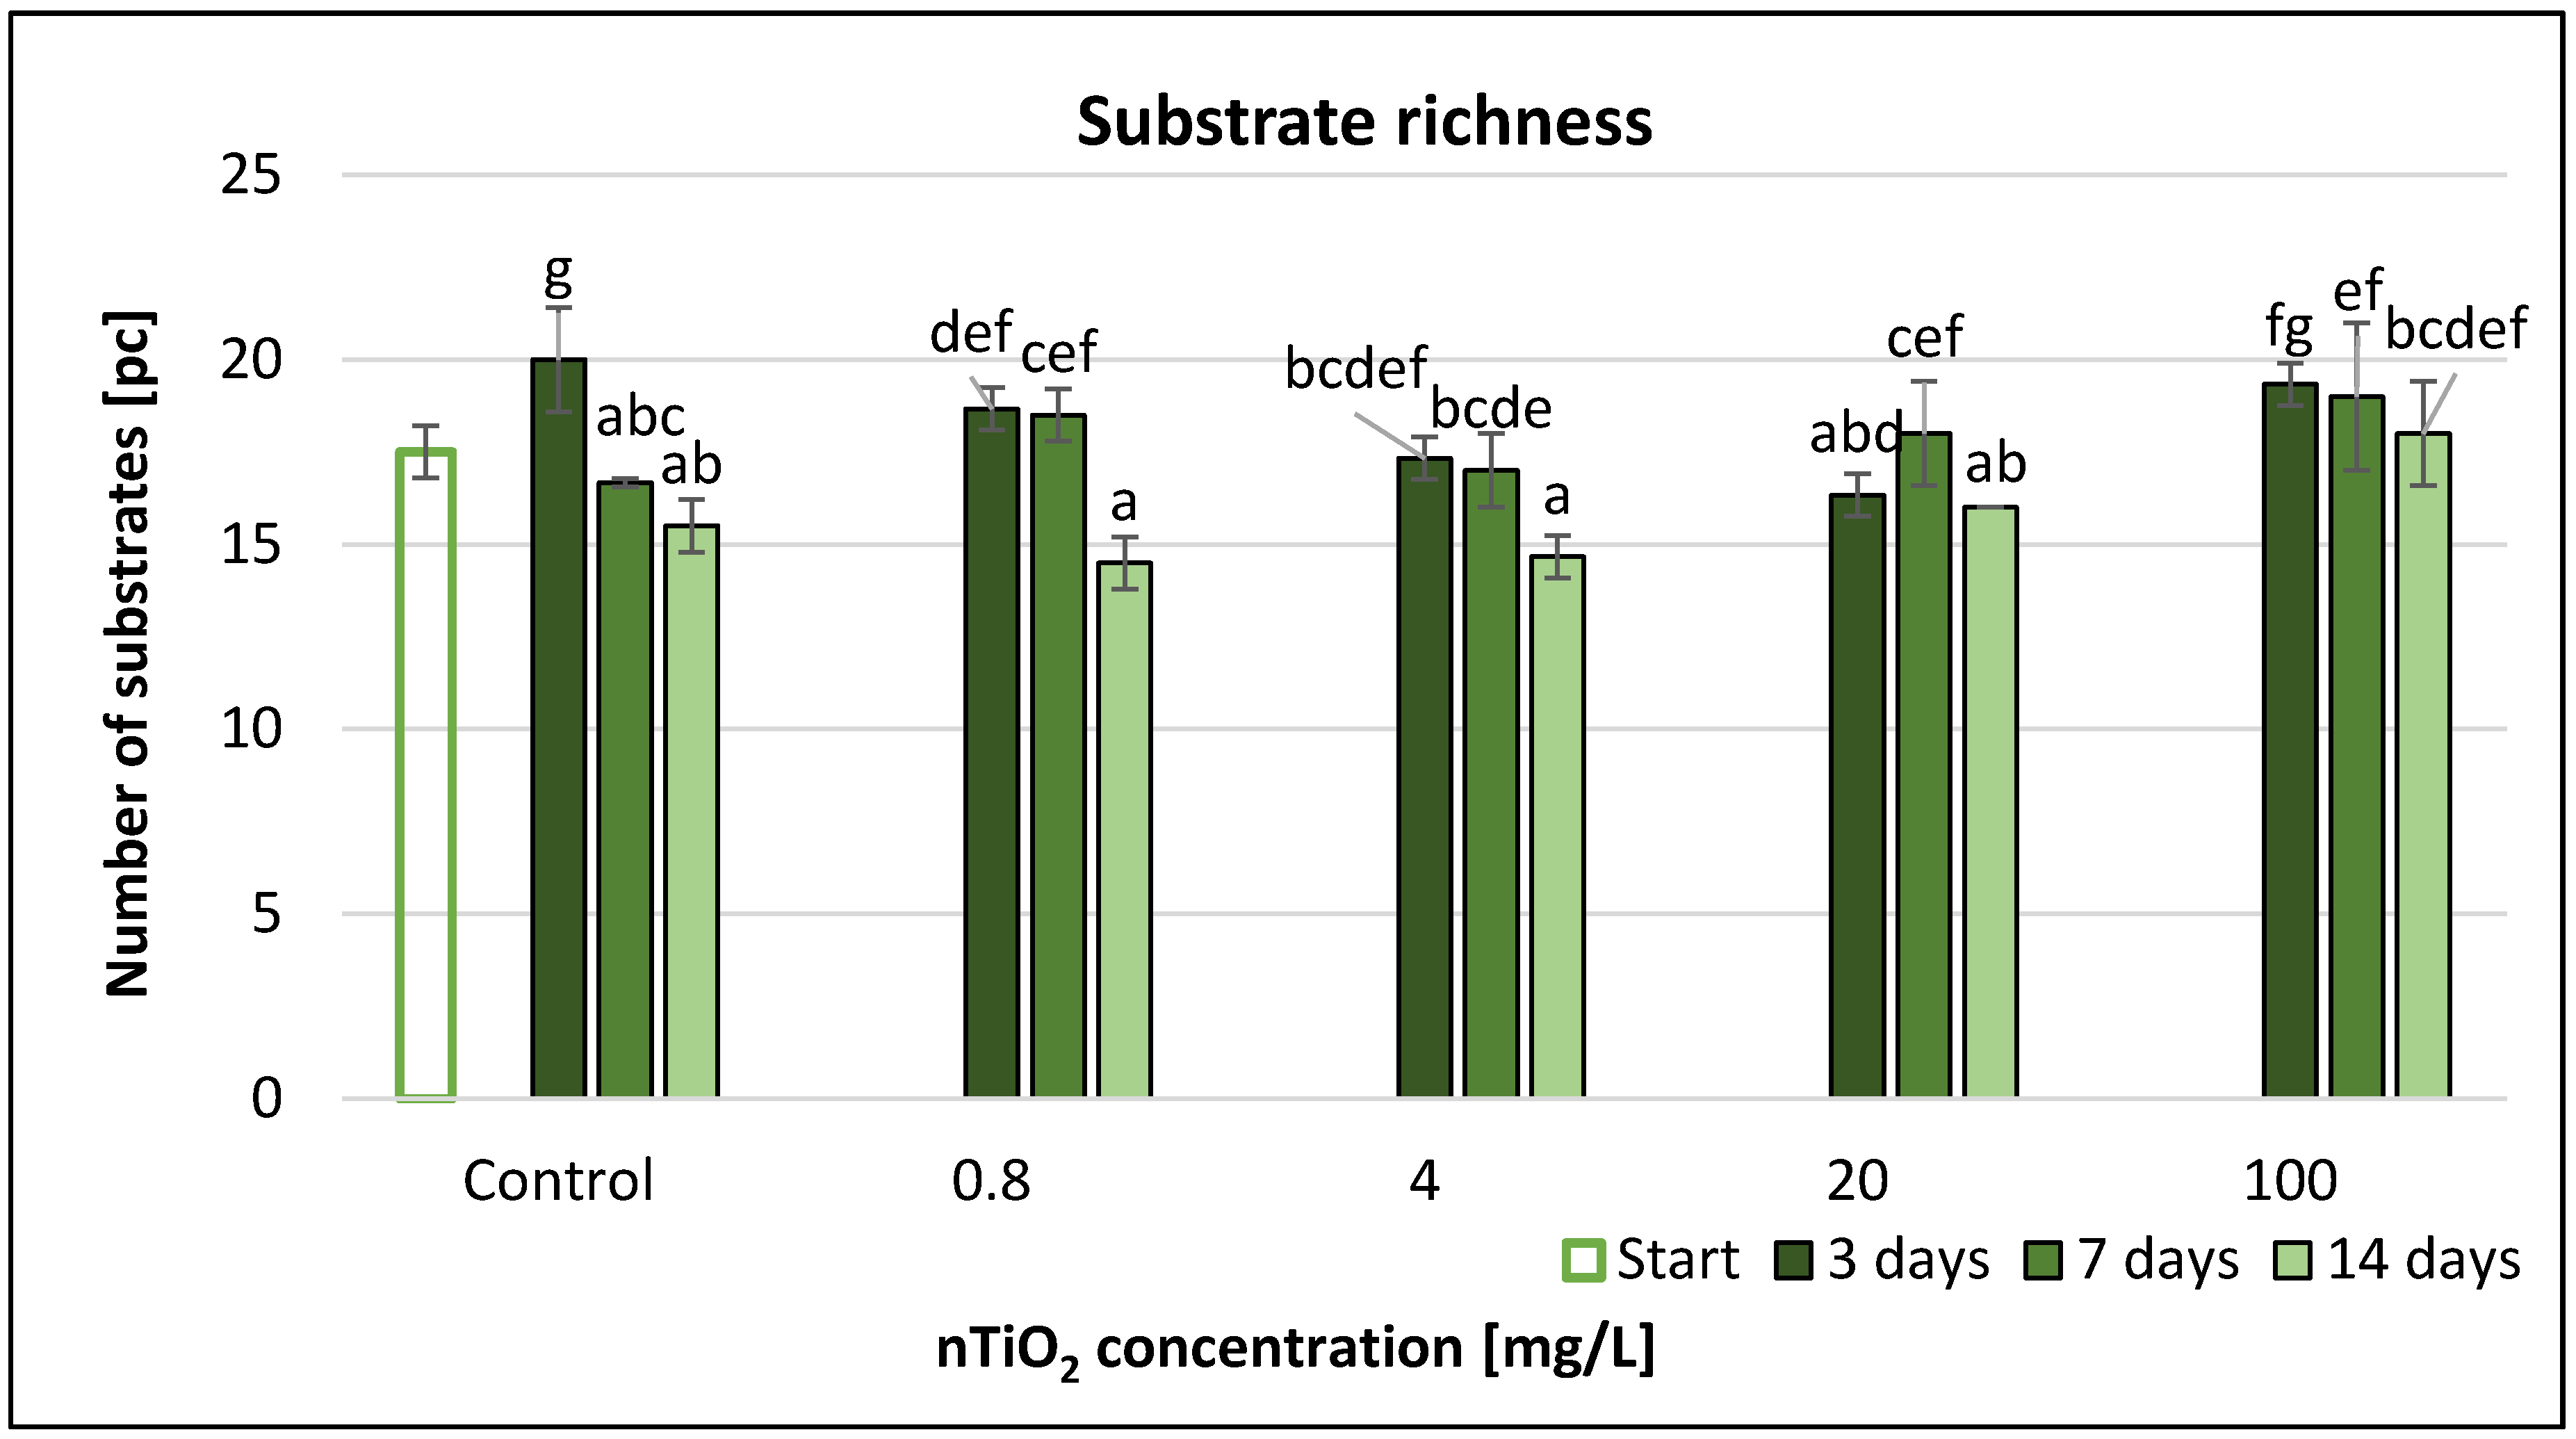
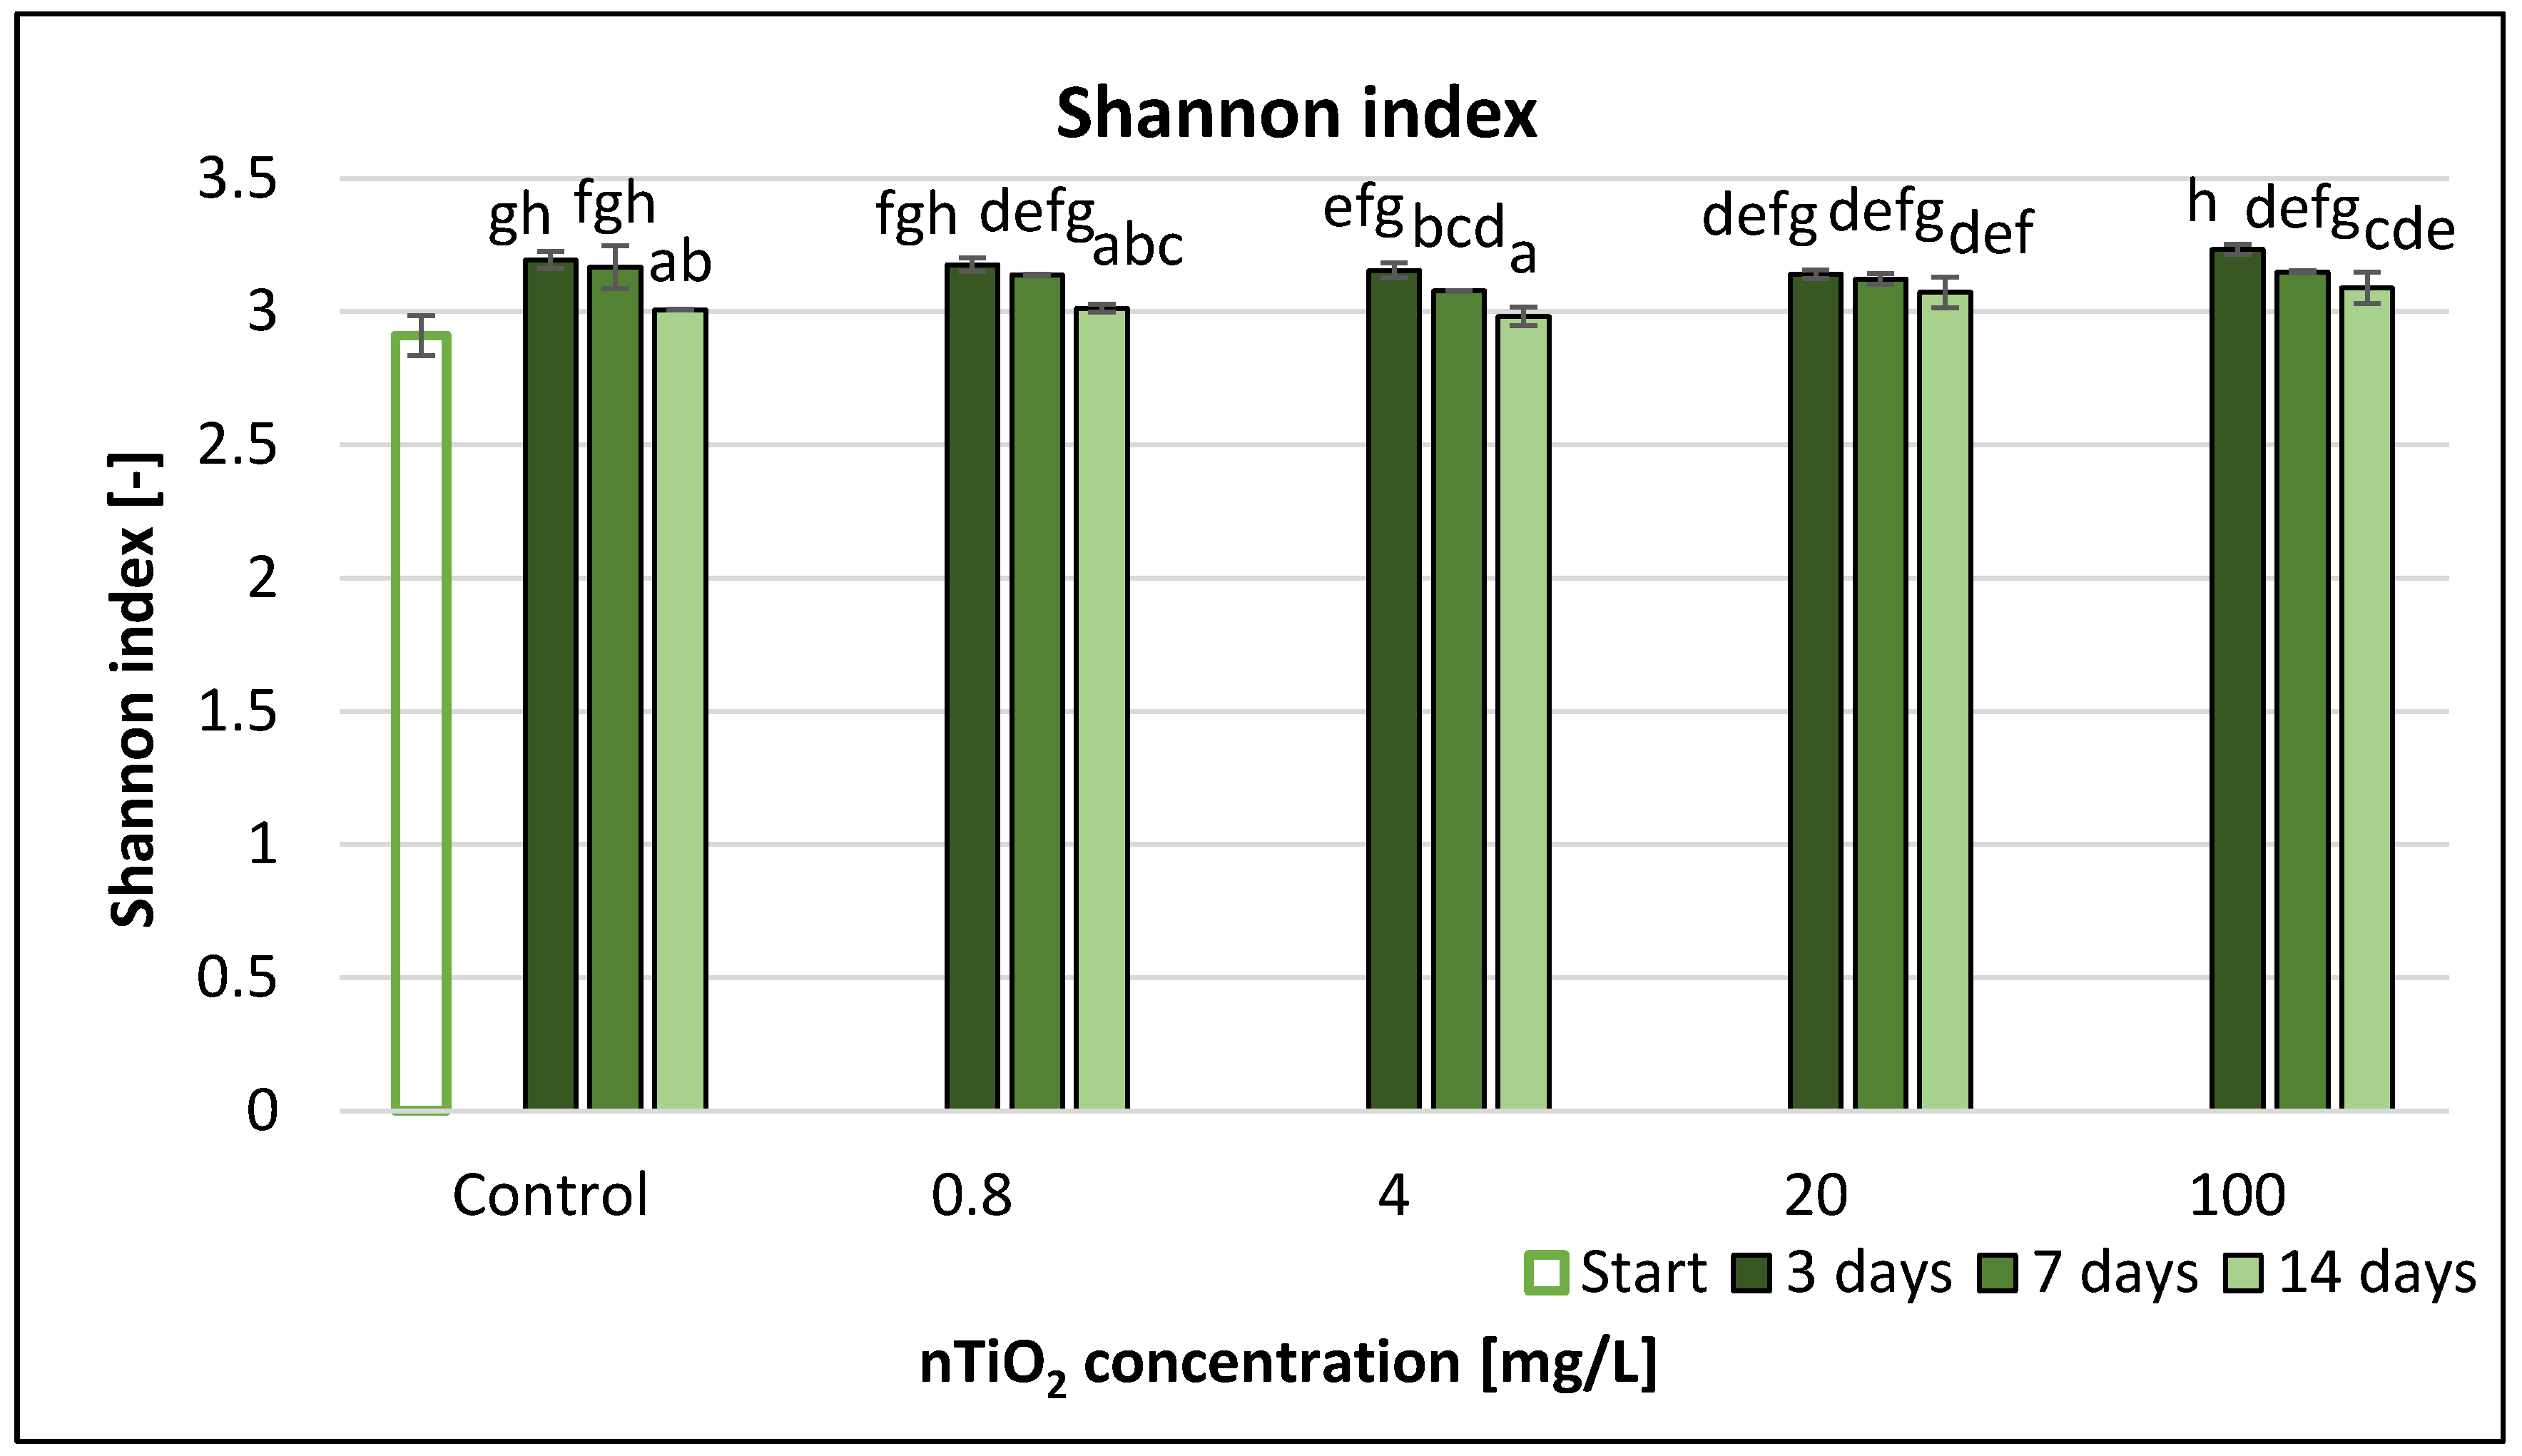
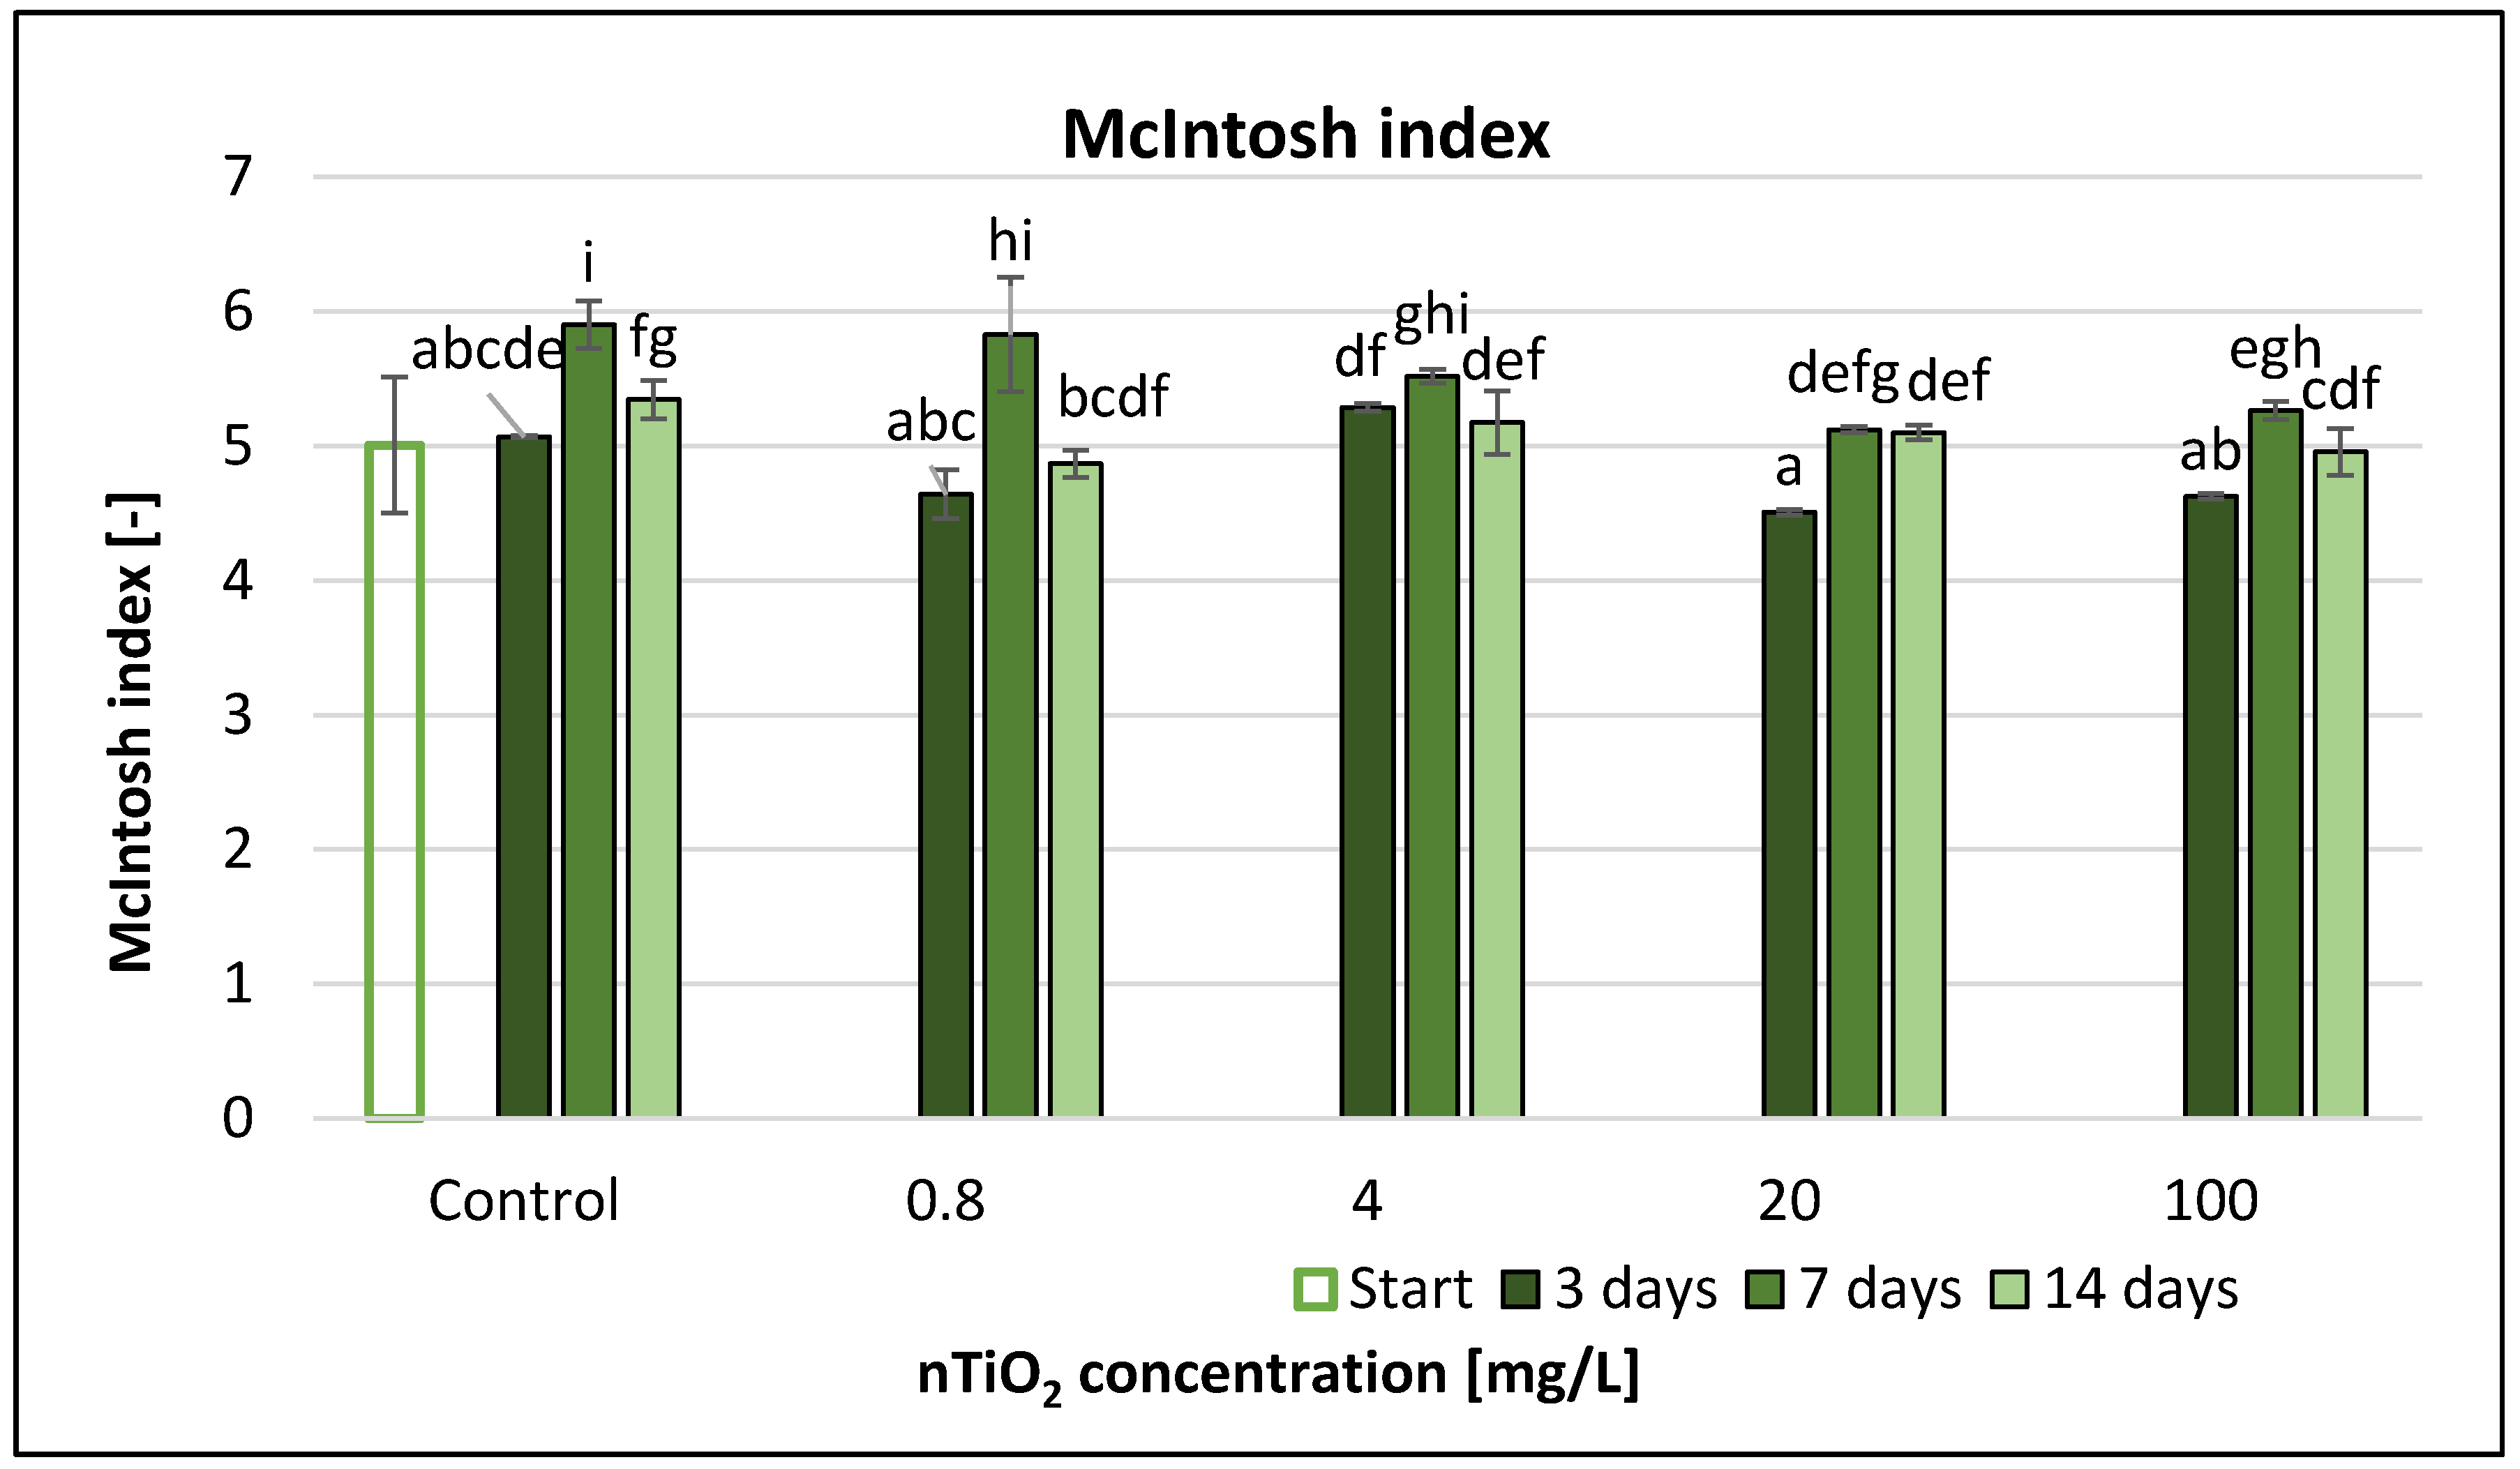
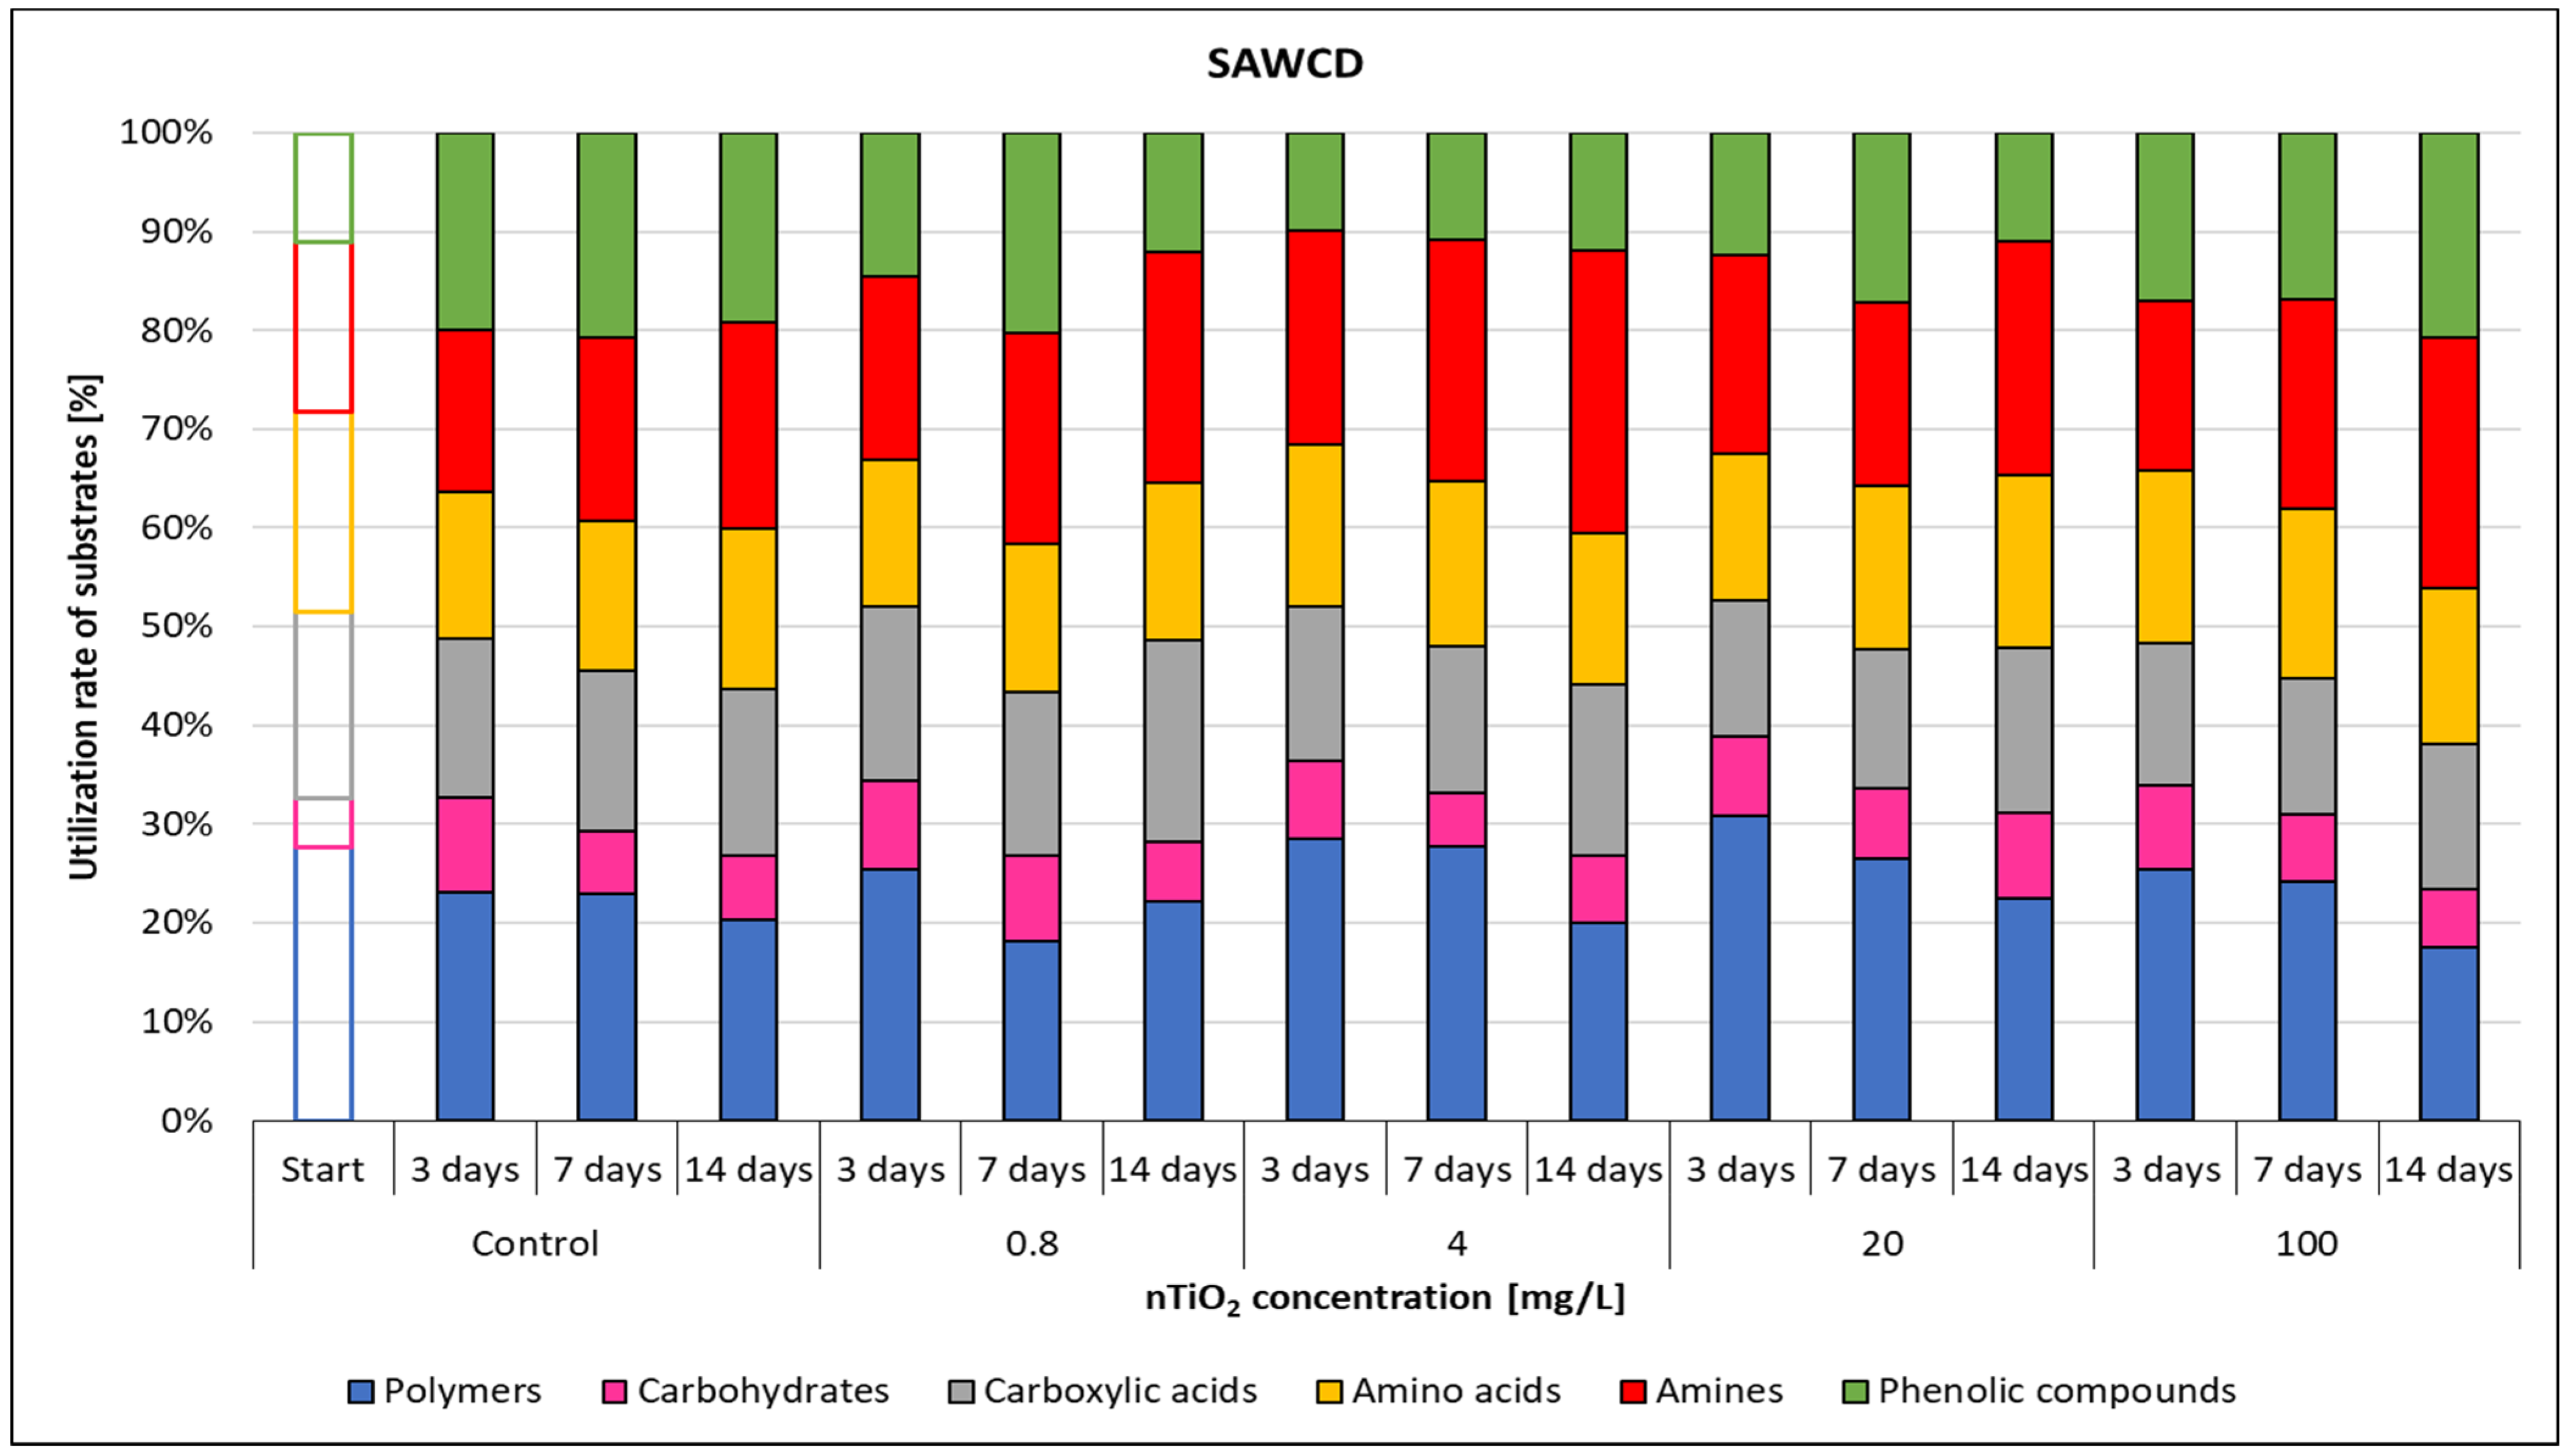
3.4. Effect of TiO2 Nanoparticles on the Community-Level Physiological Profiles (CLPP)

The average well colour development (AWCD) values usually showed a slight decline from the start to the end of the experiment (Figure 10) such as AUC values (Figure S1). The highest decrease (15%) was measured at 20 mg/L nTiO2 concentration after 7 days. A concentration of 100 mg/L nTiO2 resulted in 9% decrease compared to control after 14 days. However, the extent of the decrease was low. The RMANOVA analysis demonstrated that nTiO2 treatment and time as well as their interactions had significant effect on the AWCD (Table 3). The most significant changes were after 1 week, with significant differences between the AWCD values in the control and the nTiO2 microcosms mainly at higher concentrations (4–100 mg/L). However, after 2 weeks, nTiO2 displayed no significant effect. Correlation analysis did not show a clear correspondence between concentration and AWCD (Table S2).
The evolution of the substrate number (SR) values function of concentration had different trends at each sampling time (Figure 11). At up to 20 mg/L nTiO2 concentration it decreased continuously after 3 days; however, at 100 mg/L concentration, there was no significant change compared to control. A small increase was encountered proportionally with the concentration after both 7 and 14 days of exposure. The largest difference (~19% inhibition) versus the control occurred at 20 mg/L concentration level, after 3 days. The RMANOVA (Table 3) demonstrated that the treatment did not influence the evolution of substrate number; but the effect of time and the interactive effects of time × treatment were significant on SR. Correlation analysis showed strong positive correlation between concentration and SR (r = 0.850) after 2 weeks of exposure (Table S2).
The Shannon index (H), applied widely for characterising microbial diversity, showed only very small differences both in time and function of nTiO2 doses (Figure 12). Significant changes compared to control occurred at 4 mg/L nTiO2 after 7 days and at 20 and 100 mg/L nTiO2 after 14 days.
The highest alteration (less than 5%) compared to control occurred at 4 mg/L nTiO2 after 7 days. Based on the RMANOVA results, TiO2 nanoparticles (treatment) and time had significant effects on the Shannon index (Table 3). Pearson correlation coefficients did not indicate significant correlation between variables in this case (Table S2), but Shannon evenness (Figure S2) had significant correlation after 14 days exposure (Table S2).
The McIntosh index (Figure 13) showed higher differences both in time and as a function of nanomaterial concentration compared to the Simpson index (Figure S3). However, these changes did not exhibit a clear tendency function of nTiO2 concentration.
Significant differences compared to the control occurred only at 20 and 100 mg/L nTiO2 after 7 days and the McIntosh index values were the highest at this time point. During the 7th day, the McIntosh index values showed a slight decreasing trend with the increase of nTiO2 concentration. The largest decrease compared to control occurred at 20 mg/L and 100 mg/L, representing 13% and 11%, respectively.
Based on the results of correlation analysis, there was only a slight non-significant association between the two variables (TiO2 concentration and McIntosh index) (Table S2), such as in case of Gini index (Figure S4).
The RMANOVA analysis of the Biolog EcoPlate™ data based on the McIntosh index showed a clear significant effect of treatment and time, as well as of their interaction (Table 3).
The SAWCD ratio per guild in the nTiO2-contaminated microcosms did not change significantly during the experiment (Figure 14).
According to the percent distribution of SAWCD for each nTiO2 concentration (Figure 14), the use rate of the substrate groups did not change significantly with incremental nTiO2 concentrations.
The microbes in the different microcosms used all six substrate groups, but there were differences in the use of the various groups regardless of nTiO2 concentration and elapsed time.
The use rate of carbohydrates (5–10%) was the lowest, while those of polymers (18–31%) and amines (16–29%) were the highest.

4. Discussion

Currently, the amount of available research data concerning the effect of metal oxide nanoparticles on freshwater bacterial communities is very limited. The results of the present study reveal the necessity of assessing the impact of nano-metal oxides not only on single organisms from higher trophic levels, but also on microbial communities in aquatic systems. The results demonstrated that the effects of the two tested MONPs (nTiO2 and nZnO) on the freshwater microbial systems were different. Although both the tested concentrations and the exposure times were identical in the two freshwater ecosystems, the Biolog EcoPlate™ system identified significant differences between their effects.

4.1. Assessment of the Impact of TiO2 Nanoparticles on Freshwater Microbial Diversity

TiO2 NPs had a low, but significant effect on microbial communities. This result correlates with Miao et al.’s [48] about the effect of TiO2 and cerium dioxide (CeO2) NPs on the ecosystem of aquatic sediments. They found that oxygen consumption decreased in the case of both NP types, but nTiO2 had a less acute toxic effect compared to nCeO2. Although the treatment increased bacterial diversity, the metabolic activity of benthic microbial communities was negatively affected by the NPs [48]. Our results were in accordance with Londono et al. [15] and Chavan and Nadanathangam [49], who found that the addition of TiO2 NPs had a lower effect on the bacterial communities than the nZnO under the same experimental parameters. According to several studies, TiO2 nanoparticles in surface waters and aquatic test systems may form agglomerates, so the resulting TiO2-induced effect is due to the presence of agglomerates, in addition to individual and well-dispersed primary NPs [13,50]. Thus, microorganisms in surface waters may be exposed to NPs of different form and particle size. The typical nTiO2 toxicity mechanism is the formation of reactive oxygen species (ROS) through photocatalytic reaction, followed by a subsequent damage of the lipid membrane [13]. However, our experiments were performed in the dark, so this pathway could not play a significant role, which may explain the slighter effect on the microbial community. Since TiO2 NPs are not expected to dissolve under the studied conditions, other mechanisms in the bacterial community may be responsible for the low-level but significant effect of nTiO2, such as enhanced membrane permeability and subsequent penetration of nanoparticles, in addition to the adsorption of NPs to the cell membrane which may induce intracellular ROS [13]. Additionally, the binding affinity of NPs to organic molecules, the penetration of primary particles (<10 nm) through damaged membranes and matrix effects may induce varying degrees of toxicity [13,50,51].

4.2. Assessment of the Impact of ZnO Nanoparticles on Freshwater Microbial Diversity

In line with studies about the effects of nanomaterials in aquatic and terrestrial systems performed with different methods we found a concentration- and time-dependent effect of nZnO on bacterial community [15,49,52].
ZnO nanoparticles significantly and stably inhibited leaf decomposition in stream water at 100 mg/L throughout a 50-day exposure, as described by Du et al. [53]. Inhibition occurred only on the 43rd day at 10 mg/L dose of nZnO, but fungal diversity decreased. According to Du et al. [54], ZnO NPs increased the fungal biomass in aquatic ecosystems after 5 days of exposure, but after 45 days, chronic effects caused a significant decrease even at 300 ng/L concentration. Our results were similar to Du et al.’s [54] findings, but the Biolog EcoPlate™ technique was already able to identify the negative effects of ZnO NPs after 3 days’ exposure at 0.8 mg/L. Both ZnO nanoparticles and the dissolved Zn2+ ions may be responsible for the significant inhibitory effect. In our study, it is unknown whether dissolved zinc or the ZnO NPs exerted the adverse effects, but this was not the aim of our research. Our results harmonised with Kusi et al.’s [55] about the negative effects of silver nanoparticles (AgNPs) on freshwater microbial activity. Kusi et al. [55] applied silver nanoparticles (AgNPs) at 125 mg/L maximum concentration in microcosms with stream water. The microbial catabolic activity decreased, resulting in a decrease of the AWCD and SR values. The change in the used carbon source pattern of Kusi et al.’s study was similar to our results regarding the substrate average well colour development (SAWCD), suggesting amino acids, carbohydrates and carboxylic acids as carbon sources for metabolic fingerprint. In our research, the most affected substrate group in terms of use, affected by nZnO was the carboxylic acids group. The substrate average well colour development (SAWCD) ratio by groups indicated significant and high nZnO-induced changes; use of all substrate groups was influenced by nZnO especially at the highest concentrations (20–100 mg/L).
The highest shift occurred in the use of carboxylic acids; the initial use (15–17%) in the control increased to 30–57% at 20 and 100 mg/L nZnO level. This was in accordance with Teng et al. [56] and Melita et al. [57], who also found that carboxylic acids were sensitive carbon sources. These substrates are products of organic matter degradation in surface waters; therefore, carboxylic acids belong to the labile organic matter sources of the aquatic environment.
The reason for the enhanced carboxylic acid use may be the consumption of easily available substrates stimulated by the degraded environmental conditions at 20 and 100 mg/L nZnO.

4.3. Comparison of the Effects of TiO2 and ZnO Nanoparticles on Freshwater Microbial Diversity

Based on the observed effects of TiO2 and ZnO nanoparticles, these NPs are harmful for the microbial activity. ZnO NPs had a stronger effect than TiO2 NPs on all the tested endpoints. In accordance with several studies, our results determined by Biolog EcoPlate™ clearly reflected that the impact of MONPs on microbial community were largely determined by the type of NP [15,49].
Most of the computed endpoints presented a significant decrease at all examined concentrations, in some cases there were even detectable significant effects at a dosage of 0.8 mg/L. The influence of ZnO NPs was correlated with exposure time and the applied concentration; thus, at 100 mg/L dosage, the substrate use activity was highly reduced after 14 days. These results are similar to the observations of Londono et al. [15], who found that nZnO had a higher influence on water bacterial community than nTiO2. In line with their results, nTiO2 did not cause significant effect at 700 µg/L, while nZnO shifted the microbial community structure and genus distribution even at 70 µg/L concentration. Similar to these results, Chavan et al. [49] reported that the metabolic diversity and activity of microbial communities in soils was impacted in the presence of zinc oxide, but not of titanium dioxide NPs.
According to the Pearson correlation results, nTiO2 concentration had a low correlation to the endpoints and most of them were not significant (p < 0.05), but the Pearson’s “r” values in most cases were higher with the elapsed days (Table S2), which also indicated the significance of the exposure time. In contrast to the TiO2 nanoparticles, almost every endpoint (except Shannon evenness) showed a high correlation with the applied nZnO concentration (|r| > 0.80), and most of them were significant (p < 0.05) (Table S1) regardless of the exposure time.
The higher damage caused by ZnO NPs to microbial activity may be due to the presence of dissolved zinc ions. Uptake of toxic dissolved zinc ions may result in decreased enzyme activity as reported by Sirelkhatim et al. [58]. According to their study, ZnO NPs caused inhibition of the respiratory enzymes [58]. Our findings may reveal this mechanism as well, as the tetrazolium reduction assay in our study displayed a concentration-dependent inhibition of enzyme activity; therefore, the inhibition mechanism may be similar to that identified by Sirelkhatim et al. [58].

4.4. Characterisation of the Applicability of the Biolog EcoPlate™ for the Evaluation of the Effects of Nanoparticles on Freshwater Microbial Diversity

Biolog EcoPlate™ is a low-cost, simple and easy technique to describe and compare bacterial communities and their activity. It provides information through different calculated endpoints derived from the optical density values. Because the examined nTiO2 concentrations proved to have significant effects only in some cases, the conclusions of our study focused mainly on the effect of nZnO. Based on our results, the AWCD, AUC and SR values significantly decreased with incremental ZnO NPs concentrations. These endpoints demonstrate the harmful effects of nZnO, but they are not completely independent from each other.
SR and AWCD interact with each other: a high AWCD value indicates use of many carbon sources, a medium AWCD value suggests that all substrates are slightly used or some carbon sources are well used and the others are not used [59]. AUC values are also calculated based on ODs, and thus the AUC has a similar pattern to AWCD and SR. RMANOVA analysis revealed significant changes in the metabolic profiles of the microbial community according to the above-mentioned indices and in the presence of ZnO nanoparticles, but significant differences were more pronounced for AUC and SR parameters.
The use rates of different substrate classes (SAWCD) have rarely been applied in Biolog EcoPlate™ studies, although they can provide important and complementary information to the frequently applied endpoints. Substrates which are promptly and preferentially used may indicate important information on the environmental conditions [57]. Interestingly, the use of carboxylic acids showed an increasing trend over time at concentrations of 20 and 100 mg/L nZnO. The use of pyruvic acid methyl ester was the most significant within the carboxylic acid group at these nanomaterial concentrations after 14 days. The use of Tween40 and Tween80 was also significant in the microcosms containing high (20 and 100 mg/L) nZnO concentrations, while the carbohydrates were used at a much lower rate than in the control. Presumably, in this impacted environment, microorganisms acquired the ability to metabolise more complex carbon sources.
Our research aimed at the comparative evaluation of the different diversity indicators such as Shannon index, Shannon evenness, Simpson index, McIntosh index and Gini coefficient. Among these, the Shannon index and Shannon uniformity are most commonly used for the estimation of functional diversity.
Shannon index provides information about the distribution of the used carbon sources. A high Shannon index implies a greater functional metabolic diversity and at the same time an even distribution of different functional types. A great evenness can only be obtained if all carbon sources are well used, but it does not work backwards. If the majority of the substrates are used, the Shannon index value will be high [59]. Based on our results, nZnO treatment decreased the values of the Shannon index. This proves the negative effects of ZnO nanoparticles on microbial activity and diversity. Shannon evenness (E) is a measure of the uniformity of metabolic activities across all substrates. Shannon evenness had lower values below 20 mg/L nZnO concentration, while at 100 mg/L there were mathematical problems, because the SR value was 0, and the equation of this index (7) contains a division with natural logarithm of SR, hence there was a decrease, and thus it is not recommended to use this endpoint for characterisation.
Simpson index, similarly to the Shannon indices, represented the negative effects of nZnO. The rare species are rather more weighted in the Shannon than the common species, so the Shannon index is strongly influenced by species richness. The Simpson index weights common species more than relatively rare species, so this index gives more weight to evenness [60]. In our research, there was no significant difference between the two indices.
According to our results, McIntosh index is the best way to represent the change of the AWCD, AUC and SR endpoints; hence, the calculation of this index was based on the measured OD values, just like AWCD, AUC and SR. The McIntosh index is another measure of dominance; however, this index is not widely used. In our study, the McIntosh index value correlated with the microbial activity, and it also indicated the effect of treatment and time. Dejong [61] also found that the McIntosh and Simpson indices were more suitable to measure diversity than the Shannon index, because these indices were influenced noticeably more by evenness and less by richness than the Shannon index.
It should be highlighted that due to the sensitivity of the Gini coefficient, it reflected well the changes in metabolic activity triggered by the presence of NPs (nano titanium dioxide in addition to zinc oxide) (Figure S3). Gini index values increased with incremental ZnO NP concentrations, although the RMANOVA analysis did not display such a strong significant difference than in the case of the Shannon, Simpson and McIntosh index.
The Biolog EcoPlate™ technique does, however, have some limitations [32,49]. Using Biolog EcoPlate™ for bacterial community-level physiological profiling (CLPP) is easier and cheaper than DNA or RNA-based profiling. Additionally, several studies have reported that molecular profiling surveys are not more sensitive than CLPP approaches [62,63]. Nevertheless, further research is needed to estimate which bacterial genera are the most affected by NPs, because significantly different patterns can be observed by CLPP and DNA-based methods [64,65]. Changes of the aerobic and anaerobic microbial community should also be investigated, which could be performed by Biolog AN (anaerobic) microplate, provided with 95 carbon sources; hence, the use of more substrates could be examined.

5. Conclusions

Metal oxide nanoparticles are commonly and extensively used; therefore, they are likely to end up in aquatic environments. Nonetheless, their effect on freshwater microbial diversity has been poorly described. In this research, the Biolog EcoPlate™ technique was applied, based on living microorganisms, to show the metabolic capabilities and the physiological profiles of microbial community in MONPs affected freshwater. By experimenting with TiO2 and ZnO NPs in freshwater lab-scale microcosms, it was shown that nTiO2 weakly influences microbial community, while ZnO nanoparticles have a strong effect on the metabolic activity and functional diversity of the microbiome. Not just the presence and concentration of MONPs, but the exposure time also exhibited a significant effect on the studied Biolog EcoPlate™ parameters. The Biolog EcoPlate™ data clearly reflected that the changes were largely determined by the type of NP. Carbohydrates, carboxylic acids and polymers were found to be the principal indicator substrates at higher ZnO nanoparticle concentrations. Our results also demonstrated that the sensitivities of the examined indices were different and their simultaneous use could provide complementary information. McIntosh index as a diversity indicator displayed a good sensitivity for indicating the modified diversity of a bacterial community in nanomaterials affected freshwater. The evenness of microbial species and their carbon source use evenness also changed upon NP treatment, which was indicated by the Gini coefficient and Shannon evenness. To indicate the effect of nanoparticles on microbial communities the application of the Biolog EcoPlate™ as a rapid, cheap and practical technique is recommended.

Supplementary Materials

The following are available online at https://0-www-mdpi-com.brum.beds.ac.uk/article/10.3390/nano11071777/s1, Figure S1: The effect of TiO2 nanoparticles on freshwater based on the area under the curve value, Figure S2: The effect of TiO2 nanoparticles on Shannon evenness value of freshwater, Figure S3: The effect of TiO2 nanoparticles on freshwater Simpson index value, Figure S4: The effect of TiO2 nanoparticles on freshwater Gini index value, Table S1: Pearson correlation results to evaluate coherence of nZnO concentrations and diversity indices, Table S2. Pearson correlation results to evaluate coherence of nTiO2 concentrations and diversity indices.

Author Contributions

Conceptualisation, M.M. and I.N.; methodology, M.M. and I.N.; software, M.M., I.N. and S.M.; validation, M.M.; formal analysis, M.M.; investigation, M.M., I.N. and S.M.; resources, M.M.; data curation, M.M.; writing—original draft preparation, M.M., E.V. and I.N.; writing—review and editing, M.M., I.N. and E.V.; visualisation, M.M. and I.N.; supervision, M.M.; project administration, M.M.; funding acquisition, M.M. All authors have read and agreed to the published version of the manuscript.

Funding

This research was funded by the Higher Education Excellence Program of the Ministry of Human Capacities in the frame of Biotechnology research area of Budapest University of Technology and Economics (BME TIKP-BIO).

Institutional Review Board Statement

Not applicable.

Informed Consent Statement

Not applicable.

Data Availability Statement

Not applicable.

Conflicts of Interest

The authors declare no conflict of interest.

References

  1. Dudgeon, D.; Arthington, A.H.; Gessner, M.O.; Kawabata, Z.; Naiman, R.J.; Knowler, D.J.; Le, C. Freshwater biodiversity: Importance, threats, status and conservation challenges. Biol. Rev. 2015, 163–182. [Google Scholar] [CrossRef] [PubMed]
  2. Shade, A.; Peter, H.; Allison, S.D.; Baho, D.L.; Berga, M.; Bürgmann, H.; Huber, D.H.; Langenheder, S.; Lennon, J.T.; Martiny, J.B.H.; et al. Fundamentals of microbial community resistance and resilience. Front. Microbiol. 2012, 3, 1–19. [Google Scholar] [CrossRef] [Green Version]
  3. Zeglin, L.H. Stream microbial diversity in response to environmental changes: Review and synthesis of existing research. Front. microbiol. 2015, 6, 1–15. [Google Scholar] [CrossRef] [Green Version]
  4. Weir, A.; Westerhoff, P.; Fabricius, L.; Hristovski, K.; Von Goetz, N. Titanium dioxide nanoparticles in food and personal care products. Environ. Sci. Technol. 2012, 46, 2242–2250. [Google Scholar] [CrossRef] [Green Version]
  5. Walters, C.; Pool, E. Nanotoxicology: A review. Toxicol.-New Asp. This Sci. Conundrum 2016, 10, 5772–6475. [Google Scholar]
  6. Mishra, S.; Keswani, C.; Abhilash, P.C.; Fraceto, L.F.; Singh, H.B. Integrated approach of Agri-Nanotechnology: Challenges and future trends. Front. Plant Sci. 2017, 8, 1–12. [Google Scholar] [CrossRef] [Green Version]
  7. Piccinno, F.; Gottschalk, F.; Seeger, S.; Nowack, B. Industrial production quantities and uses of ten engineered nanomaterials in Europe and the world. J. Nanoparticle Res. 2012, 14, 1–11. [Google Scholar] [CrossRef] [Green Version]
  8. Kaegi, R.; Ulrich, A.; Sinnet, B.; Vonbank, R.; Wichser, A.; Zuleeg, S.; Simmler, H.; Brunner, S.; Vonmont, H.; Burkhardt, M.; et al. Synthetic TiO2 nanoparticle emission from exterior facades into the aquatic environment. Environ. Pollut. 2008, 156, 233–239. [Google Scholar] [CrossRef]
  9. Kiser, M.A.; Westerhoff, P.; Benn, T.; Wang, Y.; Pérez-Rivera, J.; Hristovski, K. Titanium nanomaterial removal and release from wastewater treatment plants. Environ. Sci. Technol. 2009, 43, 6757–6763. [Google Scholar] [CrossRef]
  10. Limbach, L.K.; Bereiter, R.; Müller, E.; Krebs, R.; Gälli, R.; Stark, W.J. Removal of oxide nanoparticles in a model wastewater treatment plant: Influence of agglomeration and surfactants on clearing efficiency. Environ. Sci. Technol. 2008, 42, 5828–5833. [Google Scholar] [CrossRef]
  11. Farkas, J.; Peter, H.; Ciesielski, T.M.; Thomas, K.V.; Sommaruga, R.; Salvenmoser, W.; Weyhenmeyer, G.A.; Tranvik, L.J.; Jenssen, B.M. Impact of TiO2 nanoparticles on freshwater bacteria from three Swedish lakes. Sci. Total Environ. 2015, 535, 85–93. [Google Scholar] [CrossRef] [Green Version]
  12. Nowack, B.; Mueller, N.C. Exposure modeling of engineered nanoparticles in the environment. EMPA Act. 2008, 41, 63. [Google Scholar]
  13. Battin, T.J.; Kammer, F.V.D.; Weilhartner, A.; Ottofuelling, S.; Hofmann, T. Nanostructured TiO2: Transport behavior and effects on aquatic microbial communities under environmental conditions. Environ. Sci. Technol. 2009, 43, 8098–8104. [Google Scholar] [CrossRef]
  14. Sun, T.Y.; Gottschalk, F.; Hungerbühler, K.; Nowack, B. Comprehensive probabilistic modelling of environmental emissions of engineered nanomaterials. Environ. Pollut. 2014, 185, 69–76. [Google Scholar] [CrossRef]
  15. Londono, N.; Donovan, A.R.; Shi, H.; Geisler, M.; Liang, Y. Impact of TiO2 and ZnO nanoparticles on an aquatic microbial community: Effect at environmentally relevant concentrations. Nanotoxicology 2017, 11, 1140–1156. [Google Scholar] [CrossRef]
  16. Keller, A.A.; Wang, H.; Zhou, D.; Lenihan, H.S.; Cherr, G.; Cardinale, B.J.; Miller, R.; Ji, Z. Stability and aggregation of metal oxide nanoparticles in natural aqueous matrices. Environ. Sci. Technol. 2010, 44, 1962–1967. [Google Scholar] [CrossRef] [PubMed]
  17. Peralta-Videa, J.R.; Zhao, L.; Lopez-Moreno, M.L.; de la Rosa, G.; Hong, J.; Gardea-Torresdey, J.L. Nanomaterials and the environment: A review for the biennium 2008–2010. J. Hazard. Mater. 2011, 186, 1–15. [Google Scholar] [CrossRef] [PubMed]
  18. Klaine, S.J.; Alvarez, P.J.J.; Batley, G.E.; Fernandes, T.F.; Handy, R.D.; Lyon, D.Y.; Mahendra, S.; McLaughlin, M.J.; Lead, J.R. Nanomaterials in the environment: Behavior, fate, bioavailability, and effects. Environ. Toxicol. Chem. 2008, 27, 1825–1851. [Google Scholar] [CrossRef] [PubMed]
  19. Frenk, S.; Ben-Moshe, T.; Dror, I.; Berkowitz, B.; Minz, D. Effect of metal oxide nanoparticles on microbial community structure and function in two different soil types. PLoS ONE 2013, 8, e84441. [Google Scholar] [CrossRef] [PubMed] [Green Version]
  20. Baysal, A.; Saygin, H.; Ustabasi, G.S. Physicochemical transformation of ZnO and TiO2 nanoparticles in sea water and its impact on bacterial toxicity. Environ. Health Eng. Manag. 2019, 6, 73–80. [Google Scholar] [CrossRef] [Green Version]
  21. Fekete-Kertész, I.; Piszmán, D.; Molnár, M. Particle Size and Concentration Dependent Ecotoxicity of Nano- and Microscale TiO2—Comparative Study by Different Aquatic Test Organisms of Different Trophic Levels. Water. Air. Soil Pollut. 2017, 228, 245. [Google Scholar] [CrossRef]
  22. Parada, J.; Rubilar, O.; Fernández-Baldo, M.A.; Bertolino, F.A.; Durán, N.; Seabra, A.B.; Tortella, G.R. The nanotechnology among US: Are metal and metal oxides nanoparticles a nano or mega risk for soil microbial communities? Crit. Rev. Biotechnol. 2019, 39, 157–172. [Google Scholar] [CrossRef]
  23. Barnes, R.J.; van der Gast, C.J.; Riba, O.; Lehtovirta, L.E.; Prosser, J.I.; Dobson, P.J.; Thompson, I.P. The impact of zero-valent iron nanoparticles on a river water bacterial community. J. Hazard. Mater. 2010, 184, 73–80. [Google Scholar] [CrossRef]
  24. Echavarri-Bravo, V.; Paterson, L.; Aspray, T.J.; Porter, J.S.; Winson, M.K.; Thornton, B.; Hartl, M.G.J. Shifts in the metabolic function of a benthic estuarine microbial community following a single pulse exposure to silver nanoparticles. Environ. Pollut. 2015, 201, 91–99. [Google Scholar] [CrossRef] [Green Version]
  25. Zabetakis, K.M.; De Guzmán, G.T.N.; Torrents, A.; Yarwood, S. Toxicity of zero-valent iron nanoparticles to a trichloroethylene-degrading groundwater microbial community. J. Environ. Sci. Health Part A Toxic/Hazardous Subst. Environ. Eng. 2015, 50, 794–805. [Google Scholar] [CrossRef]
  26. Christian, B.W.; Lind, O.T. Key issues concerning Biolog use for aerobic and anaerobic freshwater bacterial community-level physiological profiling. Int. Rev. Hydrobiol. 2006, 91, 257–268. [Google Scholar] [CrossRef]
  27. Xie, G.; Tang, X.; Shao, K.; Zhu, G.; Gao, G. Ecotoxicology and Environmental Safety Bacterial diversity, community composition and metabolic function in Lake Tianmuhu and its dammed river: Effects of domestic wastewater and damming. Ecotoxicol. Environ. Saf. 2021, 213, 112069. [Google Scholar] [CrossRef] [PubMed]
  28. Bahuguna, A.; Khan, I.; Bajpai, V.K.; Kang, S.C. MTT assay to evaluate the cytotoxic potential of a drug. Bangladesh J. Pharmacol. 2017, 12, 115–118. [Google Scholar] [CrossRef]
  29. Nga, N.T.H.; Ngoc, T.T.B.; Trinh, N.T.M.; Thuoc, T.L.; Thao, D.T.P. Optimization and application of MTT assay in determining density of suspension cells. Anal. Biochem. 2020, 610, 113937. [Google Scholar] [CrossRef]
  30. Ekennia, A.; Uduagwu, D.; Olowu, O.; Nwanji, O.; Oje, O.; Daniel, B.; Mgbii, S.; Emma-Uba, C. Biosynthesis of zinc oxide nanoparticles using leaf extracts of Alchornea laxiflora and its tyrosinase inhibition and catalytic studies. Micron 2021, 141, 102964. [Google Scholar] [CrossRef]
  31. Garland, J.L. Analysis and interpretation of community-level physiological profiles in microbial ecology. FEMS Microbiol. Ecol. 1997, 24, 289–300. [Google Scholar] [CrossRef]
  32. Stefanowicz, A. The biolog plates technique as a tool in ecological studies of microbial communities. Polish J. Environ. Stud. 2006, 15, 669–676. [Google Scholar]
  33. Kenarova, A.; Radeva, G.; Traykov, I.; Boteva, S. Community level physiological profiles of bacterial communities inhabiting uranium mining impacted sites. Ecotoxicol. Environ. Saf. 2014, 100, 226–232. [Google Scholar] [CrossRef] [PubMed]
  34. Muńiz, S.; Lacarta, J.; Pata, M.P.; Jiménez, J.J.; Navarro, E. Analysis of the diversity of substrate utilisation of soil bacteria exposed to Cd and earthworm activity using generalised additive models. PLoS ONE 2014, 9, e85057. [Google Scholar] [CrossRef] [PubMed]
  35. Gryta, A.; Frąc, M.; Oszust, K. The Application of the Biolog EcoPlate Approach in Ecotoxicological Evaluation of Dairy Sewage Sludge. Appl. Biochem. Biotechnol. 2014, 174, 1434–1443. [Google Scholar] [CrossRef] [Green Version]
  36. Garau, G.; Castaldi, P.; Santona, L.; Deiana, P.; Melis, P. Influence of red mud, zeolite and lime on heavy metal immobilization, culturable heterotrophic microbial populations and enzyme activities in a contaminated soil. Geoderma 2007, 142, 47–57. [Google Scholar] [CrossRef]
  37. Magdolna Nagy, Z.; Gruiz, K.; Molnár, M.; Fenyvesi, É. Comparative evaluation of microbial and chemical methods for assessing 4-chlorophenol biodegradation in soil. Period. Polytech. Chem. Eng. 2013, 57, 25–35. [Google Scholar] [CrossRef]
  38. Feigl, V.; Ujaczki, É.; Vaszita, E.; Molnár, M. Influence of red mud on soil microbial communities: Application and comprehensive evaluation of the Biolog EcoPlate approach as a tool in soil microbiological studies. Sci. Total Environ. 2017, 595, 903–911. [Google Scholar] [CrossRef] [Green Version]
  39. Frąc, M.; Oszust, K.; Lipiec, J. Community level physiological profiles (CLPP), characterization and microbial activity of soil amended with dairy sewage sludge. Sensors 2012, 12, 3253–3268. [Google Scholar] [CrossRef] [Green Version]
  40. Sala, M.M.; Arrieta, J.M.; Boras, J.A.; Duarte, C.M.; Vaqué, D. The impact of ice melting on bacterioplankton in the Arctic Ocean. Polar Biol. 2010, 33, 1683–1694. [Google Scholar] [CrossRef] [Green Version]
  41. Farkas, É.; Feigl, V.; Gruiz, K.; Vaszita, E.; Fekete-Kertész, I.; Tolner, M.; Kerekes, I.; Pusztai, É.; Kari, A.; Uzinger, N.; et al. Long-term effects of grain husk and paper fibre sludge biochar on acidic and calcareous sandy soils—A scale-up field experiment applying a complex monitoring toolkit. Sci. Total Environ. 2020, 731, 138988. [Google Scholar] [CrossRef] [PubMed]
  42. Jałowiecki, Ł.; Chojniak, J.M.; Dorgeloh, E.; Hegedusova, B.; Ejhed, H.; Magnér, J.; Płaza, G.A. Microbial community profiles in wastewaters from onsite wastewater treatment systems technology. PLoS ONE 2016, 11, e147725. [Google Scholar] [CrossRef]
  43. Garland, J.L.; Mills, A.L. Classification and characterization of heterotrophic microbial communities on the basis of patterns of community-level sole-carbon-source utilization. Appl. Environ. Microbiol. 1991, 57, 2351–2359. [Google Scholar] [CrossRef] [Green Version]
  44. Tam, L.; Derry, A.M.; Kevan, P.G.; Trevors, J.T. Functional diversity and community structure of microorganisms in rhizosphere and non-rhizosphere Canadian arctic soils. Biodivers. Conserv. 2001, 10, 1933–1947. [Google Scholar] [CrossRef]
  45. Moore, J.C. Diversity, Taxonomic versus Functional. In Encyclopedia of Biodiversity, 2nd ed.; Elsevier Academic Press: Amsterdam, The Netherlands, 2013; Volume 2, pp. 648–656. [Google Scholar] [CrossRef]
  46. Manjunath, M.; Kumar, U.; Yadava, R.B.; Rai, A.B.; Singh, B. Influence of organic and inorganic sources of nutrients on the functional diversity of microbial communities in the vegetable cropping system of the Indo-Gangetic plains. Comptes Rendus-Biol. 2018, 341, 349–357. [Google Scholar] [CrossRef] [PubMed]
  47. Preston-Mafham, J.; Boddy, L.; Randerson, P.F. Analysis of microbial community functional diversity using sole-carbon-source utilisation profiles—A critique. FEMS Microbiol. Ecol. 2006, 42, 1–14. [Google Scholar] [CrossRef]
  48. Miao, L.; Wang, P.; Wang, C.; Hou, J.; Yao, Y.; Liu, J.; Lv, B.; Yang, Y.; You, G.; Xu, Y.; et al. Effect of TiO2 and CeO2 nanoparticles on the metabolic activity of surficial sediment microbial communities based on oxygen microelectrodes and high-throughput sequencing. Water Res. 2018, 129, 287–296. [Google Scholar] [CrossRef]
  49. Chavan, S.; Nadanathangam, V. Shifts in metabolic patterns of soil bacterial communities on exposure to metal engineered nanomaterials. Ecotoxicol. Environ. Saf. 2020, 189, 110012. [Google Scholar] [CrossRef] [PubMed]
  50. Jiang, J.; Oberdörster, G.; Biswas, P. Characterization of size, surface charge, and agglomeration state of nanoparticle dispersions for toxicological studies. J. Nanopart. Res. 2009, 11, 77–89. [Google Scholar] [CrossRef]
  51. Jiang, J.; Oberdörster, G.; Elder, A.; Gelein, R.; Mercer, P.; Biswas, P. Does nanoparticle activity depend upon size and crystal phase? Nanotoxicology 2008, 2, 33–42. [Google Scholar] [CrossRef] [Green Version]
  52. Casas-Beltran, D.A.; Hernández-Pedraza, M.; Alvarado-Flores, J. Estimation of the discharge of sunscreens in aquatic environments of the Mexican Caribbean. Environments 2020, 7, 15. [Google Scholar] [CrossRef] [Green Version]
  53. Du, J.; Zhang, Y.; Guo, R.; Meng, F.; Gao, Y.; Ma, C.; Zhang, H. Harmful effect of nanoparticles on the functions of freshwater ecosystems: Insight into nanoZnO-polluted stream. Chemosphere 2019, 214, 830–838. [Google Scholar] [CrossRef] [PubMed]
  54. Du, J.; Zhang, Y.; Yin, Y.; Zhang, J.; Ma, H.; Li, K.; Wan, N. Do environmental concentrations of zinc oxide nanoparticle pose ecotoxicological risk to aquatic fungi associated with leaf litter decomposition? Water Res. 2020, 178, 115840. [Google Scholar] [CrossRef] [PubMed]
  55. Kusi, J.; Scheuerman, P.R.; Maier, K.J. Emerging environmental contaminants (silver nanoparticles) altered the catabolic capability and metabolic fingerprinting of microbial communities. Aquat. Toxicol. 2020, 228, 105633. [Google Scholar] [CrossRef] [PubMed]
  56. Zhen, T.; Fan, W.; Wang, H.; Cao, X.; Xu, X. Monitoring Soil Microorganisms with Community-Level Physiological Profiles Using Biolog EcoPlates™ in Chaohu Lakeside Wetland, East China. Eurasian Soil Sci. 2020, 53, 1142–1153. [Google Scholar] [CrossRef]
  57. Melita, M.; Amalfitano, S.; Preziosi, E.; Ghergo, S.; Frollini, E.; Parrone, D.; Zoppini, A. Physiological profiling and functional diversity of groundwater microbial communities in a municipal solid waste landfill area. Water 2019, 11, 2624. [Google Scholar] [CrossRef] [Green Version]
  58. Sirelkhatim, A.; Mahmud, S.; Seeni, A.; Kaus, N.H.M.; Ann, L.C.; Bakhori, S.K.M.; Hasan, H.; Mohamad, D. Review on zinc oxide nanoparticles: Antibacterial activity and toxicity mechanism. Nano-Micro Lett. 2015, 7, 219–242. [Google Scholar] [CrossRef] [Green Version]
  59. Harch, B.D.; Correll, R.L.; Meech, W.; Kirkby, C.A.; Pankhurst, C.E. Using the Gini coefficient with BIOLOG substrate utilisation data to provide an alternative quantitative measure for comparing bacterial soil communities. J. Microbiol. Methods 1997, 30, 91–101. [Google Scholar] [CrossRef]
  60. Adams, T.C.; Brye, K.R.; Savin, M.C.; Lee, J.A.; Gbur, E.E. Microbial carbon substrate utilization differences among high- and average-yield soybean areas. Agriculture 2017, 7, 48. [Google Scholar] [CrossRef] [Green Version]
  61. DeJong, T.M. A Comparison of Three Diversity Indices Based on Their Components of Richness and Evenness. Oikos 1975, 26, 222–227. [Google Scholar] [CrossRef]
  62. Sutcliffe, B.; Hose, G.C.; Harford, A.J.; Midgley, D.J.; Greenfield, P.; Paulsen, I.T.; Chariton, A.A. Microbial communities are sensitive indicators for freshwater sediment copper contamination. Environ. Pollut. 2019, 247, 1028–1038. [Google Scholar] [CrossRef] [PubMed]
  63. El Fantroussi, S.; Verschuere, L.; Verstraete, W.; Top, E.M. Effect of phenylurea herbicides on soil microbial communities estimated by analysis of 16S rRNA gene fingerprints and community-level physiological profiles. Appl. Environ. Microbiol. 1999, 65, 982–988. [Google Scholar] [CrossRef] [PubMed] [Green Version]
  64. Ros, M.; Goberna, M.; Pascual, J.A.; Klammer, S.; Insam, H. 16S rDNA analysis reveals low microbial diversity in community level physiological profile assays. J. Microbiol. Methods 2008, 72, 221–226. [Google Scholar] [CrossRef]
  65. Lladó, S.; Baldrian, P. Community-level physiological profiling analyses show potential to identify the copiotrophic bacteria present in soil environments. PLoS ONE 2017, 12, e171638. [Google Scholar] [CrossRef] [PubMed]
Figure 1. The effect of ZnO nanoparticles on freshwater average well colour development value. Letters on the columns indicate significant differences (level of significance: p < 0.05).
Nanomaterials 11 01777 g001
Figure 2. The effect of ZnO nanoparticles on freshwater area under the curve value. Letters on the columns indicate significant differences (level of significance: p < 0.05).
Nanomaterials 11 01777 g002
Figure 3. The effect of ZnO nanoparticles on freshwater substrate richness value. Letters on the columns indicate significant differences (level of significance: p < 0.05).
Nanomaterials 11 01777 g003
Figure 4. The effect of ZnO nanoparticles on freshwater Shannon index value. Letters on the columns indicate significant differences (level of significance: p < 0.05).
Nanomaterials 11 01777 g004
Figure 5. The effect of ZnO nanoparticles on freshwater Shannon evenness value. Letters on the columns indicate significant differences (level of significance: p < 0.05).
Nanomaterials 11 01777 g005
Figure 6. The effect of ZnO nanoparticles on freshwater Simpson index value. Letters on the columns indicate significant differences (level of significance: p < 0.05).
Nanomaterials 11 01777 g006
Figure 7. The effect of ZnO nanoparticles on freshwater McIntosh index value. Letters on the columns indicate significant differences (level of significance: p < 0.05).
Nanomaterials 11 01777 g007
Figure 8. The effect of ZnO nanoparticles on freshwater Gini index value. Letters on the columns indicate significant differences (level of significance: p < 0.05).
Nanomaterials 11 01777 g008
Figure 9. The effect of ZnO nanoparticles on freshwater substrate average well colour development value.
Nanomaterials 11 01777 g009
Figure 10. The effect of TiO2 nanoparticles on the freshwater average well colour development value. Letters on the columns indicate significant differences (level of significance: p < 0.05).
Nanomaterials 11 01777 g010
Figure 11. The effect of TiO2 nanoparticles on freshwater substrate richness value. Letters on the columns indicate significant differences (level of significance: p < 0.05).
Nanomaterials 11 01777 g011
Figure 12. The effect of TiO2 nanoparticles on freshwater Shannon index value. Letters on the columns indicate significant differences (level of significance: p < 0.05).
Nanomaterials 11 01777 g012
Figure 13. The effect of TiO2 nanoparticles on freshwater McIntosh index value. Letters on the columns indicate significant differences (level of significance: p < 0.05).
Nanomaterials 11 01777 g013
Figure 14. The effect of TiO2 nanoparticles on freshwater substrate average well colour development value.
Nanomaterials 11 01777 g014
Table 1. Characteristics of freshwater samples from Lake Balaton.
Samples from Lake BalatonpH (1)EC (2)NO3 (NO2)-N (3)K+ (4)Na+ (4)Ca2+ (4)Mg2+ (4)Cl- (5)CO32- (6)HCO3- (6)SO42- (7)
-µS/cmmg/Lmg/Lmg/Lmg/Lmg/Lmg/Lmg/Lmg/Lmg/L
Sample collected in July8.3
±0.2
707
±16
0.22
±0.10
6.7
±0.2
36.4
±0.4
33.9
±
58.8
±0.1
38.4
±2.6
27.9
±13.2
233.4
±26.8
134.2
±0.2
Sample collected in October8.8
±0.0
664
±20
0.14
±0.00
7.2
±0.6
37.4
±1.3
27.6
±2.7
60.3
±2.1
40.3
±0.0
46.5
±4.4
211.3
±40.1
141.5
±4.6
(1) Determined by HS 21470-2:981; (2) Determined by HS EN 27888:1988; (3) Determined by ISO 7890-3:1988; (4) Determined by ICP-OES, HS EN 11885:2005; (5) Determined by EPA 9253:1994; (6) Determined by HS EN ISO 9963-1:1998; (7) Determined by HS 448-13:1983.
Table 2. RMANOVA results over time to evaluate effects of nZnO treatment on the freshwater microbial diversity. Bold numbers indicate significant differences at p < 0.05.
Source of Variationd.f.Mean SquareF Ratiop-ValueSource of Variationd.f.Mean SquareF Ratiop-Value
AWCD SR
Treatment40.553317.680.000Treatment4536.02989.570.000
Time20.017.950.041Time29.9523.880.000
Time × Treatment80.001.960.269Time × Treatment83.147.520.000
AUC H
Treatment43.163299.600.001Treatment41.221487.40.000
Time20.15117.610.000Time20.1825.20.000
Time × Treatment80.0319.460.006Time × Treatment80.1013.50.000
Source of variationd.f.Mean squareF ratiop-valueSource of variationd.f.Mean squareF ratiop-value
E U
Treatment33.38223.070.000Treatment431.381230.250.000
Time20.040.690.526Time20.700.700.000
Time × Treatment60.050.780.606Time × Treatment80.230.230.000
D G
Treatment40.0250.870.000Treatment44.29287.480.000
Time20.0130.710.000Time20.041.240.339
Time × Treatment80.0011.490.000Time × Treatment80.247.310.005
AWCD—the average well colour development, AUC—the area under the curve, SR—the substrate richness, H—Shannon diversity index, E—Shannon evenness index, D—Simpson index, U—McIntosh index, G—Gini coefficient.
Table 3. RMANOVA results over time to evaluate effects of nTiO2 treatment on the freshwater microbial diversity. Bold numbers indicate significant differences at p < 0.05.
Source of Variationd.f.Mean SquareF Ratiop-ValueSource of Variationd.f.Mean SquareF Ratiop-Value
AWCD SR
Treatment40.017.010.028Treatment45.674.1660.059
Time20.0452.870.000Time221.3026.4380.000
Time × Treatment80.004.490.015Time × Treatment85.146.3810.002
AUC H
Treatment40.2535.380.000Treatment40.016.40.034
Time20.2453.200.000Time20.0540.90.000
Time × Treatment80.049.600.000Time × Treatment80.002.10.132
Source of variationd.f.Mean squareF ratiop-valueSource of variationd.f.Mean squareF ratiop-value
E U
Treatment40.005.40.046Treatment40.346.800.030
Time20.002.70.114Time21.26107.300.000
Time × Treatment80.004.30.018Time × Treatment80.108.750.001
D G
Treatment40.0020.239Treatment40.017.4260.025
Time20.00460.000Time20.03122.2660.000
Time × Treatment80.0020.103Time × Treatment80.004.8870.011
AWCD—the average well colour development, AUC—the area under the curve, SR—the substrate richness, H—Shannon diversity index, E—Shannon evenness index, D—Simpson index, U—McIntosh index, G—Gini coefficient.
Publisher’s Note: MDPI stays neutral with regard to jurisdictional claims in published maps and institutional affiliations.

