
Deposition of Nanosized Amino Acid Functionalized Bismuth Oxido Clusters on Gold Surfaces

 , , , ,
Abstract
:
1. Introduction
2. Materials and Methods
2.1. Materials
2.2. Synthesis of the Sodium Salt of Boc-Phe-OH (1)
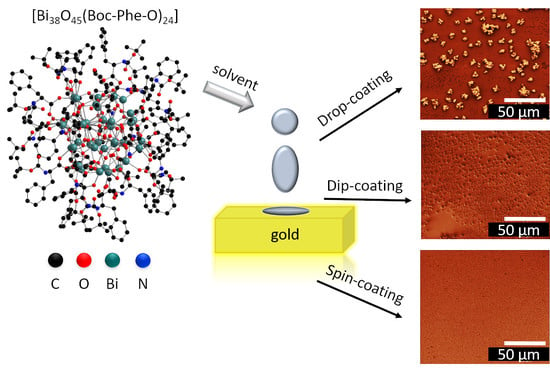
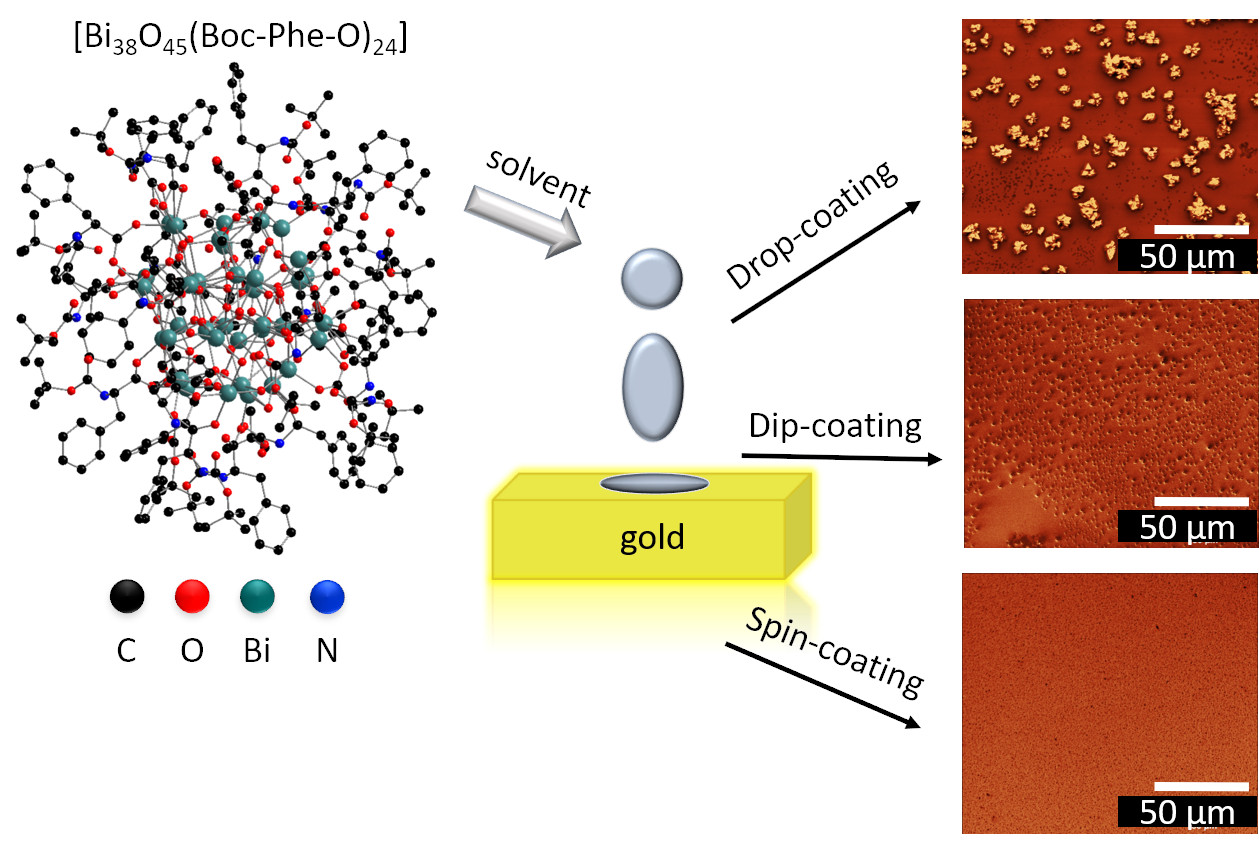
2.3. Synthesis of [Bi38O45(Boc-Phe-O)24(dmso)9] (2)
2.4. Film Preparation
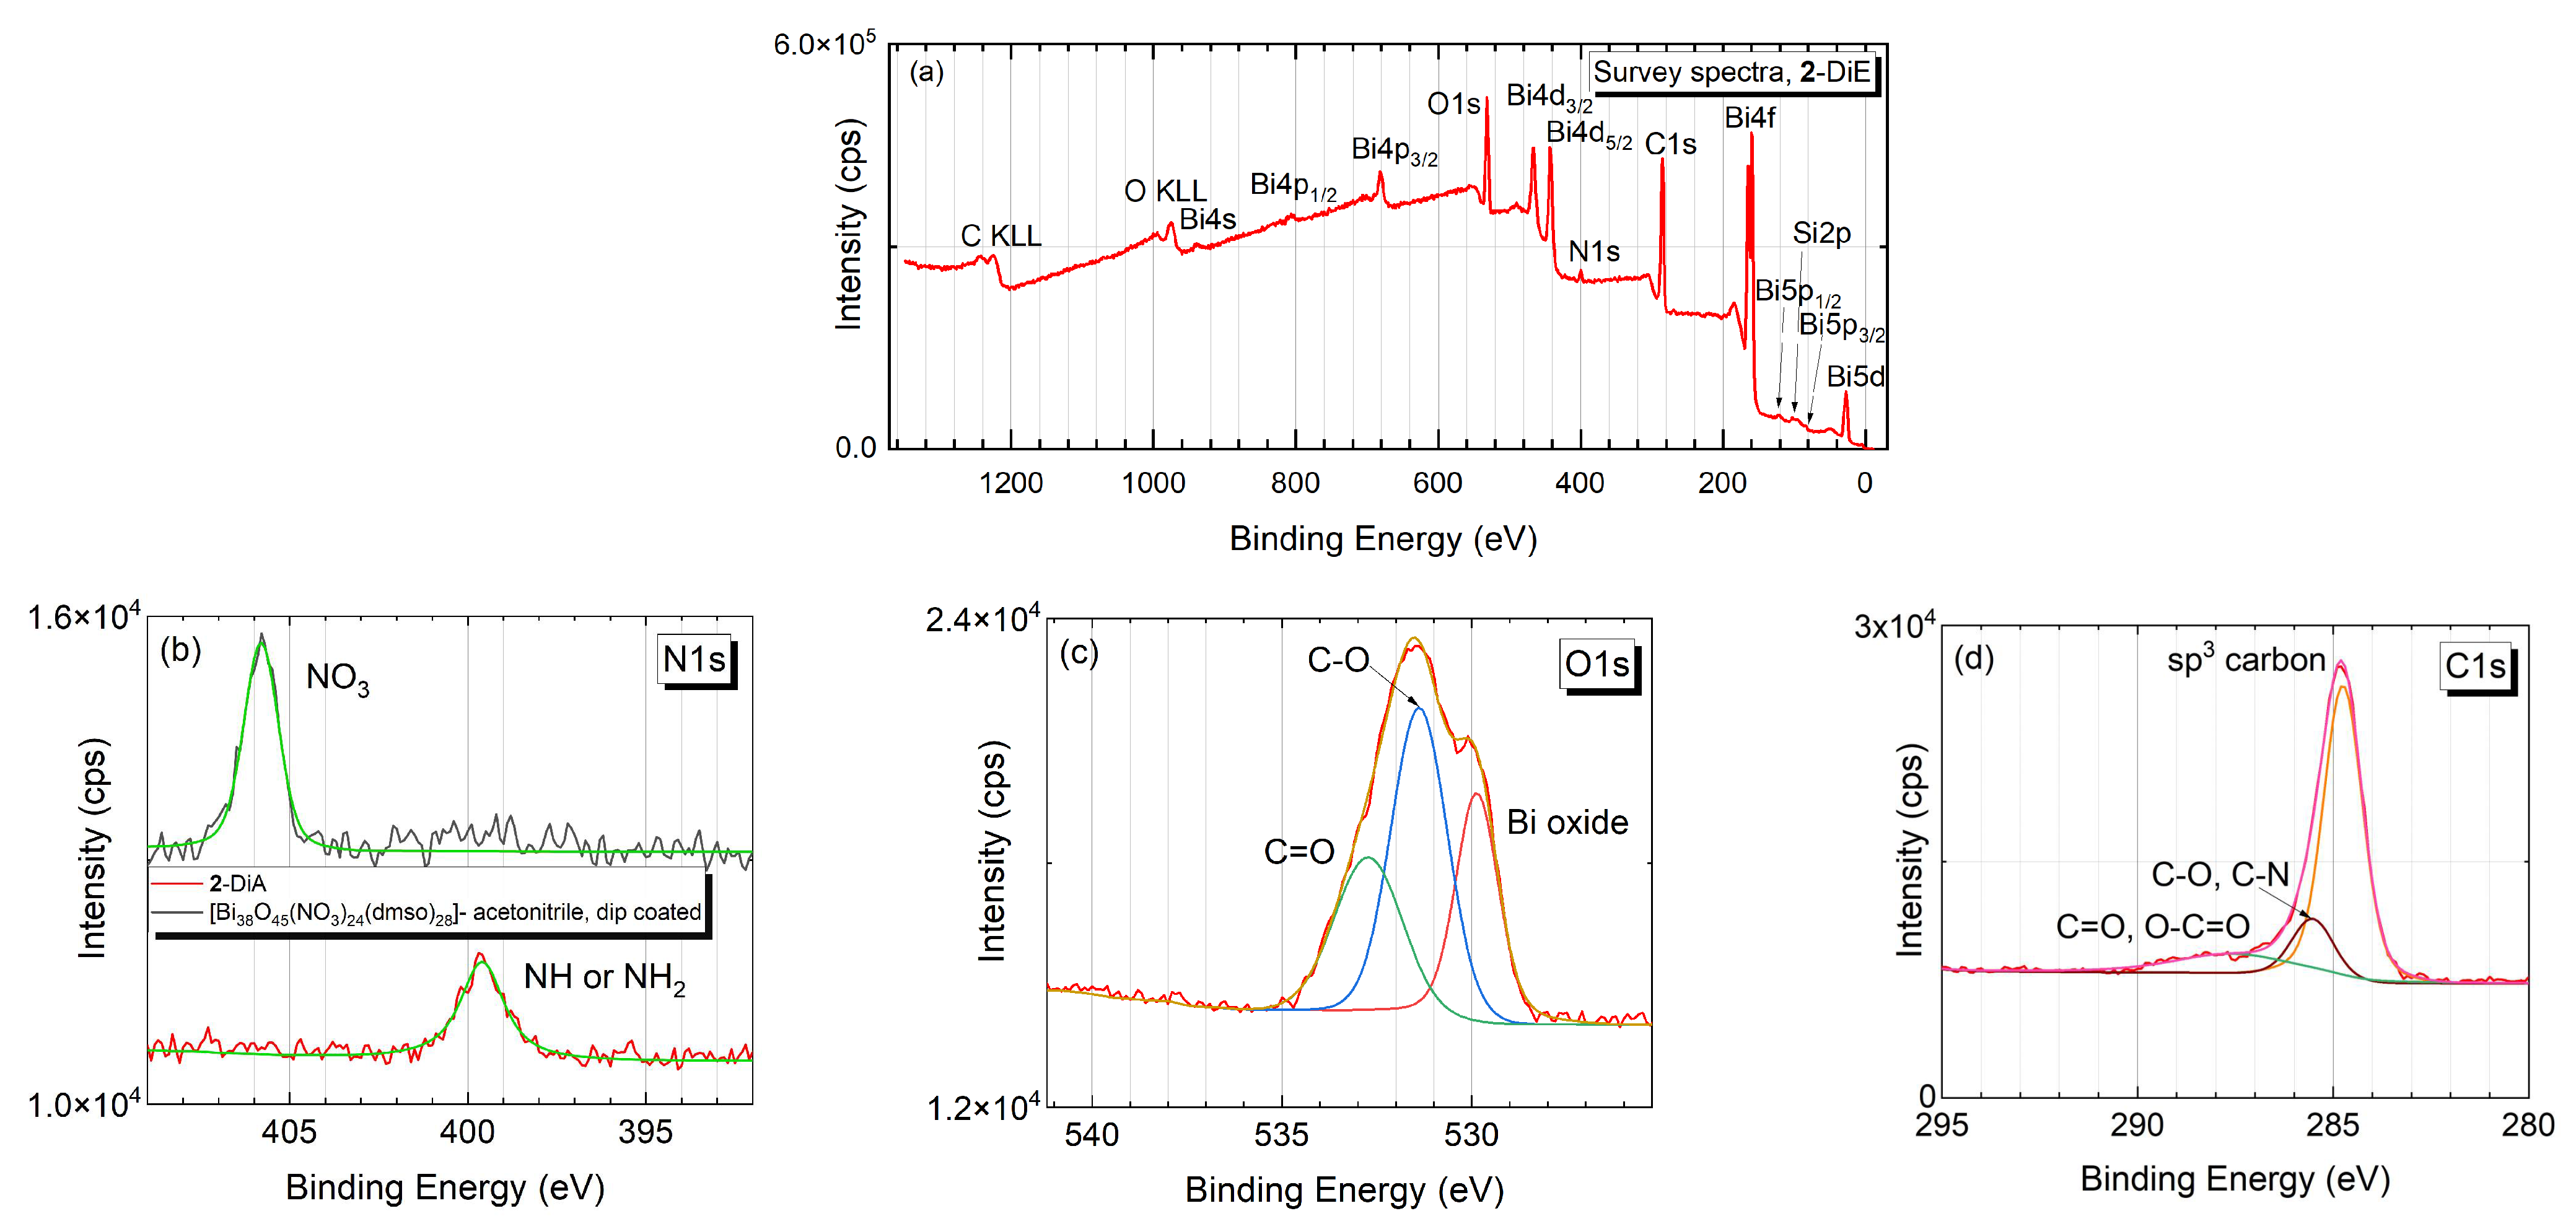
2.5. Characterization Methods
3. Results and Discussion
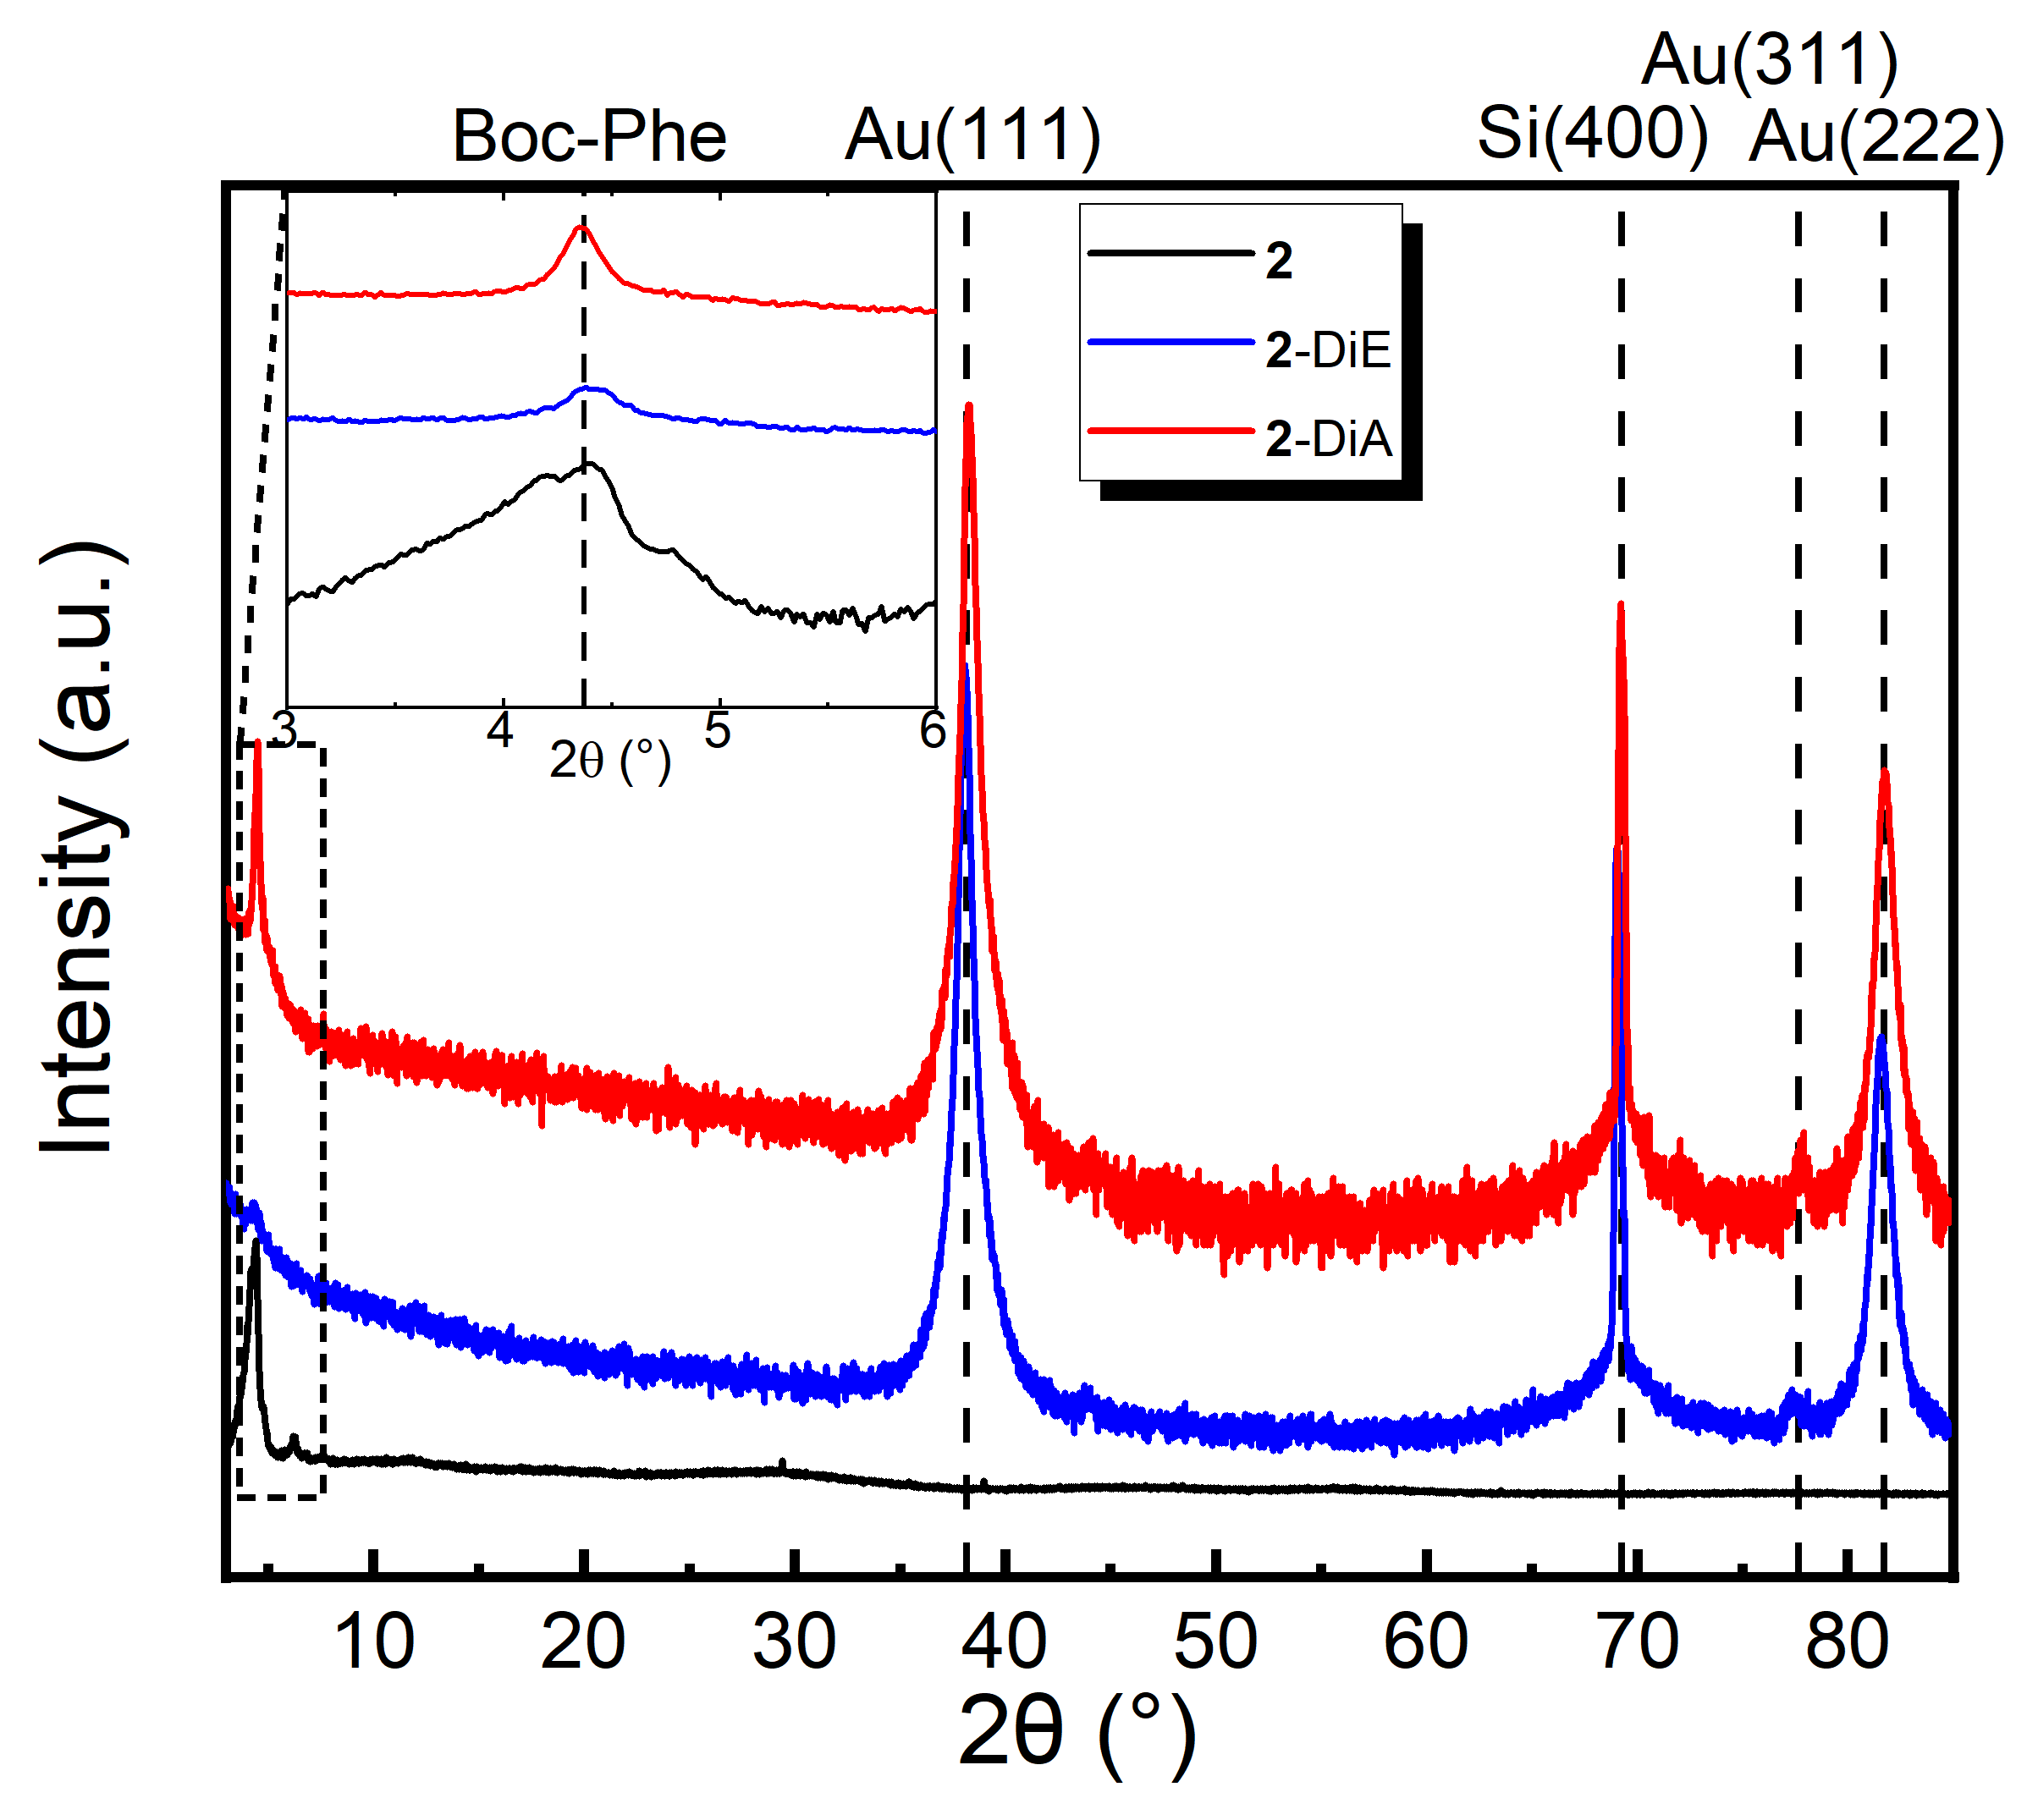
3.1. Cluster Synthesis and Characterisation
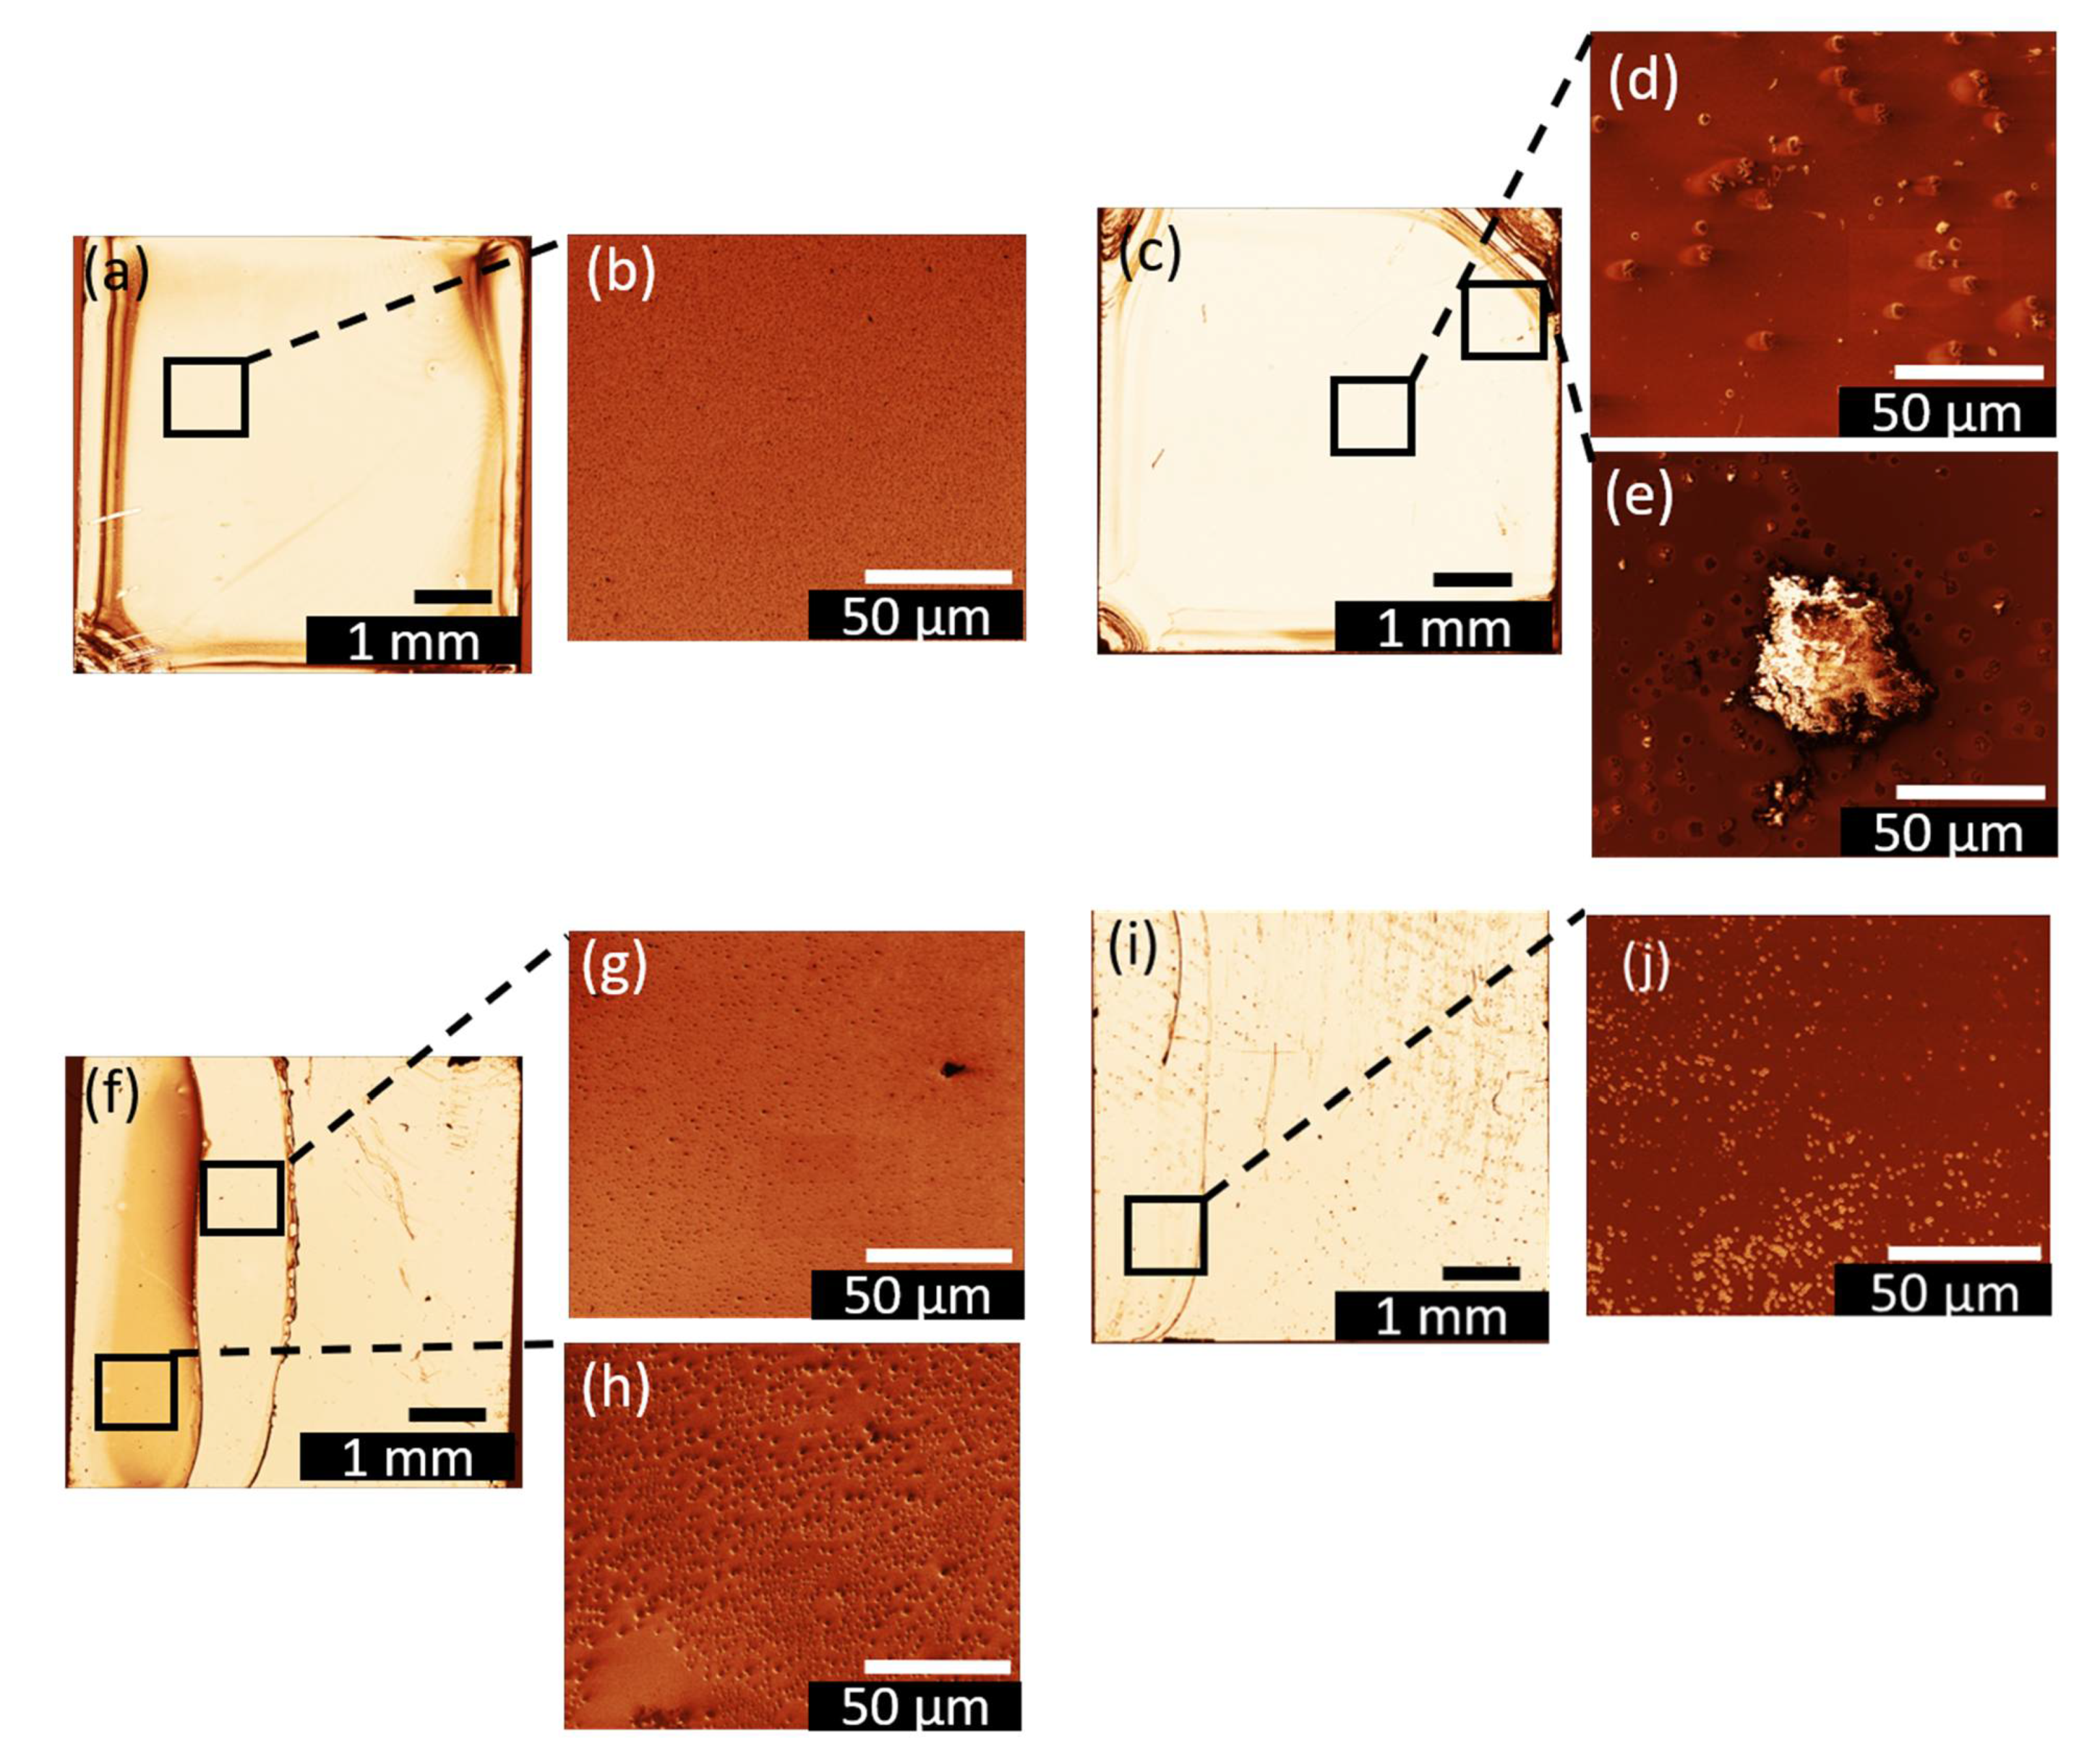
3.2. Drop-coated Films
3.3. Spin-coated and Dip-coated Films
4. Conclusions
Supplementary Materials
Author Contributions
Funding
Data Availability Statement
Acknowledgments
Conflicts of Interest
References
- Qin, K.; Zhao, Q.; Yu, H.; Xia, X.; Li, J.; He, S.; Wei, L.; An, T. A review of bismuth-based photocatalysts for antibiotic degradation: Insight into the photocatalytic degradation performance, pathways and relevant mechanisms. Environ. Res. 2021, 199, 111360. [Google Scholar] [CrossRef] [PubMed]
- Eremeev, S.V.; Koroteev, Y.M.; Chulkov, E.V. Surface electronic structure of bismuth oxychalcogenides. Phys. Rev. B 2019, 100, 115417. [Google Scholar] [CrossRef] [Green Version]
- Ferhat, M.; Zaoui, A. Structural and electronic properties of III-V bismuth compounds. Phys. Rev. B 2006, 73, 115107. [Google Scholar] [CrossRef]
- Bartoli, M.; Jagdale, P.; Tagliaferro, A. A Short Review on Biomedical Applications of Nanostructured Bismuth Oxide and Related Nanomaterials. Materials 2020, 13, 5234. [Google Scholar] [CrossRef]
- Lichtenberg, C. Molecular bismuth(III) monocations: Structure, bonding, reactivity, and catalysis. Chem. Comm. 2021, 57, 4483–4495. [Google Scholar] [CrossRef]
- Magre, M.; Kuziola, J.; Nöthling, N.; Cornella, J. Dibismuthanes in catalysis: From synthesis and characterization to redox behavior towards oxidative cleavage of 1,2-diols. Org. Biomol. Chem. 2021, 19, 4922–4929. [Google Scholar] [CrossRef]
- Levent, E.; Sala, O.; Wilm, L.F.B.; Löwe, P.; Dielmann, F. Heterobimetallic complexes composed of bismuth and lithium carboxylates as polyurethane catalysts—Alternatives to organotin compounds. Green Chem. 2021, 23, 2747–2755. [Google Scholar] [CrossRef]
- Potenti, S.; Gualandi, A.; Puggioli, A.; Fermi, A.; Bergamini, G.; Cozzi, P.G. Photoredox Allylation Reactions Mediated by Bismuth in Aqueous Conditions. EurJOC 2021, 2021, 1624–1627. [Google Scholar] [CrossRef]
- Moon, H.W.; Cornella, J. Bismuth Redox Catalysis: An Emerging Main-Group Platform for Organic Synthesis. ACS Catal. 2022, 12, 1382–1393. [Google Scholar] [CrossRef]
- Ochiai, B.; Kikuta, K.; Matsumura, Y.; Horikoshi, H.; Furukawa, K.; Miyamoto, M.; Nishimura, Y. Transparent and Photochromic Material Prepared by Copolymerization of Bismuth(III) Methacrylate. ACS Appl. Poly. Mater. 2021, 3, 4419–4423. [Google Scholar] [CrossRef]
- Arnold, J.; Sarkar, K.; Smith, D. 3D printed bismuth oxide-polylactic acid composites for radio-mimetic computed tomography spine phantoms. J. Biomed. Mater. Res. B Appl. Biomater. 2021, 109, 789–796. [Google Scholar] [CrossRef] [PubMed]
- Negussie, A.H.; de Ruiter, Q.M.B.; Britton, H.; Donahue, D.R.; Boffi, Q.; Kim, Y.-S.; Pritchard, W.F.; Moonen, C.; Storm, G.; Lewis, A.L.; et al. Synthesis, characterization, and imaging of radiopaque bismuth beads for image-guided transarterial embolization. Sci. Rep. 2021, 11, 533. [Google Scholar] [CrossRef] [PubMed]
- Miersch, L.; Schlesinger, M.; Troff, R.W.; Schalley, C.A.; Rüffer, T.; Lang, H.; Zahn, D.; Mehring, M. Hydrolysis of a Basic Bismuth Nitrate-Formation and Stability of Novel Bismuth Oxido Clusters. Chem. Eur. J. 2011, 17, 6985–6990. [Google Scholar] [CrossRef]
- Miersch, L.; Ruffer, T.; Schlesinger, M.; Lang, H.; Mehring, M. Hydrolysis studies on bismuth nitrate: Synthesis and crystallization of four novel polynuclear basic bismuth nitrates. Inorg. Chem. 2012, 51, 9376–9384. [Google Scholar] [CrossRef] [PubMed]
- Udalova, T.A.; Logutenko, O.A.; Timakova, E.V.; Afonina, L.I.; Naydenko, E.S.; Yukhin, Y.M. Bismuth compounds in medicine. In Proceedings of the Third International Forum on Strategic Technologies, Novosibirsk, Russia, 23–29 June 2008; pp. 137–140. [Google Scholar]
- Anker, A.S.; Christiansen, T.L.; Weber, M.; Schmiele, M.; Brok, E.; Kjær, E.T.S.; Juhás, P.; Thomas, R.; Mehring, M.; Jensen, K.M.Ø. Structural Changes during the Growth of Atomically Precise Metal Oxido Nanoclusters from Combined Pair Distribution Function and Small-Angle X-ray Scattering Analysis. Angew. Chem. Int. Ed. 2021, 60, 20407–20416. [Google Scholar] [CrossRef]
- Sattler, D.; Schlesinger, M.; Mehring, M.; Schalley, C.A. Mass Spectrometry and Gas-Phase Chemistry of Bismuth–Oxido Clusters. ChemPlusChem 2013, 78, 1005–1014. [Google Scholar] [CrossRef]
- Weber, M.; Schlesinger, M.; Walther, M.; Zahn, D.; Schalley, C.A.; Mehring, M. Investigations on the growth of bismuth oxido clusters and the nucleation to give metastable bismuth oxide modifications. Z. Kristallogr.—Cryst. Mater. 2017, 232, 185–207. [Google Scholar] [CrossRef]
- Szczerba, D.; Tan, D.; Do, J.-L.; Titi, H.M.; Mouhtadi, S.; Chaumont, D.; del Carmen Marco de Lucas, M.; Geoffroy, N.; Meyer, M.; Rousselin, Y.; et al. Real-Time Observation of “Soft” Magic-Size Clusters during Hydrolysis of the Model Metallodrug Bismuth Disalicylate. JACS 2021, 143, 16332–16336. [Google Scholar] [CrossRef]
- Wrobel, L.; Rüffer, T.; Korb, M.; Krautscheid, H.; Meyer, J.; Andrews, P.C.; Lang, H.; Mehring, M. Homo- and Heteroleptic Coordination Polymers and Oxido Clusters of Bismuth(III) Vinylsulfonates. Chem. Eur. J. 2018, 24, 16630–16644. [Google Scholar] [CrossRef]
- Miersch, L.; Rüffer, T.; Mehring, M. Organic–inorganic hybrid materials starting from the novel nanoscaled bismuth oxido methacrylate cluster [Bi38O45(OMc)24(DMSO)9]·2DMSO·7H2O. Chem. Comm. 2011, 47, 6353–6355. [Google Scholar] [CrossRef]
- André, V.; Hardeman, A.; Halasz, I.; Stein, R.S.; Jackson, G.J.; Reid, D.G.; Duer, M.J.; Curfs, C.; Duarte, M.T.; Friščić, T. Mechanosynthesis of the metallodrug bismuth subsalicylate from Bi2O3 and structure of bismuth salicylate without auxiliary organic ligands. Angew. Chem. 2011, 123, 8004–8007. [Google Scholar] [CrossRef]
- Andrews, P.C.; Deacon, G.B.; Forsyth, C.M.; Junk, P.C.; Kumar, I.; Maguire, M. Towards a structural understanding of the anti-ulcer and anti-gastritis drug bismuth subsalicylate. Angew. Chem. 2006, 118, 5766–5770. [Google Scholar] [CrossRef]
- Ding, Q.-R.; Yu, Y.; Cao, C.; Zhang, J.; Zhang, L. Stepwise assembly and reversible structural transformation of ligated titanium coated bismuth-oxo cores: Shell morphology engineering for enhanced chemical fixation of CO2. Chem. Sci. 2022, 13, 3395–3401. [Google Scholar] [CrossRef] [PubMed]
- Mehring, M. From Molecules to Bismuth Oxide-Based Materials: Potential Homo- and Heterometallic Precursors and Model Compounds. Coord. Chem. Rev. 2007, 251, 974. [Google Scholar] [CrossRef]
- Mansfeld, D.; Miersch, L.; Rüffer, T.; Schaarschmidt, D.; Lang, H.; Böhle, T.; Troff, R.W.; Schalley, C.A.; Müller, J.; Mehring, M. From {Bi22O26} to Chiral Ligand-Protected {Bi38O45}-Based Bismuth Oxido Clusters. Chem. Eur. J. 2011, 17, 14805–14810. [Google Scholar] [CrossRef]
- Schlesinger, M.; Weber, M.; Rüffer, T.; Lang, H.; Mehring, M. Nanoscaled Bismuth Oxido Clusters: Probing Factors of Structure Formation and Photocatalytic Activity. EurJIC 2014, 2014, 302–309. [Google Scholar] [CrossRef]
- Wang, S.-M.; Hwang, J.; Kim, E. Polyoxometalates as promising materials for electrochromic devices. J. Mat. Chem. C 2019, 7, 7828–7850. [Google Scholar] [CrossRef]
- Cherevan, A.S.; Nandan, S.P.; Roger, I.; Liu, R.; Streb, C.; Eder, D. Polyoxometalates on Functional Substrates: Concepts, Synergies, and Future Perspectives. Adv. Sci. 2020, 7, 1903511. [Google Scholar] [CrossRef] [Green Version]
- Ji, Y.; Huang, L.; Hu, J.; Streb, C.; Song, Y.-F. Polyoxometalate-functionalized nanocarbon materials for energy conversion, energy storage and sensor systems. Energy Environ. Sci. 2015, 8, 776–789. [Google Scholar] [CrossRef] [Green Version]
- Busche, C.; Vilà-Nadal, L.; Yan, J.; Miras, H.N.; Long, D.-L.; Georgiev, V.P.; Asenov, A.; Pedersen, R.H.; Gadegaard, N.; Mirza, M.M.; et al. Design and fabrication of memory devices based on nanoscale polyoxometalate clusters. Nature 2014, 515, 545–549. [Google Scholar] [CrossRef]
- Dianat, S.; Hatefi-Mehrjardi, A.; Mahmoodzadeh, K. Electrochemical behavior of inorganic–organic hybrid polyoxometalate ((Cys)3[PW12O40]) nanostructure self-assembled monolayer on polycrystalline gold electrode surfaces. New J. Chem. 2019, 43, 1388–1397. [Google Scholar] [CrossRef]
- Wu, K.; Shao, L.; Jiang, X.; Shui, M.; Ma, R.; Lao, M.; Lin, X.; Wang, D.; Long, N.; Ren, Y.; et al. Facile preparation of [Bi6O4](OH)4(NO3)6·4H2O, [Bi6O4](OH)4(NO3)6·H2O and [Bi6O4](OH)4(NO3)6·H2O/C as novel high capacity anode materials for rechargeable lithium-ion batteries. J. Power Source 2014, 254, 88–97. [Google Scholar] [CrossRef]
- Stehlin, F.; Wieder, F.; Spangenberg, A.; Le Meins, J.-M.; Soppera, O. Room-temperature preparation of metal-oxide nanostructures by DUV lithography from metal-oxo clusters. J. Mat. Chem. C 2014, 2, 277–285. [Google Scholar] [CrossRef]
- Cardineau, B.; Del Re, R.; Marnell, M.; Al-Mashat, H.; Vockenhuber, M.; Ekinci, Y.; Sarma, C.; Freedman, D.A.; Brainard, R.L. Photolithographic properties of tin-oxo clusters using extreme ultraviolet light (13.5nm). Microelectron. Eng. 2014, 127, 44–50. [Google Scholar] [CrossRef]
- Marsh, D.A.; Goberna-Ferrón, S.; Baumeister, M.K.; Zakharov, L.N.; Nyman, M.; Johnson, D.W. Ln polyoxocations: Yttrium oxide solution speciation & solution deposited thin films. Dalton Trans. 2017, 46, 947–955. [Google Scholar]
- Gross, S. Oxocluster-reinforced organic–inorganic hybrid materials: Effect of transition metal oxoclusters on structural and functional properties. J. Mat. Chem. 2011, 21, 15853–15861. [Google Scholar] [CrossRef]
- Hofmann, M.; Rößner, L.; Armbrüster, M.; Mehring, M. Thin Coatings of α- and β-Bi2O3 by Ultrasonic Spray Coating of a Molecular Bismuth Oxido Cluster and their Application for Photocatalytic Water Purification Under Visible Light. ChemistryOpen 2020, 9, 277–284. [Google Scholar] [CrossRef]
- Zhou, K.; Ding, G.; Zhang, C.; Lv, Z.; Luo, S.; Zhou, Y.; Zhou, L.; Chen, X.; Li, H.; Han, S.-T. A solution processed metal–oxo cluster for rewritable resistive memory devices. J. Mater. Chem. C 2019, 7, 843–852. [Google Scholar] [CrossRef]
- Ford, M.J.; Masens, C.; Cortie, M.B. The application of gold surface and particles in nanotechnology. Surf. Rev. Lett. 2006, 13, 297–307. [Google Scholar] [CrossRef] [Green Version]
- Fendler, J.H. Chemical Self-assembly for Electronic Applications. Chem. Mat. 2001, 13, 3196–3210. [Google Scholar] [CrossRef]
- Newton, L.; Slater, T.; Clark, N.; Vijayaraghavan, A. Self assembled monolayers (SAMs) on metallic surfaces (gold and graphene) for electronic applications. J. Mat. Chem. C 2013, 1, 376–393. [Google Scholar] [CrossRef]
- Collins, T.J. ImageJ for microscopy. BioTechniques 2007, 43, S25–S30. [Google Scholar] [CrossRef]
- Nečas, D.; Klapetek, P. Gwyddion: An open-source software for SPM data analysis. Cent. Eur. J. Phys. 2012, 10, 181–188. [Google Scholar] [CrossRef]
- Nakamoto, K. Infrared and Raman Spectra of Inorganic and Coordination Compounds. In Handbook of Vibrational Spectroscopy; John Wiley & Sons: Hoboken, NJ, USA, 2006. [Google Scholar]
- Weber, M.; Rüffer, T.; Speck, F.; Göhler, F.; Weimann, D.P.; Schalley, C.A.; Seyller, T.; Lang, H.; Mehring, M. From a Cerium-Doped Polynuclear Bismuth Oxido Cluster to β-Bi2O3:Ce. Inorg. Chem. 2020, 59, 3353–3366. [Google Scholar] [CrossRef] [PubMed]
- Cotton, F.A.; Francis, R.; Horrocks, W.D. Sulfoxides as liganfds. II. The infrared spectra of some dimethyl sulfoxide complexes. J. Phys. Chem. 1960, 64, 1534–1536. [Google Scholar] [CrossRef]
- Socrates, G. Infrared and Raman Characteristic Group Frequencies: Tables and Charts; John Wiley & Sons: Hoboken, NJ, USA, 2004. [Google Scholar]
- Coates, J. Interpretation of Infrared Spectra, A Practical Approach. In Encyclopedia of Analytical Chemistry; John Wiley & Sons: Hoboken, NJ, USA, 2006. [Google Scholar]
- Wrobel, L.; Rüffer, T.; Korb, M.; Lang, H.; Mehring, M. Bismuth(III) Anthranilates—Synthesis and Characterization of a Coordination Polymer and a Polynuclear Oxido Cluster. EurJIC 2017, 2017, 1032–1040. [Google Scholar] [CrossRef]
- Nohira, H.; Tsai, W.; Besling, W.; Young, E.; Petry, J.; Conard, T.; Vandervorst, W.; De Gendt, S.; Heyns, M.; Maes, J.; et al. Characterization of ALCVD-Al2O3 and ZrO2 layer using X-ray photoelectron spectroscopy. J. Non. Cryst. Solids. 2002, 303, 83–87. [Google Scholar] [CrossRef]
- NIST. NIST X-ray Photoelectron Spectroscopy Database; Volume NIST Standard Reference Database Number 20; National Institute of Standards and Technology: Gaithersburg, MD, USA, 2000; p. 20899. [Google Scholar]
- Rignanese, G.M.; Pasquarello, A.; Charlier, J.C.; Gonze, X.; Car, R. Nitrogen Incorporation at Si(100) -SiO2 Interfaces: Relation between N1s Core-Level Shifts and Microscopic Structure. Phys. Rev. Lett. 1997, 79, 5174–5177. [Google Scholar] [CrossRef] [Green Version]
- Shchukarev, A.V.; Korolkov, D.V. XPS Study of group IA carbonates. Cent. Eur. J. Chem. 2004, 2, 347–362. [Google Scholar] [CrossRef] [Green Version]
- Uchida, K.; Ayame, A. Dynamic XPS measurements on bismuth molybdate surfaces. Surf. Sci. 1996, 357–358, 170–175. [Google Scholar] [CrossRef]
- Weber, M.; Thiele, G.; Dornsiepen, E.; Weimann, D.P.; Schalley, C.A.; Dehnen, S.; Mehring, M. Impact of the Exchange of the Coordinating Solvent Shell in [Bi38O45(OMc)24(dmso)9] by Alcohols: Crystal Structure, Gas Phase Stability, and Thermoanalysis. ZAAC 2018, 644, 1796–1804. [Google Scholar] [CrossRef]
- Bhardwaj, R.; Fang, X.; Somasundaran, P.; Attinger, D. Self-assembly of colloidal particles from evaporating droplets: Role of DLVO interactions and proposition of a phase diagram. Langmuir 2010, 26, 7833–7842. [Google Scholar] [CrossRef] [PubMed] [Green Version]
- Wypych, G. Handbook of Solvents; ChemTec Publishing: Toronto, ON, Canada, 2001. [Google Scholar]
- Tolan, M.; Seeck, O.; Schlomka, J.-P.; Press, W.; Wang, J.; Sinha, S.; Li, Z.; Rafailovich, M.; Sokolov, J. Evidence for capillary waves on dewetted polymer film surfaces: A combined X-ray and atomic force microscopy study. Phys. Rev. Lett. 1998, 81, 2731. [Google Scholar] [CrossRef] [Green Version]
- Mulka, R.; Kujawska, A.; Zajączkowski, B.; Mancin, S.; Buschmann, M.H. Drying silica-nanofluid droplets. Colloids Surf. A Physicochem. Eng. Asp. 2021, 623, 126730. [Google Scholar] [CrossRef]
- Witten, T.A.; Sander, L.M. Diffusion-limited aggregation. Phys. Rev. B 1983, 27, 5686–5697. [Google Scholar] [CrossRef] [Green Version]
- Kotomin, E.A.; Kuzovkov, V.N.; Popov, A.I.; Vila, R. Kinetics of F center annealing and colloid formation in Al2O3. Nucl. Instrum. Methods Phys. Res. B Beam Interact. Mater. At. 2016, 374, 107–110. [Google Scholar] [CrossRef]
- Weber, M. Synthese und Charakterisierung von Bismut(III)-Basierten Halbleitern Ausgehend von Homo- und Heterometallischen Bismutoxidoclustern. Ph.D. Thesis, Technische Universität Chemnitz, Chemnitz, Germany, 2021. [Google Scholar]


| Sample Name | Deposition Method | Solvent | Rotation Speed (rpm) | Dip/Withdrawing Speed (mm·s−1) | Amount of Solution (µL) |
|---|---|---|---|---|---|
| 2-SpA | spin coating | acetonitrile | 2000 | - | 20 |
| 2-SpE | spin coating | ethanol | 2000 | - | 20 |
| 2-DiA | dip coating | acetonitrile | - | 5/2 | - |
| 2-DiE | dip coating | ethanol | - | 5/2 | - |
| 2-DrA | drop coating | acetonitrile | - | - | 20 |
| 2-DrE | drop coating | ethanol | - | - | 20 |
| 2-DrA-2 | drop coating | acetonitrile | - | - | 50 |
| 2-DrE-2 | drop coating | ethanol | - | - | 50 |
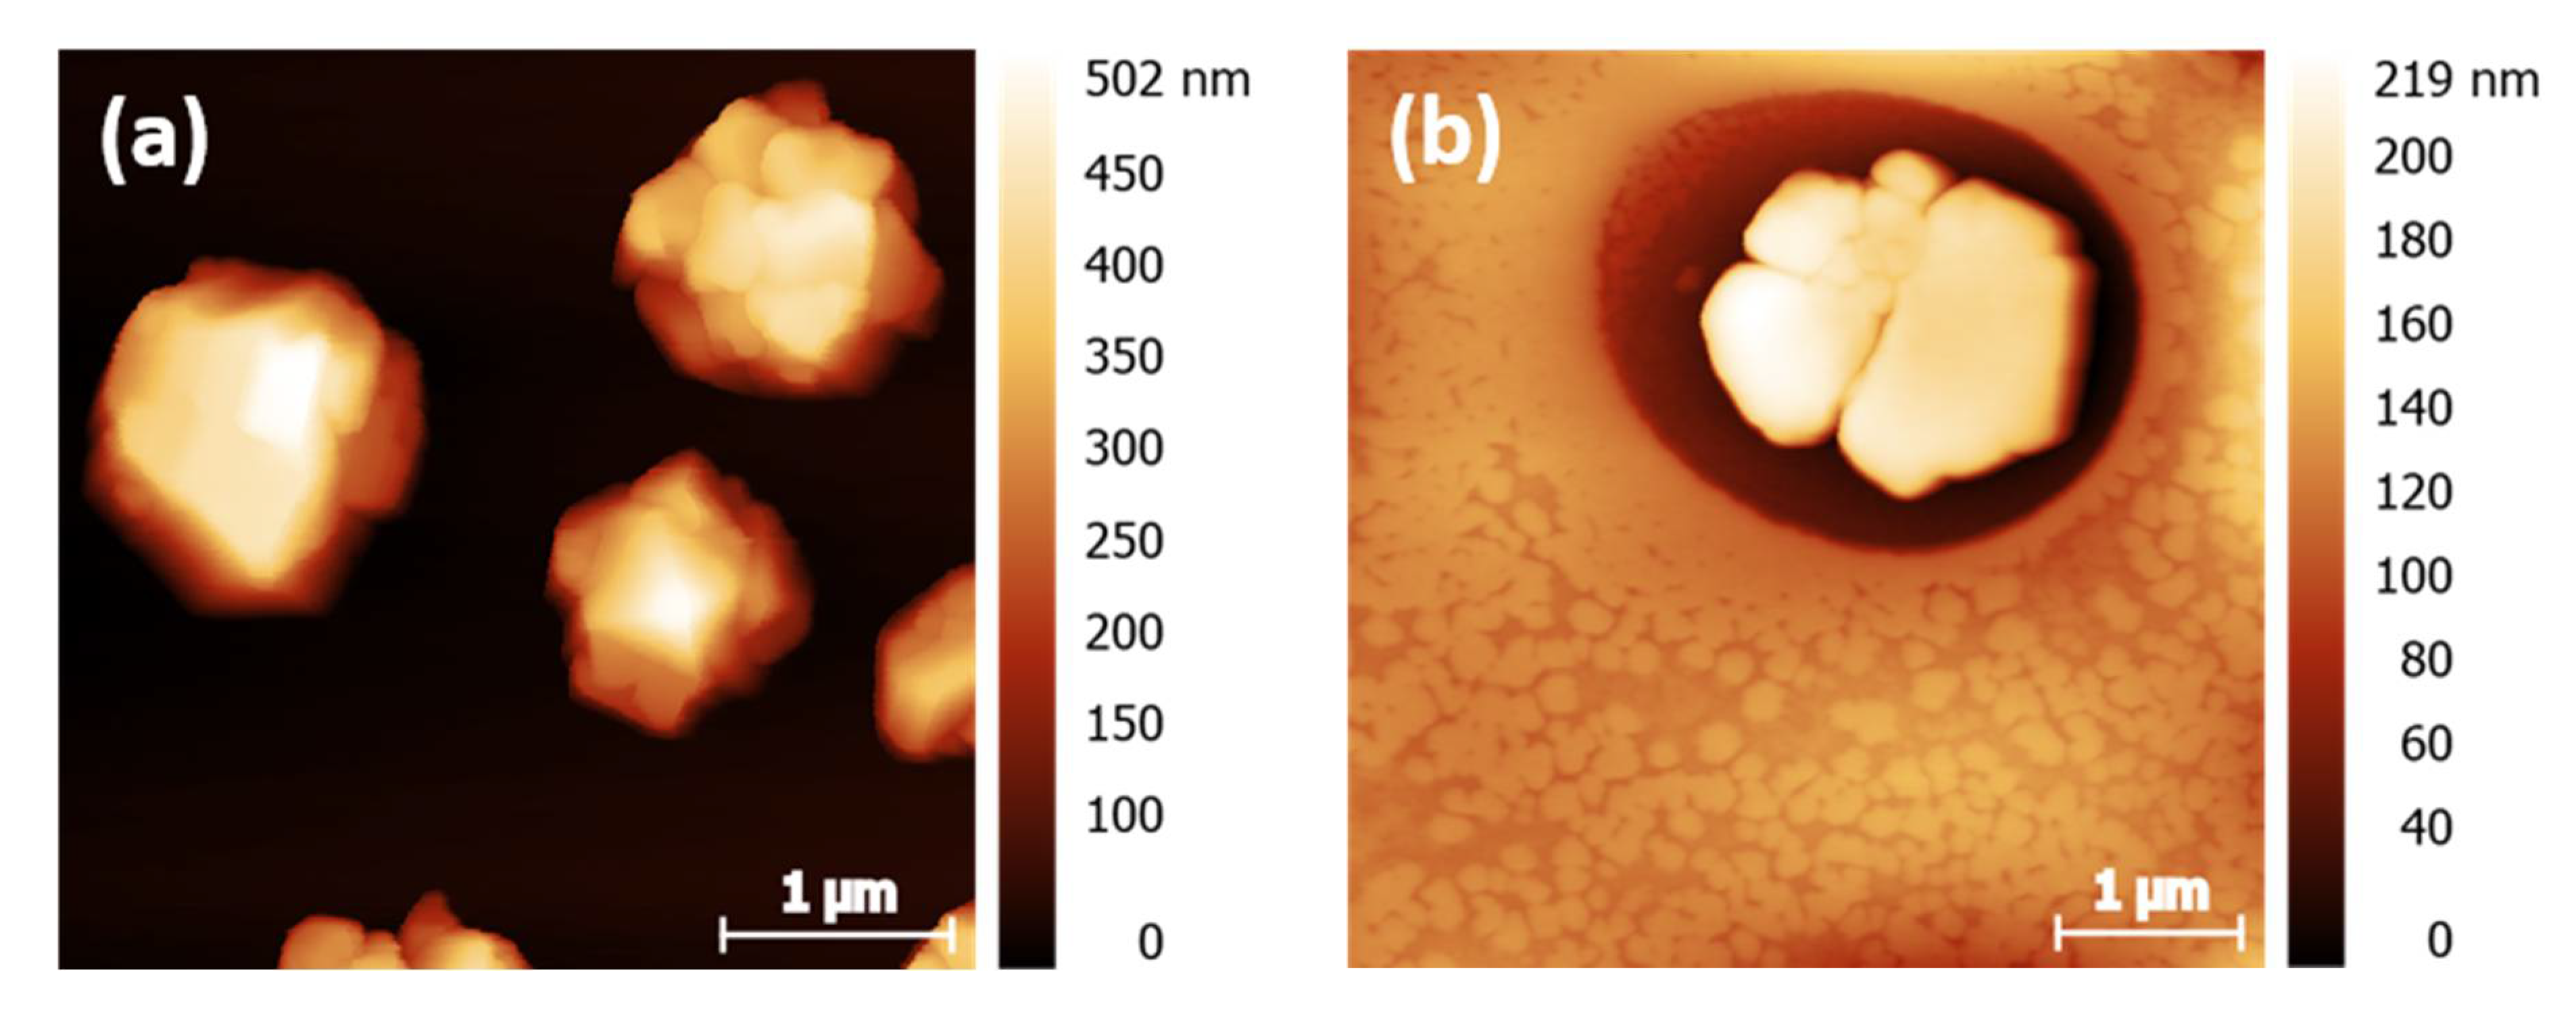
| Sample | Particle Density/% (Microscopy Images) | Maximum Island Height/nm (AFM) |
|---|---|---|
| 2-SpE | (60.0 ± 3.0) | (502 ± 25) |
| 2-SpA | (4.1 ± 0.4) | (219 ± 11) |
| 2-DiE | (28.6 ± 1.4) | (161 ± 8) |
| 2-DiA | (13.8 ± 0.2) | (543 ± 27) |
Publisher’s Note: MDPI stays neutral with regard to jurisdictional claims in published maps and institutional affiliations. |
© 2022 by the authors. Licensee MDPI, Basel, Switzerland. This article is an open access article distributed under the terms and conditions of the Creative Commons Attribution (CC BY) license (https://creativecommons.org/licenses/by/4.0/).
Share and Cite
Morgenstern, A.; Thomas, R.; Sharma, A.; Weber, M.; Selyshchev, O.; Milekhin, I.; Dentel, D.; Gemming, S.; Tegenkamp, C.; Zahn, D.R.T.; et al. Deposition of Nanosized Amino Acid Functionalized Bismuth Oxido Clusters on Gold Surfaces. Nanomaterials 2022, 12, 1815. https://0-doi-org.brum.beds.ac.uk/10.3390/nano12111815
Morgenstern A, Thomas R, Sharma A, Weber M, Selyshchev O, Milekhin I, Dentel D, Gemming S, Tegenkamp C, Zahn DRT, et al. Deposition of Nanosized Amino Acid Functionalized Bismuth Oxido Clusters on Gold Surfaces. Nanomaterials. 2022; 12(11):1815. https://0-doi-org.brum.beds.ac.uk/10.3390/nano12111815
Chicago/Turabian StyleMorgenstern, Annika, Rico Thomas, Apoorva Sharma, Marcus Weber, Oleksandr Selyshchev, Ilya Milekhin, Doreen Dentel, Sibylle Gemming, Christoph Tegenkamp, Dietrich R. T. Zahn, and et al. 2022. "Deposition of Nanosized Amino Acid Functionalized Bismuth Oxido Clusters on Gold Surfaces" Nanomaterials 12, no. 11: 1815. https://0-doi-org.brum.beds.ac.uk/10.3390/nano12111815