
Surface Properties and Photocatalytic Activities of the Colloidal ZnS:Mn Nanocrystals Prepared at Various pH Conditions

Abstract
:
1. Introduction
2. Results and Discussion
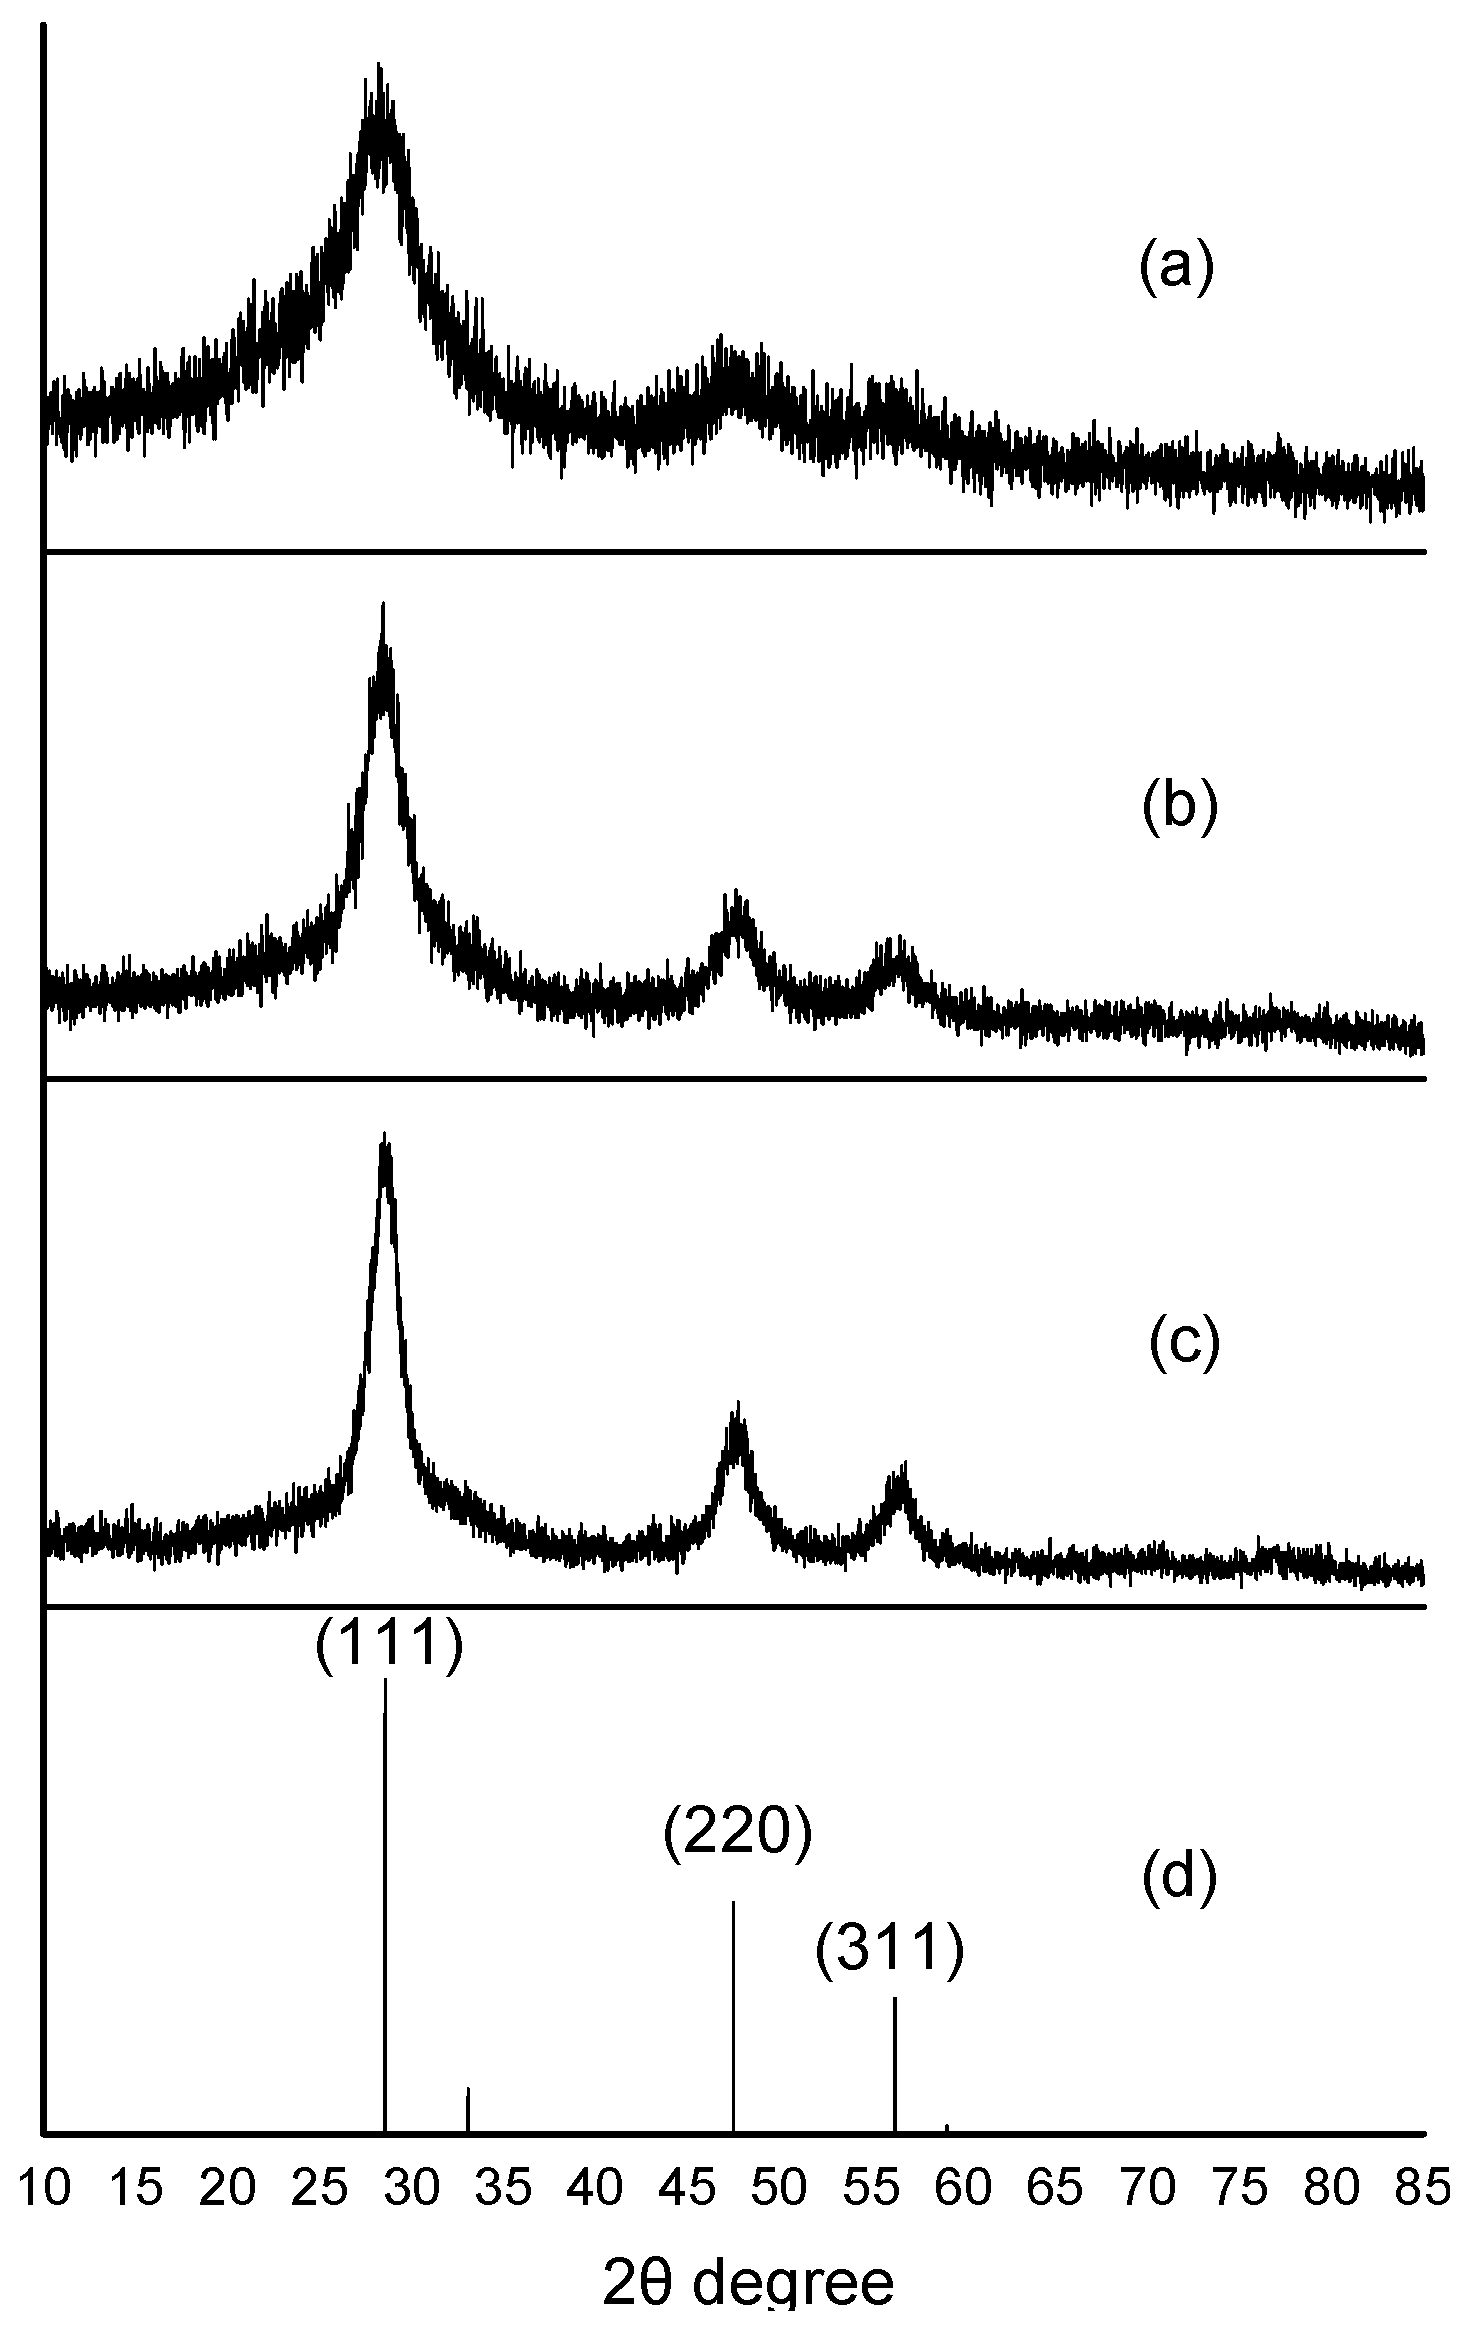
2.1. Characterizations of the ZnS:Mn-MAA NC Products Prepared at Different pH Conditions


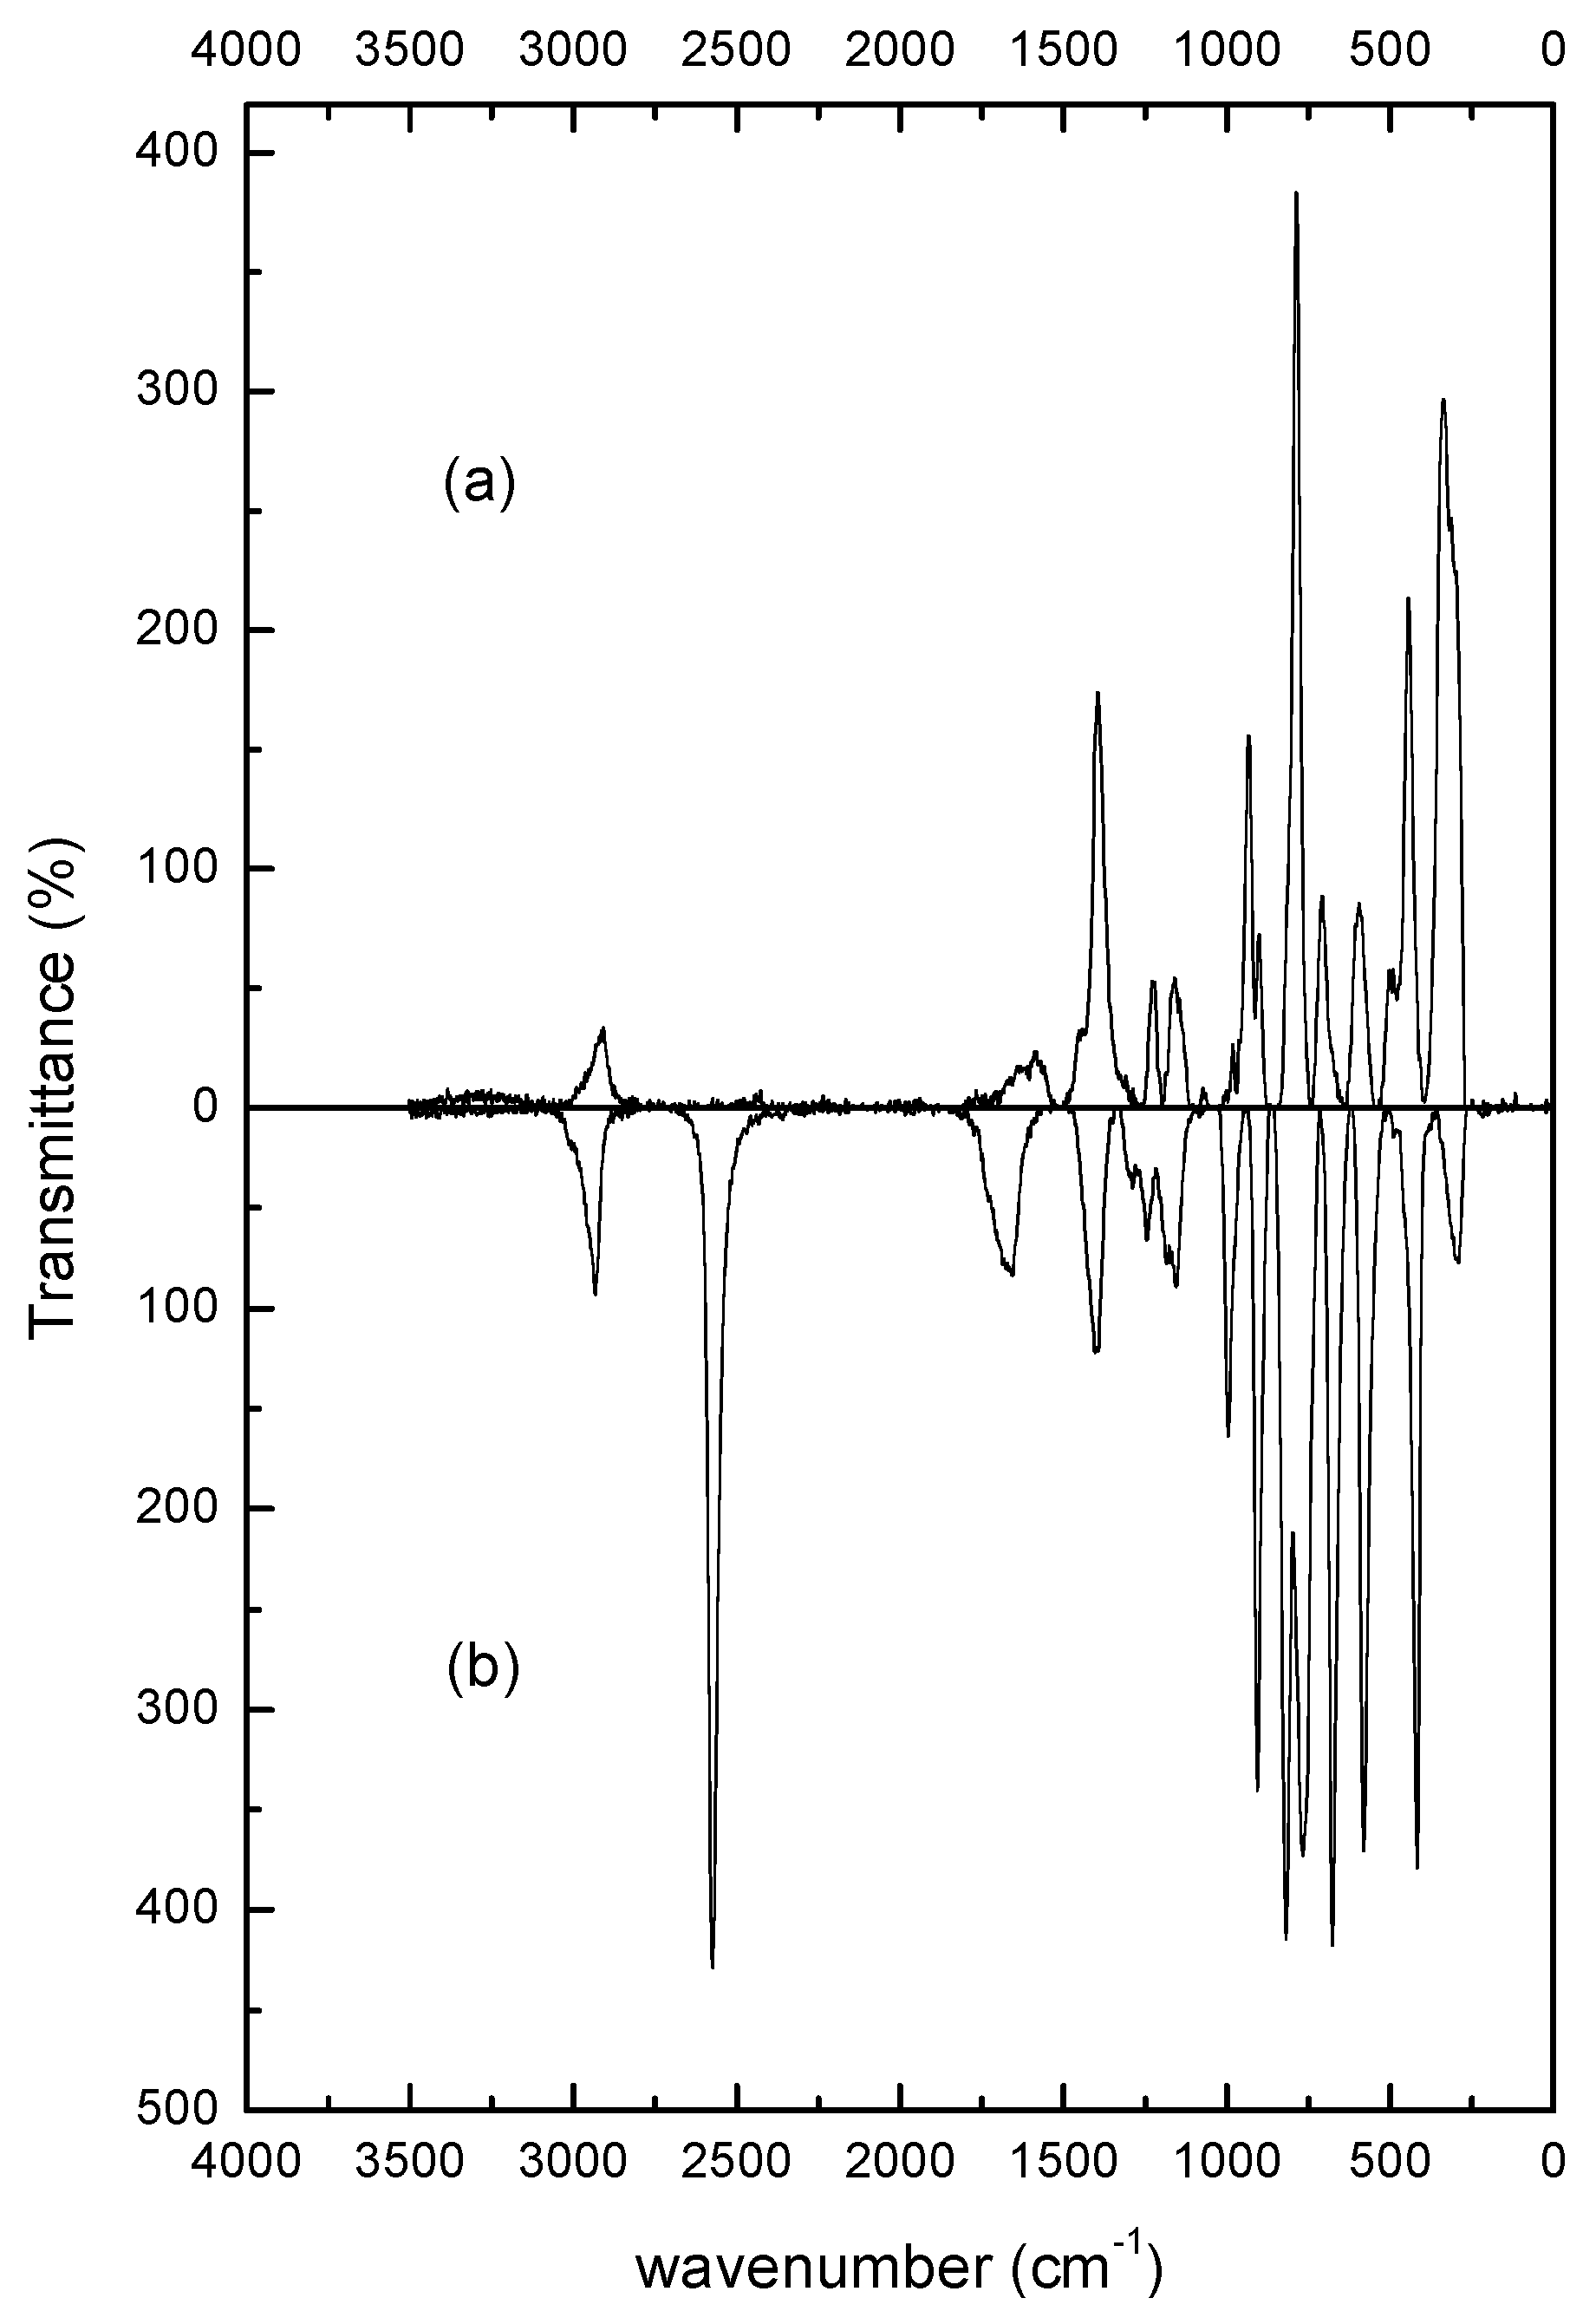
| ZnS:Mn-MAA (pH 12) | Neat MAA | Assignments |
|---|---|---|
| 335 | Zn-S phonon | |
| 444 | 419 | δ(CCO)/ρ(OCO) |
| 595 | 581 | γ(CCO)/ω(OCO) |
| 708 | δ(OCO) | |
| 787 | 776 | ν(CS) |
| 820 | ν(CC) | |
| 934 | 909 | ρ (CH2) |
| 1395 | 1400 | ν(OCO) + δ(CH2) |
| 1583 | 1692 | ν(C=O) |
| 2575 | ν(SH) | |
| 2907 | 2932 | ν(CH2) |
2.2. Surface Properties of the ZnS:Mn-MAA NCs

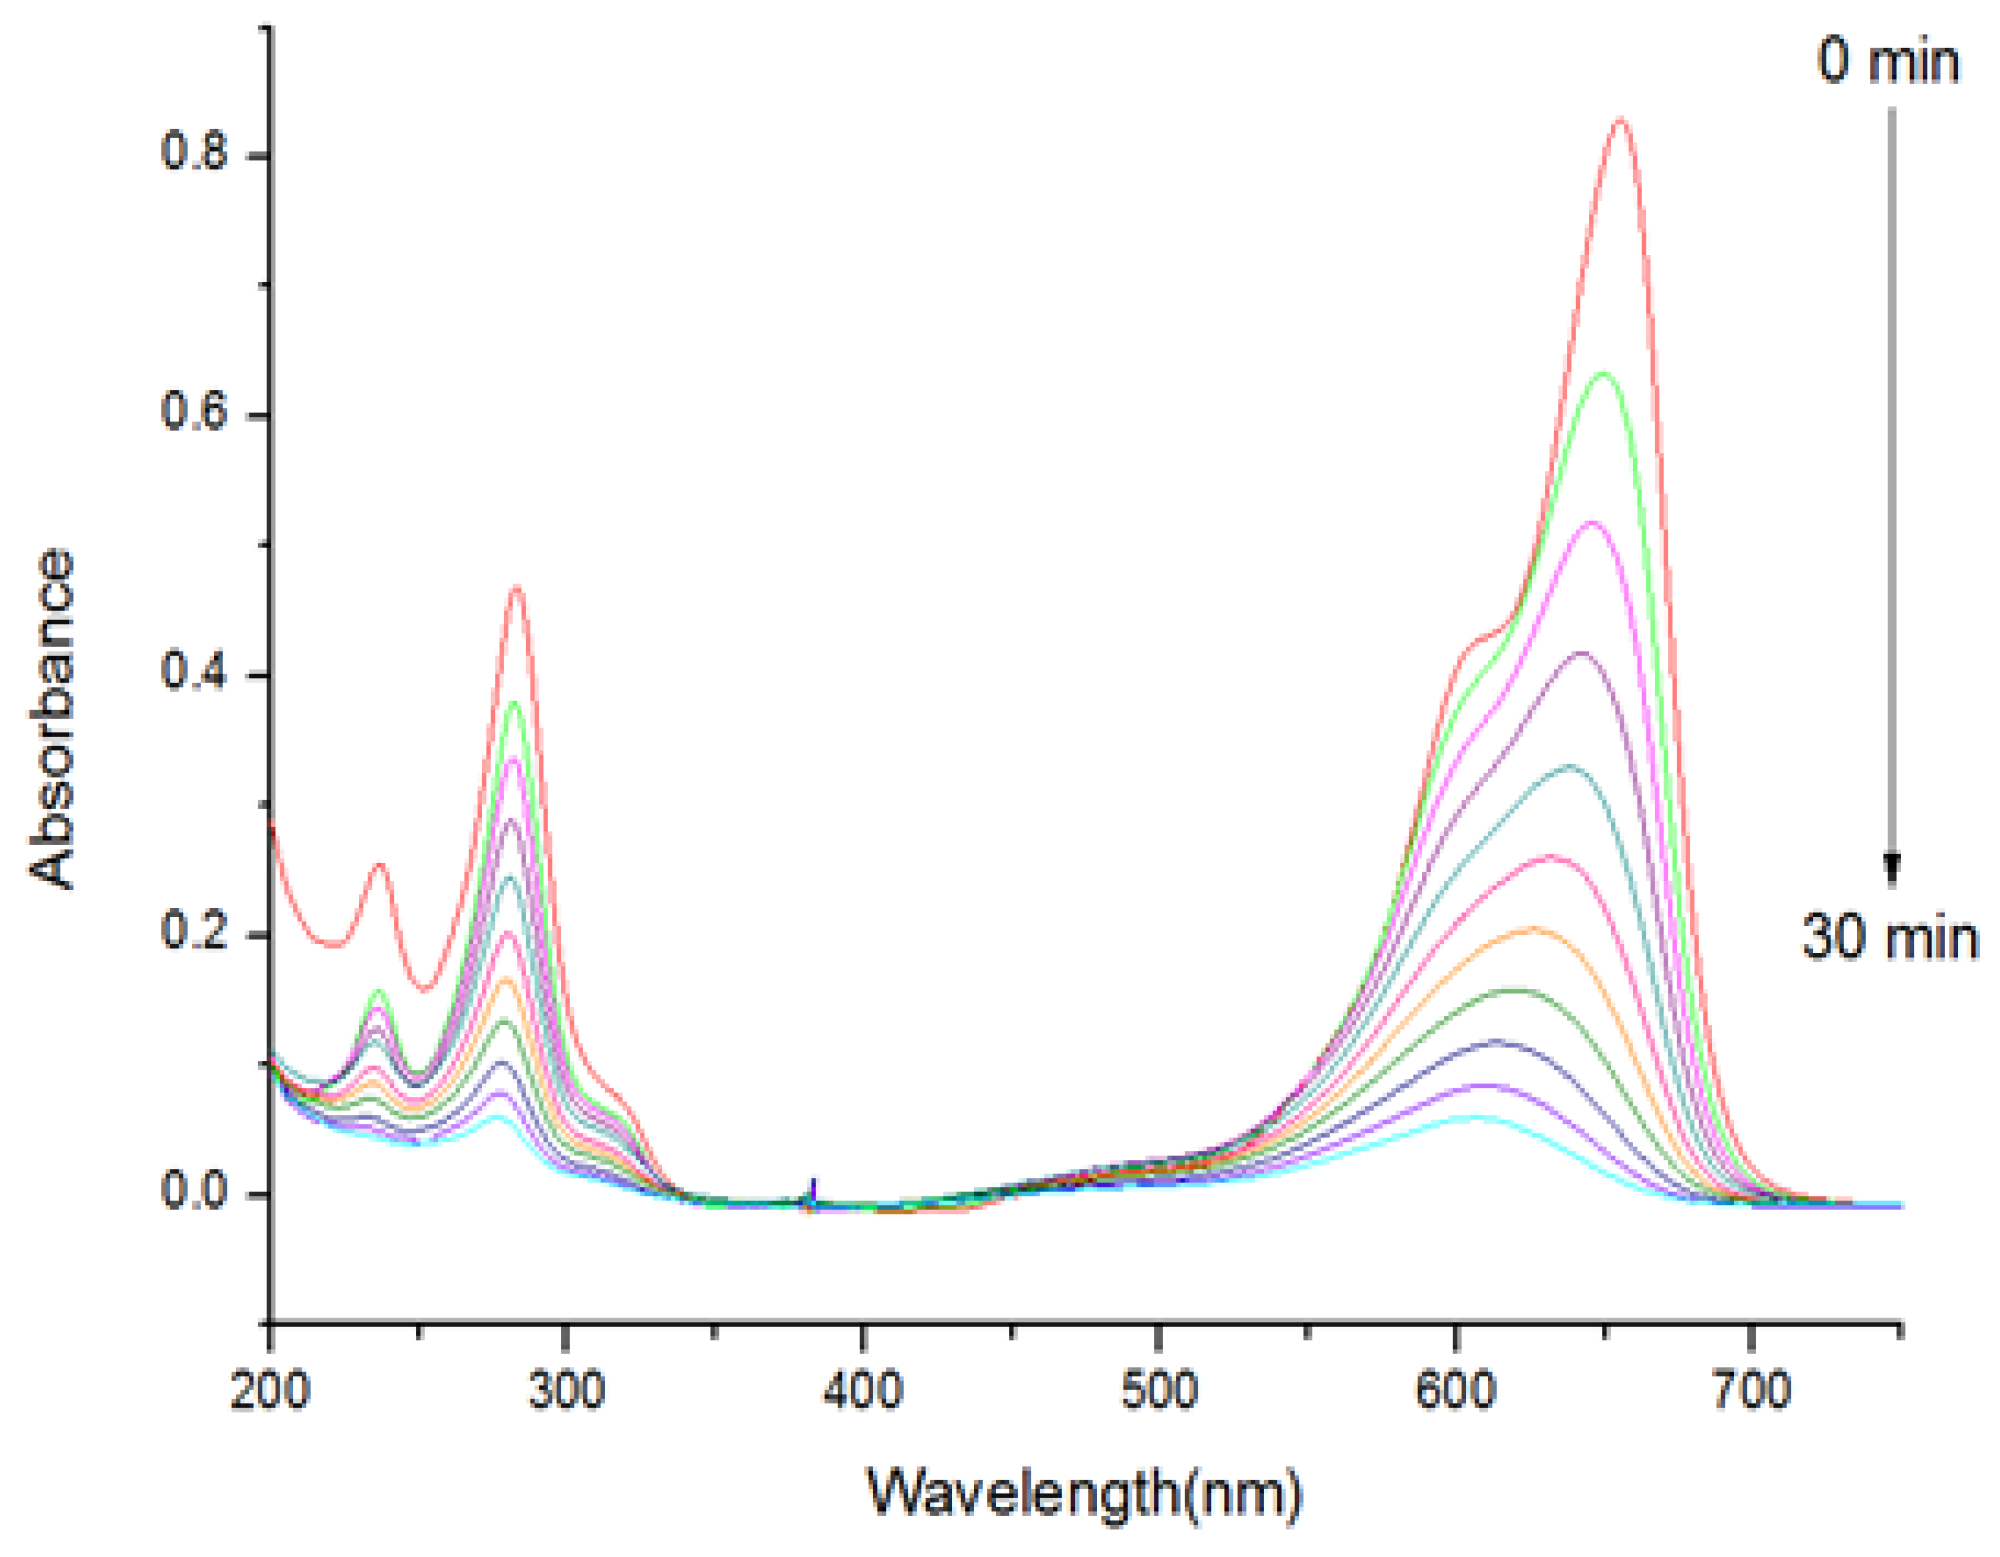
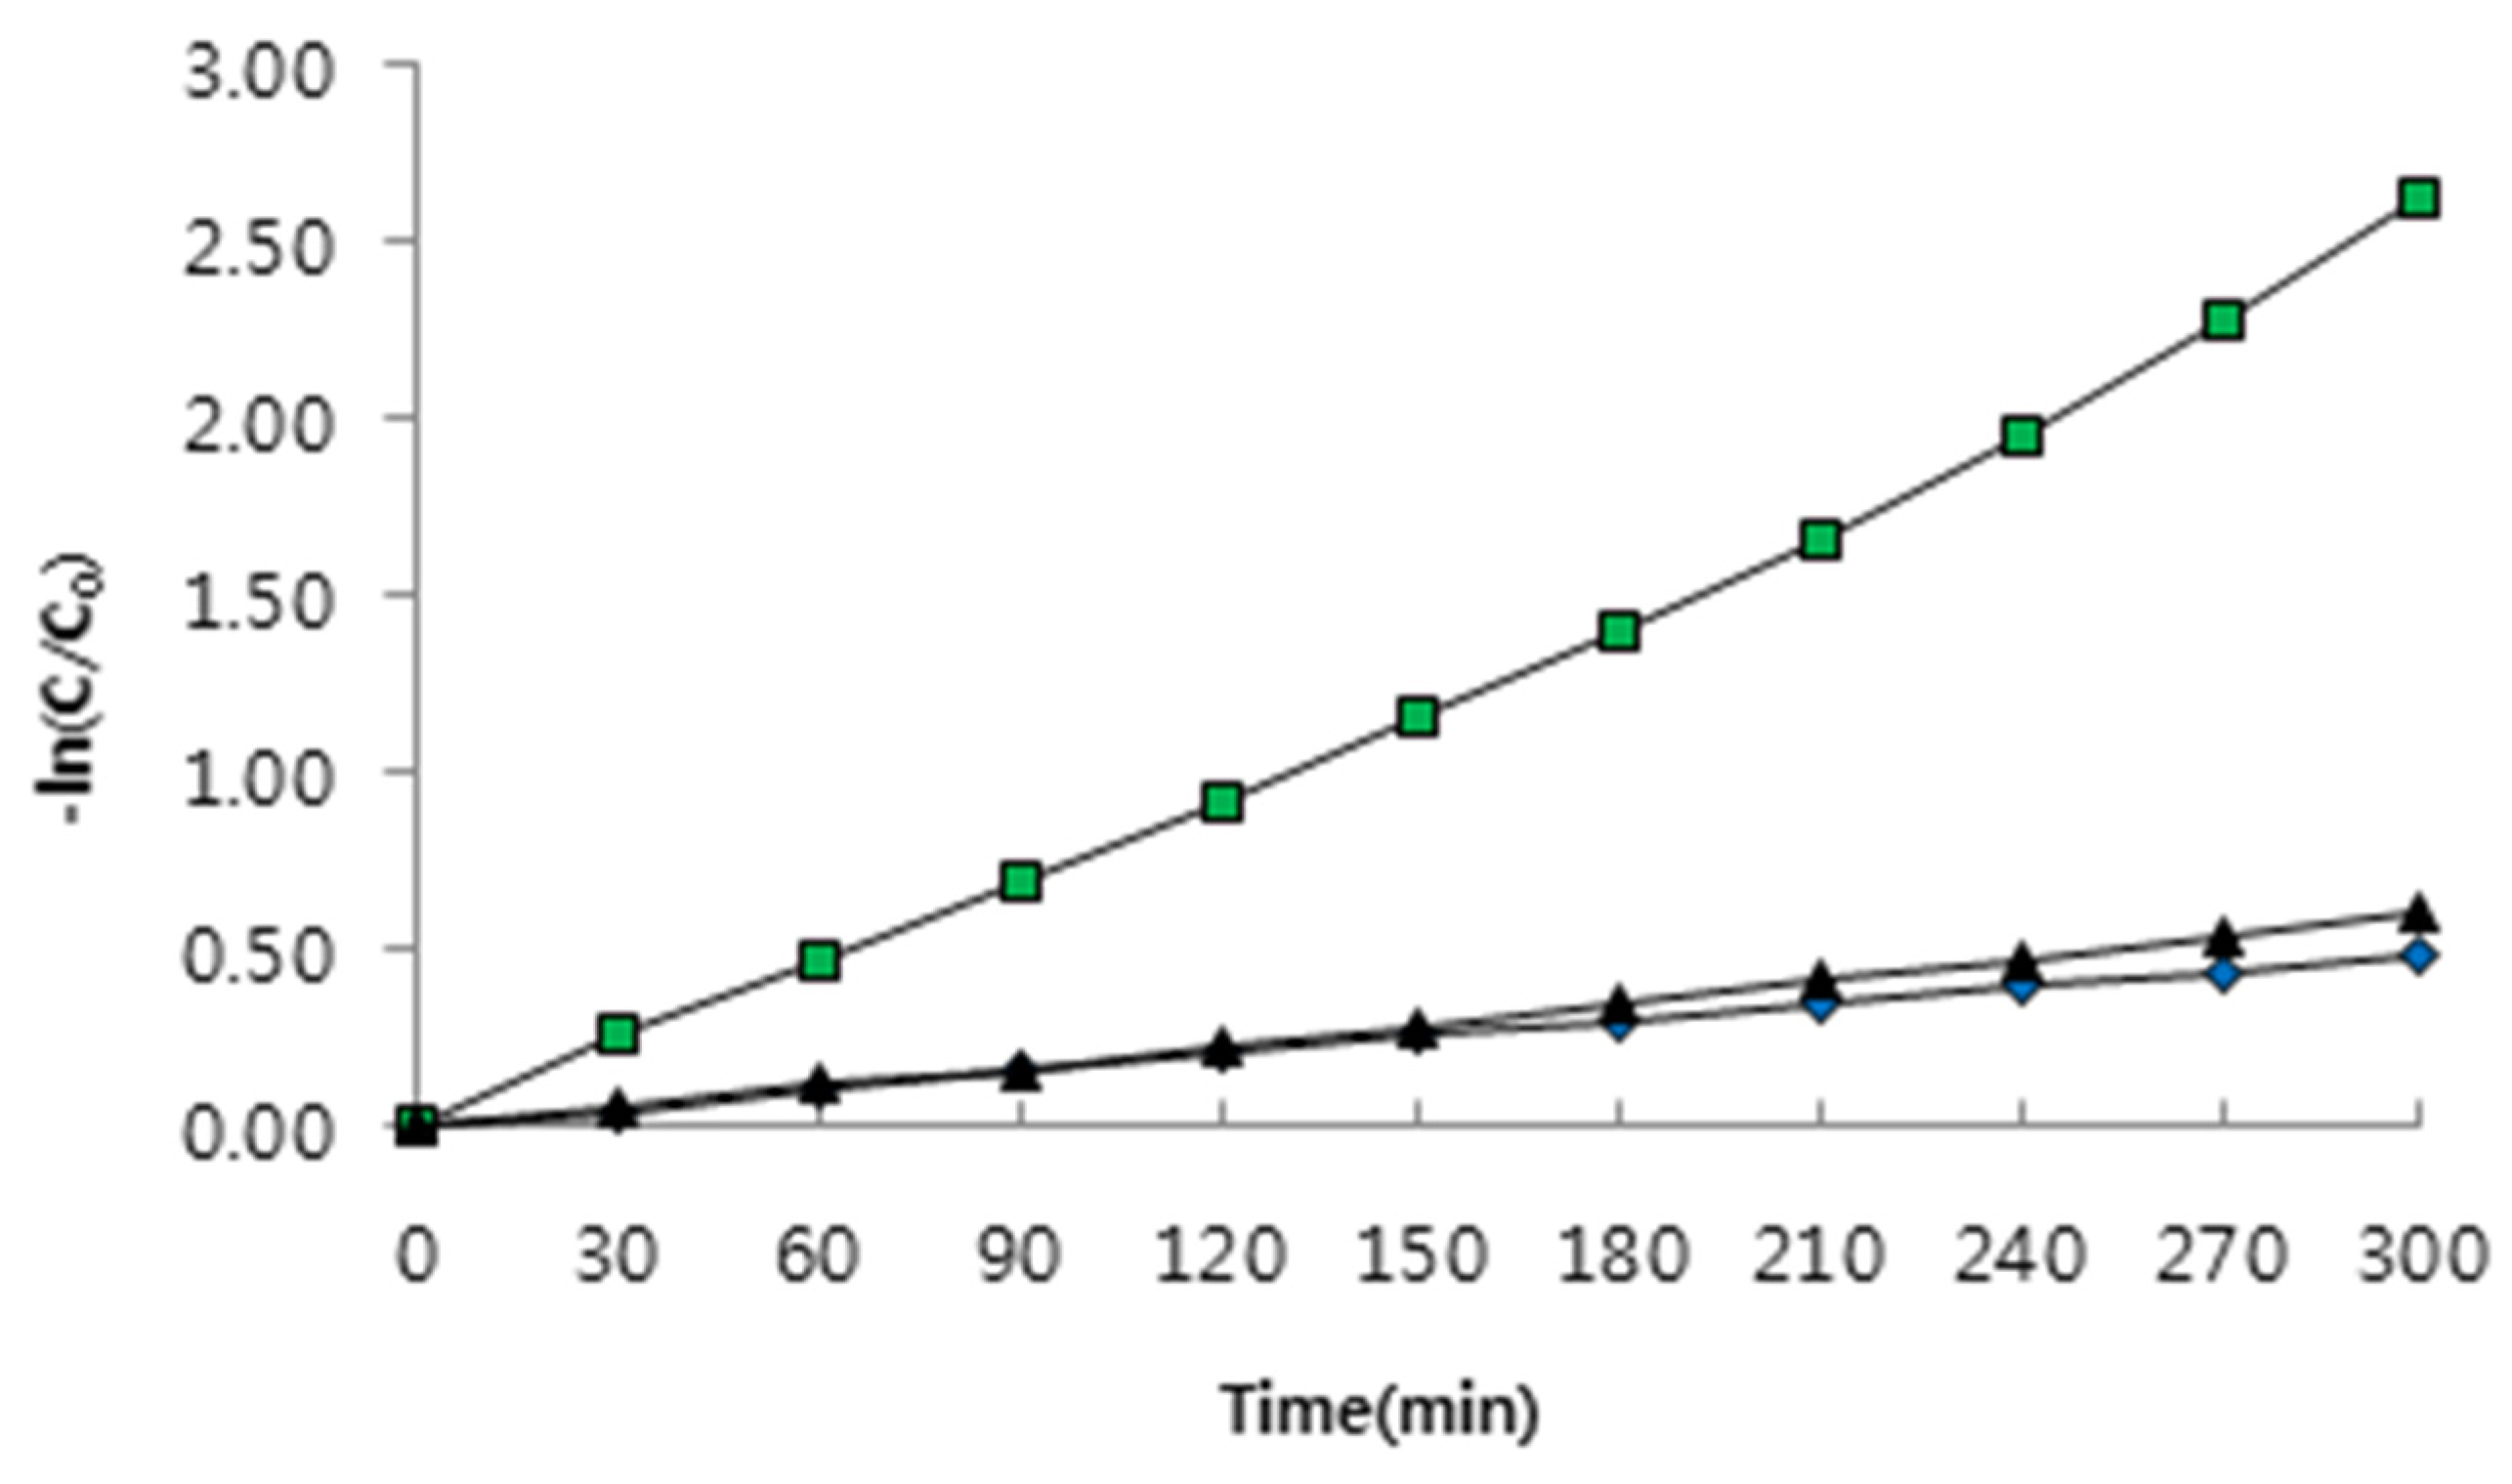
2.3. Photocatalytic Activities of the ZnS:Mn-MAA NCs


3. Experimental Section
3.1. Instrumentations
3.2. Syntheses of the ZnS:Mn-MAA NCs
| Experimental Data | pH 2 | pH 7 | pH 12 |
|---|---|---|---|
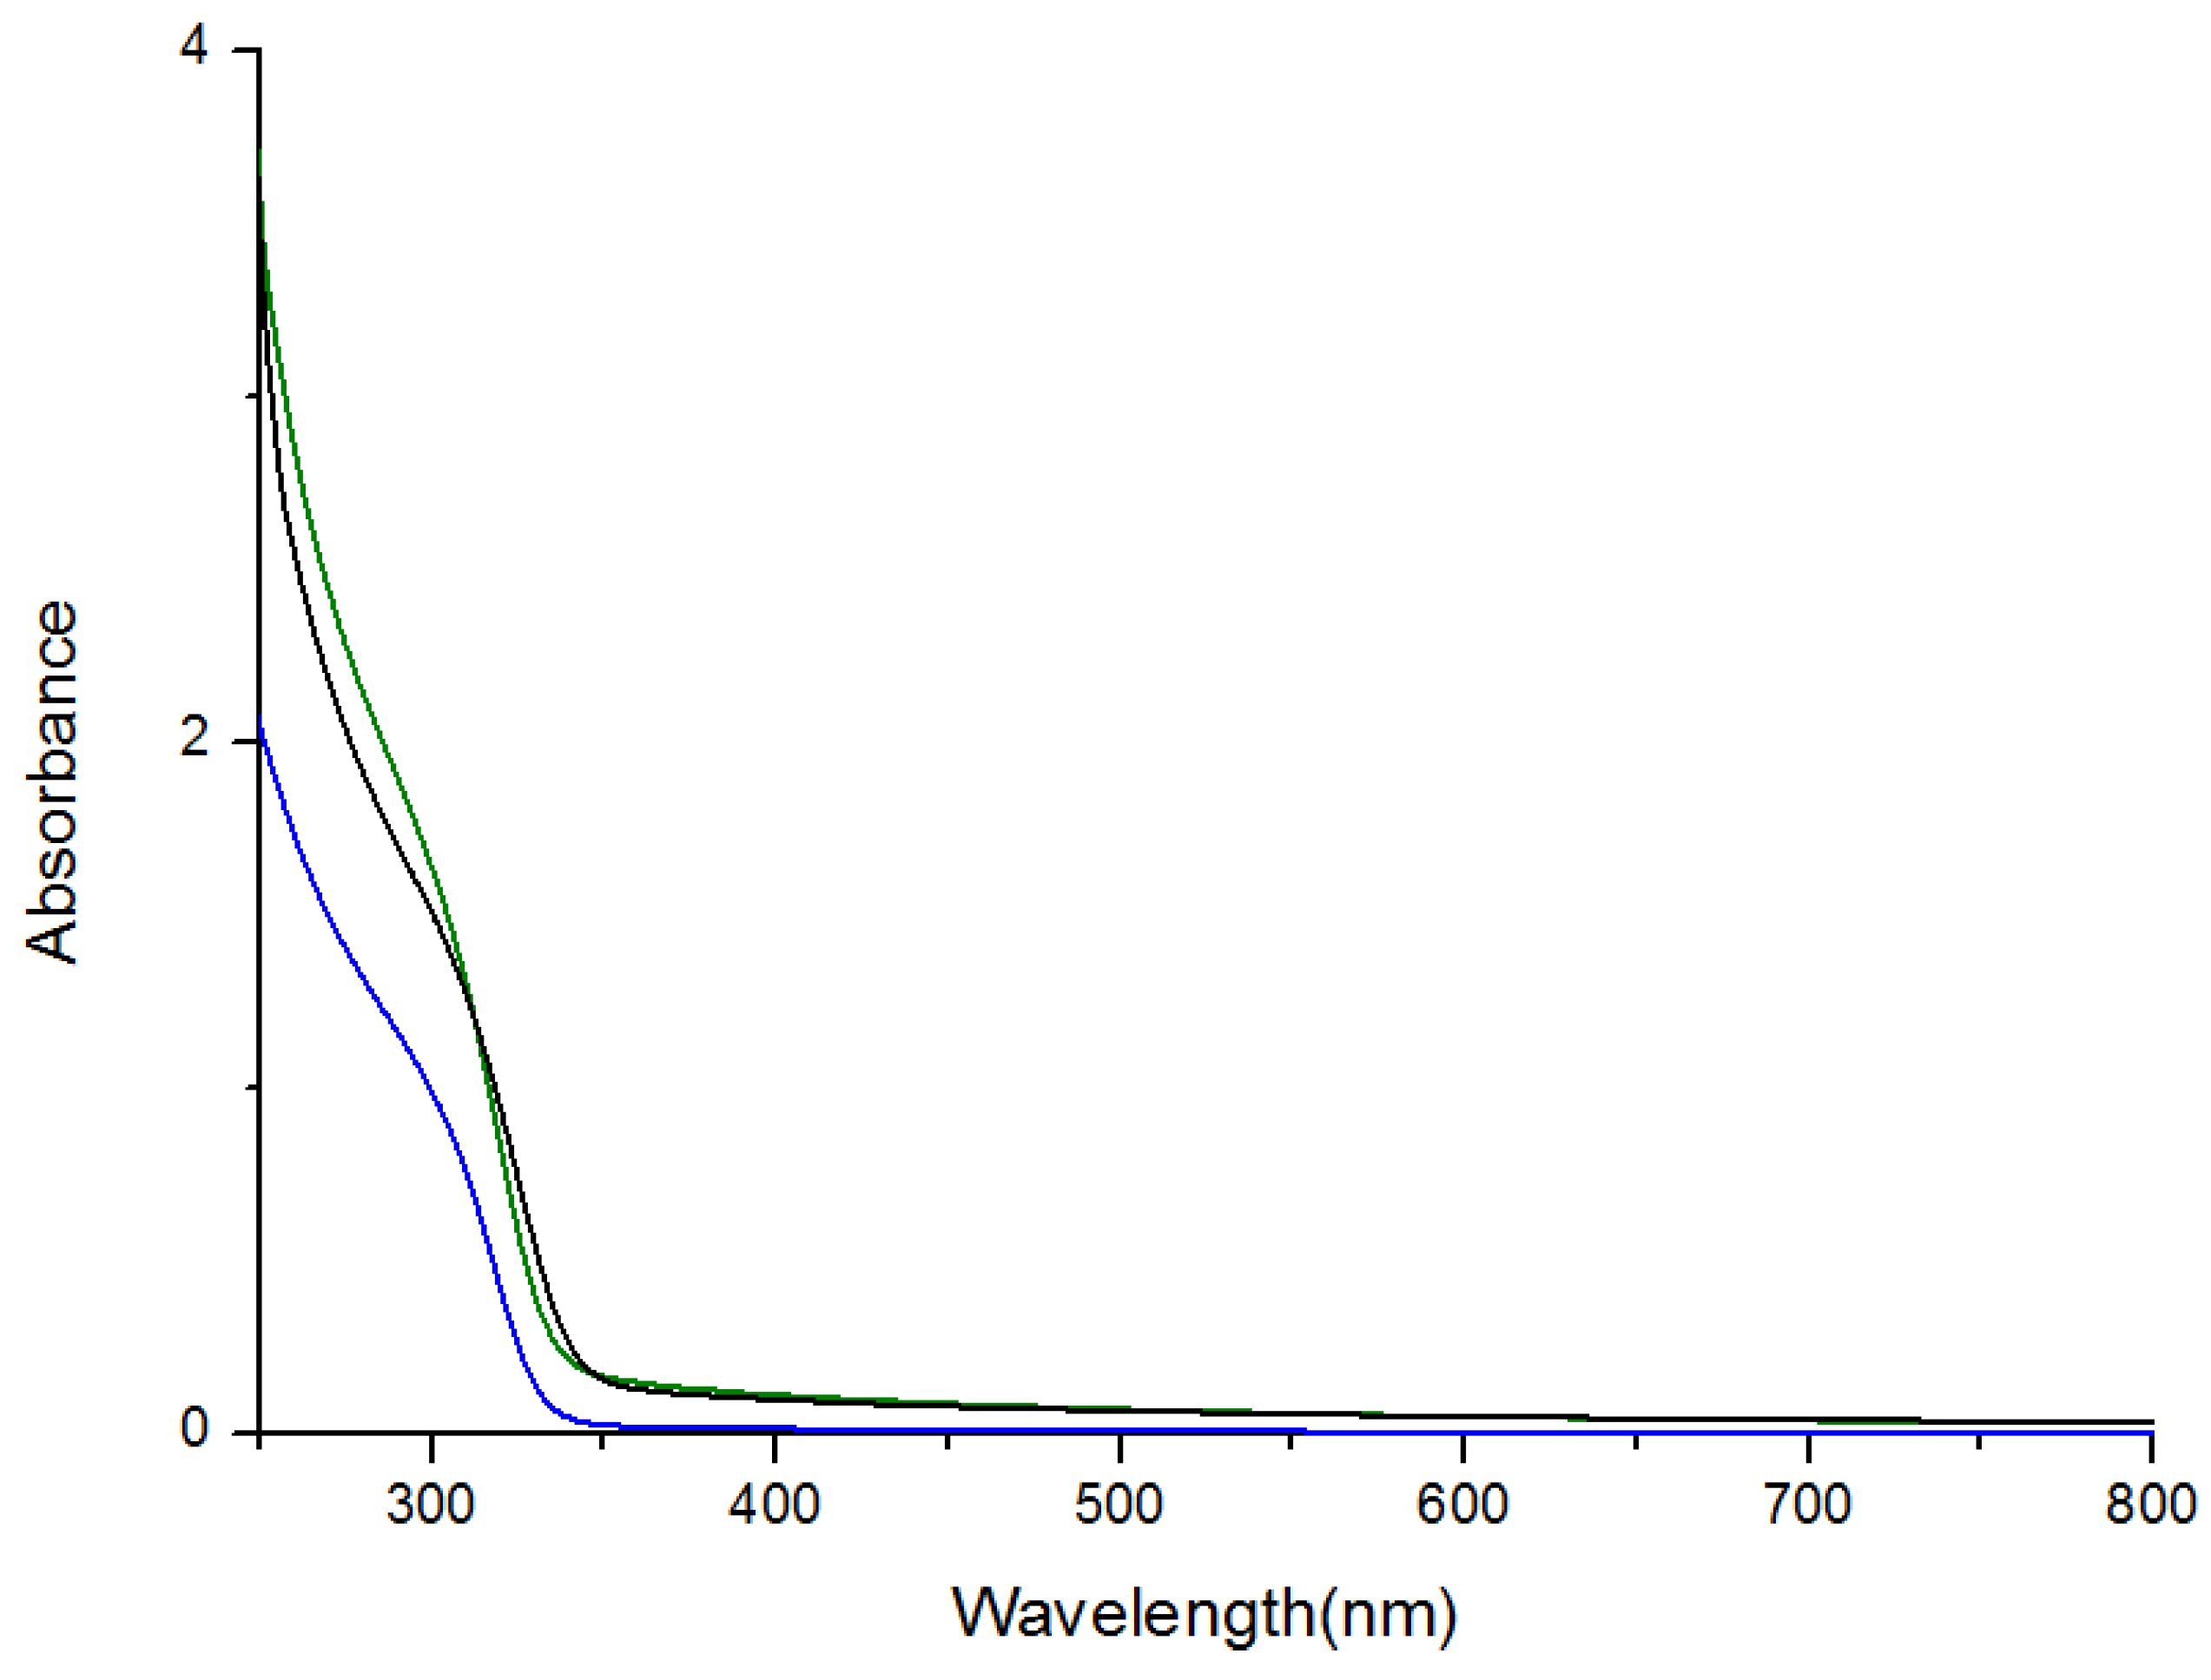
| UV/Vis absorption (λmax, nm) | 307 | 310 | 312 |
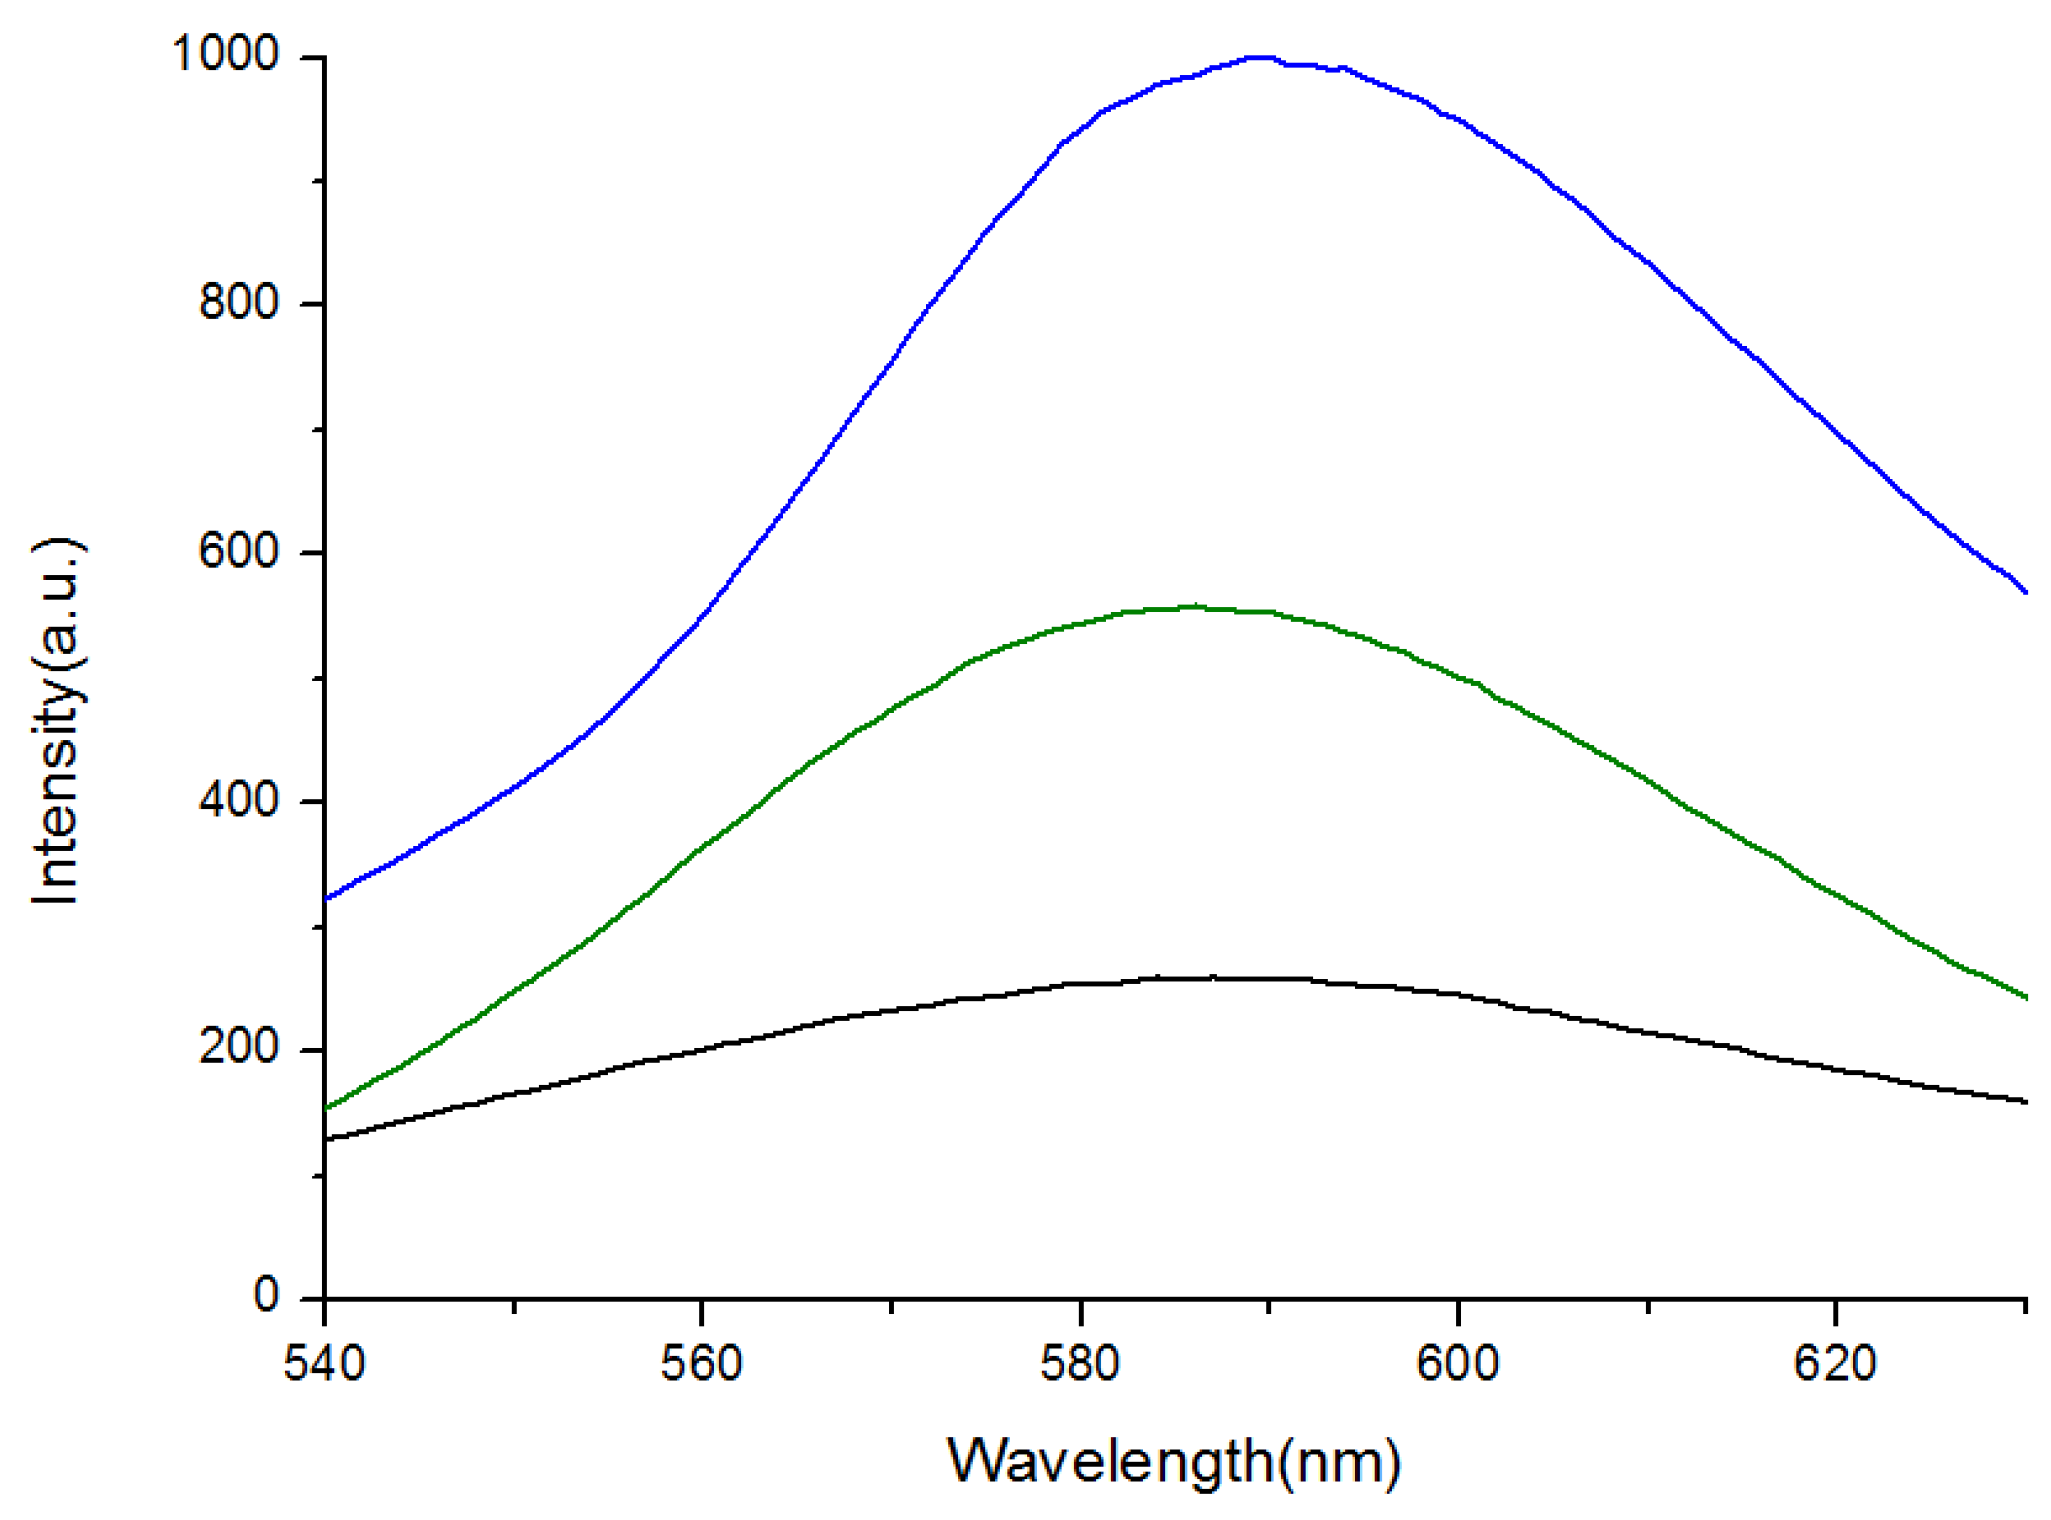
| PL emission (λmax, nm) | 590 | 586 | 587 |
| PL efficiencies (%) | 4.67 | 4.02 | 3.98 |
| concentration Mn dopant ICP-AES (%) | 1.06 | 1.22 | 1.11 |
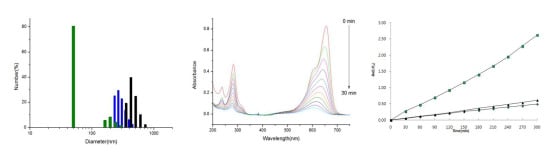
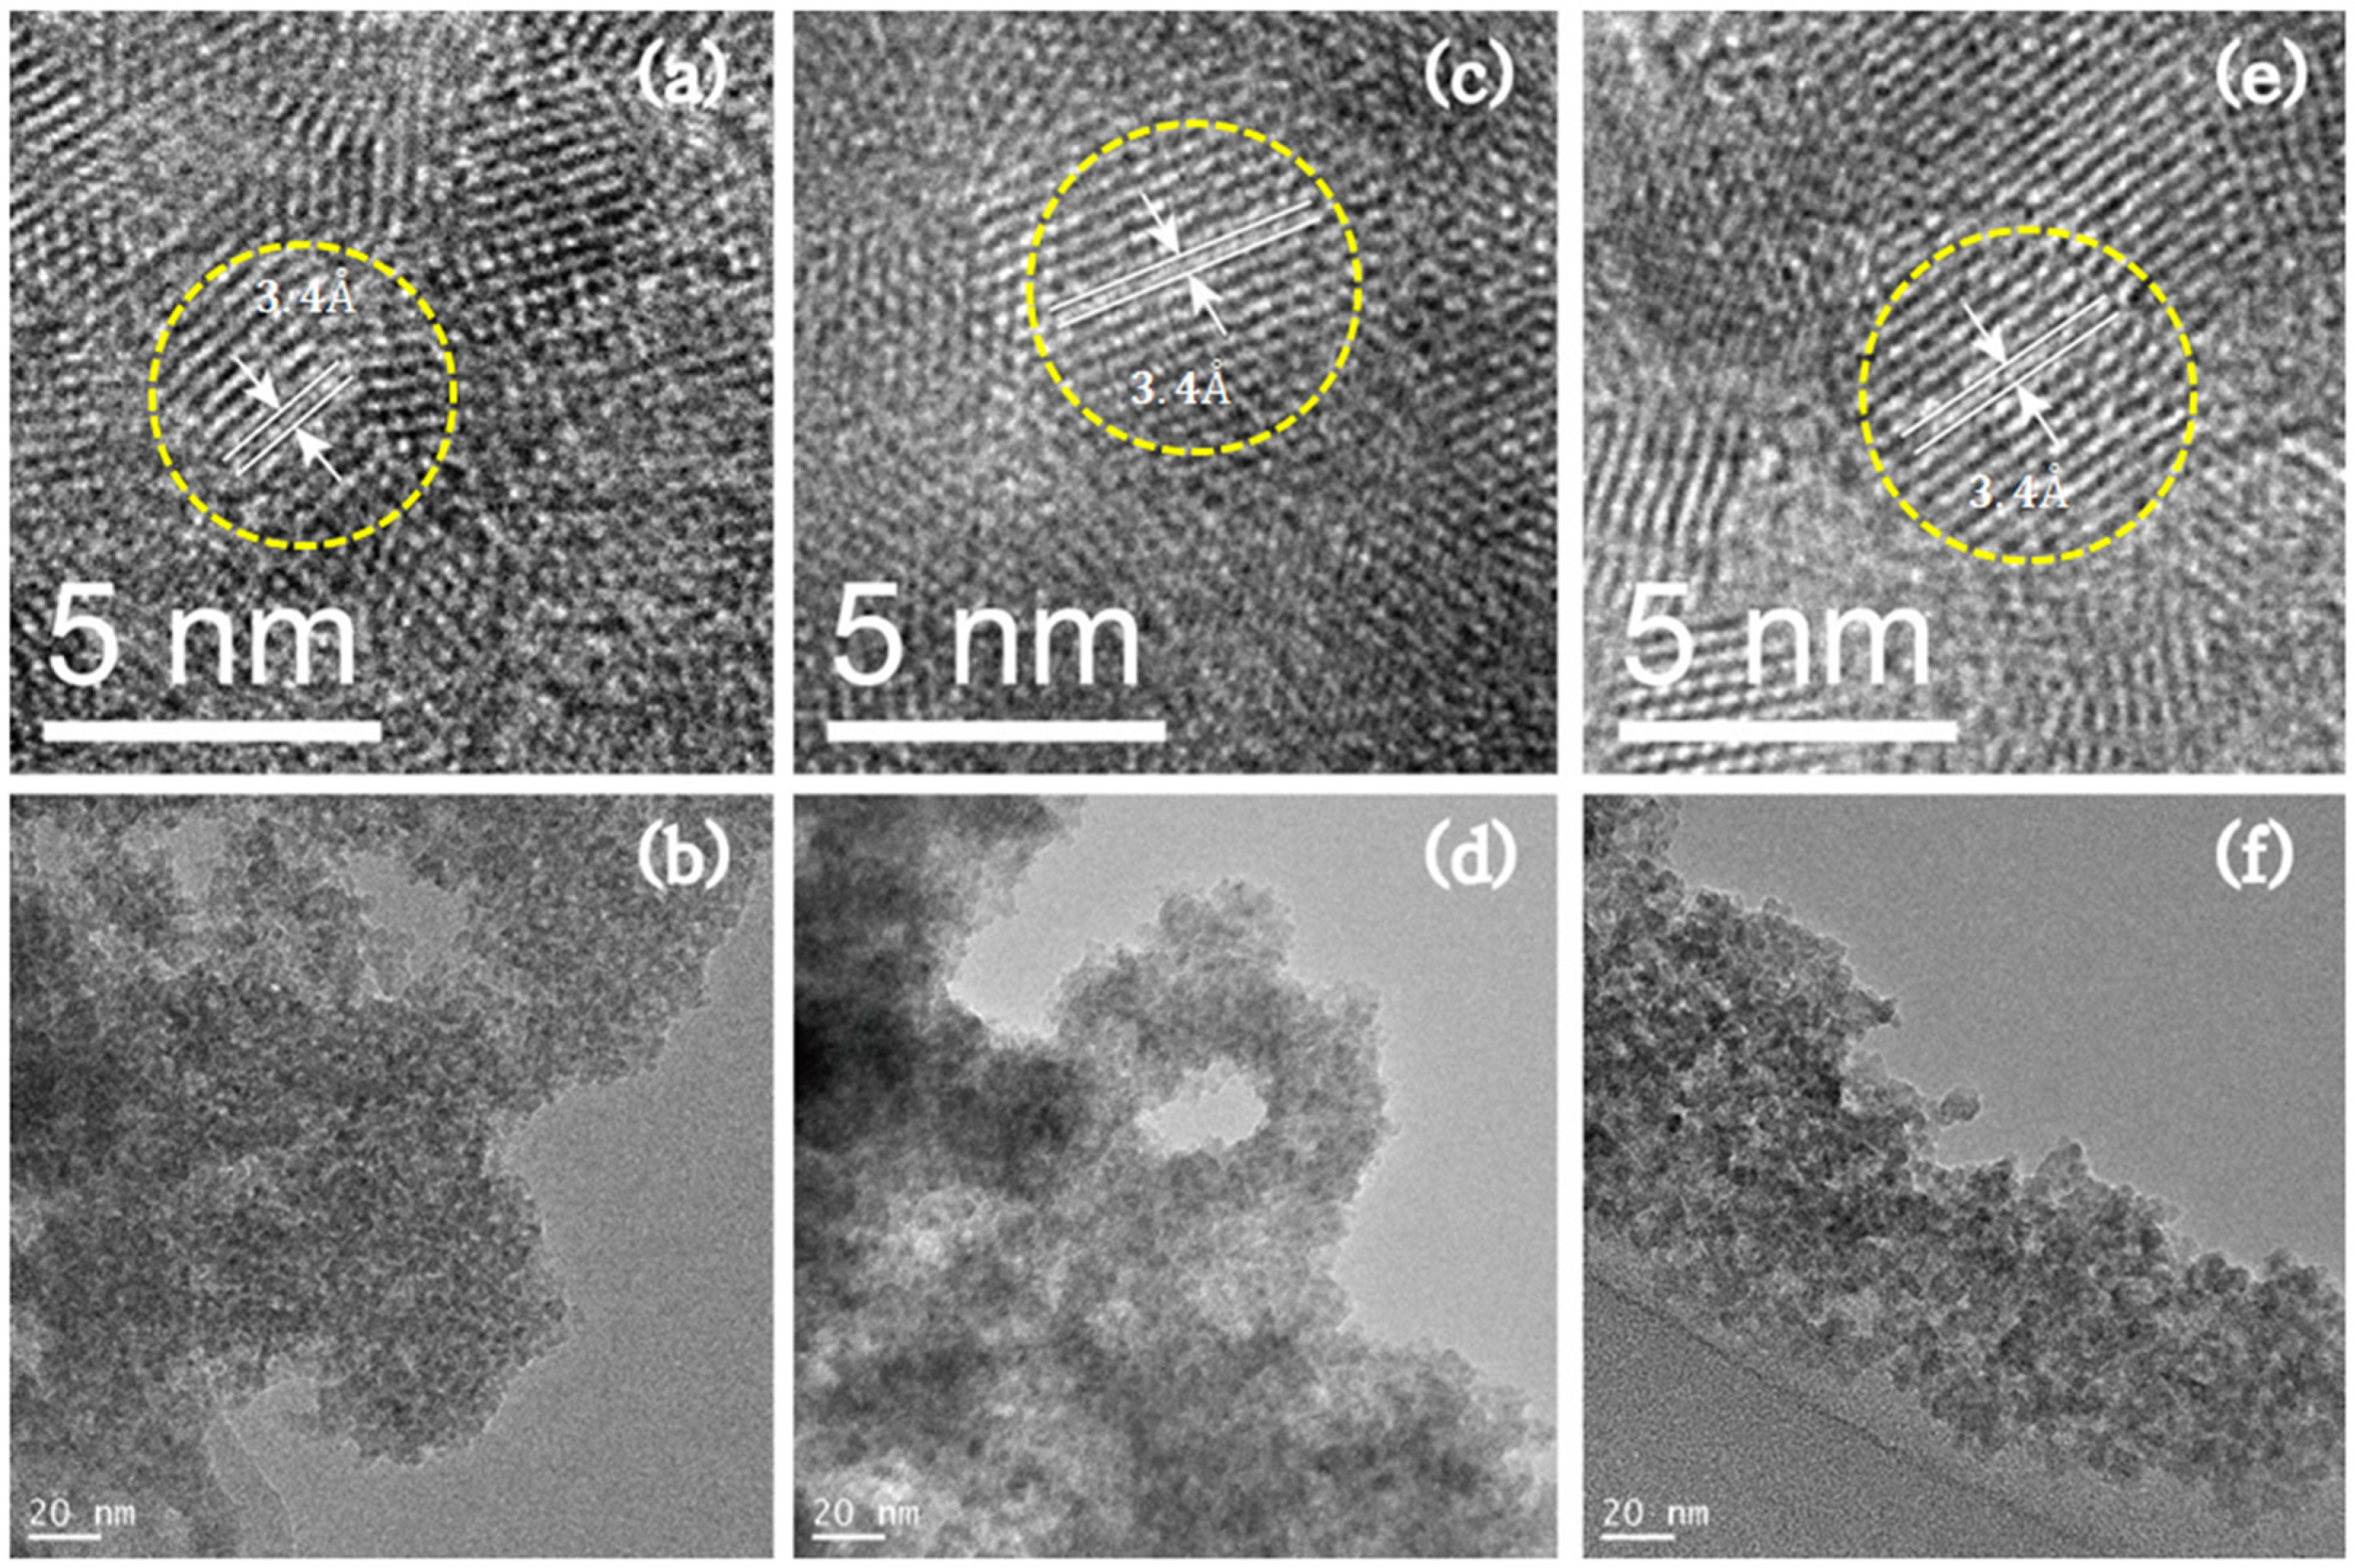
| Average particle size HR-TEM (nm) | 3.33 | 5.17 | 6.05 |
| Average particle size XRD (nm) | 3.51 | 5.00 | 5.70 |
| Zeta potentials (mV) | −24.98 | −31.67 | −7.59 |
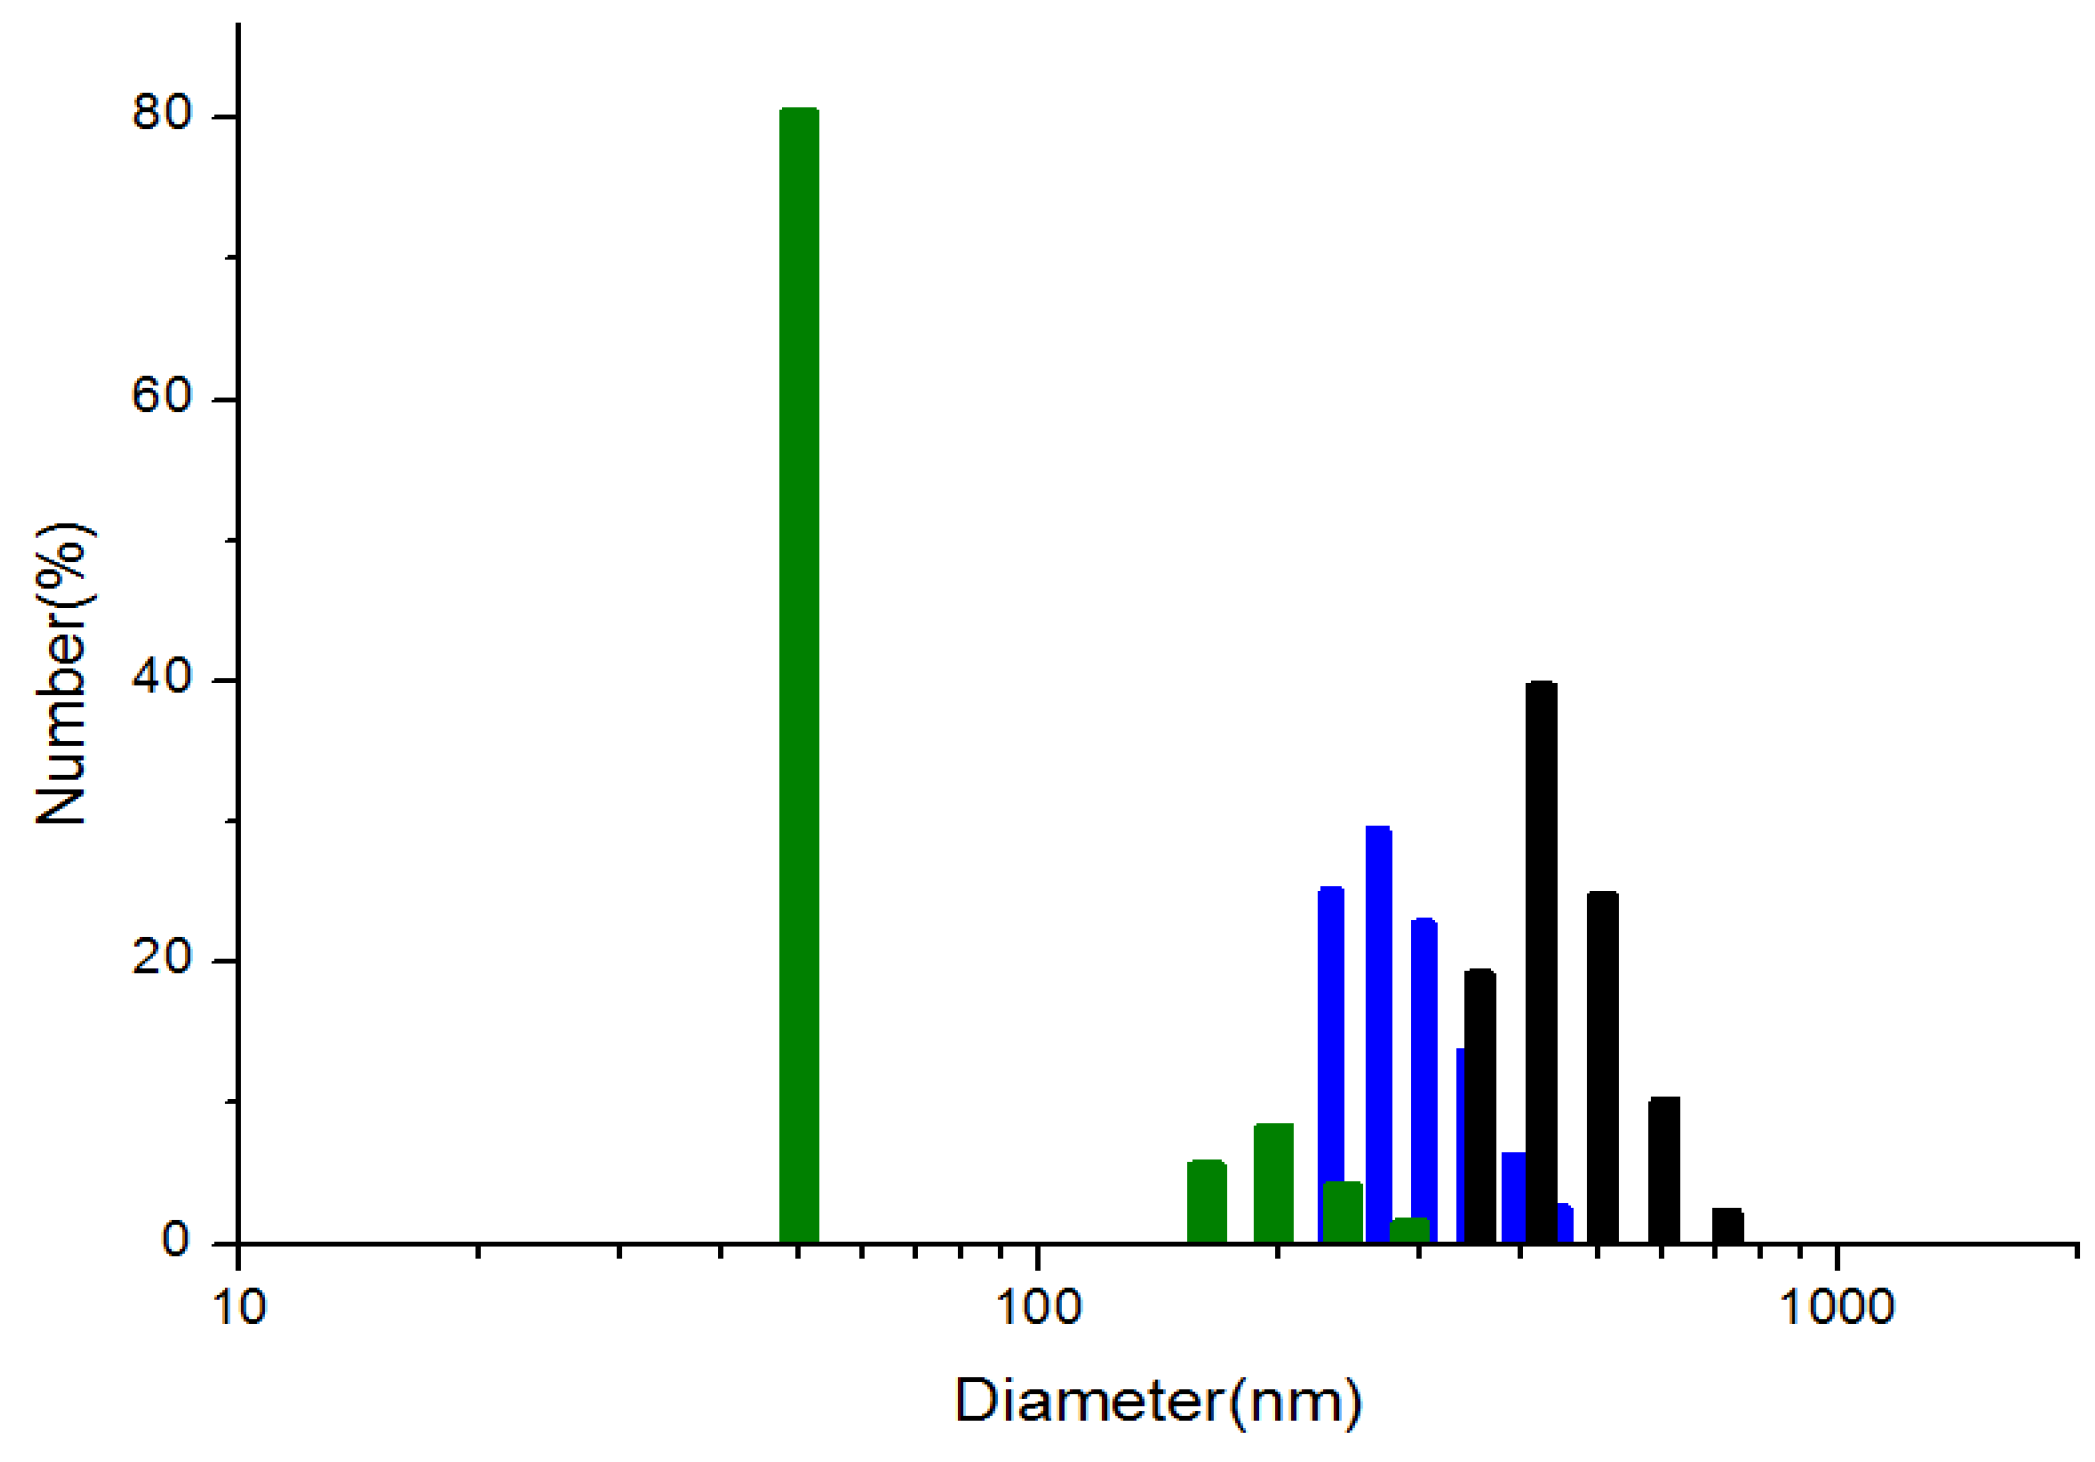
| Average size of aggregates in water DLS (nm) | 287 | 50 | 440 |
3.3. Photocatalytic Experiments
4. Conclusions
Acknowledgments
Author Contributions
Conflicts of Interest
References
- Karakoti, A.S.; Shukla, R.; Shanker, R.; Singh, S. Surface functionalization of quantum dots for biological applications. Adv. Colloid Interface Sci. 2015, 215, 28–45. [Google Scholar] [CrossRef] [PubMed]
- Tyrakowski, C.M.; Snee, P.T. A primer on the synthesis, water-solubilization, and functionalization of quantum dots, their use as biological sensing agents, and present status. Phys. Chem. Chem. Phys. 2014, 16, 837–855. [Google Scholar] [CrossRef] [PubMed]
- Yu, W.W. Water-soluble quantum dots for biomedical applications. Biochem. Biophys. Res. Commun. 2006, 348, 781–786. [Google Scholar] [CrossRef] [PubMed]
- Ruberu, T.P.A.; Dong, Y.; Das, A.; Eisenberg, R. Photoelectrochemical Generation of Hydrogen from Water Using a CdSe Quantum Dot-Sensitized Photocathode. ACS Catal. 2015, 5, 2255–2259. [Google Scholar] [CrossRef]
- Chauvire, T.; Mouesca, J.-M.; Gasparutto, D.; Ravanat, J.-L.; Lebrun, C.; Gromova, M.; Jouneau, P.-H.; Chauvin, J.; Gambarelli, S.; Maurel, V. Redox Photocatalysis with Water-Soluble Core-Shell CdSe-ZnS Quantum Dots. J. Phys. Chem. C 2015, 119, 17857–17866. [Google Scholar] [CrossRef]
- Kudo, A.; Miseki, Y. Heterogeneous photocatalyst materials for water splitting. Chem. Soc. Rev. 2009, 38, 253–278. [Google Scholar] [CrossRef] [PubMed]
- Ray, P.Z.; Shipley, H.J. Inorganic nano-adsorbents for the removal of heavy metals and arsenic: A review. RCS Adv. 2015, 5, 29885–29907. [Google Scholar] [CrossRef]
- Rajabi, H.R.; Farsi, M. Quantum dot based photocatalytic decolorization as an efficient and green strategy for the removal of anionic dye. Mater. Sci. Semicond. Process. 2015, 31, 478–486. [Google Scholar] [CrossRef]
- Ayanda, O.S.; Petrik, L.F. Nanotechnology: The Breakthrough in Water and Wastewater Treatment. Intl. J. Chem. Mater. Environ. Res. 2014, 1, 1–2. [Google Scholar]
- Bajpai, P.K.; Yadav, S.; Tiwari, A.; Virk, H.S. Recent Advances in the Synthesis and Characterization of Chalcogenide Nanoparticles. Solid State Phenom. 2015, 222, 187–233. [Google Scholar] [CrossRef]
- Sharma, R.; Bisen, D.P. Thermoluminescence of mercaptoethanol capped ZnS:Mn nanoparticles. Luminescence 2015, 30, 175–181. [Google Scholar] [CrossRef] [PubMed]
- Vogel, W.; Borse, P.H.; Deshmukh, N.; Kulkarni, S.K. Structure and Stability of Monodisperse 1.4-nm ZnS Particles Stabilized by Mercaptoethanol. Langmuir 2000, 16, 2032–2037. [Google Scholar] [CrossRef]
- Wangoo, N.; Kaur, S.; Bajaj, M.; Jain, D.V.S.; Sharma, R.K. One pot, rapid and efficient synthesis of water dispersible gold nanoparticles using alpha-amino acids. Nanotechnology 2014, 25, 5608–5615. [Google Scholar] [CrossRef] [PubMed]
- Lee, J.H.; Kim, Y.A.; Kim, K.M.; Huh, Y.D.; Hyun, J.W.; Kim, H.S.; Noh, S.J.; Hwang, C.S. Syntheses and Optical Properties of the Water-Dispersible ZnS:Mn Nanocrystals Surface Capped by l-Aminoacid Ligands: Arginine, Cysteine, Histidine, and Methionine. Bull. Korean Chem. Soc. 2007, 28, 1091–1096. [Google Scholar]
- Jang, H.D.; Kim, S.K.; Kim, S.J. Effect of particle size and phase composition of titanium dioxide nanoparticles on the photocatalytic properties. J. Nanopart. Res. 2001, 3, 141–147. [Google Scholar] [CrossRef]
- Lin, Y.T.; Weng, C.H.; Chen, F.Y. Key operating parameters affecting photocatalytic activity of visible-light-induced C-doped TiO2 catalyst for ethylene oxidation. Chem. Eng. J. 2014, 248, 175–183. [Google Scholar] [CrossRef]
- Farkhani, S.M.; Valizadeh, A. Review: Three synthesis methods of CdX (X = Se, S or Te) quantum dots. IET Nanobiotechnol. 2014, 8, 59–76. [Google Scholar] [CrossRef] [PubMed]
- Wageh, S.; Shu-Man, L.; You, F.T.; Xu-Rong, X. Optical properties of strongly luminescing mercaptoacetic acid capped ZnS nanoparticles. J. Lumin. 2003, 102–103, 768–773. [Google Scholar] [CrossRef]
- Dukhin, A.S.; Parila, S. Measuring zeta potential of protein nano-particles using electroacoustics. Col. Surf. B 2014, 121, 257–263. [Google Scholar] [CrossRef] [PubMed]
- Du, X.; Wang, X.; You, S.; Wang, Q.; Gong, X. A case study of aggregation behaviors of titanium dioxide nanoparticles in the presence of dodecylbenzene sulfonate in natural water. J. Environ. Sci. 2015, 36, 84–92. [Google Scholar]
- Scuderi, V.; Impellizzeri, G.; Romano, L.; Scuderi, M.; Nicotra, G.; Bergum, K.; Irrera, A.; Svensson, B.G.; Privitera, V. TiO2-coated nanostructures for dye photo-degradation in water. Nanoscale Res. Lett. 2014, 9, 458–465. [Google Scholar] [CrossRef] [PubMed]
- Molea, A.; Popescu, V.; Rowson, N.A.; Dinescu, A.M. Influence of pH on the formulation of TiO2 nano-crystalline powders with high photocatalytic activity. Powder Technol. 2014, 253, 22–28. [Google Scholar] [CrossRef]
- Bhargava, R.N.; Gallagher, D.; Hong, X.; Nurmikko, A. Optical properties of manganese-doped nanocrystals of ZnS. Phys. Rev. Lett. 1994, 72, 416–426. [Google Scholar] [CrossRef] [PubMed]
- Kushida, T.; Tanaka, Y.; Oka, Y. Excited-state absorption spectra of ZnS:Mn Excited state absorption spectra of ZnS:Mn. Solid. State Commun. 1974, 14, 617–620. [Google Scholar] [CrossRef]
- Yu, I.; Isobe, T.; Senna, M. Optical properties and characteristics of ZnS nano-particles with homogeneous Mn distribution. J. Phys. Chem. Solids 1996, 57, 373–379. [Google Scholar] [CrossRef]
- Karar, N.; Singh, F.; Mehta, B.R. Structure and photoluminescence studies on ZnS:Mn nanoparticles. J. Appl. Phys. 2004, 95, 656–660. [Google Scholar] [CrossRef]
- Geyer, S.M.; Scherer, J.M.; Jaworski, F.B.; Bawendi, M.G. Multispectral imaging via luminescent down-shifting with colloidal quantum dots. Opt. Mater. Exp. 2013, 3, 1167–1175. [Google Scholar] [CrossRef]
- Bereus, V.V.; Heyes, C.D.; Nienhaus, U. Quenching of CdSe-ZnS core-shell quantum dot luminescence by water-soluble thiolate ligands. J. Phys. Chem. C 2007, 111, 18589–18594. [Google Scholar] [CrossRef]
- Williams, A.T.R.; Winfield, S.A.; Miller, J.N. Relative fluorescence quantum yields using a computer-controlled luminescence spectrometer. Analyst 1983, 108, 1067–1071. [Google Scholar] [CrossRef]
- Chizhik, A.I.; Gregore, I.; Enderlein, J. Quantum Yield Measurement in a Multicolor Chromophore Solution Using a Nanocavity. Nano Lett. 2013, 13, 1348–1351. [Google Scholar] [CrossRef] [PubMed]
- Meech, S.R.; Philips, D. Photophysics of some common fluorescence standards. J. Photochem. 1983, 23, 193–217. [Google Scholar] [CrossRef]
- Hahn, T. International Tables for X-Ray Crystallography, Part III; The international union of crystallography: Chester, England, 1985; pp. 318–320. [Google Scholar]
- Jones, F.W. The measurements of particle size by the X-ray method. Proc. R. Soc. Lond. Ser. A 1938, 166, 16–43. [Google Scholar] [CrossRef]
- Monshi, A.; Foroughi, M.R.; Monshi, M.R. Modified Scherrer Equation to Estimate More Accurately Nano-Crystallite Size Using XRD. World J. Nano Sci. Eng. 2012, 2, 154–160. [Google Scholar] [CrossRef]
- Wu, Y.; Jin, S.; Ye, J.Y.; Wang, S.; Feng, Z.; Li, C. Charge-Sensitive Surface Optical Phonon in CdS Quantum Dots Studied by Resonant Raman Spectroscopy. J. Phys. Chem. C 2014, 118, 30269–30273. [Google Scholar] [CrossRef]
- Kim, J.E.; Hwang, C.S.; Yoon, S. Synthesis and Surface Characterization by Raman Spectroscopy of Water-Dispersible ZnS:Mn Nanocrystals Capped with Mercaptoacetic Acid. Bull. Korean Chem. Soc. 2008, 29, 1247–1249. [Google Scholar]
- Nakamoto, K. Infrared and Raman Spectra of Inorganic and Coordination Compounds, 5th ed.; John Wiley & Son: New York, NY, USA, 1997; pp. 350–358. [Google Scholar]
- Ishiguro, S.; Umebayash, Y.; Kanzaki, R. Characterization of metal ions in coordinating solvent mixtures by means of Raman spectroscopy. Anal. Sci. 2004, 20, 415–421. [Google Scholar] [CrossRef] [PubMed]
- Milekhin, A.G.; Sveshnikova, L.L.; Duda, T.A.; Surovtsev, N.V.; Adichchev, S.V.; Azhniuk, Y.M.; Himcinschi, C.; Kehr, M.; Zahn, D.R.T. Resonance effects in Raman scattering of quantum dots formed by the Langmuir-Blodgett method. J. Phys. Conf. Ser. 2010, 245. [Google Scholar] [CrossRef]
- Xu, R. Particle Characterization: Light Scattering Methods; Kluwar Academic Publishers: Dordrecht, The Netherlands, 2001; pp. 289–340. [Google Scholar]
- Berne, B.J.; Pecora, R. Dynamic Light Scattering; Dover Publications Inc.: New York, NY, USA, 2000; pp. 223–276. [Google Scholar]
- Park, S.H.; Song, B.; Kong, H.Y.; Byun, J.; Hwang, C.S. Biological Toxicities and Aggregation Effects of l-Glycine and l-Alanine Capped ZnS:Mn Nanocrystals in Aqueous Solution. Bull. Korean Chem. Soc. 2014, 35, 1169–1176. [Google Scholar] [CrossRef]
- El Badawy, A.M.; Luxton, T.P.; Silva, R.G.; Scheckel, K.G.; Suidan, M.T.; Tolymat, T.M. Impact of Environmental Conditions (pH, Ionic Strength, and Electrolyte Type) on the Surface Charge and Aggregation of Silver Nanoparticles Suspensions. Environ. Sci. Technol. 2010, 44, 1260–1266. [Google Scholar] [CrossRef] [PubMed]
- Wang, D.; Tejerina, B.; Lagzi, I.; Kowalczyk, B.; Grzybowski, B.A. Bridging Interactions and Selective Nanoparticle Aggregation Mediated by Monovalent Cations. ACS Nano 2011, 5, 530–536. [Google Scholar] [CrossRef] [PubMed]
- Mardani, H.R.; Forouzani, M.; Ziari, M.; Biparva, P. Visible light photo-degradation of methylene blue over Fe or Cu promoted ZnO nanoparticles. Spectrochim. Acta A 2015, 141, 27–33. [Google Scholar] [CrossRef] [PubMed]
- Praus, P.; Svoboda, L.; Tokarsky, J.; Hospodkova, A.; Klemn, V. Core/shell CdS/ZnS nanoparticles: Molecular modelling and characterization by photocatalytic decomposition of Methylene Blue. Appl. Surf. Sci. 2014, 292, 813–822. [Google Scholar] [CrossRef]
- Soltani, N.; Saion, E.; Hussein, M.Z.; Erfani, M.; Abedini, A.; Bahmanrokh, G.; Navasery, M.; Vaziri, P. Visible Light-Induced Degradation of Methylene Blue in the Presence of Photocatalytic ZnS and CdS Nanoparticles. Int. J. Mol. Sci. 2012, 13, 12242–12258. [Google Scholar] [CrossRef] [PubMed]
- Houas, A.; Lchheb, H.; Ksibi, M.; Elaloui, E.; Guillard, C.; Herrmann, J.-M. Photocatalytic degradation pathway of methylene blue in water. Appl. Catal. B Environ. 2001, 31, 145–157. [Google Scholar] [CrossRef]
- Guillard, C.; Lanchheb, H.; Houas, A.; Ksibi, M.; Elaloui, E.; Herrmann, J.-M. Influence of chemical structure of dyes, of pH and of inorganic salts on their photocatalytic degradation by TiO2 comparison of the efficiency of powder and supported TiO2. J. Photochem. Photobiol. A 2003, 158, 27–36. [Google Scholar] [CrossRef]
- Liqiang, J.; Xiaojun, S.; Jing, S.; Weimin, C.; Zili, X.; Yaoguo, D.; Honggang, F. Review of surface photovoltage spectra of nano-sized semiconductor and its applications in heterogeneous photocatalysis. Sol. Energy Mater. Sol. Cells 2003, 79, 133–151. [Google Scholar] [CrossRef]
- Xu, N.; Shi, Z.; Fan, Y.; Dong, J.; Shi, J.; Hu, M.Z.-C. Effects of Particle Size of TiO2 on Photocatalytic Degradation of Methylene Blue in Aqueous Suspensions. Ind. Eng. Chem. Res. 1999, 38, 373–379. [Google Scholar] [CrossRef]
- Wold, A. Photocatalytic properties of titanium dioxide (TiO2). Chem. Mater. 1993, 5, 280–283. [Google Scholar] [CrossRef]
- Zhang, H.; Banfield, J. Structural Characteristics and Mechanical and Thermodynamic Properties of Nanocrystalline TiO2. Chem. Rev. 2014, 114, 9613–9644. [Google Scholar] [CrossRef] [PubMed]
- Jimmy, C.Y.; Yu, J.; Ho, W.; Zhang, L. Preparation of highly photocatalytic active nano-sized TiO2 particles via ultrasonic irradiation. Chem. Commun. 2001, 19, 1942–1943. [Google Scholar]
- Park, H.; Park, Y.; Kim, W.; Choi, W. Surface modification of TiO2 photocatalyst for environmental applications. J. Photochem. Photobiol. C 2013, 15, 1–20. [Google Scholar] [CrossRef]
- Sharma, M.; Jain, T.; Sing, S.; Pandey, O.P. Photocatalytic degradation of organic dyes under UV-Visible light using capped ZnS nanoparticles. Solar Energy 2012, 86, 626–633. [Google Scholar] [CrossRef]
- Rajabi, H.R.; Farsi, M. Effect of transition metal ion doping on the photocatalytic activity of ZnS quantum dots: Synthesis, characterization, and application for dye decolorization. J. Mol. Catal. A 2015, 399, 53–61. [Google Scholar] [CrossRef]
- Chauhan, R.; Kumar, A.; Chaudhary, R.P. Photocatalytic degradation of methylene blue with Cu doped ZnS nanoparticles. J. Lumin. 2014, 145, 6–12. [Google Scholar] [CrossRef]
- Chauhan, R.; Kumar, A.; Chaudhary, R.P. Photocatalytic degradation of methylene blue with Fe doped ZnS nanoparticles. Spectrochim. Acta A 2013, 113, 250–256. [Google Scholar] [CrossRef] [PubMed]
© 2015 by the authors; licensee MDPI, Basel, Switzerland. This article is an open access article distributed under the terms and conditions of the Creative Commons Attribution license (http://creativecommons.org/licenses/by/4.0/).
Share and Cite
Heo, J.; Hwang, C.-S. Surface Properties and Photocatalytic Activities of the Colloidal ZnS:Mn Nanocrystals Prepared at Various pH Conditions. Nanomaterials 2015, 5, 1955-1970. https://0-doi-org.brum.beds.ac.uk/10.3390/nano5041955
Heo J, Hwang C-S. Surface Properties and Photocatalytic Activities of the Colloidal ZnS:Mn Nanocrystals Prepared at Various pH Conditions. Nanomaterials. 2015; 5(4):1955-1970. https://0-doi-org.brum.beds.ac.uk/10.3390/nano5041955
Chicago/Turabian StyleHeo, Jungho, and Cheong-Soo Hwang. 2015. "Surface Properties and Photocatalytic Activities of the Colloidal ZnS:Mn Nanocrystals Prepared at Various pH Conditions" Nanomaterials 5, no. 4: 1955-1970. https://0-doi-org.brum.beds.ac.uk/10.3390/nano5041955