
Non-Cytotoxic Quantum Dot–Chitosan Nanogel Biosensing Probe for Potential Cancer Targeting Agent

 ,
,
Abstract
:
1. Introduction
2. Results and Discussion
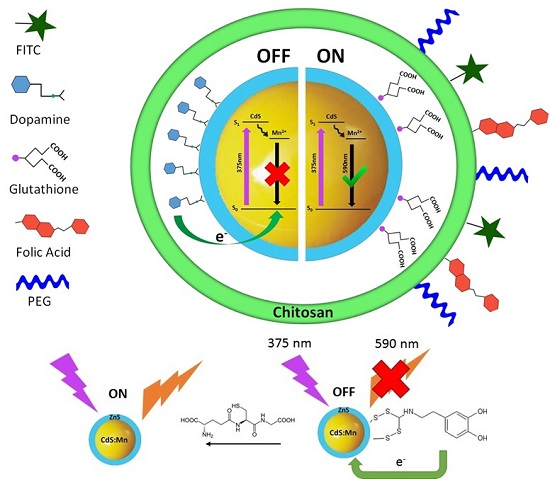
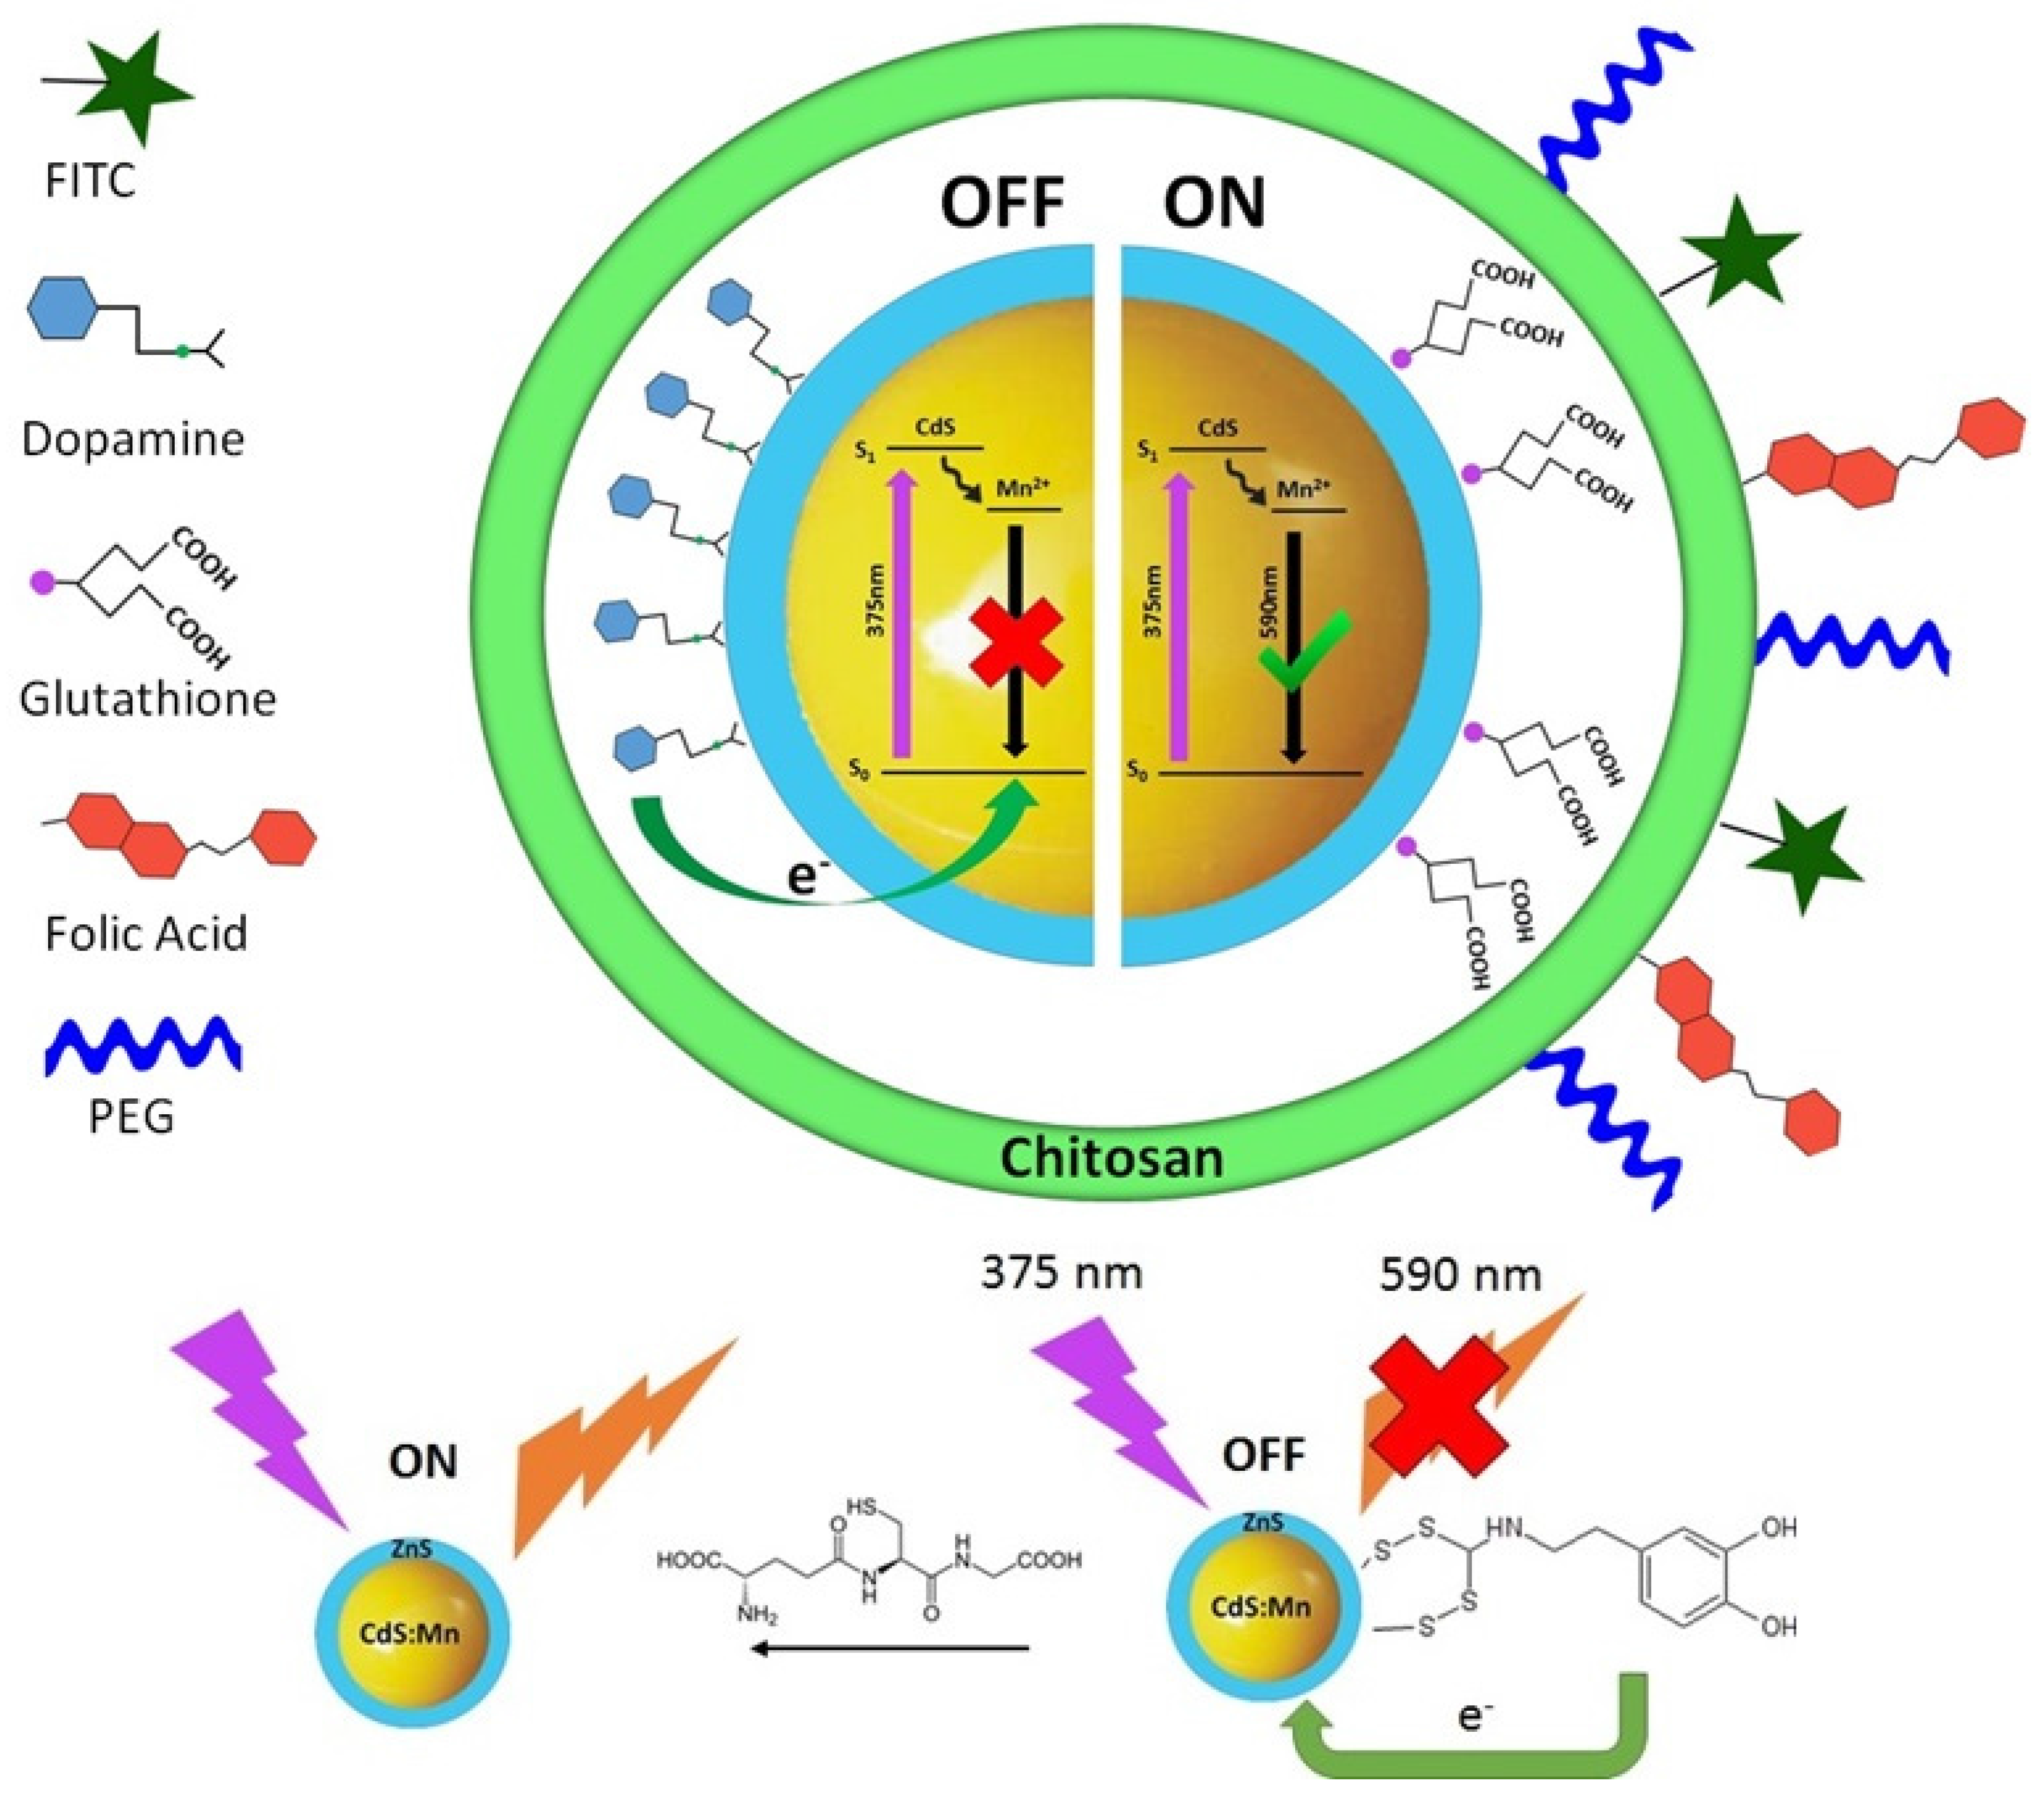
2.1. Probe Design

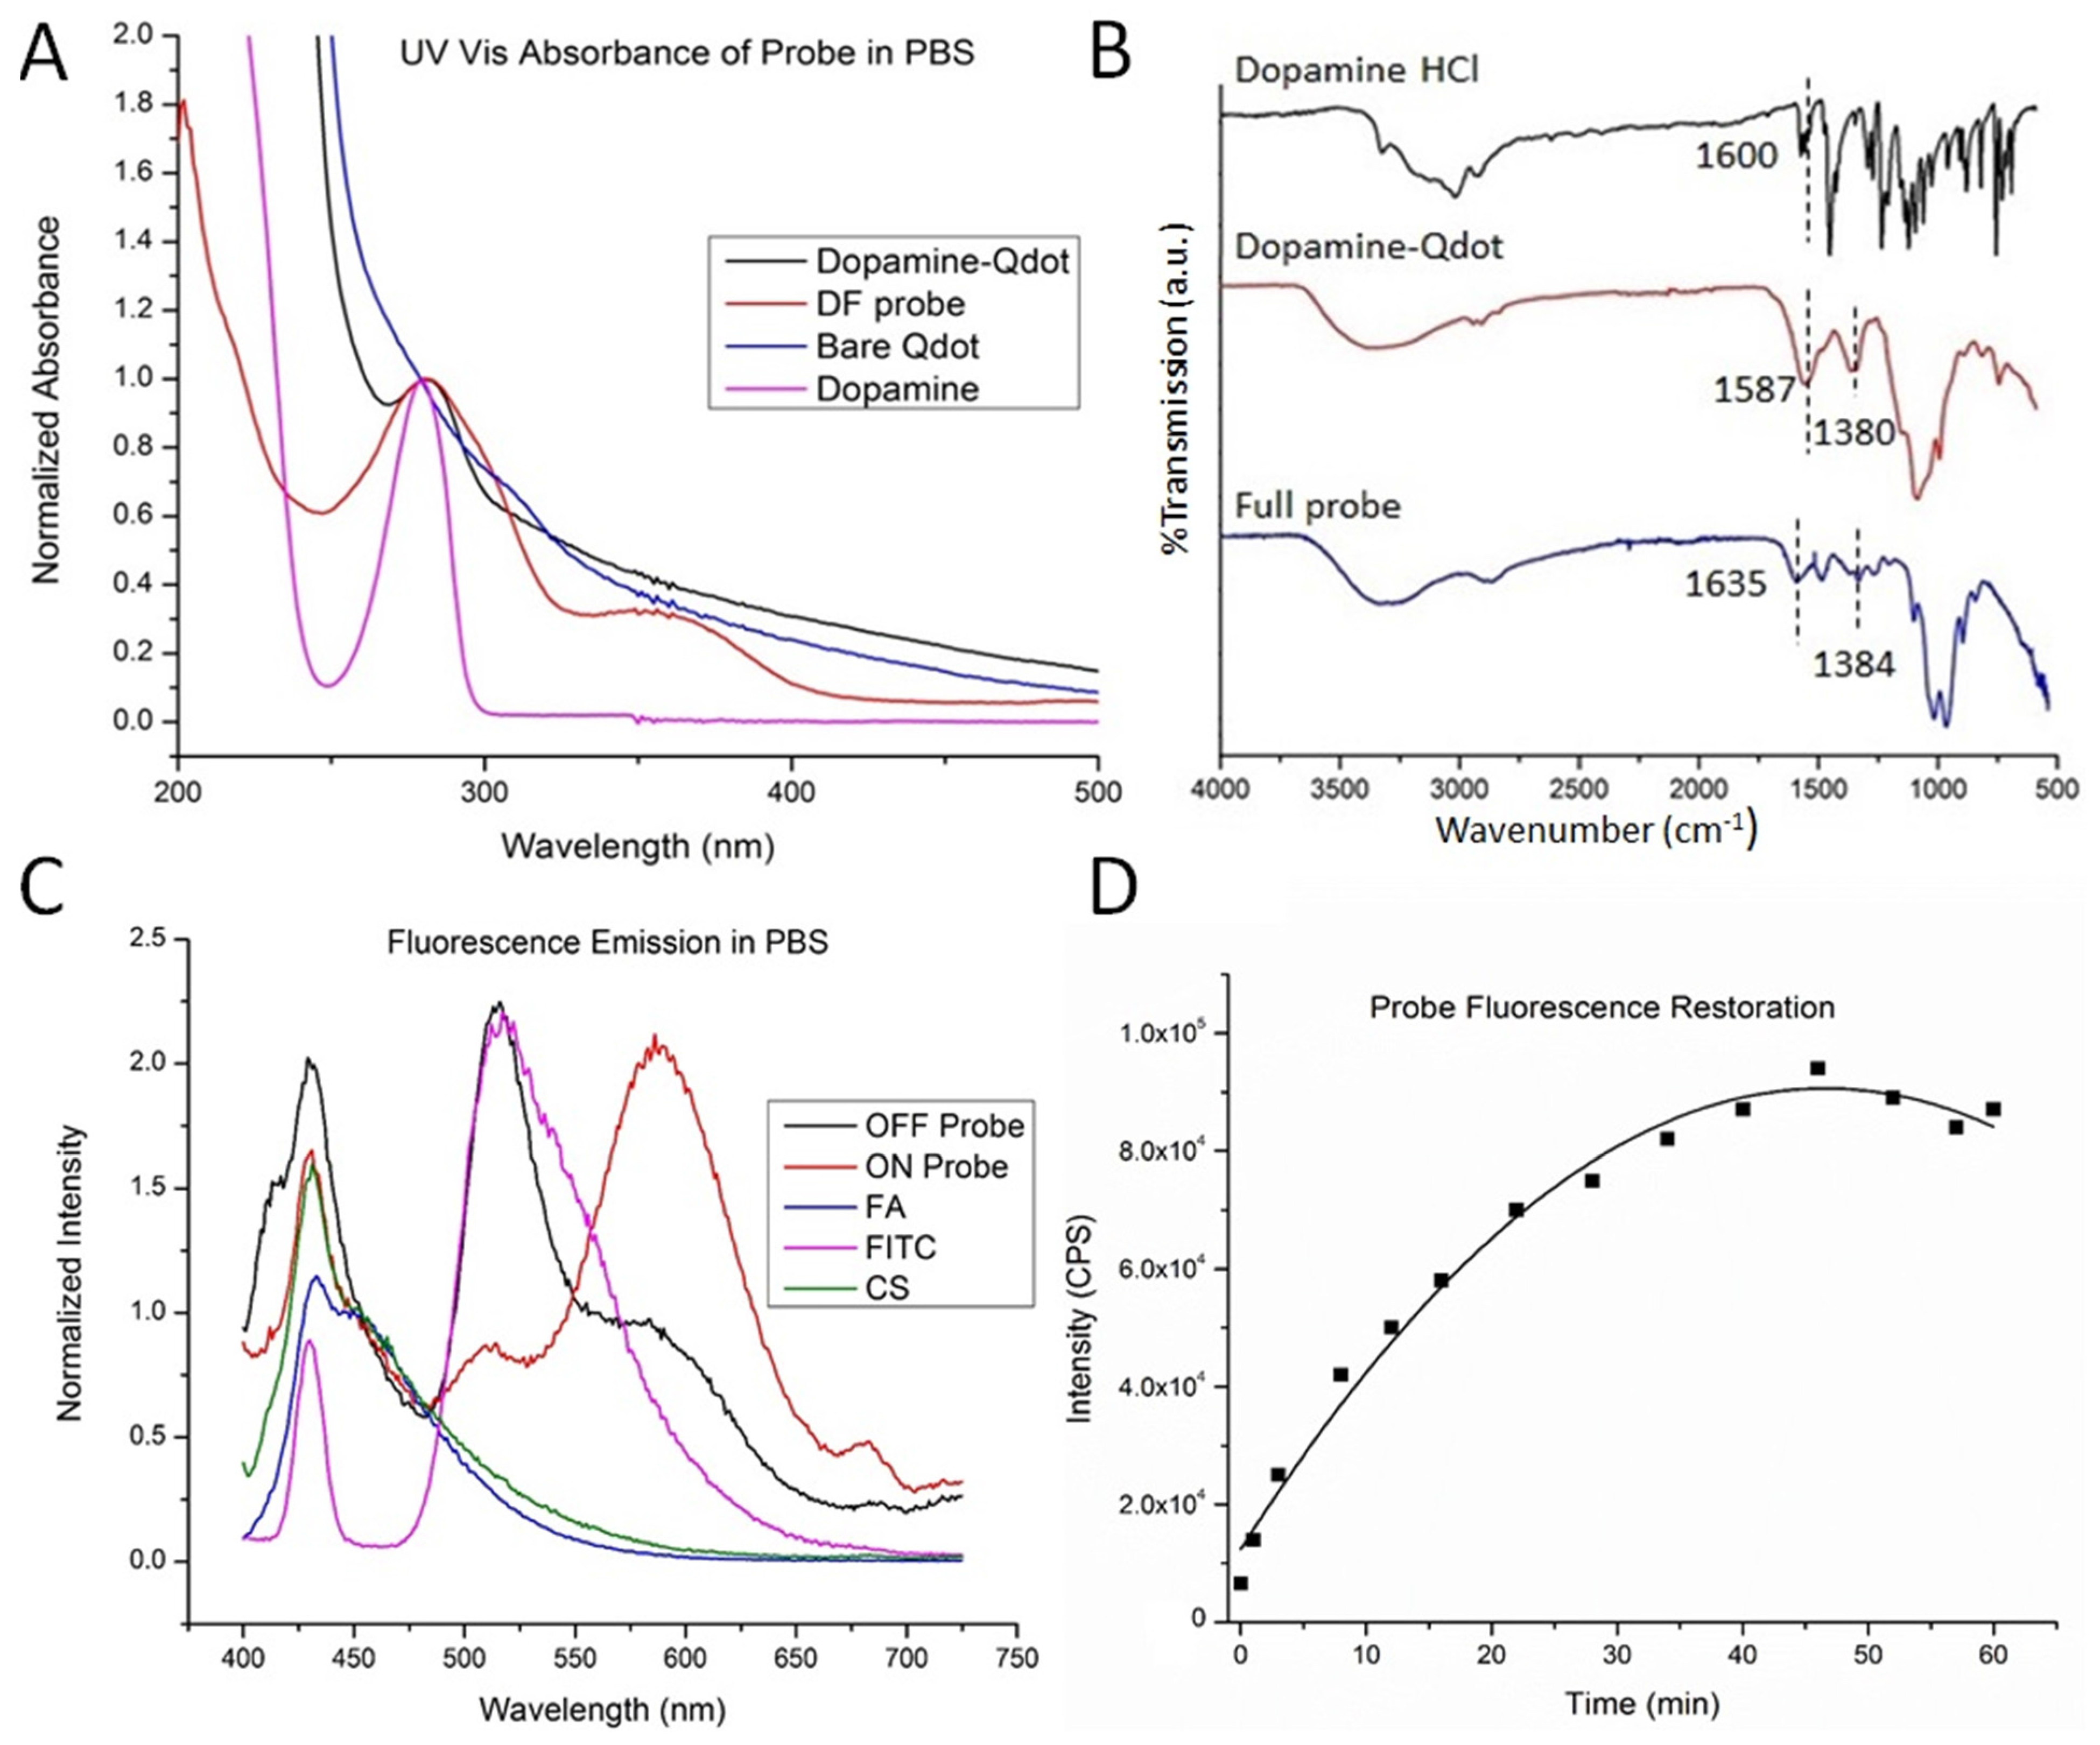
2.2. Infrared Spectroscopy

2.3. UV-Vis Spectroscopy
2.4. Fluorescence Spectroscopy
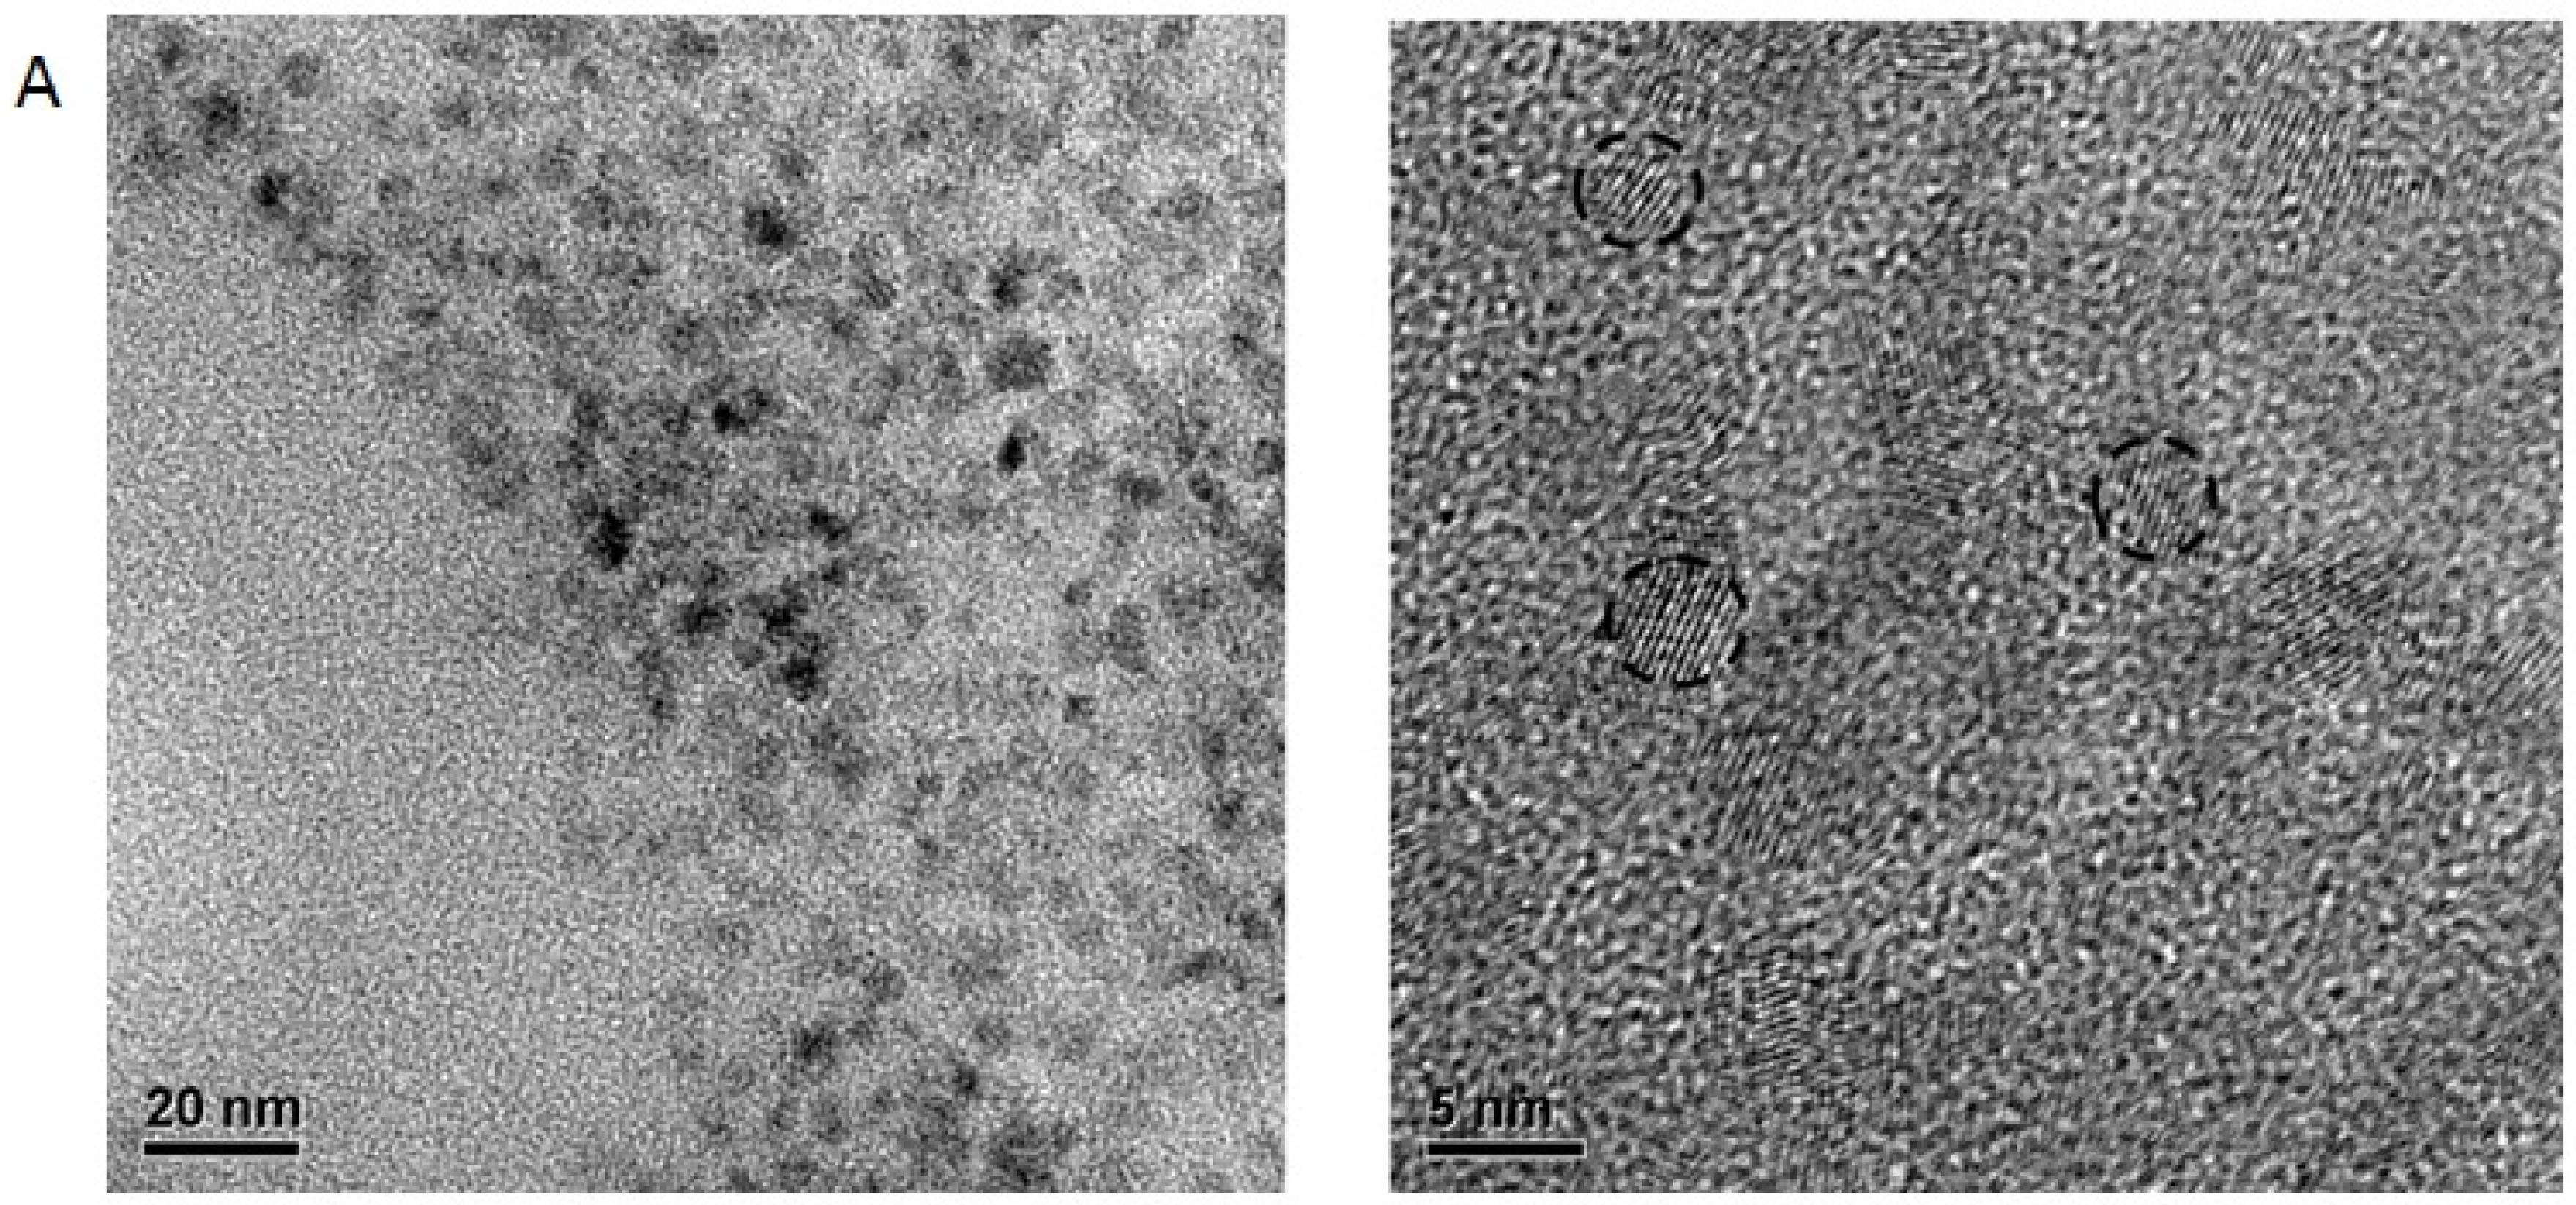
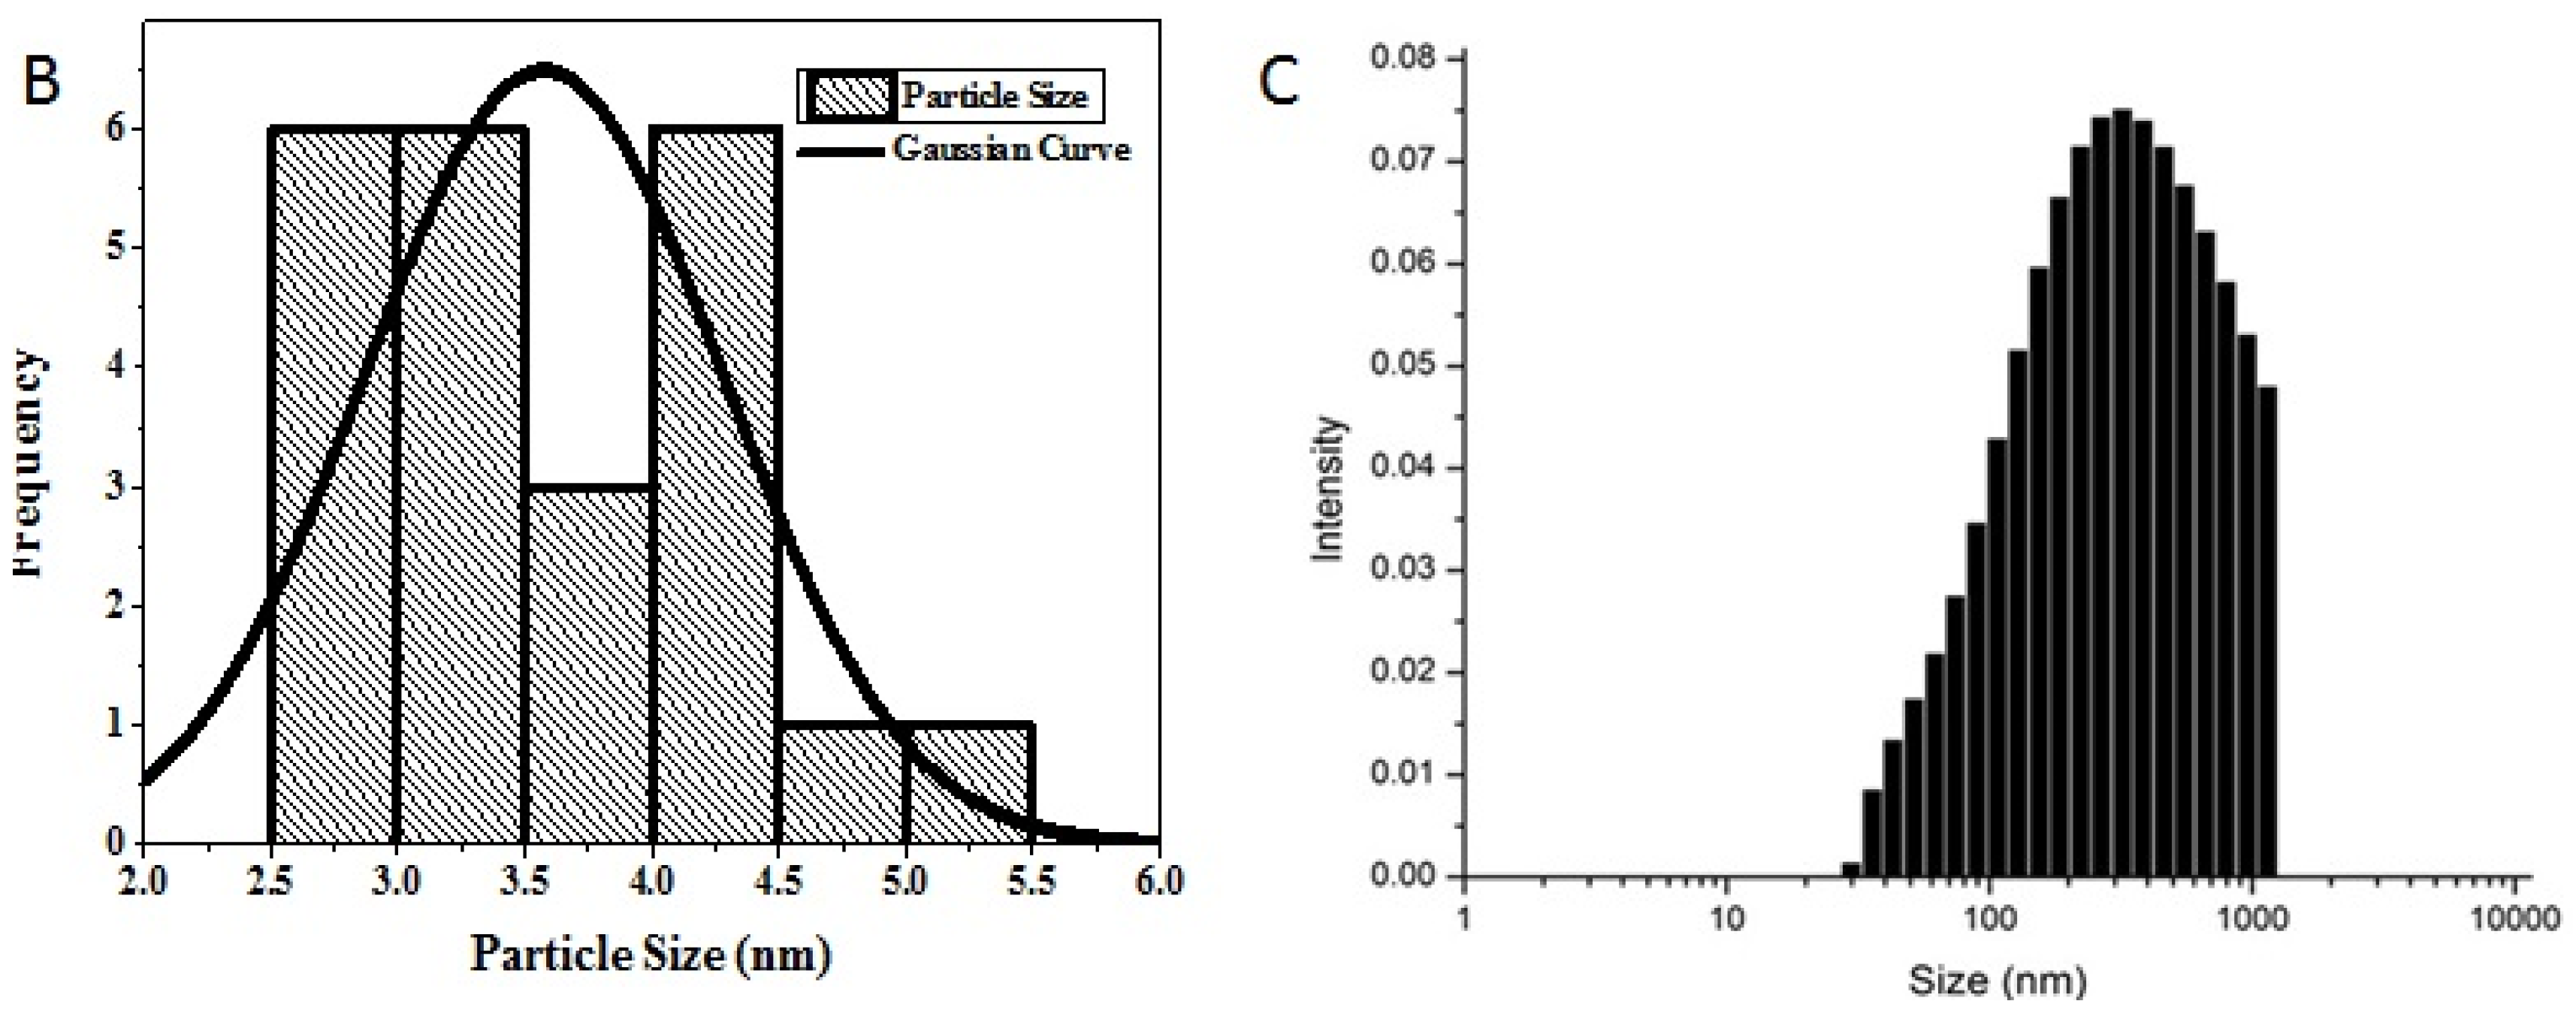
2.5. Electron Microscopy


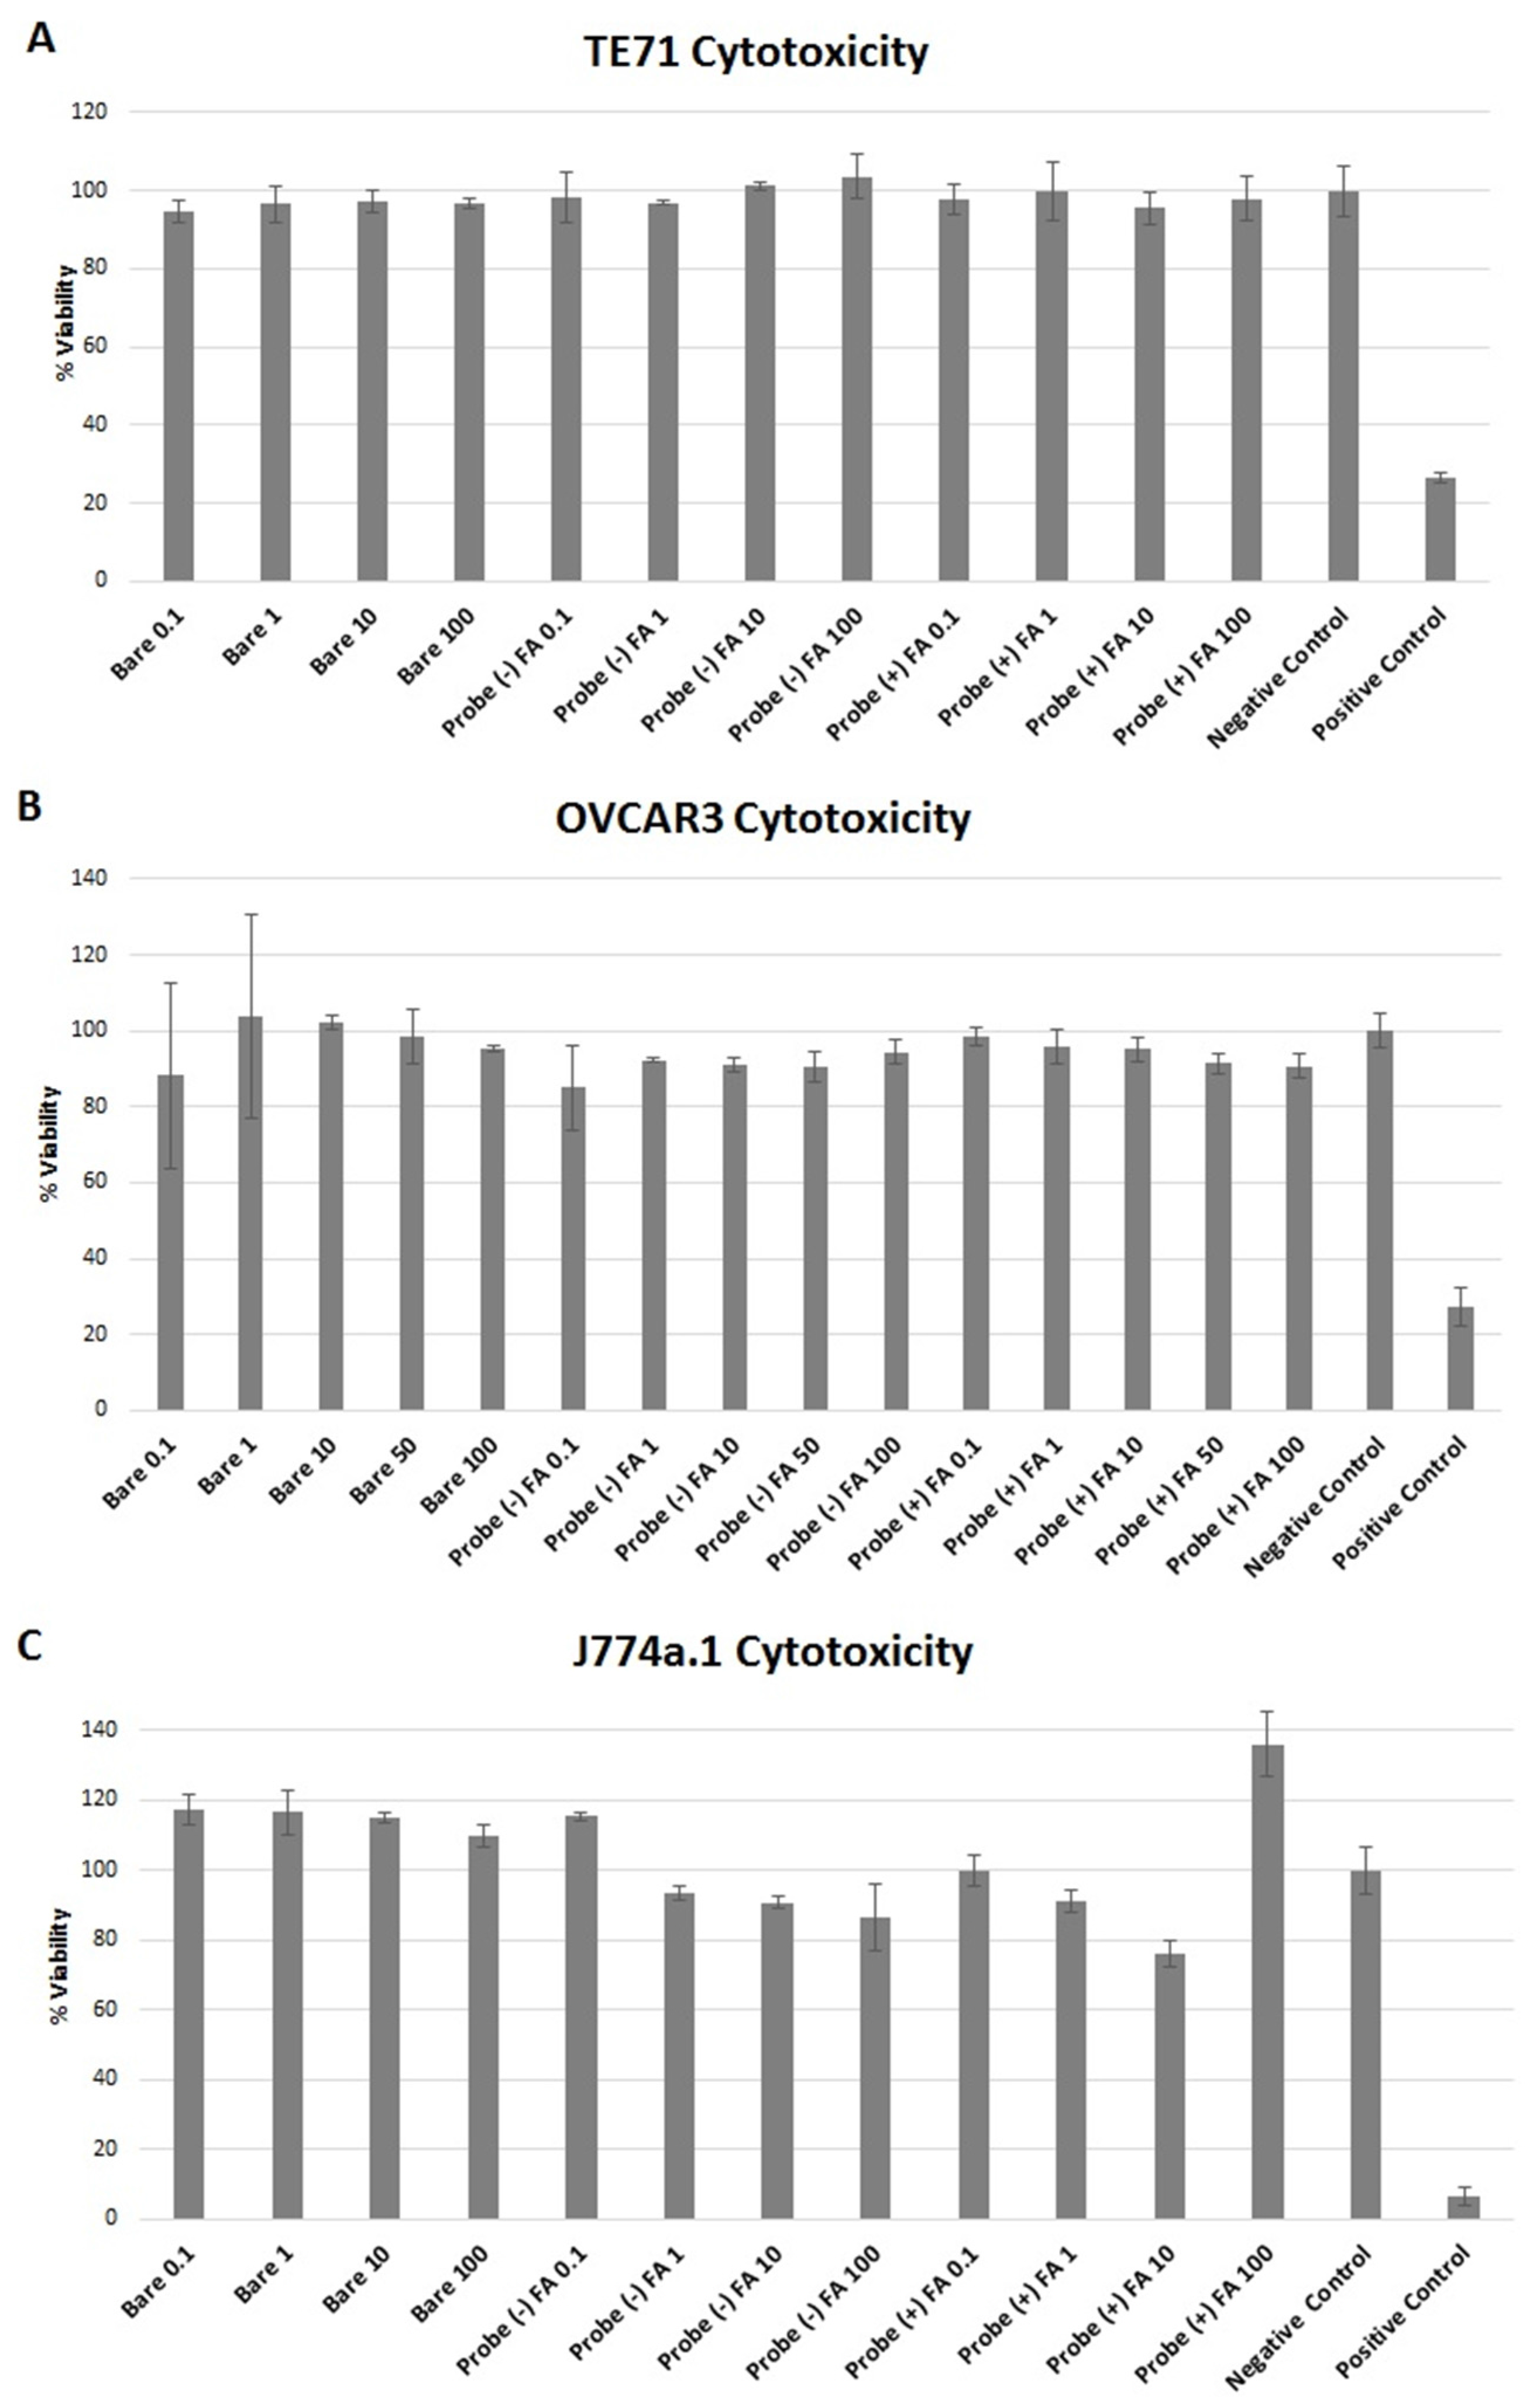
2.6. Cytotoxicity

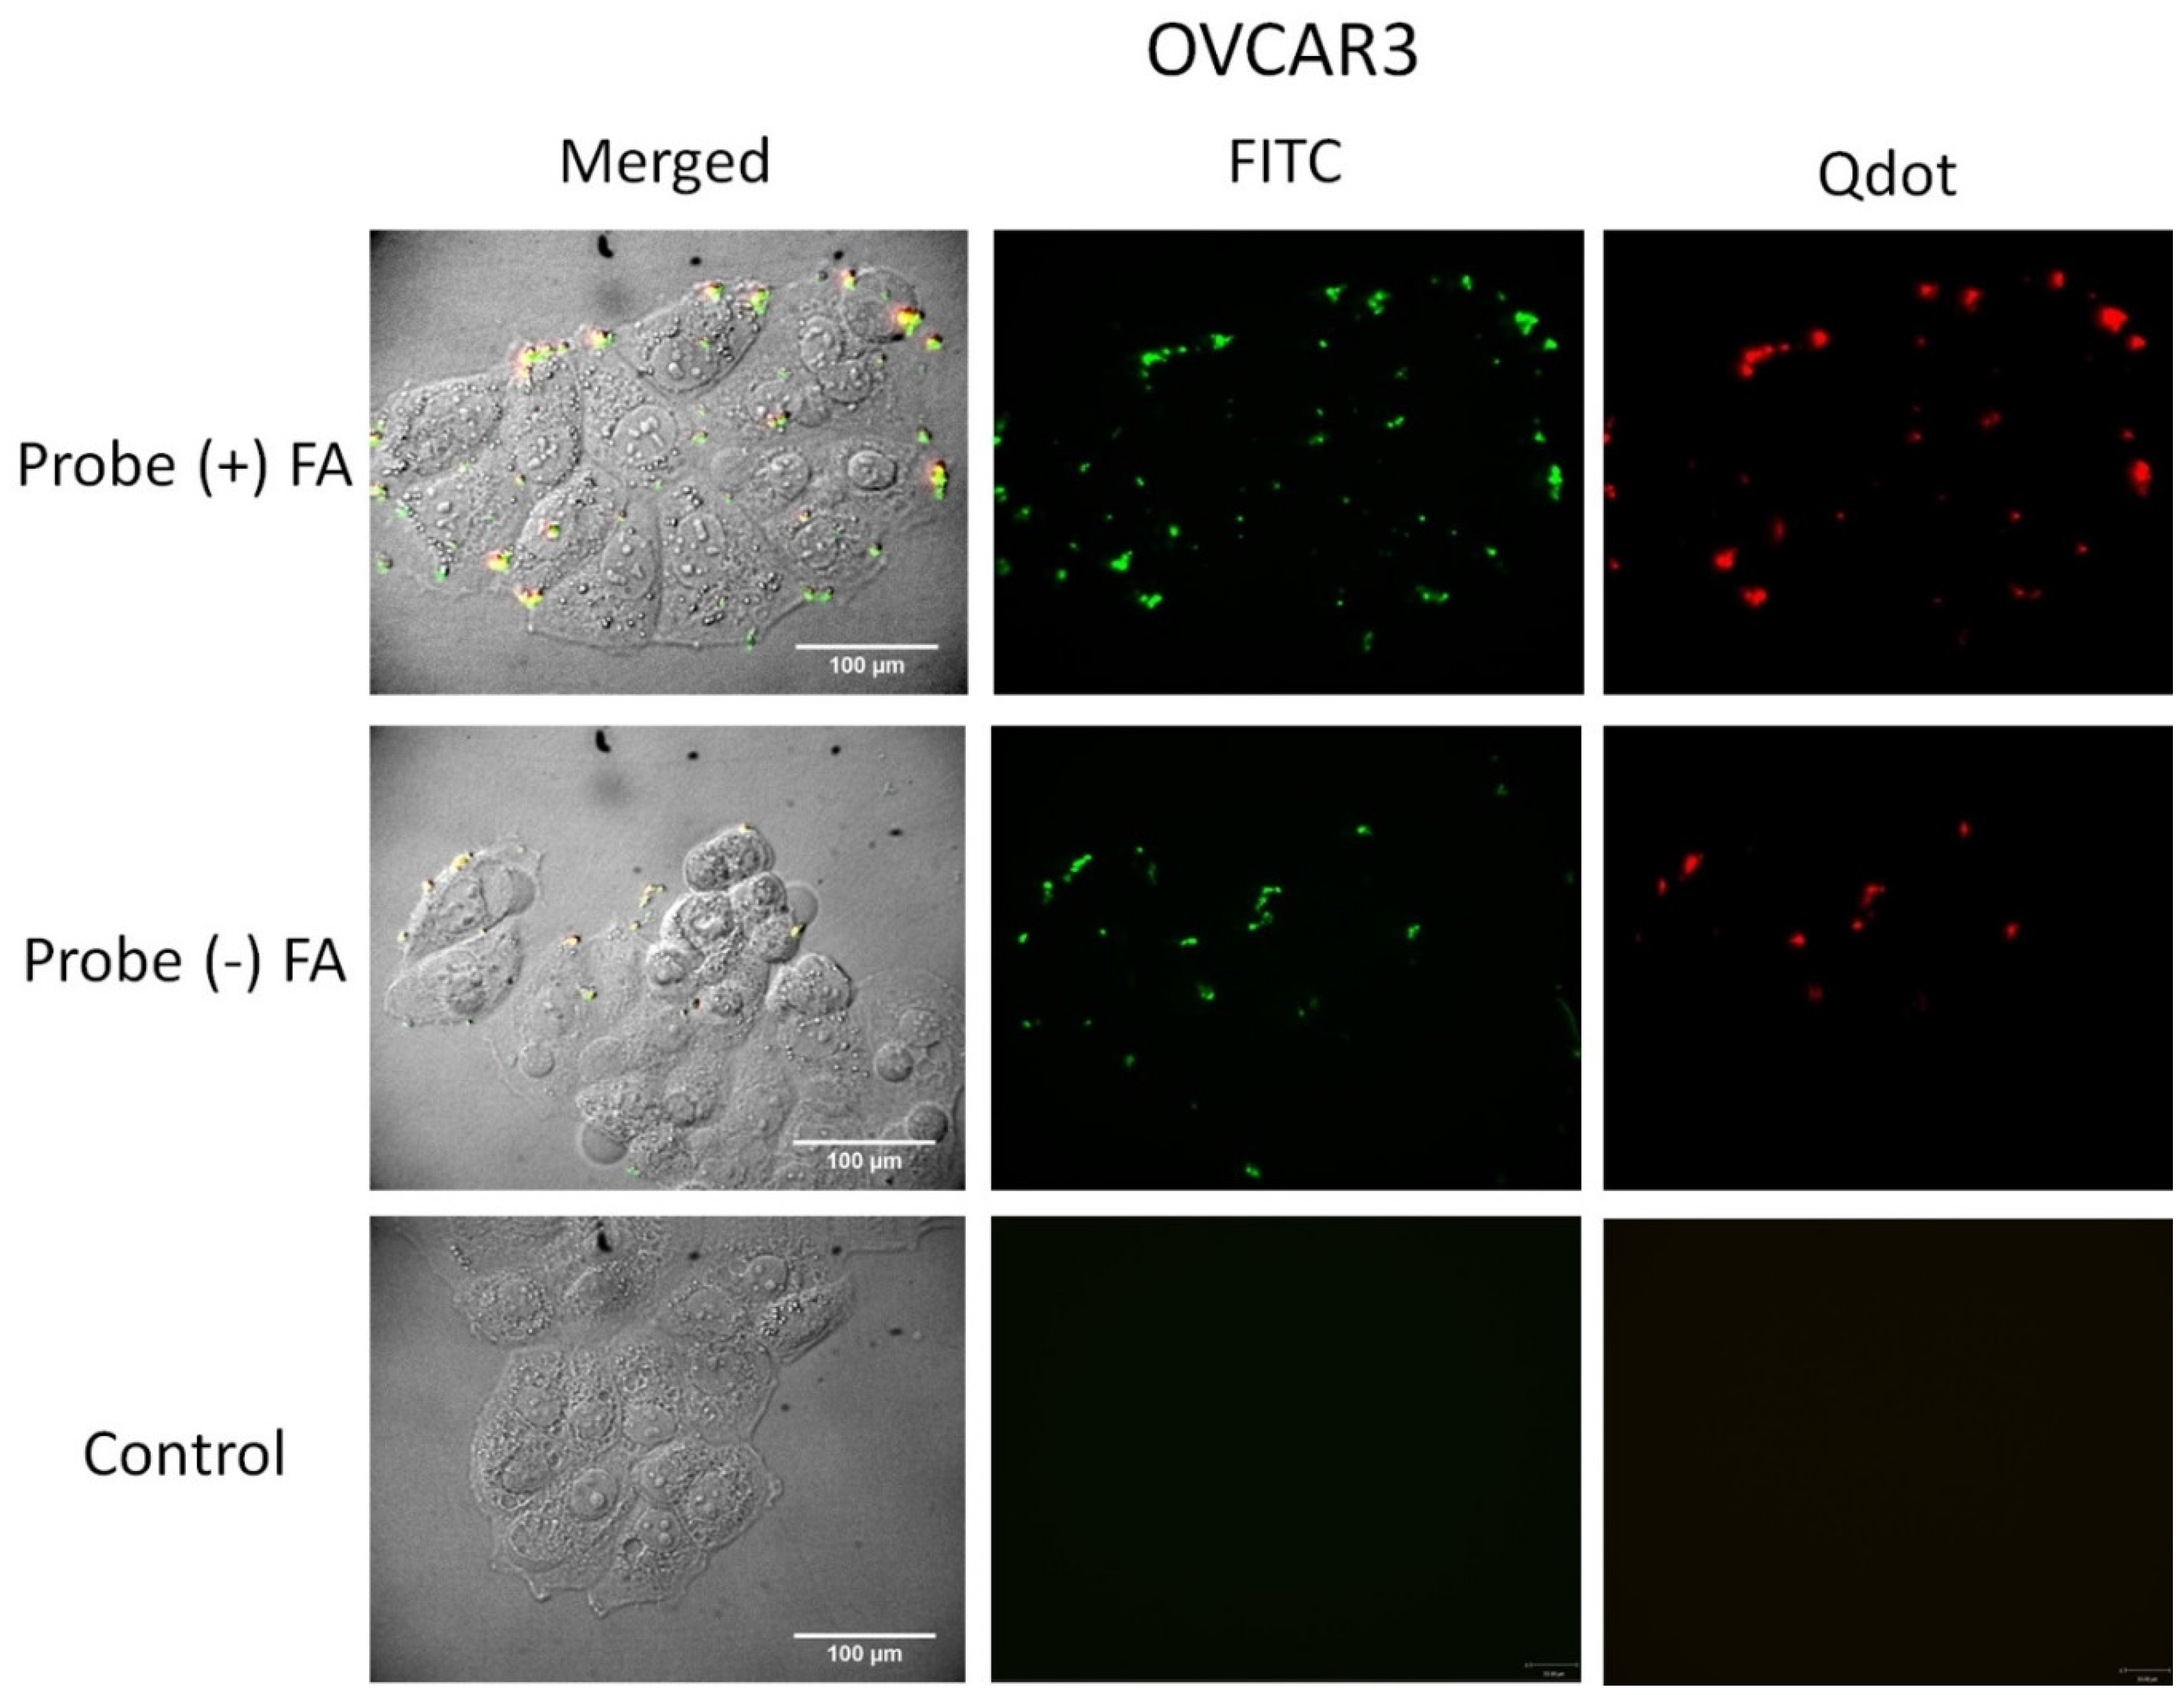
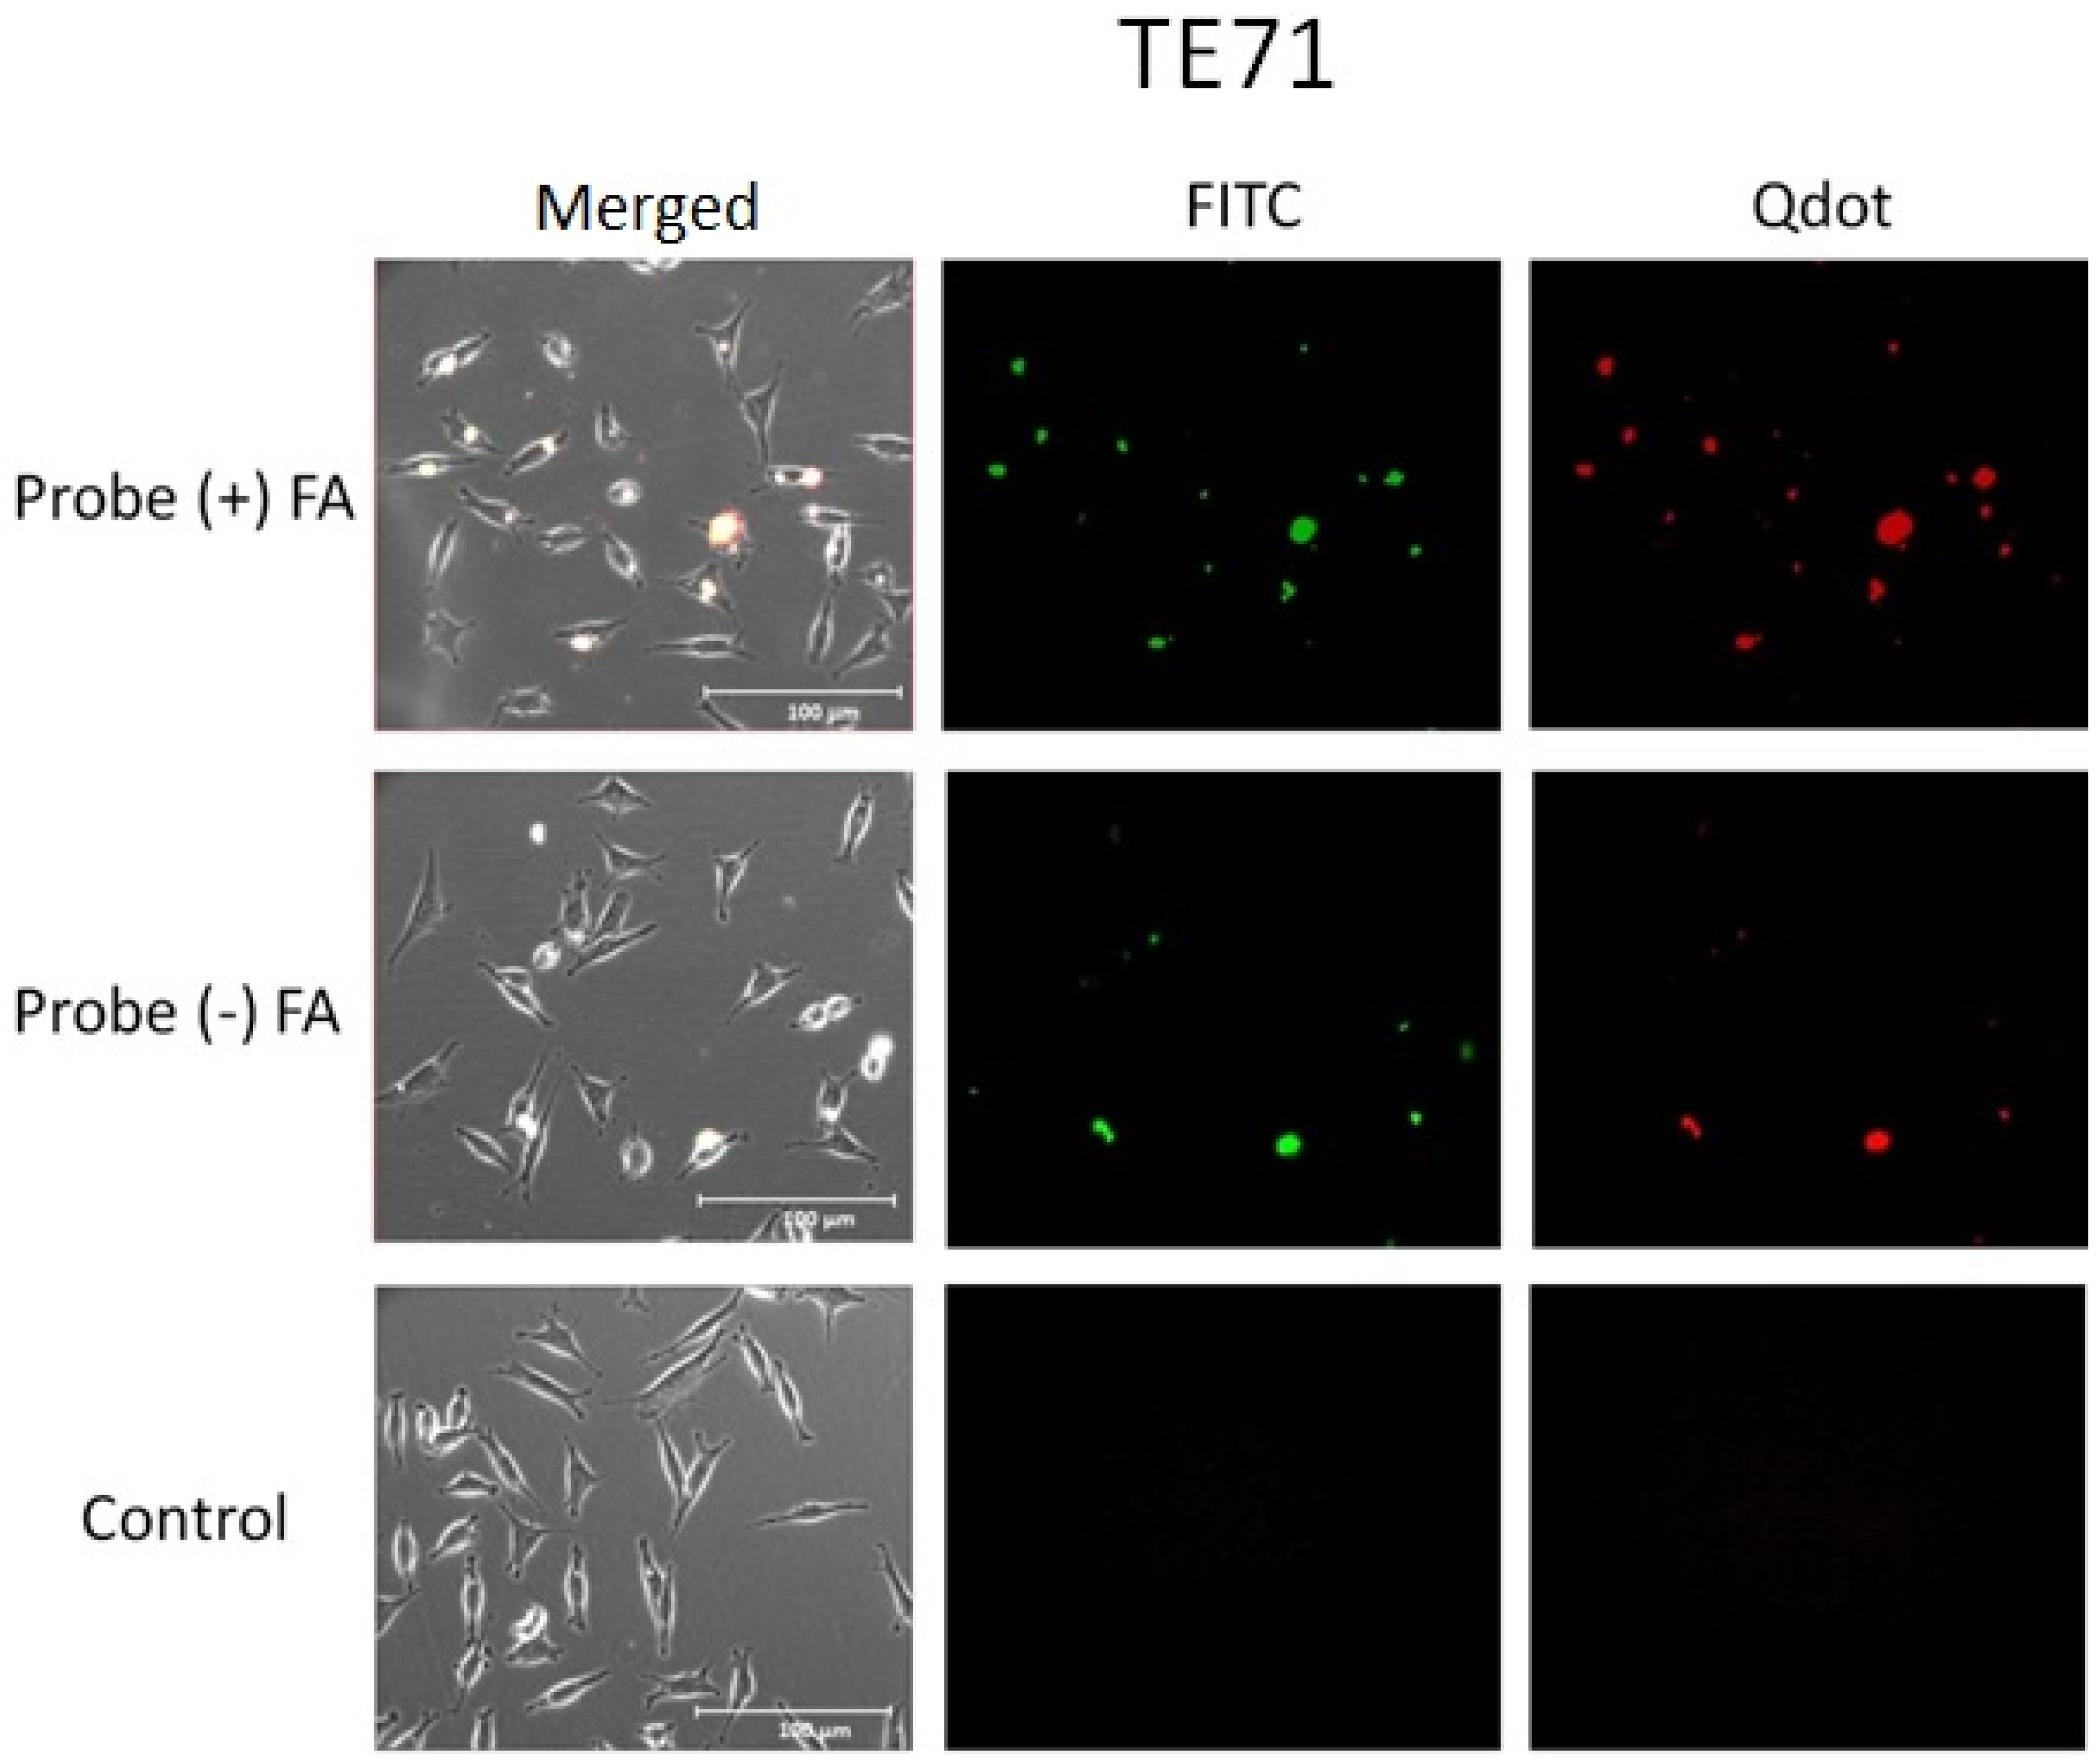
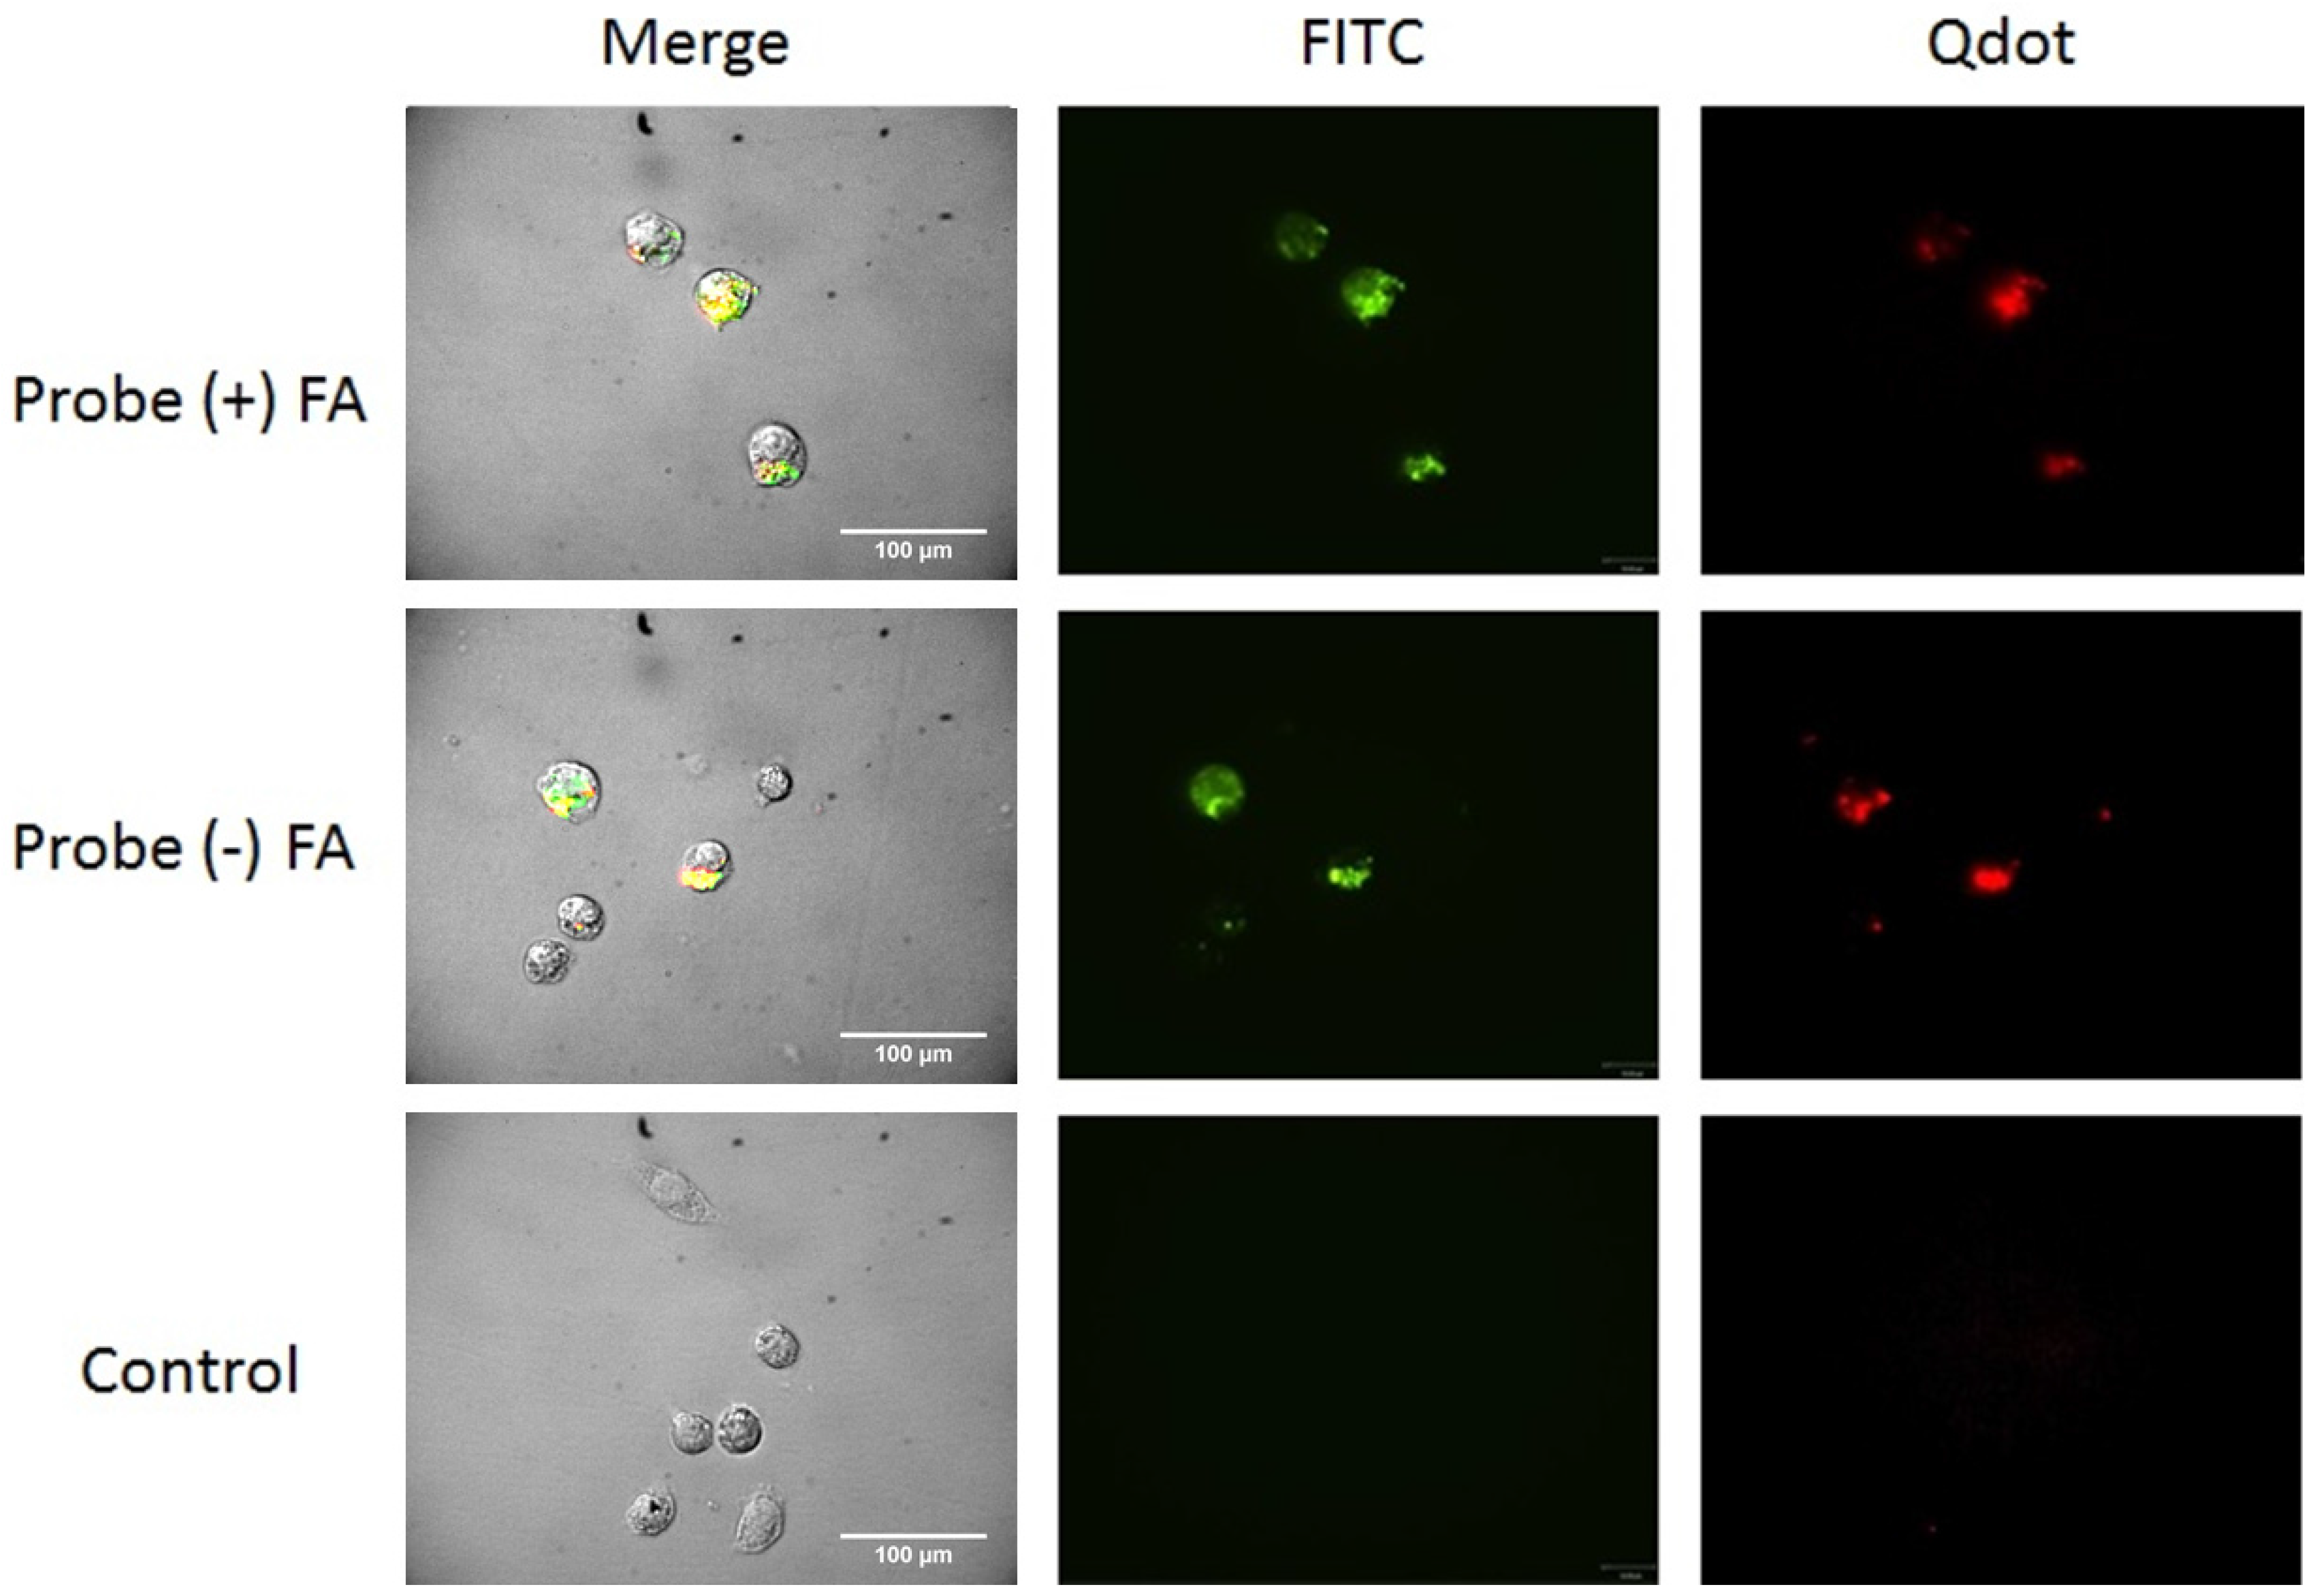
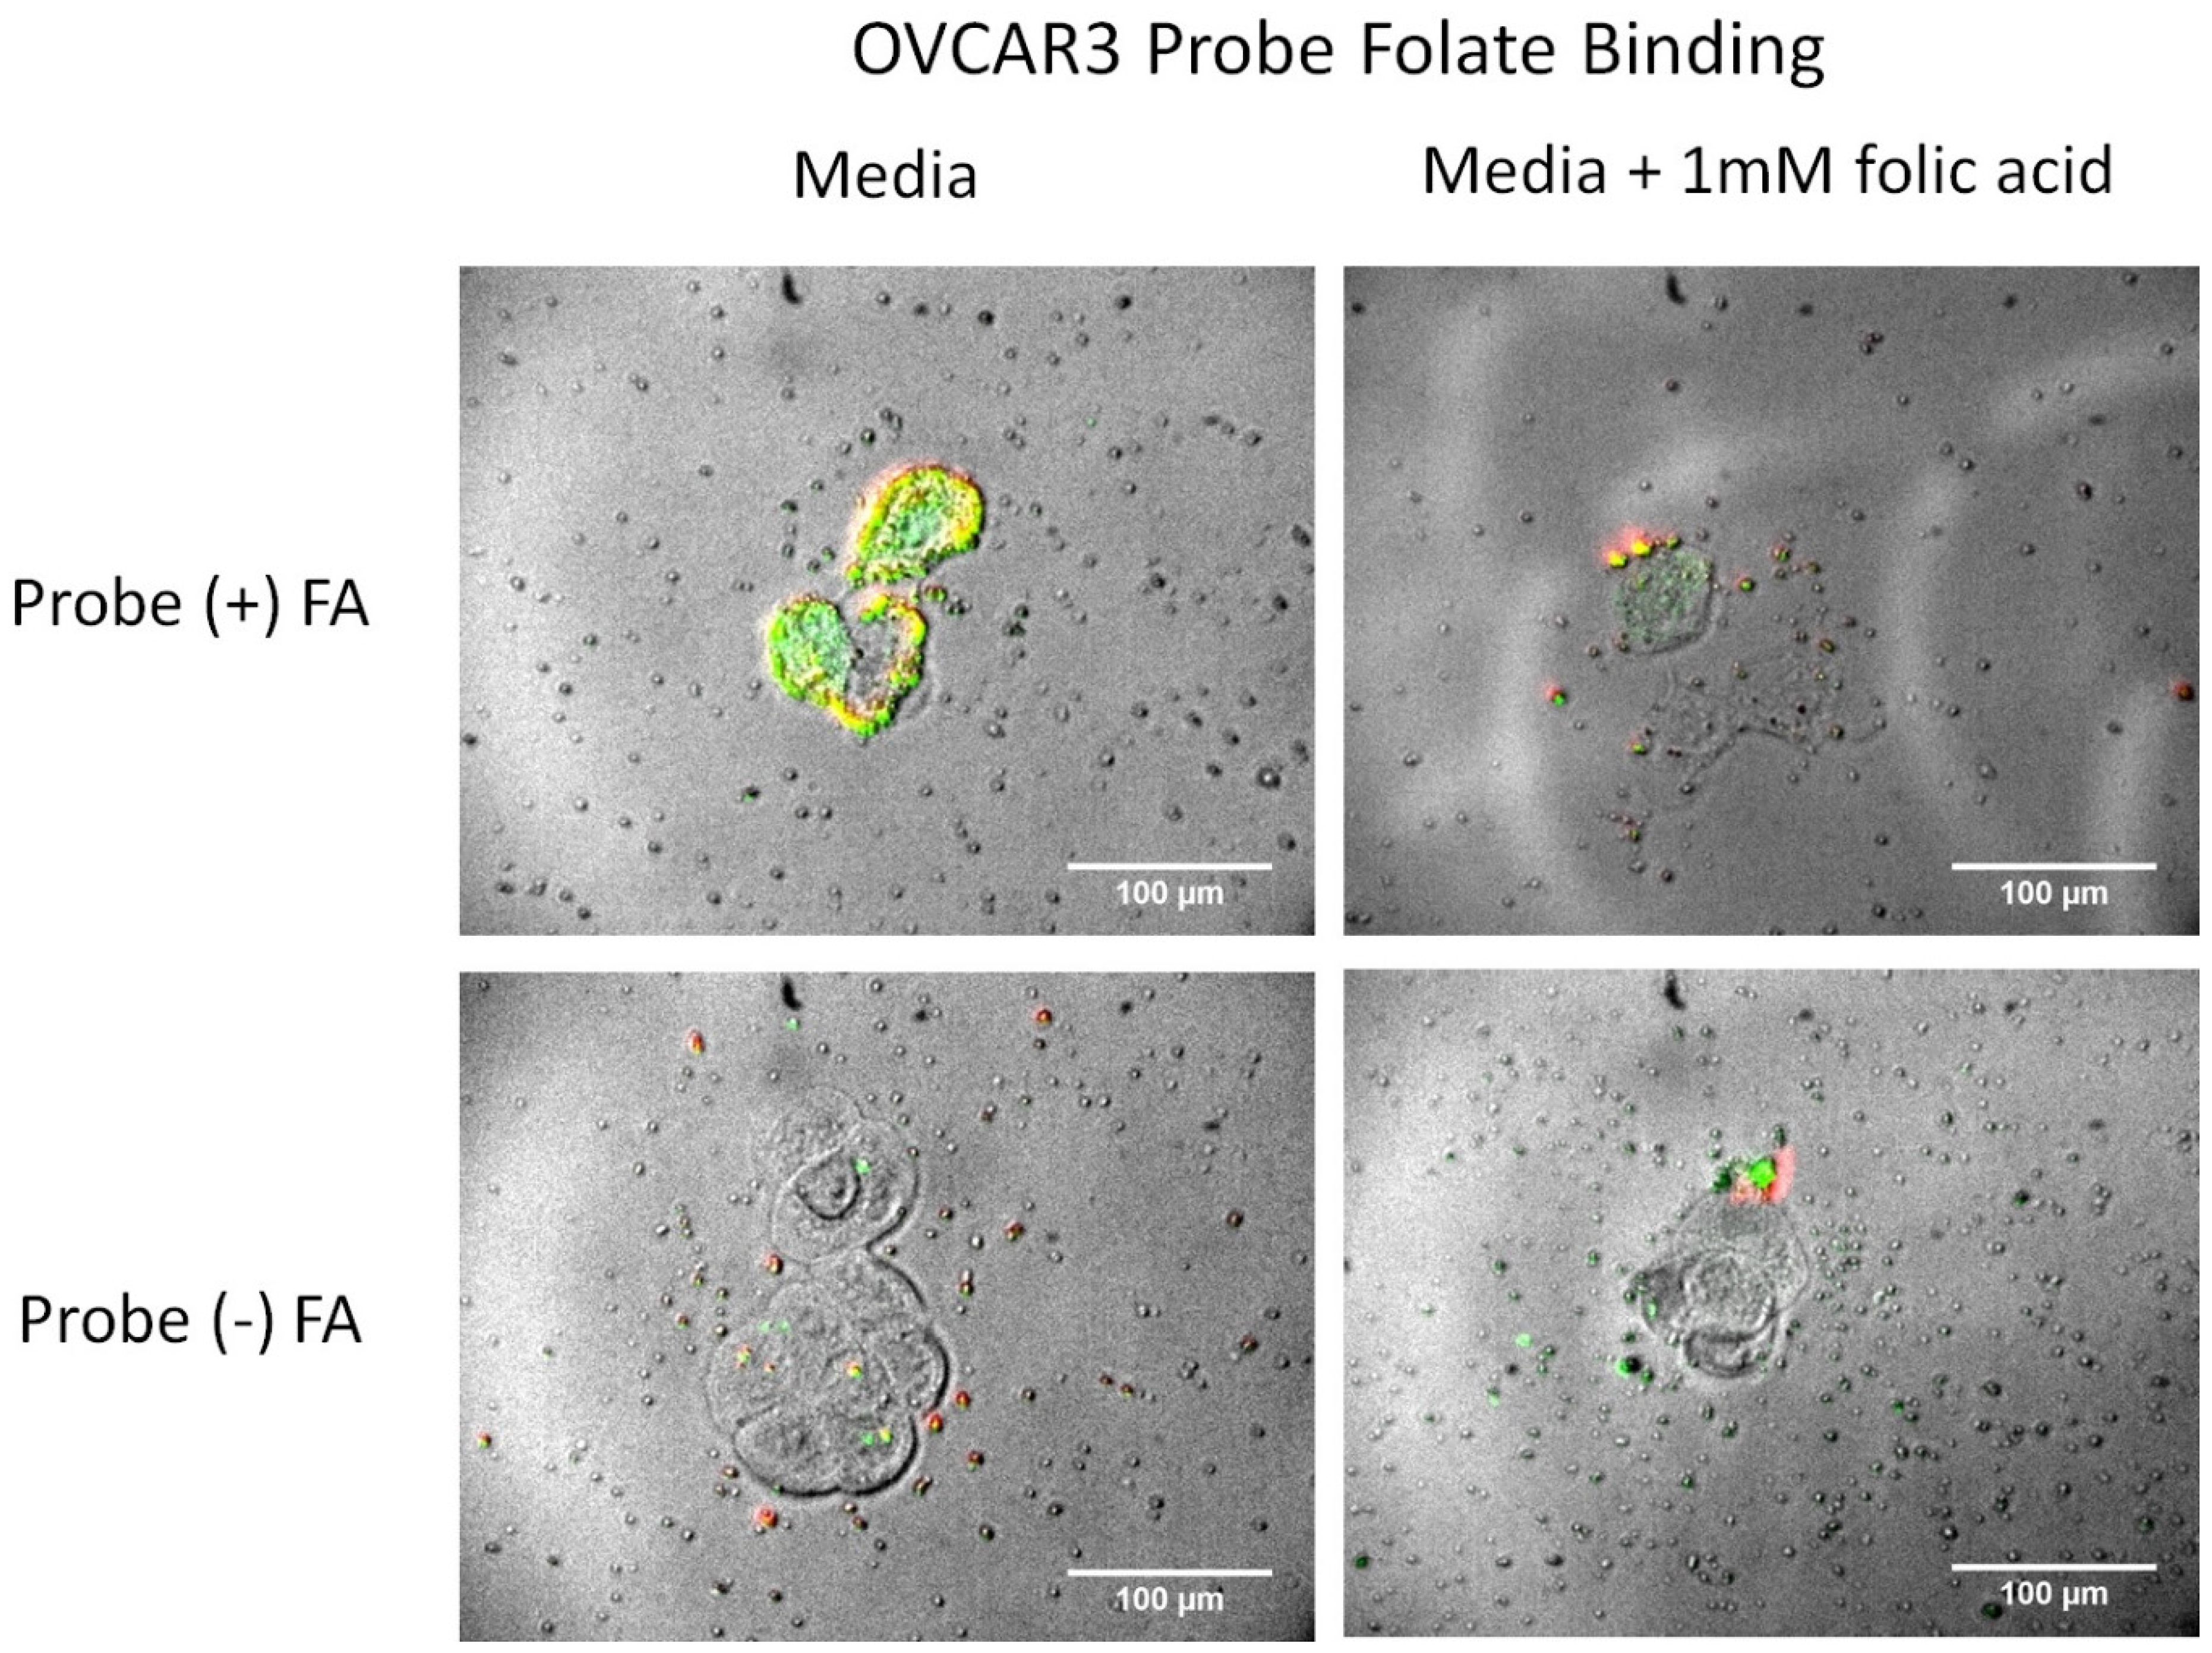
2.7. Cell Uptake


3. Experimental Section
3.1. Materials
3.2. Synthesis of Dopamine Coated CdS:Mn/ZnS Quantum Dots
3.3. Synthesis of Chitosan Coated Qdots
3.4. FTIR Experiments
3.5. Solution Spectroscopy
3.6. Scanning Electron Microscopy (SEM)
3.7. Dynamic Light Scattering (DLS)
3.8. Cytotoxicity
3.9. Cell Uptake Studies
3.10. Fluorescence Spectroscopy
3.11. Confocal Imaging
4. Conclusions
Supplementary Materials
Acknowledgments
Author Contributions
Conflicts of Interest
References
- Yong, K.-T. Mn-doped near-infrared quantum dots as multimodal targeted probes for pancreatic cancer imaging. Nanotechnology 2009, 20. [Google Scholar] [CrossRef] [PubMed]
- Vengala, P.; Dasari, A.; Yeruva, N. Quantum dots for drug delivery and therapy. Int. J. Pharm. Technol. 2012, 4, 2055–2074. [Google Scholar]
- Soltani, N.; Gharibshahi, E.; Saion, E. Band gap of cubic and hexagonal CdS quantum dots—Experimental and theoretical studies. Chalcogenide Lett. 2012, 9, 321–328. [Google Scholar]
- Sapsford, K.E.; Pons, T.; Medintz, I.L.; Mattoussi, H. Biosensing with luminescent semiconductor quantum dots. Sensors 2006, 6, 925–953. [Google Scholar] [CrossRef]
- Smith, A.M.; Duan, H.; Mohs, A.M.; Nie, S. Bioconjugated quantum dots for in vivo molecular and cellular imaging. Adv. Drug Deliv. Rev. 2008, 60, 1226–1240. [Google Scholar] [CrossRef] [PubMed]
- Hoshino, A.; Manabe, N.; Fujioka, K.; Suzuki, K.; Yasuhara, M.; Yamamoto, K. Use of fluorescent quantum dot bioconjugates for cellular imaging of immune cells, cell organelle labeling, and nanomedicine: Surface modification regulates biological function, including cytotoxicity. J. Artif. Organs 2007, 10, 149–157. [Google Scholar] [CrossRef] [PubMed]
- Tharkur, J.; Telbum, A.; Basumallick, S.; Sah, R.; Catarero, K.; Maity, N.; Rifai, S.; Doshi, M.; Gesquiere, A.J.; Santra, S. Probing intra-cellular drug release event using activatable (OFF/ON) CdS:Mn/ZnS quantum dots (Qdots): Spectroscopic studies to investigate interaction of Qdots with quencher. Proc. SPIE 2013, 8596. [Google Scholar] [CrossRef]
- Mitra, R.N.; Doshi, M.; Zhang, X.; Tyus, J.C.; Bengtsson, N.; Fletcher, S.; Page, B.D.G.; Turkson, J.; Gesquiere, A.J.; Gunning, P.T.; et al. An activatable multimodal/multifunctional nanoprobe for direct imaging of intracellular drug delivery. Biomaterials 2012, 33, 1500–1508. [Google Scholar] [CrossRef] [PubMed]
- Santra, S. The potential clinical impact of quantum dots. Nanomedicine 2012, 7, 623–626. [Google Scholar] [CrossRef] [PubMed]
- Enkin, N.; Wang, F.; Sharon, E.; Albada, H.B.; Willner, I. Multiplexed analysis of genes using nucleic acid-stabilized silver-nanocluster quantum dots. ACS Nano 2014, 8, 11666–11673. [Google Scholar] [CrossRef] [PubMed]
- Park, J.; Park, Y.; Kim, S. Signal Amplification via Biological Self-Assembly of Surface-Engineered Quantum Dots for Multiplexed Subattomolar Immunoassays and Apoptosis Imaging. ACS Nano 2013, 7, 9416–9427. [Google Scholar] [CrossRef] [PubMed]
- Tan, Y.F.; Chandrasekharan, P.; Maity, D.; Yong, C.X.; Chuang, K.-H.; Zhao, Y.; Wang, S.; Ding, J.; Feng, S.-S. Multimodal tumor imaging by iron oxides and quantum dots formulated in poly (lactic acid)-d-alpha-tocopheryl polyethylene glycol 1000 succinate nanoparticles. Biomaterials 2011, 32, 2969–2978. [Google Scholar] [CrossRef] [PubMed]
- Erogbogbo, F.; Yong, K.-T.; Hu, R.; Law, W.-C.; Ding, H.; Cang, C.-W.; Prasad, P.N.; Swihart, M.T. Biocompatible Magnetofluorescent Probes: Luminescent Silicon Quantum Dots Coupled with Superparamagnetic Iron(III) Oxide. ACS Nano 2010, 4, 5131–5138. [Google Scholar] [CrossRef] [PubMed]
- Lee, J.-H.; Schneider, B.; Jordan, E.K.; Liu, W.; Frank, J.A. Synthesis of complexable fluorescent superparamagnetic iron oxide nanoparticles (FL SPIONs) and cell labeling for clinical application. Adv. Mater. 2008, 20, 2512–2516. [Google Scholar] [CrossRef] [PubMed]
- Trehin, R.; Figueiredo, J.-L.; Pittet, M.J.; Weissleder, R.; Josephson, L.; Mahmood, U. Fluorescent nanoparticle uptake for brain tumor visualization. Neoplasia 2006, 8, 302–311. [Google Scholar] [CrossRef] [PubMed]
- Yang, K.; Zhu, L.; Nie, L.; Sun, X.; Cheng, L.; Wu, C.; Niu, G.; Chen, X.; Liu, Z. Visualization of protease activity in vivo using an activatable photo-acoustic imaging probe based on CuS nanoparticles. Theranostics 2014, 4, 134–141. [Google Scholar] [CrossRef] [PubMed]
- Chen, N.-T.; Cheng, S.-H.; Liu, C.-P.; Souris, J.S.; Chen, C.-T; Mou, C.-Y.; Lo, L.-W. Recent advances in nanoparticle-based foerster resonance energy transfer for biosensing, molecular imaging and drug release profiling. Int. J. Mol. Sci. 2012, 13, 16598–16623. [Google Scholar] [CrossRef] [PubMed]
- Gui, R.; Wan, A.; Zhang, Y. Ratiometric and Time-Resolved Fluorimetry from Quantum Dots Featuring Drug Carriers for Real-Time Monitoring of Drug Release in situ. Anal. Chem. 2014, 86, 5211–5214. [Google Scholar] [CrossRef] [PubMed]
- Banerjee, S.; Kar, S.; Perez, J.M.; Santra, S. Quantum Dot-Based OFF/ON Probe for Detection of Glutathione. J. Phys. Chem. C 2009, 113, 9659–9663. [Google Scholar] [CrossRef]
- Ji, X.; Wang, W.; Mattoussi, H. Effects of separation distance on the charge transfer interactions in quantum dot-dopamine assemblies. Phys. Chem. Chem. Phys. 2015, 17, 10108–10117. [Google Scholar] [CrossRef] [PubMed]
- Ji, X.; Palui, G.; Avellini, T.; Na, H.B.; Yi, C.; Knappenberger, K.L.; Mattoussi, H. On the pH-Dependent Quenching of Quantum Dot Photoluminescence by Redox Active Dopamine. J. Am. Chem. Soc. 2012, 134, 6006–6017. [Google Scholar] [CrossRef] [PubMed]
- Kwon, Y.-T.; Choi, Y.-M.; Kim, K.-H.; Lee, C.-G.; Lee, K.-J.; Kim, B.-S.; Choa, Y.-H. Synthesis of CdSe/ZnSe quantum dots passivated with a polymer for oxidation prevention. Surf. Coat. Technol. 2014, 259, 83–86. [Google Scholar] [CrossRef]
- Negele, C.; Haase, J.; Budweg, A.; Leitenstorfer, A.; Mecking, S. Stable Single-Photon Emission by Quantum Dot/Polymer Hybrid Particles. Macromol. Rapid Commun. 2013, 34, 1145–1150. [Google Scholar] [CrossRef] [PubMed]
- Ai, X.; Ma, Q.; Su, X. Nanosensor for dopamine and glutathione based on the quenching and recovery of the fluorescence of silica-coated quantum dots. Microchim. Acta 2013, 180, 269–277. [Google Scholar]
- Maity, A.R.; Saha, A.; Roy, A.; Jana, N.R. Folic Acid Functionalized Nanoprobes for Fluorescence-, Dark-Field-, and Dual-Imaging-Based Selective Detection of Cancer Cells and Tissue. ChemPlusChem 2013, 78, 259–267. [Google Scholar] [CrossRef]
- Santra, S.; Liesenfeld, B.; Dutta, D.; Chatel, D.; Batich, C.D.; Tan, W.; Moudgil, B.M.; Mericle, R.A. Folate conjugated fluorescent silica nanoparticles for labeling neoplastic cells. J. Nanosci. Nanotechnol. 2005, 5, 899–904. [Google Scholar] [CrossRef] [PubMed]
- Gerard, V.A.; Maguire, C.M.; Bazou, D.; Gun'ko, Y.K. Folic acid modified gelatine coated quantum dots as potential reagents for in vitro cancer diagnostics. J. Nanobiotechnol. 2011, 9, 50. [Google Scholar] [CrossRef] [PubMed]
- Miotti, S.; Bagnoli, M.; Ottone, F.; Tomassetti, A.; Colnaghi, M.I.; Canevari, S. Simultaneous activity of two different mechanisms of folate transport in ovarian carcinoma cell lines. J. Cell. Biochem. 1997, 65, 479–491. [Google Scholar] [CrossRef]
- Miotti, S.; Facheris, P.; Tomassetti, A.; Bottero, F.; Bottini, C.; Ottone, F.; Colnaghi, M.I.; Bunni, M.A.; Priest, D.G.; Canevari, S. Growth of ovarian-carcinoma cell lines at physiological folate concentration: Effect on folate-binding protein expression in vitro and in vivo. Int. J. Cancer 1995, 63, 395–401. [Google Scholar] [CrossRef] [PubMed]
- Kirchner, C.; Liedl, T.; Kudera, S.; Pellegrino, T.; Javier, A.M.; Gaub, H.E.; Stoelzle, S.; Fertig, N.; Parak, W.J. Cytotoxicity of Colloidal CdSe and CdSe/ZnS Nanoparticles. Nano Lett. 2005, 5, 331–338. [Google Scholar] [CrossRef] [PubMed]
- Derfus, A.M.; Chan, W.C.W.; Bhatia, S.N. Probing the Cytotoxicity of Semiconductor Quantum Dots. Nano Lett. 2004, 4, 11–18. [Google Scholar] [CrossRef]
- Kailasa, S.K.; Wu, H.-F. One-pot synthesis of dopamine dithiocarbamate functionalized gold nanoparticles for quantitative analysis of small molecules and phosphopeptides in SALDI- and MALDI-MS. Analyst 2012, 137, 1629–1638. [Google Scholar] [CrossRef] [PubMed]
- Mehta, V.N.; Mungara, A.K.; Kailasa, S.K. Dopamine dithiocarbamate functionalized silver nanoparticles as colorimetric sensors for the detection of cobalt ion. Anal. Methods 2013, 5, 1818–1822. [Google Scholar] [CrossRef]
- Calvert, P.; Yao, K.-S.; Hamilton, T.C.; O’Dwyer, P.J. Clinical studies of reversal of drug resistance based on glutathione. Chem. Biol. Interact. 1998, 111–112, 213–224. [Google Scholar] [CrossRef]
- Godwin, A.K.; Meister, A.; O’Dwyer, P.J.; Huang, C.S.; Hamilton, T.C.; Anderson, M.E. High resistance to cisplatin in human ovarian cancer cell lines is associated with marked increase of glutathione synthesis. Proc. Natl. Acad. Sci. USA 1992, 89, 3070–3074. [Google Scholar] [CrossRef] [PubMed]
- Coles, B.; Ketterer, B. The role of glutathione and glutathione transferases in chemical carcinogenesis. Crit. Rev. Biochem. Mol. Biol. 1990, 25, 47–70. [Google Scholar] [CrossRef] [PubMed]
- Malhotra, A.; Zhang, X.; Turkson, J.; Santra, S. Buffer-stable Chitosan-Polyglutamic Acid Hybrid Nanoparticles for Biomedical Applications. Macromol. Biosci. 2013, 13, 603–613. [Google Scholar] [CrossRef] [PubMed]
- Kumar, M.N.V.R. A review of chitin and chitosan applications. React. Funct. Polym. 2000, 46, 1–27. [Google Scholar] [CrossRef]
- Tallury, P.; Kar, S.; Bamrungsap, S.; Huang, Y.-F.; Tan, W.; Santra, S. Ultra-small water-dispersible fluorescent chitosan nanoparticles: Synthesis, characterization and specific targeting. Chem. Commun. 2009, 17, 2347–2349. [Google Scholar] [CrossRef] [PubMed]
- Silva, S.M.L.; Braga, C.R.C.; Fook, M.V.L.; Raposo, C.M.O.; Carvalho, L.H.; Canedo, E.L. Application of Infrared Spectroscopy to Analysis of Chitosan/Clay Nanocomposites. In Infrared Spectroscopy—Materials Science, Engineering and Technology; Theophanides, T., Ed.; InTech: Rijeka, Croatia; 2012. [Google Scholar]
- Brugnerotto, J.; Lizardi, J.; Goycoolea, F.M.; Arguelles-Monal, W.; Desbrieres, J.; Rinaudo, M. An infrared investigation in relation with chitin and chitosan characterization. Polymer 2001, 42, 3569–3580. [Google Scholar] [CrossRef]
- Studer, K.; Decker, C.; Beck, E.; Schwalm, R.; Gruber, N. Redox and photoinitiated crosslinking polymerization. Prog. Org. Coat. 2005, 53, 126–133. [Google Scholar] [CrossRef]
- Wei, Q.; Zhang, F.; Li, J.; Li, B.; Zhao, C. Oxidant-induced dopamine polymerization for multifunctional coatings. Polym. Chem. 2010, 1, 1430–1433. [Google Scholar] [CrossRef]
- Tyagi, A.; Penzkofer, A. Fluorescence spectroscopic behaviour of folic acid. Chem. Phys. 2010, 367, 83–92. [Google Scholar] [CrossRef]
- Wang, J.; Sun, X.; Mao, W.; Sun, W.; Tang, J.; Sui, M.; Shen, Y.; Gu, Z. Tumor Redox Heterogeneity-Responsive Prodrug Nanocapsules for Cancer Chemotherapy. Adv. Mater. 2013, 25, 3670–3676. [Google Scholar] [CrossRef] [PubMed]
- Michelet, F.; Gueguen, R.; Leroy, P.; Wellman, M.; Nicolas, A.; Siest, G. Blood and plasma glutathione measured in healthy subjects by HPLC: Relation to sex, aging, biological variables, and life habits. Clin. Chem. 1995, 41, 1509–1517. [Google Scholar] [PubMed]
- Clift, M.J.; Boyles, M.S.; Brown, D.M.; Stone, V. An investigation into the potential for different surface-coated quantum dots to cause oxidative stress and affect macrophage cell signalling in vitro. Nanotoxicology 2010, 4, 139–149. [Google Scholar] [CrossRef] [PubMed]
- Rosas-Hernandez, H.; Jimenez-Badillo, S.; Martinez-Cuevas, P.P.; Gracia-Espino, E.; Terrones, H.; Terrones, M.; Hussain, S.M.; Ali, S.F.; Gonzalez, C. Effects of 45-nm silver nanoparticles on coronary endothelial cells and isolated rat aortic rings. Toxicol. Lett. 2009, 191, 305–313. [Google Scholar] [CrossRef] [PubMed]
- Kawata, K.; Osawa, M.; Okabe, S. In vitro Toxicity of Silver Nanoparticles at Noncytotoxic Doses to HepG2 Human Hepatoma Cells. Environ. Sci. Technol. 2009, 43, 6046–6051. [Google Scholar] [CrossRef] [PubMed]
- Montfort, R.L.M.V.; Congreve, M.; Tisi, D.; Carr, R.; Jhoti, H. Oxidation state of the active-site cysteine in protein tyrosine phosphatase 1B. Nature 2003, 423, 773–777. [Google Scholar] [CrossRef] [PubMed]
- Huang, H.-C.; Barua, S.; Sharma, G.; Dey, S.K.; Rege, K. Inorganic nanoparticles for cancer imaging and therapy. J. Control. Release 2011, 155, 344–357. [Google Scholar] [CrossRef] [PubMed]
- Zhang, Y.; Guo, L.; Roeske, R.W.; Antony, A.C.; Jayaram, H.N. Pteroyl-γ-glutamate-cysteine synthesis and its application in folate receptor-mediated cancer cell targeting using folate-tethered liposomes. Anal. Biochem. 2004, 332, 168–177. [Google Scholar] [CrossRef] [PubMed]
- Sears, D.; Osman, N.; Tate, B.; McKenzie, I.; Hogarth, P. Molecular cloning and expression of the mouse high affinity Fc receptor for IgG. J. Immunol. 1990, 144, 371–378. [Google Scholar] [PubMed]
- Iversen, T.-G.; Skotland, T.; Sandvig, K. Endocytosis and intracellular transport of nanoparticles: Present knowledge and need for future studies. Nano Today 2011, 6, 176–185. [Google Scholar] [CrossRef]
- Fernando, L.P.; Kandel, P.K.; Yu, J.; McNeill, J.; Ackroyd, P.; Christensen, K.A. Mechanism of cellular uptake of highly fluorescent conjugated polymer nanoparticles. Biomacromolecules 2010, 11, 2675–2682. [Google Scholar] [CrossRef] [PubMed]
- Clift, M.J.; Rothen-Rutishauser, B.; Brown, D.M.; Duffin, R.; Donaldson, K.; Proudfoot, L.; Guy, K.; Stone, V. The impact of different nanoparticle surface chemistry and size on uptake and toxicity in a murine macrophage cell line. Toxicol. Appl. Pharmacol. 2008, 232, 418–427. [Google Scholar] [CrossRef] [PubMed]
- Dong, S.; Cho, H.J.; Lee, Y.W.; Roman, M. Synthesis and Cellular Uptake of Folic Acid-Conjugated Cellulose Nanocrystals for Cancer Targeting. Biomacromolecules 2014, 15, 1560–1567. [Google Scholar] [CrossRef] [PubMed]
- Kortan, A.R.; Hull, R.; Opila, R.L.; Bawendi, M.G.; Steigerwald, M.L.; Carroll, P.J.; Brus, L.E. Nucleation and growth of cadmium selendie on zinc sulfide quantum crystallite seeds, and vice versa, in inverse micelle media. J. Am. Chem. Soc. 1990, 112, 1327–1332. [Google Scholar] [CrossRef]
- Basumallick, S.; Rajasekaran, P.; Tetard, L.; Santra, S. Hydrothermally derived water-dispersible mixed valence copper-chitosan nanocomposite as exceptionally potent antimicrobial agent. J. Nanopart. Res. 2014, 16, 1–11. [Google Scholar] [CrossRef]
© 2015 by the authors; licensee MDPI, Basel, Switzerland. This article is an open access article distributed under the terms and conditions of the Creative Commons Attribution license (http://creativecommons.org/licenses/by/4.0/).
Share and Cite
Maxwell, T.; Banu, T.; Price, E.; Tharkur, J.; Campos, M.G.N.; Gesquiere, A.; Santra, S. Non-Cytotoxic Quantum Dot–Chitosan Nanogel Biosensing Probe for Potential Cancer Targeting Agent. Nanomaterials 2015, 5, 2359-2379. https://0-doi-org.brum.beds.ac.uk/10.3390/nano5042359
Maxwell T, Banu T, Price E, Tharkur J, Campos MGN, Gesquiere A, Santra S. Non-Cytotoxic Quantum Dot–Chitosan Nanogel Biosensing Probe for Potential Cancer Targeting Agent. Nanomaterials. 2015; 5(4):2359-2379. https://0-doi-org.brum.beds.ac.uk/10.3390/nano5042359
Chicago/Turabian StyleMaxwell, Tyler, Tahmina Banu, Edward Price, Jeremy Tharkur, Maria Gabriela Nogueira Campos, Andre Gesquiere, and Swadeshmukul Santra. 2015. "Non-Cytotoxic Quantum Dot–Chitosan Nanogel Biosensing Probe for Potential Cancer Targeting Agent" Nanomaterials 5, no. 4: 2359-2379. https://0-doi-org.brum.beds.ac.uk/10.3390/nano5042359