Surface Morphology-Dependent Functionality of Titanium Dioxide–Nickel Oxide Nanocomposite Semiconductors

Department of Optoelectronics and Materials Technology, National Taiwan Ocean University, Keelung 20224, Taiwan
*
Author to whom correspondence should be addressed.
Nanomaterials 2019, 9(12), 1651; https://0-doi-org.brum.beds.ac.uk/10.3390/nano9121651
Submission received: 28 September 2019
/
Revised: 8 November 2019
/
Accepted: 19 November 2019
/
Published: 21 November 2019
(This article belongs to the Special Issue Advanced Nanomaterials for Sustainable Energy, Environment and Sensing Applications)
Abstract
:In this study, TiO2–NiO heterostructures were synthesized by combining hydrothermal and chemical bath deposition methods. The post-annealing temperature was varied to control the surface features of the TiO2–NiO heterostructures. TiO2–NiO heterostructures annealed at 350 °C comprised NiO-nanosheet-decorated TiO2 nanostructures (NST), whereas those annealed at 500 °C comprised NiO-nanoparticle-decorated TiO2 nanostructures (NPT). The NPT exhibited higher photodegradation activity than the NST in terms of methylene blue (MB) degradation under irradiation. Structural analyses demonstrated that the NPT had a higher surface adsorption capability for MB dyes and superior light-harvesting ability; thus, they exhibited greater photodegradation ability toward MB dyes. In addition, the NST showed high gas-sensing responses compared with the NPT when exposed to acetone vapor. This result was attributable to the higher number of oxygen-deficient regions on the surfaces of the NST, which increased the amount of surface-chemisorbed oxygen species. This resulted in a relatively large resistance variation for the NST when exposed to acetone vapor.
1. Introduction
TiO2 has been widely studied for applications in photodegradation organic dyes and gas-sensing materials because of its low toxicity, high chemical stability, and environmental friendliness [1,2,3,4,5,6]. However, TiO2 still has some drawbacks that might limit its efficiency in photocatalyst and gas-sensing materials. The wide band gap of TiO2 limits its ability to absorb visible light; moreover, rapid recombination of photogenerated electron–hole pairs hinders its performance in photodegrading organic dyes [7]. TiO2 has been favored for sensing H2, NO2, and C2H5OH at elevated temperatures of 290–550 °C [8]; nevertheless, pure TiO2 with improved gas-sensing response is still highly desired for fabricating gas sensors with high gas detection performance. Recently, constructing TiO2-based heterostructures proved to be a promising approach to enhancing the photodegradation and gas-sensing abilities of TiO2. Several TiO2-based heterostructure systems have been proposed and investigated. Decorating the surface of TiO2 with a CdS photosensitizer improves its photodegradation ability toward rhodamine B [9]. SrTiO3/TiO2 heterostructures are beneficial for the rapid separation of photogenerated electrons and holes, and they improve the photodegradation performance of pristine TiO2 [10]. TiO2–ZnO composite tubes exhibit higher organic dye photodegradation ability when compared with pristine TiO2 tubes [11]. According to research fabricating TiO2-based heterostructures in applications such as gas-sensing materials, ZnS-sphere-decorated TiO2 flower-like composites exhibit a superior gas-sensing response to pristine TiO2 flowers [3]. Moreover, decorating the surface of TiO2 nanorods with island-like CdO crystallites markedly improves the gas-sensing response of the nanorods to low-concentration NO2 [2]. Increased potential barriers in the heterostructure systems could constitute an essential factor in enhancing the gas-sensing performance of TiO2 on exposure to reducing and oxidizing gases. Accordingly, most proposed TiO2-based heterostructures are based on n-type oxides or sulfides uniformly distributed on the surfaces of n-type TiO2, leading to the formation of n–n-type heterogeneous structures in the composite systems.
However, in addition to n–n-type TiO2-based heterogeneous systems, recent efforts have focused on improving the photodegradation and gas-sensing performance of TiO2 with a p–n-type heterogeneous system. NiO is a p-type metal-oxide semiconductor with a wide band-gap energy (Eg = 3.6–4.0 eV) [12]. Creating TiO2–NiO p–n heterojunctions is one of the most effective strategies for developing efficient TiO2-based photocatalysts. When p-type NiO and n-type TiO2 form a p–n junction, an inner electric field is established at the interface, which then acts as a potential barrier to prevent the recombination of electrons and holes. Therefore, improved photodegradation performance towards organic dyes is expected for TiO2–NiO p–n-type heterostructures [13]. Moreover, p-type NiO is a suitable catalyst for promoting selective oxidation of various volatile organic compounds [14]. Constructing TiO2–NiO heterostructures is also a promising approach to improving both gas-sensing abilities of n-type TiO2 [15]. However, systematic studies on NiO loading effects on both the photodegradation and gas-sensing properties of TiO2 are still limited in number. In the current study, TiO2 flower-based heterostructures were synthesized and decorated with various NiO shell layer crystallites. The three-dimensional (3D) architecture of TiO2 nanostructures were used as templates to fabricating TiO2–NiO nanocomposites herein. This is due to the fact that 3D nanotechnology of oxides has been demonstrated to obtain remarkable properties and multifunctionality [16]. Controlling the post-annealing procedure resulted in two types of TiO2–NiO composites—namely NiO nanosheet-decorated TiO2 flowers and NiO nanoparticle-decorated TiO2 nanostructures—that were used to understand the effects of different morphologies and microstructures on photodegradation ability and gas-sensing responses. This study proposes a correlation between the microstructures of the NiO shell layer and the photodegradation and gas-sensing performance of the TiO2–NiO composites. The investigations herein are important for designing TiO2–NiO nanocomposites in photodegrading organic dyes and gas-sensing applications with satisfactory performance.
2. Materials and Methods
In this study, the TiO2 nanostructures were grown on glass substrates using a hydrothermal method. For hydrothermal synthesis, 2.4 mL of deionized water was mixed with 3.6 mL of concentrated HCl (35%) in a Teflon-lined stainless autoclave. The mixture was stirred at ambient conditions for 5 min and after that, 0.25 mL of TiCl4 was added into the mixed solution for preparation of TiO2 nanostructures. The hydrothermal synthesis was conducted at 180 °C for 3 h. NiO crystallites were decorated onto the surfaces of TiO2 nanostructures by a chemical bath deposition (CBD) method. The solution for CBD process was prepared by adding 1 mL of aqueous ammonia (25–28%) to the mixture of 20 mL of 1 M nickel sulfate and 16 mL of 0.25 M potassium persulfate. The TiO2 nanostructures were immersed into the CBD solution for reaction and the samples were rinsed with distilled water. Finally, the as-synthesized samples were post-annealed at 350 and 500 °C in ambient air for 1 h to fabricate the TiO2–NiO heterostructures with various surface crystal features. Notably, the market crystalline temperature of the NiO phase from initially formed Ni-based hydroxide nanosheets was above 350 °C in this study. The sample annealed at 350 °C formed NiO-nanosheet-decorated TiO2 nanostructures (NST); that annealed at 500 °C formed NiO-nanoparticle-decorated TiO2 nanostructures (NPT). The NST and NPT were used to present the corresponding samples annealed at 350 and 500 °C, respectively.
Crystal structures of the as-synthesized samples were investigated by X-ray diffraction (XRD) using Cu Kα radiation. The scanning electron microscopy (SEM) was performed to investigate surface morphology of the samples. High-resolution transmission electron microscopy (HRTEM) was used to investigate the detailed microstructures of the TiO2–NiO composites. The attached energy dispersive X-ray spectroscopy (EDS) was used to investigate the compositions of the TiO2–NiO composite samples. X-ray photoelectron spectrometry (XPS) analysis was used to determine the chemical binding status of constituent elements of the samples. The analysis of absorbance spectra of the composites was conducted by using a UV–Vis spectrophotometer. Photodegradation performance of various TiO2–NiO composites were performed by comparing the degradation of aqueous solution of methylene blue (MB, 10−6 M) containing various TiO2–NiO composites as catalysts under solar light irradiation excited from a 100 W Xe arc lamp. The variation of MB solution concentration in the presence of various TiO2–NiO composites with different irradiation durations was analyzed by recording the changes of absorbance spectra using a UV–Vis spectrophotometer. The gas-sensing response of the gas sensors made from the TiO2–NiO composites to acetone vapor with concentrations of 50–750 ppm was defined as the Rg/Ra. Ra was the sensor electrical resistance in the absence of the target gas and Rg was that in the target gas.
3. Results and Discussion
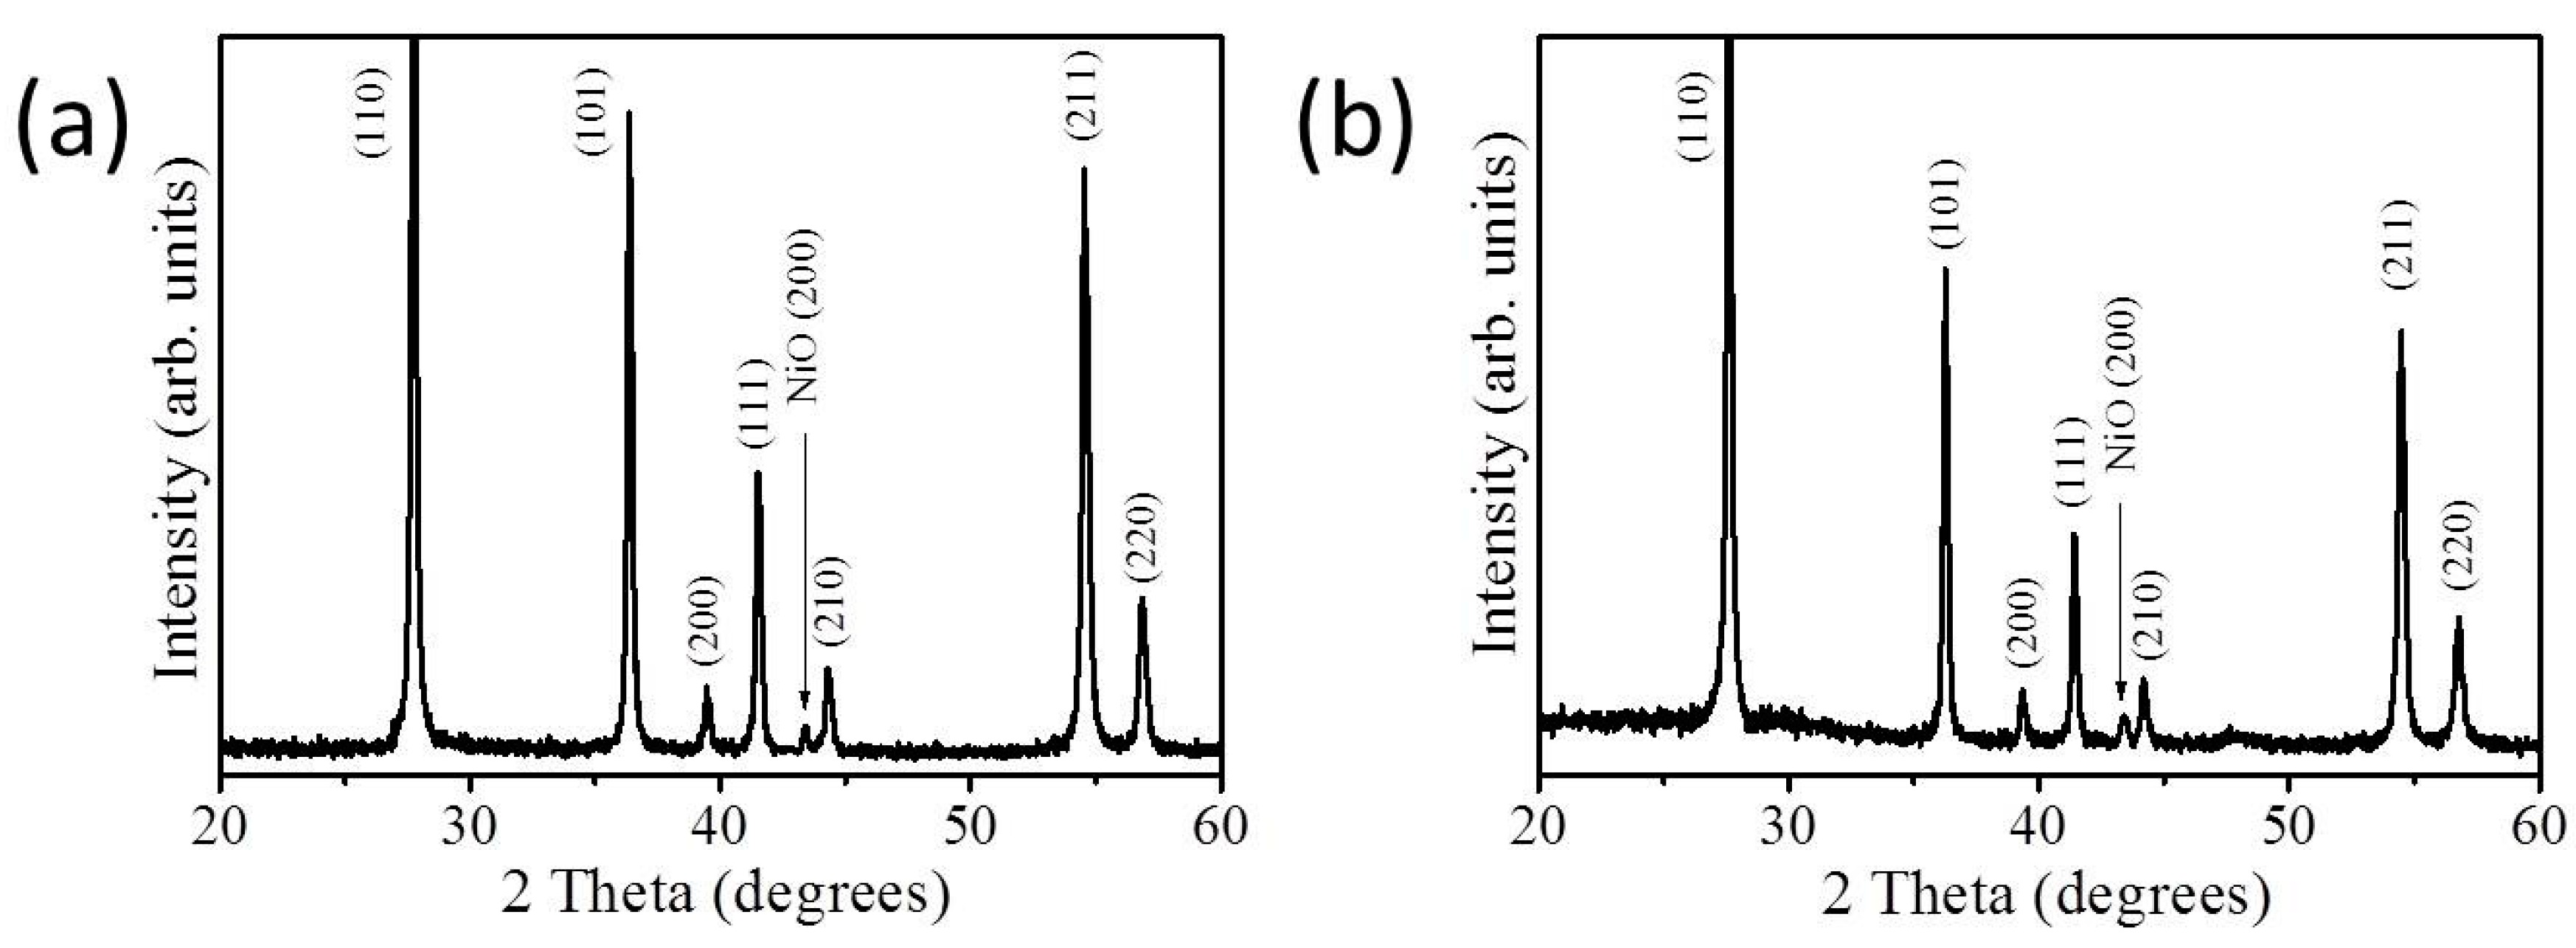
Figure 1a,b depict the SEM images of hydrothermally derived 3D TiO2 nanostructures. The lengths of the TiO2 petals ranged from 1.2 to 3.1 μm and the surface of TiO2 was smooth. The possible growth mechanism of the hydrothermally derived TiO2 nanostructures herein has been reported elsewhere [3]. Figure 1c,d illustrate the SEM images of TiO2–NiO composites formed through post-annealing at 350 °C. The surfaces of the TiO2–NiO composites consisted of undulated shell layers and were rough. The coverage of the sheet-like NiO crystallites on the surfaces of TiO2 nanostructures was uniform, and a homogeneous layer-like structure was thus formed. The sheet thickness of the NiO crystallites ranged from 10 to 25 nm. When the post-annealing temperature was further increased to 500 °C, the morphology of the NiO crystallites decorated on the surfaces of the TiO2 structures markedly differed from that observed at 350 °C (Figure 1e,f). Comparatively, the surface morphology of the NiO thin layer on the TiO2 surface became a discontinuous shell structure when the TiO2–NiO composites were formed at 500 °C. According to the SEM observations, the morphology of TiO2–NiO composites can be controlled by changing the post-annealing temperature. Figure 2a,b illustrate the XRD patterns of the TiO2-based composites with various thermal post-annealing procedures. Several sharp and intense Bragg reflections originating from the rutile TiO2 phase (JCPDS No. 004−0551) were observed (Figure 2a,b). The TiO2 nanostructures were highly crystalline, as revealed by the XRD patterns. In addition to the Bragg reflections originating from the TiO2 phase (Figure 2a,b), a tiny Bragg reflection centered at approximately 43.4° was observed and was ascribed to the (200) plane of the cubic NiO structure (JCPDS No. 02−1216) [17]. No Bragg reflections from other impurities were detected. The SEM and XRD results demonstrated that crystalline TiO2–NiO composites with various NiO shell layer morphologies could be formed through various post-annealing procedures.
Figure 3a displays the low-magnification TEM image of a single TiO2–NiO composite formed at 350 °C. For a representative core–shell structure, a single TiO2 petal was uniformly covered with interconnected thin NiO sheets when the as-synthesized composite was annealed at 350 °C. Figure 3b shows distinct boundaries between the adjacent sheet-like NiO crystallites. As revealed by the HRTEM image depicted in Figure 3c, lattice fringes with multiple orientations were observed in the NiO crystallites, revealing a polycrystalline feature. Moreover, lattice fringes with an interval of 0.20 ± 0.02 nm were determined to correspond to the interplanar distance of NiO (200). Selected area electron diffraction (SAED) patterns of several NST composites were recorded, as shown in Figure 3d. The patterns exhibited several distinct diffraction rings consisting of sharp and bright spots that originated from the TiO2 petals and NiO sheets (Figure 3d). According to the SAED patterns, the (110), (101), (200), (111), (210), and (211) crystallographic planes were determined to correspond to the rutile TiO2 phase and the (200) crystallographic plane was determined to correspond to the cubic NiO phase. EDS line-scan analysis (Figure 3e) confirmed the localization of Ti in the core area and the tendency of the Ni element to be distributed along the surface of the TiO2 petal, revealing that the NiO sheets adequately covered the TiO2 surface. By contrast, the TEM images in Figure 3f,g reveal the morphology of the TiO2–NiO composite formed at 500 °C to differ from that of the composite annealed at 350 °C. NiO crystallites with a particle-like feature discontinuously decorated the surface of the TiO2 petal. As demonstrated by the HRTEM image in Figure 3h, the NiO particles had a diameter of 10 to 18 nm. The NPT formed at 500 °C exhibited appropriate crystalline phases (Figure 3i). The corresponding EDS analyses (Figure 3j,k) demonstrated that Ti, Ni, and O were the main constituent elements of the composites; moreover, no impurity atoms were detected. The Ni/Ti wt% ratios of the NPT and NST were 0.68 and 0.73, respectively in this study.
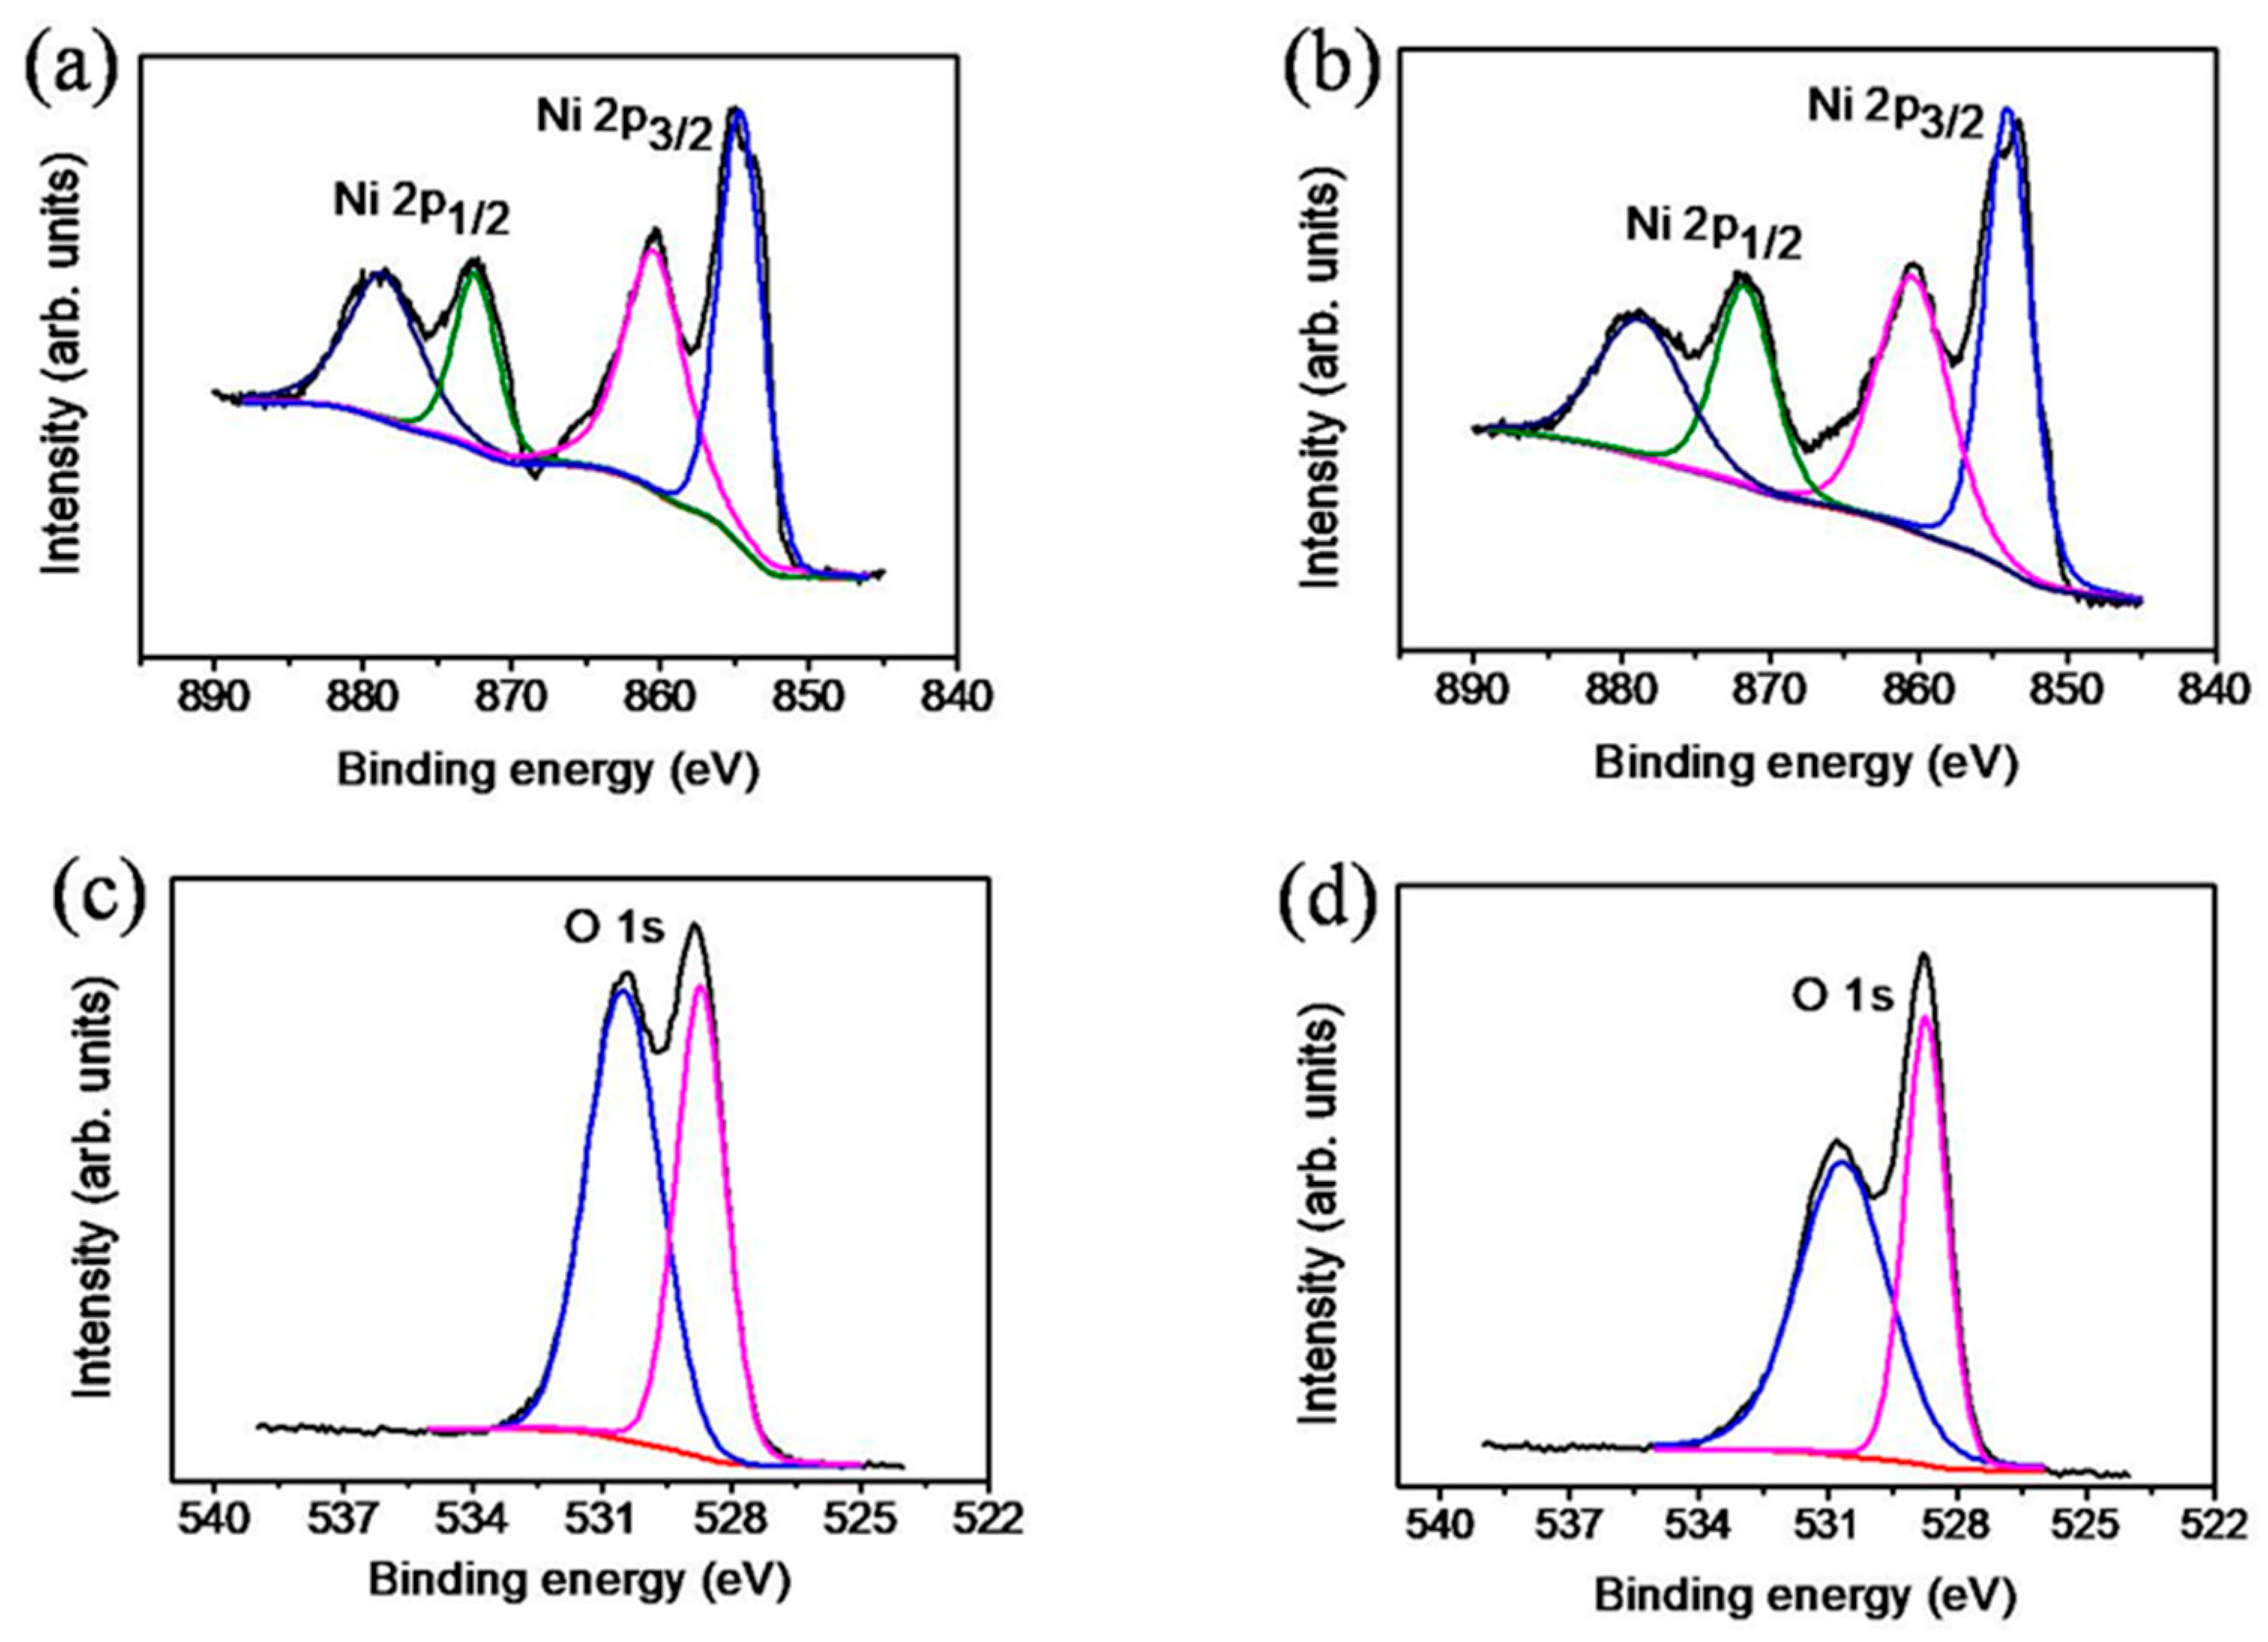
Figure 4a,b show the XPS narrow-scan spectra of the Ni 2p region of the TiO2–NiO composites formed at 350 °C and 500 °C, respectively. The Ni 2p states of the NiO shell layers (Figure 4a,b) contained multiple peaks at binding energies between 854 and 879 eV, including main peaks and satellites. The main peaks of Ni 2p3/2 and Ni 2p1/2 were located at approximately 854.1 and 871.8 eV, respectively (Figure 4a,b), which were in agreement with those reported in the literature for the NiO phase [18,19]. Figure 4c,d show the O1s spectra of the TiO2–NiO composites formed at 350 °C and 500 °C, respectively. Sharp fitted subpeaks were observed at a binding energy of approximately 528.8 eV and were attributed to the lattice oxygen of the NiO phase [20]; additionally, broadened subpeaks were observed at 530.7 eV and were attributed to the formation of surface-oxygen-deficient sites and surface chemisorbed oxygen species on the NiO shell layer [21]. Notably, the relative intensity of the higher binding energy component in the O1s spectra of the TiO2–NiO composites decreased when the composites were thermally treated from 350 °C to 500 °C. This finding reveals that surface crystalline imperfections of a larger size were formed in the NiO nanosheets.
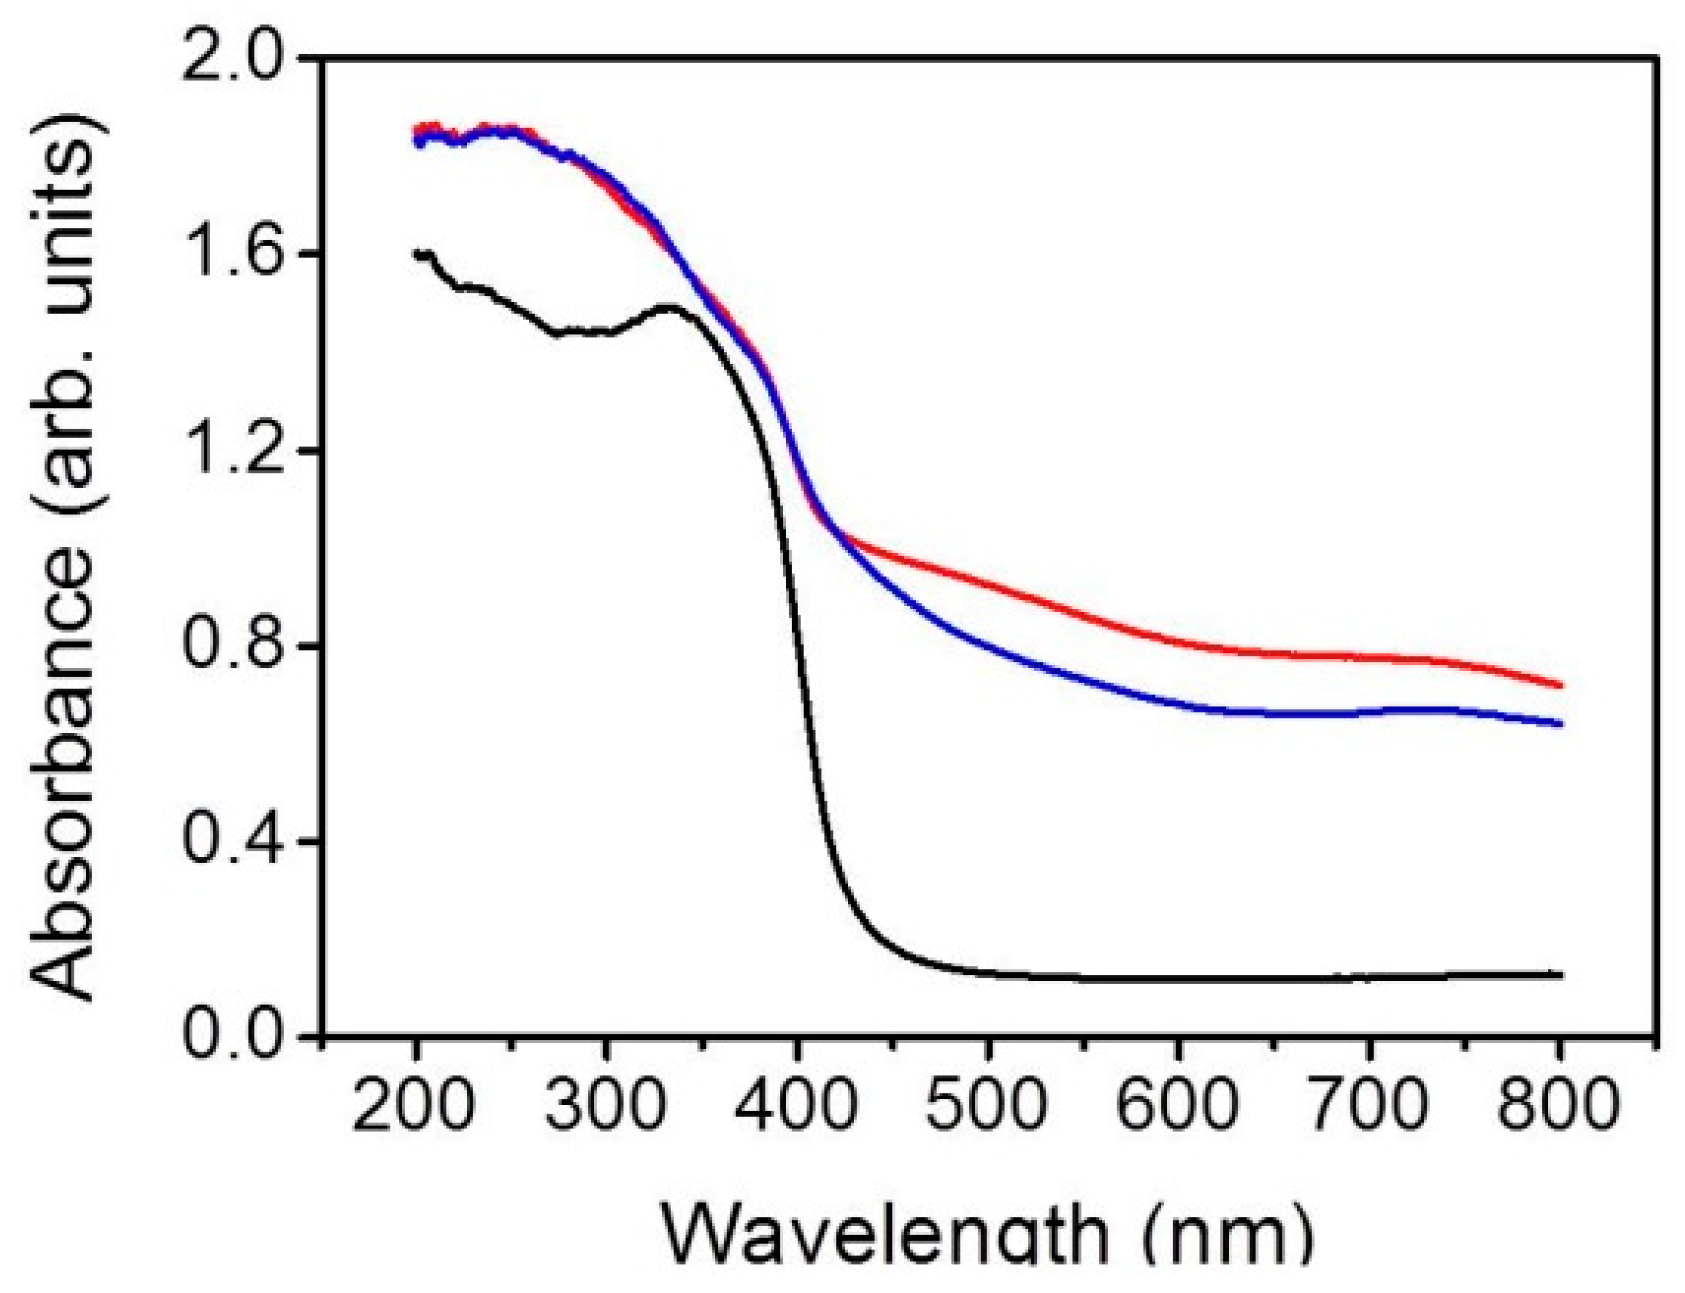
Figure 5 presents the optical absorption properties of the pristine TiO2, NST, and NPT. For the TiO2, a sharp drop of the absorption edge was observed, and the onset was at approximately 406 nm, which is consistent with the intrinsic band-gap absorption of rutile TiO2 [22]. After the NiO nanosheets and nanoparticles were coated onto the surfaces of the TiO2 nanostructures, the absorption edge broadened, and a redshift extension in the absorption edge was observed. The extended absorption edge of the TiO2–NiO composites suggests strong contact between NiO and TiO2 engendered by the interdispersion of two semiconductors [7]. In the interface region, the overlap of the conduction band due to the Ti d orbital of titanium oxide and Ni d orbital of nickel oxide may reduce the energy gap between the Ti d and O p orbitals of titanium oxide and enable a redshift of the adsorption edge [23]. Comparatively, the NPT exhibited a higher light harvesting ability. The extension of the optical absorption edge to the visible light region of the TiO2–NiO composites can enhance the efficiency of forming electron–hole pairs on the composite photocatalyst surfaces under illumination and might improve the photodegradation performance of the TiO2 nanostructures [7]. A similar redshift of TiO2 adsorption edge because of the surface decoration of NiO crystals has been shown in other TiO2–NiO composites synthesized via sol–gel and electroplating methods [24,25].
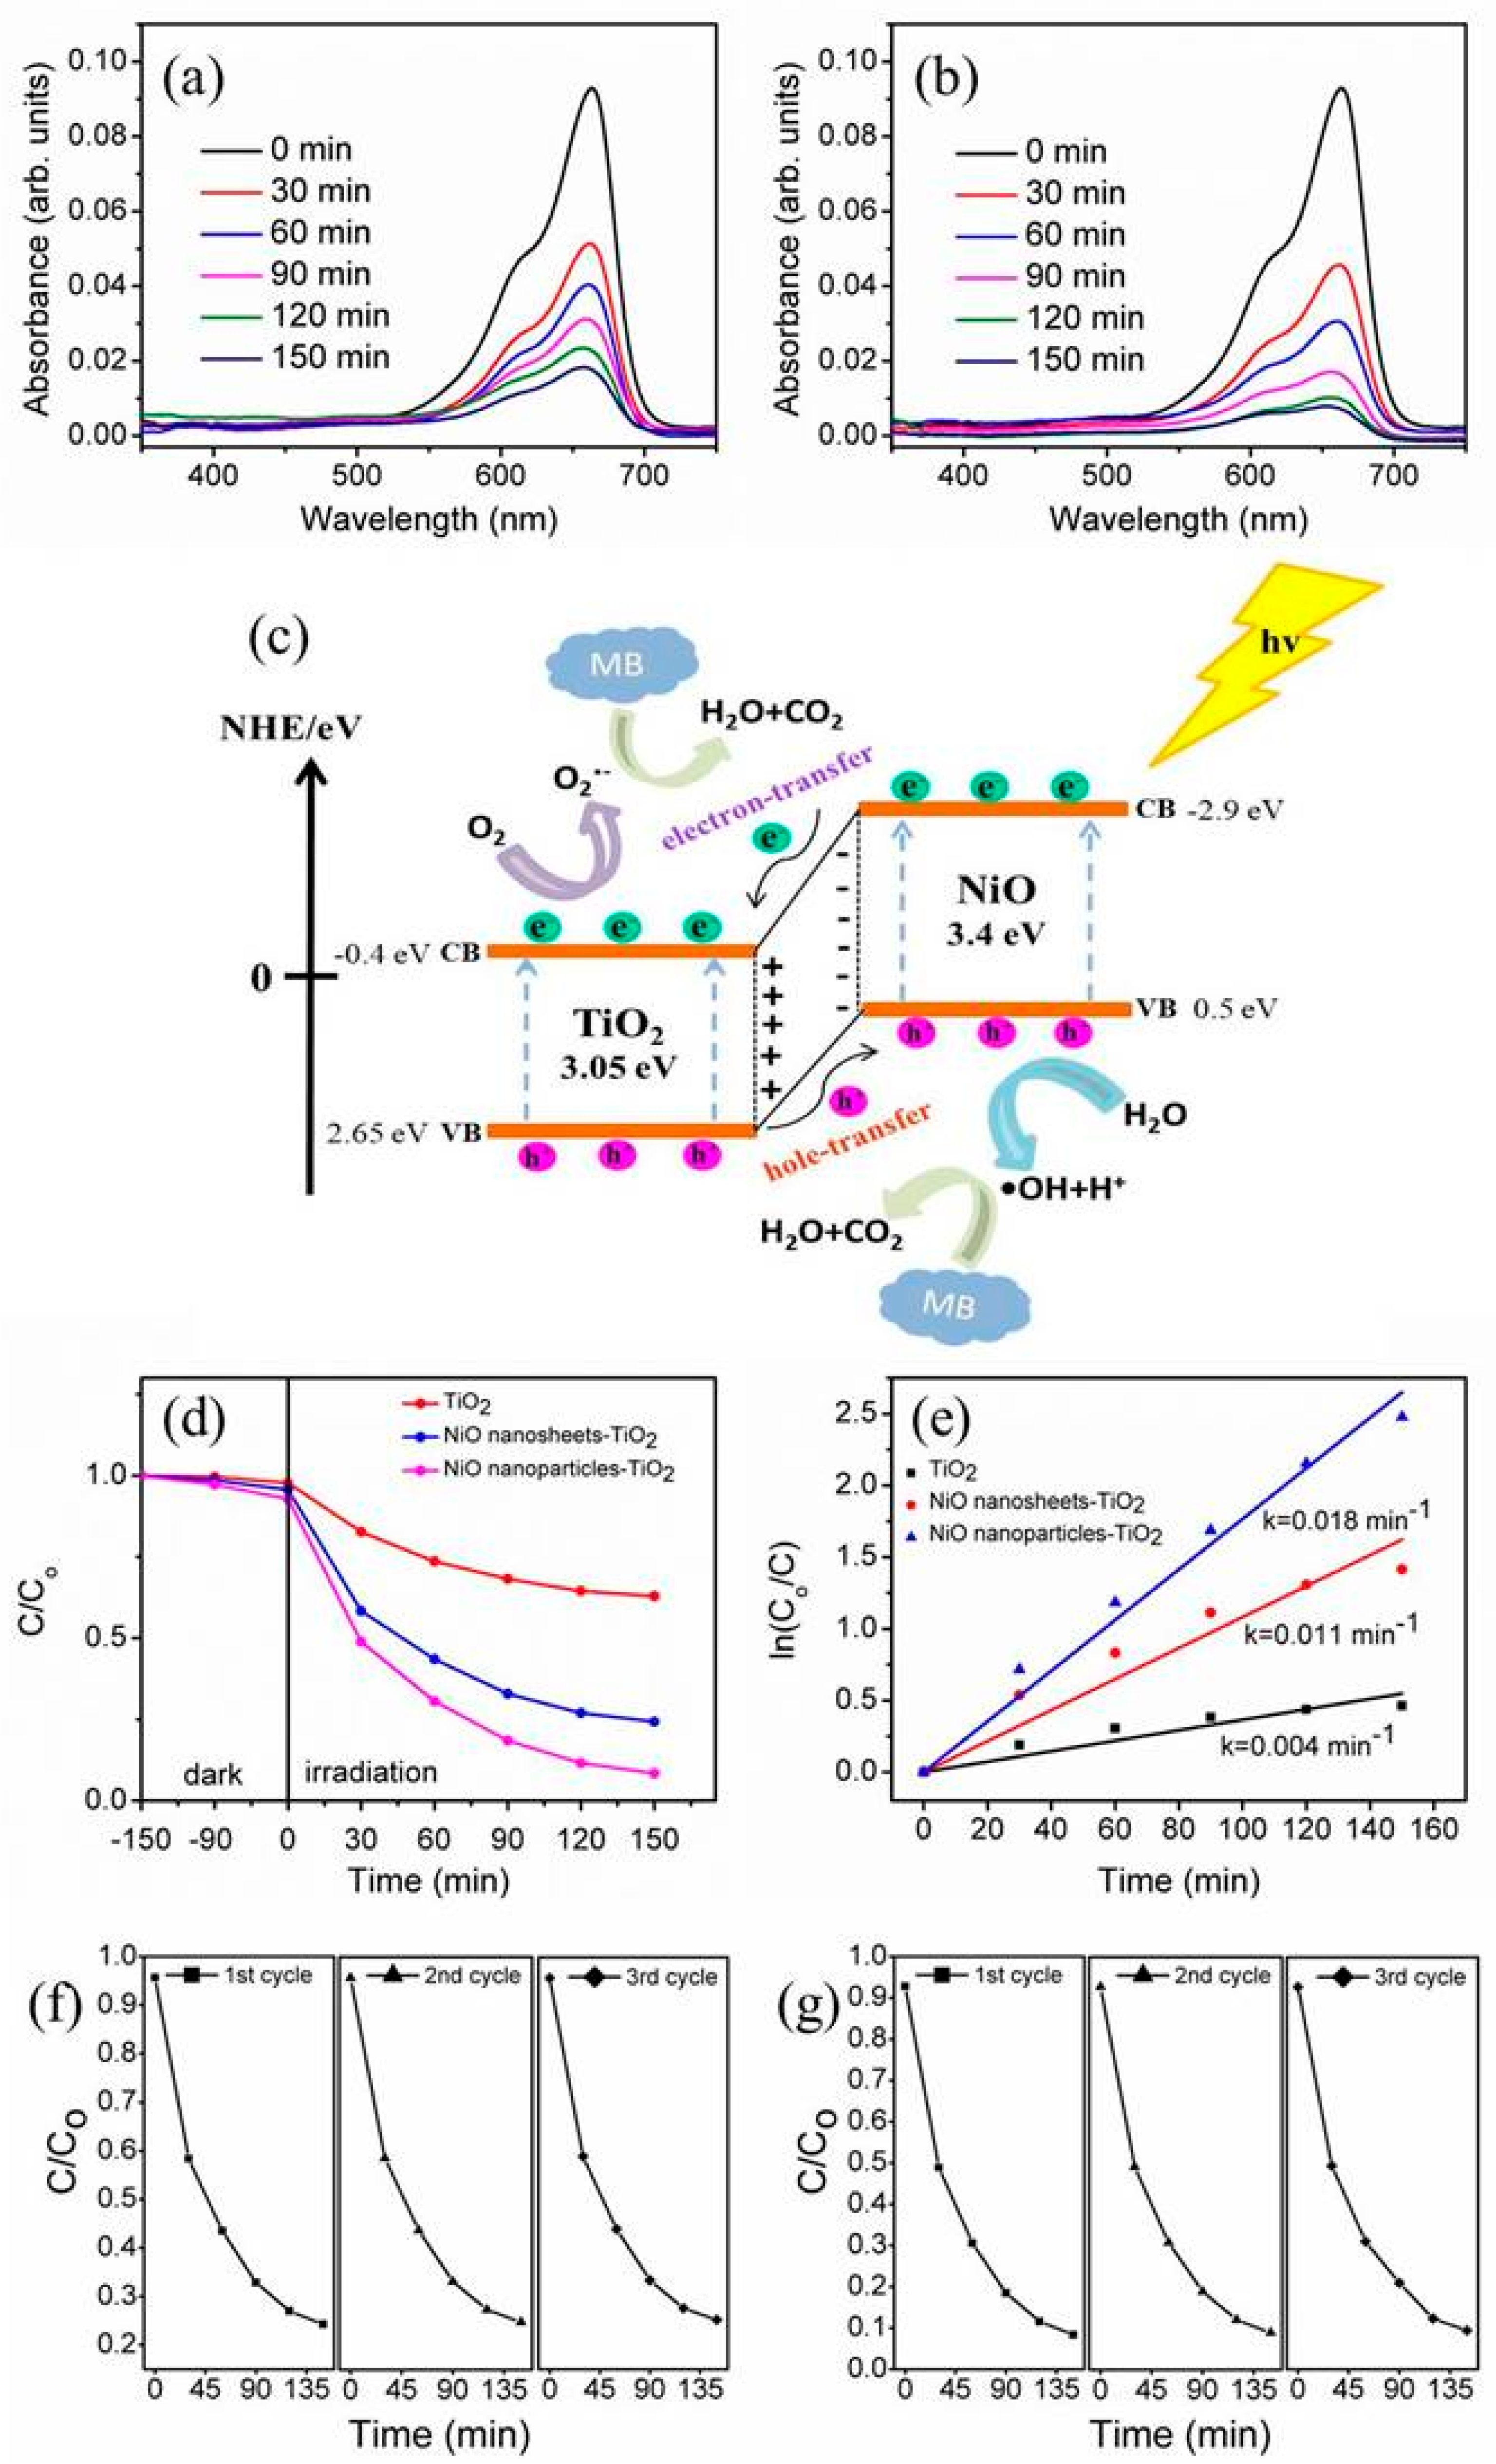
The photodegradation performance of the various TiO2–NiO composites was examined in terms of MB solution degradation. This study monitored the variation of the characteristic absorption intensity (at approximately 663 nm) of the MB solution containing various TiO2–NiO composites with different irradiation durations, as illustrated in Figure 6a,b. The absorbance spectra of the MB solution at 663 nm decreased with irradiation duration, indicating that the MB dyes were efficiently degraded by the TiO2–NiO photocatalysts under irradiation. The photodegradation reaction of the MB solution containing TiO2–NiO composites involved the reaction of photoexcited free electrons (TiO2-core) and holes (NiO-shell) with the MB solution. This can be understood from the possible band alignment between the TiO2 and NiO reported previously [26,27]. The subsequently formed hydroxyl radicals in the solution were strong oxidizing agents that effectively decomposed MB dyes [28,29]. The schematic figure of the photodegradation reaction of TiO2–NiO towards MB solution is illustrated in Figure 6c. The absorption intensity of the MB solution containing the NPT decreased more rapidly than that of the MB solution containing the NST under the given irradiation duration. Furthermore, the C/Co ratio was used to determine the photodegradation level of the MB solution containing various composite photocatalysts, where C represents the remaining MB concentration after light irradiation and Co represents the initial MB concentration without light irradiation [30]. A plot of C/Co versus irradiation duration is presented in Figure 6d. For comparison, the photodegradation level of the MB solution containing various composites under dark conditions is also shown in Figure 6d. Notably, the C/Co values for the degradation of the MB solution under dark conditions for 150 min were 7.9% and 4.3% for the NPT and NST, respectively. This reveals that the NPT possessed a higher MB dye surface adsorption capability. The relatively superior adsorption capability of the NPT enabled the MB molecules to diffuse freely inside the composites and facilitated more efficient contact between the photocatalysts and organic dyes, thus improving the resulting photodegradation level [27]. The photodegradation efficiency observed for the TiO2–NiO composites was substantially superior to that observed for the pristine TiO2. Contact between p-NiO and n-TiO2 in the composites engendered an inner electric field. The as-formed inner field further caused the photoexcited holes to flow into the negative field and the photoexcited electrons to move to the positive field in the oxides. Therefore, the photoexcited electron–hole pairs were separated more effectively by the p–n junction formed in the TiO2–NiO composites than that formed in the pristine TiO2. This enabled the formation of more free carriers on the active sides of the composites and increased the photodegradation activity of the composites [31]. In addition, the NPT showed a higher degree of photodegradation than that of the NST. This study also applied the following formula to investigate the kinetics of the degradation of the MB solution containing various photocatalysts under light irradiation (Figure 6e): ln (Co/C) = kt, where k is the apparent reaction rate constant and t is the irradiation duration [32]. Figure 6e shows a linear relationship between ln (Co/C) and irradiation duration. A higher degradation reaction rate was observed for the MB solution containing the NPT. The superior light-harvesting ability of the NPT accounted for the difference in photodegradation ability between the NPT and NST. The photodegradation stability of the TiO2–NiO composites under irradiation in the MB solution was evaluated after the recycling of the composites (Figure 6f,g). After three test cycles, the NST and NPT maintained relatively consistent activity without apparent deactivation.
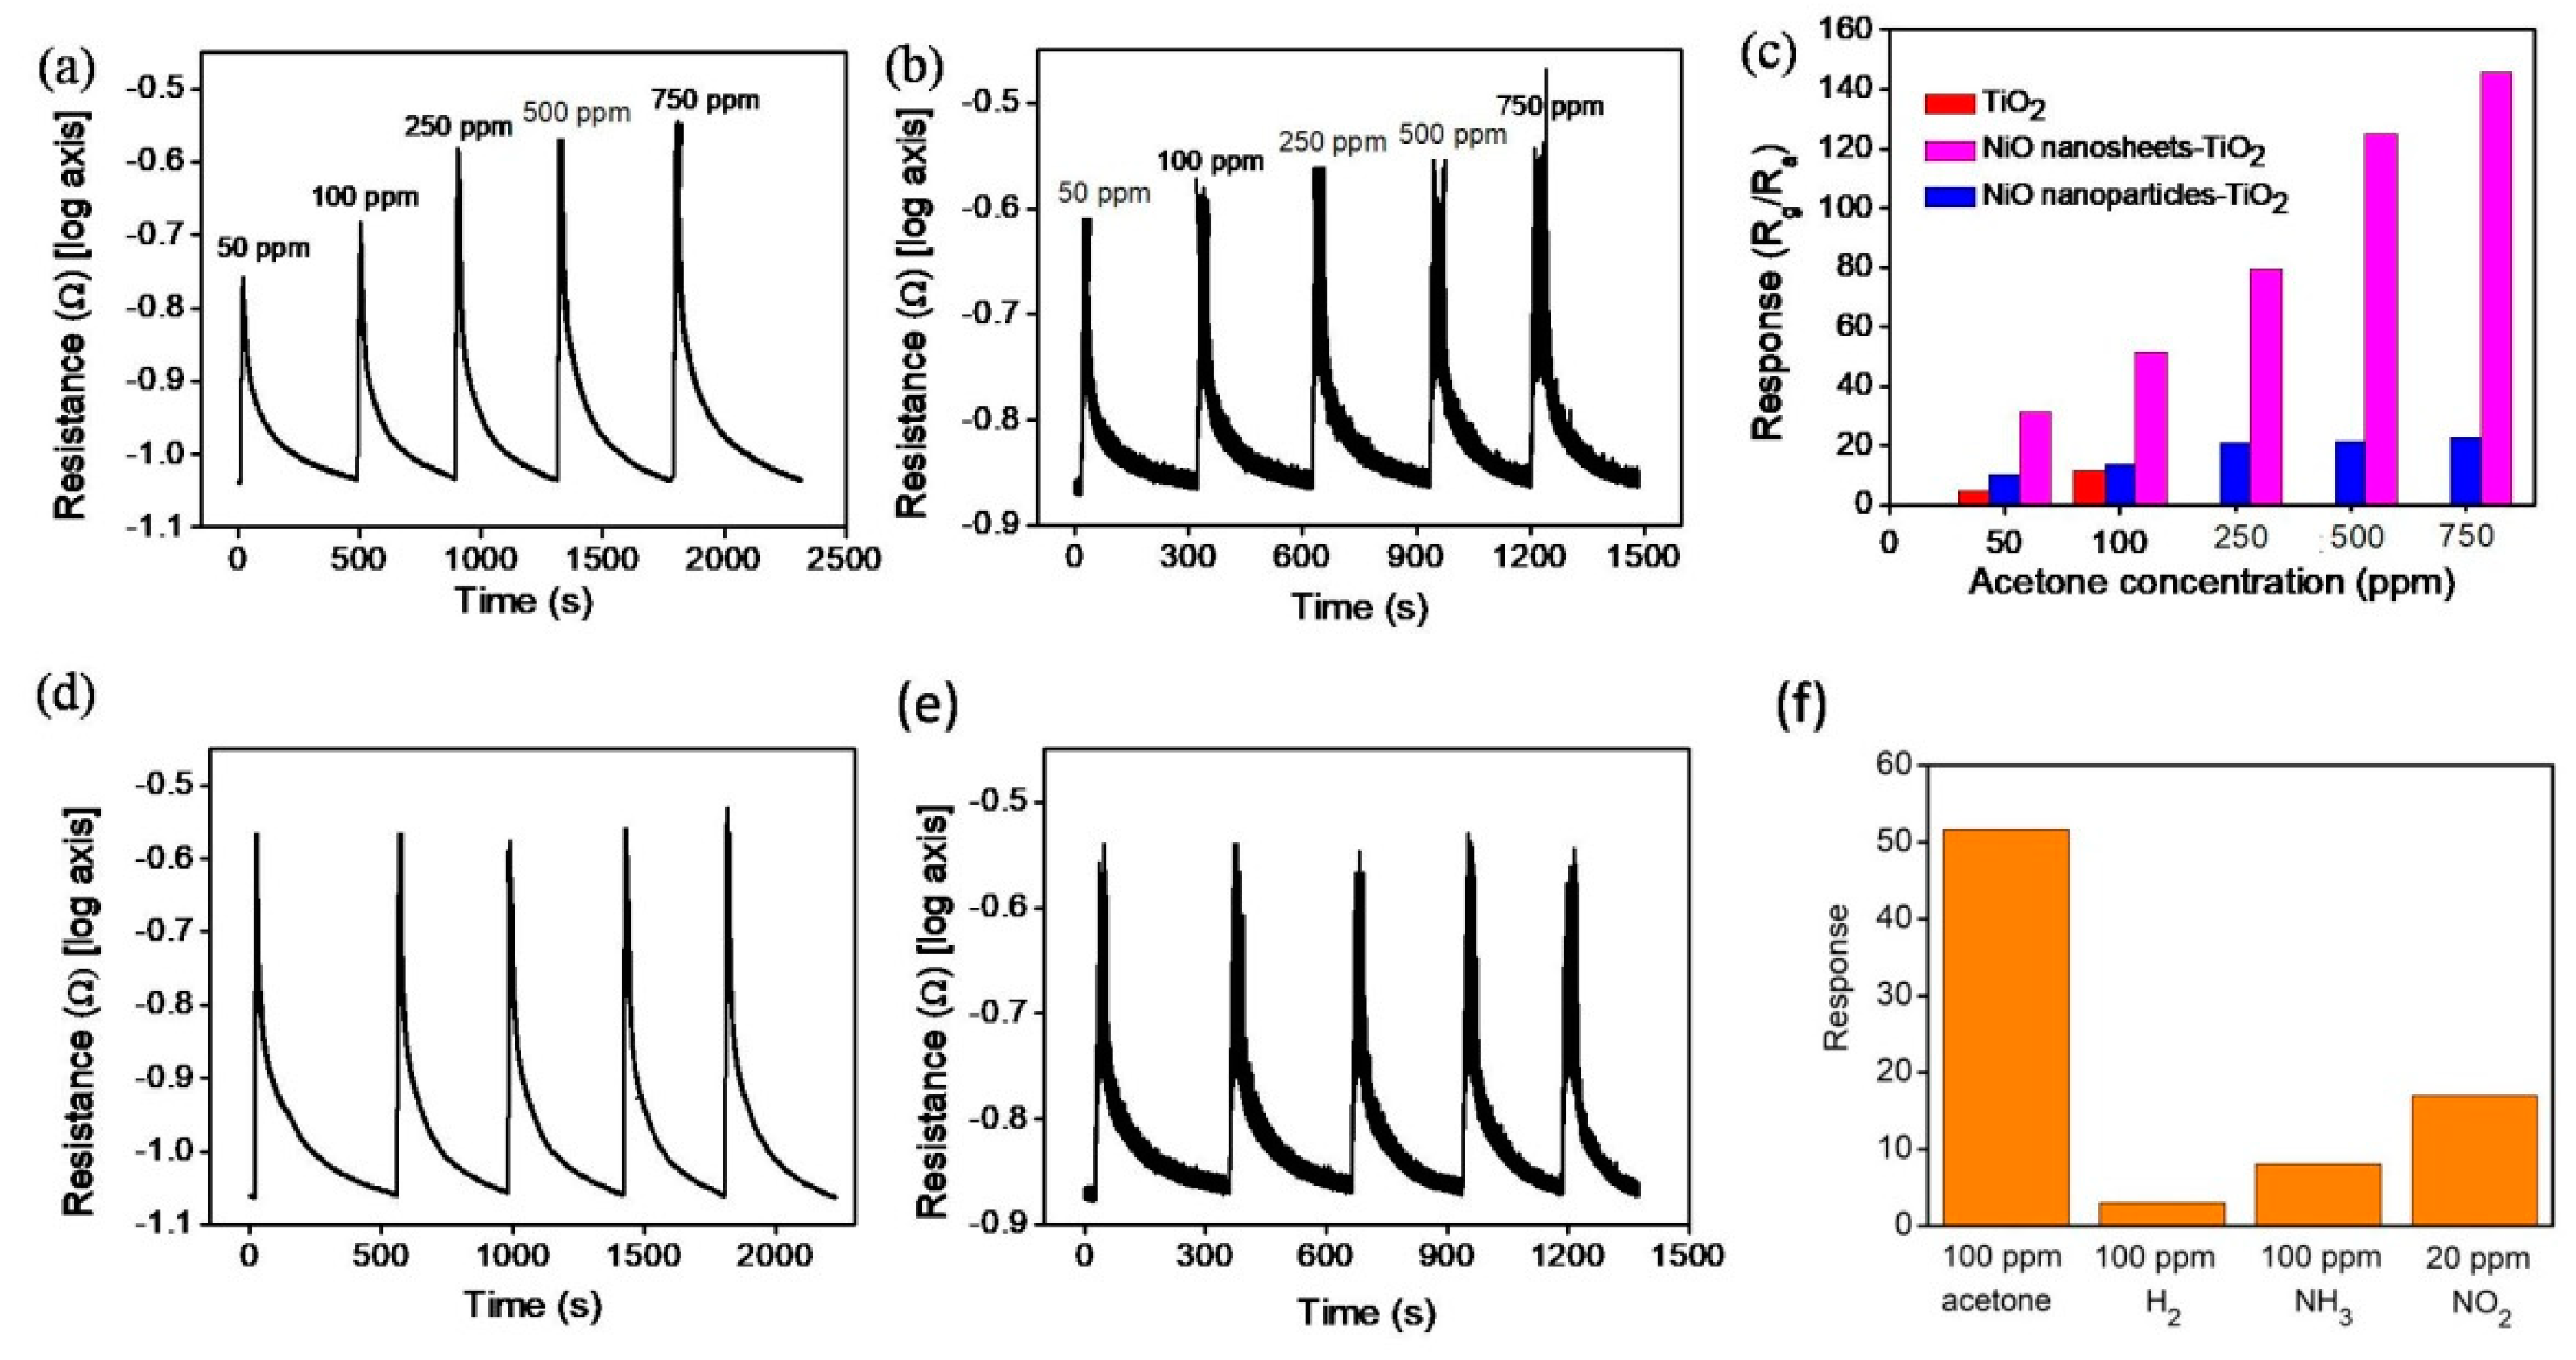
Figure 7a,b present the gas response transients of the NST and NPT, respectively, toward 50, 100, 250, 500, and 750 ppm acetone vapor at 300 °C. The gas-sensing response of the various composites increased with the acetone vapor concentration. As shown in Figure 7c, the gas-sensing response of the sensor comprising the NST increased from 31.3 to 145.5 when the acetone vapor concentration was increased from 50 to 750 ppm. By contrast, the gas-sensing responses of the sensor comprising the NPT were 10.2 and 22.8 with exposure to 50 and 750 ppm acetone vapor, respectively. The gas-sensing responses of the sensor comprising the NST were higher than those of the NPT under the given test conditions. Figure 7d,e show the results obtained from cyclic gas-sensing response tests of various TiO2–NiO composites on exposure to 250 ppm acetone vapor. The TiO2–NiO composites exhibited stability and reproducibility after five test cycles. For comparison, the gas-sensing responses of the pristine TiO2 exposed to 50 and 100 ppm acetone vapor are also displayed in Figure 7c. Decorating the surface of the TiO2 with NiO crystallites markedly improved the gas-sensing performance of the TiO2. For the pristine TiO2, the gas-sensing mechanism was explained mainly in terms of modulation of the depletion layer accompanying the adsorption and desorption of acetone molecules. When pristine TiO2 is exposed to air, oxygen molecules are adsorbed onto the surface of the TiO2 and are ionized to O− by capturing free electrons from the conduction band of TiO2. This reduces the electron concentration, which then leads to the formation of an electron depletion layer. When TiO2 is exposed to acetone vapor, the acetone molecules react with the surface-adsorbed oxygen species of TiO2 according to the following equation [33]: CH3COCH3(ads) + 8O−(ads) = 3CO2 + 3H2O + 8e−. This reaction releases the trapped electrons back to the conduction band of TiO2, which increases the free-electron concentration, and ultimately reduces the resistance of the pristine TiO2. Notably, compared with the n-type gas-sensing behavior of pristine TiO2, the gas-sensing behavior of TiO2–NiO composites changes to p-type due to the p-type nature of NiO shells. In p–n oxide composites having a homogeneous p-type shell layer coverage, the gas-sensing behavior is dominated by p-type shell layers [6,34]. The possible difference in the gas-sensing ability of the NST and NPT might be associated with surface defect density differences. The variations of both the surface and interfacial potential barriers of the composites were determined to dominate the gas-sensing behavior of the TiO2–NiO2 composites with various shell layer morphologies. Defect analyses revealed that the NiO nanosheets contained more surface crystal point defects than those of the NiO nanoparticles. An increase in oxygen-deficient regions in oxides can be contributed to more surface-chemisorbed oxygen species being able to participate in the oxidation–reduction reaction occurring on the surface of the sensing materials, which would thus induce a greater change in sensor resistance [21]. A higher number of oxygen-deficient regions on the surfaces of NST would increase the amount of surface-chemisorbed oxygen species. In ZnO–ZnCr2O4 composites, a higher surface point defect density is highly associated with a higher sensing response toward ethanol vapor [35]. The structural analyses indicated that the NiO shell thicknesses of the composites were in the tens of nanometers; therefore, the interfacial potential barriers were assumed to be influenced by the surface adsorption and desorption of reductive acetone molecules. A larger potential barrier variation was expected in the NST than in the NPT during the gas-sensing tests. This explains the higher gas-sensing response of the NST in this study [2,36]. Moreover, the selectivity of the NST was shown in Figure 7f. A visible sensing response to acetone vapor of the NST was observed. Table 1 summarizes acetone vapor sensing responses of various TiO2–NiO composites reported in literatures for a comparison [8,37,38]. Notably, several reference works need a high operating temperature of 400 °C to obtain a visible gas-sensing response of TiO2–NiO composites. Comparatively, the NST herein exhibited superior acetone vapor sensing response and a relatively lower operating temperature.
4. Conclusions
TiO2–NiO heterostructures were successfully synthesized by combining a hydrothermal process and a chemical bath deposition method. Crystalline TiO2–NiO heterostructures were formed after post-annealing procedures, and the surface features of the TiO2–NiO heterostructures were controlled by varying the post-annealing temperature. Photocatalytic activity tests revealed that the NPT had a higher surface adsorption capability for MB dyes and light harvesting ability when compared with the NST. These factors accounted for the superior photocatalytic activity of the NPT. By contrast, gas sensors made from the TiO2–NiO heterostructures exhibited strong gas-sensing responses and recycling stability to acetone vapor. The NST exhibited a higher gas-sensing response than that of the NPT when exposed to acetone vapor under the given test conditions. The NiO nanosheets comprised more surface crystal point defects than the NiO nanoparticles did, which engendered the difference in potential barrier variation in the TiO2–NiO heterostructures with various surface morphologies during gas-sensing tests.
Author Contributions
Methodology, N.-C.X.; formal analysis, N.-C.X., K.-J.C.; investigation, N.-C.X., K.-J.C.; writing—original draft preparation, Y.-C.L.; supervision, Y.-C.L.; writing—review and editing, Y.-C.L.
Funding
This research was funded by Ministry of Science and Technology of Taiwan. Grant No. MOST 108-2221-E-019-034-MY3.
Conflicts of Interest
The authors declare no conflict of interest.
References
- Luna-Flores, A.; Sosa-Sánchez, J.L.; Morales-Sánchez, M.A.; Agustín-Serrano, R.; Luna-López, J.A. An Easy-Made, Economical and Efficient Carbon-Doped Amorphous TiO2 Photocatalyst Obtained by Microwave Assisted Synthesis for the Degradation of Rhodamine B. Materials 2017, 10, 1447. [Google Scholar] [CrossRef] [PubMed]
- Liang, Y.C.; Xu, N.C.; Wang, C.C.; Wei, D.H. Fabrication of Nanosized Island-Like CdO Crystallites-Decorated TiO2 Rod Nanocomposites via a Combinational Methodology and Their Low-Concentration NO2 Gas-Sensing Behavior. Materials 2017, 10, 778. [Google Scholar] [CrossRef] [PubMed]
- Liang, Y.C.; Wang, C.C. Hydrothermally derived zinc sulfide sphere-decorated titanium dioxide flower-like composites and their enhanced ethanol gas-sensing performance. J. Alloy Compd. 2018, 730, 333–341. [Google Scholar] [CrossRef]
- Zhang, H.; Yu, M.; Qin, X. Photocatalytic Activity of TiO2 Nanofibers: The Surface Crystalline Phase Matters. Nanomaterials 2019, 9, 535. [Google Scholar] [CrossRef] [PubMed]
- Li, Y.; Wang, W.; Wang, F.; Di, L.; Yang, S.; Zhu, S.; Yao, Y.; Ma, C.; Dai, B.; Yu, F. Enhanced Photocatalytic Degradation of Organic Dyes via Defect-Rich TiO2 Prepared by Dielectric Barrier Discharge Plasma. Nanomaterials 2019, 9, 720. [Google Scholar] [CrossRef]
- Liang, Y.C.; Liu, Y.C. Design of Nanoscaled Surface Morphology of TiO2–Ag2O Composite Nanorods through Sputtering Decoration Process and Their Low-Concentration NO2 Gas-Sensing Behaviors. Nanomaterials 2019, 9, 1150. [Google Scholar] [CrossRef]
- Wang, M.; Hu, Y.; Han, J.; Guo, R.; Xiong, H.; Yin, Y. TiO2/NiO hybrid shells: P–n junction photocatalysts with enhanced activity under visible light. J. Mater. Chem. A 2015, 3, 20727–20735. [Google Scholar] [CrossRef]
- Sun, G.J.; Kheel, H.; Park, S.; Lee, S.; Park, S.E.; Lee, C. Synthesis of TiO2 nanorods decorated with NiO nanoparticles and their acetone sensing properties. Ceram. Int. 2016, 42, 1063–1069. [Google Scholar] [CrossRef]
- Liu, X.; Li, Y.; Yang, J.; Wang, B.; Ma, M.; Xu, F.; Sun, R.; Zhang, X. Enhanced Photocatalytic Activity of CdS-Decorated TiO2/Carbon Core-Shell Microspheres Derived from Microcrystalline Cellulose. Materials 2016, 9, 245. [Google Scholar] [CrossRef]
- Ha, M.N.; Zhu, F.; Liu, Z.; Wang, L.; Liu, L.; Lu, G.; Zhao, Z. Morphology-controlled synthesis of SrTiO3/TiO2 heterostructures and their photocatalytic performance for water splitting. RSC Adv. 2016, 6, 21111–21118. [Google Scholar] [CrossRef]
- Wang, M.; Cui, L.; Li, S.; Li, Z.; Ma, T.; Luan, G.; Liu, W.; Zhang, F. Facile fabrication hybrids of TiO2@ZnO tubes with enhanced photocatalytic properties. RSC Adv. 2016, 6, 58452–58457. [Google Scholar] [CrossRef]
- Fujii, E.; Tomozawa, A.; Torii, H.; Takayama, R. Preferred Orientations of NiO Films Prepared by Plasma-Enhanced Metalorganic Chemical Vapor Deposition. Jpn. J. Appl. Phys. 1996, 35, L328–L330. [Google Scholar] [CrossRef]
- Eskandarloo, H.; Badiei, A.; Haug, C. Enhanced photocatalytic degradation of an azo textile dye by using TiO2/NiO coupled nanoparticles: Optimization of synthesis and operational key factors. Mater. Sci. Semicond. Process. 2014, 27, 240–253. [Google Scholar] [CrossRef]
- Kaye, S.S.; Long, J.R. Hydrogen Storage in the Dehydrated Prussian Blue Analogues M3[Co(CN)6]2 (M = Mn, Fe, Co, Ni, Cu, Zn). J. Am. Chem. Soc. 2005, 127, 6506–6507. [Google Scholar] [CrossRef]
- Gaspera, E.D.; Guglielmi, M.; Agnoli, S.; Granozzi, G.; Post, M.L.; Bello, V.; Mattei, G.; Martucci, A. Au Nanoparticles in Nanocrystalline TiO2-NiO Films for SPR-Based, Selective H2S Gas Sensing. Chem. Mater. 2010, 22, 3407–3417. [Google Scholar] [CrossRef]
- Mishra, Y.K.; Adelung, R. ZnO tetrapod materials for functional applications. Mater. Today 2018, 21, 631–651. [Google Scholar] [CrossRef]
- Tian, H.; Fan, H.; Dong, G.; Ma, L.; Ma, J. NiO/ZnO p–n heterostructures and their gas sensing properties for reduced operating temperature. RSC Adv. 2016, 6, 109091–109098. [Google Scholar] [CrossRef]
- Liang, K.; Tang, X.; Hu, W. High-performance three-dimensional nanoporous NiO film as a supercapacitor electrode. J. Mater. Chem. 2012, 22, 11062–11067. [Google Scholar] [CrossRef]
- Varghese, B.; Reddy, M.V.; Yanwu, Z.; Chang, S.L.; Hoong, T.C.; Rao, G.V.S.; Chowdari, B.V.R.; Wee, A.T.S.; Lim, C.T.; Sow, C.-H. Fabrication of NiO Nanowall Electrodes for High Performance Lithium Ion Battery. Chem. Mater. 2008, 20, 3360–3367. [Google Scholar] [CrossRef]
- Li, D.; Zhang, Y.; Liu, D.; Yao, S.; Liu, F.; Wang, B.; Sun, P.; Gao, Y.; Chuai, X.; Lu, G. Hierarchical core/shell ZnO/NiO nanoheterojunctions synthesized by ultrasonic spray pyrolysis and their gas-sensing performance. CrystEngComm 2016, 18, 8101–8107. [Google Scholar] [CrossRef]
- Wang, C.; Cui, X.; Liu, J.; Zhou, X.; Cheng, X.; Sun, P.; Hu, X.; Li, X.; Zheng, J.; Lu, G. Design of Superior Ethanol Gas Sensor Based on Al-Doped NiO Nanorod-Flowers. ACS Sens. 2016, 1, 131–136. [Google Scholar] [CrossRef]
- Ibupoto, Z.H.; Abbasi, M.A.; Liu, X.; AlSalhi, M.S.; Willander, M. The Synthesis of NiO/TiO2Heterostructures and Their Valence Band Offset Determination. J. Nanomater. 2014, 6, 928658. [Google Scholar] [CrossRef]
- Lin, J.; Shen, J.; Wang, R.; Cui, J.; Zhou, W.; Hu, P.; Liu, D.; Liu, H.; Wang, J.; Boughton, R.I.; et al. Nano-p–n junctions on surface-coarsened TiO2nanobelts with enhanced photocatalytic activity. J. Mater. Chem. 2011, 21, 5106–5113. [Google Scholar] [CrossRef]
- Guo, J.; Fu, W.; Yang, H.; Yu, Q.; Zhao, W.; Zhou, X.; Sui, Y.; Ding, J.; Li, Y.; Cheng, S.; et al. A NiO/TiO2 junction electrode constructed using self-organized TiO2 nanotube arrays for highly efficient photoelectrocatalytic visible light activations. J. Phys. D Appl. Phys. 2010, 43, 245202. [Google Scholar] [CrossRef]
- Uddin, M.T.; Nicolas, Y.; Olivier, C.; Jaegermann, W.; Rockstroh, N.; Junge, H.; Toupance, T. Band alignment investigations of heterostructure NiO/TiO2 nanomaterials used as efficient heterojunction earth-abundant metal oxide photocatalysts for hydrogen production. Phys. Chem. Chem. Phys. 2017, 19, 19279–19288. [Google Scholar] [CrossRef] [PubMed]
- Zhang, H.; Liu, X.; Li, Y.; Sun, Q.; Wang, Y.; Wood, B.J.; Liu, P.; Yang, D.; Zhao, H. Vertically aligned nanorod-like rutile TiO2 single crystal nanowire bundles with superior electron transport and photoelectrocatalytic properties. J. Mater. Chem. 2012, 22, 2465–2472. [Google Scholar] [CrossRef]
- Sun, B.; Zhou, G.; Gao, T.; Zhang, H.; Yu, H. NiO nanosheet/TiO2 nanorod-constructed p–n heterostructures for improved photocatalytic activity. Appl. Surf. Sci. 2016, 364, 322–331. [Google Scholar] [CrossRef]
- Lin, H.; Ye, H.; Chen, S.; Chen, Y. One-pot hydrothermal synthesis of BiPO4/BiVO4 with enhanced visible-light photocatalytic activities for methylene blue degradation. RSC Adv. 2014, 4, 10968–10974. [Google Scholar] [CrossRef]
- Liang, Y.C.; Lung, T.W. Growth of Hydrothermally Derived CdS-Based Nanostructures with Various Crystal Features and Photoactivated Properties. Nanoscale Res. Lett. 2016, 11, 264. [Google Scholar] [CrossRef]
- Liang, Y.C.; Lo, Y.R.; Wang, C.C.; Xu, N.C. Shell Layer Thickness-Dependent Photocatalytic Activity of Sputtering Synthesized Hexagonally Structured ZnO-ZnS Composite Nanorods. Materials 2018, 11, 87. [Google Scholar] [CrossRef]
- Liang, Y.C.; Liu, Y.C.; Hung, C.S. Sputtering control of Ag2O decoration configurations on ZnO nanorods and their surface arrangement effects on photodegradation ability toward methyl orange. Nanotechnology 2019, 30, 495701–495711. [Google Scholar] [CrossRef] [PubMed]
- Liang, Y.C.; Chung, C.C.; Lin, T.Y.; Cheng, Y.R. Synthesis and microstructure-dependent photoactivated properties of three-dimensional cadmium sulfide crystals. J. Alloy Compd. 2016, 688, 769–775. [Google Scholar] [CrossRef]
- Liang, Y.C.; Cheng, Y.R.; Hsia, H.Y.; Chung, C.C. Fabrication and reducing gas detection characterization of highly-crystalline p-type zinc chromite oxide thin film. Appl. Surf. Sci. 2016, 364, 837–842. [Google Scholar] [CrossRef]
- Kim, H.J.; Jeong, H.M.; Kim, T.H.; Chung, J.H.; Kang, Y.C.; Lee, J.H. Enhanced Ethanol Sensing Characteristics of In2O3-Decorated NiO Hollow Nanostructures via Modulation of Hole Accumulation Layers. ACS Appl. Mater. Interfaces 2014, 6, 18197–18204. [Google Scholar] [CrossRef] [PubMed]
- Liang, Y.C.; Hsia, H.Y.; Cheng, Y.R.; Lee, C.M.; Liu, S.L.; Lin, T.Y.; Chung, C.C. Crystalline quality-dependent gas detection behaviors of zinc oxide–zinc chromite p–n heterostructures. CrystEngComm 2015, 17, 4190–4199. [Google Scholar] [CrossRef]
- Liang, Y.C.; Lo, Y.J. High-temperature solid-state reaction induced structure modifications and associated photoactivity and gas-sensing performance of binary oxide one-dimensional composite system. RSC Adv. 2017, 7, 29428–29439. [Google Scholar] [CrossRef] [Green Version]
- Sun, G.J.; Kheel, H.; Choi, S.; Hyun, S.K.; Lee, C. Prominent Gas Sensing Performance of TiO2-Core/NiO-Shell Nanorod Sensors. J. Nanosci. Nanotechnol. 2017, 17, 4099–4102. [Google Scholar] [CrossRef]
- Wisitsoraat, A.; Tuantranont, A.; Comini, E.; Sberveglieri, G.; Wlodarski, W. Characterization of n-type and p-type semiconductor gas sensors based on NiOx doped TiO2 thin films. Thin Solid Films 2009, 517, 2775–2780. [Google Scholar] [CrossRef]
Figure 1.
(a,b) Low- and high-magnification SEM images of TiO2 nanostructures. (c,d) Low- and high-magnification SEM images of TiO2–NiO composites formed at 350 °C. (e,f) Low- and high-magnification SEM images of TiO2–NiO composites formed at 500 °C.
Figure 1.
(a,b) Low- and high-magnification SEM images of TiO2 nanostructures. (c,d) Low- and high-magnification SEM images of TiO2–NiO composites formed at 350 °C. (e,f) Low- and high-magnification SEM images of TiO2–NiO composites formed at 500 °C.

Figure 2.
XRD patterns of TiO2–NiO composites formed at (a) 350 °C and (b) 500 °C. The arrow represents the position of NiO Bragg reflection.
Figure 2.
XRD patterns of TiO2–NiO composites formed at (a) 350 °C and (b) 500 °C. The arrow represents the position of NiO Bragg reflection.

Figure 3.
TEM analyses of TiO2–NiO composites formed at 350 °C: (a) Low-magnification TEM image of a single TiO2–NiO composite. (b) High-magnification TEM image taken from the TiO2–NiO composite. (c) High-resolution transmission electron microscopy (HRTEM) image taken from the local region of the TiO2–NiO composite. (d) Selected area electron diffraction (SAED) pattern of several TiO2–NiO composites. (e) Energy dispersive X-ray spectroscopy (EDS) line-scanning profiles of the TiO2–NiO composite. TEM analyses of TiO2–NiO composites formed at 500 °C. (f,g) Low- and high-magnification TEM images of a single TiO2–NiO composite, respectively. (h) HRTEM image taken from the local region of the TiO2–NiO composite. (i) SAED pattern of several TiO2–NiO composites. (j,k) EDS spectra of the NiO-nanoparticle-decorated TiO2 nanostructures (NPT) and NiO-nanosheet-decorated TiO2 nanostructures (NST) composites, respectively.

Figure 4.
High-resolution XPS spectra in Ni 2p region of TiO2–NiO composites formed at various temperatures: (a) 350 °C and (b) 500 °C. High-resolution XPS spectra in O 1s region of TiO2–NiO composites formed at various temperatures: (c) 350 °C and (d) 500 °C.
Figure 4.
High-resolution XPS spectra in Ni 2p region of TiO2–NiO composites formed at various temperatures: (a) 350 °C and (b) 500 °C. High-resolution XPS spectra in O 1s region of TiO2–NiO composites formed at various temperatures: (c) 350 °C and (d) 500 °C.

Figure 5.
Optical absorbance spectra of the pristine TiO2 (black), NST (blue), and NPT (red).

Figure 6.
Intensity variation of absorbance spectra of the methylene blue (MB) solution vs. irradiation duration containing various TiO2–NiO composites under solar light irradiation: (a) NST. (b) NPT. (c) Schematic of photodegradation process of TiO2–NiO composites toward MB. (d) The ratio of the remaining MB concentration after light irradiation (C) and the initial MB concentration without light irradiation (Co) vs. irradiation time curves for the MB solution containing various TiO2–NiO composites in dark conditions and under light irradiation. (e) Plot of ln (Co/C) vs. reaction time for MB solution containing various TiO2–NiO composites under irradiation. (f,g) Recycled performances of photodegradation of MB solution in the presence of the NST and NPT, respectively.

Figure 7.
Gas-sensing response curves of various TiO2–NiO composites on exposure to various acetone vapor concentrations (50–750 ppm): (a) NST. (b) NPT. (c) Gas-sensing responses vs. acetone vapor concentrations for various TiO2–NiO composites. The gas sensing responses of the pristine TiO2 flowers to 50 and 100 ppm acetone vapor are also shown for a comparison. (d,e) Cyclic gas-sensing response curves of the NST and NPT on exposure to 250 ppm acetone vapor, respectively. (f) Gas-sensing selectivity of NST.

| Materials | Operating Temperature | Acetone Concentration | Response (Ra/Rg or Rg/Ra) | Reference |
|---|---|---|---|---|
| NiO nanosheets–TiO2 flowers | 300 °C | 100 ppm | 51.6 (Rg/Ra) | (this work) |
| NiO nanoparticles–TiO2 flowers | 300 °C | 100 ppm | 13.54 (Rg/Ra) | (this work) |
| TiO2–NiO nanorod | 400 °C | 200 ppm | 9.81 (Rg/Ra) | [37] |
| TiO2–NiO nanorod | 400 °C | 200 ppm | 9.33 (Ra/Rg) | [8] |
| 95 wt% TiO2–5 wt% NiO composite film | 300 °C | 100 ppm | 6 (Rg/Ra) | [38] |
| 99 wt% TiO2–1 wt% NiO composite film | 400 °C | 100 ppm | 6.5 (Rg/Ra) | [38] |
© 2019 by the authors. Licensee MDPI, Basel, Switzerland. This article is an open access article distributed under the terms and conditions of the Creative Commons Attribution (CC BY) license (http://creativecommons.org/licenses/by/4.0/).
Share and Cite
MDPI and ACS Style
Liang, Y.-C.; Xu, N.-C.; Chiang, K.-J. Surface Morphology-Dependent Functionality of Titanium Dioxide–Nickel Oxide Nanocomposite Semiconductors. Nanomaterials 2019, 9, 1651. https://0-doi-org.brum.beds.ac.uk/10.3390/nano9121651
AMA Style
Liang Y-C, Xu N-C, Chiang K-J. Surface Morphology-Dependent Functionality of Titanium Dioxide–Nickel Oxide Nanocomposite Semiconductors. Nanomaterials. 2019; 9(12):1651. https://0-doi-org.brum.beds.ac.uk/10.3390/nano9121651
Chicago/Turabian StyleLiang, Yuan-Chang, Nian-Cih Xu, and Kai-Jen Chiang. 2019. "Surface Morphology-Dependent Functionality of Titanium Dioxide–Nickel Oxide Nanocomposite Semiconductors" Nanomaterials 9, no. 12: 1651. https://0-doi-org.brum.beds.ac.uk/10.3390/nano9121651
Note that from the first issue of 2016, this journal uses article numbers instead of page numbers. See further details here.