Gold Nanorods for LSPR Biosensing: Synthesis, Coating by Silica, and Bioanalytical Applications

 ,
,
Abstract
:1. Introduction
2. Synthesis Methods
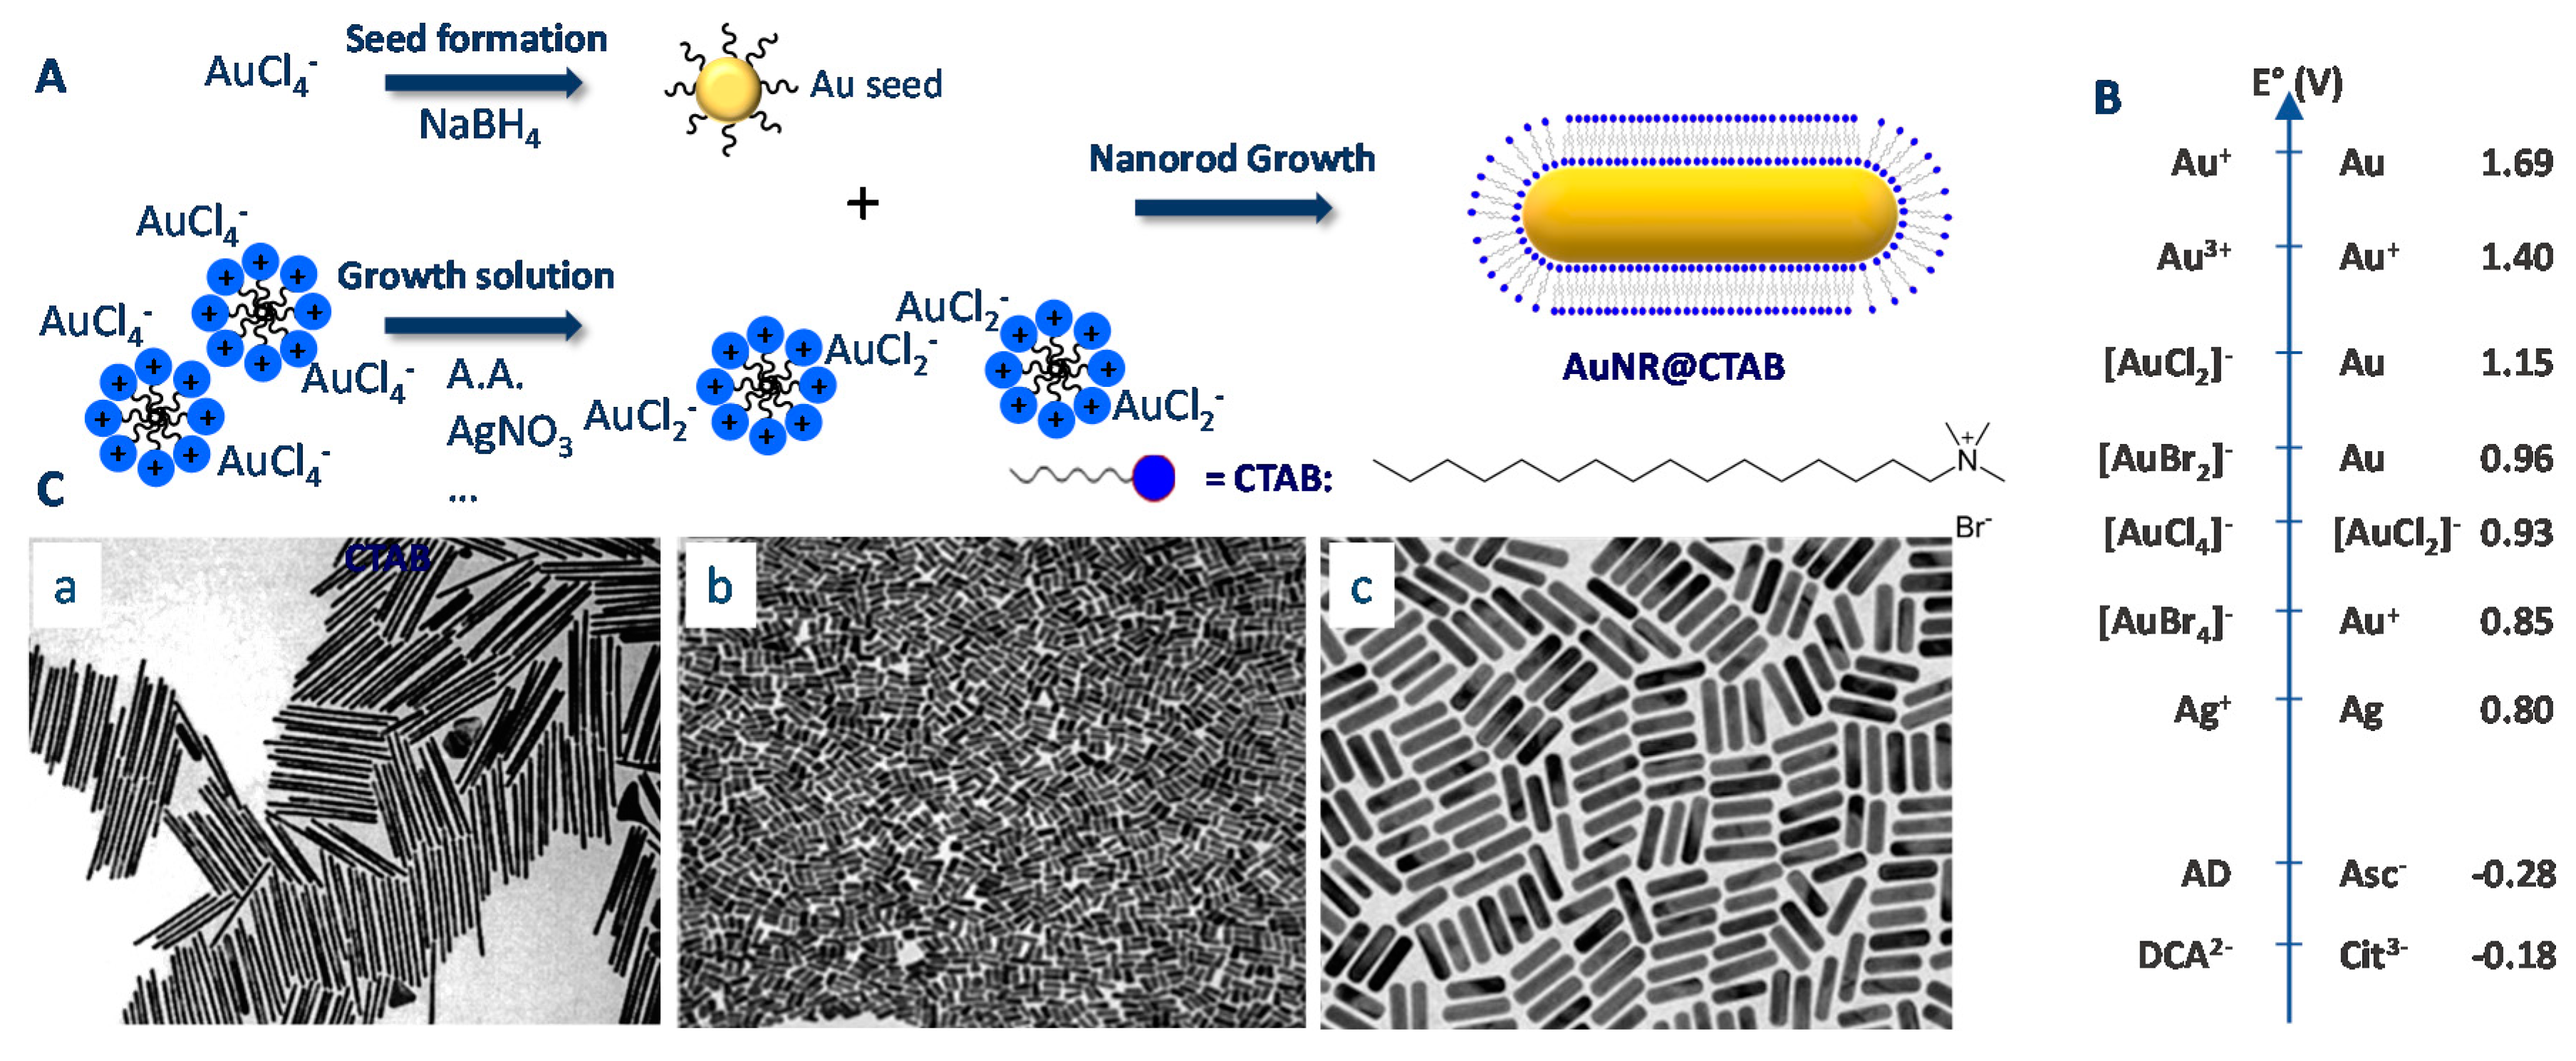
2.1. Gold Nanorods
2.1.1. Historical Background
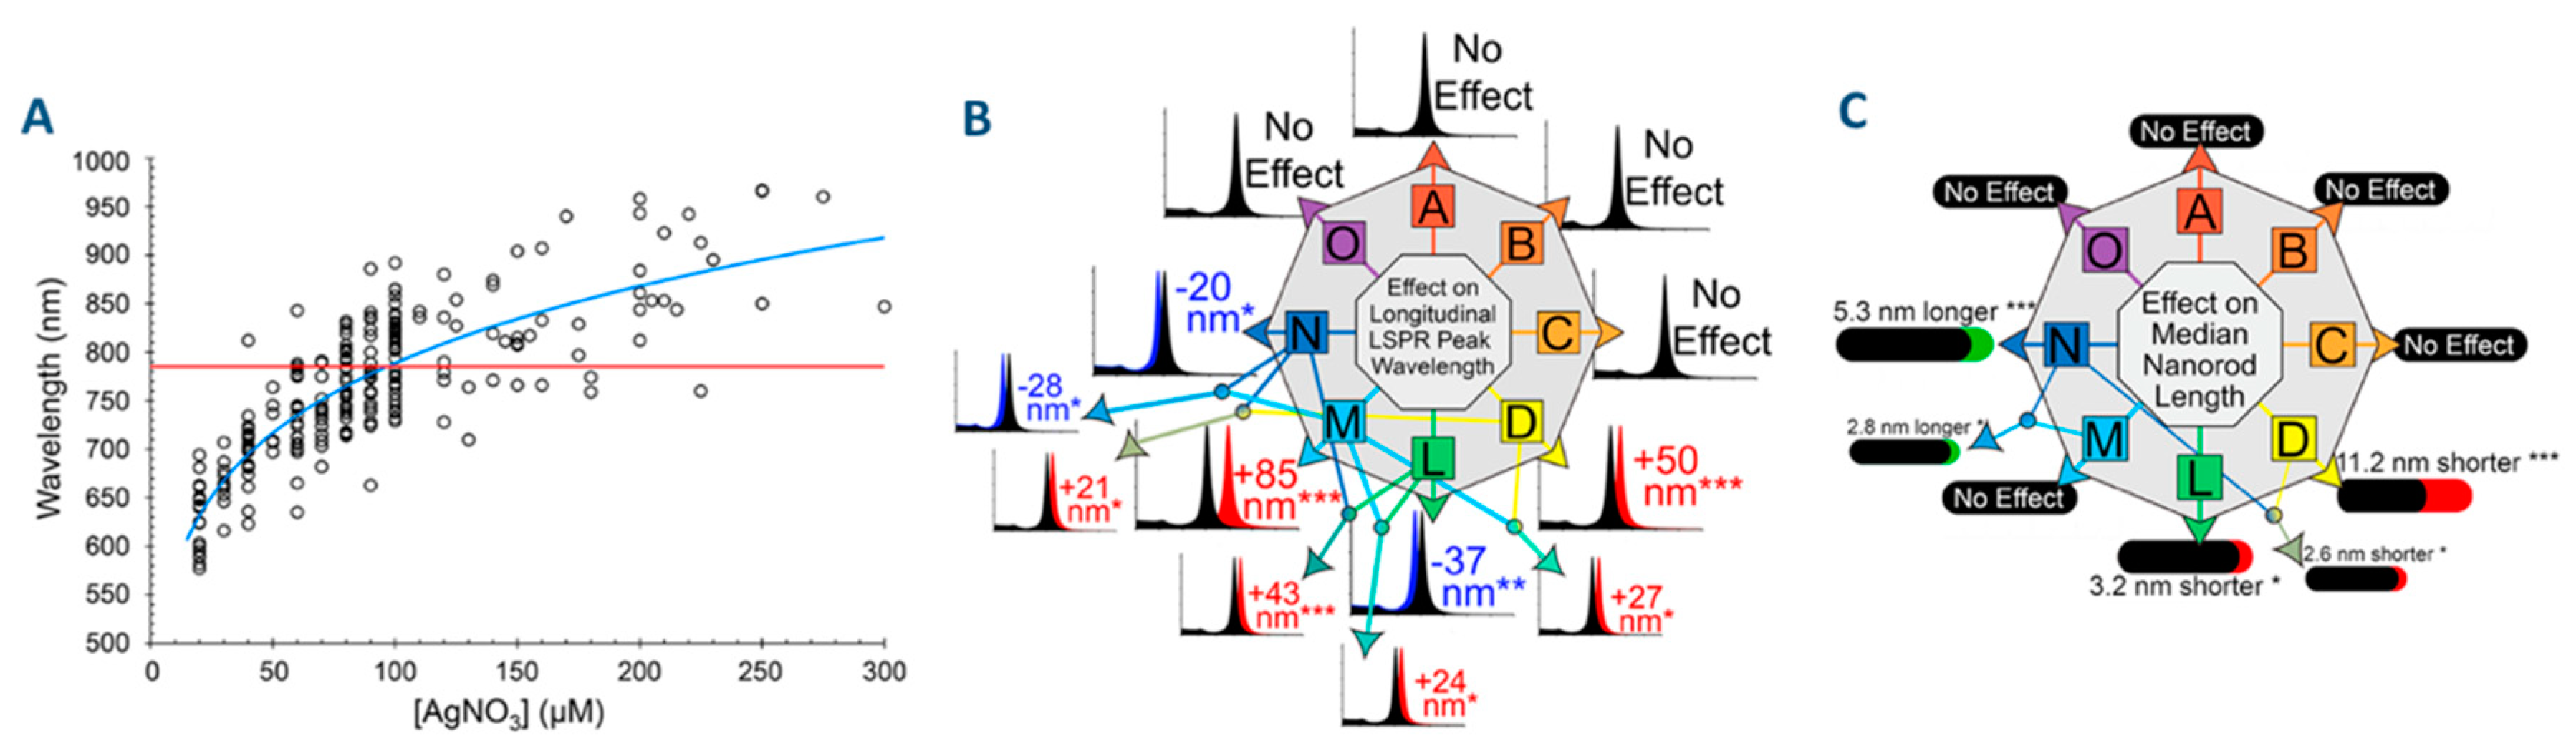
2.1.2. Origins of the Lack of Reproducibility in the Synthesis of AuNRs
2.1.3. Other Difficulties Often Encountered in the Preparation of AuNRs
- Low yield in reduced gold
- Presence of Au particles with other shapes and/or too large distribution of AR.
- High cost of synthesis
2.1.4. Short Shelf-Life of AuNRs/Poor Stability of AuNRs in Oxidizing Conditions
2.1.5. Difficulties in Scaling up the Synthesis
2.2. Silica Coating of Gold Nanorods (AuNR@SiO2)
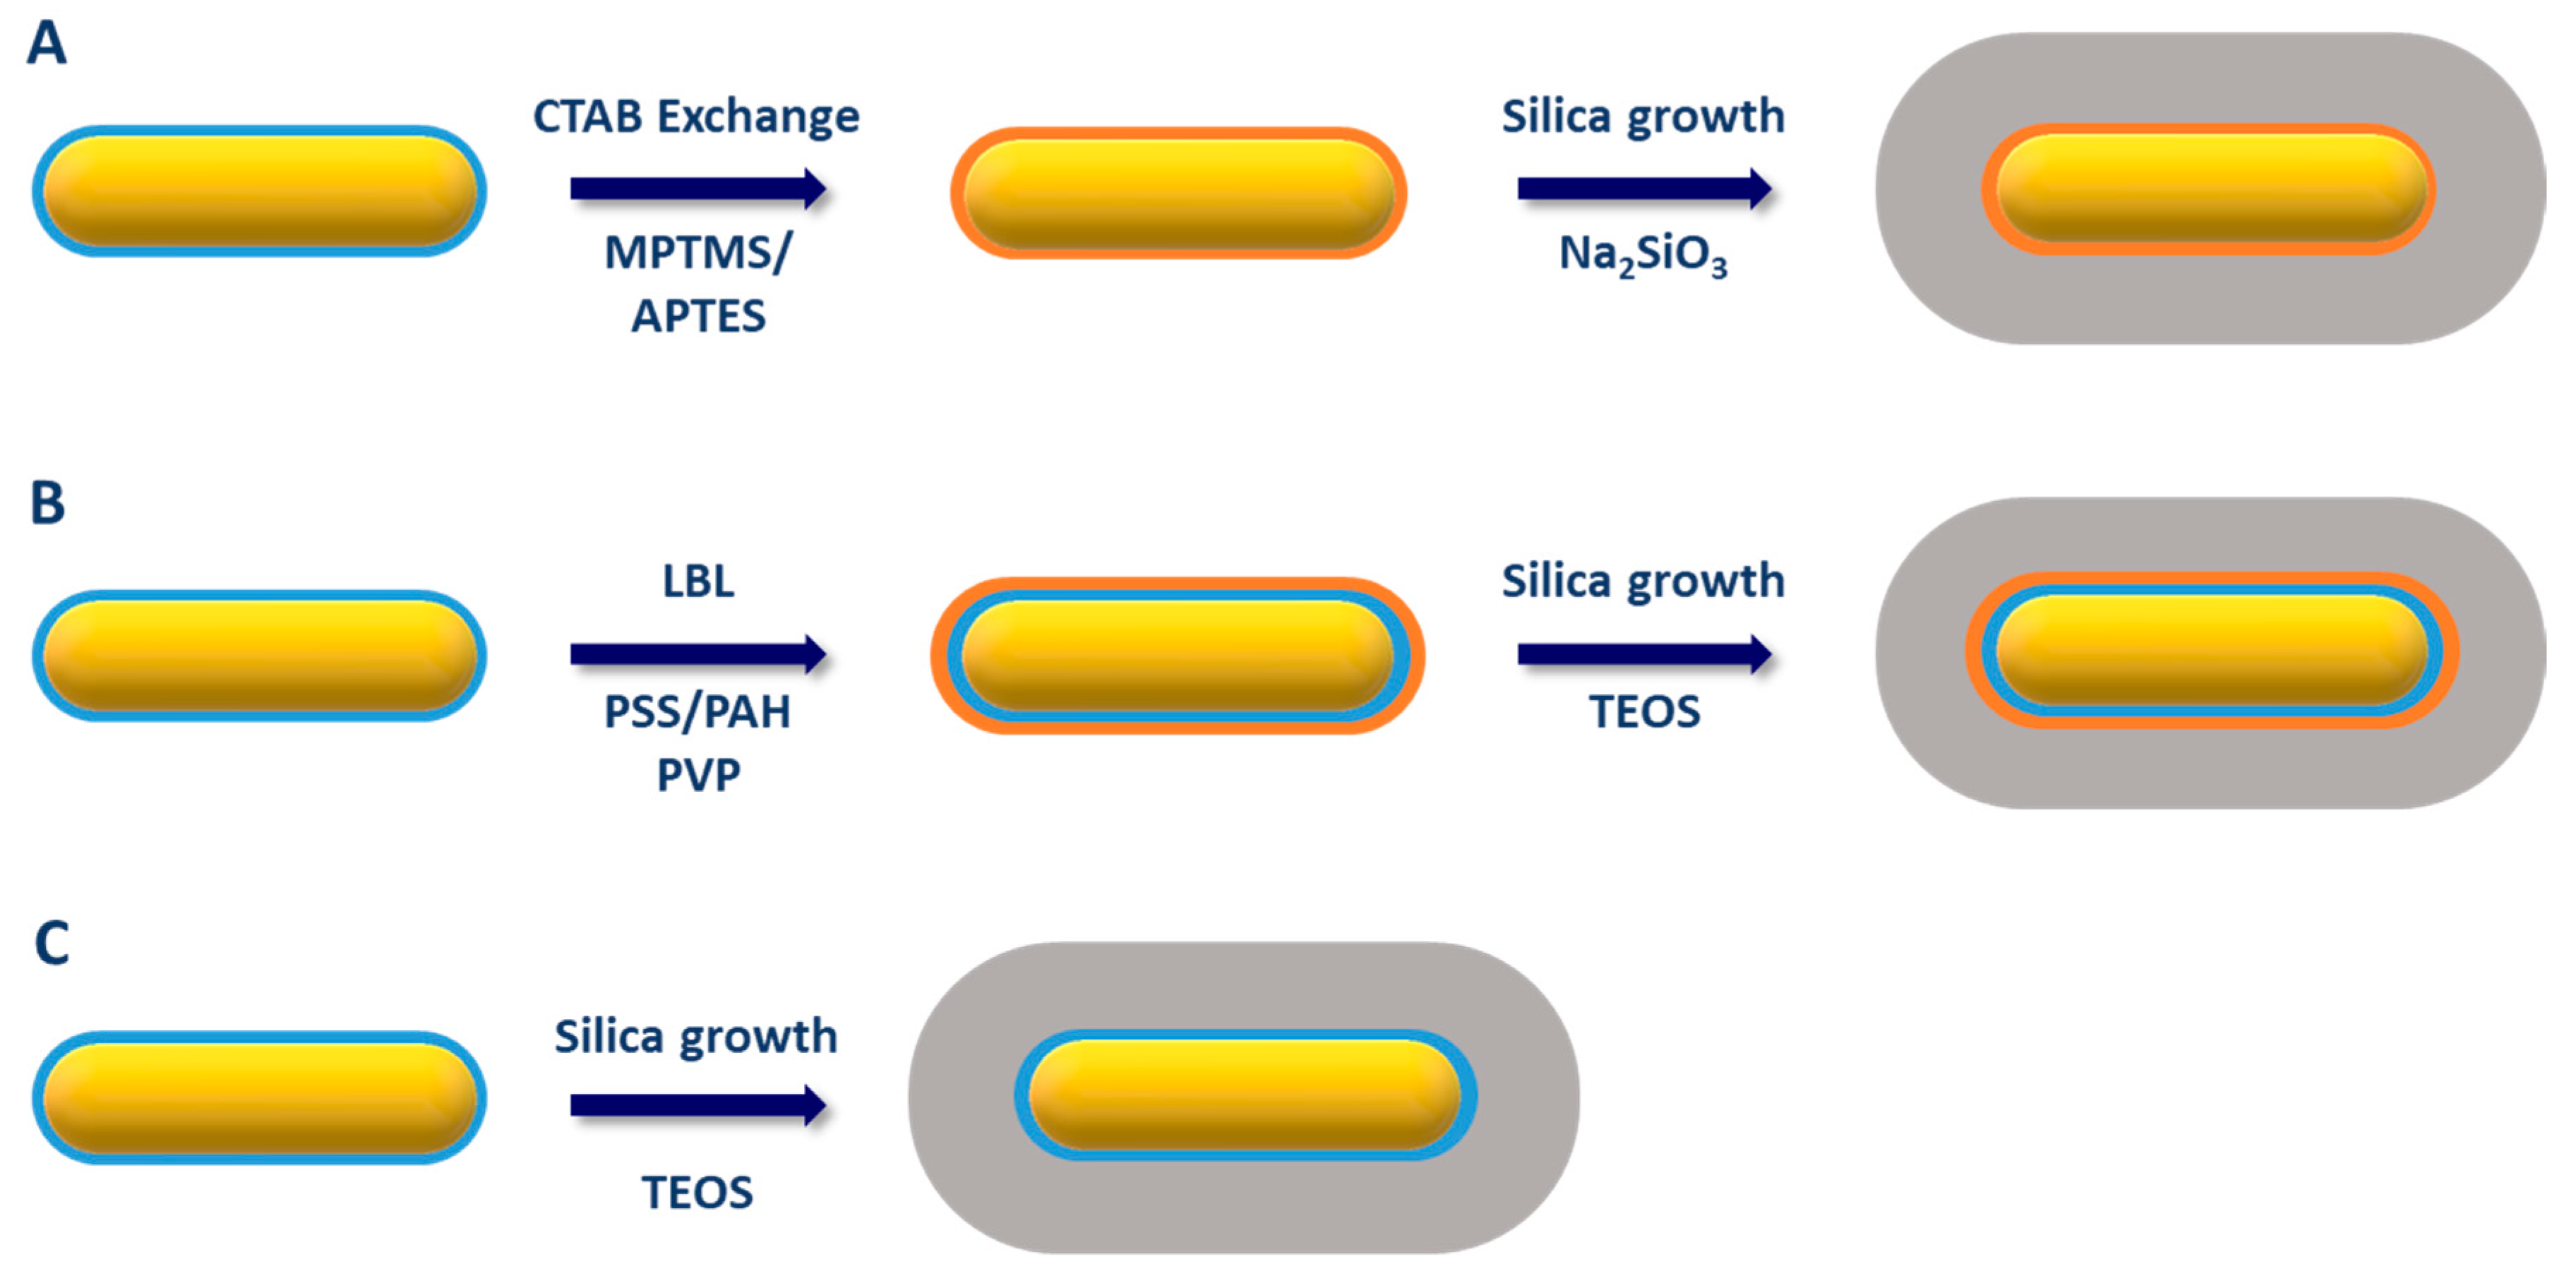
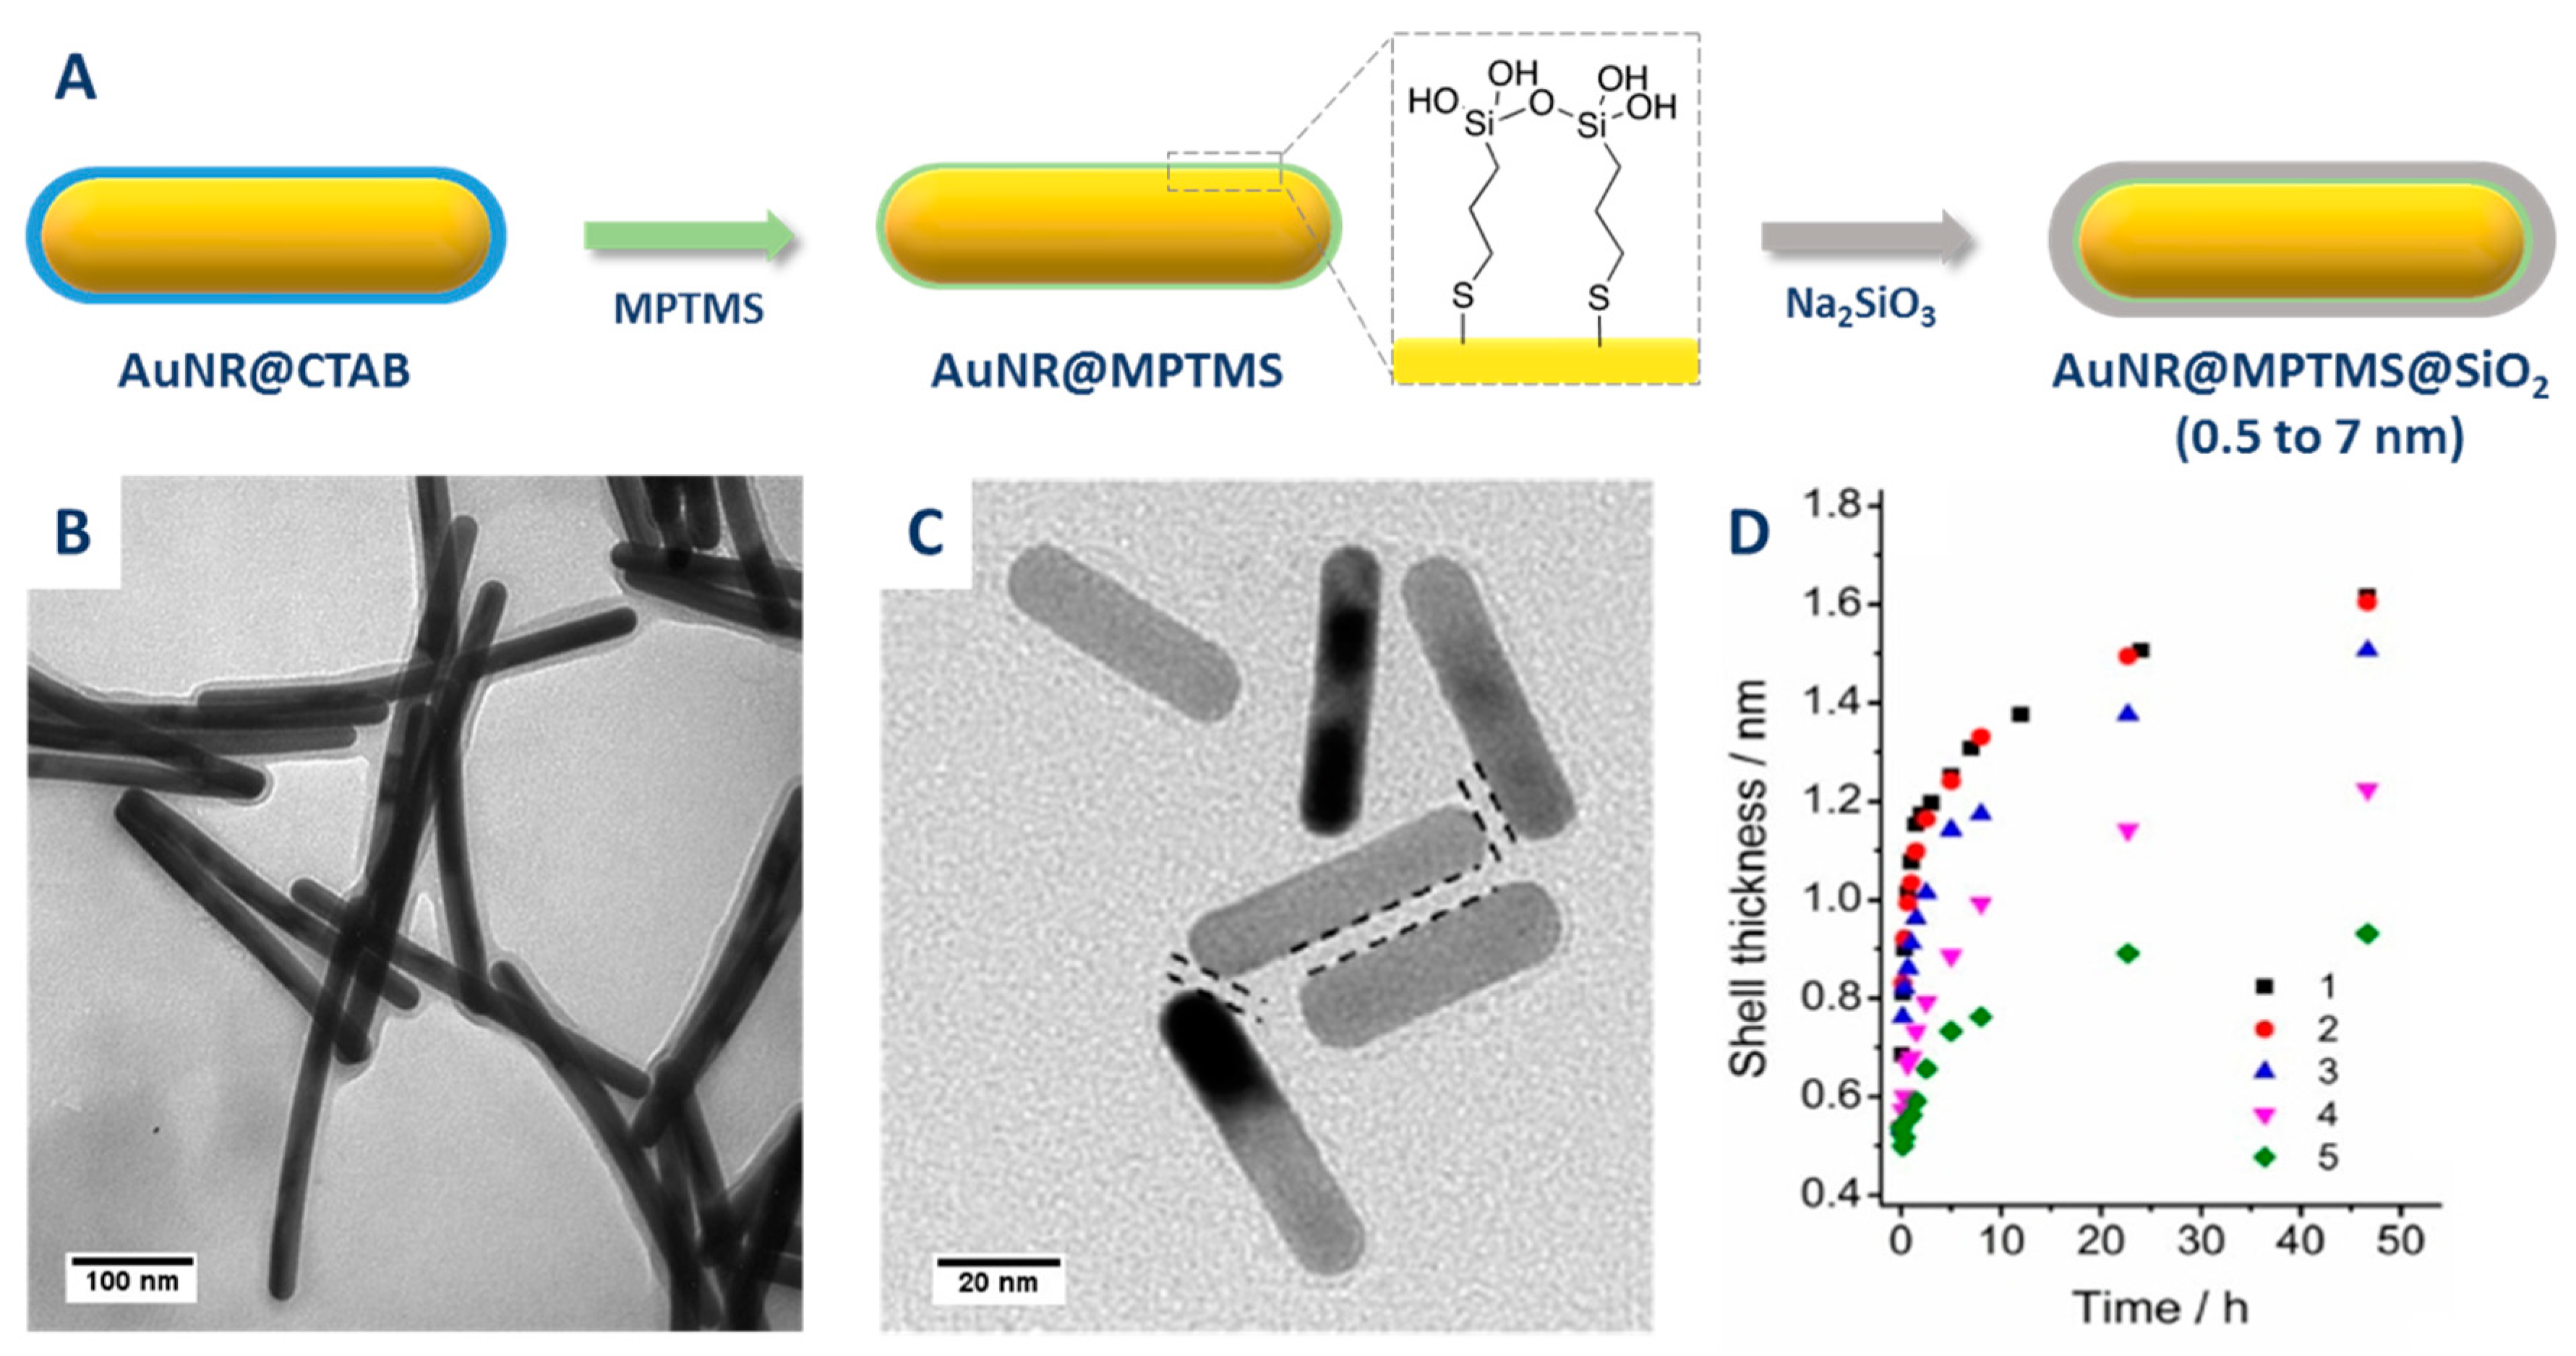
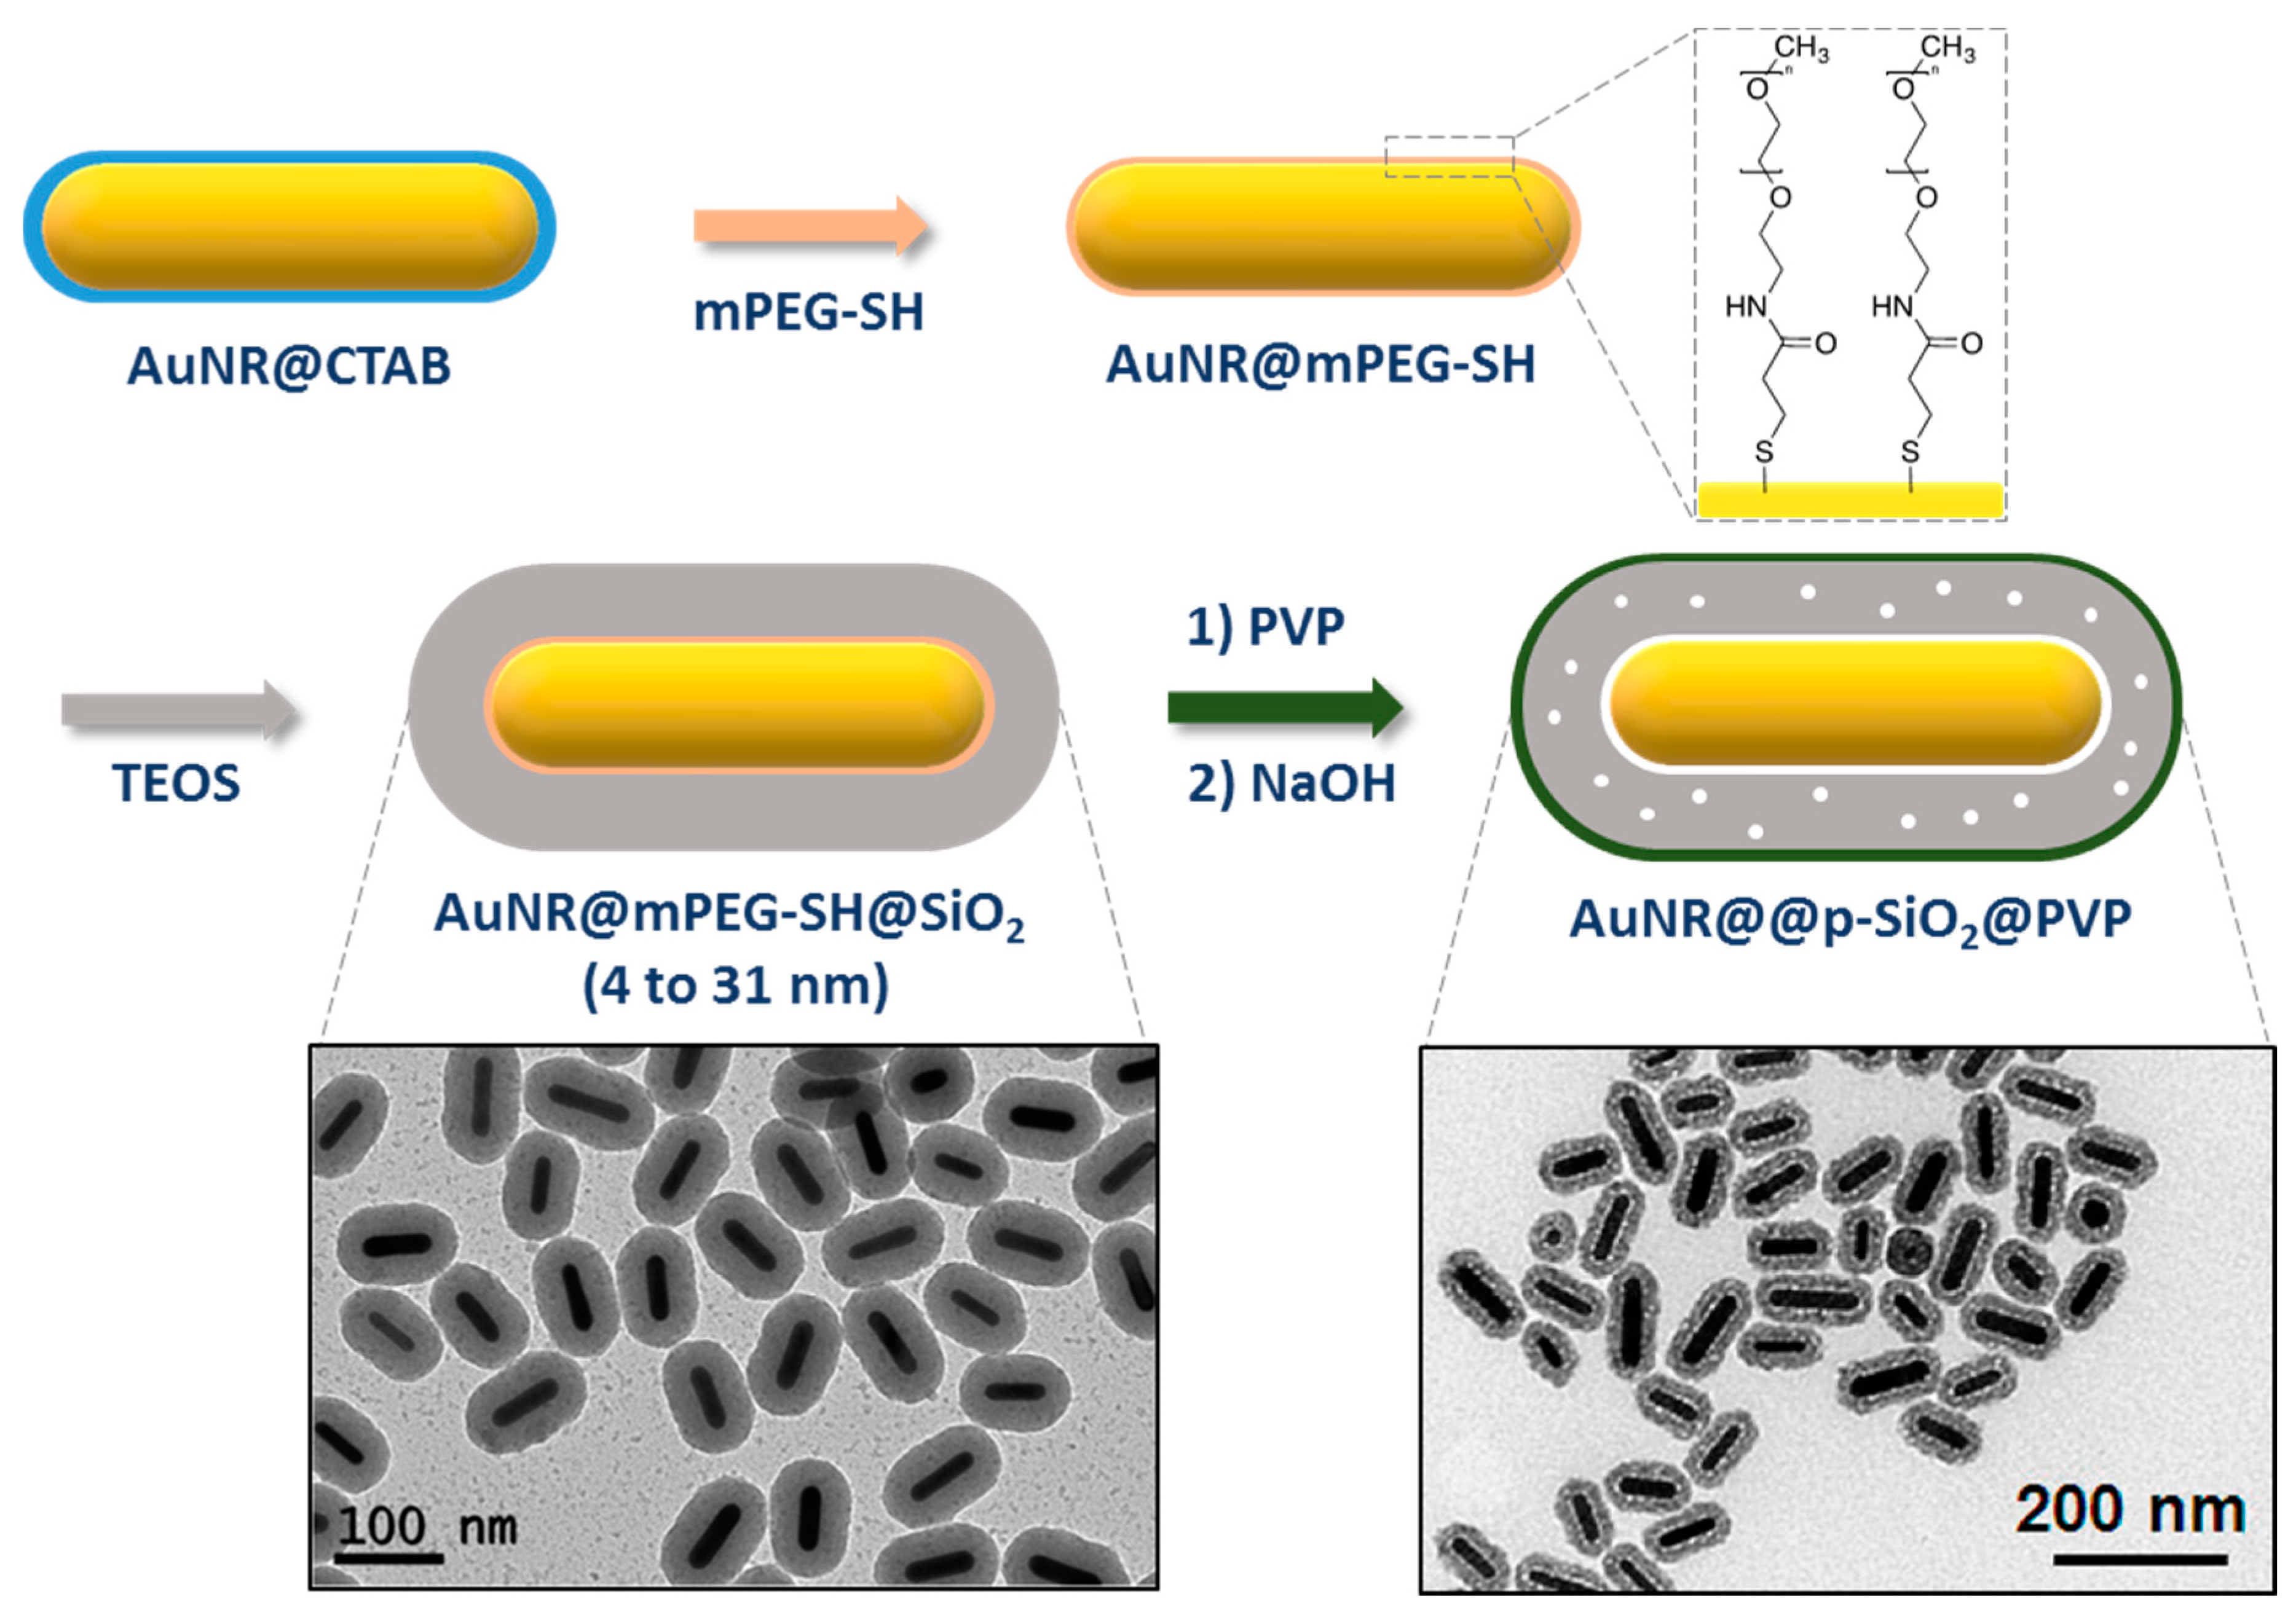
2.2.1. CTAB Exchange by a Functional Primer
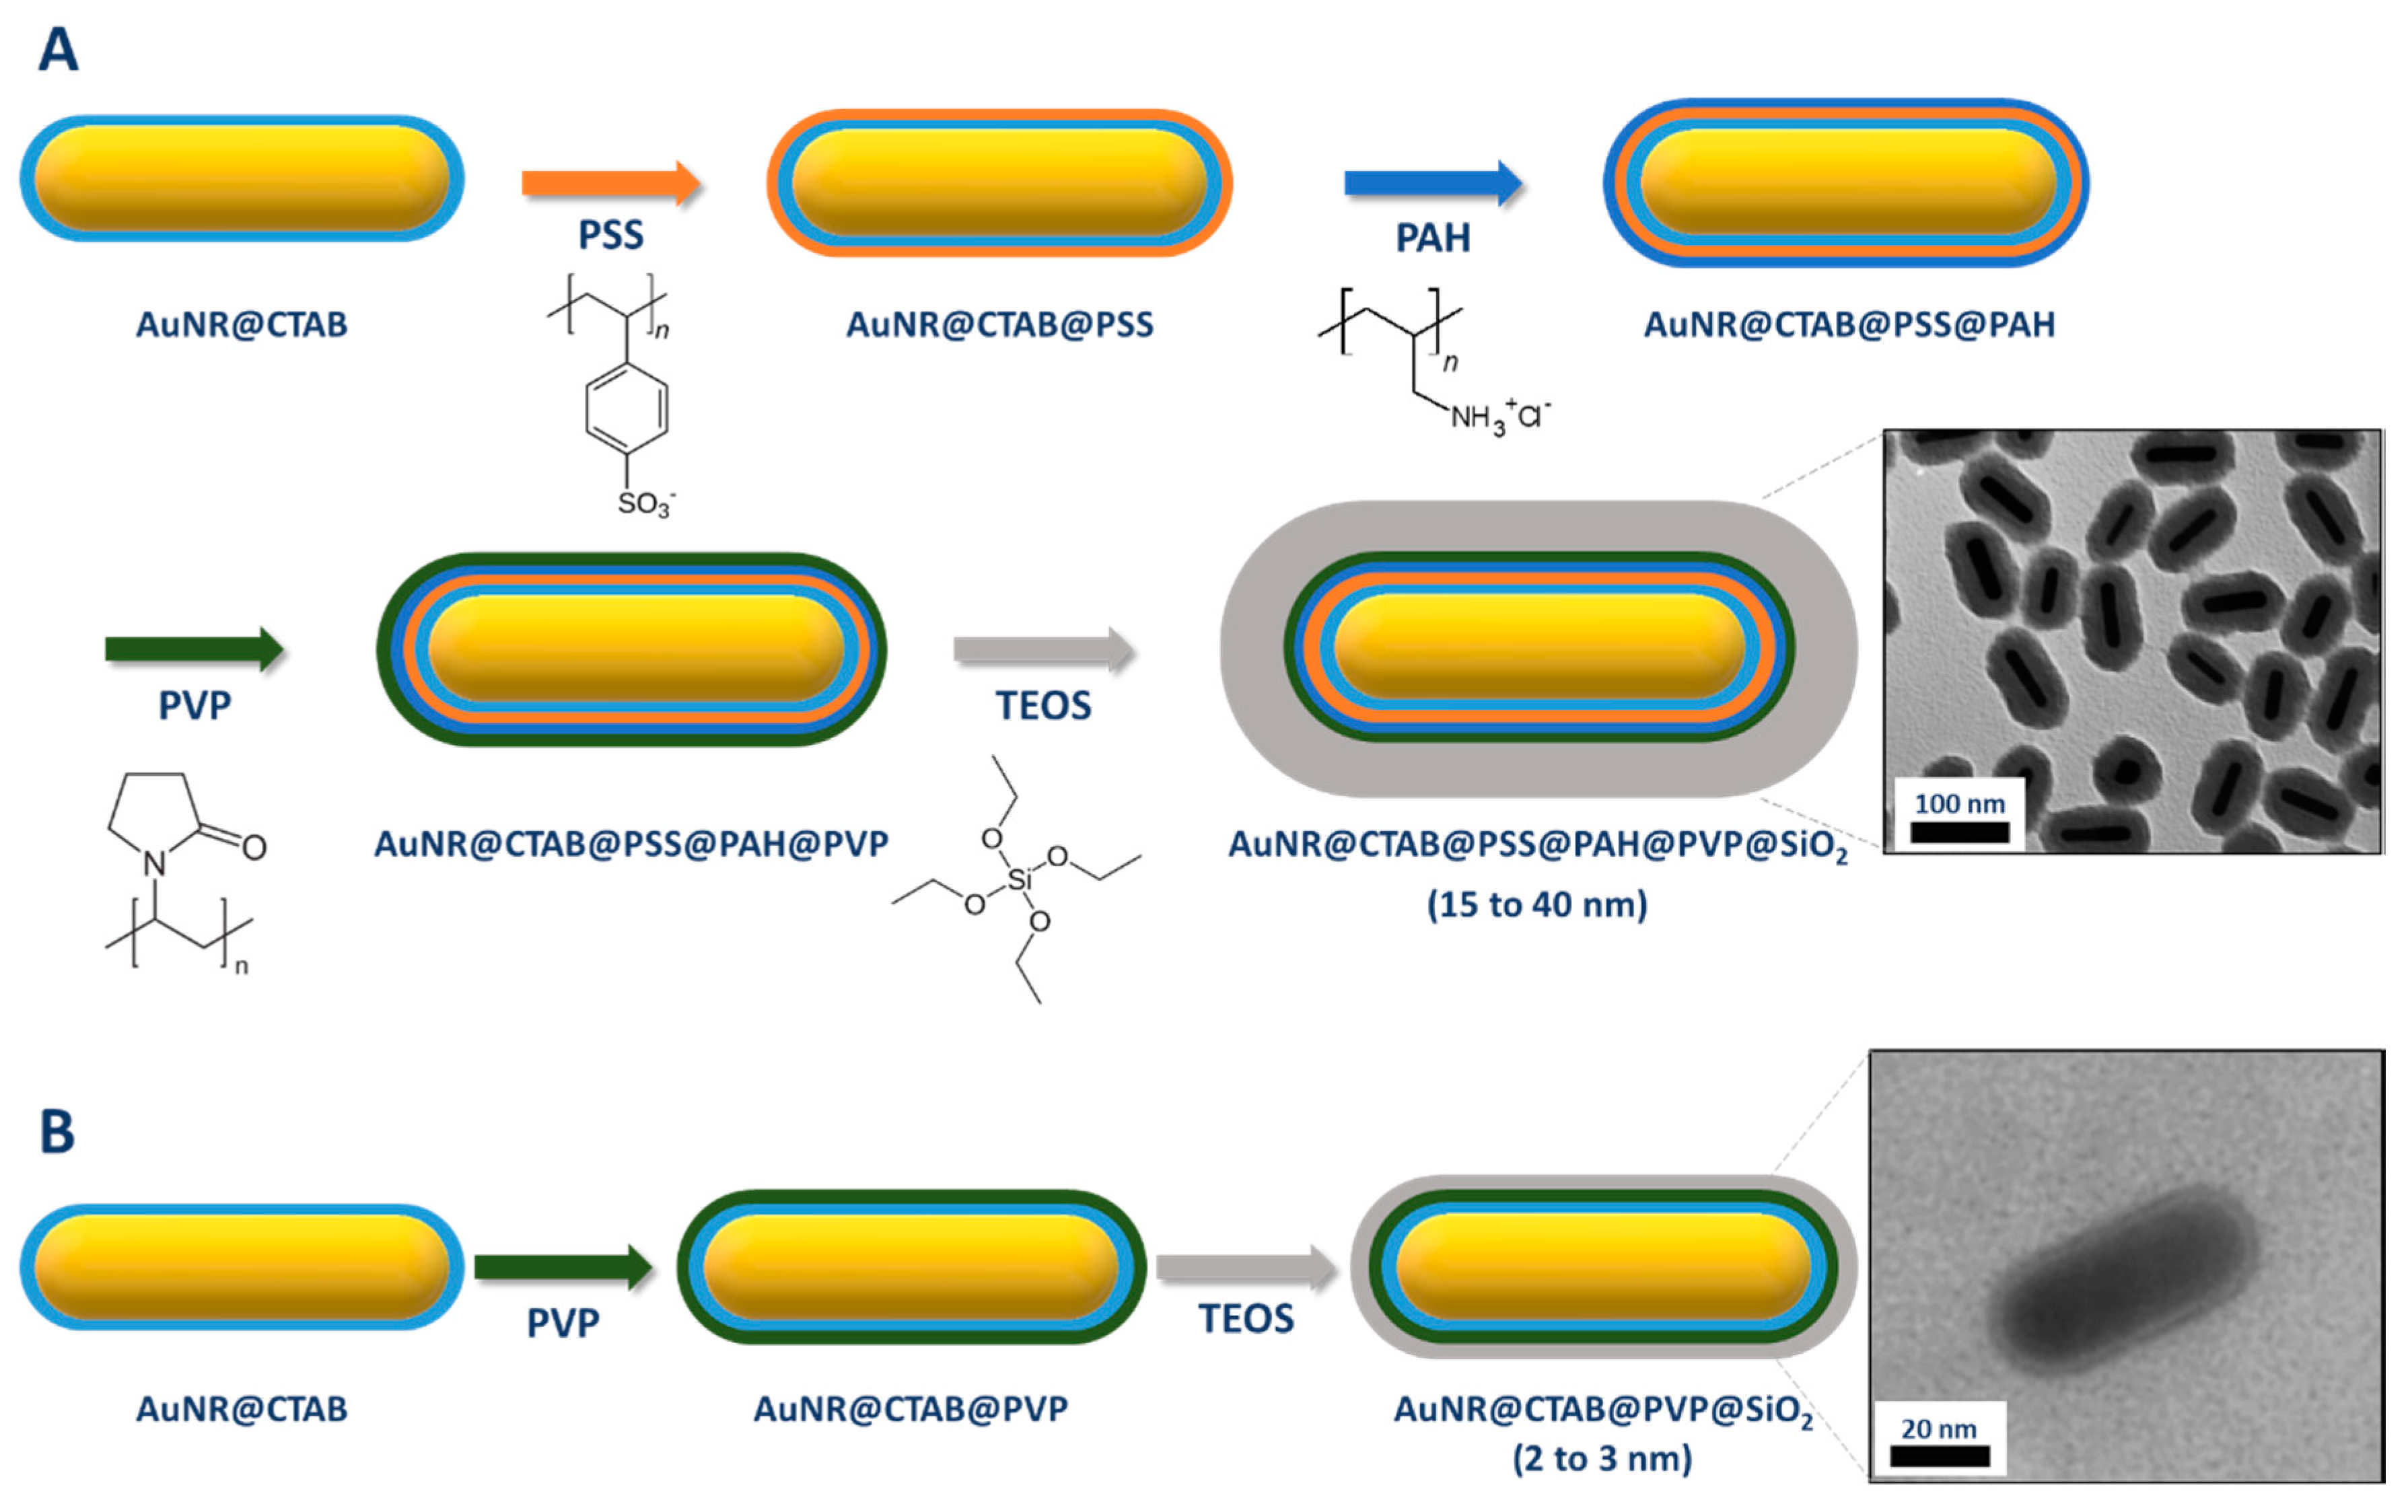
2.2.2. Coating through a Primer on Top of CTAB Bilayer
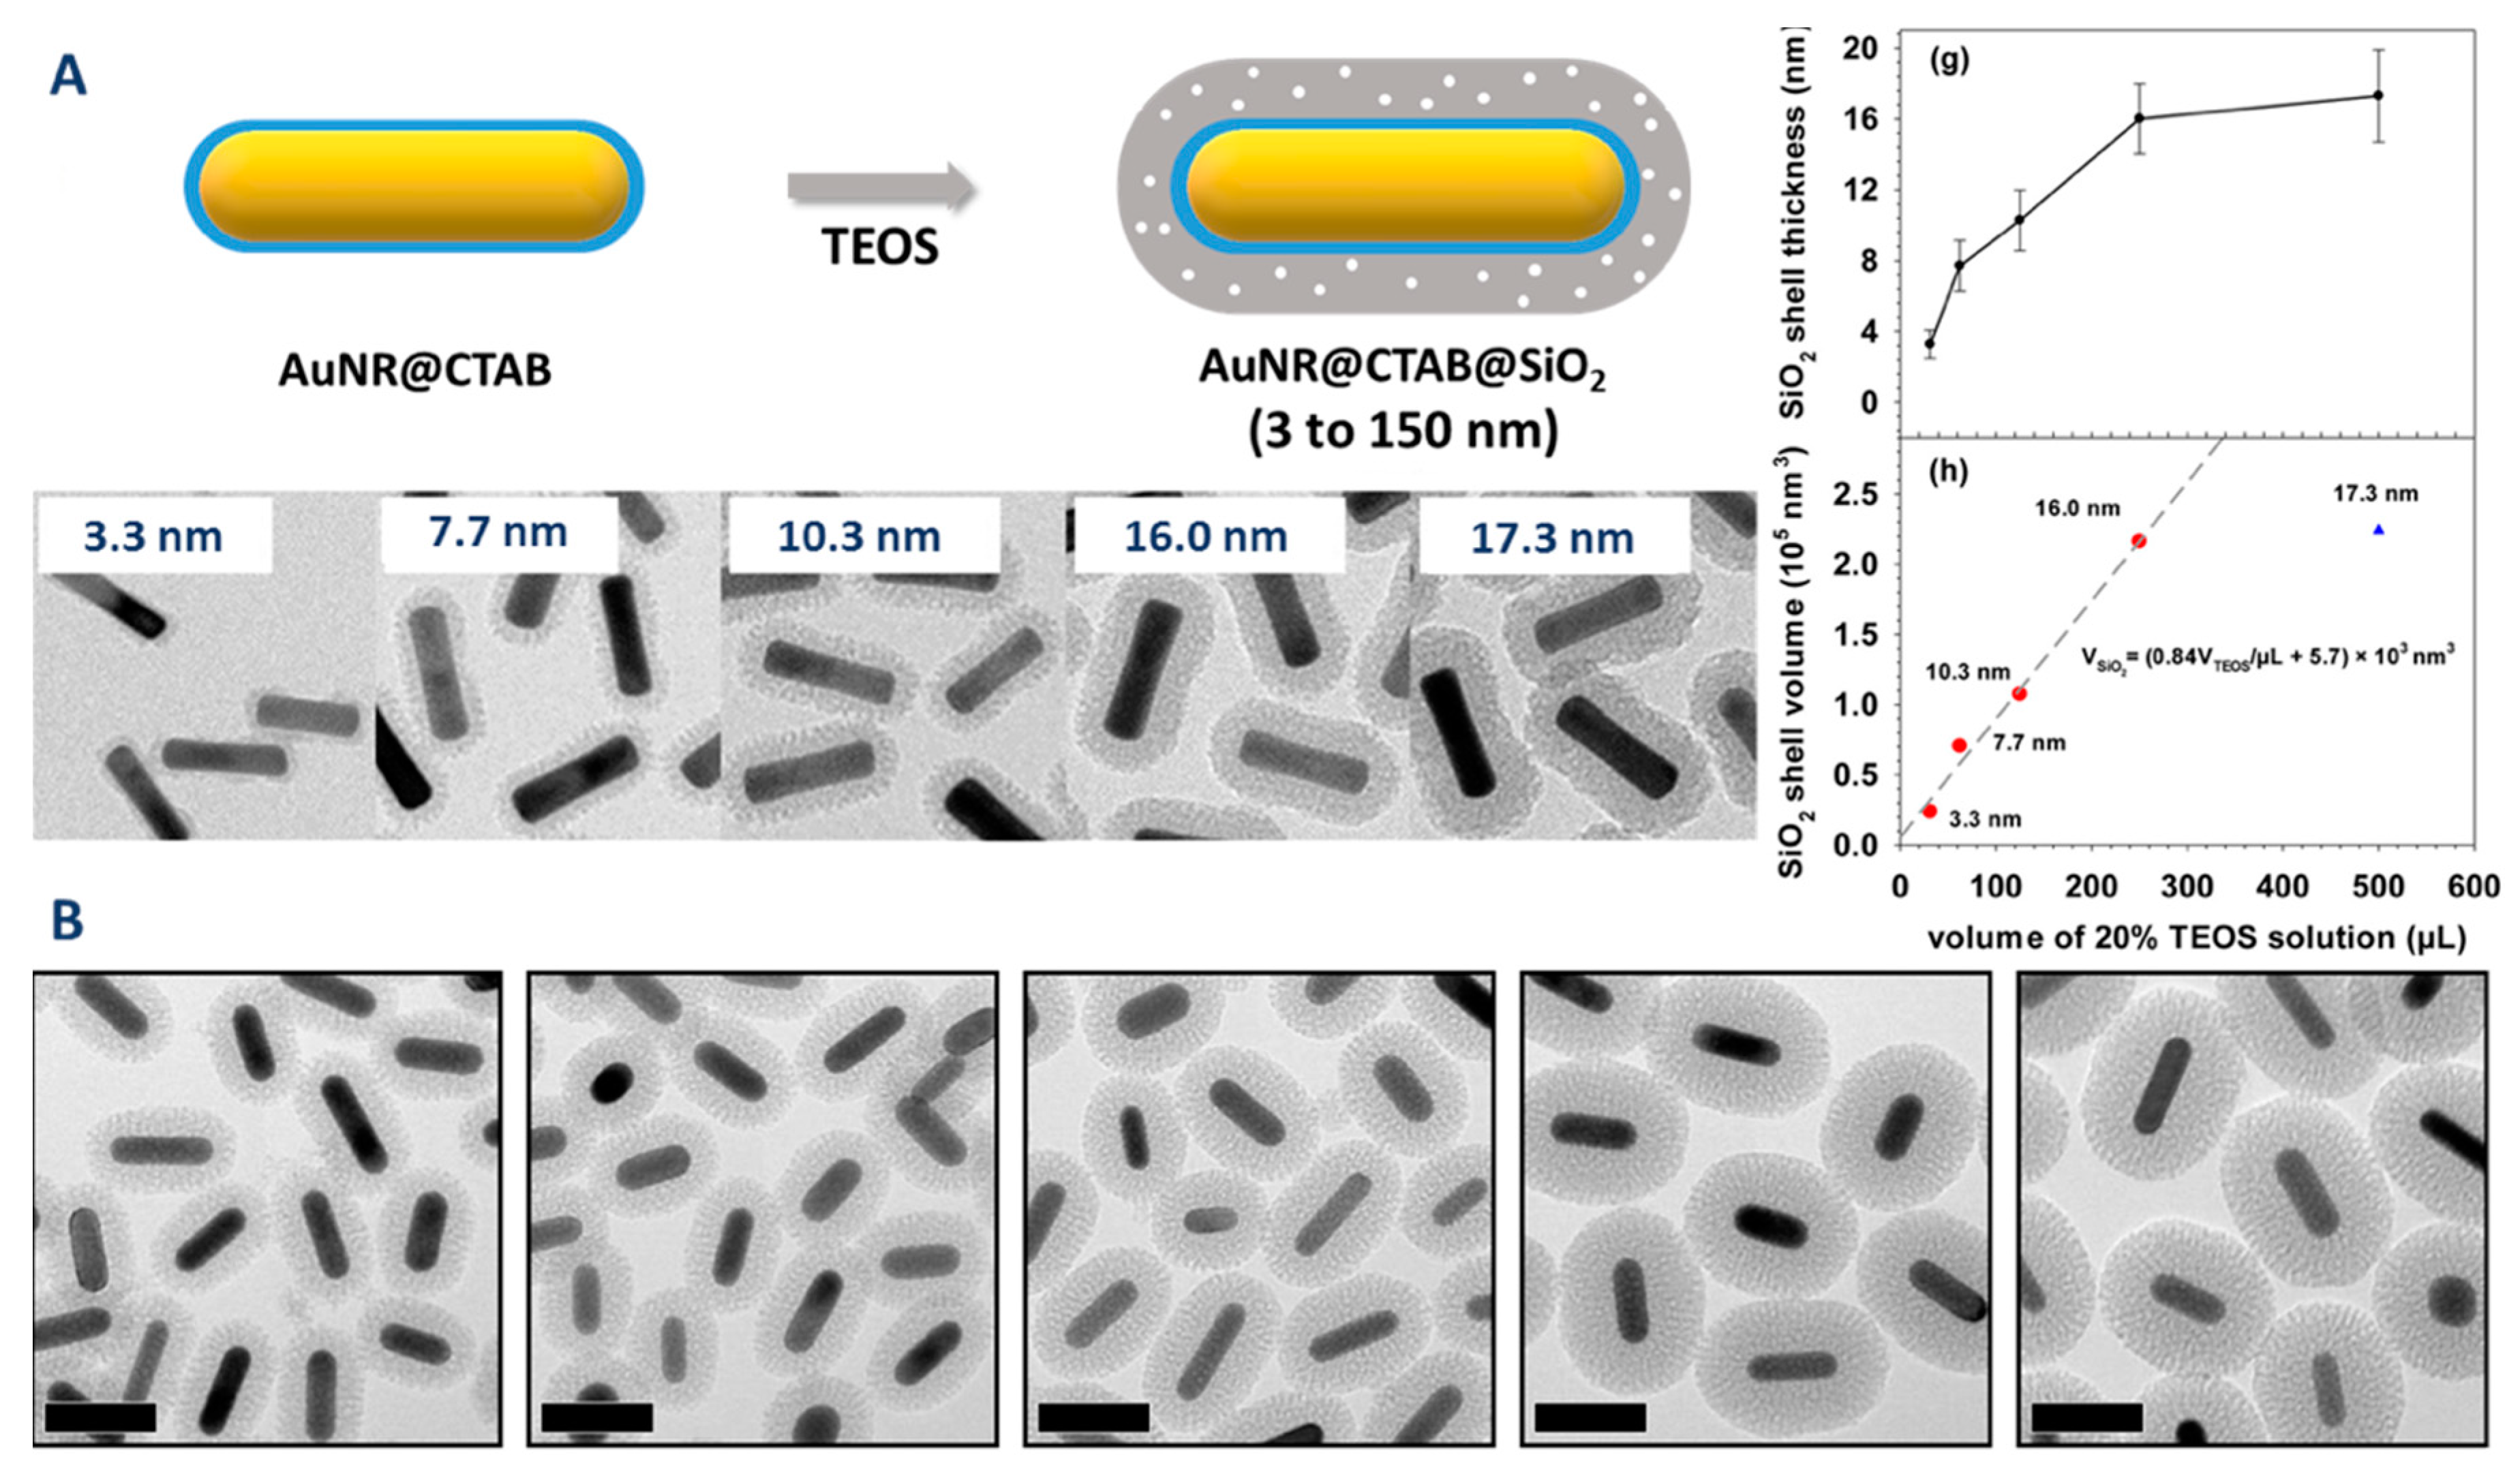
2.2.3. Direct Coating of AuNR with a Mesoporous Silica Shell
2.2.4. Other Strategies
2.2.5. Commonly Encountered Difficulties and Their Remedies
- Core-free silica particles
- Dumbbell-shaped coatings
- Removal of CTAB
2.2.6. Concluding Remarks
3. Methods of Characterization
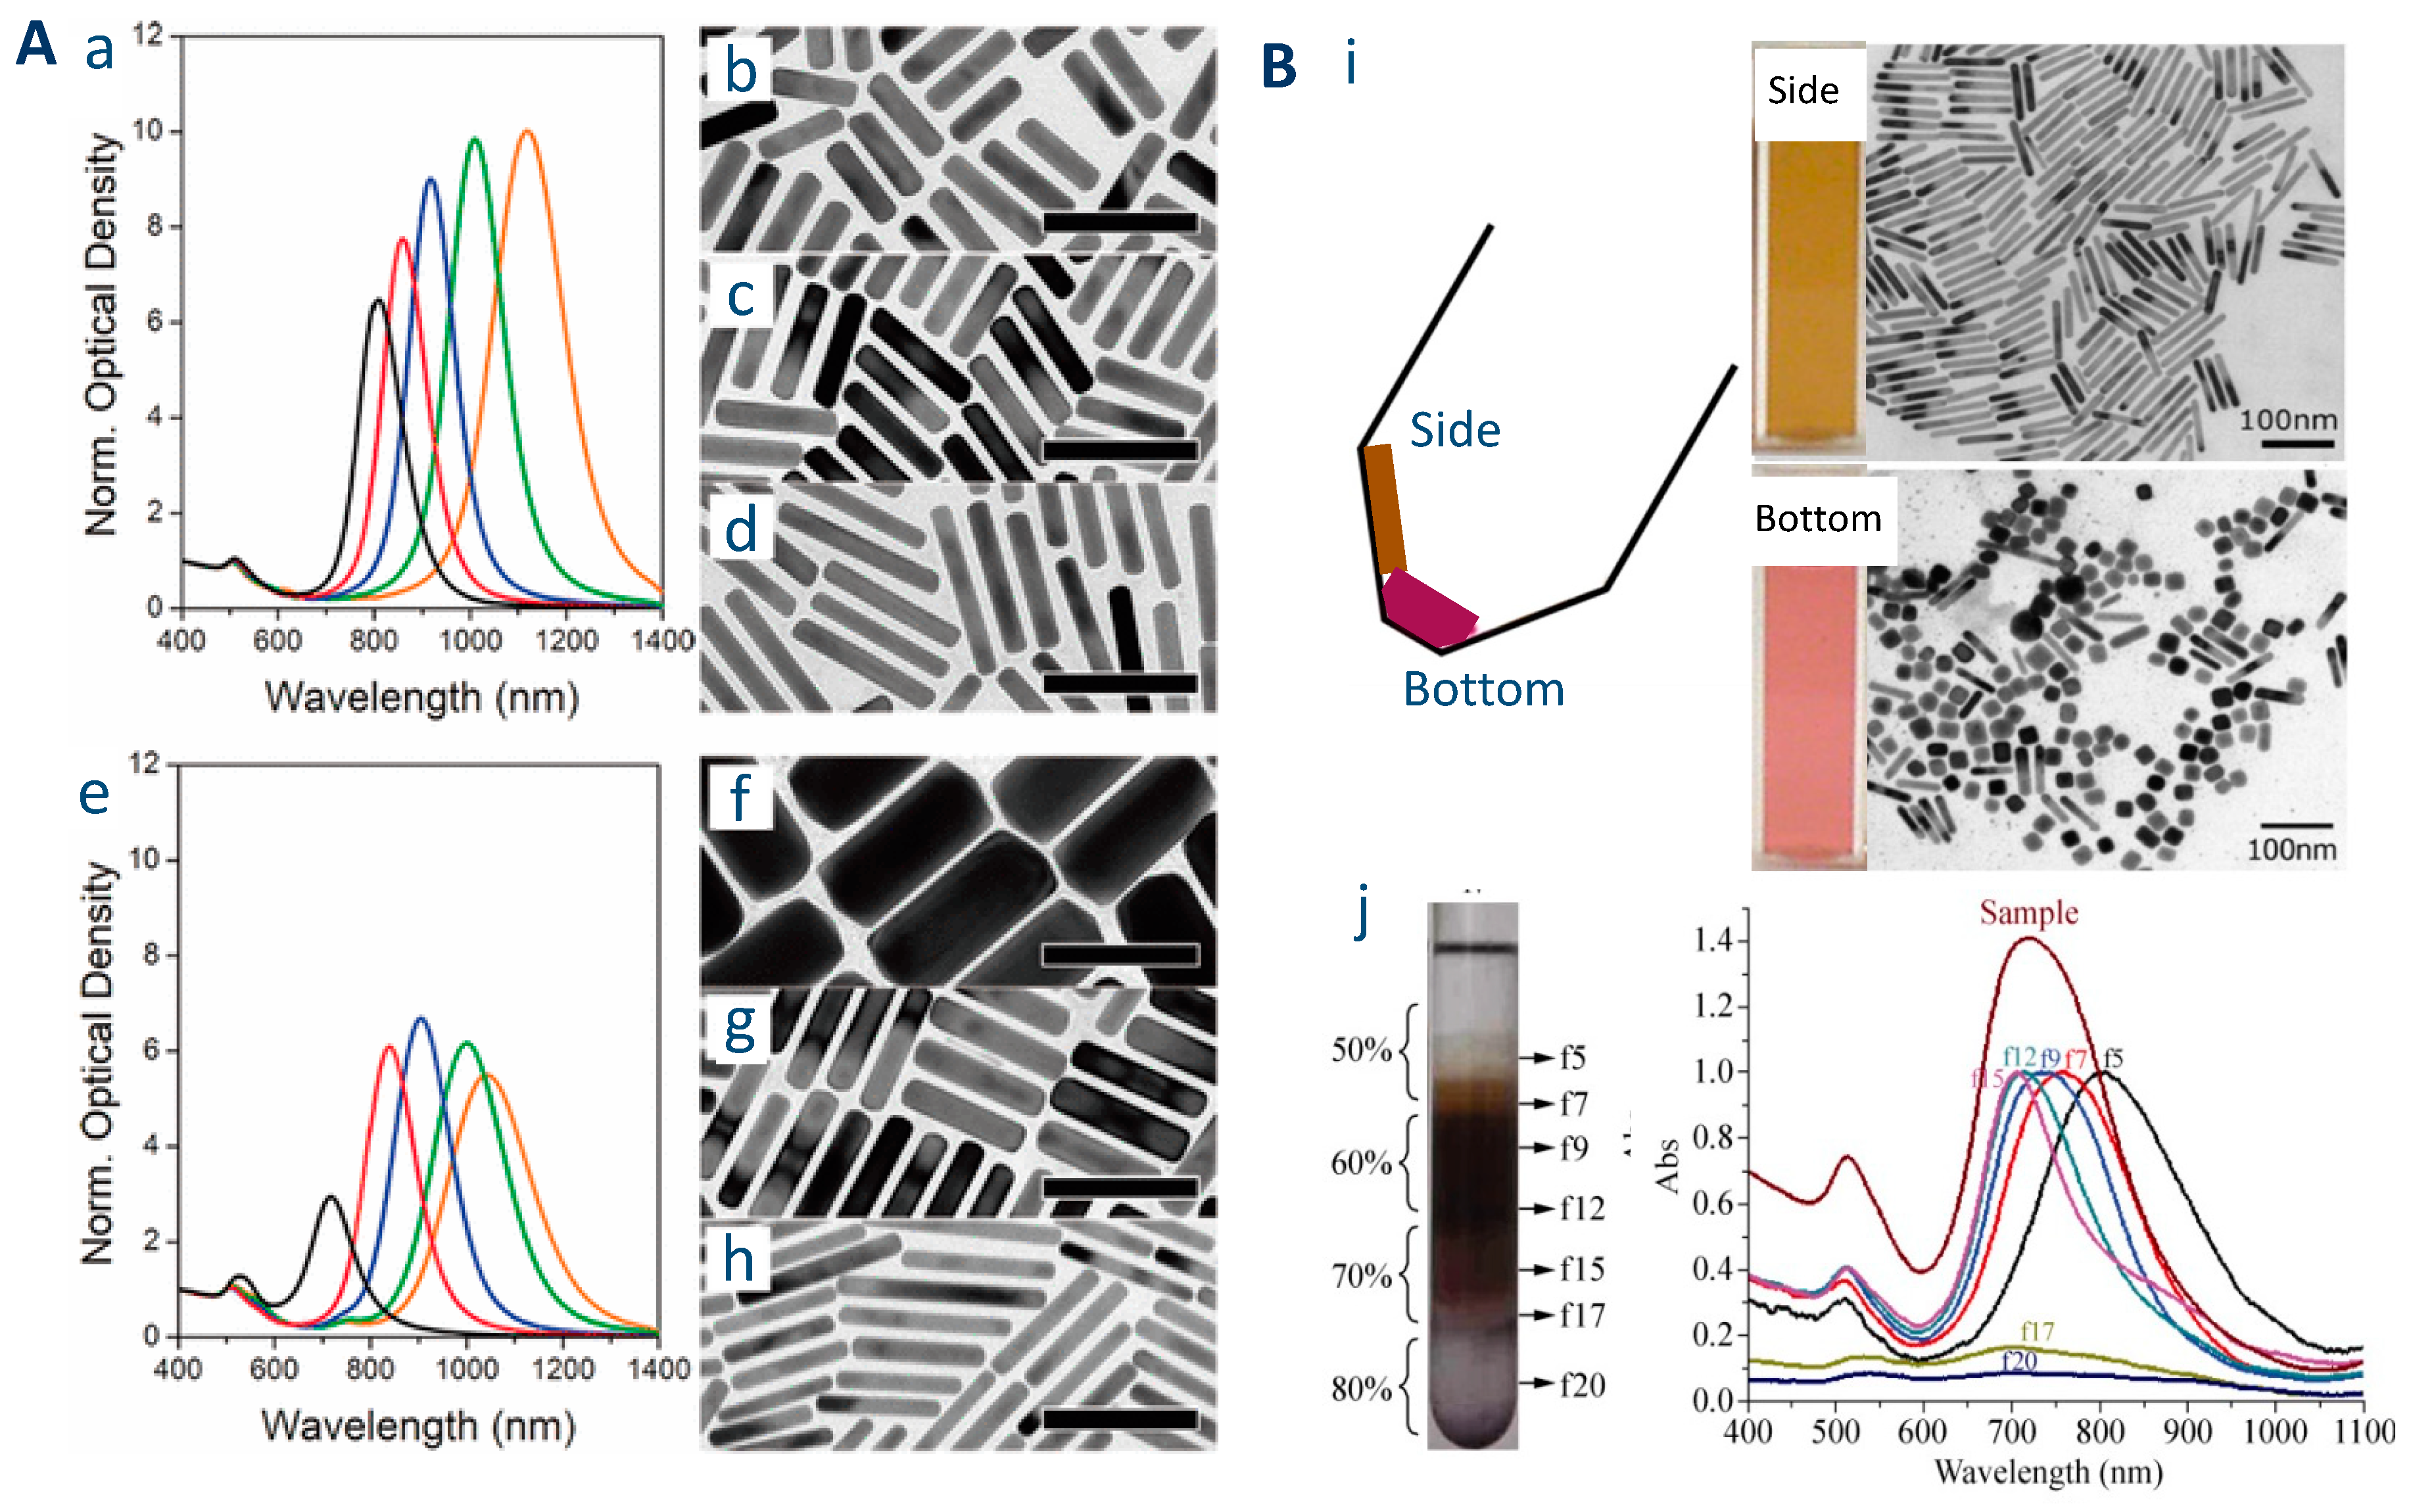
3.1. UV-Visible Spectroscopy
- The absorbance at 400 nm can be used for the quantitation of reduced gold (see details in the section of this chapter dedicated to quantitation);
- The intensity ratio between l- and t-LSPR bands is a good qualitative indication of the polydispersity (a high ratio indicates a low polydispersity in the dimensions of the nanorods);
- A shoulder close to the t-LSPR peak indicates the presence of AuNPs of other shapes (e.g., spherical AuNPs);
- The width and the symmetry of the l-LSPR band are related to the polydispersity of the sample (a larger width and/or an asymmetric shape indicates a higher polydispersity).
3.2. Electronic Microscopy
- The handling of dried samples to analyze them in vacuum in the microscope chamber can also introduce multiple artefacts;
- The selection of a necessarily limited number of micrographs of the samples can introduce a biased overview of the sample or, at least, a measurement uncertainty. General statistics like Sturges’ rule [108] or specific studies dedicated to nanoparticle distributions [109] can help to evaluate the accuracy of this limited sampling. These problems are amplified by the difficulty of the manual or automatic analysis of the dimensions of such objects on micrographs;
- It is usually advised to analyze 200–300 nanorods to obtain a reasonable evaluation of the average dimensions and polydispersity in size of the nanorods, which can be time consuming if performed manually with a software such as ImageJ and automatic analysis is often not efficient (especially when particles of different shapes are present). New developments in this field are oriented toward the automatic analysis of TEM images by the development of appropriate algorithms [110].
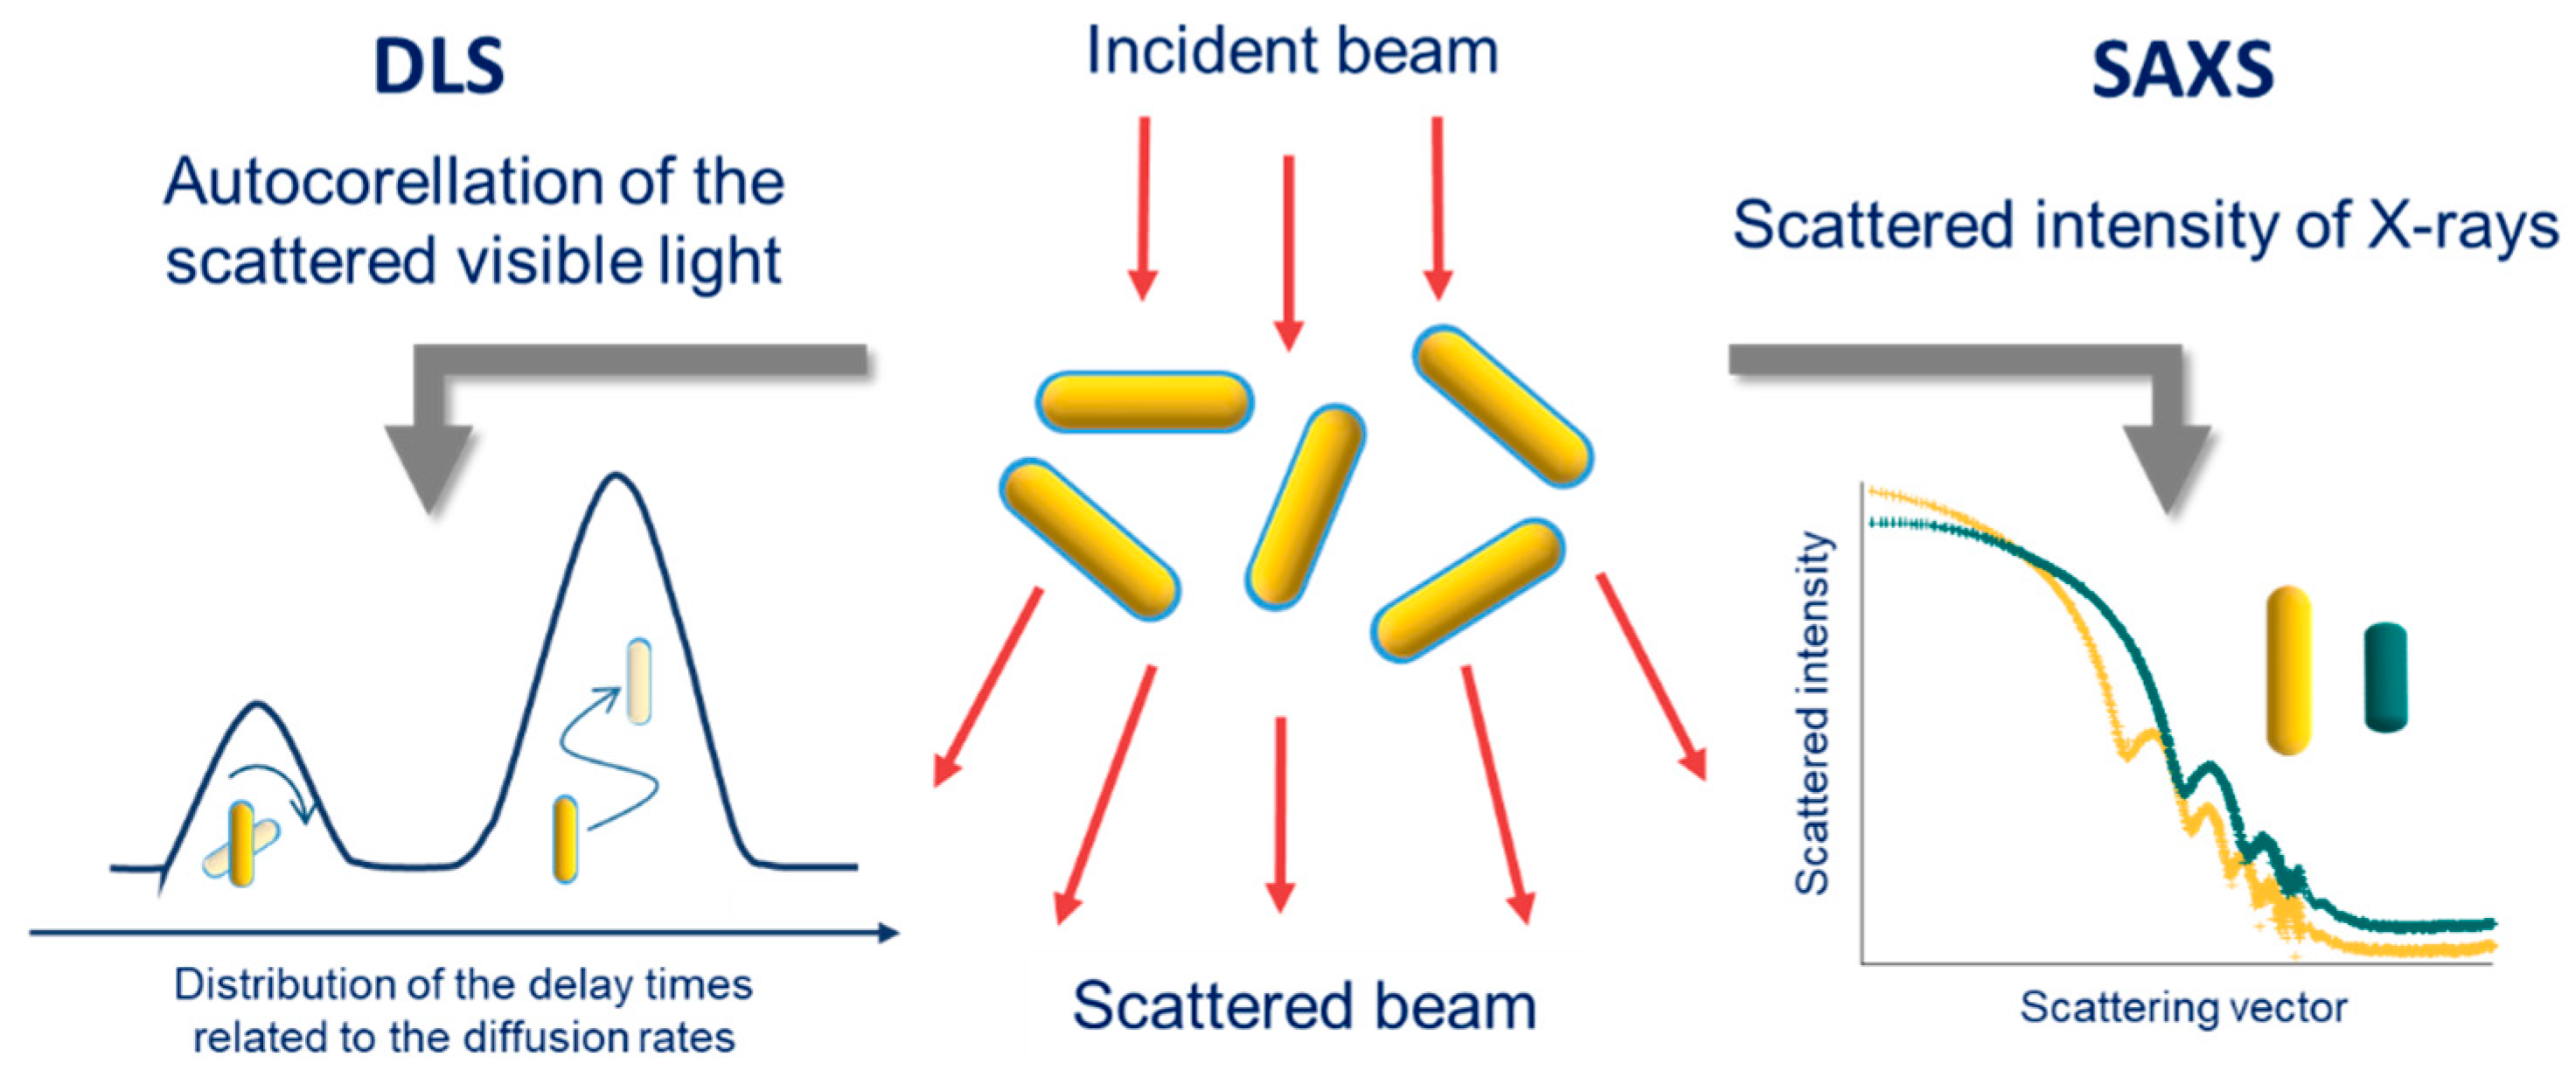
3.3. Scattering Techniques
3.3.1. DLS
3.3.2. SAXS
3.4. Other Characterizations
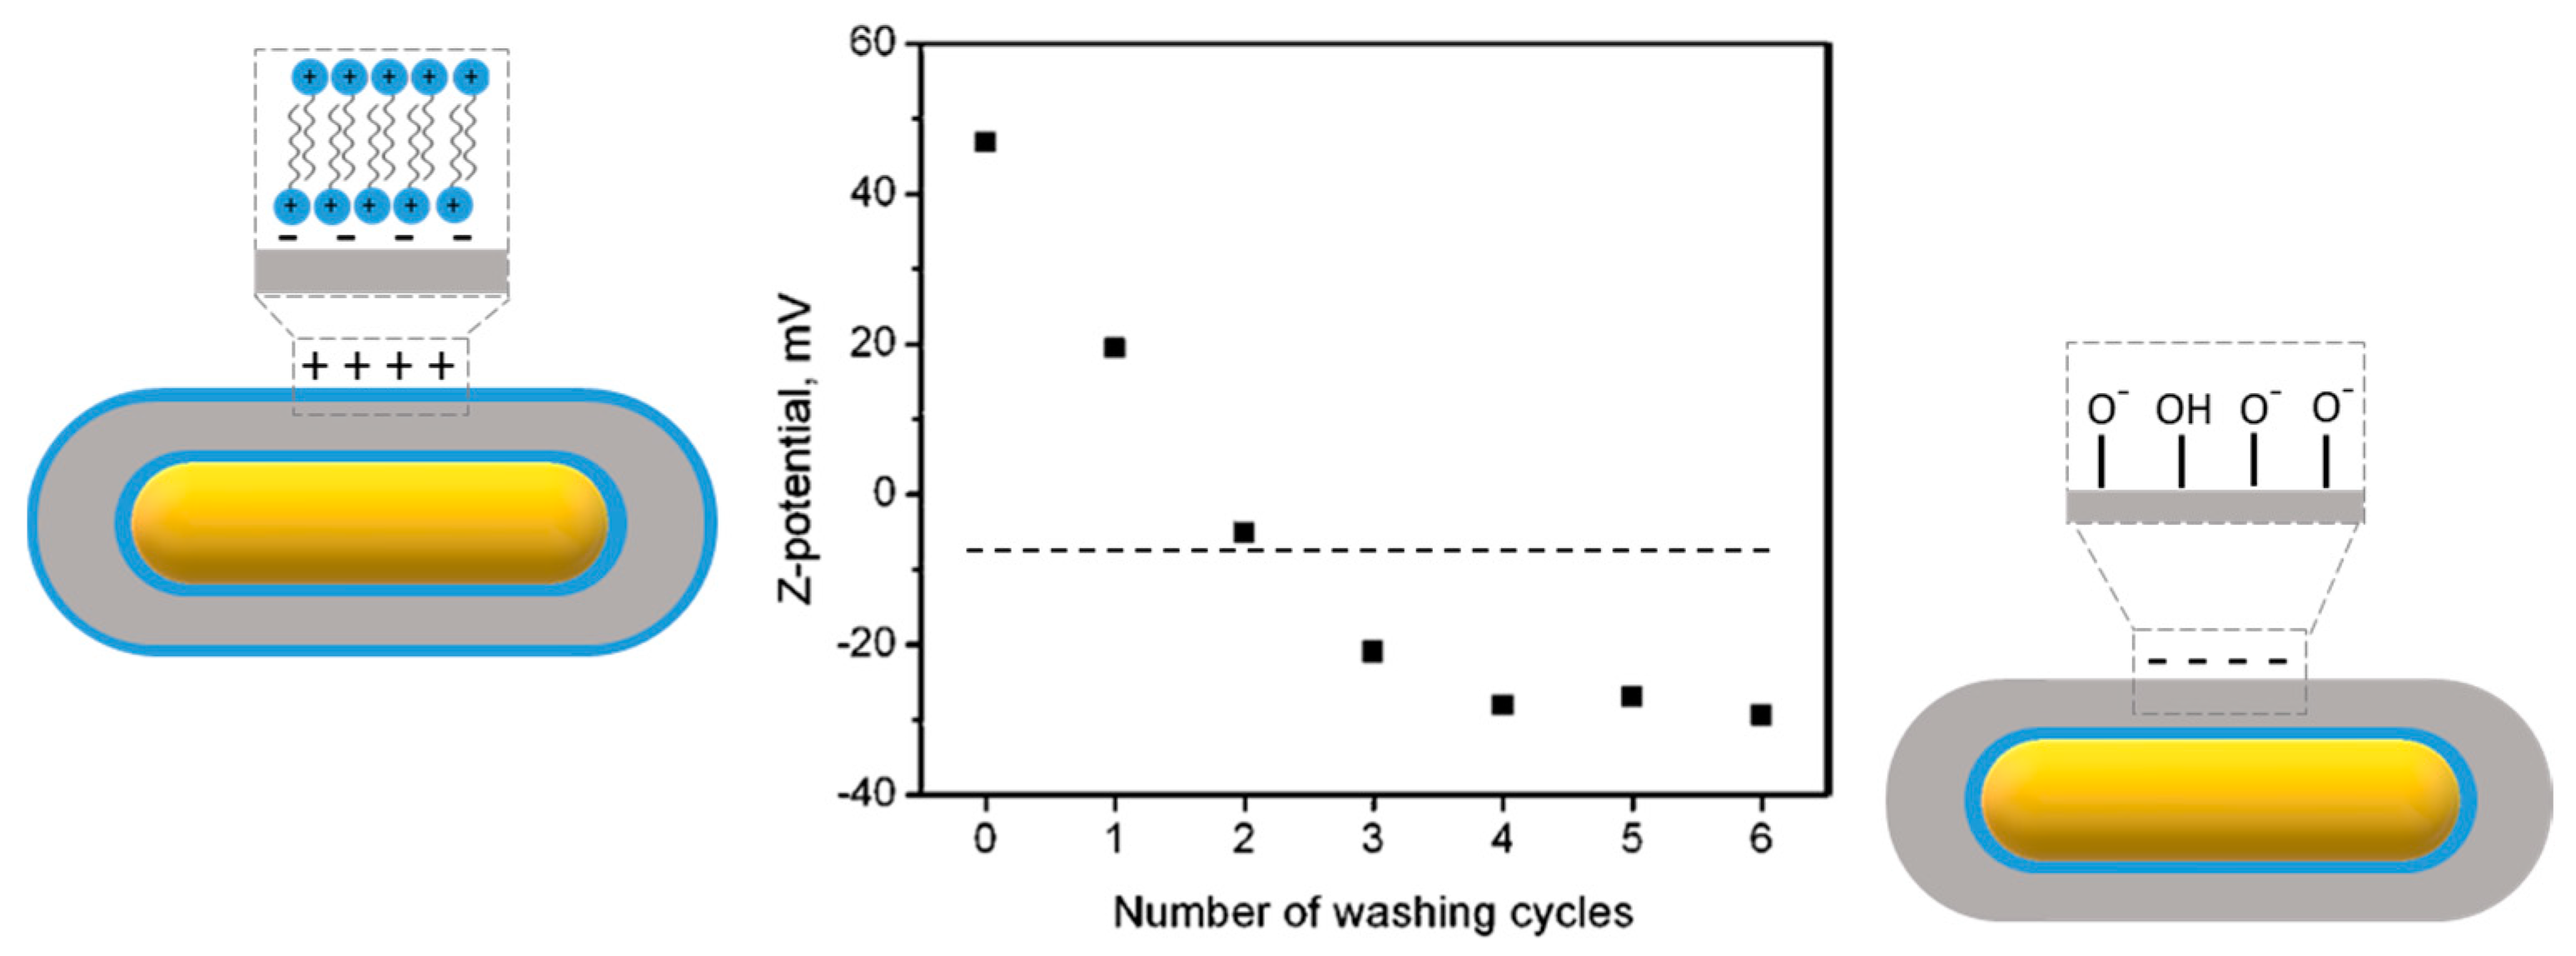
3.4.1. Zeta Potential Measurement
3.4.2. Quantitation of Reduced Gold in AuNRs
3.4.3. Silica-Shell Porosity Assessment
4. Functionalization Methods of Gold Nanorods
4.1. Physisorption
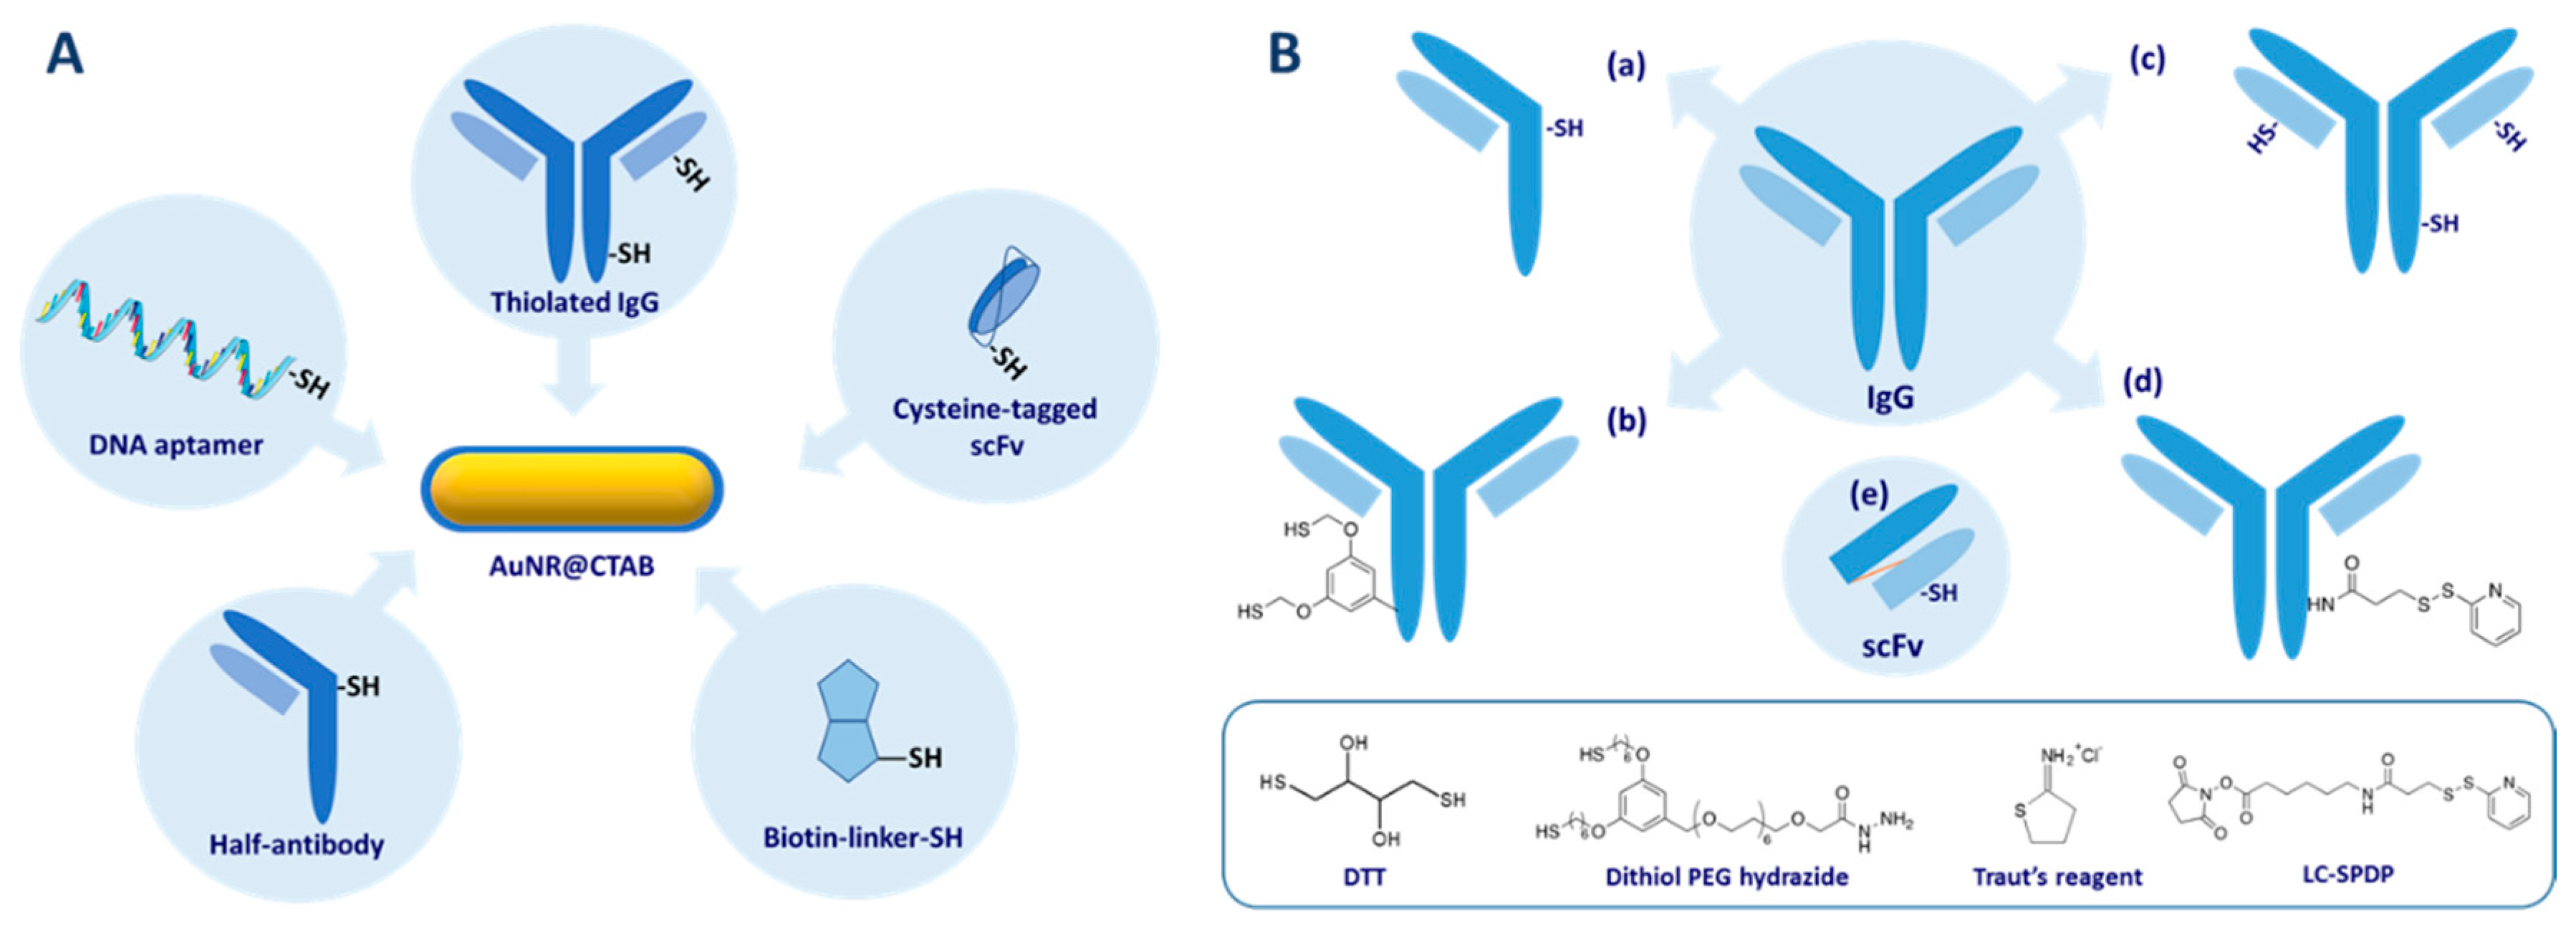
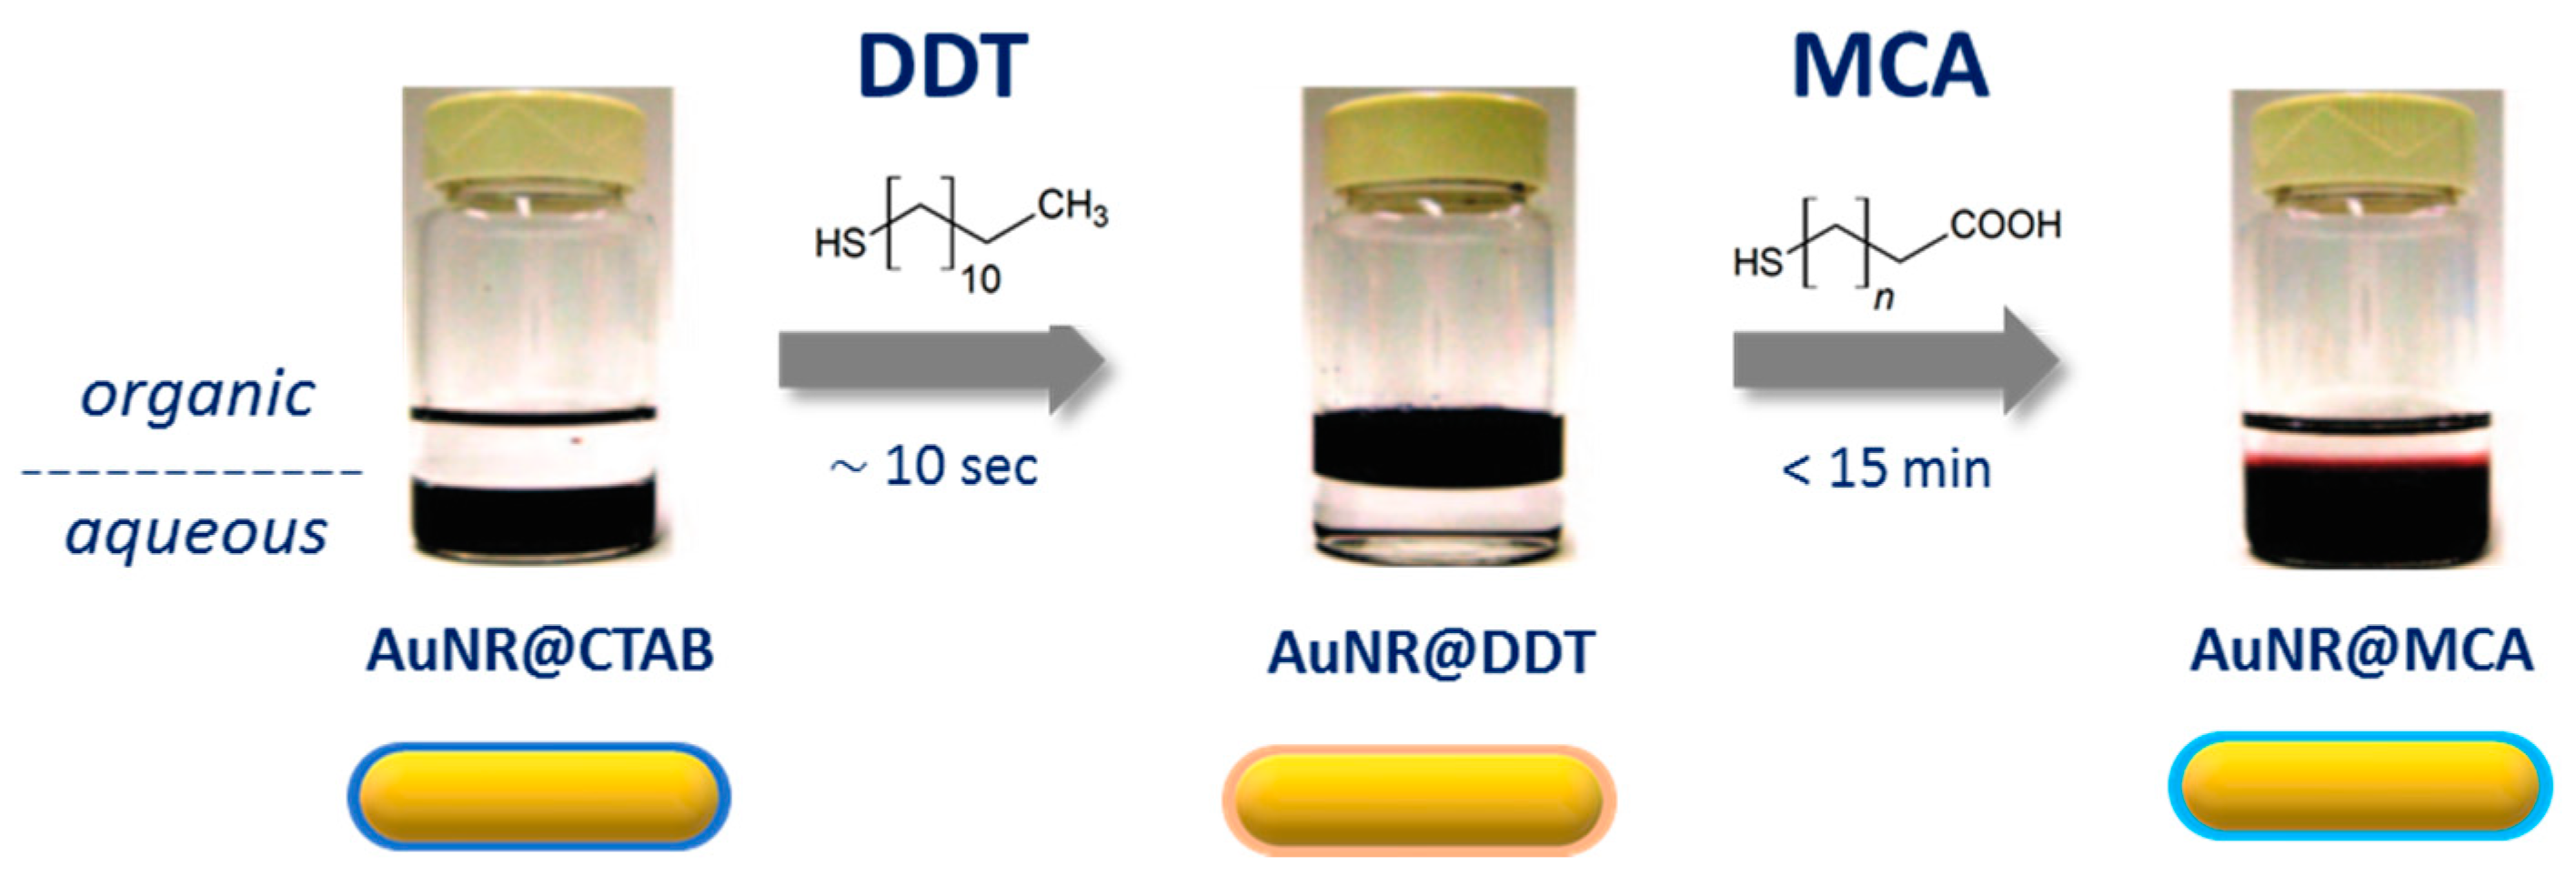
4.2. Chemisorption
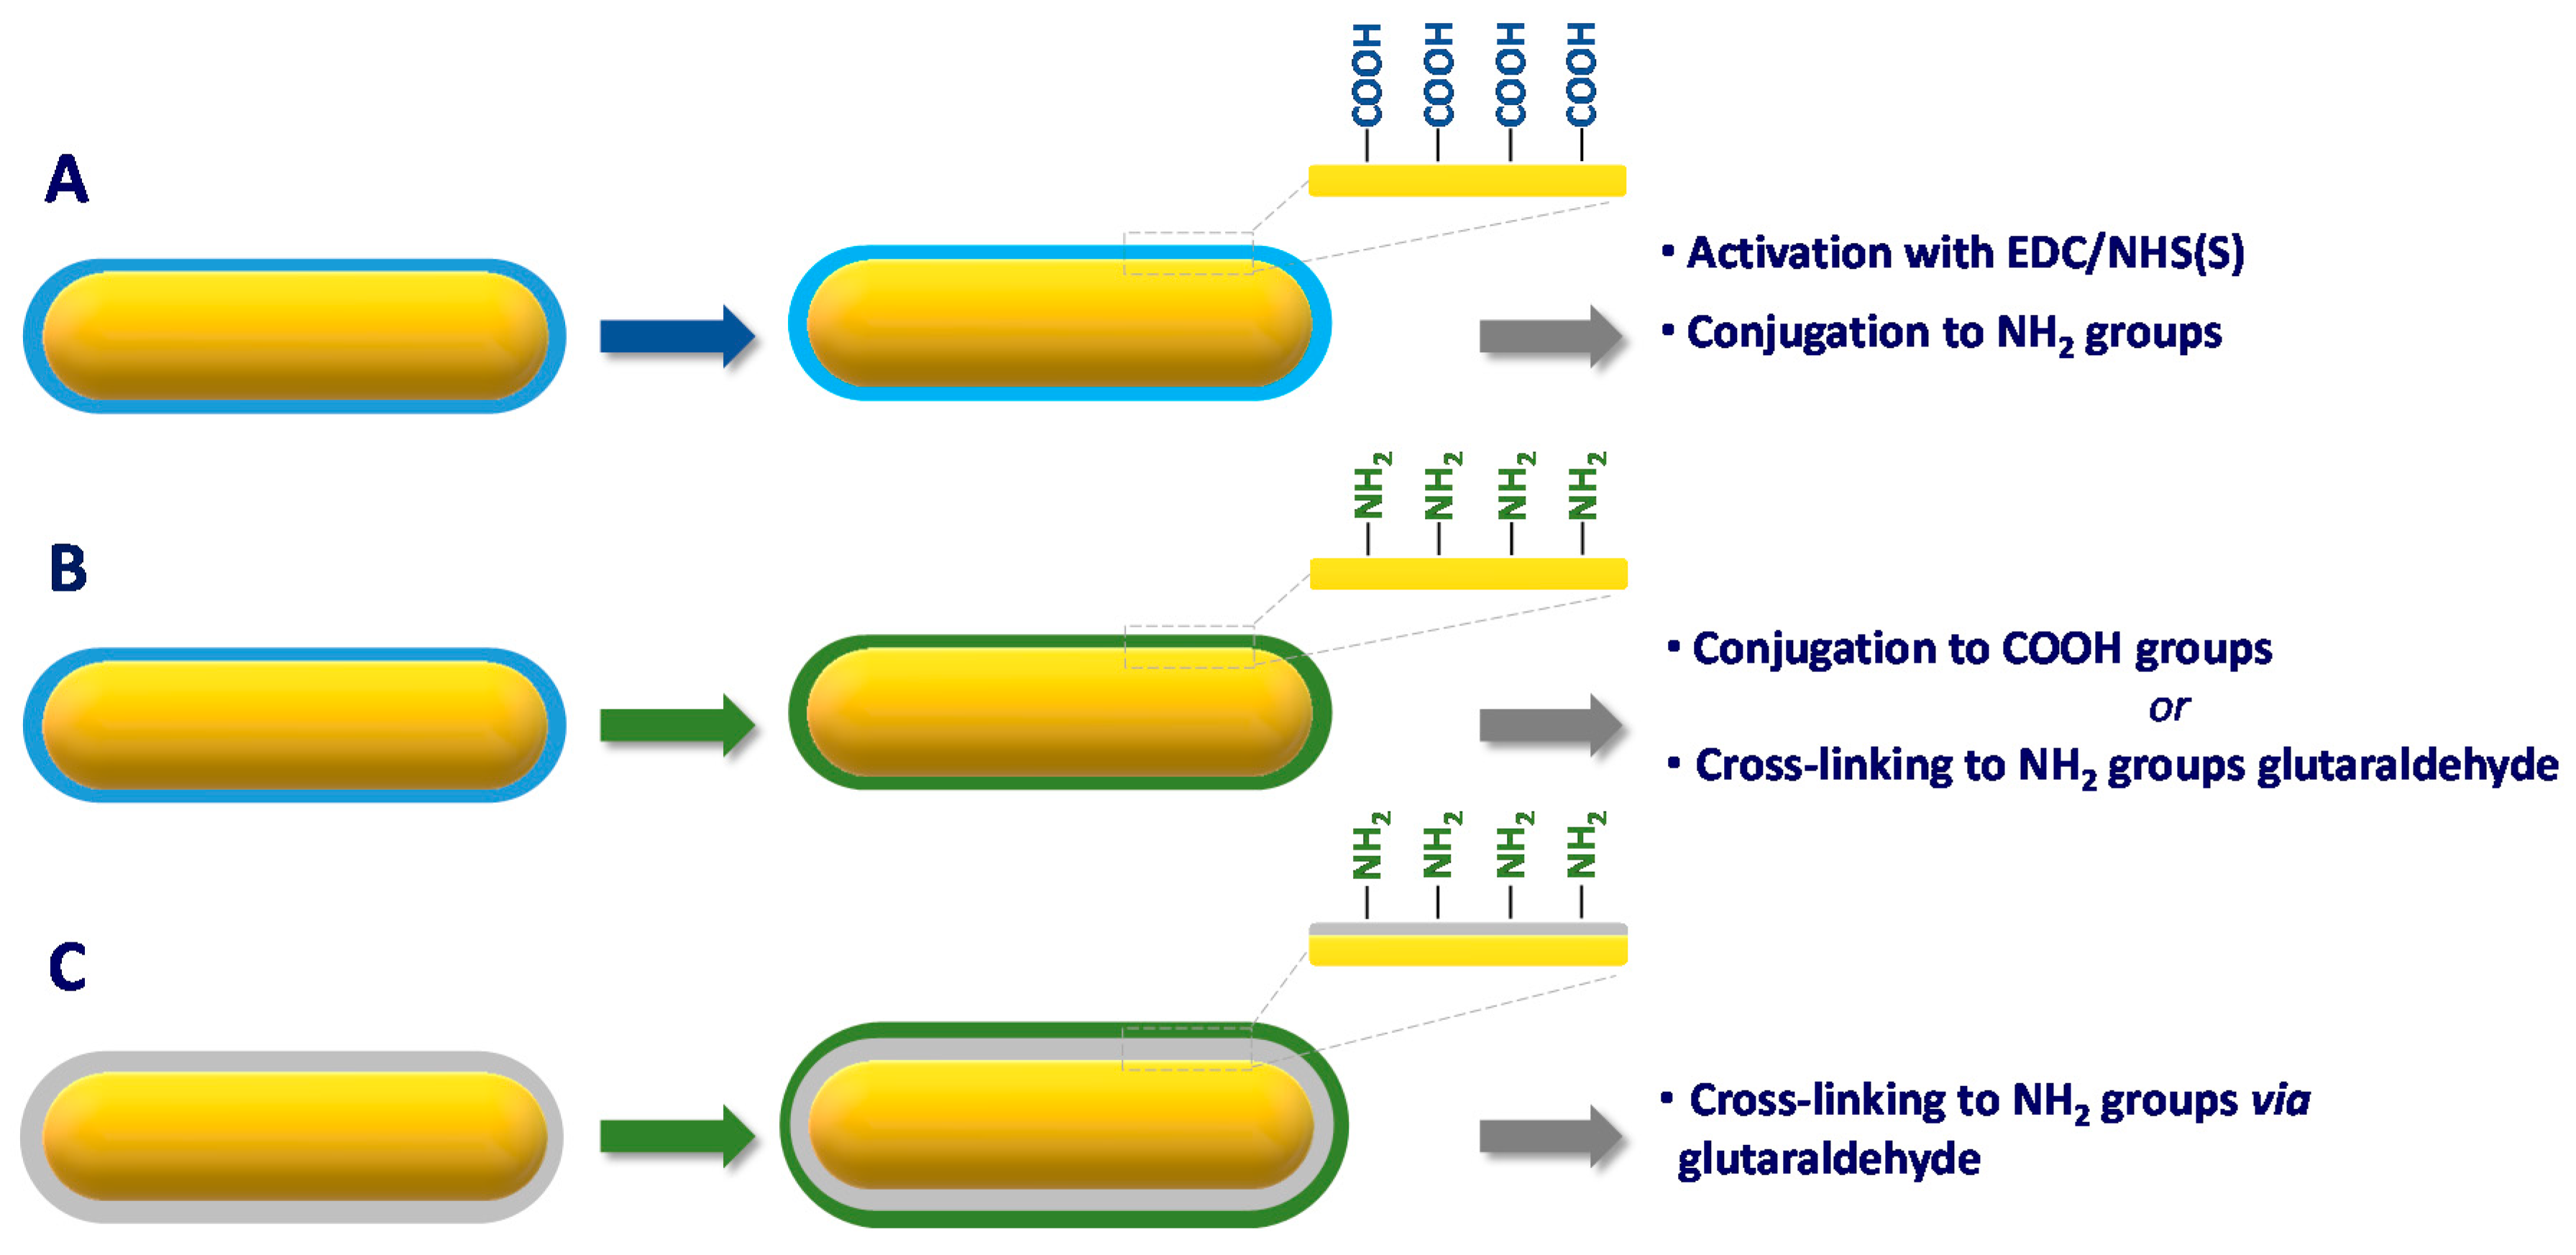
4.3. Conjugation
4.4. Selective Grafting at the Ends or the Sides of AuNR
5. Applications of AuNRs in LSPR Biosensing
5.1. Optical Properties of AuNR in Relation to LSPR Biosensor Development
5.2. Immunosensors
5.2.1. Solution-Phase Based Immunosensors
5.2.2. Solid-Phase-Based Immunosensors
5.3. Aptasensors
5.4. AuNR-Based LSPR Biosensors Using Uncommon Receptors
5.5. Single Molecule Plasmonic Biosensors
6. Conclusions and Perspectives
Author Contributions
Funding
Acknowledgments
Conflicts of Interest
Abbreviations
| AA | L-ascorbic acid |
| Ab | Antibody |
| AD | Dehydroascorbic acid |
| ALCAM | activated leukocyte cell adhesion molecule |
| APTMS | (3-aminopropyl)trimethoxysilane |
| AR | aspect ratio |
| Asc.- | radical ascorbate |
| Asc- | L-ascorbate |
| ATP | Adenosine triphosphate |
| AuNR | Gold nanorod |
| AuNR@SiO2 | silica coated gold nanorod |
| BDAC | Benzyldimethylhexadecylammonium chloride |
| CMC | critical micellar concentration |
| CRP | C-reactive protein |
| CTAB | cetyltrimethylammonium bromide |
| CTAC | cetyltrimethylammonium chloride |
| ctDNA | circulating tumor DNA |
| cTnI | cardiac troponin I |
| DA | dehydroascorbic acid |
| DDLS | depolarised dynamic light scattering |
| DDT | dodecanethiol |
| DLS | dynamic light scattering |
| DNA | Deoxyribonucleic acid |
| DR | detection range |
| DTT | Dithiothreitol |
| EDC | N-(3-Dimethylaminopropyl)-N′-ethylcarbodiimide |
| FoM | figure of merit |
| FWHM | full width at half maximum |
| GBP-SpA | gold-binding polypeptide Staphylococcal Protein A |
| HBsAg | Hepatitis B surface antigen |
| hIgG | human Immunoglobulin G |
| ICP-MS | inductively coupled plasma mass spectroscopy |
| ICP-OES | inductively coupled plasma optical emission spectrometry |
| IGEPAL | octylphenoxypolyethoxyethanol |
| IgG | Immunoglibulin G |
| KRAS | Kirsten RAt Sarcoma virus |
| LbL | layer-by-layer |
| LC-SPDP | N-Succinimidyl-6-(3’-(2-PyridylDithio)-Propionamido)-hexanoate |
| l-LSPR | longitudinal localized surface plasmon resonance |
| LoD | Limit of detection |
| LSPR | localized surface plasmon resonance |
| MCF-7 | Michigan Cancer Foundation-7 |
| MC-LR-OVA | microcystin-LR ovalbumin |
| MHA | 6-Mercaptohexanoic acid |
| MHDA | 16-Mercaptohexadecanoic acid |
| MNP | magnetic nanoparticle |
| mPEG-SH | (O-[2-(3-mercaptopropionylamino)ethyl] O’-methylpolyethylene glycol |
| MPTMS | (3-mercaptopropyl)trimethoxysilane |
| NaOL | Sodium oleate |
| NGAL | Neutrophil Gelatinase-Associated Lipocalin |
| NHS | N-Hydroxysuccinimide |
| NP | Nanoparticle |
| OTA | Ochratoxin A |
| PAH | polyallylamine chloride |
| PEI | Polyethylenimine |
| PNA | peptide nucleic acid |
| PSS | polystyrene sulfonate |
| PVP | Polyvinyl pyrrolidone |
| PZC | point of zero charge |
| RI | Refractive index |
| RNA | Ribonucleic acid |
| SAM | Self-Assembled Monolayer |
| SAV | Streptavidin |
| SAXS | small angle X-ray scattering |
| scFv | Single-Chain Fragment Variable |
| SDS | Sodium dodecyl sulfate |
| SERS | Surface-enhanced Raman spectroscopy |
| SHE | Standard hydrogen electrode |
| SPR | Surface Plasmon resonance |
| ssDNA | single-stranded DNA |
| TAMRA | 5-Carboxytetramethylrhodamine |
| TEA | triethylamine |
| TEM | Transmission Electron Microscopy |
| TEOS | Tetraethyl orthosilicate |
| t-LSPR | transverse localized surface plasmon resonance |
| UTSC | ultra-thin silica shell |
| XANES | X-ray absorption near edge spectroscopy |
References
- Faraday, M.X. The Bakerian Lecture. —Experimental relations of gold (and other metals) to light. Philos. Trans. R. Soc. Lond. 1857, 147, 145–181. [Google Scholar] [CrossRef]
- Mie, G. Beiträge zur Optik trüber Medien, speziell kolloidaler Metallösungen. Ann. Phys. 1908, 330, 377–445. [Google Scholar] [CrossRef]
- Lee, J.-H.; Cho, H.-Y.; Choi, H.K.; Lee, J.-Y.; Choi, J.-W. Application of Gold Nanoparticle to Plasmonic Biosensors. Int. J. Mol. Sci. 2018, 19, 2021. [Google Scholar] [CrossRef] [PubMed] [Green Version]
- Liu, J.; Jalali, M.; Mahshid, S.; Wachsmann-Hogiu, S. Are plasmonic optical biosensors ready for use in point-of-need applications? Analyst 2020, 145, 364–384. [Google Scholar] [CrossRef] [PubMed] [Green Version]
- Carter, T.; Mulholland, P.; Chester, K. Antibody-targeted nanoparticles for cancer treatment. Immunotherapy 2016, 8, 941–958. [Google Scholar] [CrossRef]
- Biju, V. Chemical modifications and bioconjugate reactions of nanomaterials for sensing, imaging, drug delivery and therapy. Chem. Soc. Rev. 2014, 43, 744–764. [Google Scholar] [CrossRef]
- Englebienne, P. Use of colloidal gold surface plasmon resonance peak shift to infer affinity constants from the interactions between protein antigens and antibodies specific for single or multiple epitopes. Analyst 1998, 123, 1599–1603. [Google Scholar] [CrossRef]
- Saha, K.; Agasti, S.S.; Kim, C.; Li, X.; Rotello, V.M. Gold Nanoparticles in Chemical and Biological Sensing. Chem. Rev. 2012, 112, 2739–2779. [Google Scholar] [CrossRef] [Green Version]
- Sepúlveda, B.; Angelomé, P.C.; Lechuga, L.M.; Liz-Marzán, L.M. LSPR-based nanobiosensors. Nano Today 2009, 4, 244–251. [Google Scholar] [CrossRef]
- Tang, L.; Li, J. Plasmon-Based Colorimetric Nanosensors for Ultrasensitive Molecular Diagnostics. ACS Sens. 2017, 2, 857–875. [Google Scholar] [CrossRef]
- Aldewachi, H.; Chalati, T.; Woodroofe, M.N.; Bricklebank, N.; Sharrack, B.; Gardiner, P. Gold nanoparticle-based colorimetric biosensors. Nanoscale 2017, 10, 18–33. [Google Scholar] [CrossRef] [Green Version]
- Loiseau, A.; Zhang, L.; Hu, D.; Salmain, M.; Mazouzi, Y.; Flack, R.; Liedberg, B.; Boujday, S. Core–Shell Gold/Silver Nanoparticles for Localized Surface Plasmon Resonance-Based Naked-Eye Toxin Biosensing. ACS Appl. Mater. Interfaces 2019, 11, 46462–46471. [Google Scholar] [CrossRef] [PubMed]
- Chen, H.; Shao, L.; Li, Q.; Wang, J. Gold nanorods and their plasmonic properties. Chem Soc Rev 2013, 42, 2679–2724. [Google Scholar] [CrossRef] [PubMed]
- Brioude, A.; Jiang, X.C.; Pileni, M.P. Optical Properties of Gold Nanorods: DDA Simulations Supported by Experiments. J. Phys. Chem. B 2005, 109, 13138–13142. [Google Scholar] [CrossRef]
- Hu, M.; Chen, J.; Li, Z.-Y.; Au, L.; Hartland, G.V.; Li, X.; Marquez, M.; Xia, Y. Gold nanostructures: engineering their plasmonic properties for biomedical applications. Chem. Soc. Rev. 2006, 35, 1084–1094. [Google Scholar] [CrossRef]
- Huang, X.; Jain, P.K.; El-Sayed, I.H.; El-Sayed, M.A. Gold nanoparticles: interesting optical properties and recent applications in cancer diagnostics and therapy. Nanomed. 2007, 2, 681–693. [Google Scholar] [CrossRef] [PubMed] [Green Version]
- Huang, X.; Neretina, S.; El-Sayed, M.A. Gold Nanorods: From Synthesis and Properties to Biological and Biomedical Applications. Adv. Mater. 2009, 21, 4880–4910. [Google Scholar] [CrossRef]
- Murphy, C.J.; Gole, A.M.; Stone, J.W.; Sisco, P.N.; Alkilany, A.M.; Goldsmith, E.C.; Baxter, S.C. Gold Nanoparticles in Biology: Beyond Toxicity to Cellular Imaging. Acc. Chem. Res. 2008, 41, 1721–1730. [Google Scholar] [CrossRef]
- Kim, S.; Lee, S.; Lee, H.J. An aptamer-aptamer sandwich assay with nanorod-enhanced surface plasmon resonance for attomolar concentration of norovirus capsid protein. Sens. Actuators B Chem. 2018, 273, 1029–1036. [Google Scholar] [CrossRef]
- Sim, H.R.; Wark, A.W.; Lee, H.J. Attomolar detection of protein biomarkers using biofunctionalized gold nanorods with surface plasmon resonance. The Analyst 2010, 135, 2528. [Google Scholar] [CrossRef] [Green Version]
- Spadavecchia, J.; Casale, S.; Boujday, S.; Pradier, C.-M. Bioconjugated gold nanorods to enhance the sensitivity of FT-SPR-based biosensors. Colloids Surf. B Biointerfaces 2012, 100, 1–8. [Google Scholar] [CrossRef] [PubMed]
- Mei, Z.; Tang, L. Surface-Plasmon-Coupled Fluorescence Enhancement Based on Ordered Gold Nanorod Array Biochip for Ultrasensitive DNA Analysis. Anal. Chem. 2017, 89, 633–639. [Google Scholar] [CrossRef]
- Lio, D.C.S.; Liu, C.; Wiraja, C.; Qiu, B.; Fhu, C.W.; Wang, X.; Xu, C. Molecular Beacon Gold Nanosensors for Leucine-Rich Alpha-2-Glycoprotein-1 Detection in Pathological Angiogenesis. ACS Sens. 2018, 3, 1647–1655. [Google Scholar] [CrossRef] [PubMed]
- Zhang, Z.; Wang, H.; Chen, Z.; Wang, X.; Choo, J.; Chen, L. Plasmonic colorimetric sensors based on etching and growth of noble metal nanoparticles: Strategies and applications. Biosens. Bioelectron. 2018, 114, 52–65. [Google Scholar] [CrossRef] [PubMed]
- Chen, H.; Kou, X.; Yang, Z.; Ni, W.; Wang, J. Shape- and Size-Dependent Refractive Index Sensitivity of Gold Nanoparticles. Langmuir 2008, 24, 5233–5237. [Google Scholar] [CrossRef] [PubMed]
- Lohse, S.E.; Murphy, C.J. The Quest for Shape Control: A History of Gold Nanorod Synthesis. Chem. Mater. 2013, 25, 1250–1261. [Google Scholar] [CrossRef]
- Nikoobakht, B.; El-Sayed, M.A. Evidence for Bilayer Assembly of Cationic Surfactants on the Surface of Gold Nanorods. Langmuir 2001, 17, 6368–6374. [Google Scholar] [CrossRef]
- Jana, N.R.; Gearheart, L.; Murphy, C.J. Wet Chemical Synthesis of High Aspect Ratio Cylindrical Gold Nanorods. J. Phys. Chem. B 2001, 105, 4065–4067. [Google Scholar] [CrossRef]
- Sau, T.K.; Murphy, C.J. Seeded High Yield Synthesis of Short Au Nanorods in Aqueous Solution. Langmuir 2004, 20, 6414–6420. [Google Scholar] [CrossRef]
- Ye, X.; Zheng, C.; Chen, J.; Gao, Y.; Murray, C.B. Using Binary Surfactant Mixtures To Simultaneously Improve the Dimensional Tunability and Monodispersity in the Seeded Growth of Gold Nanorods. Nano Lett. 2013, 13, 765–771. [Google Scholar] [CrossRef]
- Lohse, S.E.; Burrows, N.D.; Scarabelli, L.; Liz-Marzán, L.M.; Murphy, C.J. Anisotropic Noble Metal Nanocrystal Growth: The Role of Halides. Chem. Mater. 2014, 26, 34–43. [Google Scholar] [CrossRef] [Green Version]
- Creutz, C. Complexities of ascorbate as a reducing agent. Inorg. Chem. 1981, 20, 4449–4452. [Google Scholar] [CrossRef]
- Evans, D.H.; Lingane, J.J. Standard potentials of the couples involving AuBr4−, AuBr2− and Au In bromide media. J. Electroanal. Chem. 1959 1963, 6, 1–10. [Google Scholar] [CrossRef]
- Lingane, J.J. Standard potentials of half-reactions involving + 1 and + 3 gold in chloride medium: Equilibrium constant of the reaction AuCl4− + 2Au + 2Cl− = 3AuCl2−. J. Electroanal. Chem. 1959 1962, 4, 332–342. [Google Scholar] [CrossRef]
- Foss Jr, C.A.; Hornyak, G.L.; Stockert, J.A.; Martin, C.R. Template-synthesized nanoscopic gold particles: optical spectra and the effects of particle size and shape. J. Phys. Chem. 1994, 98, 2963–2971. [Google Scholar] [CrossRef]
- Jana, N.R.; Gearheart, L.; Murphy, C.J. Seed-Mediated Growth Approach for Shape-Controlled Synthesis of Spheroidal and Rod-like Gold Nanoparticles Using a Surfactant Template. Adv. Mater. 2001, 13, 1389–1393. [Google Scholar] [CrossRef]
- Nikoobakht, B.; El-Sayed, M.A. Preparation and Growth Mechanism of Gold Nanorods (NRs) Using Seed-Mediated Growth Method. Chem. Mater. 2003, 15, 1957–1962. [Google Scholar] [CrossRef]
- Jana, N.R. Gram-Scale Synthesis of Soluble, Near-Monodisperse Gold Nanorods and Other Anisotropic Nanoparticles. Small 2005, 1, 875–882. [Google Scholar] [CrossRef]
- Ali, M.R.K.; Snyder, B.; El-Sayed, M.A. Synthesis and Optical Properties of Small Au Nanorods Using a Seedless Growth Technique. Langmuir 2012, 28, 9807–9815. [Google Scholar] [CrossRef] [PubMed]
- Burrows, N.D.; Harvey, S.; Idesis, F.A.; Murphy, C.J. Understanding the Seed-Mediated Growth of Gold Nanorods through a Fractional Factorial Design of Experiments. Langmuir 2017, 33, 1891–1907. [Google Scholar] [CrossRef]
- Smith, D.K.; Miller, N.R.; Korgel, B.A. Iodide in CTAB Prevents Gold Nanorod Formation. Langmuir 2009, 25, 9518–9524. [Google Scholar] [CrossRef]
- Scarabelli, L.; Sánchez-Iglesias, A.; Pérez-Juste, J.; Liz-Marzán, L.M. A “Tips and Tricks” Practical Guide to the Synthesis of Gold Nanorods. J. Phys. Chem. Lett. 2015, 6, 4270–4279. [Google Scholar] [CrossRef] [PubMed] [Green Version]
- Reza Hormozi-Nezhad, M.; Robatjazi, H.; Jalali-Heravi, M. Thorough tuning of the aspect ratio of gold nanorods using response surface methodology. Anal. Chim. Acta 2013, 779, 14–21. [Google Scholar] [CrossRef] [PubMed]
- Watt, J.; Hance, B.G.; Anderson, R.S.; Huber, D.L. Effect of Seed Age on Gold Nanorod Formation: A Microfluidic, Real-Time Investigation. Chem. Mater. 2015, 27, 6442–6449. [Google Scholar] [CrossRef]
- Vigderman, L.; Zubarev, E.R. High-Yield Synthesis of Gold Nanorods with Longitudinal SPR Peak Greater than 1200 nm Using Hydroquinone as a Reducing Agent. Chem. Mater. 2013, 25, 1450–1457. [Google Scholar] [CrossRef]
- Orendorff, C.J.; Murphy, C.J. Quantitation of Metal Content in the Silver-Assisted Growth of Gold Nanorods. J. Phys. Chem. B 2006, 110, 3990–3994. [Google Scholar] [CrossRef]
- Xu, D.; Mao, J.; He, Y.; Yeung, E.S. Size-tunable synthesis of high-quality gold nanorods under basic conditions by using H 2 O 2 as the reducing agent. J. Mater. Chem. C 2014, 2, 4989–4996. [Google Scholar] [CrossRef]
- Leng, Y.; Yin, X.; Hu, F.; Zou, Y.; Xing, X.; Li, B.; Guo, Y.; Ye, L.; Lu, Z. High-yield synthesis and fine-tuning aspect ratio of (200) faceted gold nanorods by the pH-adjusting method. RSC Adv. 2017, 7, 25469–25474. [Google Scholar] [CrossRef] [Green Version]
- Canonico-May, S.A.; Beavers, K.R.; Melvin, M.J.; Alkilany, A.M.; Duvall, C.L.; Stone, J.W. High conversion of HAuCl4 into gold nanorods: A re-seeding approach. J. Colloid Interface Sci. 2016, 463, 229–232. [Google Scholar] [CrossRef]
- Kozek, K.A.; Kozek, K.M.; Wu, W.-C.; Mishra, S.R.; Tracy, J.B. Large-Scale Synthesis of Gold Nanorods through Continuous Secondary Growth. Chem. Mater. 2013, 25, 4537–4544. [Google Scholar] [CrossRef] [Green Version]
- Chang, H.-H.; Murphy, C.J. Mini Gold Nanorods with Tunable Plasmonic Peaks beyond 1000 nm. Chem. Mater. 2018, 30, 1427–1435. [Google Scholar] [CrossRef]
- González-Rubio, G.; Scarabelli, L.; Guerrero-Martínez, A.; Liz-Marzán, L.M. Surfactant-Assisted Symmetry Breaking in Colloidal Gold Nanocrystal Growth. ChemNanoMat 2020, 6, 698–707. [Google Scholar] [CrossRef]
- González-Rubio, G.; Kumar, V.; Llombart, P.; Díaz-Núñez, P.; Bladt, E.; Altantzis, T.; Bals, S.; Peña-Rodríguez, O.; Noya, E.G.; MacDowell, L.G.; et al. Disconnecting Symmetry Breaking from Seeded Growth for the Reproducible Synthesis of High Quality Gold Nanorods. ACS Nano 2019, 13, 4424–4435. [Google Scholar] [CrossRef] [PubMed] [Green Version]
- Sharma, V.; Park, K.; Srinivasarao, M. Shape separation of gold nanorods using centrifugation. Proc. Natl. Acad. Sci. USA 2009, 106, 4981–4985. [Google Scholar] [CrossRef] [PubMed] [Green Version]
- Li, S.; Chang, Z.; Liu, J.; Bai, L.; Luo, L.; Sun, X. Separation of gold nanorods using density gradient ultracentrifugation. Nano Res. 2011, 4, 723–728. [Google Scholar] [CrossRef]
- Boksebeld, M.; Blanchard, N.P.; Jaffal, A.; Chevolot, Y.; Monnier, V. Shape-selective purification of gold nanorods with low aspect ratio using a simple centrifugation method. Gold Bull. 2017, 50, 69–76. [Google Scholar] [CrossRef]
- Park, K.; Koerner, H.; Vaia, R.A. Depletion-Induced Shape and Size Selection of Gold Nanoparticles. Nano Lett. 2010, 10, 1433–1439. [Google Scholar] [CrossRef]
- Uson, L.; Sebastian, V.; Arruebo, M.; Santamaria, J. Continuous microfluidic synthesis and functionalization of gold nanorods. Chem. Eng. J. 2016, 285, 286–292. [Google Scholar] [CrossRef] [Green Version]
- Xu, Y.; Zhao, Y.; Chen, L.; Wang, X.; Sun, J.; Wu, H.; Bao, F.; Fan, J.; Zhang, Q. Large-scale, low-cost synthesis of monodispersed gold nanorods using a gemini surfactant. Nanoscale 2015, 7, 6790–6797. [Google Scholar] [CrossRef]
- Kaur, P.; Chudasama, B. Effect of Colloidal Medium on the Shelf-Life and Stability of Gold Nanorods Prepared by Seed-Mediated Synthesis. J. Nanosci. Nanotechnol. 2018, 18, 1665–1674. [Google Scholar] [CrossRef]
- Vassalini, I.; Rotunno, E.; Lazzarini, L.; Alessandri, I. “Stainless” Gold Nanorods: Preserving Shape, Optical Properties, and SERS Activity in Oxidative Environment. ACS Appl. Mater. Interfaces 2015, 7, 18794–18802. [Google Scholar] [CrossRef] [PubMed]
- Lohse, S.E.; Eller, J.R.; Sivapalan, S.T.; Plews, M.R.; Murphy, C.J. A Simple Millifluidic Benchtop Reactor System for the High-Throughput Synthesis and Functionalization of Gold Nanoparticles with Different Sizes and Shapes. ACS Nano 2013, 7, 4135–4150. [Google Scholar] [CrossRef] [PubMed]
- Ma, J.; Li, C.-W. Rapid and continuous parametric screening for the synthesis of gold nanocrystals with different morphologies using a microfluidic device. Sens. Actuators B Chem. 2018, 262, 236–244. [Google Scholar] [CrossRef]
- Park, K.; Hsiao, M.; Yi, Y.-J.; Izor, S.; Koerner, H.; Jawaid, A.; Vaia, R.A. Highly Concentrated Seed-Mediated Synthesis of Monodispersed Gold Nanorods. ACS Appl. Mater. Interfaces 2017, 9, 26363–26371. [Google Scholar] [CrossRef]
- Khanal, B.P.; Zubarev, E.R. Gram-Scale Synthesis of Isolated Monodisperse Gold Nanorods. Chem. Eur. J. 2019, 25, 1595–1600. [Google Scholar] [CrossRef]
- Liz-Marzán, L.M.; Giersig, M.; Mulvaney, P. Synthesis of Nanosized Gold−Silica Core−Shell Particles. Langmuir 1996, 12, 4329–4335. [Google Scholar] [CrossRef]
- Obare, S.O.; Jana, N.R.; Murphy, C.J. Preparation of Polystyrene- and Silica-Coated Gold Nanorods and Their Use as Templates for the Synthesis of Hollow Nanotubes. Nano Lett. 2001, 1, 601–603. [Google Scholar] [CrossRef] [Green Version]
- Pérez-Juste, J.; Correa-Duarte, M.A.; Liz-Marzán, L.M. Silica gels with tailored, gold nanorod-driven optical functionalities. Appl. Surf. Sci. 2004, 226, 137–143. [Google Scholar] [CrossRef]
- Li, C.; Li, Y.; Ling, Y.; Lai, Y.; Wu, C.; Zhao, Y. Exploration of the growth process of ultrathin silica shells on the surface of gold nanorods by the localized surface plasmon resonance. Nanotechnology 2014, 25, 045704. [Google Scholar] [CrossRef]
- Li, J.F.; Tian, X.D.; Li, S.B.; Anema, J.R.; Yang, Z.L.; Ding, Y.; Wu, Y.F.; Zeng, Y.M.; Chen, Q.Z.; Ren, B.; et al. Surface analysis using shell-isolated nanoparticle-enhanced Raman spectroscopy. Nat. Protoc. 2013, 8, 52–65. [Google Scholar] [CrossRef]
- Fernández-López, C.; Mateo-Mateo, C.; Álvarez-Puebla, R.A.; Pérez-Juste, J.; Pastoriza-Santos, I.; Liz-Marzán, L.M. Highly Controlled Silica Coating of PEG-Capped Metal Nanoparticles and Preparation of SERS-Encoded Particles. Langmuir 2009, 25, 13894–13899. [Google Scholar] [CrossRef] [PubMed]
- Wang, J.; Zhang, W.; Li, S.; Miao, D.; Qian, G.; Su, G. Engineering of Porous Silica Coated Gold Nanorods by Surface-Protected Etching and Their Applications in Drug Loading and Combined Cancer Therapy. Langmuir 2019, 35, 14238–14247. [Google Scholar] [CrossRef]
- Kinnear, C.; Dietsch, H.; Clift, M.J.D.; Endes, C.; Rothen-Rutishauser, B.; Petri-Fink, A. Gold Nanorods: Controlling Their Surface Chemistry and Complete Detoxification by a Two-Step Place Exchange. Angew. Chem. Int. Ed. 2013, 52, 1934–1938. [Google Scholar] [CrossRef] [PubMed] [Green Version]
- Graf, C.; Vossen, D.L.J.; Imhof, A.; van Blaaderen, A. A General Method To Coat Colloidal Particles with Silica. Langmuir 2003, 19, 6693–6700. [Google Scholar] [CrossRef]
- Pastoriza-Santos, I.; Pérez-Juste, J.; Liz-Marzán, L.M. Silica-Coating and Hydrophobation of CTAB-Stabilized Gold Nanorods. Chem. Mater. 2006, 18, 2465–2467. [Google Scholar] [CrossRef]
- Pastoriza-Santos, I.; Liz-Marzán, L.M. Reliable Methods for Silica Coating of Au Nanoparticles. In Nanomaterial Interfaces in Biology; Bergese, P., Hamad-Schifferli, K., Eds.; Methods in Molecular Biology; Humana Press: Totowa, NJ, USA, 2013; pp. 75–93. ISBN 978-1-62703-461-6. [Google Scholar]
- Nallathamby, P.D.; Hopf, J.; Irimata, L.E.; McGinnity, T.L.; Roeder, R.K. Preparation of fluorescent Au–SiO2 core–shell nanoparticles and nanorods with tunable silica shell thickness and surface modification for immunotargeting. J. Mater. Chem. B 2016, 4, 5418–5428. [Google Scholar] [CrossRef]
- Gorelikov, I.; Matsuura, N. Single-Step Coating of Mesoporous Silica on Cetyltrimethyl Ammonium Bromide-Capped Nanoparticles. Nano Lett. 2008, 8, 369–373. [Google Scholar] [CrossRef]
- Cong, H.; Toftegaard, R.; Arnbjerg, J.; Ogilby, P.R. Silica-Coated Gold Nanorods with a Gold Overcoat: Controlling Optical Properties by Controlling the Dimensions of a Gold−Silica−Gold Layered Nanoparticle. Langmuir 2010, 26, 4188–4195. [Google Scholar] [CrossRef]
- Liu, J.; Kan, C.; Cong, B.; Xu, H.; Ni, Y.; Li, Y.; Shi, D. Plasmonic Property and Stability of Core-Shell Au@SiO2 Nanostructures. Plasmonics 2014, 9, 1007–1014. [Google Scholar] [CrossRef]
- Wu, W.-C.; Tracy, J.B. Large-Scale Silica Overcoating of Gold Nanorods with Tunable Shell Thicknesses. Chem. Mater. 2015, 27, 2888–2894. [Google Scholar] [CrossRef] [Green Version]
- Abadeer, N.S.; Brennan, M.R.; Wilson, W.L.; Murphy, C.J. Distance and Plasmon Wavelength Dependent Fluorescence of Molecules Bound to Silica-Coated Gold Nanorods. ACS Nano 2014, 8, 8392–8406. [Google Scholar] [CrossRef] [PubMed]
- Yoon, S.; Lee, B.; Kim, C.; Lee, J.H. Controlled Heterogeneous Nucleation for Synthesis of Uniform Mesoporous Silica-Coated Gold Nanorods with Tailorable Rotational Diffusion and 1 nm-Scale Size Tunability. Cryst. Growth Des. 2018, 18, 4731–4736. [Google Scholar] [CrossRef]
- Rowe, L.R.; Chapman, B.S.; Tracy, J.B. Understanding and Controlling the Morphology of Silica Shells on Gold Nanorods. Chem. Mater. 2018, 30, 6249–6258. [Google Scholar] [CrossRef]
- Wang, M.; Hoff, A.; Doebler, J.E.; Emory, S.R.; Bao, Y. Dumbbell-Like Silica Coated Gold Nanorods and Their Plasmonic Properties. Langmuir 2019, 35, 16886–16892. [Google Scholar] [CrossRef] [PubMed]
- Tian, X.; Guo, J.; Tian, Y.; Tang, H.; Yang, W. Modulated fluorescence properties in fluorophore-containing gold nanorods@mSiO2. RSC Adv. 2014, 4, 9343–9348. [Google Scholar] [CrossRef]
- Wu, C.; Xu, Q.-H. Stable and Functionable Mesoporous Silica-Coated Gold Nanorods as Sensitive Localized Surface Plasmon Resonance (LSPR) Nanosensors. Langmuir 2009, 25, 9441–9446. [Google Scholar] [CrossRef]
- Zhang, R.; Zhou, Y.; Peng, L.; Li, X.; Chen, S.; Feng, X.; Guan, Y.; Huang, W. Influence of SiO 2 shell thickness on power conversion efficiency in plasmonic polymer solar cells with Au nanorod@SiO 2 core-shell structures. Sci. Rep. 2016, 6, 1–9. [Google Scholar] [CrossRef] [Green Version]
- Mohanta, J.; Satapathy, S.; Si, S. Porous Silica-Coated Gold Nanorods: A Highly Active Catalyst for the Reduction of 4-Nitrophenol. ChemPhysChem 2016, 17, 364–368. [Google Scholar] [CrossRef]
- Huang, C.-C.; Huang, C.-H.; Kuo, I.-T.; Chau, L.-K.; Yang, T.-S. Synthesis of silica-coated gold nanorod as Raman tags by modulating cetyltrimethylammonium bromide concentration. Colloids Surf. Physicochem. Eng. Asp. 2012, 409, 61–68. [Google Scholar] [CrossRef]
- Shen, D.; Yang, J.; Li, X.; Zhou, L.; Zhang, R.; Li, W.; Chen, L.; Wang, R.; Zhang, F.; Zhao, D. Biphase Stratification Approach to Three-Dimensional Dendritic Biodegradable Mesoporous Silica Nanospheres. Nano Lett. 2014, 14, 923–932. [Google Scholar] [CrossRef]
- Xu, C.; Chen, F.; Valdovinos, H.F.; Jiang, D.; Goel, S.; Yu, B.; Sun, H.; Barnhart, T.E.; Moon, J.J.; Cai, W. Bacteria-like mesoporous silica-coated gold nanorods for positron emission tomography and photoacoustic imaging-guided chemo-photothermal combined therapy. Biomaterials 2018, 165, 56–65. [Google Scholar] [CrossRef]
- Malik, M.A.; Wani, M.Y.; Hashim, M.A. Microemulsion method: A novel route to synthesize organic and inorganic nanomaterials. Arab. J. Chem. 2012, 5, 397–417. [Google Scholar] [CrossRef] [Green Version]
- Wang, J.; Shah, Z.H.; Zhang, S.; Lu, R. Silica-based nanocomposites via reverse microemulsions: classifications, preparations, and applications. Nanoscale 2014, 6, 4418. [Google Scholar] [CrossRef] [PubMed]
- Han, Y.; Jiang, J.; Lee, S.S.; Ying, J.Y. Reverse Microemulsion-Mediated Synthesis of Silica-Coated Gold and Silver Nanoparticles. Langmuir 2008, 24, 5842–5848. [Google Scholar] [CrossRef]
- Ding, H.L.; Zhang, Y.X.; Wang, S.; Xu, J.M.; Xu, S.C.; Li, G.H. Fe3O4@SiO2 Core/Shell Nanoparticles: The Silica Coating Regulations with a Single Core for Different Core Sizes and Shell Thicknesses. Chem. Mater. 2012, 24, 4572–4580. [Google Scholar] [CrossRef]
- Anderson, B.D.; Wu, W.-C.; Tracy, J.B. Silica Overcoating of CdSe/CdS Core/Shell Quantum Dot Nanorods with Controlled Morphologies. Chem. Mater. 2016, 28, 4945–4952. [Google Scholar] [CrossRef]
- Wang, L.; Guo, S.; Liu, D.; He, J.; Zhou, J.; Zhang, K.; Wei, Y.; Pan, Y.; Gao, C.; Yuan, Z.; et al. Plasmon-Enhanced Blue Upconversion Luminescence by Indium Nanocrystals. Adv. Funct. Mater. 2019, 29, 1901242. [Google Scholar] [CrossRef]
- Feng, J.; Wang, Z.; Shen, B.; Zhang, L.; Yang, X.; He, N. Effects of template removal on both morphology of mesoporous silica-coated gold nanorod and its biomedical application. RSC Adv. 2014, 4, 28683–28690. [Google Scholar] [CrossRef]
- Yu, Y.Y.; Chang, S.S.; Lee, C.L.; Wang, C.C. Gold Nanorods: Electrochemical Synthesis and Optical Properties. J. Phys. Chem. B 1997, 101, 6661–6664. [Google Scholar] [CrossRef]
- Hatakeyama, Y.; Sasaki, K.; Judai, K.; Nishikawa, K.; Hino, K. Growth Behavior of Gold Nanorods Synthesized by the Seed-Mediated Method: Tracking of Reaction Progress by Time-Resolved X-ray Absorption Near-Edge Structure, Small-Angle X-ray Scattering, and Ultraviolet–Visible Spectroscopy. J. Phys. Chem. C 2018, 122, 7982–7991. [Google Scholar] [CrossRef]
- Juvé, V.; Cardinal, M.F.; Lombardi, A.; Crut, A.; Maioli, P.; Pérez-Juste, J.; Liz-Marzán, L.M.; Del Fatti, N.; Vallée, F. Size-Dependent Surface Plasmon Resonance Broadening in Nonspherical Nanoparticles: Single Gold Nanorods. Nano Lett. 2013, 13, 2234–2240. [Google Scholar] [CrossRef] [PubMed]
- Cao, J.; Sun, T.; Grattan, K.T.V. Gold nanorod-based localized surface plasmon resonance biosensors: A review. Sens. Actuators B Chem. 2014, 195, 332–351. [Google Scholar] [CrossRef]
- Al-Sherbini, A.-S.A.-M. Thermal instability of gold nanorods in micellar solution of water/glycerol mixtures. Colloids Surf. Physicochem. Eng. Asp. 2004, 246, 61–69. [Google Scholar] [CrossRef]
- Pérez-Juste, J.; Liz-Marzán, L.M.; Carnie, S.; Chan, D.Y.C.; Mulvaney, P. Electric-Field-Directed Growth of Gold Nanorods in Aqueous Surfactant Solutions. Adv. Funct. Mater. 2004, 14, 571–579. [Google Scholar] [CrossRef]
- Pérez-Juste, J.; Pastoriza-Santos, I.; Liz-Marzán, L.M.; Mulvaney, P. Gold nanorods: Synthesis, characterization and applications. Coord. Chem. Rev. 2005, 249, 1870–1901. [Google Scholar] [CrossRef]
- Grulke, E.A.; Wu, X.; Ji, Y.; Buhr, E.; Yamamoto, K.; Song, N.W.; Stefaniak, A.B.; Schwegler-Berry, D.; Burchett, W.W.; Lambert, J.; et al. Differentiating gold nanorod samples using particle size and shape distributions from transmission electron microscope images. Metrologia 2018, 55, 254–267. [Google Scholar] [CrossRef]
- Sturges, H.A. The Choice of a Class Interval. J. Am. Stat. Assoc. 1926, 21, 65–66. [Google Scholar] [CrossRef]
- Masuda, H.; Gotoh, K. Study on the sample size required for the estimation of mean particle diameter. Adv. Powder Technol. 1999, 10, 159–173. [Google Scholar] [CrossRef]
- Laramy, C.R.; Brown, K.A.; O’Brien, M.N.; Mirkin, C.A. High-Throughput, Algorithmic Determination of Nanoparticle Structure from Electron Microscopy Images. ACS Nano 2015, 9, 12488–12495. [Google Scholar] [CrossRef]
- Pecora, R. Spectrum of Light Scattered from Optically Anisotropic Macromolecules. J. Chem. Phys. 1968, 49, 1036–1043. [Google Scholar] [CrossRef]
- Liu, H.; Pierre-Pierre, N.; Huo, Q. Dynamic light scattering for gold nanorod size characterization and study of nanorod–protein interactions. Gold Bull. 2012, 45, 187–195. [Google Scholar] [CrossRef] [Green Version]
- Glidden, M.; Muschol, M. Characterizing Gold Nanorods in Solution Using Depolarized Dynamic Light Scattering. J. Phys. Chem. C 2012, 116, 8128–8137. [Google Scholar] [CrossRef]
- Nixon-Luke, R.; Bryant, G. A Depolarized Dynamic Light Scattering Method to Calculate Translational and Rotational Diffusion Coefficients of Nanorods. Part. Part. Syst. Charact. 2019, 36, 1800388. [Google Scholar] [CrossRef]
- Hubert, F.; Testard, F.; Thill, A.; Kong, Q.; Tache, O.; Spalla, O. Growth and Overgrowth of Concentrated Gold Nanorods: Time Resolved SAXS and XANES. Cryst. Growth Des. 2012, 12, 1548–1555. [Google Scholar] [CrossRef]
- Guinier, A.; Fournet, G.; Walker, C.B.; Vineyard, G.H. Small-Angle Scattering of X-Rays. Phys. Today 1956, 9, 38. [Google Scholar] [CrossRef] [Green Version]
- Morita, T.; Hatakeyama, Y.; Nishikawa, K.; Tanaka, E.; Shingai, R.; Murai, H.; Nakano, H.; Hino, K. Multiple small-angle X-ray scattering analyses of the structure of gold nanorods with unique end caps. Chem. Phys. 2009, 364, 14–18. [Google Scholar] [CrossRef]
- Schulz, F.; Möller, J.; Lehmkühler, F.; Smith, A.J.; Vossmeyer, T.; Lange, H.; Grübel, G.; Schroer, M.A. Structure and Stability of PEG- and Mixed PEG-Layer-Coated Nanoparticles at High Particle Concentrations Studied In Situ by Small-Angle X-Ray Scattering. Part. Part. Syst. Charact. 2018, 35, 1700319. [Google Scholar] [CrossRef]
- Kuttner, C.; Höller, R.P.M.; Quintanilla, M.; Schnepf, M.J.; Dulle, M.; Fery, A.; Liz-Marzán, L.M. SERS and plasmonic heating efficiency from anisotropic core/satellite superstructures. Nanoscale 2019, 11, 17655–17663. [Google Scholar] [CrossRef] [Green Version]
- Nikoobakht, B.; Wang, J.; El-Sayed, M.A. Surface-enhanced Raman scattering of molecules adsorbed on gold nanorods: off-surface plasmon resonance condition. Chem. Phys. Lett. 2002, 366, 17–23. [Google Scholar] [CrossRef]
- Liao, H.; Hafner, J.H. Gold Nanorod Bioconjugates. Chem. Mater. 2005, 17, 4636–4641. [Google Scholar] [CrossRef]
- Park, K.; Biswas, S.; Kanel, S.; Nepal, D.; Vaia, R.A. Engineering the Optical Properties of Gold Nanorods: Independent Tuning of Surface Plasmon Energy, Extinction Coefficient, and Scattering Cross Section. J. Phys. Chem. C 2014, 118, 5918–5926. [Google Scholar] [CrossRef]
- Scarabelli, L.; Grzelczak, M.; Liz-Marzán, L.M. Tuning Gold Nanorod Synthesis through Prereduction with Salicylic Acid. Chem. Mater. 2013, 25, 4232–4238. [Google Scholar] [CrossRef] [Green Version]
- Rodríguez-Fernández, J.; Pérez-Juste, J.; Mulvaney, P.; Liz-Marzán, L.M. Spatially-Directed Oxidation of Gold Nanoparticles by Au(III)−CTAB Complexes. J. Phys. Chem. B 2005, 109, 14257–14261. [Google Scholar] [CrossRef]
- Hendel, T.; Wuithschick, M.; Kettemann, F.; Birnbaum, A.; Rademann, K.; Polte, J. In Situ Determination of Colloidal Gold Concentrations with UV–Vis Spectroscopy: Limitations and Perspectives. Anal. Chem. 2014, 86, 11115–11124. [Google Scholar] [CrossRef]
- Edgar, J.A.; McDonagh, A.M.; Cortie, M.B. Formation of Gold Nanorods by a Stochastic “Popcorn” Mechanism. ACS Nano 2012, 6, 1116–1125. [Google Scholar] [CrossRef] [PubMed] [Green Version]
- Gao, Z.; Burrows, N.D.; Valley, N.A.; Schatz, G.C.; Murphy, C.J.; Haynes, C.L. In solution SERS sensing using mesoporous silica-coated gold nanorods. The Analyst 2016, 141, 5088–5095. [Google Scholar] [CrossRef] [PubMed]
- Wang, X.; Li, Y.; Wang, H.; Fu, Q.; Peng, J.; Wang, Y.; Du, J.; Zhou, Y.; Zhan, L. Gold nanorod-based localized surface plasmon resonance biosensor for sensitive detection of hepatitis B virus in buffer, blood serum and plasma. Biosens. Bioelectron. 2010, 26, 404–410. [Google Scholar] [CrossRef]
- Zhang, K.; Shen, X. Cancer antigen 125 detection using the plasmon resonance scattering properties of gold nanorods. The Analyst 2013, 138, 1828. [Google Scholar] [CrossRef] [PubMed]
- Wang, C.; Chen, Y.; Wang, T.; Ma, Z.; Su, Z. Biorecognition-Driven Self-Assembly of Gold Nanorods: A Rapid and Sensitive Approach toward Antibody Sensing. Chem. Mater. 2007, 19, 5809–5811. [Google Scholar] [CrossRef]
- Guo, Z.R.; Gu, C.R.; Fan, X.; Bian, Z.P.; Wu, H.F.; Yang, D.; Gu, N.; Zhang, J.N. Fabrication of Anti-human Cardiac Troponin I Immunogold Nanorods for Sensing Acute Myocardial Damage. Nanoscale Res. Lett. 2009, 4, 1428–1433. [Google Scholar] [CrossRef] [Green Version]
- Casas, J.; Venkataramasubramani, M.; Wang, Y.; Tang, L. Replacement of cetyltrimethylammoniumbromide bilayer on gold nanorod by alkanethiol crosslinker for enhanced plasmon resonance sensitivity. Biosens. Bioelectron. 2013, 49, 525–530. [Google Scholar] [CrossRef] [PubMed] [Green Version]
- Wang, Y.; Tang, L. Chemisorption assembly of Au nanorods on mercaptosilanized glass substrate for label-free nanoplasmon biochip. Anal. Chim. Acta 2013, 796, 122–129. [Google Scholar] [CrossRef] [PubMed] [Green Version]
- Boujday, S.; Lambert, J.-F.; Che, M. Amorphous Silica as a Versatile Supermolecular Ligand for NiII Amine Complexes: Toward Interfacial Molecular Recognition. ChemPhysChem 2004, 5, 1003–1013. [Google Scholar] [CrossRef]
- Song, L.; Zhang, L.; Huang, Y.; Chen, L.; Zhang, G.; Shen, Z.; Zhang, J.; Xiao, Z.; Chen, T. Amplifying the signal of localized surface plasmon resonance sensing for the sensitive detection of Escherichia coli O157:H7. Sci. Rep. 2017, 7, 3288. [Google Scholar] [CrossRef] [PubMed] [Green Version]
- Li, Y.; Zhang, Y.; Zhao, M.; Zhou, Q.; Wang, L.; Wang, H.; Wang, X.; Zhan, L. A simple aptamer-functionalized gold nanorods based biosensor for the sensitive detection of MCF-7 breast cancer cells. Chem. Commun. 2016, 52, 3959–3961. [Google Scholar] [CrossRef] [PubMed]
- Lee, B.; Park, J.-H.; Byun, J.-Y.; Kim, J.H.; Kim, M.-G. An optical fiber-based LSPR aptasensor for simple and rapid in-situ detection of ochratoxin A. Biosens. Bioelectron. 2018, 102, 504–509. [Google Scholar] [CrossRef] [PubMed]
- Ha, S.-J.; Park, J.-H.; Lee, B.; Kim, M.-G. Label-Free Direct Detection of Saxitoxin Based on a Localized Surface Plasmon Resonance Aptasensor. Toxins 2019, 11, 274. [Google Scholar] [CrossRef] [Green Version]
- Park, J.-H.; Byun, J.-Y.; Jang, H.; Hong, D.; Kim, M.-G. A highly sensitive and widely adaptable plasmonic aptasensor using berberine for small-molecule detection. Biosens. Bioelectron. 2017, 97, 292–298. [Google Scholar] [CrossRef]
- Park, J.-H.; Byun, J.-Y.; Shim, W.-B.; Kim, S.U.; Kim, M.-G. High-sensitivity detection of ATP using a localized surface plasmon resonance (LSPR) sensor and split aptamers. Biosens. Bioelectron. 2015, 73, 26–31. [Google Scholar] [CrossRef]
- Wang, X.; Li, Y.; Wang, J.; Wang, Q.; Xu, L.; Du, J.; Yan, S.; Zhou, Y.; Fu, Q.; Wang, Y.; et al. A broad-range method to detect genomic DNA of multiple pathogenic bacteria based on the aggregation strategy of gold nanorods. The Analyst 2012, 137, 4267–4273. [Google Scholar] [CrossRef]
- Rosman, C.; Prasad, J.; Neiser, A.; Henkel, A.; Edgar, J.; Sönnichsen, C. Multiplexed Plasmon Sensor for Rapid Label-Free Analyte Detection. Nano Lett. 2013, 13, 3243–3247. [Google Scholar] [CrossRef]
- Parab, H.J.; Jung, C.; Lee, J.-H.; Park, H.G. A gold nanorod-based optical DNA biosensor for the diagnosis of pathogens. Biosens. Bioelectron. 2010, 26, 667–673. [Google Scholar] [CrossRef] [PubMed]
- Tadepalli, S.; Kuang, Z.; Jiang, Q.; Liu, K.-K.; Fisher, M.A.; Morrissey, J.J.; Kharasch, E.D.; Slocik, J.M.; Naik, R.R.; Singamaneni, S. Peptide Functionalized Gold Nanorods for the Sensitive Detection of a Cardiac Biomarker Using Plasmonic Paper Devices. Sci. Rep. 2015, 5, 16206. [Google Scholar] [CrossRef] [PubMed] [Green Version]
- Zhao, Y.; Tong, L.; Li, Y.; Pan, H.; Zhang, W.; Guan, M.; Li, W.; Chen, Y.; Li, Q.; Li, Z.; et al. Lactose-Functionalized Gold Nanorods for Sensitive and Rapid Serological Diagnosis of Cancer. ACS Appl. Mater. Interfaces 2016, 8, 5813–5820. [Google Scholar] [CrossRef]
- Wang, X.; Mei, Z.; Wang, Y.; Tang, L. Comparison of four methods for the biofunctionalization of gold nanorods by the introduction of sulfhydryl groups to antibodies. Beilstein J. Nanotechnol. 2017, 8, 372–380. [Google Scholar] [CrossRef] [Green Version]
- Zhu, L.; Li, G.; Sun, S.; Tan, H.; He, Y. Digital immunoassay of a prostate-specific antigen using gold nanorods and magnetic nanoparticles. RSC Adv. 2017, 7, 27595–27602. [Google Scholar] [CrossRef] [Green Version]
- Wang, X.; Mei, Z.; Wang, Y.; Tang, L. Gold nanorod biochip functionalization by antibody thiolation. Talanta 2015, 136, 1–8. [Google Scholar] [CrossRef] [Green Version]
- Wang, Y.; Tang, L.-J.; Jiang, J.-H. Surface-Enhanced Raman Spectroscopy-Based, Homogeneous, Multiplexed Immunoassay with Antibody-Fragments-Decorated Gold Nanoparticles. Anal. Chem. 2013, 85, 9213–9220. [Google Scholar] [CrossRef]
- Joshi, P.P.; Yoon, S.J.; Hardin, W.G.; Emelianov, S.; Sokolov, K.V. Conjugation of Antibodies to Gold Nanorods through Fc Portion: Synthesis and Molecular Specific Imaging. Bioconjug. Chem. 2013, 24, 878–888. [Google Scholar] [CrossRef] [Green Version]
- Byun, J.-Y.; Shin, Y.-B.; Li, T.; Park, J.-H.; Kim, D.-M.; Choi, D.-H.; Kim, M.-G. The use of an engineered single chain variable fragment in a localized surface plasmon resonance method for analysis of the C-reactive protein. Chem. Commun. 2013, 49, 9497–9499. [Google Scholar] [CrossRef]
- Shams, S.; Bakhshi, B.; Tohidi Moghadam, T.; Behmanesh, M. A sensitive gold-nanorods-based nanobiosensor for specific detection of Campylobacter jejuni and Campylobacter coli. J. Nanobiotechnology 2019, 17. [Google Scholar] [CrossRef]
- Wijaya, A.; Hamad-Schifferli, K. Ligand Customization and DNA Functionalization of Gold Nanorods via Round-Trip Phase Transfer Ligand Exchange. Langmuir 2008, 24, 9966–9969. [Google Scholar] [CrossRef]
- Pekcevik, I.C.; Poon, L.C.H.; Wang, M.C.P.; Gates, B.D. Tunable Loading of Single-Stranded DNA on Gold Nanorods through the Displacement of Polyvinylpyrrolidone. Anal. Chem. 2013, 85, 9960–9967. [Google Scholar] [CrossRef] [PubMed] [Green Version]
- Li, J.; Zhu, B.; Zhu, Z.; Zhang, Y.; Yao, X.; Tu, S.; Liu, R.; Jia, S.; Yang, C.J. Simple and Rapid Functionalization of Gold Nanorods with Oligonucleotides Using an mPEG-SH/Tween 20-Assisted Approach. Langmuir 2015, 31, 7869–7876. [Google Scholar] [CrossRef]
- Cao, J.; Galbraith, E.K.; Sun, T.; Grattan, K.T.V. Effective surface modification of gold nanorods for localized surface plasmon resonance-based biosensors. Sens. Actuators B Chem. 2012, 169, 360–367. [Google Scholar] [CrossRef]
- Xu, X.; Liu, X.; Li, Y.; Ying, Y. A simple and rapid optical biosensor for detection of aflatoxin B1 based on competitive dispersion of gold nanorods. Biosens. Bioelectron. 2013, 47, 361–367. [Google Scholar] [CrossRef] [PubMed]
- Huang, H.; Tang, C.; Zeng, Y.; Yu, X.; Liao, B.; Xia, X.; Yi, P.; Chu, P.K. Label-free optical biosensor based on localized surface plasmon resonance of immobilized gold nanorods. Colloids Surf. B Biointerfaces 2009, 71, 96–101. [Google Scholar] [CrossRef]
- Peixoto, L.P.F.; Santos, J.F.L.; Andrade, G.F.S. Plasmonic nanobiosensor based on Au nanorods with improved sensitivity: A comparative study for two different configurations. Anal. Chim. Acta 2019, 1084, 71–77. [Google Scholar] [CrossRef]
- Marinakos, S.M.; Chen, S.; Chilkoti, A. Plasmonic Detection of a Model Analyte in Serum by a Gold Nanorod Sensor. Anal. Chem. 2007, 79, 5278–5283. [Google Scholar] [CrossRef]
- Mayer, K.M.; Lee, S.; Liao, H.; Rostro, B.C.; Fuentes, A.; Scully, P.T.; Nehl, C.L.; Hafner, J.H. A Label-Free Immunoassay Based Upon Localized Surface Plasmon Resonance of Gold Nanorods. ACS Nano 2008, 2, 687–692. [Google Scholar] [CrossRef]
- Kaushal, S.; Priyadarshi, N.; Pinnaka, A.K.; Soni, S.; Deep, A.; Singhal, N.K. Glycoconjugates coated gold nanorods based novel biosensor for optical detection and photothermal ablation of food borne bacteria. Sens. Actuators B Chem. 2019, 289, 207–215. [Google Scholar] [CrossRef]
- Loo, J.; Lau, P.-M.; Kong, S.-K.; Ho, H.-P. An Assay Using Localized Surface Plasmon Resonance and Gold Nanorods Functionalized with Aptamers to Sense the Cytochrome-c Released from Apoptotic Cancer Cells for Anti-Cancer Drug Effect Determination. Micromachines 2017, 8, 338. [Google Scholar] [CrossRef] [PubMed] [Green Version]
- Pai, J.-H.; Yang, C.-T.; Hsu, H.-Y.; Wedding, A.B.; Thierry, B. Development of a simplified approach for the fabrication of localised surface plasmon resonance sensors based on gold nanorods functionalized using mixed polyethylene glycol layers. Anal. Chim. Acta 2017, 974, 87–92. [Google Scholar] [CrossRef]
- Guo, L.; Huang, Y.; Kikutani, Y.; Tanaka, Y.; Kitamori, T.; Kim, D.-H. In situ assembly, regeneration and plasmonic immunosensing of a Au nanorod monolayer in a closed-surface flow channel. Lab. Chip 2011, 11, 3299–3304. [Google Scholar] [CrossRef]
- Truong, P.L.; Kim, B.W.; Sim, S.J. Rational aspect ratio and suitable antibody coverage of gold nanorod for ultra-sensitive detection of a cancer biomarker. Lab. Chip 2012, 12, 1102–1109. [Google Scholar] [CrossRef]
- Vial, S.; Wenger, J. Single-step homogeneous immunoassay for detecting prostate-specific antigen using dual-color light scattering of metal nanoparticles. The Analyst 2017, 142, 3484–3491. [Google Scholar] [CrossRef]
- Tang, L.; Casas, J.; Venkataramasubramani, M. Magnetic Nanoparticle Mediated Enhancement of Localized Surface Plasmon Resonance for Ultrasensitive Bioanalytical Assay in Human Blood Plasma. Anal. Chem. 2013, 85, 1431–1439. [Google Scholar] [CrossRef] [Green Version]
- Tang, L.; Casas, J. Quantification of cardiac biomarkers using label-free and multiplexed gold nanorod bioprobes for myocardial infarction diagnosis. Biosens. Bioelectron. 2014, 61, 70–75. [Google Scholar] [CrossRef] [PubMed] [Green Version]
- Temur, E.; Zengin, A.; Boyacı, İ.H.; Dudak, F.C.; Torul, H.; Tamer, U. Attomole Sensitivity of Staphylococcal Enterotoxin B Detection Using an Aptamer-Modified Surface-Enhanced Raman Scattering Probe. Anal. Chem. 2012, 84, 10600–10606. [Google Scholar] [CrossRef] [PubMed]
- Chen, C.-D.; Cheng, S.-F.; Chau, L.-K.; Wang, C.R.C. Sensing capability of the localized surface plasmon resonance of gold nanorods. Biosens. Bioelectron. 2007, 22, 926–932. [Google Scholar] [CrossRef]
- Guo, Y.-J.; Sun, G.-M.; Zhang, L.; Tang, Y.-J.; Luo, J.-J.; Yang, P.-H. Multifunctional optical probe based on gold nanorods for detection and identification of cancer cells. Sens. Actuators B Chem. 2014, 191, 741–749. [Google Scholar] [CrossRef]
- Wang, C.; Irudayaraj, J. Gold Nanorod Probes for the Detection of Multiple Pathogens. Small 2008, 4, 2204–2208. [Google Scholar] [CrossRef]
- Wang, Y.; Lee, K.; Irudayaraj, J. SERS aptasensor from nanorod–nanoparticle junction for protein detection. Chem Commun 2010, 46, 613–615. [Google Scholar] [CrossRef]
- Wang, C.; Ma, Z.; Wang, T.; Su, Z. Synthesis, Assembly, and Biofunctionalization of Silica-Coated Gold Nanorods for Colorimetric Biosensing. Adv. Funct. Mater. 2006, 16, 1673–1678. [Google Scholar] [CrossRef]
- Wang, L.; Zhu, Y.; Xu, L.; Chen, W.; Kuang, H.; Liu, L.; Agarwal, A.; Xu, C.; Kotov, N.A. Side-by-Side and End-to-End Gold Nanorod Assemblies for Environmental Toxin Sensing. Angew. Chem. Int. Ed. 2010, 49, 5472–5475. [Google Scholar] [CrossRef] [PubMed] [Green Version]
- Zijlstra, P.; Paulo, P.M.R.; Orrit, M. Optical detection of single non-absorbing molecules using the surface plasmon resonance of a gold nanorod. Nat. Nanotechnol. 2012, 7, 379–382. [Google Scholar] [CrossRef] [PubMed] [Green Version]
- Murphy, C.J.; Sau, T.K.; Gole, A.M.; Orendorff, C.J.; Gao, J.; Gou, L.; Hunyadi, S.E.; Li, T. Anisotropic Metal Nanoparticles: Synthesis, Assembly, and Optical Applications. J. Phys. Chem. B 2005, 109, 13857–13870. [Google Scholar] [CrossRef]
- Caswell, K.K.; Wilson, J.N.; Bunz, U.H.F.; Murphy, C.J. Preferential End-to-End Assembly of Gold Nanorods by Biotin−Streptavidin Connectors. J. Am. Chem. Soc. 2003, 125, 13914–13915. [Google Scholar] [CrossRef]
- Zijlstra, P.; Paulo, P.M.R.; Yu, K.; Xu, Q.-H.; Orrit, M. Chemical Interface Damping in Single Gold Nanorods and Its Near Elimination by Tip-Specific Functionalization. Angew. Chem. Int. Ed. 2012, 51, 8352–8355. [Google Scholar] [CrossRef] [PubMed]
- Paulo, P.M.R.; Zijlstra, P.; Orrit, M.; Garcia-Fernandez, E.; Pace, T.C.S.; Viana, A.S.; Costa, S.M.B. Tip-Specific Functionalization of Gold Nanorods for Plasmonic Biosensing: Effect of Linker Chain Length. Langmuir 2017, 33, 6503–6510. [Google Scholar] [CrossRef]
- Zhen, S.J.; Huang, C.Z.; Wang, J.; Li, Y.F. End-to-End Assembly of Gold Nanorods on the Basis of Aptamer−Protein Recognition. J. Phys. Chem. C 2009, 113, 21543–21547. [Google Scholar] [CrossRef]
- Xu, X.; Xu, C.; Ying, Y. Aptasensor for the simple detection of ochratoxin A based on side-by-side assembly of gold nanorods. RSC Adv. 2016, 6, 50437–50443. [Google Scholar] [CrossRef]
- Yu, C.; Irudayaraj, J. Multiplex Biosensor Using Gold Nanorods. Anal. Chem. 2007, 79, 572–579. [Google Scholar] [CrossRef]
- Chang, J.-Y.; Wu, H.; Chen, H.; Ling, Y.-C.; Tan, W. Oriented assembly of Au nanorods using biorecognition system. Chem. Commun. 2005, 1092–1094. [Google Scholar] [CrossRef] [PubMed] [Green Version]
- Zhu, Y.; Kuang, H.; Xu, L.; Ma, W.; Peng, C.; Hua, Y.; Wang, L.; Xu, C. Gold nanorod assembly based approach to toxin detection by SERS. J Mater Chem 2012, 22, 2387–2391. [Google Scholar] [CrossRef]
- Zhu, Y.; Qu, C.; Kuang, H.; Xu, L.; Liu, L.; Hua, Y.; Wang, L.; Xu, C. Simple, rapid and sensitive detection of antibiotics based on the side-by-side assembly of gold nanorod probes. Biosens. Bioelectron. 2011, 26, 4387–4392. [Google Scholar] [CrossRef]
- Park, W.M.; Choi, B.G.; Huh, Y.S.; Hong, W.H.; Lee, S.Y.; Park, T.J. Facile Functionalization of Colloidal Gold Nanorods by the Specific Binding of an Engineered Protein that Is Preferred over CTAB Bilayers. ChemPlusChem 2013, 78, 48–51. [Google Scholar] [CrossRef]
- Ben Haddada, M.; Hu, D.; Salmain, M.; Zhang, L.; Peng, C.; Wang, Y.; Liedberg, B.; Boujday, S. Gold nanoparticle-based localized surface plasmon immunosensor for staphylococcal enterotoxin A (SEA) detection. Anal. Bioanal. Chem. 2017, 409, 6227–6234. [Google Scholar] [CrossRef] [Green Version]
- Wang, Y.; Liu, X.; Chen, P.; Tran, N.T.; Zhang, J.; Chia, W.S.; Boujday, S.; Liedberg, B. Smartphone spectrometer for colorimetric biosensing. Analyst 2016, 141, 3233–3238. [Google Scholar] [CrossRef]
- Zhang, L.; Salmain, M.; Liedberg, B.; Boujday, S. Naked Eye Immunosensing of Food Biotoxins Using Gold Nanoparticle-Antibody Bioconjugates. ACS Appl. Nano Mater. 2019, 2, 4150–4158. [Google Scholar] [CrossRef]
- Mayer, K.M.; Hafner, J.H. Localized Surface Plasmon Resonance Sensors. Chem. Rev. 2011, 111, 3828–3857. [Google Scholar] [CrossRef]
- Nusz, G.J.; Curry, A.C.; Marinakos, S.M.; Wax, A.; Chilkoti, A. Rational Selection of Gold Nanorod Geometry for Label-Free Plasmonic Biosensors. ACS Nano 2009, 3, 795–806. [Google Scholar] [CrossRef]
- Tian, L.; Chen, E.; Gandra, N.; Abbas, A.; Singamaneni, S. Gold Nanorods as Plasmonic Nanotransducers: Distance-Dependent Refractive Index Sensitivity. Langmuir 2012, 28, 17435–17442. [Google Scholar] [CrossRef] [PubMed]
- Anker, J.N.; Hall, W.P.; Lyandres, O.; Shah, N.C.; Zhao, J.; Van Duyne, R.P. Biosensing with plasmonic nanosensors. Nat. Mater. 2008, 7, 442–453. [Google Scholar] [CrossRef] [PubMed]
- Zhang, L.; Mazouzi, Y.; Salmain, M.; Liedberg, B.; Boujday, S. Antibody-Gold Nanoparticle Bioconjugates for Biosensors: Synthesis, Characterization and Selected Applications. Biosens. Bioelectron. 2020, 165, 112370. [Google Scholar] [CrossRef] [PubMed]
- Jackman, J.A.; Ferhan, A.R.; Cho, N.-J. Nanoplasmonic sensors for biointerfacial science. Chem. Soc. Rev. 2017, 46, 3615–3660. [Google Scholar] [CrossRef]
- Ping, J.; Zhou, Y.; Wu, Y.; Papper, V.; Boujday, S.; Marks, R.S.; Steele, T.W.J. Recent advances in aptasensors based on graphene and graphene-like nanomaterials. Biosens. Bioelectron. 2015, 64, 373–385. [Google Scholar] [CrossRef]
- Park, J.-H.; Byun, J.-Y.; Mun, H.; Shim, W.-B.; Shin, Y.-B.; Li, T.; Kim, M.-G. A regeneratable, label-free, localized surface plasmon resonance (LSPR) aptasensor for the detection of ochratoxin A. Biosens. Bioelectron. 2014, 59, 321–327. [Google Scholar] [CrossRef]
- Tadimety, A.; Zhang, Y.; Kready, K.M.; Palinski, T.J.; Tsongalis, G.J.; Zhang, J.X.J. Design of peptide nucleic acid probes on plasmonic gold nanorods for detection of circulating tumor DNA point mutations. Biosens. Bioelectron. 2019, 130, 236–244. [Google Scholar] [CrossRef]
- McFarland, A.D.; Van Duyne, R.P. Single Silver Nanoparticles as Real-Time Optical Sensors with Zeptomole Sensitivity. Nano Lett. 2003, 3, 1057–1062. [Google Scholar] [CrossRef] [Green Version]
- Raschke, G.; Kowarik, S.; Franzl, T.; Sönnichsen, C.; Klar, T.A.; Feldmann, J.; Nichtl, A.; Kürzinger, K. Biomolecular Recognition Based on Single Gold Nanoparticle Light Scattering. Nano Lett. 2003, 3, 935–938. [Google Scholar] [CrossRef]
- Nusz, G.J.; Marinakos, S.M.; Curry, A.C.; Dahlin, A.; Höök, F.; Wax, A.; Chilkoti, A. Label-Free Plasmonic Detection of Biomolecular Binding by a Single Gold Nanorod. Anal. Chem. 2008, 80, 984–989. [Google Scholar] [CrossRef] [PubMed] [Green Version]
- Guo, L.; Zhou, X.; Kim, D.-H. Facile fabrication of distance-tunable Au-nanorod chips for single-nanoparticle plasmonic biosensors. Biosens. Bioelectron. 2011, 26, 2246–2251. [Google Scholar] [CrossRef]
- Guo, L.; Kim, D.-H. Reusable plasmonic aptasensors: using a single nanoparticle to establish a calibration curve and to detect analytes. Chem. Commun. 2011, 47, 7125–7127. [Google Scholar] [CrossRef]
- Guo, L.; Kim, D.-H. LSPR biomolecular assay with high sensitivity induced by aptamer–antigen–antibody sandwich complex. Biosens. Bioelectron. 2012, 31, 567–570. [Google Scholar] [CrossRef]
- Truong, P.L.; Cao, C.; Park, S.; Kim, M.; Sim, S.J. A new method for non-labeling attomolar detection of diseases based on an individual gold nanorod immunosensor. Lab. Chip 2011, 11, 2591–2597. [Google Scholar] [CrossRef] [PubMed]
- Wu, B.; Chen, L.-C.; Huang, Y.; Zhang, Y.; Kang, Y.; Kim, D.-H. Multiplexed Biomolecular Detection Based on Single Nanoparticles Immobilized on Pneumatically Controlled Microfluidic Chip. Plasmonics 2014, 9, 801–807. [Google Scholar] [CrossRef]
- Ahijado-Guzmán, R.; Prasad, J.; Rosman, C.; Henkel, A.; Tome, L.; Schneider, D.; Rivas, G.; Sönnichsen, C. Plasmonic Nanosensors for Simultaneous Quantification of Multiple Protein–Protein Binding Affinities. Nano Lett. 2014, 14, 5528–5532. [Google Scholar] [CrossRef] [PubMed]


| Method | AR | Solvent | [CTAB] | Primer | Silica Source | Reaction Time | Shell Thickness (nm) | Shell Feature |
|---|---|---|---|---|---|---|---|---|
| Obare et al. [67] | 13.0 | Water | Minimized | MPTMS | Na2SiO3 | 24 h | 8 | Thin |
| Perez-Juste et al. [68] | 1.9–3.8 | Water | Minimized | MPTMS | Na2SiO3 | 2 d | 5–7 | Thin |
| Li et al. [70] | 3.0 | Water | Minimized | APTMS | Na2SiO3 | 1–2 d | 4 | Thin |
| Li et al. [69] | NC | Water | Minimized | MPTMS | Na2SiO3 | 2–6 d | 0.5–3.5 | Ultrathin |
| Fernández-López et al. [71] | 3.5–4.8 | EtOH/Water | Without | PEG-SH | TEOS | 2 h | 4–31 | Thin/Thick and dense |
| Wang et al. [72] | 3.2 | EtOH | Without | PEG-SH | TEOS | 3 h | nc | Thick and mesoporous |
| Method | AR | Solvent | Primer | Reaction Time | Shell Thickness (nm) | Shell Feature |
|---|---|---|---|---|---|---|
| Pastoriza-Santos et al. [75] | 4.0 | 2-propanol/Water | PSS, PADH, PVP | 2 h | 15–40 | Thick and dense |
| Nallathamby et al. [77] | 3.6 | EtOH | PVP | 24 h | 2–3 | Thin |
| Method | AR | Solvent | [CTAB] (mM) | Precursor | Reaction Time | Shell Thickness (nm) | Shell Feature |
|---|---|---|---|---|---|---|---|
| Gorelikov et al. [78] | 3.5 | MeOH/Water | Minimized | TEOS | 2 d | 15–60 | Thick and mesoporous |
| Wu et al. [81] | 3.6 | EtOH/Water | 0.1 | TEOS | 20 h | 3–20 | Thin/Thick and Mesoporous |
| Cong et al. [79] | 3.0 | Isopropanol/Water | 0.2 | TEOS | 20 h | 60–150 | Thick and dense |
| Liu et al. [80] | 4.3 | EtOH/Water | Minimized | TEOS | 20 h | 10–40 | Thick and mesoporous |
| Abadeer et al. [82] | 1.1 | MeOH/Water | 0.4–1.2 | TEOS | 20 h | 11–26 | Thick and mesoporous |
| Yoon et al. [83] | NC | MeOH/Water | 0.4–50 | TEOS | 24 h | 8–21 | Thick and mesoporous |
| Rowe et al. [84] | 4.0 | MeOH/Water | 1.7 | TEOS | 20 h | NC | Uniform to Dumbbell |
| Wang et al. [85] | 3.9 | EtOH/Water | 1–9 | TEOS | 12 h | 13–20 | Uniform to Dumbbell |
| Analyte | Format | Analytical Performances | Ref. |
|---|---|---|---|
| hIgG | Direct; aggregation | LoD = 60 ng/mL (0.4 nM) | [130] |
| Goat anti-hIgG | direct | LoD = 0.4 nM DR = 0.4–100 nM | [156] |
| HBsAg | Direct | LoD = 0.01 IU/mL DR = 0.01–1 IU/mL | [128] |
| cTnI | Direct; aggregation | LoD = 10 ng/mL DR = 1–200 ng/mL | [131] |
| Sandwich with MNP-Ab | LoD = 1 ng/mL DR = 1–20 ng/mL | [168] | |
| Direct | LoD = 1 ng/mL DR = 1–20 ng/mL | [132] | |
| CRP | Direct | LoD = 6.2 nM DR = 10–100 nM | [188] |
| E. coli O157:H7 | Direct | LoD = 10 CFU Linear response to 5 × 10⁴ CFU | [135] |
| MC-LR | Competitive disassembly | LoD = 0.03 or 0.6 ng/mL DR = 0.05–1 ng/mL or 1–100 ng/mL | [176] |
| Aflatoxin B1 | Competitive disassembly | LoD = 0.16 ng/mL DR = 0.5–20 ng/mL | [157] |
| Gentamicin | Competitive disassembly | LoD = 0.05 ng/mL DR = 0.1–20 ng/mL | [187] |
| E. coli O157:H7 S. typhimurium | Direct; aggregation; multiplex | DR = 10–108 CFU/mL | [173] |
| Mb cTnI | Direct; multiplex | DR (Mb) = 25–250 ng/mL DR (cTnI) = 1–10 ng/mL | [169] |
| Analyte | Format | Analytical Performances | Ref. |
|---|---|---|---|
| Human IgG | Direct | LoD = 61 pM DR = 33–233 nM | [133] |
| Direct | DR = 10–40 nM | [146,148] | |
| Direct; visual detection | LoD = 1 ng/mL DR = 1–10 ng/mL | [175] | |
| ALCAM | Direct | LoD = 15 pM DR = 0.05–30 nM | [164] |
| CRP | Direct | DR = 1–10 ng/mL | [151] |
| cTnI | Direct * | LoD = 353 pg/mL | [144] |
| Analyte | Format | Analytical Performances | Ref. |
|---|---|---|---|
| Ochratoxin A (OTA) | Direct; glass slide | LoD = 1 nM DR = 0.1 nM–10 µM | [199] |
| Direct; optical fiber | LoD = 12 pM DR = 10 pM–100 nM | [137] | |
| Direct; glass slide | DR = 10 pM–10 µM LoD = 0.56 pM | [139] | |
| Solution; competitive disassembly | LoD = 0.54 nM DR = 1.2–25 nM | [183] | |
| Aflatoxin B1 | Direct; glass slide | DR = 10 pM–10 µM LoD = 0.63 pM | [139] |
| ATP | Direct; glass slide | DR = 10 pM–10 µM LoD = 0.87 pM | [139] |
| Direct; glass slide | DR = 10 pM–10 µM | [140] | |
| MCF-7 cancer cells (mucin-1) | Direct; Cells | [136] | |
| Cytochrome c (apoptosis marker) | Sandwich with MNP-Ab for capture; solution; aggregation | LoD = 0.1 ng/mL | [163] |
| cTnI | Direct; filter paper | LoD = 35 pg/mL DR = 35 pg/mL–3.5 µg/mL | [144] |
| Analyte | Bioreceptor | Format | Analytical Performances | Ref. |
|---|---|---|---|---|
| SAV | biotin | Direct; glass slide | LoD = 94 pM (5 ng/mL) DR = 2–2000 nM | [160] |
| LoD = 25 ng/mL DR = 25–4000 ng/mL | [171] | |||
| DR = 10–100 nM | [181] | |||
| Concanavalin A Peanut agglutinin | 4-aminophenyl α-D-mannopyranoside 4-aminophenyl b-D-galactopyranoside | Solution; aggregation | [162] | |
| Galectin-1 | lactose | Solution; aggregation | DR = 0.1–100 pM LoD = 0.1 pM | [145] |
| 16S rDNA Serratia marcenscens | DNA | Sandwich assay; aggregation | DR = 10 pM–10 nM LoD = 5 pM | [141] |
| ctDNA (KRAS gene mutation) | PNA | Direct | LoD = 2 ng/mL DR = 40–125 ng/mL | [200] |
| Chlamydia. trachomatis DNA | DNA | Sandwich assay; aggregation | DR = 0.25–20 nM | [143] |
| Folate receptor | Folic acid | Direct | DR = 100–5000 HeLa cells/mL LoD = 10 cells/mL | [172] |
| Analyte | Bioreceptor | Format | Analytical Performances | Ref. |
|---|---|---|---|---|
| SAV | Biotin | Direct | LoD = 1 nM | [203] |
| Thrombin | Aptamer | Direct | LoD = 10 ng/mL (0.28 nM) DR = 10 ng/mL–100 µg/mL | [204] |
| LoD = 0.6 ng/mL (17 pM) | [205] | |||
| Sandwich with Ab | LoD = 1.6 pM DR = 1 ng/mL–10 µg/mL | [206] | ||
| NGAL | Ab | Direct | LoD = 8.5 ng/mL (340 pM) DR = 10 ng/mL–1 µg/mL | [165] |
| PSA | Ab | Direct | DR = 0.1 fM–1 nM LoD = 0.11 fM | [207] |
| DR = 1 aM–0.1 nM LoD = 1 aM | [166] | |||
| PSA Thrombin IgE | Aptamer | Direct or sandwich with Ab; multiplex; 9-spot array | LoD = 1 ng/mL | [208] |
| Fibronectin SAV Thrombin IgE | Aptamer | Direct; multiplex | LoD (SAV) = 1 nM DR (SAV) = 1–30 nM | [142] |
| FtsZ | s1ZipA s2ZipA MinC | Direct; multiplex | DR = 0.2–100 µM | [209] |
Publisher’s Note: MDPI stays neutral with regard to jurisdictional claims in published maps and institutional affiliations. |
© 2020 by the authors. Licensee MDPI, Basel, Switzerland. This article is an open access article distributed under the terms and conditions of the Creative Commons Attribution (CC BY) license (http://creativecommons.org/licenses/by/4.0/).
Share and Cite
Pellas, V.; Hu, D.; Mazouzi, Y.; Mimoun, Y.; Blanchard, J.; Guibert, C.; Salmain, M.; Boujday, S. Gold Nanorods for LSPR Biosensing: Synthesis, Coating by Silica, and Bioanalytical Applications. Biosensors 2020, 10, 146. https://0-doi-org.brum.beds.ac.uk/10.3390/bios10100146
Pellas V, Hu D, Mazouzi Y, Mimoun Y, Blanchard J, Guibert C, Salmain M, Boujday S. Gold Nanorods for LSPR Biosensing: Synthesis, Coating by Silica, and Bioanalytical Applications. Biosensors. 2020; 10(10):146. https://0-doi-org.brum.beds.ac.uk/10.3390/bios10100146
Chicago/Turabian StylePellas, Vincent, David Hu, Yacine Mazouzi, Yoan Mimoun, Juliette Blanchard, Clément Guibert, Michèle Salmain, and Souhir Boujday. 2020. "Gold Nanorods for LSPR Biosensing: Synthesis, Coating by Silica, and Bioanalytical Applications" Biosensors 10, no. 10: 146. https://0-doi-org.brum.beds.ac.uk/10.3390/bios10100146