Determination of the Empirical Electrokinetic Equilibrium Condition of Microorganisms in Microfluidic Devices


Abstract
:1. Introduction
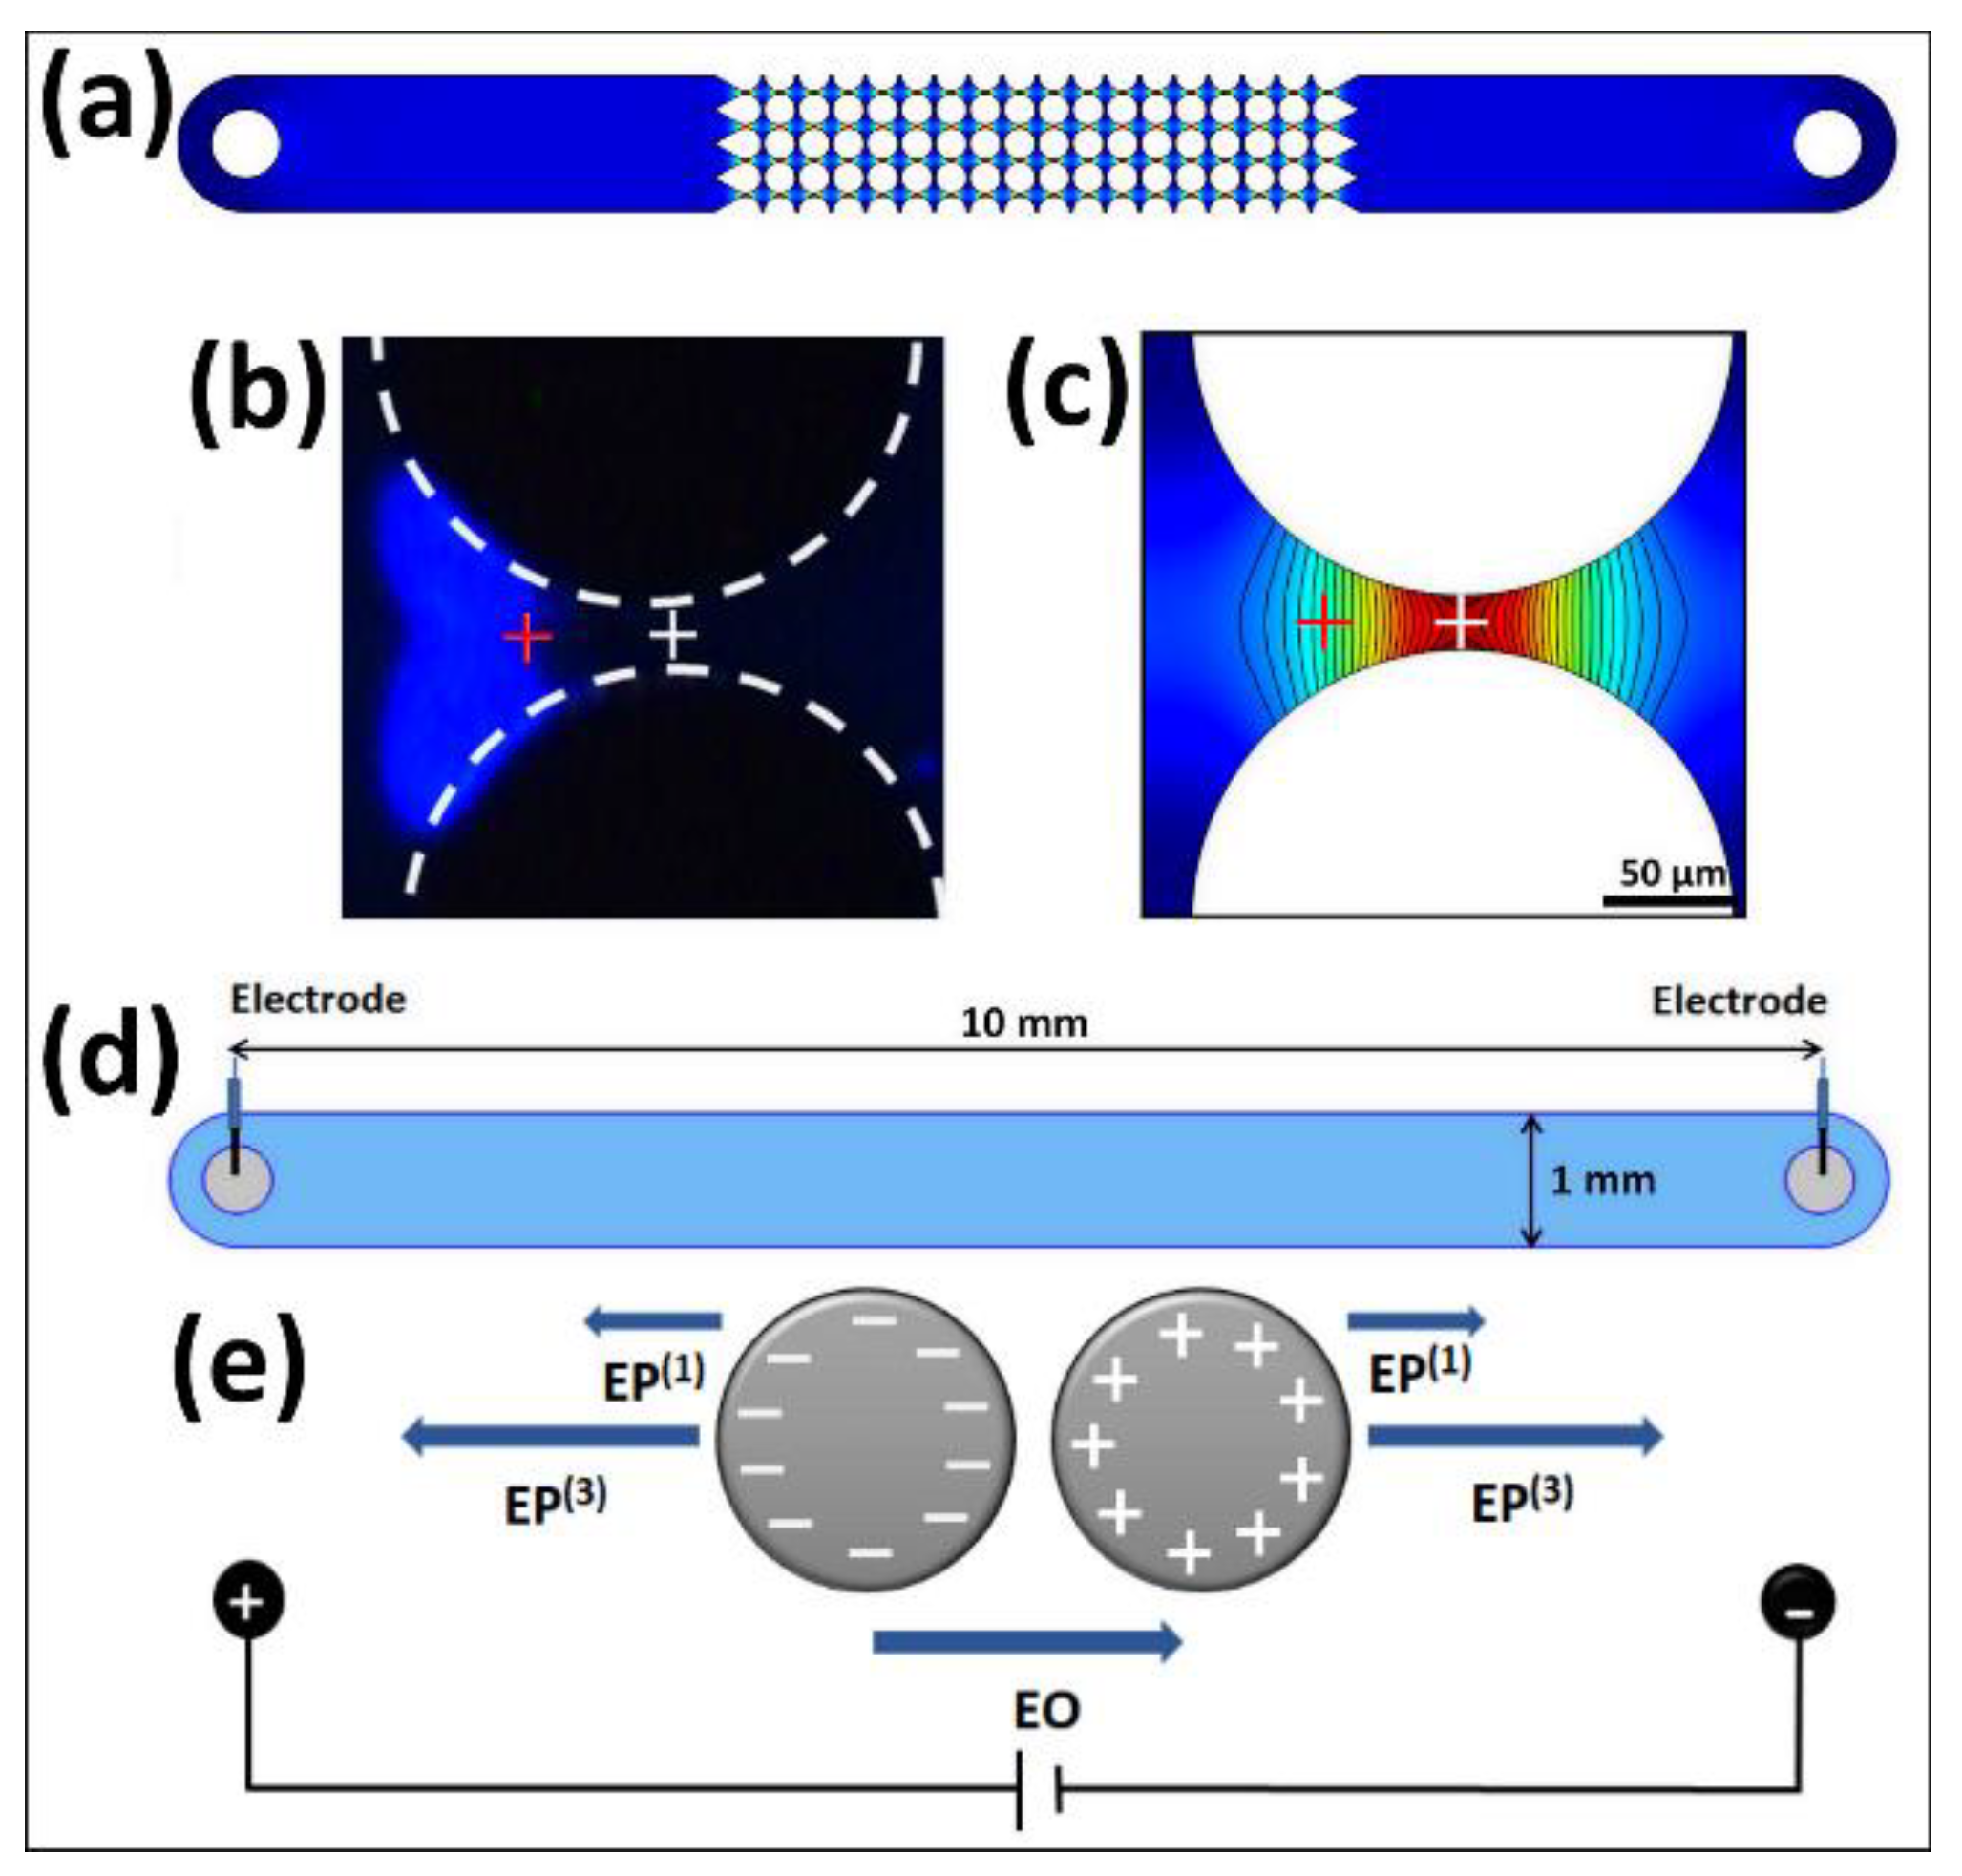
2. Theory
3. Materials and Methods
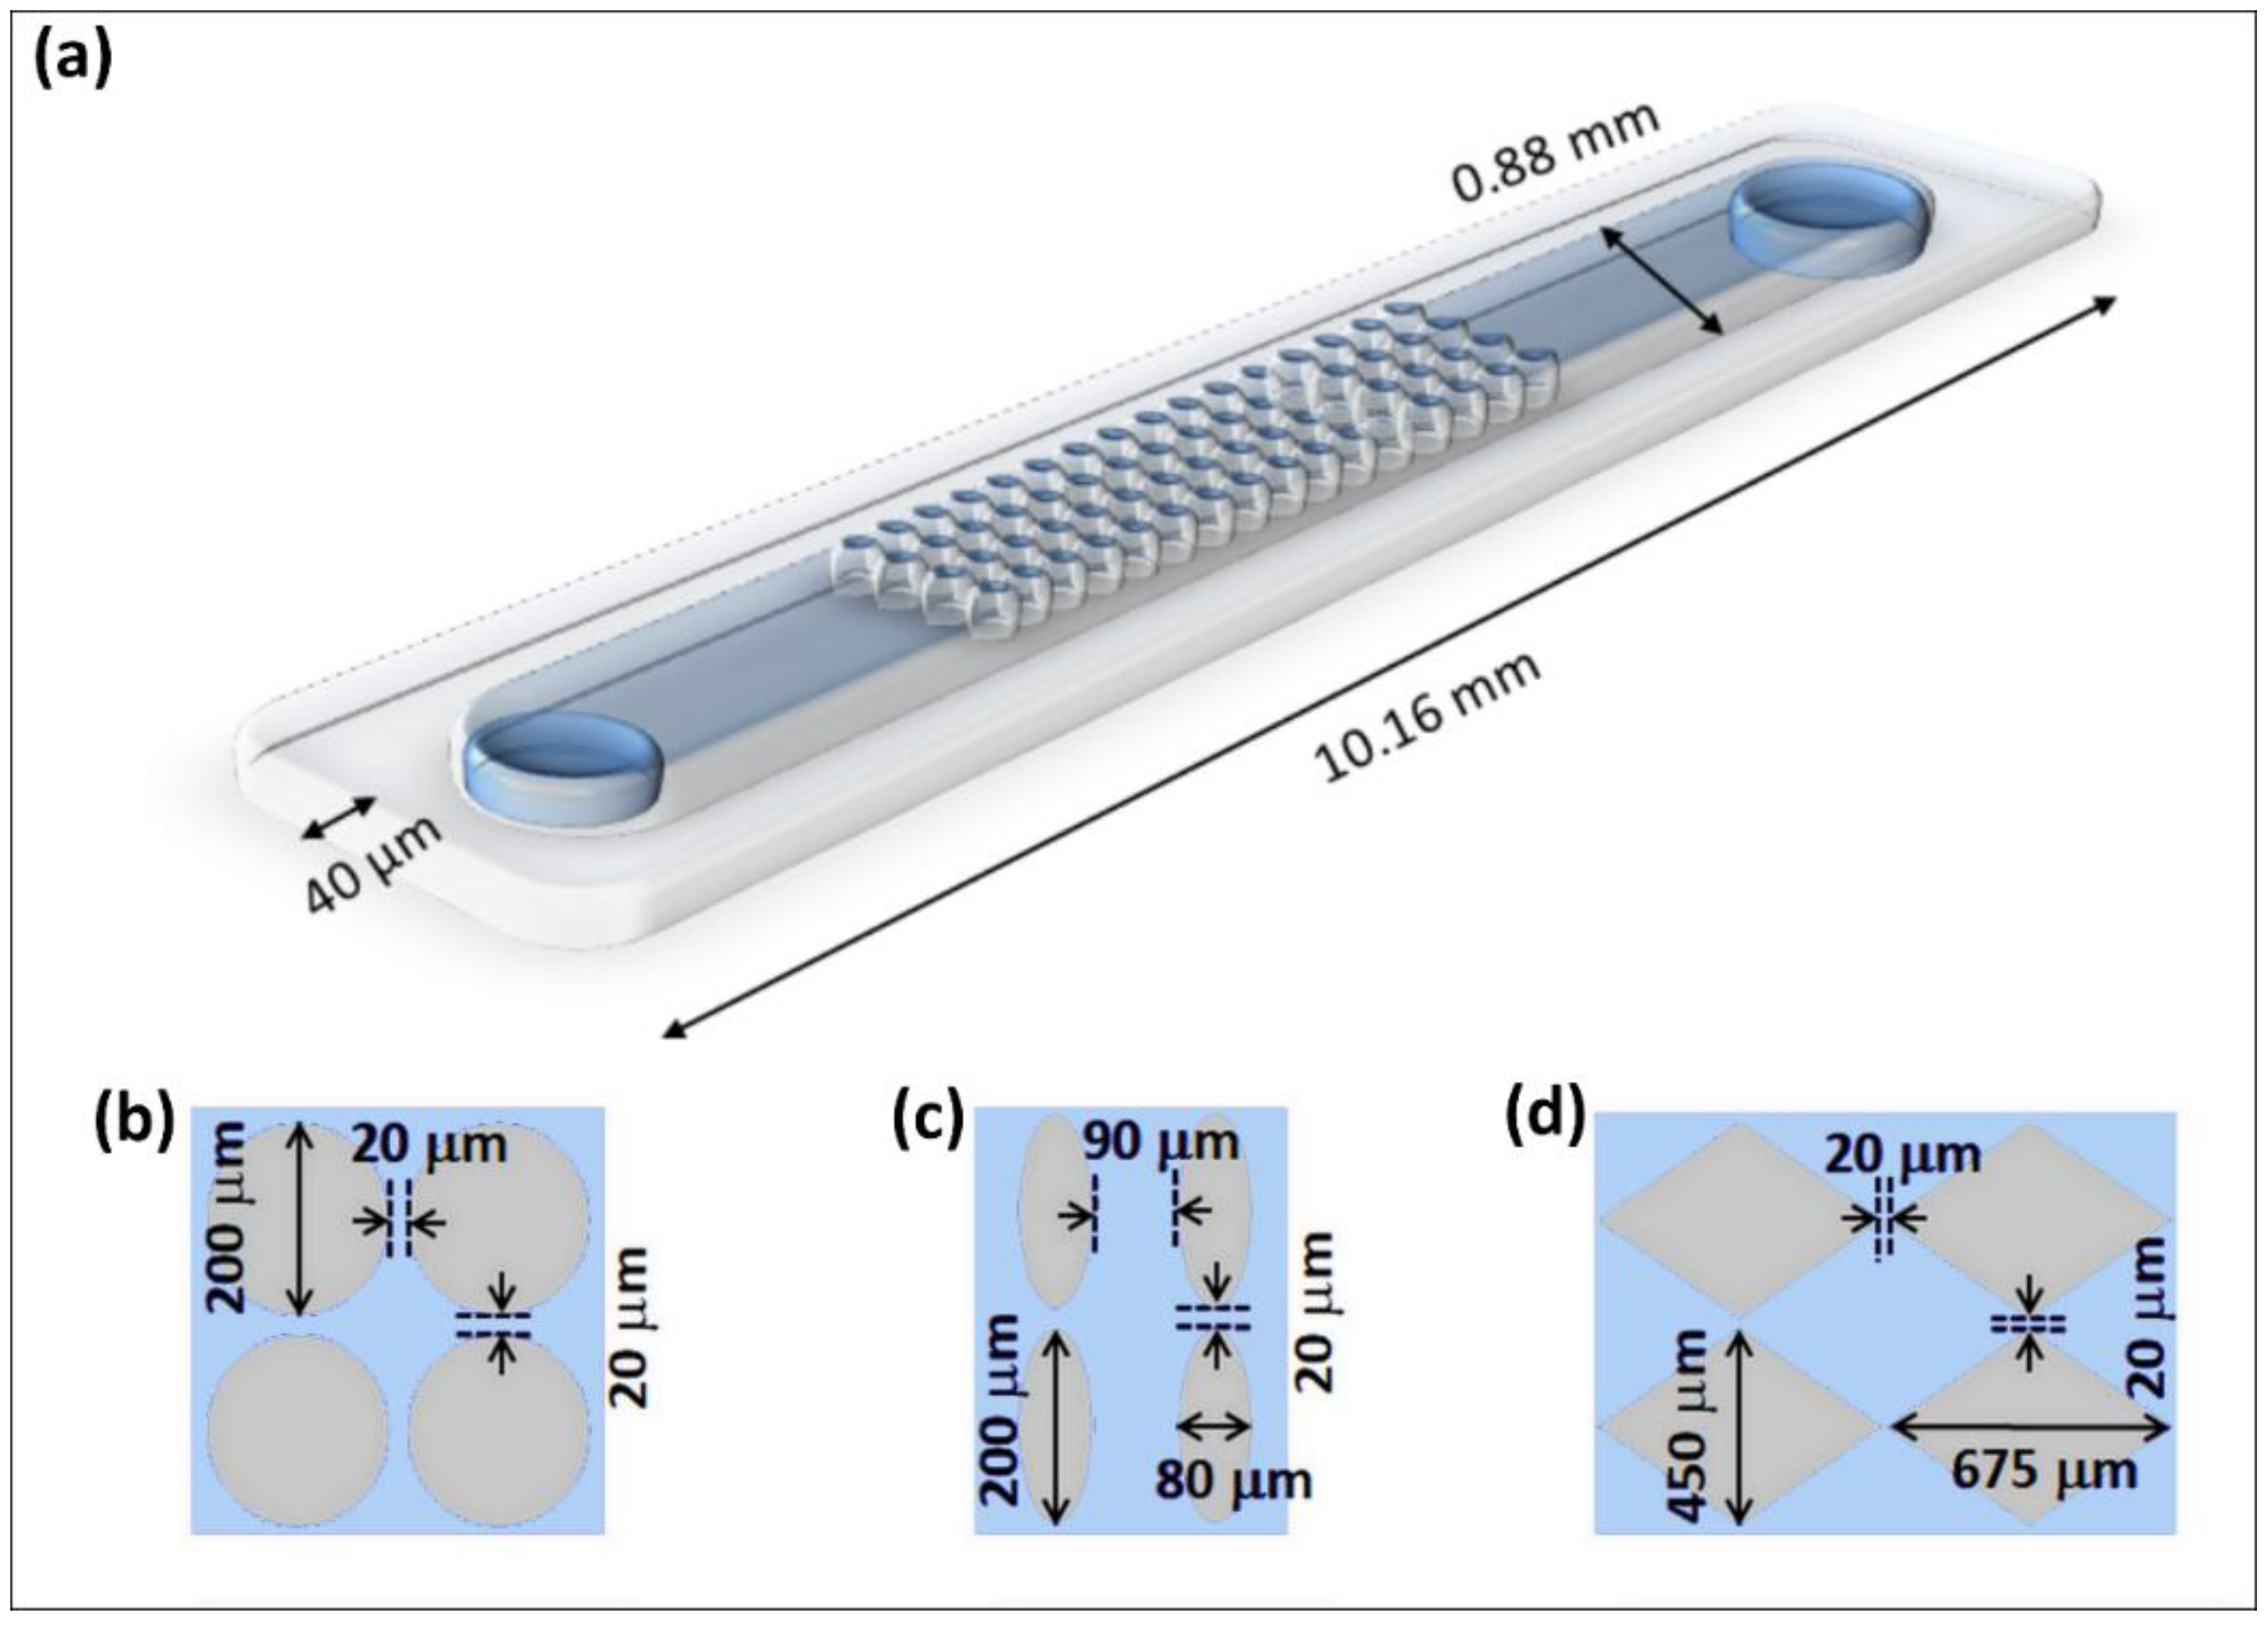
3.1. Microfluidic Devices
3.2. Samples and Suspending Medium
3.3. Equipment and Software
3.4. Experimental Procedure
4. Results and Discussion
4.1. Discussion of Methods for Estimating in iEK Microfluidic Devices
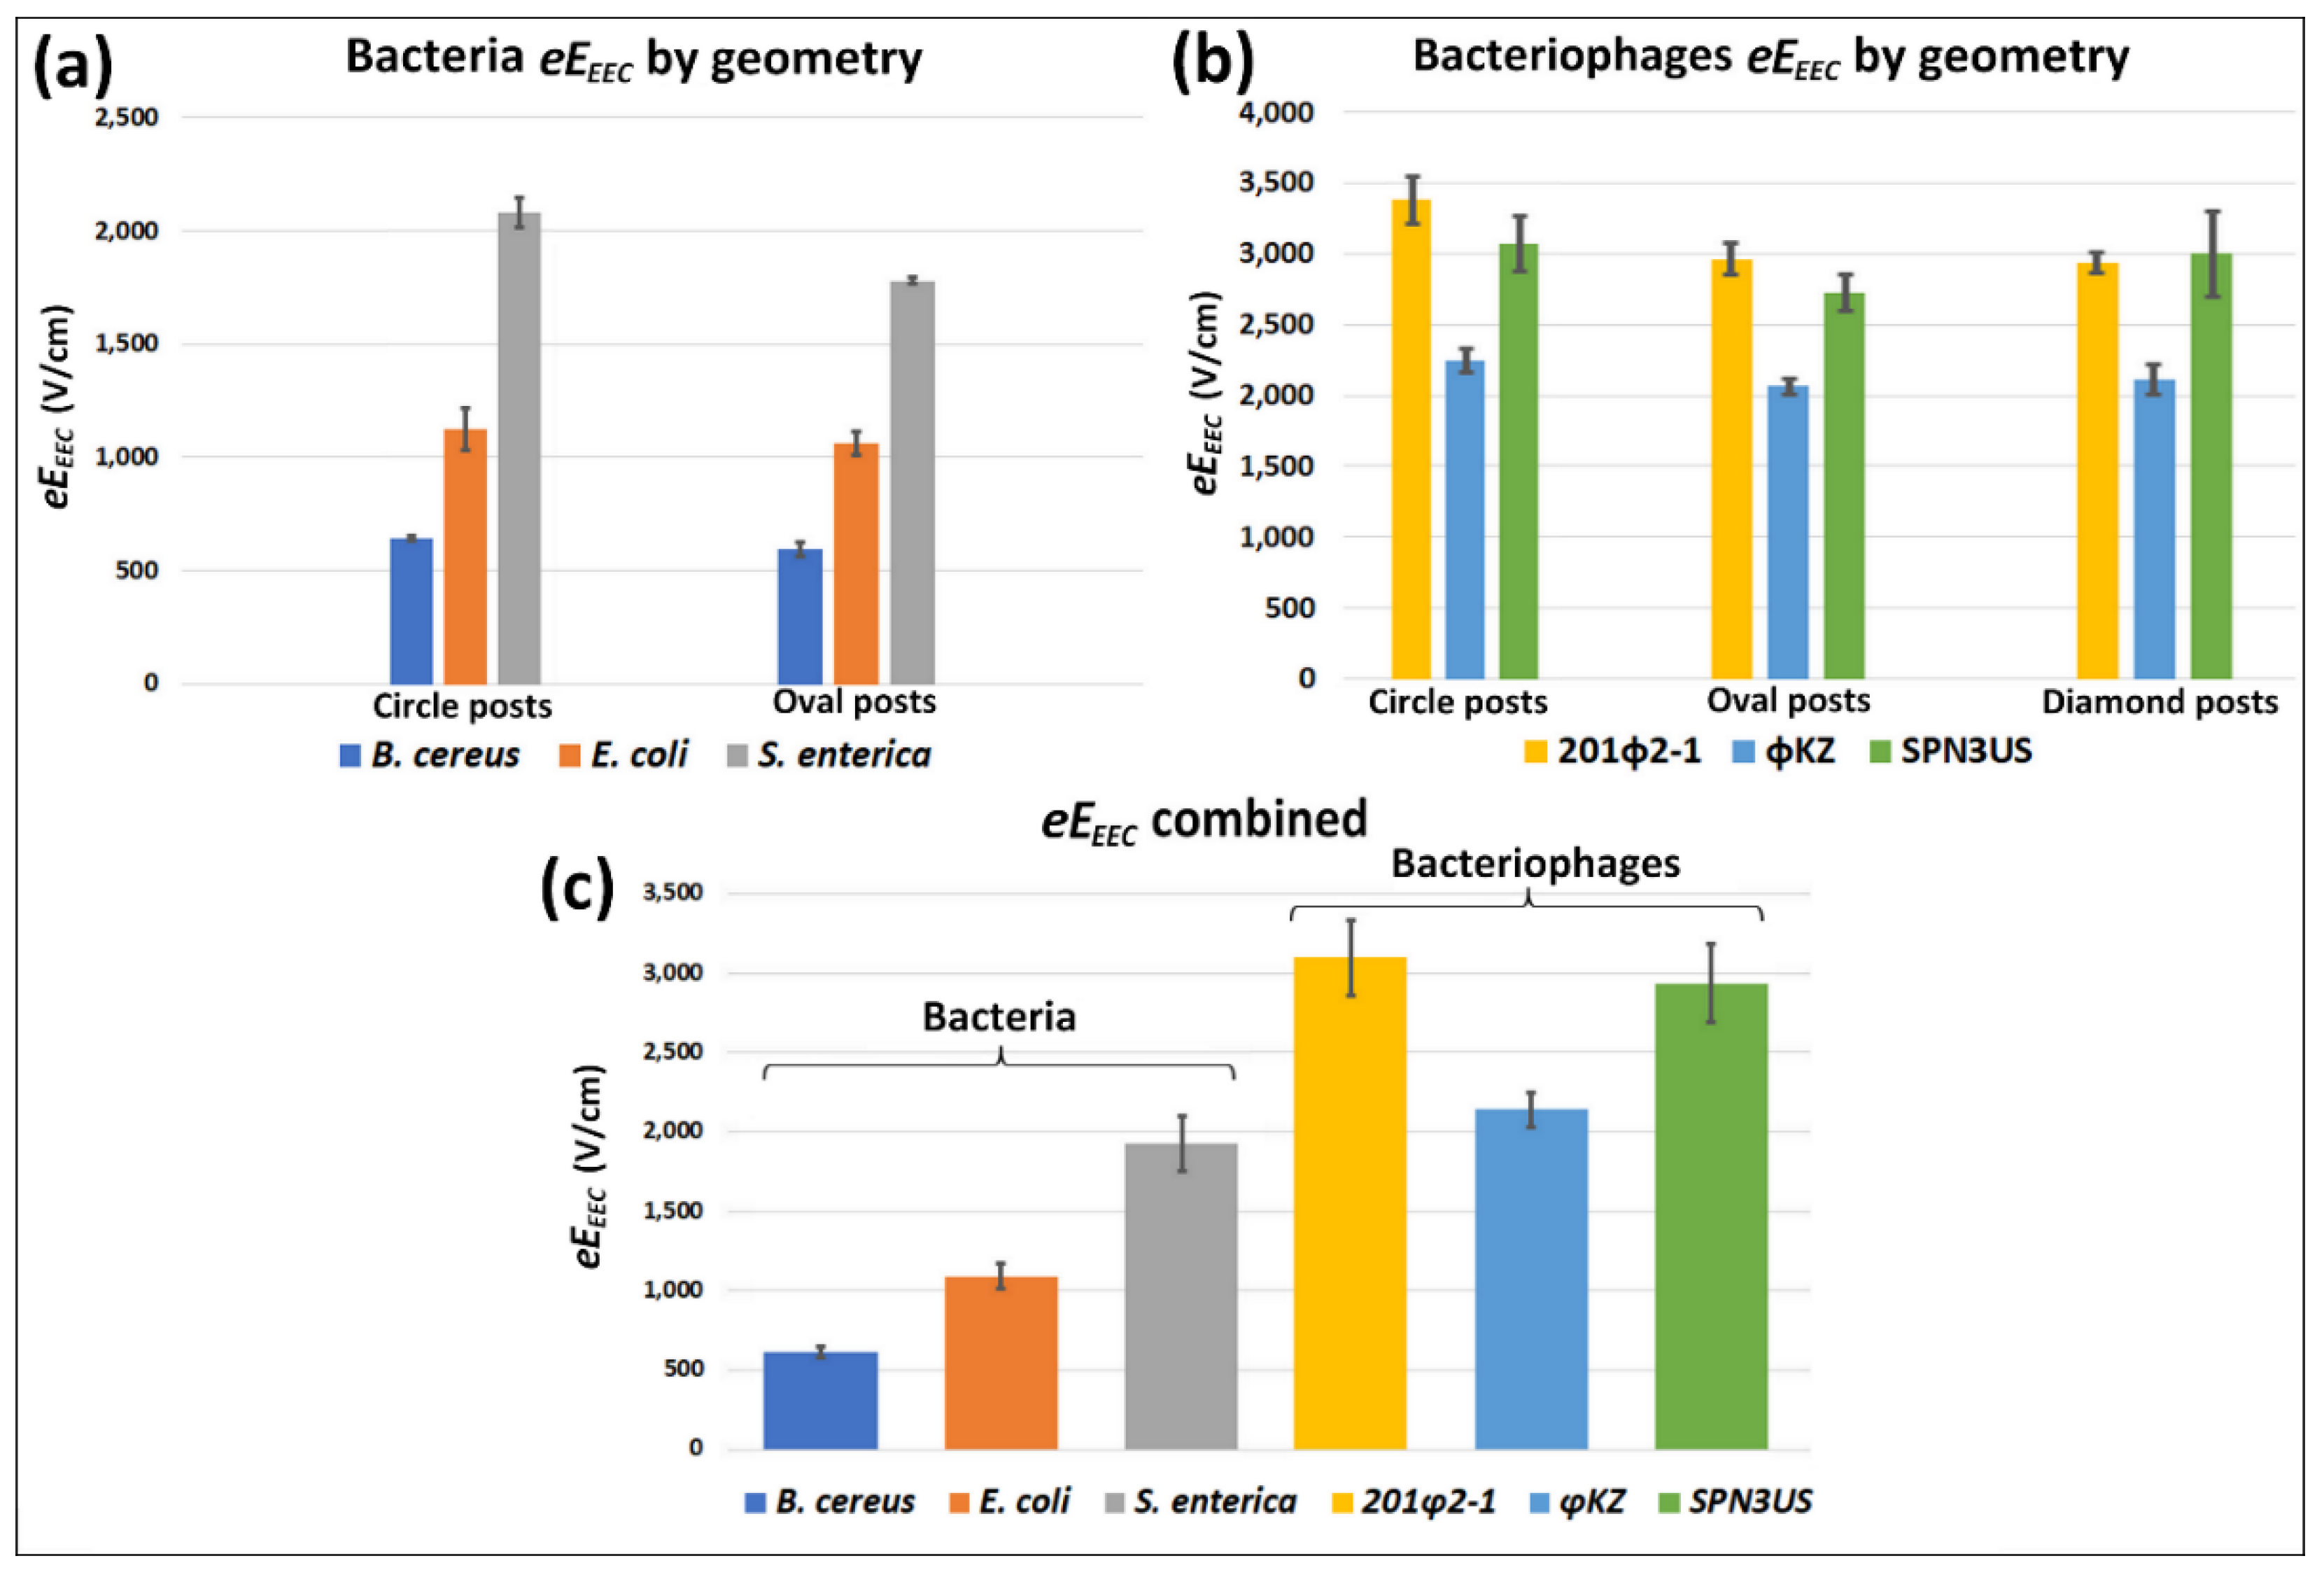
4.2. Estimations of the New Parameter
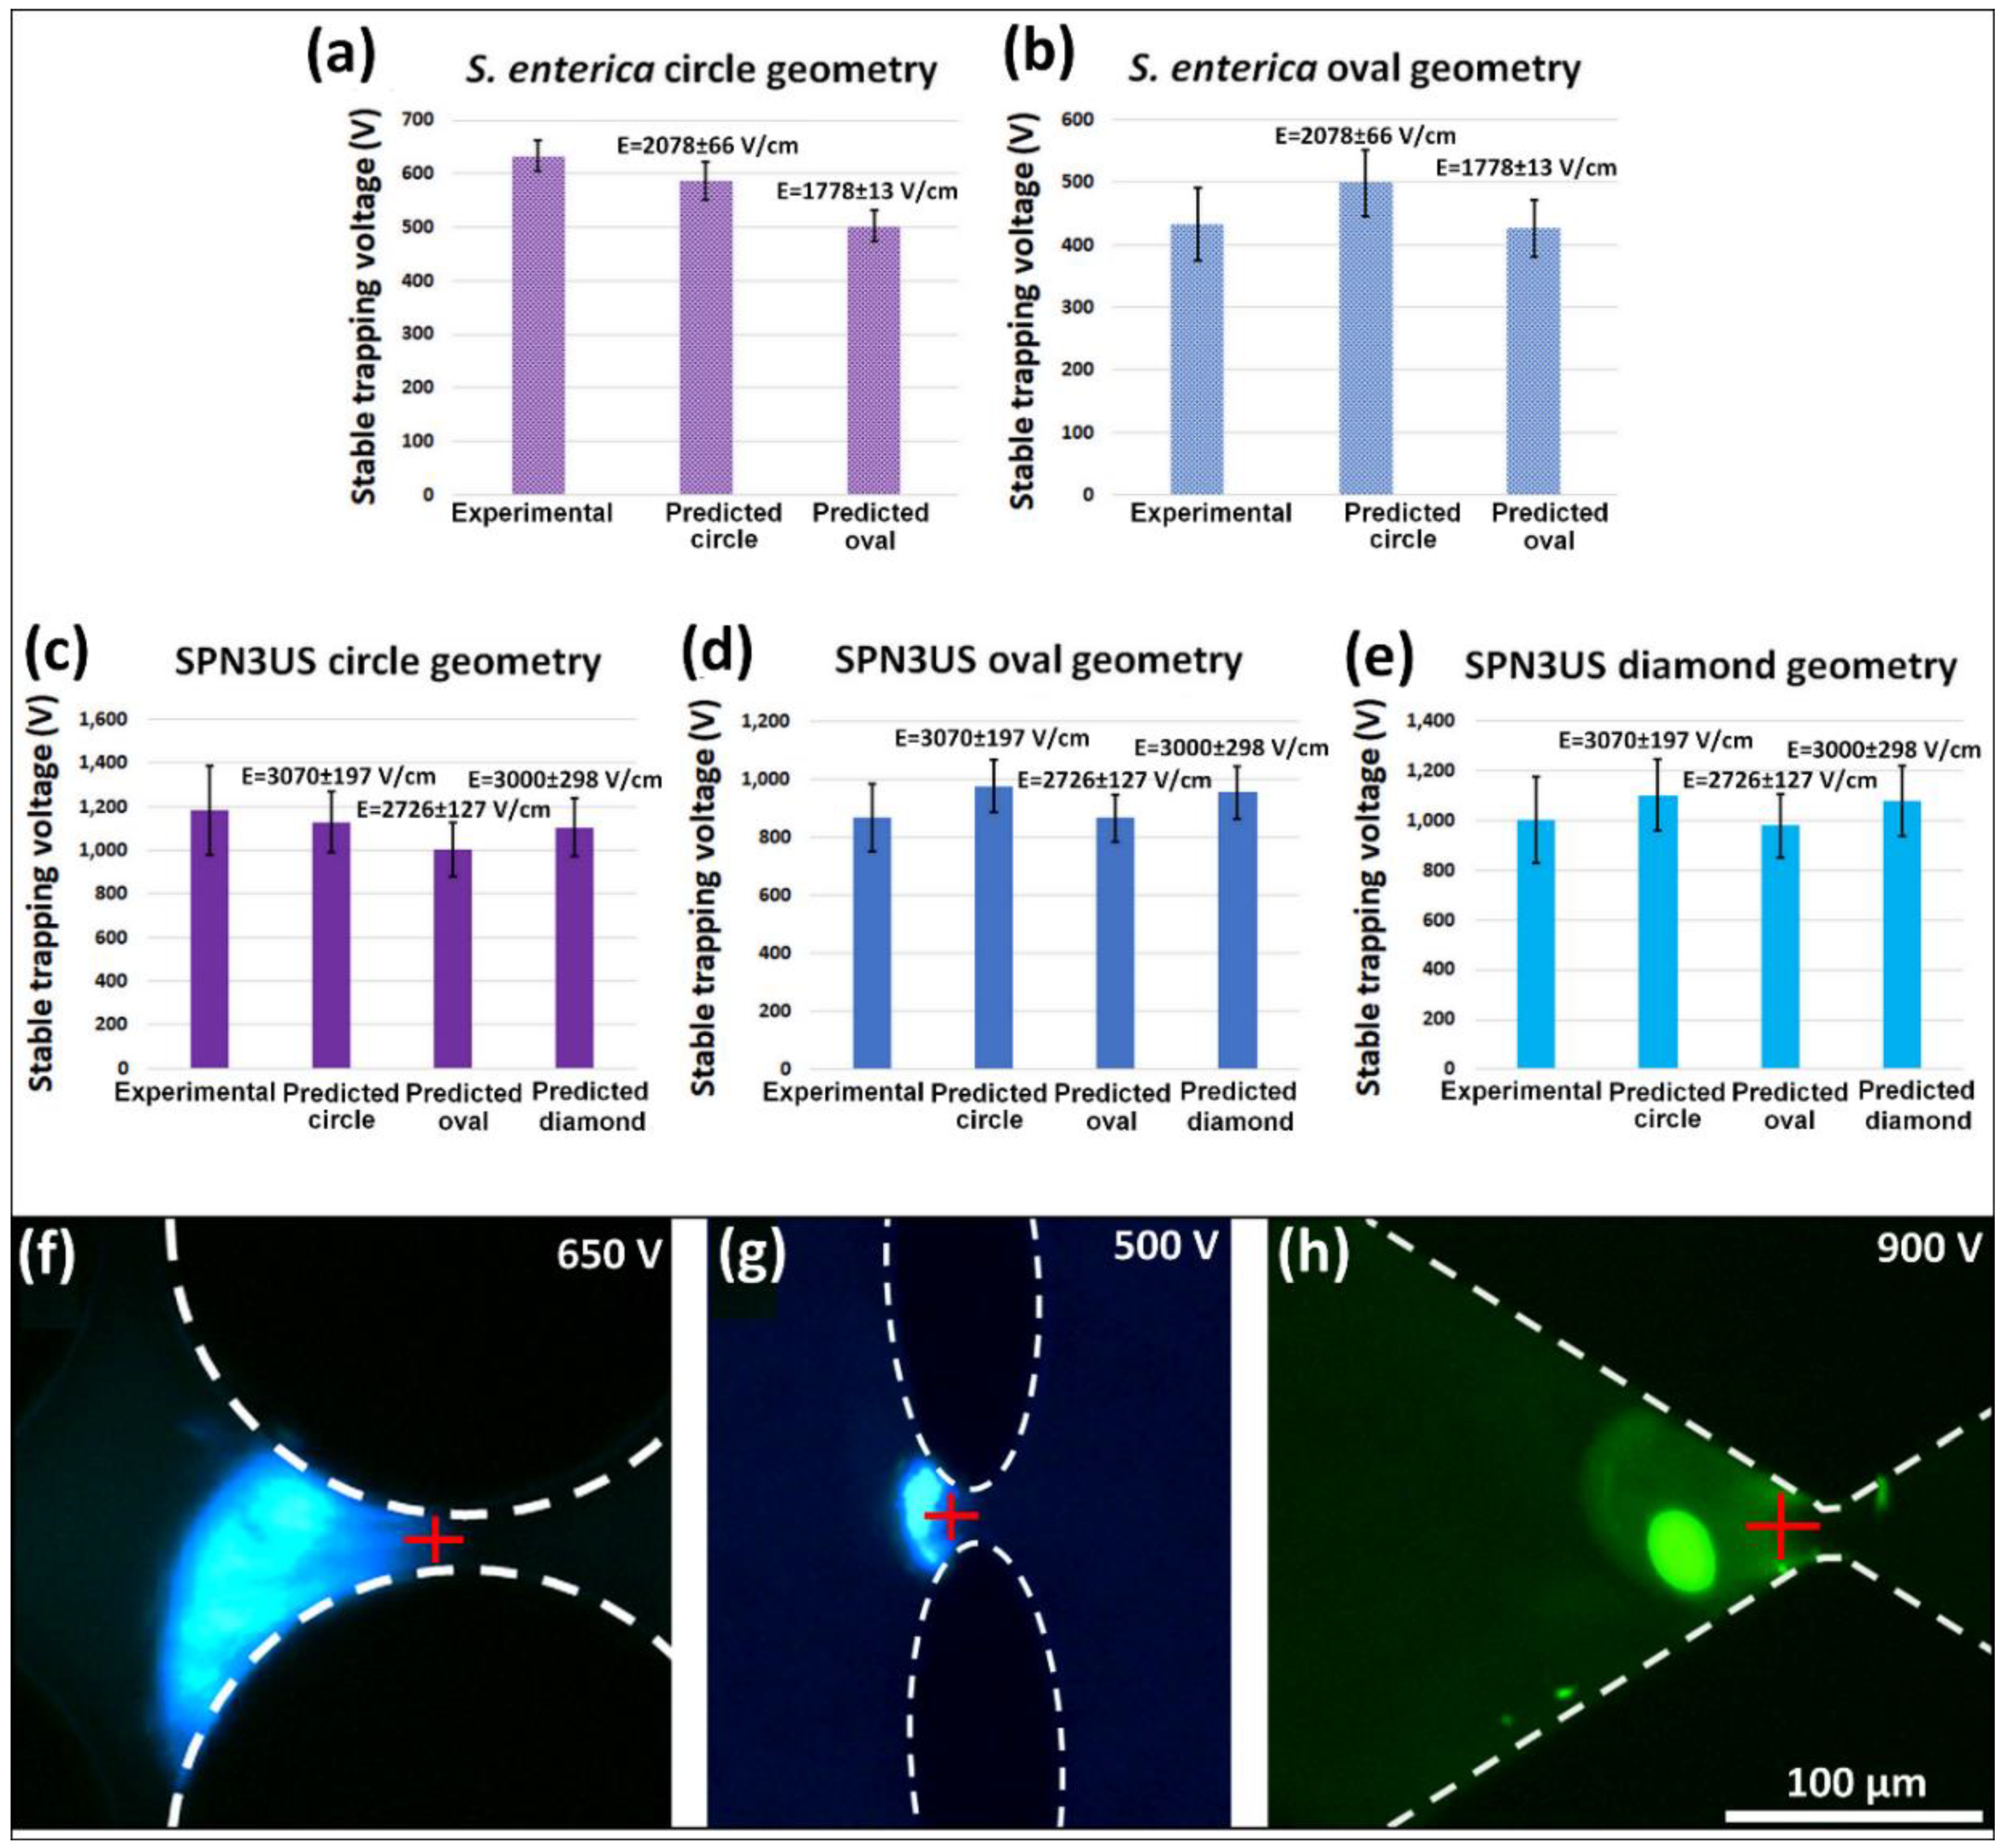
4.3. Application of the New Parameter to Estimate Stable Trapping Voltages (sTVs)
5. Conclusions
Author Contributions
Funding
Acknowledgments
Conflicts of Interest
References
- Fernandez, R.E.; Rohani, A.; Farmehini, V.; Swami, N.S. Review: Microbial analysis in dielectrophoretic microfluidic systems. Anal. Chim. Acta 2017, 966, 11–33. [Google Scholar] [CrossRef] [Green Version]
- Pethig, R. Review—Where Is Dielectrophoresis (DEP) Going? J. Electrochem. Soc. 2017, 164, B3049–B3055. [Google Scholar] [CrossRef]
- Siebman, C.; Velev, O.; Slaveykova, V. Alternating Current-Dielectrophoresis Collection and Chaining of Phytoplankton on Chip: Comparison of Individual Species and Artificial Communities. Biosensors 2017, 7, 4. [Google Scholar] [CrossRef] [Green Version]
- Natu, R.; Islam, M.; Keck, D.; Martinez-Duarte, R. Automated “pick and transfer” of targeted cells using dielectrophoresis. Lab Chip 2019, 19, 2512–2525. [Google Scholar] [CrossRef]
- Gimsa, J.; Titipornpun, K.; Stubbe, M.; Gimsa, U. Combined detection of AC-electrokinetic effects: Experiments with three-axial chicken red blood cells. Electrophoresis 2018, 39, 2253–2261. [Google Scholar] [CrossRef]
- Lorenz, M.; Malangré, D.; Du, F.; Baune, M.; Thöming, J.; Pesch, G.R. High-throughput dielectrophoretic filtration of sub-micron and micro particles in macroscopic porous materials. Anal. Bioanal. Chem. 2020, 412, 3903–3914. [Google Scholar] [CrossRef] [Green Version]
- Su, Y.H.; Rohani, A.; Warren, C.A.; Swami, N.S. Tracking Inhibitory Alterations during Interstrain Clostridium difficile Interactions by Monitoring Cell Envelope Capacitance. ACS Infect. Dis. 2016, 2, 544–551. [Google Scholar] [CrossRef]
- Leonard, K.M.; Minerick, A.R. Explorations of ABO-Rh antigen expressions on erythrocyte dielectrophoresis: Changes in cross-over frequency. Electrophoresis 2011, 32, 2512–2522. [Google Scholar] [CrossRef]
- Coll De Peña, A.; Mohd Redzuan, N.H.; Abajorga, M.; Hill, N.; Thomas, J.A.; Lapizco-Encinas, B.H. Analysis of bacteriophages with insulator-based dielectrophoresis. Micromachines 2019, 10, 450. [Google Scholar] [CrossRef] [Green Version]
- Ding, J.; Lawrence, R.M.; Jones, P.V.; Hogue, B.G.; Hayes, M.A. Concentration of Sindbis virus with optimized gradient insulator-based dielectrophoresis. Analyst 2016, 141, 1997–2008. [Google Scholar] [CrossRef]
- Masuda, T.; Maruyama, H.; Honda, A.; Arai, F. Virus enrichment for single virus infection by using 3D insulator based dielectrophoresis. PLoS ONE 2014, 9, e94083. [Google Scholar] [CrossRef] [Green Version]
- Crowther, C.V.; Hilton, S.H.; Kemp, L.K.; Hayes, M.A. Isolation and identification of Listeria monocytogenes utilizing DC insulator-based dielectrophoresis. Anal. Chim. Acta 2019, 1068, 41–51. [Google Scholar] [CrossRef]
- Coll De Peña, A.; Miller, A.; Lentz, C.J.; Hill, N.; Parthasarathy, A.; Hudson, A.O.; Lapizco-Encinas, B.H. Creation of an electrokinetic characterization library for the detection and identification of biological cells. Anal. Bioanal. Chem. 2020, 412, 3935–3945. [Google Scholar] [CrossRef]
- Jones, P.V.; Hayes, M.A. Development of the resolution theory for gradient insulator-based dielectrophoresis. Electrophoresis 2015, 36, 1098–1106. [Google Scholar] [CrossRef] [Green Version]
- Jones, P.V.; DeMichele, A.F.; Kemp, L.K.; Hayes, M.A. Differentiation of Escherichia coli serotypes using DC gradient insulator dielectrophoresis. Anal. Bioanal. Chem. 2014, 406, 183–192. [Google Scholar] [CrossRef] [Green Version]
- Jen, C.-P.; Chen, T.-W. Selective trapping of live and dead mammalian cells using insulator-based dielectrophoresis within open-top microstructures. Biomed. Microdevices 2009, 11, 597–607. [Google Scholar] [CrossRef]
- Shafiee, H.; Sano, M.B.; Henslee, E.A.; Caldwell, J.L.; Davalos, R.V. Selective isolation of live/dead cells using contactless dielectrophoresis (cDEP). Lab Chip 2010, 10, 438–445. [Google Scholar] [CrossRef]
- Lapizco-Encinas, B.H.; Simmons, B.A.; Cummings, E.B.; Fintschenko, Y. Dielectrophoretic Concentration and Separation of Live and Dead Bacteria in an Array of Insulators. Anal. Chem. 2004, 76, 1571–1579. [Google Scholar] [CrossRef]
- Jones, P.V.; Huey, S.; Davis, P.; Yanashima, R.; McLemore, R.; McLaren, A.; Hayes, M.A. Biophysical separation of Staphylococcus epidermidis strains based on antibiotic resistance. Analyst 2015, 140, 5152–5161. [Google Scholar] [CrossRef] [Green Version]
- Su, Y.-H.H.; Tsegaye, M.; Varhue, W.; Liao, K.-T.T.; Abebe, L.S.; Smith, J.A.; Guerrant, R.L.; Swami, N.S. Quantitative dielectrophoretic tracking for characterization and separation of persistent subpopulations of Cryptosporidium parvum. Analyst 2014, 139, 66–73. [Google Scholar] [CrossRef]
- Thomas, J.A.; Benítez Quintana, A.D.; Bosch, M.A.; Coll De Peña, A.; Aguilera, E.; Coulibaly, A.; Wu, W.; Osier, M.V.; Hudson, A.O.; Weintraub, S.T.; et al. Identification of Essential Genes in the Salmonella Phage SPN3US Reveals Novel Insights into Giant Phage Head Structure and Assembly. J. Virol. 2016, 90, 10284–10298. [Google Scholar] [CrossRef] [Green Version]
- Baratchi, S.; Zaldivia, M.T.K.; Wallert, M.; Loseff-Silver, J.; Al-Aryahi, S.; Zamani, J.; Thurgood, P.; Salim, A.; Htun, N.M.; Stub, D.; et al. Transcatheter Aortic Valve Implantation Represents an Anti-Inflammatory Therapy via Reduction of Shear Stress-Induced, Piezo-1-Mediated Monocyte Activation. Circulation 2020, 142, 1092–1105. [Google Scholar] [CrossRef]
- Jones, P.V.; Salmon, G.L.; Ros, A. Continuous Separation of DNA Molecules by Size Using Insulator-Based Dielectrophoresis. Anal. Chem. 2017, 89, 1531–1539. [Google Scholar] [CrossRef]
- Gan, L.; Chao, T.-C.C.; Camacho-Alanis, F.; Ros, A. Six-Helix Bundle and Triangle DNA Origami Insulator-Based Dielectrophoresis. Anal. Chem. 2013, 85, 11427–11434. [Google Scholar] [CrossRef]
- Gallo-Villanueva, R.C.; Rodríguez-López, C.E.; Díaz-de-la-Garza, R.I.; Reyes-Betanzo, C.; Lapizco-Encinas, B.H. DNA manipulation by means of insulator-based dielectrophoresis employing direct current electric fields. Electrophoresis 2009, 30, 4195–4205. [Google Scholar] [CrossRef]
- Nakano, A.; Chao, T.-C.C.; Camacho-Alanis, F.; Ros, A. Immunoglobulin G and bovine serum albumin streaming dielectrophoresis in a microfluidic device. Electrophoresis 2011, 32, 2314–2322. [Google Scholar] [CrossRef]
- Lapizco-Encinas, B.H.; Ozuna-Chacón, S.; Rito-Palomares, M. Protein manipulation with insulator-based dielectrophoresis and direct current electric fields. J. Chromatogr. A 2008, 1206, 45–51. [Google Scholar] [CrossRef]
- Lapizco-Encinas, B.H. Microscale electrokinetic assessments of proteins employing insulating structures. Curr. Opin. Chem. Eng. 2020, 29, 9–16. [Google Scholar] [CrossRef]
- Moncada-Hernandez, H.; Baylon-Cardiel, J.L.; Pérez-González, V.H.; Lapizco-Encinas, B.H. Insulator-based dielectrophoresis of microorganisms: Theoretical and experimental results. Electrophoresis 2011, 32, 2502–2511. [Google Scholar] [CrossRef]
- Lu, S.-Y.; Malekanfard, A.; Beladi-Behbahani, S.; Zu, W.; Kale, A.; Tzeng, T.-R.; Wang, Y.-N.; Xuan, X. Passive Dielectrophoretic Focusing of Particles and Cells in Ratchet Microchannels. Micromachines 2020, 11, 451. [Google Scholar] [CrossRef]
- LaLonde, A.; Romero-Creel, M.F.; Saucedo-Espinosa, M.A.; Lapizco-Encinas, B.H. Isolation and enrichment of low abundant particles with insulator-based dielectrophoresis. Biomicrofluidics 2015, 9, 064113. [Google Scholar] [CrossRef] [PubMed] [Green Version]
- Aghilinejad, A.; Aghaamoo, M.; Chen, X.; Xu, J. Effects of electrothermal vortices on insulator-based dielectrophoresis for circulating tumor cell separation. Electrophoresis 2018, 39, 869–877. [Google Scholar] [CrossRef] [PubMed]
- Adekanmbi, E.O.; Giduthuri, A.T.; Srivastava, S.K. Dielectric Characterization and Separation Optimization of Infiltrating Ductal Adenocarcinoma via Insulator-Dielectrophoresis. Micromachines 2020, 11, 340. [Google Scholar] [CrossRef] [Green Version]
- Ding, J.; Woolley, C.; Hayes, M.A. Biofluid pretreatment using gradient insulator-based dielectrophoresis: Separating cells from biomarkers. Anal. Bioanal. Chem. 2017, 409, 6405–6414. [Google Scholar] [CrossRef] [PubMed]
- Bhattacharya, S.; Chao, T.-C.C.; Ariyasinghe, N.; Ruiz, Y.; Lake, D.; Ros, R.; Ros, A. Selective trapping of single mammalian breast cancer cells by insulator-based dielectrophoresis. Anal. Bioanal. Chem. 2014, 406, 1855–1865. [Google Scholar] [CrossRef]
- Schnitzer, O.; Yariv, E. Nonlinear electrophoresis at arbitrary field strengths: Small-Dukhin-number analysis. Phys. Fluids 2014, 26, 122002. [Google Scholar] [CrossRef] [Green Version]
- Schnitzer, O.; Zeyde, R.; Yavneh, I.; Yariv, E. Weakly nonlinear electrophoresis of a highly charged colloidal particle. Phys. Fluids 2013, 25, 052004. [Google Scholar] [CrossRef]
- Shilov, V.; Barany, S.; Grosse, C.; Shramko, O. Field-induced disturbance of the double layer electro-neutrality and non-linear electrophoresis. Adv. Colloid Interface Sci. 2003, 104, 159–173. [Google Scholar] [CrossRef]
- Dukhin, S.S. Electrokinetic phenomena of the second kind and their applications. Adv. Colloid Interface Sci. 1991, 35, 173–196. [Google Scholar] [CrossRef]
- Cardenas-Benitez, B.; Jind, B.; Gallo-Villanueva, R.C.; Martinez-Chapa, S.O.; Lapizco-Encinas, B.H.; Perez-Gonzalez, V.H. Direct Current Electrokinetic Particle Trapping in Insulator-Based Microfluidics: Theory and Experiments. Anal. Chem. 2020, 92, 12871–12879. [Google Scholar] [CrossRef]
- Saucedo-Espinosa, M.A.; Lapizco-Encinas, B.H. Experimental and theoretical study of dielectrophoretic particle trapping in arrays of insulating structures: Effect of particle size and shape. Electrophoresis 2015, 36, 1086–1097. [Google Scholar] [CrossRef] [PubMed]
- Hill, N.; Lapizco-Encinas, B.H. On the use of correction factors for the mathematical modeling of insulator based dielectrophoretic devices. Electrophoresis 2019, 40, 2541–2552. [Google Scholar] [CrossRef]
- Electrokinetic Library, Microscale Bioseparations Laboratory. Available online: http://microbioseplab.org/Electrokinetic_Library.html (accessed on 10 October 2020).
- Saucedo-Espinosa, M.A.; Lapizco-Encinas, B.H. Exploiting Particle Mutual Interactions To Enable Challenging Dielectrophoretic Processes. Anal. Chem. 2017, 89, 8459–8467. [Google Scholar] [CrossRef]
- LaLonde, A.; Gencoglu, A.; Romero-Creel, M.F.; Koppula, K.S.; Lapizco-Encinas, B.H. Effect of insulating posts geometry on particle manipulation in insulator based dielectrophoretic devices. J. Chromatogr. A 2014, 1344, 99–108. [Google Scholar] [CrossRef]
- Hill, N.; Lapizco-Encinas, B.H. Continuous flow separation of particles with insulator-based dielectrophoresis chromatography. Anal. Bioanal. Chem. 2020, 412, 3891–3902. [Google Scholar] [CrossRef]


| Microorganism Type | Species | Size (µm) | SD (%) | |
|---|---|---|---|---|
| Bacteria | Bacillus cereus (ATCC® 14579™) | Length: 4.94 ± 0.47 Width: 1.32 ± 0.13 | 618 ± 32 | 5.2 |
| Escherichia coli (ATCC® 25922) | Length: 2.01 ± 0.42 Width: 0.97 ± 0.21 | 1092 ± 76 | 6.9 | |
| Salmonella enterica (TT9079) | Length: 2.00 ± 0.31 Width: 0.97 ± 0.11 | 1928 ± 170 | 8.8 | |
| Bacteriophages | 201Φ2-1 | Head dia.: 0.200 Tail: 0.020 × 0.211 | 3094 ± 238 | 7.7 |
| ΦKZ | Head dia.: 0.145 Tail: 0.022 × 0.200 | 2140 ± 107 | 5.0 | |
| SPN3US | Head dia.: 0.060 Tail: 0.018 × 0.035 | 2932 ± 246 | 8.4 |
| Species | iEK Microfluidic Channel | Predicted sTV (V) |
|---|---|---|
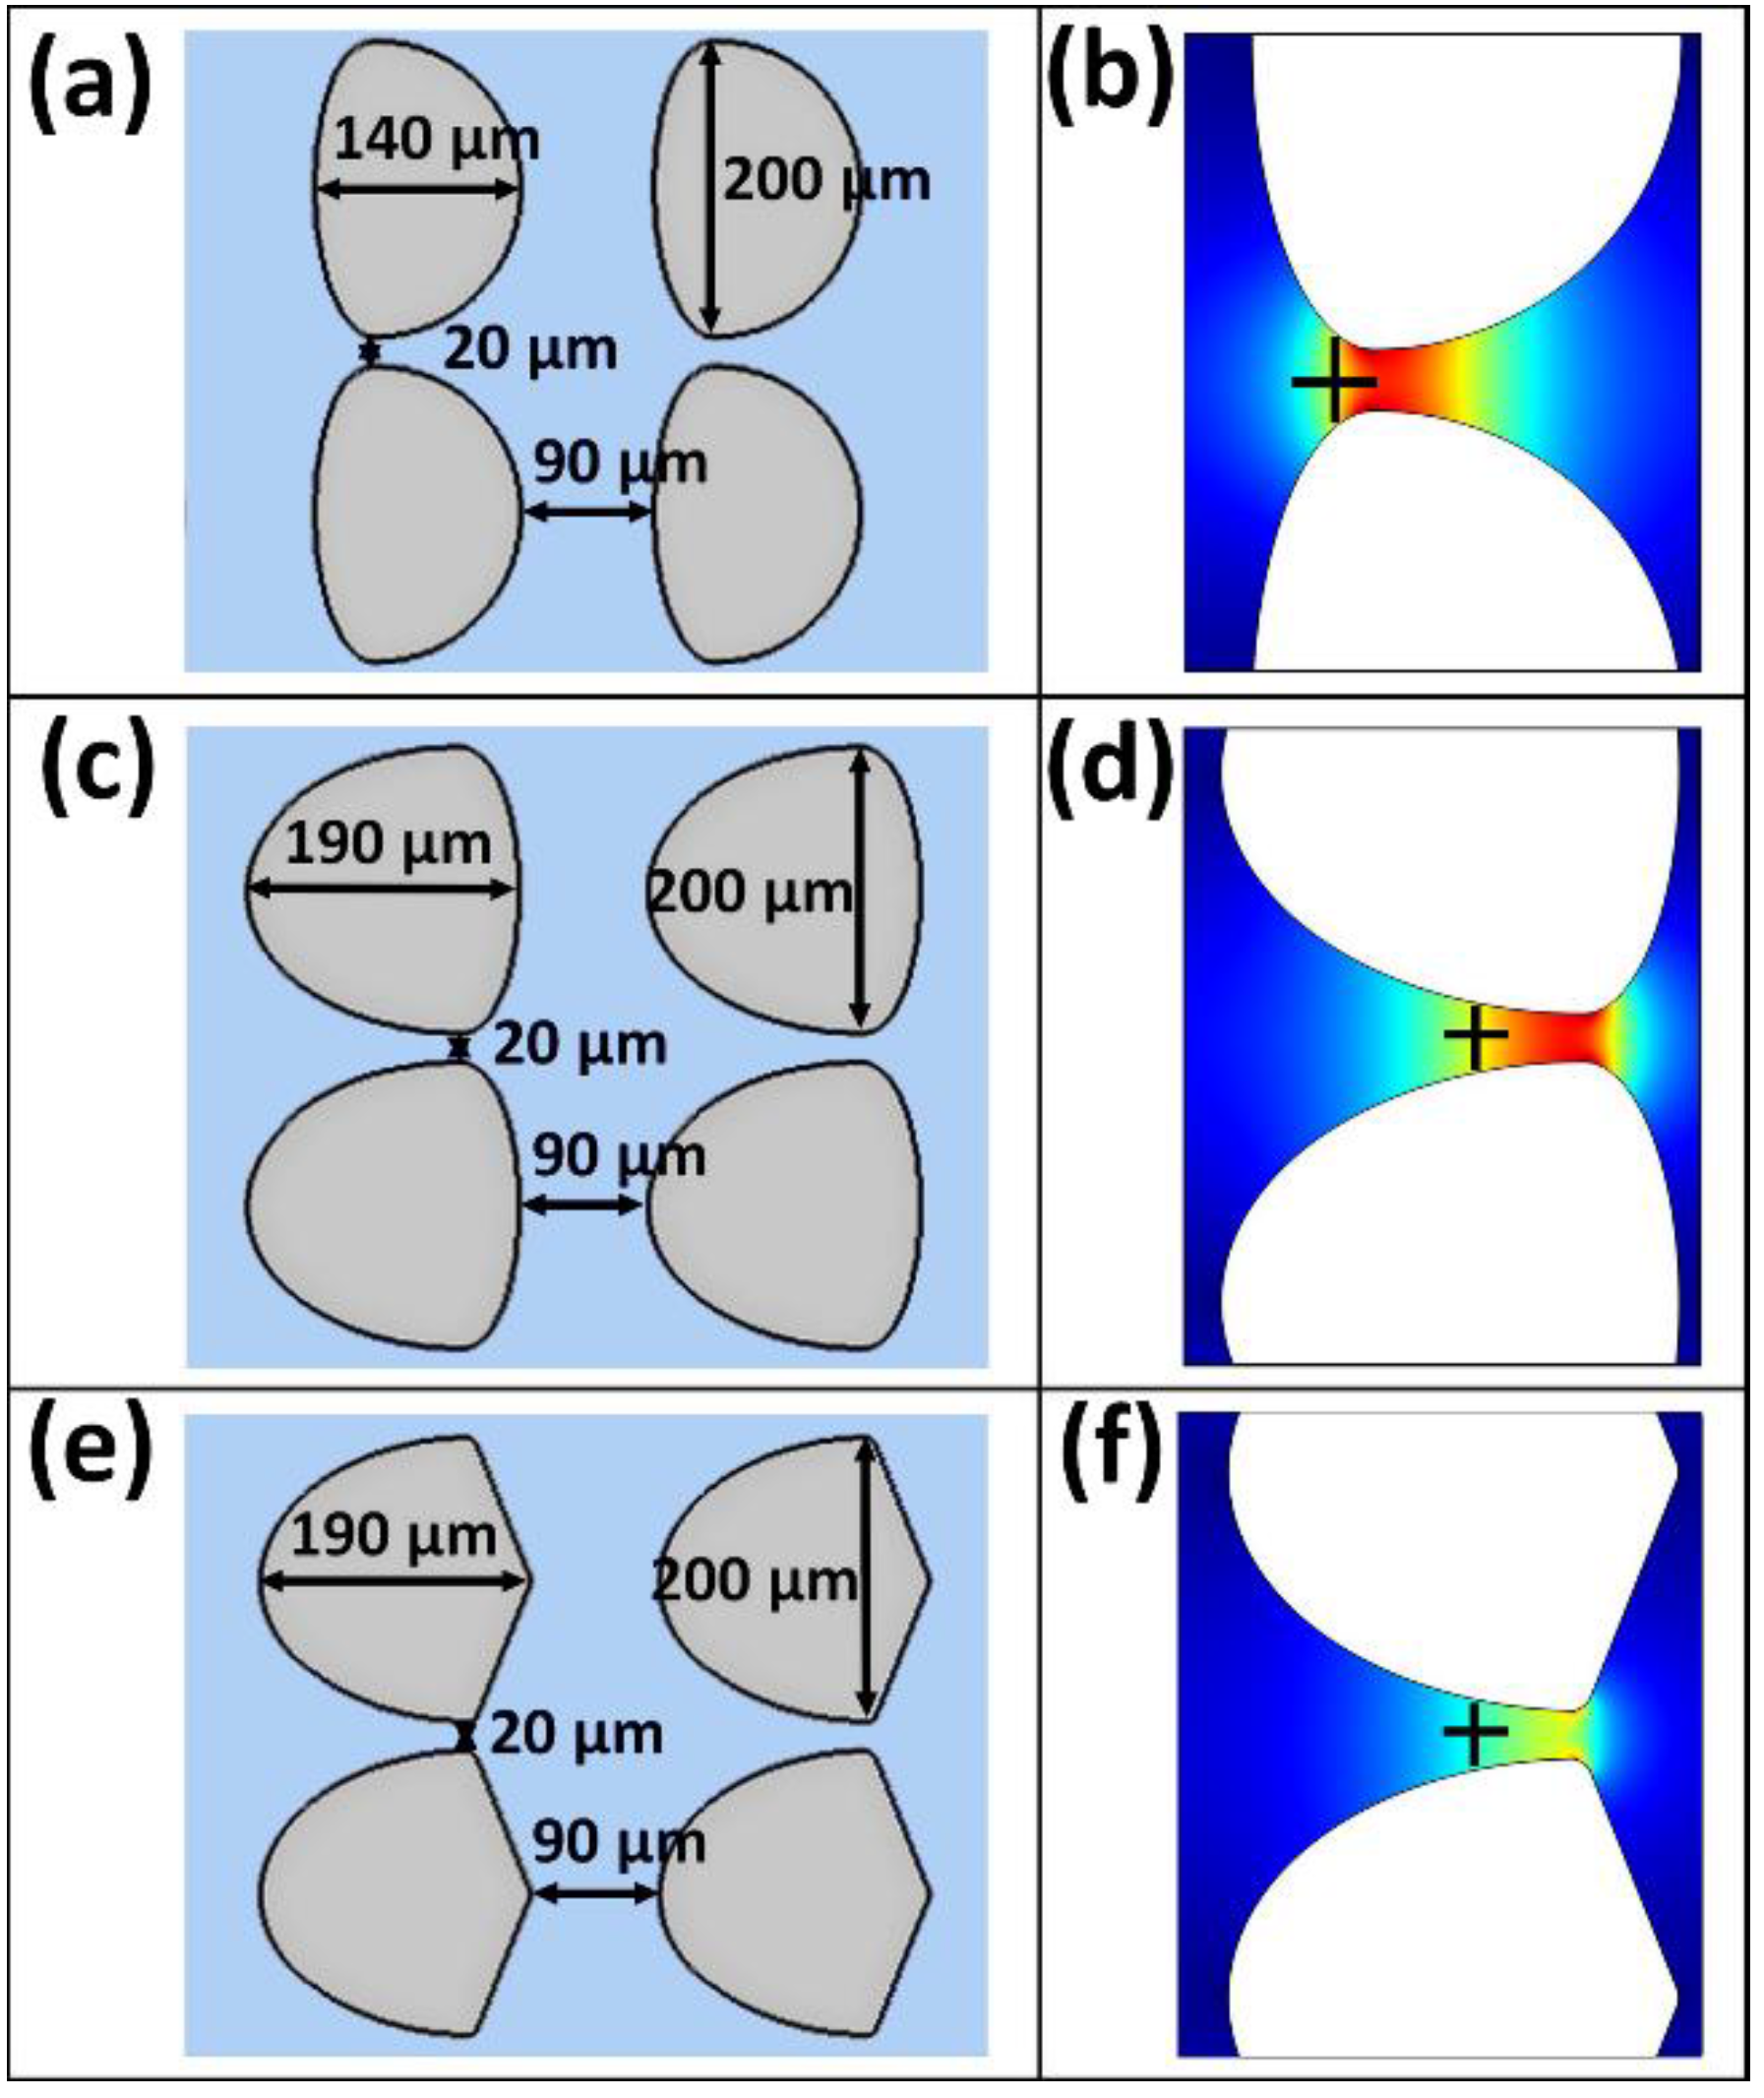
| S. enterica | Oval–narrow–oval (Figure 5a,b) | 519 |
| Oval–wide–oval (Figure 5c,d) | 542 | |
| Oval–wide–diamond (Figure 5e,f) | 535 | |
| SPN3US | Oval–narrow–oval (Figure 5a,b) | 780 |
| Oval–wide–oval (Figure 5c,d) | 815 | |
| Oval–wide–diamond (Figure 5e,f) | 805 |
Publisher’s Note: MDPI stays neutral with regard to jurisdictional claims in published maps and institutional affiliations. |
© 2020 by the authors. Licensee MDPI, Basel, Switzerland. This article is an open access article distributed under the terms and conditions of the Creative Commons Attribution (CC BY) license (http://creativecommons.org/licenses/by/4.0/).
Share and Cite
Coll De Peña, A.; Hill, N.; Lapizco-Encinas, B.H. Determination of the Empirical Electrokinetic Equilibrium Condition of Microorganisms in Microfluidic Devices. Biosensors 2020, 10, 148. https://0-doi-org.brum.beds.ac.uk/10.3390/bios10100148
Coll De Peña A, Hill N, Lapizco-Encinas BH. Determination of the Empirical Electrokinetic Equilibrium Condition of Microorganisms in Microfluidic Devices. Biosensors. 2020; 10(10):148. https://0-doi-org.brum.beds.ac.uk/10.3390/bios10100148
Chicago/Turabian StyleColl De Peña, Adriana, Nicole Hill, and Blanca H. Lapizco-Encinas. 2020. "Determination of the Empirical Electrokinetic Equilibrium Condition of Microorganisms in Microfluidic Devices" Biosensors 10, no. 10: 148. https://0-doi-org.brum.beds.ac.uk/10.3390/bios10100148