Enhanced Plasmonic Biosensor Utilizing Paired Antibody and Label-Free Fe3O4 Nanoparticles for Highly Sensitive and Selective Detection of Parkinson’s α-Synuclein in Serum

 , , , , , and
Abstract
:1. Introduction
2. Experimental
2.1. Materials
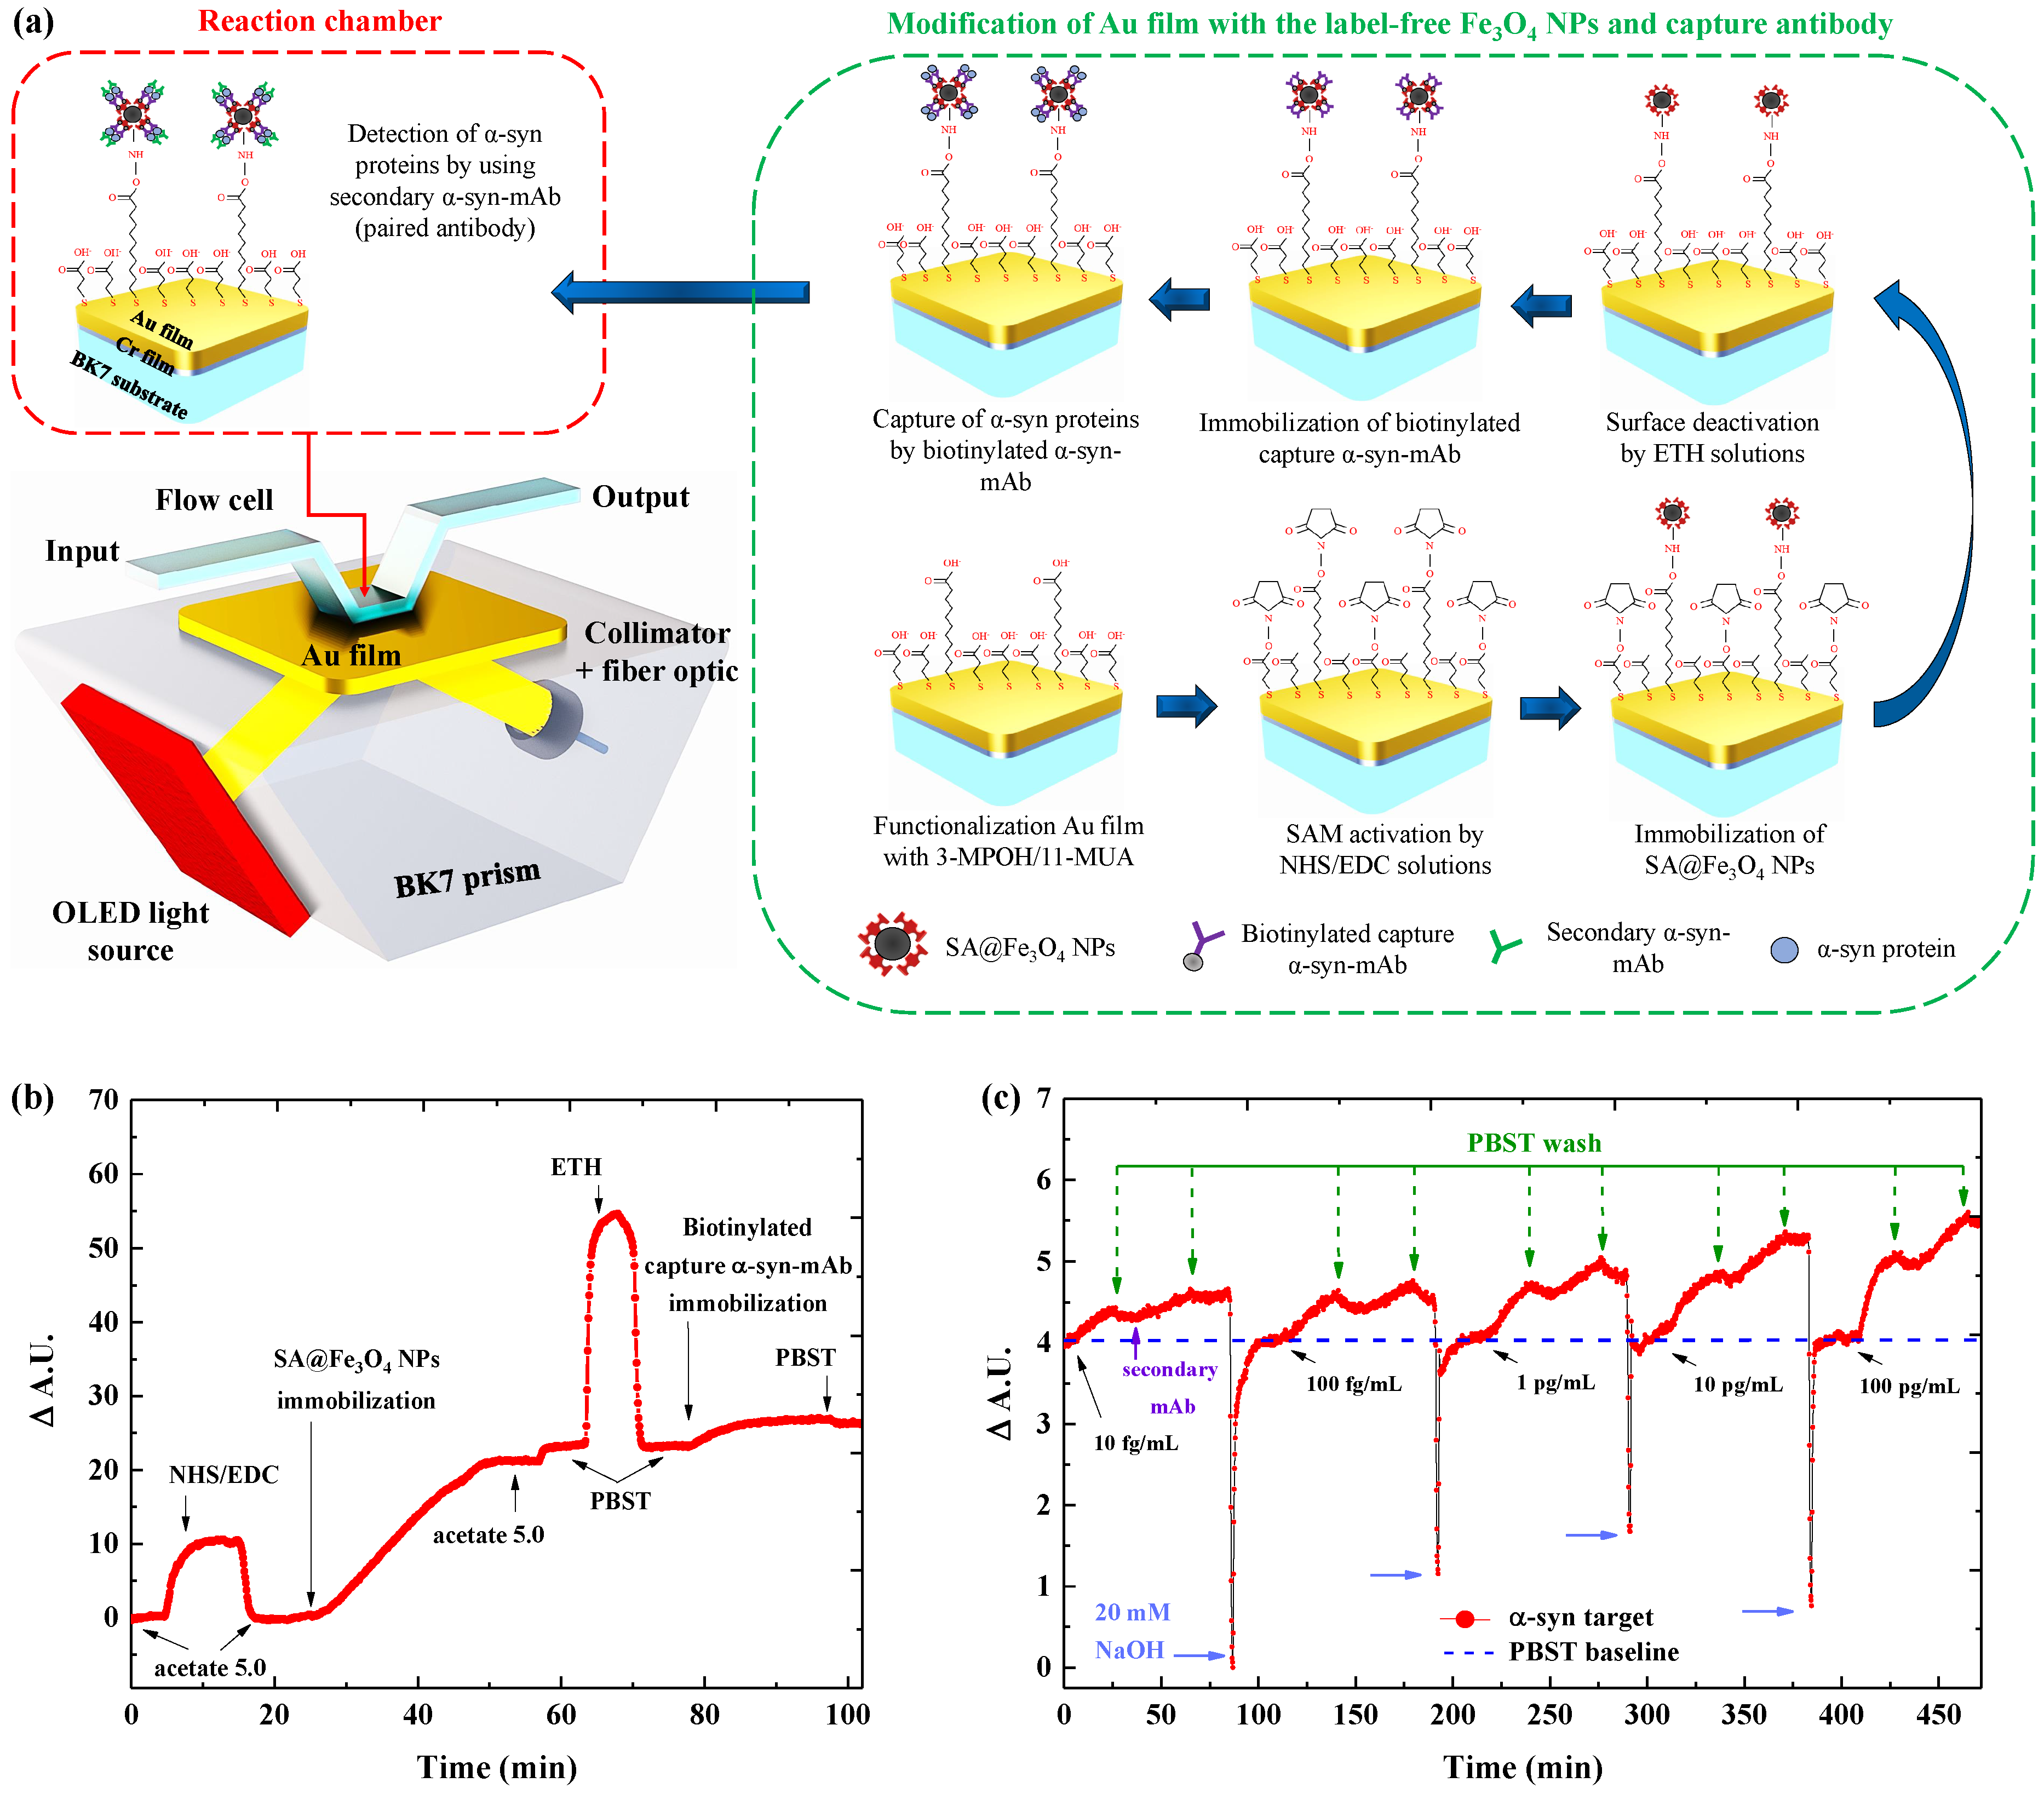
2.2. Apparatus
2.3. Functionalization of Sensor Chips
2.4. Detection Protocol of Immunoassays
2.5. Specificity Test
3. Results
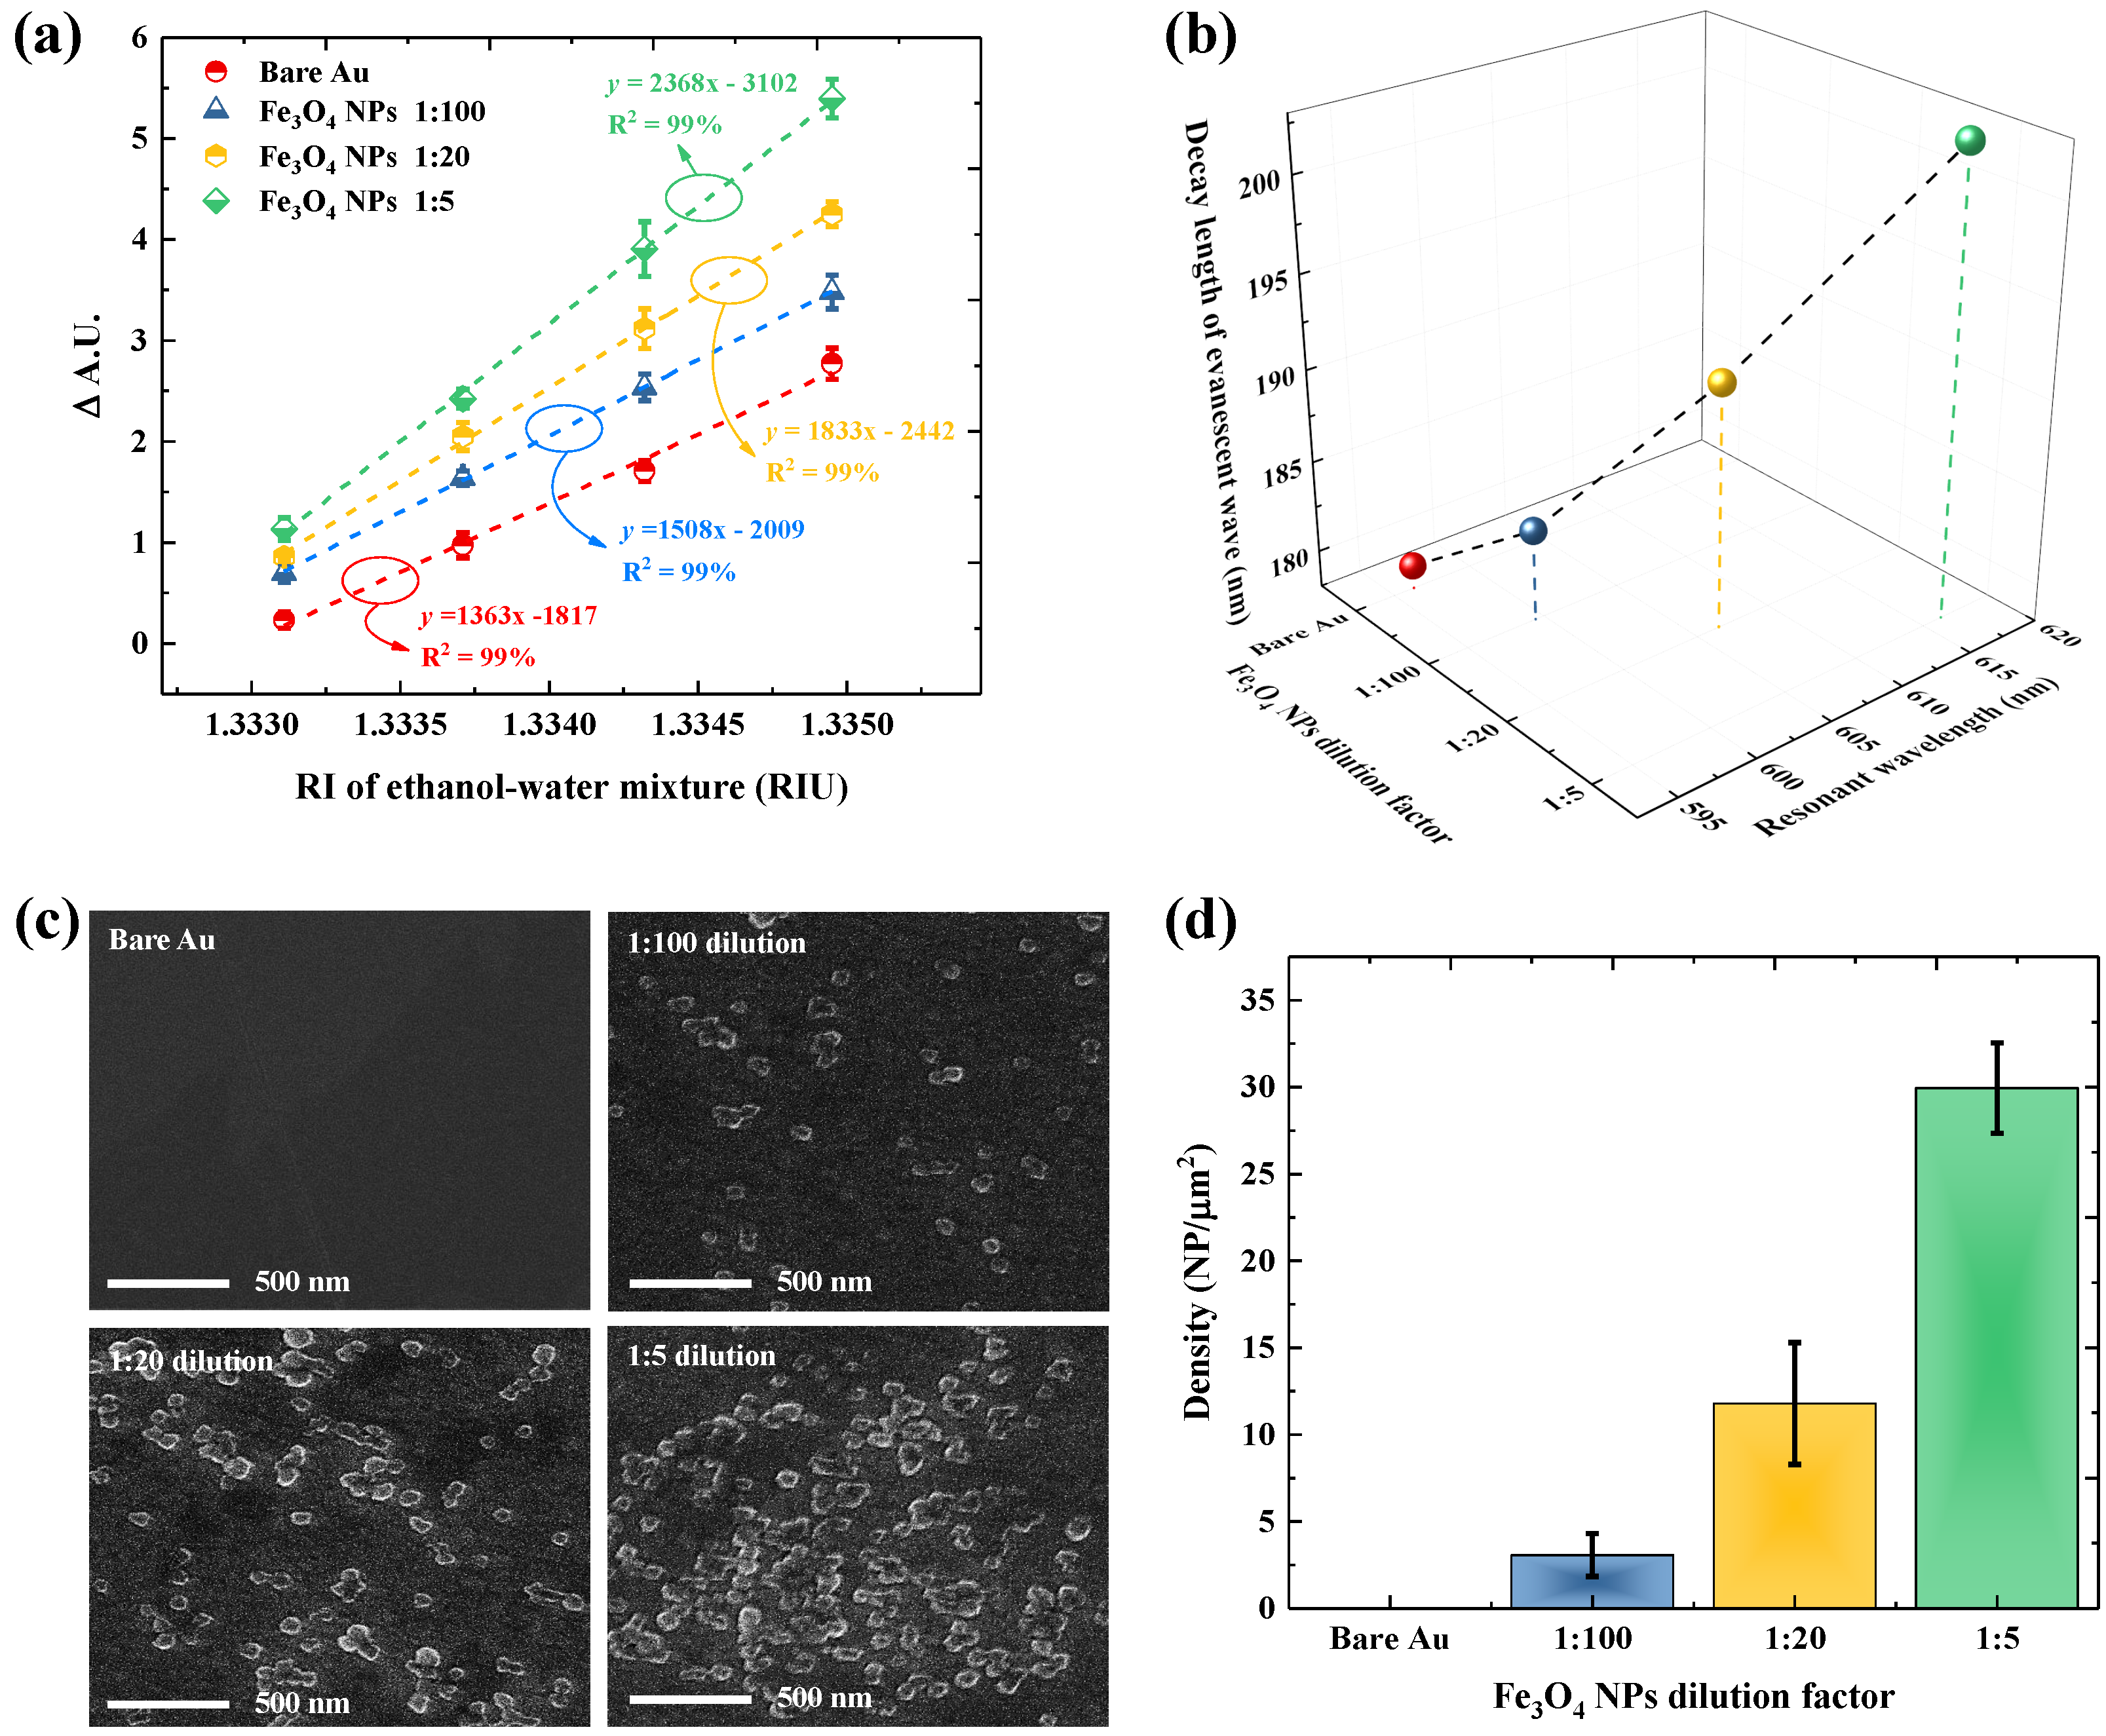
3.1. Influence of Fe3O4 NPs Density on the SPR Sensitivity
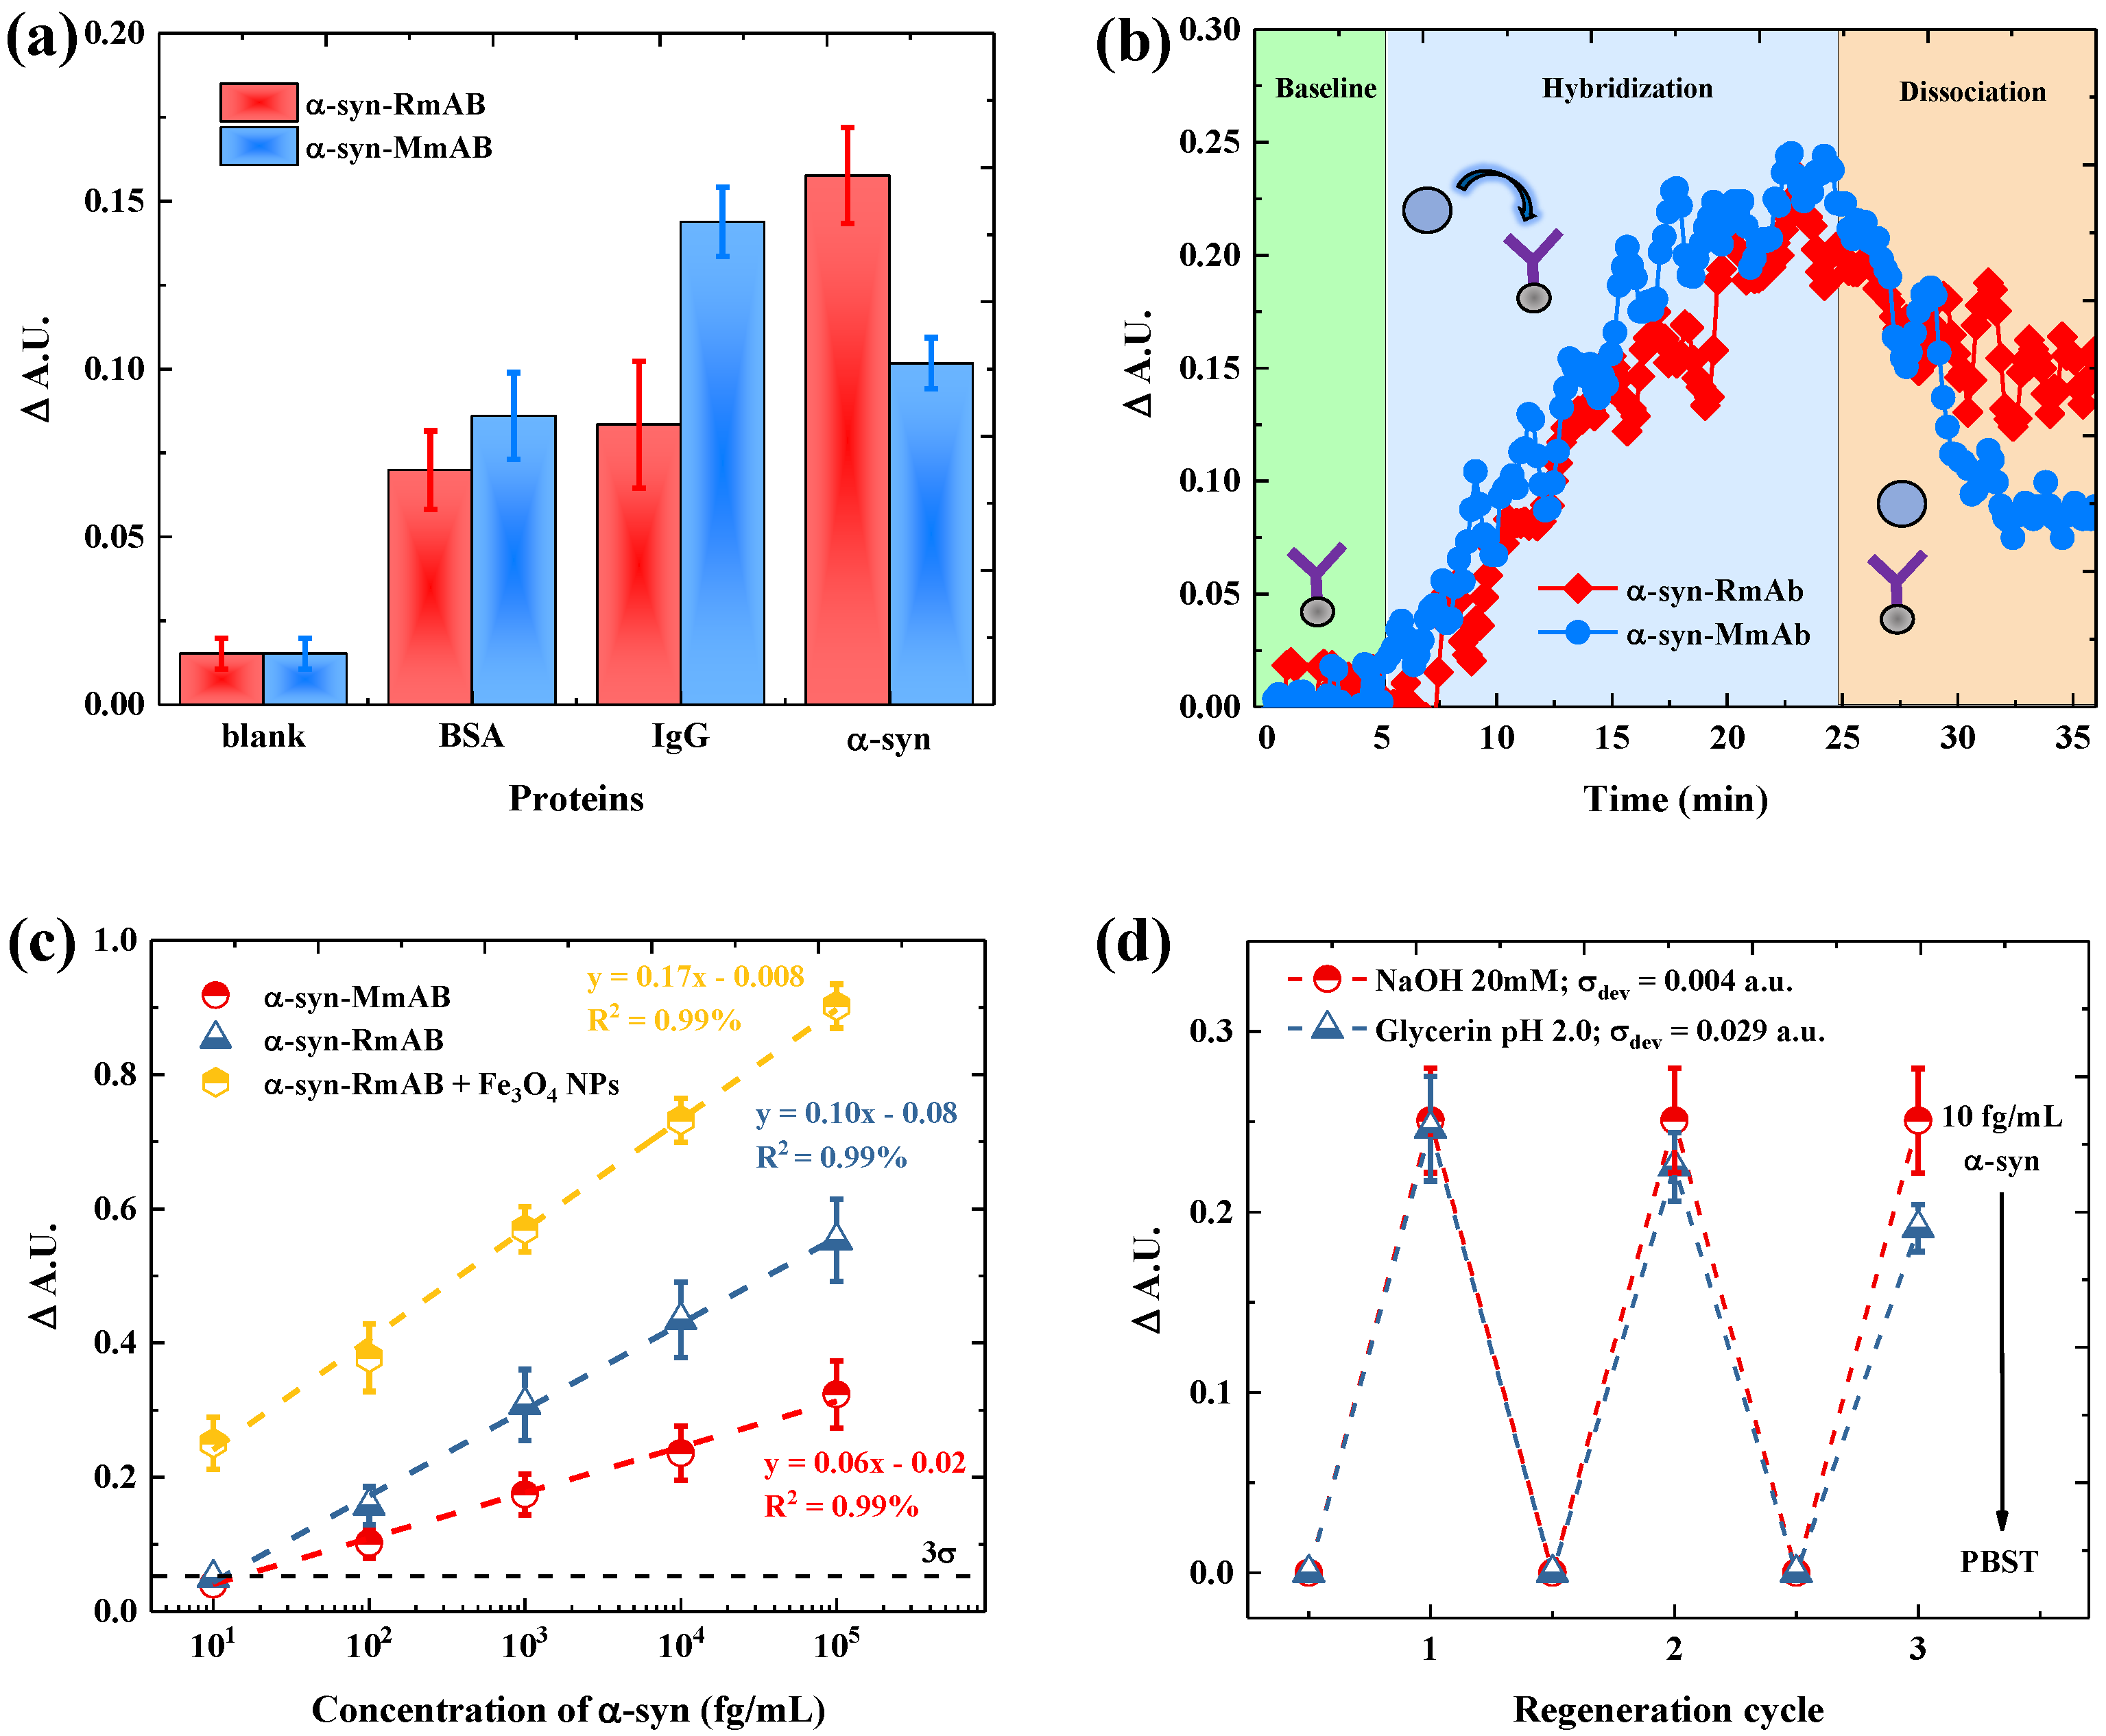
3.2. Selectivity and Sensitivity Evaluation of Antibody with -syn
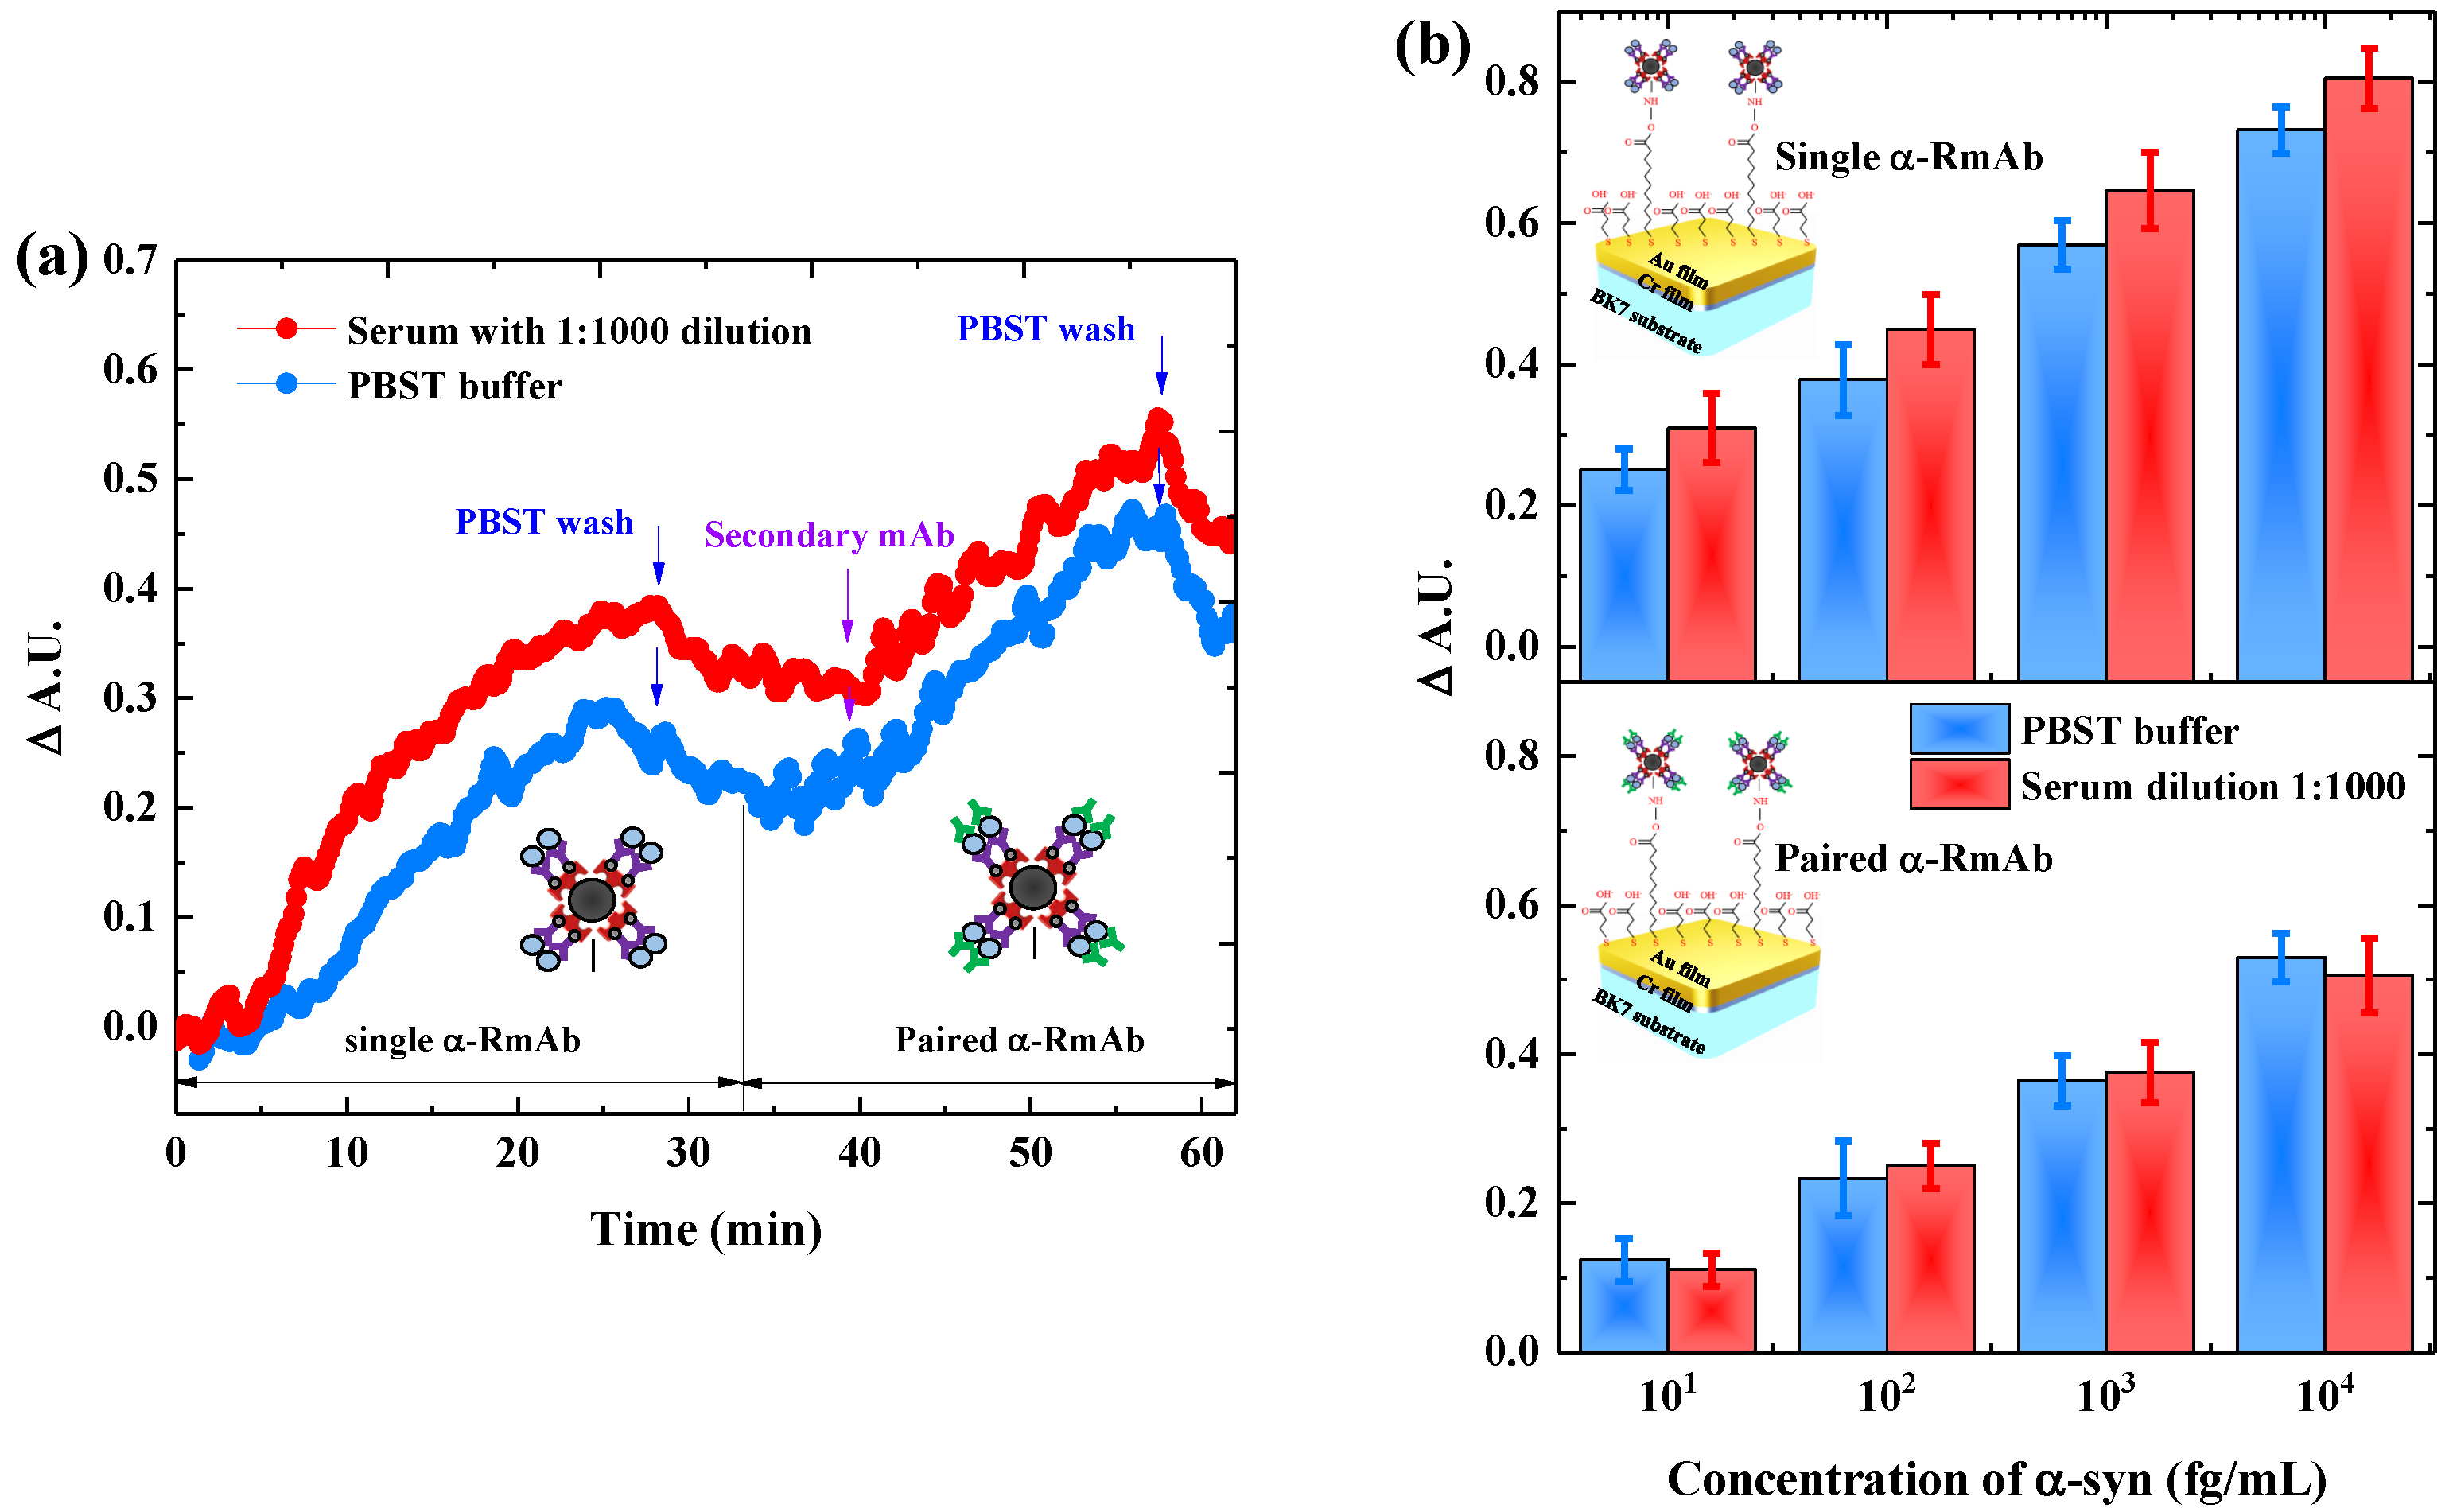
3.3. Paired Antibody for Detecting -Syn in Serum
4. Discussion
5. Conclusions
Supplementary Materials
Author Contributions
Funding
Institutional Review Board Statement
Informed Consent Statement
Data Availability Statement
Conflicts of Interest
References
- Vargas, A.J.; Harris, C.C. Biomarker development in the precision medicine era: Lung cancer as a case study. Nat. Rev. Cancer 2016, 16, 525–537. [Google Scholar] [CrossRef]
- Wu, L.; Qu, X. Cancer biomarker detection: Recent achievements and challenges. Chem. Soc. Rev. 2015, 44, 2963–2997. [Google Scholar] [CrossRef]
- Tektonidou, M.G.; Ward, M.M. Validation of new biomarkers in systemic autoimmune diseases. Nat. Rev. Rheumatol. 2011, 7, 708–717. [Google Scholar] [CrossRef] [Green Version]
- Hansson, O. Biomarkers for neurodegenerative diseases. Nat. Med. 2021, 27, 954–963. [Google Scholar] [CrossRef]
- Dorsey, E.R.; Constantinescu, R.; Thompson, J.P.; Biglan, K.M.; Holloway, R.G.; Kieburtz, K.; Marshall, F.J.; Ravina, B.M.; Schifitto, G.; Siderowf, A.; et al. Projected number of people with Parkinson disease in the most populous nations, 2005 through 2030. Neurology 2007, 68, 384–386. [Google Scholar] [CrossRef] [PubMed]
- Armstrong, M.J.; Okun, M.S. Diagnosis and treatment of Parkinson disease: A review. JAMA 2020, 323, 548–560. [Google Scholar] [CrossRef] [PubMed]
- Schapira, A.H.V.; Tolosa, E. Molecular and clinical prodrome of Parkinson disease: Implications for treatment. Nat. Rev. Neurol. 2010, 6, 309–317. [Google Scholar] [CrossRef] [PubMed]
- Greffard, S.; Verny, M.; Bonnet, A.M.; Beinis, J.Y.; Gallinari, C.; Meaume, S.; Piette, F.; Hauw, J.J.; Duyckaerts, C. Motor score of the unified Parkinson disease rating scale as a good predictor of Lewy body–associated neuronal loss in the substantia nigra. Arch. Neurol. 2006, 63, 584–588. [Google Scholar] [CrossRef] [PubMed] [Green Version]
- Connolly, B.S.; Lang, A.E. Pharmacological treatment of Parkinson disease: A review. JAMA 2014, 311, 1670–1683. [Google Scholar] [CrossRef]
- Lashuel, H.A.; Overk, C.R.; Oueslati, A.; Masliah, E. The many faces of α-synuclein: From structure and toxicity to therapeutic target. Nat. Rev. Neurosci. 2013, 14, 38–48. [Google Scholar] [CrossRef] [Green Version]
- Poewe, W.; Seppi, K.; Tanner, C.M.; Halliday, G.M.; Brundin, P.; Volkmann, J.; Schrag, A.E.; Lang, A.E. Parkinson disease. Nat. Rev. Dis. Prim. 2017, 3, 17013. [Google Scholar] [CrossRef] [PubMed]
- Spillantini, M.G.; Schmidt, M.L.; Lee, V.M.Y.; Trojanowski, J.Q.; Jakes, R.; Goedert, M. α-Synuclein in Lewy bodies. Nature 1997, 388, 839–840. [Google Scholar] [CrossRef]
- Parnetti, L.; Gaetani, L.; Eusebi, P.; Paciotti, S.; Hansson, O.; El-Agnaf, O.; Mollenhauer, B.; Blennow, K.; Calabresi, P. CSF and blood biomarkers for Parkinson’s disease. Lancet Neurol. 2019, 18, 573–586. [Google Scholar] [CrossRef]
- Chang, C.W.; Yang, S.Y.; Yang, C.C.; Chang, C.W.; Wu, Y.R. Plasma and serum α-synuclein as a biomarker of diagnosis in patients with Parkinson’s disease. Front. Neurol. 2020, 10, 1388. [Google Scholar] [CrossRef] [PubMed] [Green Version]
- Schlichtmann, B.W.; Kondru, N.; Hepker, M.M.; Kanthasamy, A.G.; Anantharam, V.; John, M.; Ban, B.; Mallapragada, S.K.; Narasimhan, B. Enzyme immunoassay-based platform for accurate detection of serum pathological α-synuclein in Parkinson’s disease patients. ACS Chem. Neurosci. 2020, 11, 4179–4190. [Google Scholar] [CrossRef]
- Emmanouilidou, E.; Papagiannakis, N.; Kouloulia, S.; Galaziou, A.; Antonellou, R.; Papadimitriou, D.; Athanasiadou, A.; Bozi, M.; Koros, C.; Maniati, M.; et al. Peripheral alpha-synuclein levels in patients with genetic and non-genetic forms of Parkinson’s disease. Park. Relat. Disord. 2020, 73, 35–40. [Google Scholar] [CrossRef]
- Ge, C.Y.; Rahman, M.M.; Zhang, W.; Lopa, N.S.; Jin, L.; Yoon, S.; Jang, H.; Xu, G.R.; Kim, W. An electrochemical immunosensor based on a self-assembled monolayer modified electrode for label-free detection of α-synuclein. Sensors 2020, 20, 617. [Google Scholar] [CrossRef] [Green Version]
- Herrmann, Y.; Bujnicki, T.; Zafiu, C.; Kulawik, A.; Kühbach, K.; Peters, L.; Fabig, J.; Willbold, J.; Bannach, O.; Willbold, D. Nanoparticle standards for immuno-based quantitation of α-synuclein oligomers in diagnostics of Parkinson’s disease and other synucleinopathies. Clin. Chim. Acta 2017, 466, 152–159. [Google Scholar] [CrossRef]
- Karaboǧa, M.N.S.; Sezgintürk, M.K. Cerebrospinal fluid levels of α-synuclein measured using a poly-glutamic acid-modified gold nanoparticle-doped disposable neuro-biosensor system. Analyst 2019, 144, 611–621. [Google Scholar] [CrossRef]
- Homola, J. Surface plasmon resonance sensors for detection of chemical and biological species. Chem. Rev. 2008, 108, 462–493. [Google Scholar] [CrossRef]
- Masson, J.F. Surface plasmon resonance clinical biosensors for medical diagnostics. ACS Sens. 2017, 2, 16–30. [Google Scholar] [CrossRef] [PubMed]
- Tabasi, O.; Falamaki, C. Recent advancements in the methodologies applied for the sensitivity enhancement of surface plasmon resonance sensors. Anal. Methods 2018, 10, 3906–3925. [Google Scholar] [CrossRef]
- Homola, J.; Yee, S.S.; Gauglitz, G. Surface plasmon resonance sensors: Review. Sens. Actuator B-Chem. 1999, 54, 3–15. [Google Scholar] [CrossRef]
- Masson, J.F.; Battaglia, T.M.; Cramer, J.; Beaudoin, S.; Sierks, M.; Booksh, K.S. Reduction of nonspecific protein binding on surface plasmon resonance biosensors. Anal. Bioanal. Chem. 2006, 386, 1951–1959. [Google Scholar] [CrossRef] [PubMed]
- Lee, S.H.; Park, Y.E.; Lee, J.E.; Lee, H.J. A surface plasmon resonance biosensor in conjunction with a DNA aptamer-antibody bioreceptor pair for heterogeneous nuclear ribonucleoprotein A1 concentrations in colorectal cancer plasma solutions. Biosens. Bioelectron. 2020, 154, 112065. [Google Scholar] [CrossRef]
- Yakes, B.J.; Papafragkou, E.; Conrad, S.M.; Neill, J.D.; Ridpath, J.F.; Burkhardt, W.; Kulka, M.; DeGrasse, S.L. Surface plasmon resonance biosensor for detection of feline calicivirus, a surrogate for norovirus. Int. J. Food Microbiol. 2013, 162, 152–158. [Google Scholar] [CrossRef] [PubMed]
- Meyer, M.H.; Hartmann, M.; Keusgen, M. SPR-based immunosensor for the CRP detection—A new method to detect a well known protein. Biosens. Bioelectron. 2006, 21, 1987–1990. [Google Scholar] [CrossRef] [PubMed]
- Fathi, F.; Rashidi, M.R.; Omidi, Y. Ultra-sensitive detection by metal nanoparticles-mediated enhanced SPR biosensors. Talanta 2019, 192, 118–127. [Google Scholar] [CrossRef] [PubMed]
- Dolci, M.; Bryche, J.F.; Leuvrey, C.; Zafeiratos, S.; Gree, S.; Begin-Colin, S.; Barbillon, G.; Pichon, B.P. Robust clicked assembly based on iron oxide nanoparticles for a new type of SPR biosensor. J. Mater. Chem. C. 2018, 6, 9102–9110. [Google Scholar] [CrossRef]
- Wang, J.; Zhu, Z.; Munir, A.; Zhou, H.S. Fe3O4 nanoparticles-enhanced SPR sensing for ultrasensitive sandwich bio-assay. Talanta 2011, 84, 783–788. [Google Scholar] [CrossRef]
- Krishnan, S.; Mani, V.; Wasalathanthri, D.; Kumar, C.V.; Rusling, J.F. Attomolar detection of a cancer biomarker protein in serum by surface plasmon resonance using superparamagnetic particle labels. Angew. Chem. Int. Ed. 2011, 50, 1175–1178. [Google Scholar] [CrossRef]
- Prabowo, B.A.; Su, L.c.; Chang, Y.f.; Lai, H.c.; Chiu, N.F.; Liu, K.C. Performance of white organic light-emitting diode for portable optical biosensor. Sens. Actuator B-Chem. 2016, 222, 1058–1065. [Google Scholar] [CrossRef]
- Hyre, D.E.; Amon, L.M.; Penzotti, J.E.; Le Trong, I.; Stenkamp, R.E.; Lybrand, T.P.; Stayton, P.S. Early mechanistic events in biotin dissociation from streptavidin. Nat. Struct. Biol. 2002, 9, 582–585. [Google Scholar] [CrossRef] [PubMed]
- Yu, B.Y.; Kwak, S.Y. Assembly of magnetite nanocrystals into spherical mesoporous aggregates with a 3-D wormhole-like pore structure. J. Mater. Chem. 2010, 20, 8320–8328. [Google Scholar] [CrossRef]
- Holder, C.F.; Schaak, R.E. Tutorial on powder x-ray diffraction for characterizing nanoscale materials. ACS Nano 2019, 13, 7359–7365. [Google Scholar] [CrossRef] [Green Version]
- Shalabney, A.; Abdulhalim, I. Electromagnetic fields distribution in multilayer thin film structures and the origin of sensitivity enhancement in surface plasmon resonance sensors. Sens. Actuator A-Phys. 2010, 159, 24–32. [Google Scholar] [CrossRef]
- Johnson, P.B.; Christy, R.W. Optical constants of the noble metals. Phys. Rev. B 1972, 6, 4370–4379. [Google Scholar] [CrossRef]
- Sahab, Z.J.; Semaan, S.M.; Sang, Q.X.A. Methodology and applications of disease biomarker identification in human serum. Biomark. Insights 2007, 2, 117727190700200034. [Google Scholar] [CrossRef]
- Lee, J.W.; Sim, S.J.; Cho, S.M.; Lee, J. Characterization of a self-assembled monolayer of thiol on a gold surface and the fabrication of a biosensor chip based on surface plasmon resonance for detecting anti-GAD antibody. Biosens. Bioelectron. 2005, 20, 1422–1427. [Google Scholar] [CrossRef]
- Zhang, P.; Ma, G.; Dong, W.; Wan, Z.; Wang, S.; Tao, N. Plasmonic scattering imaging of single proteins and binding kinetics. Nat. Methods 2020, 17, 1010–1017. [Google Scholar] [CrossRef]
- MacDougall, D.; Crummett, W.B. Guidelines for data acquisition and data quality evaluation in environmental chemistry. Anal. Chem. 1980, 52, 2242–2249. [Google Scholar] [CrossRef]
- Shim, K.H.; Kim, S.C.; Youn, Y.C.; Sung, Y.H.; An, S.S.A. Decreased plasma α-synuclein in idiopathic Parkinson’s disease patients after adjusting hemolysis factor. Mol. Cell. Toxicol. 2020, 16, 477–484. [Google Scholar] [CrossRef]
- Yang, S.Y.; Chiu, M.J.; Lin, C.H.; Horng, H.E.; Yang, C.C.; Chieh, J.J.; Chen, H.H.; Liu, B.H. Development of an ultra-high sensitive immunoassay with plasma biomarker for differentiating Parkinson disease dementia from Parkinson disease using antibody functionalized magnetic nanoparticles. J. Nanobiotechnol. 2016, 14, 41. [Google Scholar] [CrossRef] [Green Version]
- Yin, Z.; Cheng, X.; Wang, G.; Chen, J.; Jin, Y.; Tu, Q.; Xiang, J. SPR immunosensor combined with Ti4+@TiP nanoparticles for the evaluation of phosphorylated alpha-synuclein level. Microchim. Acta 2020, 187, 1–9. [Google Scholar] [CrossRef] [PubMed]
- Lippow, S.M.; Wittrup, K.D.; Tidor, B. Computational design of antibody-affinity improvement beyond in vivo maturation. Nat. Biotechnol. 2007, 25, 1171–1176. [Google Scholar] [CrossRef] [Green Version]
- Kim, D.; Herr, A.E. Protein immobilization techniques for microfluidic assays. Biomicrofluidics 2013, 7, 1–47. [Google Scholar] [CrossRef] [PubMed] [Green Version]
- Goode, J.A.; Rushworth, J.V.; Millner, P.A. Biosensor regeneration: A review of common techniques and outcomes. Langmuir 2015, 31, 6267–6276. [Google Scholar] [CrossRef] [PubMed]
- Sun, K.; Xia, N.; Zhao, L.; Liu, K.; Hou, W.; Liu, L. Aptasensors for the selective detection of alpha-synuclein oligomer by colorimetry, surface plasmon resonance and electrochemical impedance spectroscopy. Sens. Actuator B-Chem. 2017, 245, 87–94. [Google Scholar] [CrossRef]
- Lin, C.H.; Yang, S.Y.; Horng, H.E.; Yang, C.C.; Chieh, J.J.; Chen, H.H.; Liu, B.H.; Chiu, M.J. Plasma α-synuclein predicts cognitive decline in Parkinson’s disease. J. Neurol. Neurosurg. Psychiatry 2017, 88, 818–824. [Google Scholar] [CrossRef]
- Saito, Y.; Wang, J.J.; Batchelder, D.N.; Smith, D.A. Simple chemical method for forming silver surfaces with controlled grain sizes for surface plasmon experiments. Langmuir 2003, 19, 6857–6861. [Google Scholar] [CrossRef]
- Herth, E.; Zeggari, R.; Rauch, J.Y.; Remy-Martin, F.; Boireau, W. Investigation of amorphous SiOx layer on gold surface for Surface Plasmon Resonance measurements. Microelectron. Eng. 2016, 163, 43–48. [Google Scholar] [CrossRef]
- Maharana, P.K.; Jha, R. Chalcogenide prism and graphene multilayer based surface plasmon resonance affinity biosensor for high performance. Sens. Actuator B-Chem. 2012, 169, 161–166. [Google Scholar] [CrossRef]
- Ishii, R.; Tokuda, T.; Tatebe, H.; Ohmichi, T.; Kasai, T.; Nakagawa, M.; Mizuno, T.; El-Agnaf, O.M. Decrease in plasma levels of α-synuclein is evident in patients with Parkinson’s disease after elimination of heterophilic antibody interference. PLoS ONE 2015, 10, e0123162. [Google Scholar] [CrossRef] [PubMed]
- Rossi, S.; Laurino, L.; Furlanetto, A.; Chinellato, S.; Orvieto, E.; Canal, F.; Facchetti, F.; Dei Tos, A.P. Rabbit monoclonal antibodies: A comparative study between a novel category of immunoreagents and the corresponding mouse monoclonal antibodies. Am. J. Clin. Pathol. 2005, 124, 295–302. [Google Scholar] [CrossRef] [PubMed]
- Weber, J.; Peng, H.; Rader, C. From rabbit antibody repertoires to rabbit monoclonal antibodies. Exp. Mol. Med. 2017, 49, 1–12. [Google Scholar] [CrossRef] [PubMed]
- Soelberg, S.D.; Stevens, R.C.; Limaye, A.P.; Furlong, C.E. Surface plasmon resonance detection using antibody-linked magnetic nanoparticles for analyte capture, purification, concentration, and signal amplification. Anal. Chem. 2009, 81, 2357–2363. [Google Scholar] [CrossRef] [Green Version]
- Vaisocherová, H.; Brynda, E.; Homola, J. Functionalizable low-fouling coatings for label-free biosensing in complex biological media: Advances and applications. Anal. Bioanal. Chem. 2015, 407, 3927–3953. [Google Scholar] [CrossRef]
- Wang, Q.; Zou, L.; Yang, X.; Liu, X.; Nie, W.; Zheng, Y.; Cheng, Q.; Wang, K. Direct quantification of cancerous exosomes via surface plasmon resonance with dual gold nanoparticle-assisted signal amplification. Biosens. Bioelectron. 2019, 135, 129–136. [Google Scholar] [CrossRef]
- Xue, T.; Liang, W.; Li, Y.; Sun, Y.; Xiang, Y.; Zhang, Y.; Dai, Z.; Duo, Y.; Wu, L.; Qi, K.; et al. Ultrasensitive detection of miRNA with an antimonene-based surface plasmon resonance sensor. Nat. Commun. 2019, 10, 1–9. [Google Scholar] [CrossRef]


| Proteins | A.U. | Selectivity Coefficient | ||
|---|---|---|---|---|
| -syn-RmAb | -syn-MmAb | -syn-RmAb | -syn-MmAb | |
| -syn | 0.16 ± 0.02 | 0.10 ± 0.01 | — | — |
| BSA | 0.07 ± 0.01 | 0.09 ± 0.01 | 2.25 | 1.18 |
| IgG | 0.08 ± 0.02 | 0.14 ± 0.01 | 1.89 | 0.71 |
| Technique | Capture Antibody | Linearity Range (pg/mL) | LOD (pg/mL) | Ref |
|---|---|---|---|---|
| Electrochemical | mouse mAb | (10–1000) × | 1130 | [17] |
| sFIDA | mouse 4B12 mAb | (3.60–26) × | 980 | [18] |
| ELISA | mouse 4B12 mAb | (0.20–3.20) × | 114 | [42] |
| Neurobiosensors | mouse mAb | 4–2000 | 0.1350 | [19] |
| IMR | mouse sc-12767 mAb | (0.31–31)× | 0.0003 | [43] |
| SPR | rabbit MJF-R13 mAb | 0.10–10 | 0.0700 | [44] |
| rabbit Ab138501 mAb | 0.01–100 | 0.0056 | This work |
| Sample | Added -syn | Found (fg/mL) | Recovery Rate (%) | ||
|---|---|---|---|---|---|
| (fg/mL) | Single mAb | Paired mAb | Single mAb | Paired mAb | |
| 1 | 10 | 36.6 | 9.9 | 366.2 | 99.4 |
| 2 | 100 | 324.0 | 104.3 | 324.0 | 104.3 |
| 3 | 1000 | 5251.5 | 1032.5 | 525.1 | 103.2 |
| 4 | 10,000 | 49,107.1 | 9455.6 | 491.1 | 94.5 |
Publisher’s Note: MDPI stays neutral with regard to jurisdictional claims in published maps and institutional affiliations. |
© 2021 by the authors. Licensee MDPI, Basel, Switzerland. This article is an open access article distributed under the terms and conditions of the Creative Commons Attribution (CC BY) license (https://creativecommons.org/licenses/by/4.0/).
Share and Cite
Mandala, S.H.S.; Liu, T.-J.; Chen, C.-M.; Liu, K.-K.; Januar, M.; Chang, Y.-F.; Lai, C.-S.; Chang, K.-H.; Liu, K.-C. Enhanced Plasmonic Biosensor Utilizing Paired Antibody and Label-Free Fe3O4 Nanoparticles for Highly Sensitive and Selective Detection of Parkinson’s α-Synuclein in Serum. Biosensors 2021, 11, 402. https://0-doi-org.brum.beds.ac.uk/10.3390/bios11100402
Mandala SHS, Liu T-J, Chen C-M, Liu K-K, Januar M, Chang Y-F, Lai C-S, Chang K-H, Liu K-C. Enhanced Plasmonic Biosensor Utilizing Paired Antibody and Label-Free Fe3O4 Nanoparticles for Highly Sensitive and Selective Detection of Parkinson’s α-Synuclein in Serum. Biosensors. 2021; 11(10):402. https://0-doi-org.brum.beds.ac.uk/10.3390/bios11100402
Chicago/Turabian StyleMandala, Samuel Husin Surya, Tai-Jan Liu, Chiung-Mei Chen, Kuo-Kang Liu, Mochamad Januar, Ying-Feng Chang, Chao-Sung Lai, Kuo-Hsuan Chang, and Kou-Chen Liu. 2021. "Enhanced Plasmonic Biosensor Utilizing Paired Antibody and Label-Free Fe3O4 Nanoparticles for Highly Sensitive and Selective Detection of Parkinson’s α-Synuclein in Serum" Biosensors 11, no. 10: 402. https://0-doi-org.brum.beds.ac.uk/10.3390/bios11100402