Article

Robust Nanozyme-Enzyme Nanosheets-Based Lactate Biosensor for Diagnosing Bacterial Infection in Olive Flounder (Paralichthys olivaceus)

1
Department of Cogno-Mechatronics Engineering, College of Nanoscience and Nanotechnology, Pusan National University, Busan 46241, Korea
2
Department of Chemistry, Pusan National University, Busan 46241, Korea
3
Department of Polymer Science and Engineering, Pusan National University, Busan 46241, Korea
*
Author to whom correspondence should be addressed.
These authors contributed equally to this work.
Submission received: 6 October 2021 / Revised: 29 October 2021 / Accepted: 2 November 2021 / Published: 4 November 2021
(This article belongs to the Section Biosensor Materials)

Abstract

:
Bacterial infections in fish farms increase mass mortality and rapid detection of infection can help prevent its widespread. Lactate is an important biomarker for early diagnosis of bacterial infections in farmed olive flounder (Paralichthys olivaceus). To determine the lactate levels, we designed a disposable amperometric biosensor based on Prussian blue nanozyme and lactate oxidase (LOX) entrapped in copolymer-reduced graphene oxide (P-rGO) on screen-printed carbon electrodes. Because LOX is inherently unstable, P-rGO nanosheets were utilized as a base matrix to immobilize it. After optimization in terms of enzyme loading, operating potential, and pH, the biosensor displayed maximum current responses within 5 s at the applied potential of –0.1 V vs. internal Ag/AgCl. The biosensor had Langmuir-type response in the lactate concentration range from 10 µM to 1.6 mM, a dynamic linear response range of 10–100 µM, a sensitivity of 15.9 µA mM−1 cm−2, and a lower detection limit of 3.1 µM (S/N = 3). Additionally, the biosensor featured high reproducibility, good selectivity, and stability till four weeks. Its practical applicability was tested in olive flounder infected by Streptococcus parauberis against the uninfected control. The results were satisfactory compared to those of a standard colorimetric assay kit, validating our method.

1. Introduction

Streptococcosis is a common bacterial disease affecting aquaculture farms. Streptococcosis caused by Streptococcus parauberis is the dominant bacterial infection in olive flounder (Paralichthys olivaceus), with the clinical signs of darkening of the body, exophthalmia with hemorrhage, and congestion of the spleen, kidney, liver, and heart. S. parauberis infection leads to devastating mortality and antibiotic resistance in the fish. Despite the use of antibacterial agents and vaccines against this pathogen, recurrent infection has been reported [1,2,3].
The detection and identification of S. parauberis mainly rely on the clinical symptoms [4], biochemical characteristics [2], molecular techniques including genomics [5,6,7], proteomics [8], and conventional polymerase chain reaction (PCR) based on the 23S rRNA region [9,10]. Although PCR is widely used as a standard molecular technique for the diagnosis, it is time-consuming and costly, has a high risk of contamination, and requires careful implementation to achieve sensitivity and specificity [11,12,13]. Despite the seriousness of streptococcosis in marine fishes, no efforts have been made to detect S. parauberis in a rapid manner. Therefore, a novel and robust technique is necessary for simple and accurate diagnosis of S. parauberis. Moreover, to our knowledge, there are no commercially available kits or biosensors for diagnosing bacterial infections in fish.
Metabolites are the best indicators of the current health status of an organism. Many metabolomics studies have uncovered biomarkers useful for diagnosing various infectious diseases [14]. Nuclear magnetic resonance (NMR)-based metabolomics studies have demonstrated that infection with Aeromonas salmonicida, a Gram-negative bacterium, induces metabolic changes in lipoproteins and choline-based residues [15]. Several studies have investigated metabolic changes in tilapias upon infection by Streptococcus species, and revealed that N-acetylglucosamine, leucine, and proline could be biomarkers for streptococcosis [16,17,18].
According to NMR metabolic profiling, lactate level is elevated (hyperlactatemia) in S. parauberis-infected olive flounder, and therefore the detection of lactate biomarker contributes to streptococcosis infection diagnosis at an early stage. Previously reported conventional analytical methods for detecting lactate in fishes include liquid chromatography-tandem mass spectrometry [19] and 1H NMR spectroscopy [20]. Although these methods are reliable, they have significant demerits such as the need for expensive equipment or expertise, multi-step sample pre-preparation, high time consumption, the inability for real-time monitoring, and increased risk of false-positive responses due to potential interferents in biological matrices. In comparison, electrochemical biosensing techniques are rapid, and free from these drawbacks [21]. Thus, they have the potential for accurate real-time quantification of lactate. Enzymatic biosensors are highly desirable for the selective detection of lactate amongst various interfering compounds. A flavoprotein enzyme, lactate oxidase (LOX), is generally employed as the catalyst to fabricate amperometric lactate biosensors. As shown in Equation (1), LOX catalyzes the conversion of lactate to pyruvate, and the formed hydrogen peroxide (H2O2) can be easily detected by the sensing electrode [22].
L a c t a t e + O 2 + H 2 O   L O X   P y r u v a t e + H 2 O 2
H 2 O 2 O 2 + 2 H + + 2 e
The byproduct H2O2 provides an indirect estimation of the lactate concentration. Although much research has been conducted on H2O2 oxidation (Equation (2)) at large overpotentials (around +0.4 V/+0.6 V), we would like to polarize the working electrode in a less negative potential region (−0.1 V) to study the reduction kinetics. To lower the working potential, artificial peroxidases and/or redox mediators can be used for signal amplification. Specifically, Prussian blue (PB), could be incorporated as a peroxidase mimic for electrochemical biosensors due to their excellent catalytic activity and facile synthesis the integration of PB nanozyme helps the sensing of H2O2 at lower applied potentials [23]. More importantly, redox mediators such as PB can improve lactate detection at micromolar concentrations with higher sensitivity and at a mild applied potential [24,25]. Notably, PB demonstrates enhanced stability with oxidase enzymes having optimum alkaline pH (pH 7.4), and it could significantly lower the interference from ascorbic acid [26].
Despite many studies of enzymatic lactate biosensors, there is still considerable interest in improving the stability properties of biosensors. Since LOX is a less stable enzyme, further stabilization of the enzyme layer is mandatory. To immobilize LOX structures onto the electrode interface, many researchers have employed nanomaterials such as nitrogen-doped carbon nanotubes [27], mesoporous silica [28], ceria nanoparticles [29], and copper metallic frameworks [30]. Polymer binders such as chitosan and Nafion analogs could be utilized as an additional layer to prevent LOX inactivation and efflux. Although these dense polymers seem to be connected to higher noise in chronoamperometry (CA) experiments and probably cause lag responses, at the optimum concentrations they not only act as a barrier against potential interferents but also provide a suitable framework for enzyme orientation [30]. Therefore, the sensing interface should be configured with a nanomaterial and a polymer binder for better enzyme orientation and improved stability.
In this study, we used NMR-based metabolomics analysis to identify metabolite biomarkers in the spleen of olive flounder infected with S. parauberis. Significant changes in metabolites were observed, particularly lactate, whose elevation enables the diagnosis of S. parauberis infections. Next, to rapidly evaluate the lactate concentration, we designed an amperometric lactate biosensor based on screen-printed carbon electrodes (SPCEs). First, the SPCEs were modified with PB nanozyme (PB/SPCEs). Meanwhile, reduced graphene oxide (rGO) was dispersed in a synthesized copolymer binder, poly(sodium 4-styrenesulfonate-r-LAHEMA) PSSL), and the product was termed P-rGO nanosheets. The P-rGO nanosheets were mixed with LOX to create affinity or electrostatic interactions between the two components. In the resulting mixture (termed LOXENs), the P-rGO nanosheets not only provide a large surface for entrapping abundant LOX but also prevent enzyme efflux, thus enhancing the stability. The LOXENs was simply cast over the nanozyme-modified biosensor. A simple representation of the designed lactate biosensor, referred to as LOXENs/PB/SPCE, is shown in Scheme 1. Overall, the nanozyme–enzyme nanosheet modification is expected to improve the analytical performance of the amperometric lactate biosensor.

2. Experimental

2.1. Reagents and Chemicals

The following reagents and chemicals were procured from Sigma-Aldrich (USA): lactate oxidase (LOX, EC 1.1.3.2) from Aerococcus viridans species, sodium l-lactate, potassium ferricyanide (K3[Fe(CN)6]), 4-dimethylaminopyridine (DMAP), iron (III) chloride (FeCl3), sodium 4-styrenesulfonate (SS), 2-hydroxyethyl methacrylate (HEMA), sodium phosphate monobasic (NaH2PO4), hydrazine monohydrate, sodium phosphate dibasic (Na2HPO4), sodium chloride (NaCl), azobisisobutyronitrile (AIBN), N,N′-dicyclohexylcarbodiimide (DCC), lipoic acid (LA), dichloromethane (DCM), dimethyl sulfoxide (DMSO), magnesium sulfate (MgSO4), and potassium chloride (KCl). Graphene oxide (GO) was obtained from Nanosolution (Jeonju, Jeonbuk, South Korea). Phosphate buffer solution (PBS) at a concentration of 50 mM and various pH was prepared using NaH2PO4, Na2HPO4, and KCl [29]. All other reagents employed were of standard or analytical grade and used without any further pretreatment steps. The aqueous solutions were prepared using triple distilled water (18 MΩ) from a Milli-Q water purification system.

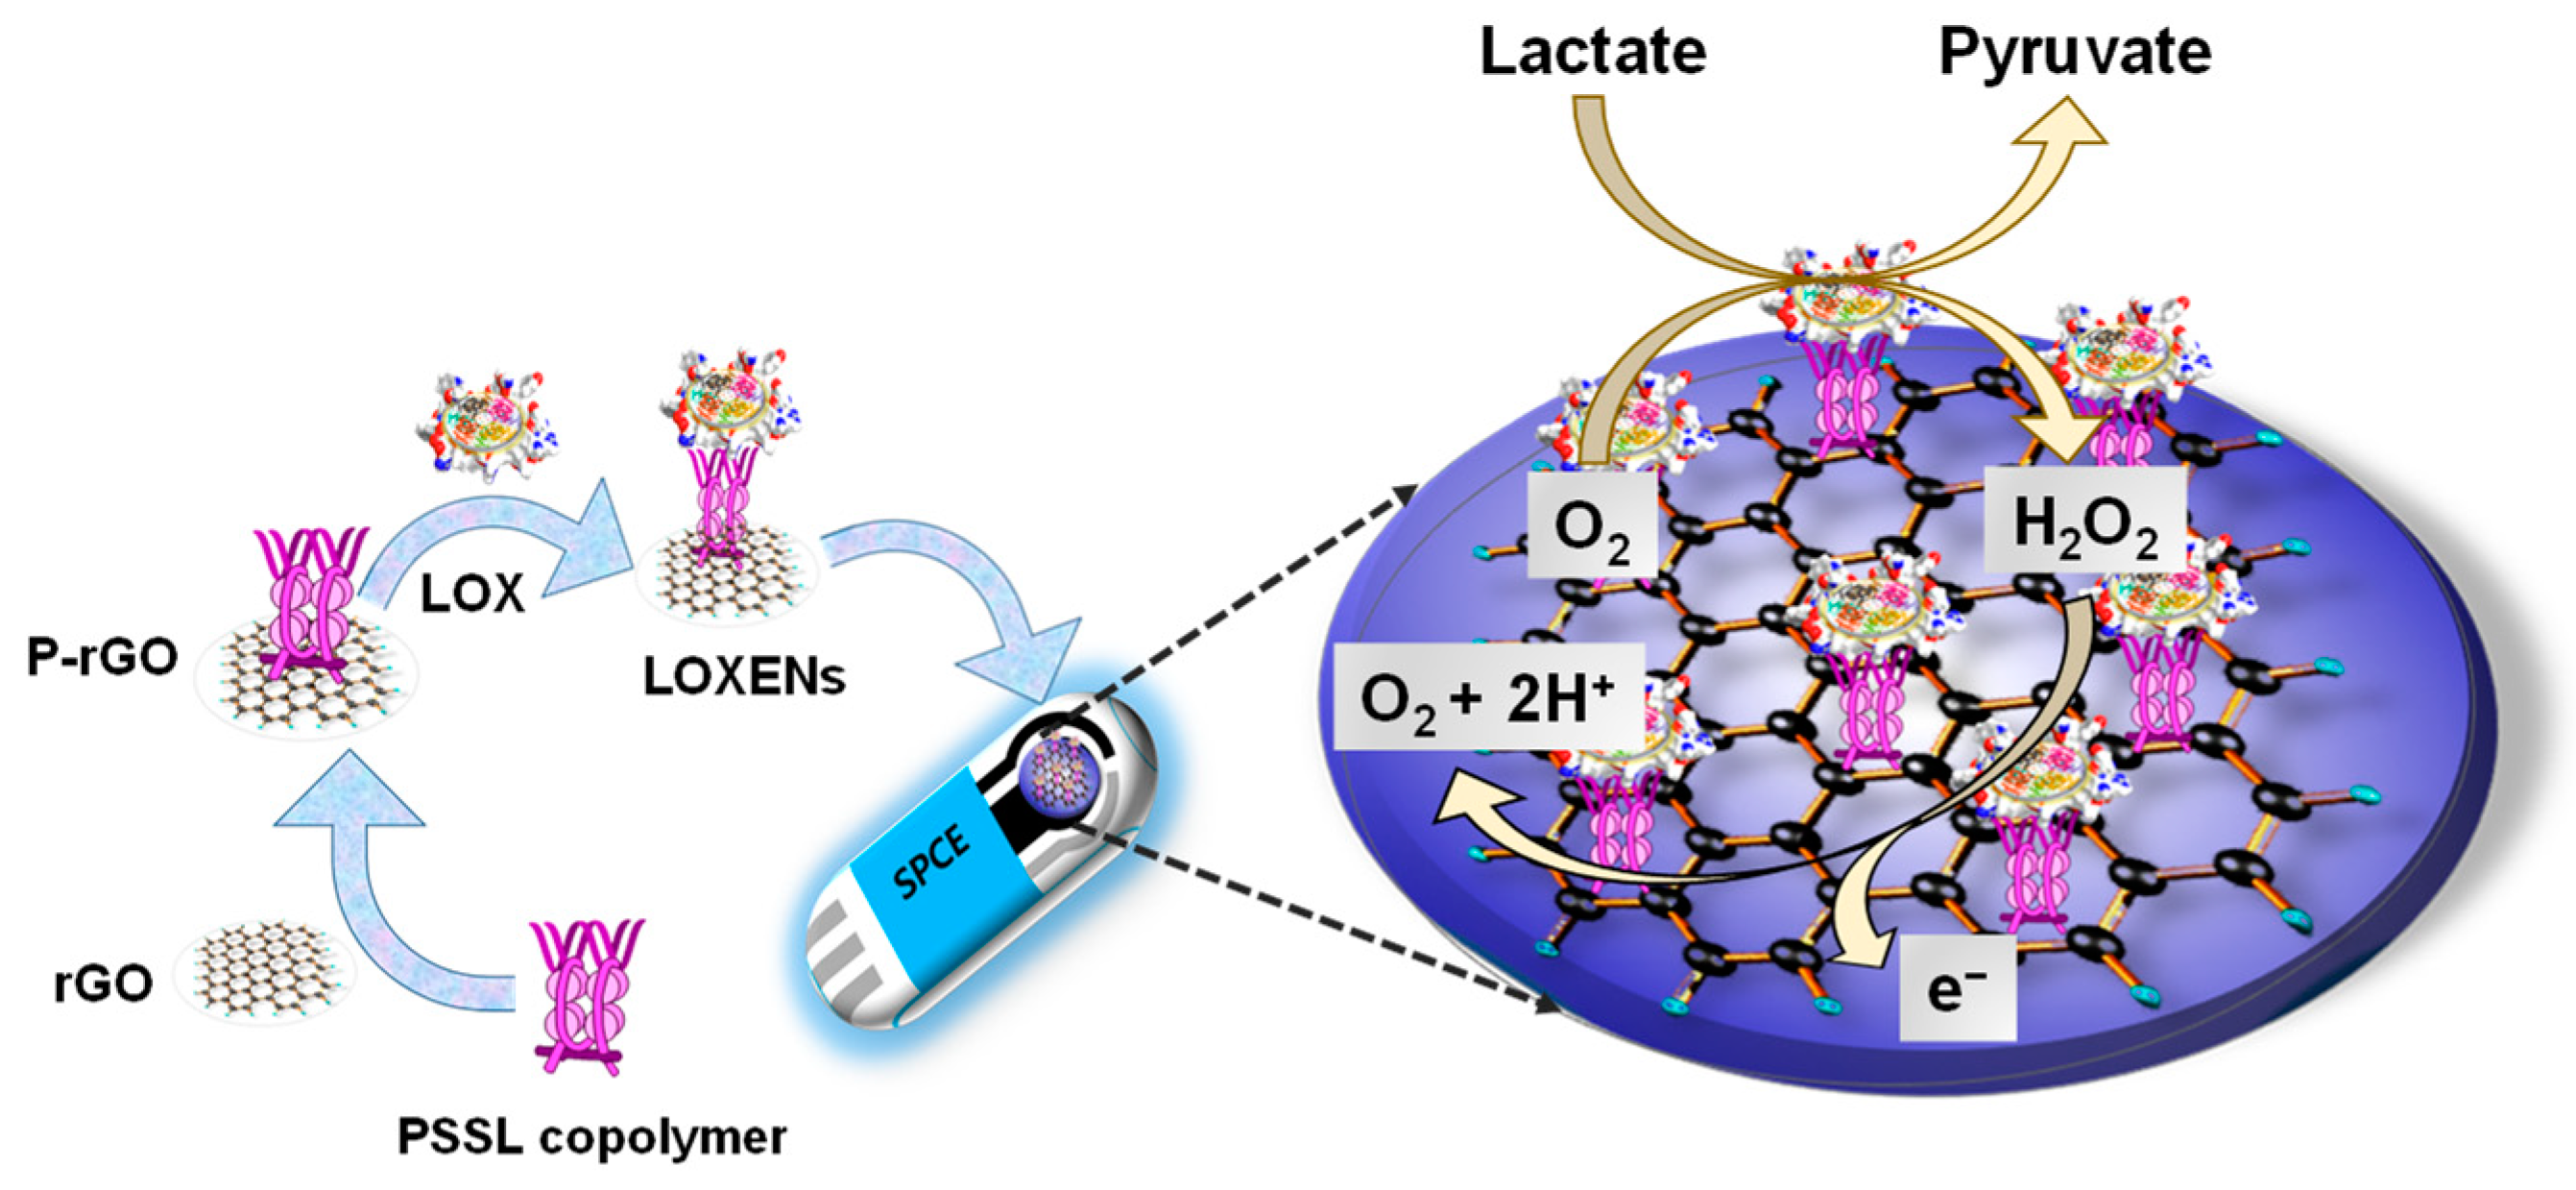
2.2. Construction of Lactate Biosensors

To prepare LOXENs, equal volumes of P-rGO (0.2 mg mL−1, for the synthesis see Section S2 in Supplementary material) and LOX (25 IU mL−1) were mixed and left for 10 min. The surface area of P-rGO was large enough to entrap a significant amount of LOX. Approximately 6 µL of the prepared LOXENs was drop-casted onto the SPCE surface. Prior to drop-casting, the SPCE was modified with the nanozyme (Section S1 in Supplementary material) following our previous report [31]. The obtained biosensors, LOXENs/PB/SPCEs, were finally dried at 4 °C for 12 h before use. The PSSL copolymer contained in P-rGO has adhesive/binding properties that promote LOX loading by simple adsorption.

2.3. Equipment and Measurements

Morphological analysis of the biosensors was conducted using field-emission scanning electron microscopy (FE-SEM, Zeiss SUPRA 25). CA evaluations were carried out using electrochemical equipment (Compactstat, Ivium Technologies B.V., Eindhoven, The Netherlands).
For CA, the biosensor was attached to a potentiostat, 60 μL of PBS was placed onto the sensing surface, and then a potential of −0.10 V was applied. After achieving a stable baseline response, 20 μL of lactate solution was introduced, and the resulting current responses were measured over time. To acquire the calibration curve, the evaluations were repeated using standard lactate solutions at various concentrations.

2.4. Experimental Fish and S. parauberis Challenge

Olive flounder with an average body weight of 40 g was obtained from a commercial fish farm in South Korea and acclimatized to laboratory conditions for 2 weeks in a 1000 L tank with circulated seawater at 26 °C. S. parauberis strain SpOF-3k serotype I was cultured for 24 h on brain heart infusion agar (BHIA) containing 1% NaCl. For S. parauberis infection, the fish (S. parauberis infection group, n = 50) was subcutaneously injected with bacteria at a final concentration of 4.3 × 10³ colony-forming units/fish. The control group (n = 50) was injected with the same volume of sterile saline. Water temperature was maintained at 26 °C during the experiment. At 7 days post-challenge (DPC), the cumulative mortality was 38% and 0% in the S. parauberis-infected and control groups, respectively. Twenty fish per group were dissected at 7 DPC after controlled anesthesia with MS-222. The target organ (spleen) from both groups was removed aseptically and frozen immediately using liquid nitrogen.
The presence of infection was confirmed by homogenizing the isolated spleen followed by serial dilution and culturing on BHIA for 24 h. No infection was found in the control group, and fish from the infected group were confirmed to be severely infected with S. parauberis.

2.5. 1H NMR Analysis

The spleen samples were lyophilized and homogenized individually for metabolite extraction. Within the S. parauberis-infected group and the control group, the homogenized samples were pooled (9 and 10 samples, respectively) to achieve a weight of 60 mg on average. Metabolite extraction was performed on each pooled sample using Bligh and Dyer’s method [32]. The polar phase supernatant of each sample was collected and lyophilized. Later, the samples were re-dissolved in 2 mM 3-(trimethylsilyl) propionic-2,2,3,3-d4 acid sodium salt (TSP-d4) solution in 700 μL of D2O, and finally transferred into a 5 mm NMR tube. All samples were analyzed using a 600 MHz Agilent NMR spectrometer (Agilent, Santa Clara, CA, USA). A Carr–Purcell–Meiboom–Gill pulse (CPMG) sequence was used to suppress the peaks of water and macromolecules. Spectra were acquired with a 22.375 μs 90° pulse, 1 s relaxation delay, 3 s acquisition time, and 128 scans. The total acquisition time was 9 min 56 s.

2.6. Preparation of Fish Spleen Extracts for Biosensor and Kit Tests

The practical utility of the fabricated biosensor was examined following a standard addition method employing spleen extracts from both the control and S. parauberis-infected groups. The samples were prepared at various dilutions with 50 mM PBS (pH 7.4). Diluted samples with minimal background current and noise were chosen to minimize matrix effects and possible interferences. Spleen extracts (4 × 60 μL) spiked with 60 μL of lactate at known concentrations (0.0, 50, 100, and 150 μM) were prepared and subjected to CA measurements. The dilution factor of the spiked samples was 0.5. The cumulative lactate concentrations detected in spiked samples were calculated in the same way as for the linear calibration plots.
To compare to the biosensor results, the lactate concentrations in control and S. parauberis-infected groups were also estimated using a standard colorimetric lactate assay kit (cat. ab65331; Abcam) according to the manufacturer’s protocol.

2.7. Data Analysis

Identification and concentration estimation of the metabolites were performed using Chenomx NMR suite 8.4 (Chenomx Inc., Edmonton, AB, Canada). The concentration of metabolites was calculated with reference to the 2 mM TSP peak. MetaboAnalyst 5.0, a web-based metabolomics analysis platform, was used for t-test analysis adjusted to a false discovery rate (FDR) and receiver operating characteristic (ROC) analysis, to assess the diagnostic performance of the metabolite.

3. Results and Discussion

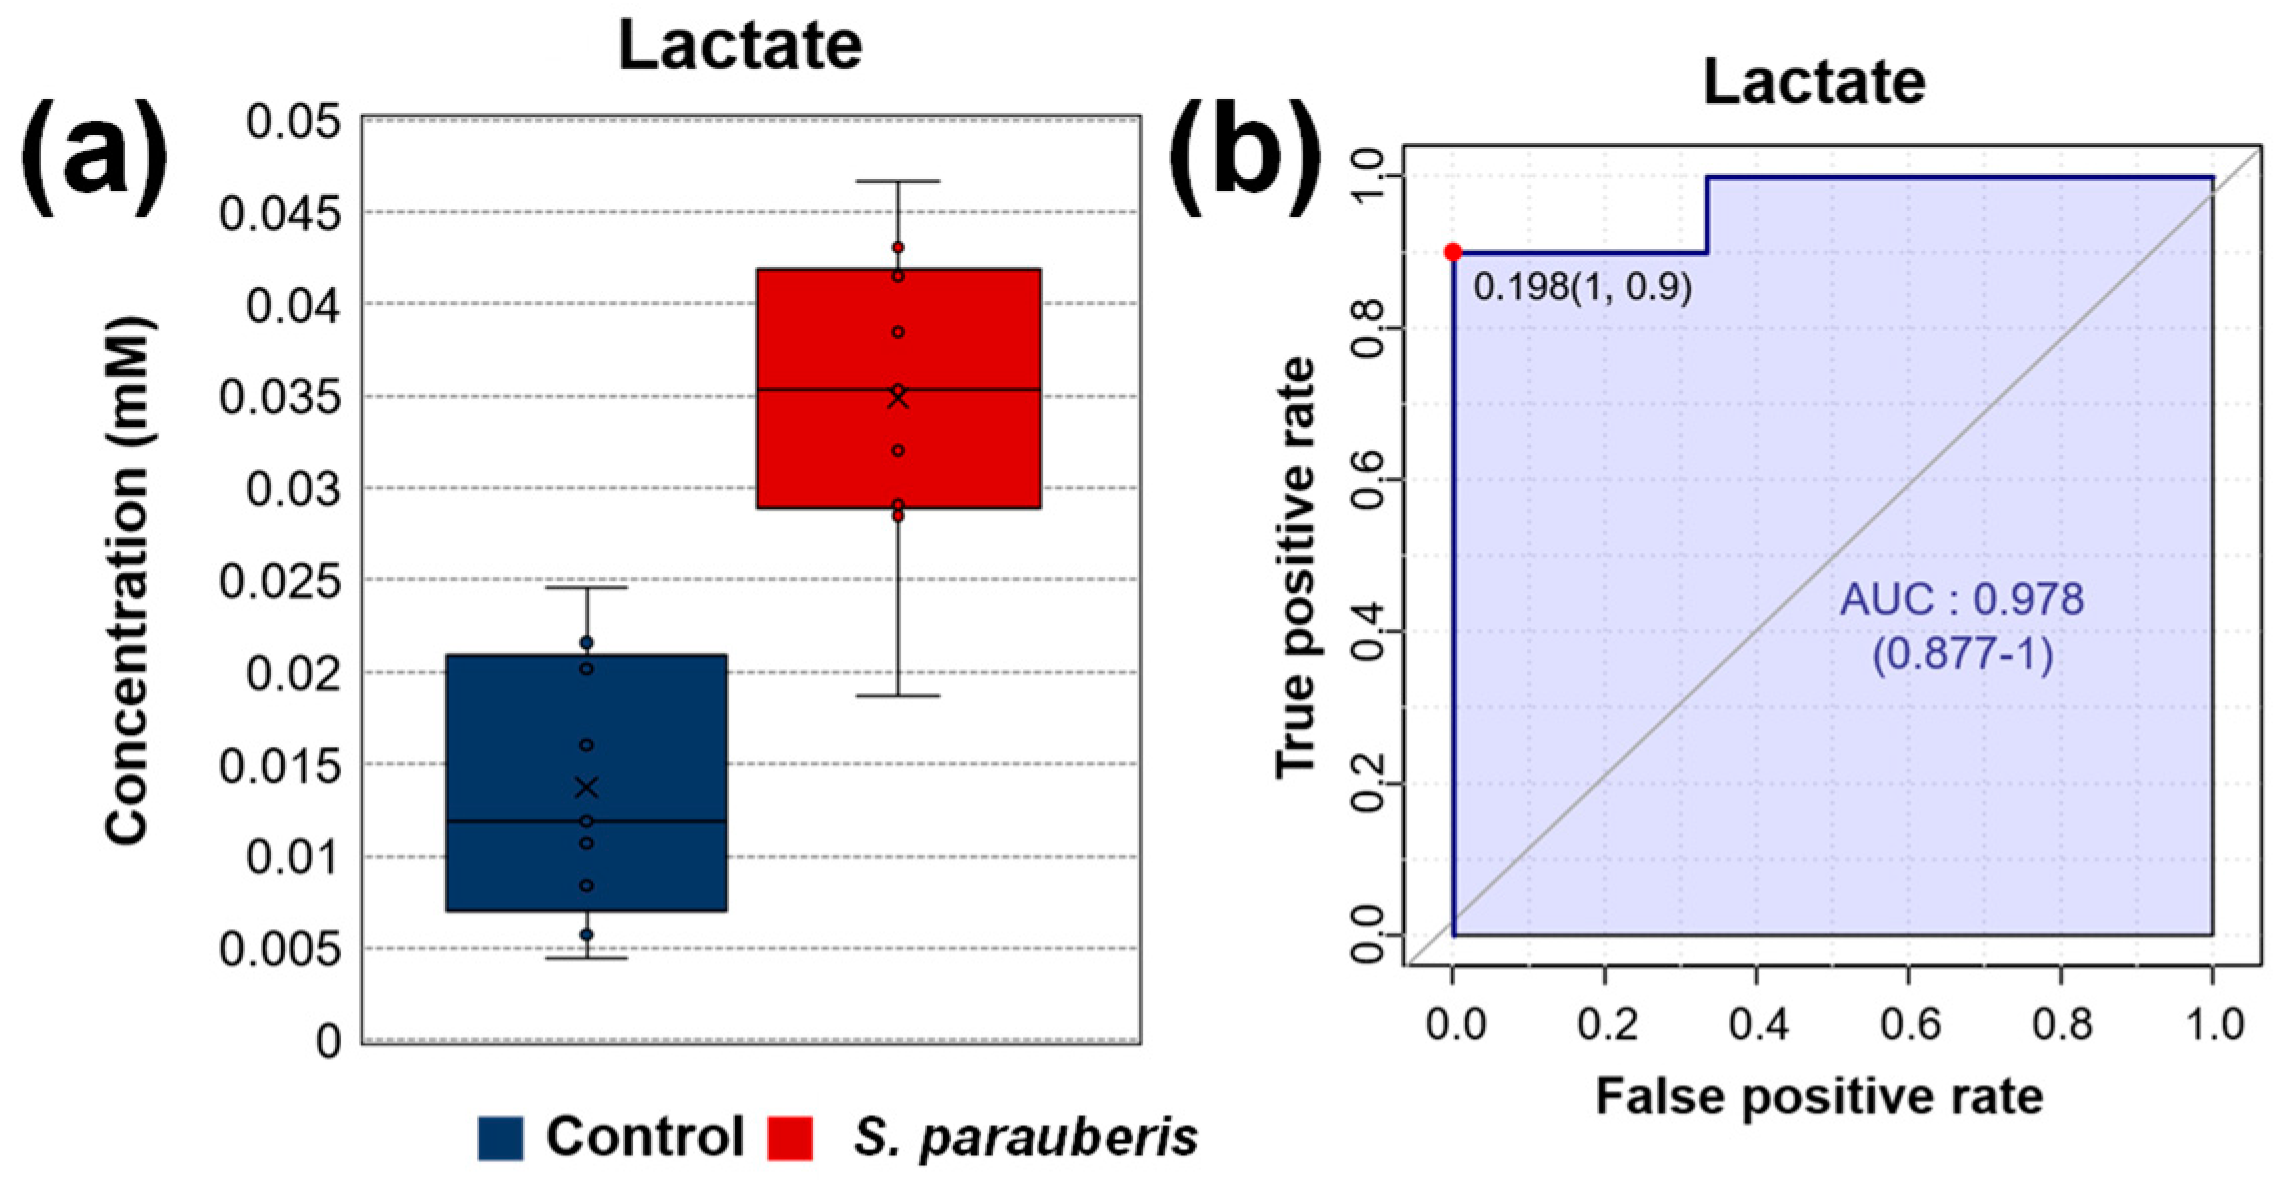
3.1. Lactate Levels in S. parauberis-Infected Fish Spleen

A total of 21 metabolites were identified and quantified in the spleen of olive flounder as given in Table S1. These metabolites were further analyzed using the t-test, and significant increases in lactate were observed in the S. parauberis-infected group compared to the control (FDR < 0.05). Figure S1 shows the lactate NMR peaks characteristic of control and S. parauberis infected groups. Lactate is represented as doublet peak at 1.33 ppm (Figure S1a and quartet peak at 4.1 ppm (Figure S1b) in the 1H-NMR spectra. The average lactate concentration in the control group was below 0.002 mM, whereas that in the S. parauberis-infected group increased by at least 2-fold as shown in Figure 1a. The area under the curve (AUC) values from the ROC were used to determine the diagnostic performance of lactate. The results showed excellent ability to predict lactate with a high AUC value of 0.978 (Figure 1b). The results are summarized in Table 1. The p value of ROC was also significant (p = 1.08 × 10⁻⁴). Therefore, we confirmed that lactate is an effective biomarker for detecting S. parauberis infection, and its concentration could distinguish the infected fish from control.

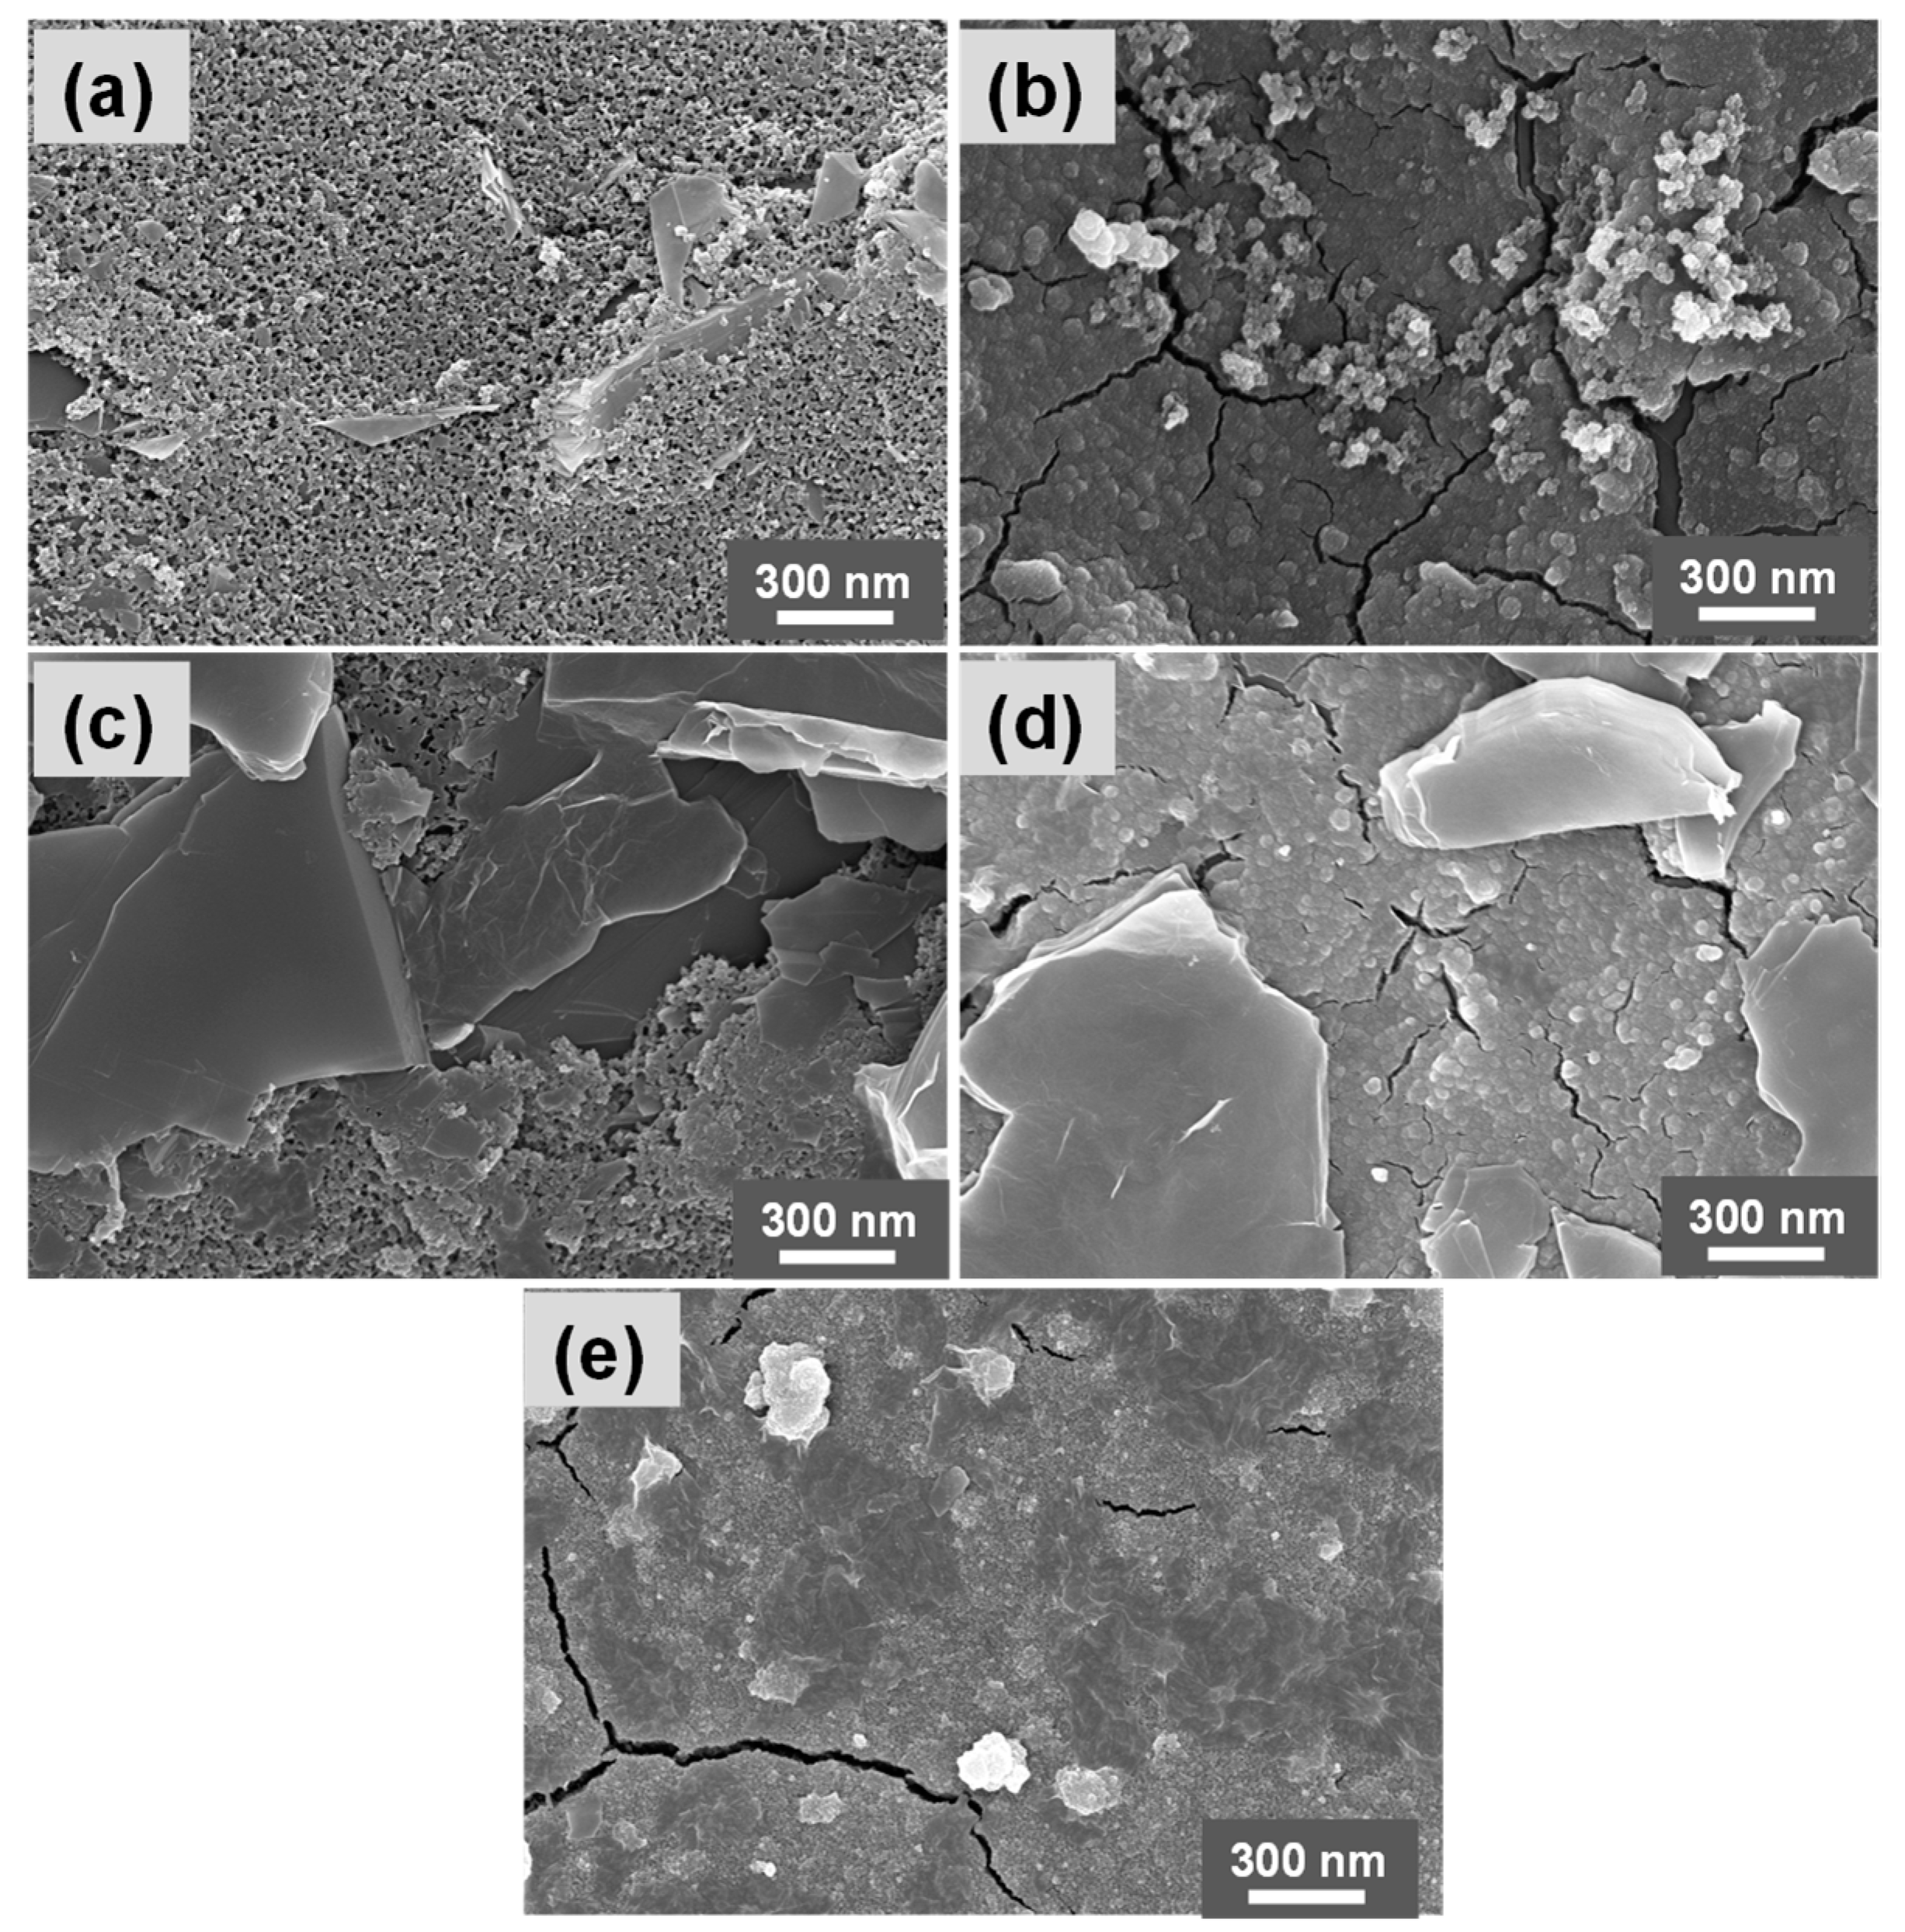
3.2. Physicochemical Characterization

The morphology of biosensors after successive modifications was characterized by FE-SEM (Figure 2). The bare SPCE displayed a relatively rugged surface and an uneven morphology, whereas the surface of nanozyme-modified SPCE was slightly smoother with uniformly distributed PB nanoparticles (Figure 2a,b). On P-rGO/SPCE, the two-dimensional rGO nanosheets were distributed evenly, except for some slight aggregates (Figure 2c). Both PB nanoparticles and rGO nanosheet-like structures were observed on P-rGO/PB/SPCE (Figure 2d). After LOXENs immobilization, the surface became predominantly smooth with small globe-like structures (Figure 2e). This globular morphology suggests good interactions between the P-rGO nanosheets and LOX.

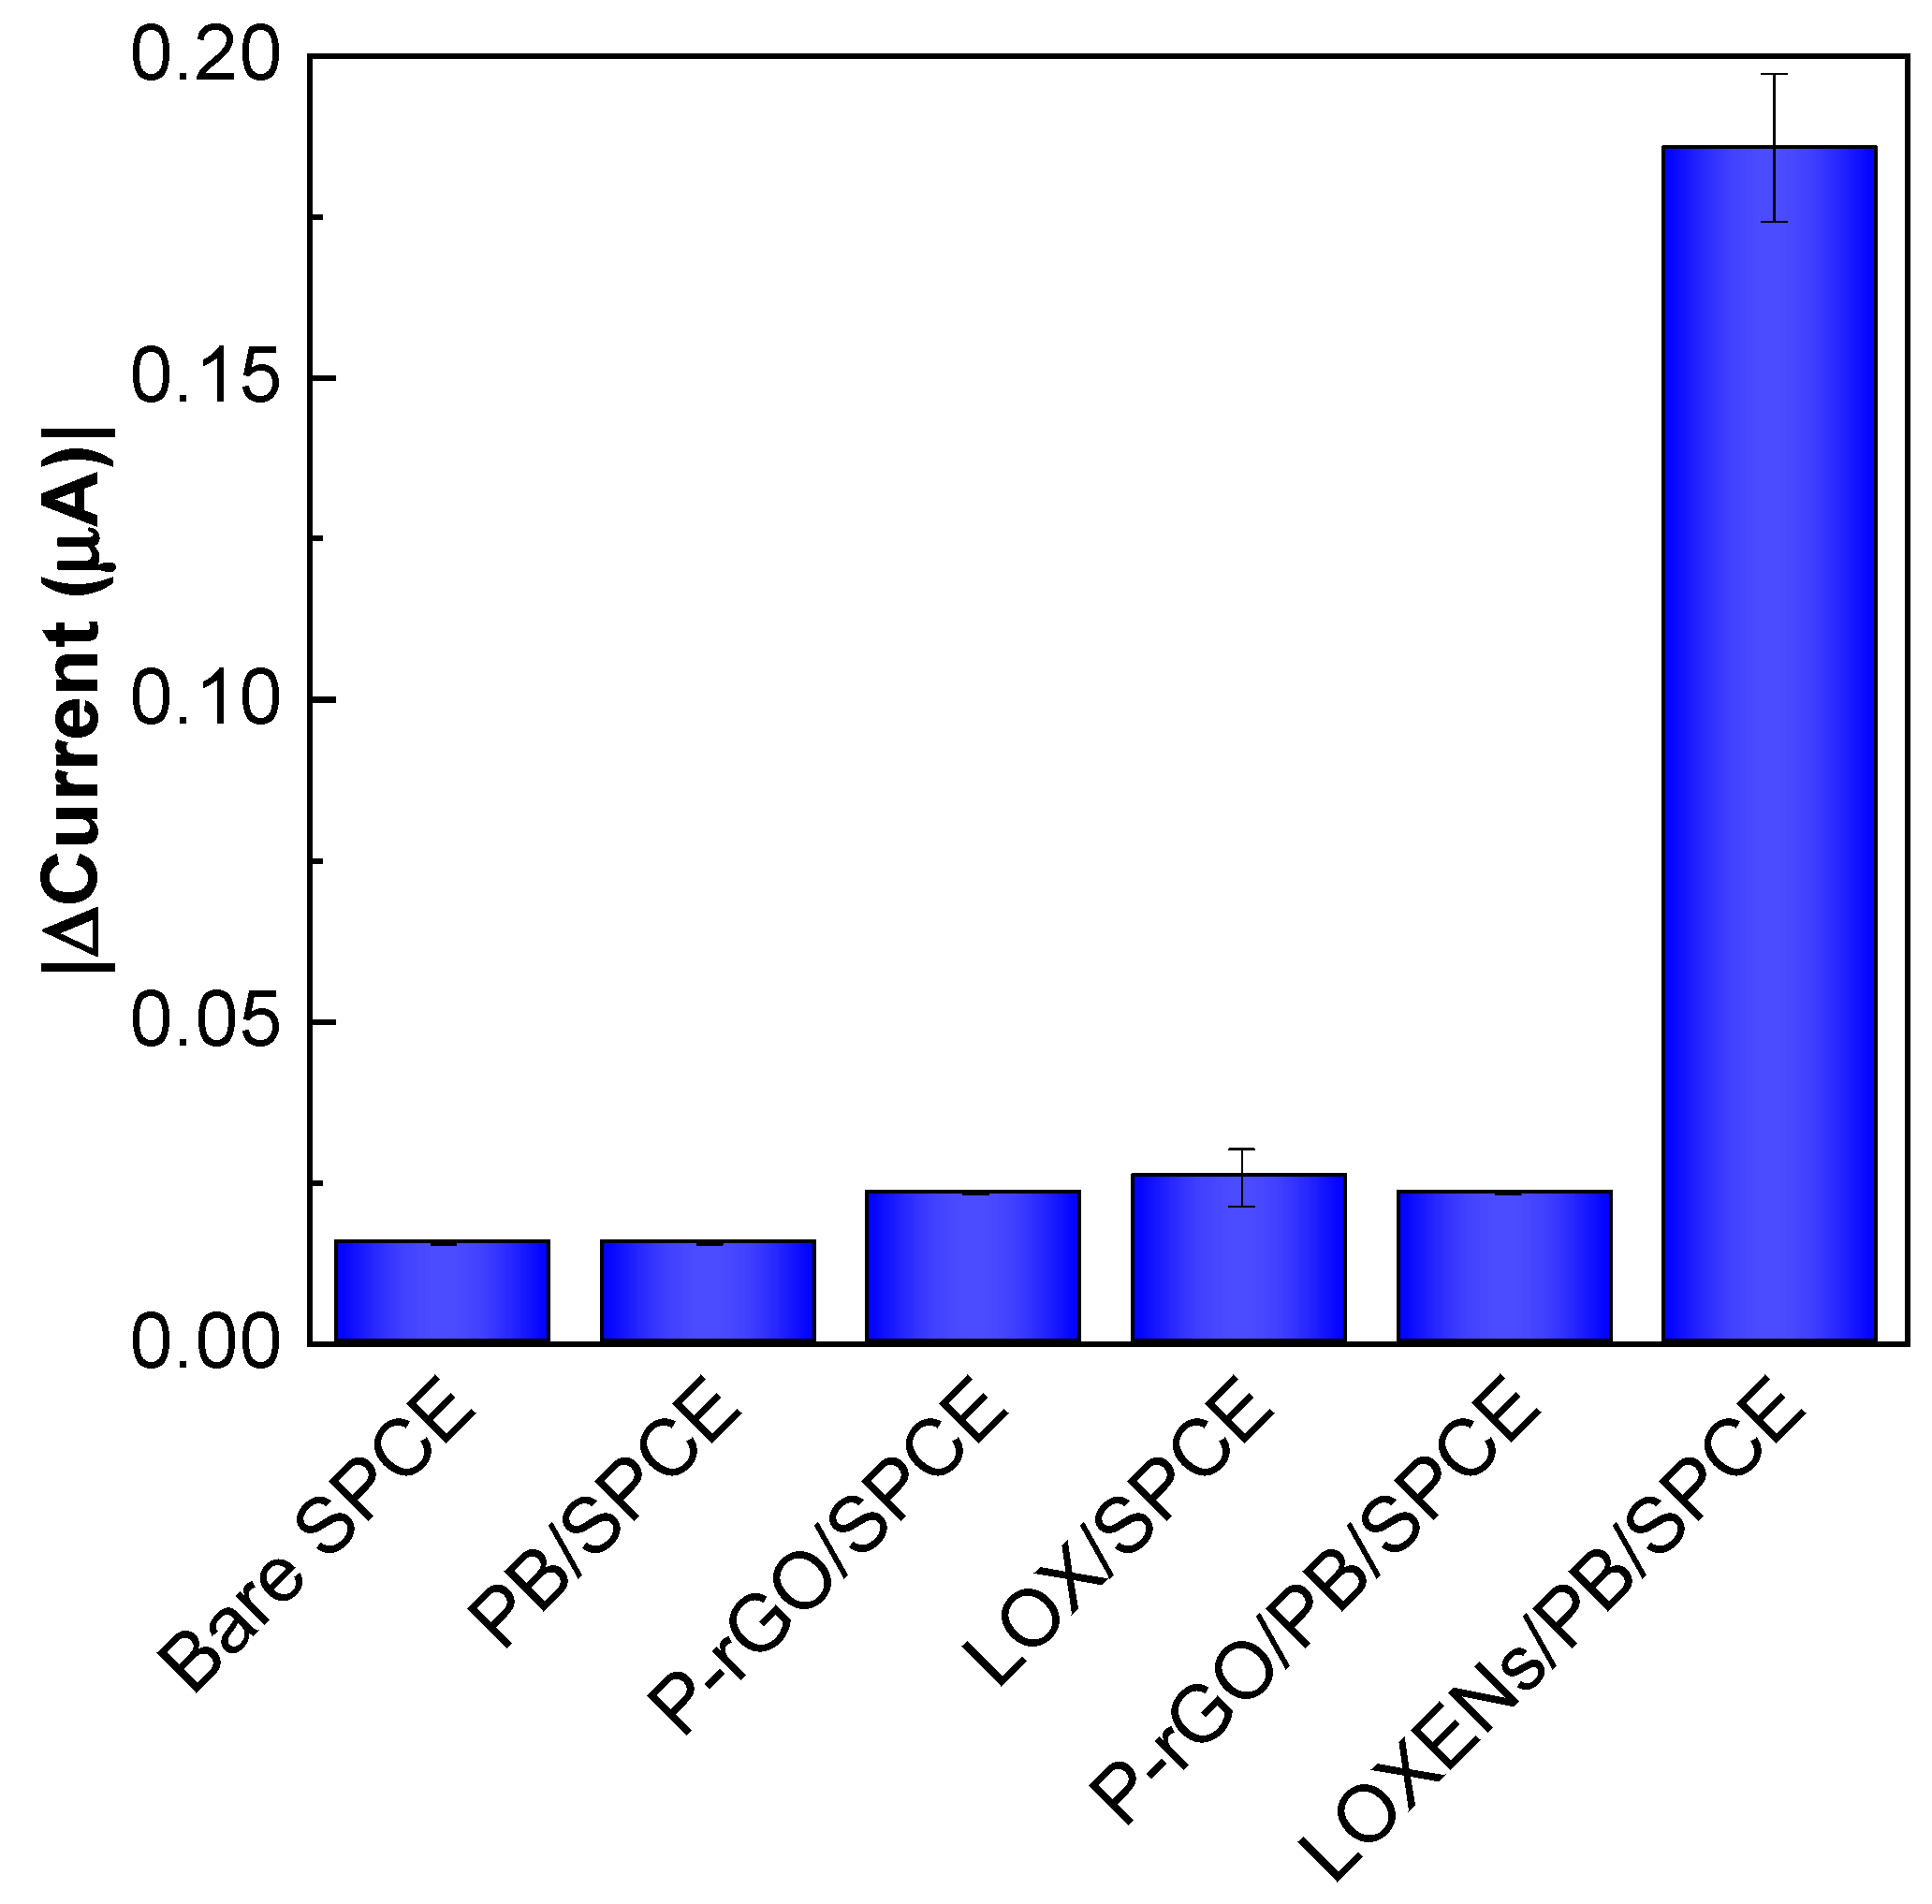
3.3. Electrochemical Characteristics of Biosensors

The modified biosensors (bare SPCE, PB/SPCE, P-rGO/PB/SPCE, and LOXENs/PB/SPCE) were electrochemically characterized by CV experiments. The Figure 3a represents the cyclic voltammograms of the biosensors in 5 mM K3[Fe(CN)6] prepared in 0.1 M KCl at the sweep rate of 50 mV s−1. In addition, the anodic peak currents (ipa) were measured and plotted for the modified biosensors (Figure 3b). The ipa values for bare SPCE, PB/SPCE, P-rGO/PB/SPCE, and LOXENs/PB/SPCE were 51.7, 180.4, 207.6, and 155.7 μA, respectively. All the modified biosensors including bare SPCE revealed distinguished redox peaks. The PB/SPCE, P-rGO/PB/SPCE, and LOXENs/PB/SPCE showed increased ipa values, indicating that the stepwise modifications of PB, P-rGO, and LOXENs improve the specific surface area of the biosensor as compared with bare SPCE. In comparison with P-rGO/PB/SPCE, the LOXENs/PB/SPCE exhibited a slightly decreased ipa value due to the presence of a relatively large enzyme molecule, that partially impedes electron transfer between the electrolyte and the biosensor. In addition, it confirms the successful formation of the LOXENs on the nanozyme modified biosensors.
Various biosensors (bare SPCE, PB/SPCE, P-rGO/SPCE, LOX/SPCE, P-rGO/PB/SPCE, and LOXENs/PB/SPCE) were electrochemically characterized by CA experiments using 100 µM lactate at an operating potential of −0.10 V. The CA current responses were measured 10 s after lactate addition, and the results are shown in Figure 4. Only LOXENs/PB/SPCE showed a significant increase in the current responses upon lactate addition. Even the biosensor modified with LOX alone (LOX/SPCE) had current responses similar to those of bare SPCE. In contrast, LOXENs/PB/SPCE demonstrated maximum current responses due to the presence of P-rGO, which provided biocompatibility and retained the bioactivity of LOX.

3.4. Optimization of Biosensor Performance

The LOXENs/PB/SPCE biosensors were further optimized in terms of the LOX enzyme loading, operating potential, and solution pH. Enzymes as macromolecules may impede electron transfer and compromise the sensitivity of biosensors. To optimize the LOX loading, biosensors were prepared by using various concentrations of LOX (6.125, 12.5, and 25.0 IU mL−1) with the P-rGO nanosheets. From the CA measurements (Figure 5a), the amperometric current responses increased as the enzyme concentration increased from 6.125 to 25.0 IU mL−1. Thus, 25.0 IU mL−1 was selected because of its increased bioactivity.
Next, the amperometric experiments were repeated using 100 µM lactate on P-rGO/PB/SPCE and LOXENs/PB/SPCE in the applied potential range of 0.0 to −0.30 V. As shown in Figure 5b, P-rGO/PB/SPCE exhibited only slight changes in its cathodic current response to lactate at −0.2 and −0.3 V. For LOXENs/PB/SPCE, the cathodic current response drastically increased as the applied potential became more negative. However, to minimize the influence of possible interferents at negative overpotential, a very low operating potential of −0.1 V was chosen.
Most enzymes have an optimal pH value at which they form suitable enzyme-substrate complexes and display maximal catalytic activity. In addition, it is well recognized that pH affects the enzyme conformation, which can diminish the enzyme’s affinity for the substrate. Therefore, the effect of pH on LOXENs/PB/SPCE was tested using 50 mM PBS at pH = 6.0–8.0. Upon the addition of lactate, maximum current responses were only observed near the neural pH (pH 7.4) instead of other pH values (Figure 5c). Moreover, arginine residues in the enzyme likely have a positive charge at near neutral pH, which would promote the enzyme’s affinity with the negatively charged PSSL copolymer backbone in P-rGO. In consideration of the enzyme stability and maximum bioactivity at physiological pH, pH 7.4 was chosen as the most suitable condition. Another study also reported that LOX shows maximum catalytic performance and stability at pH 7.4 [33], in accordance with our results.

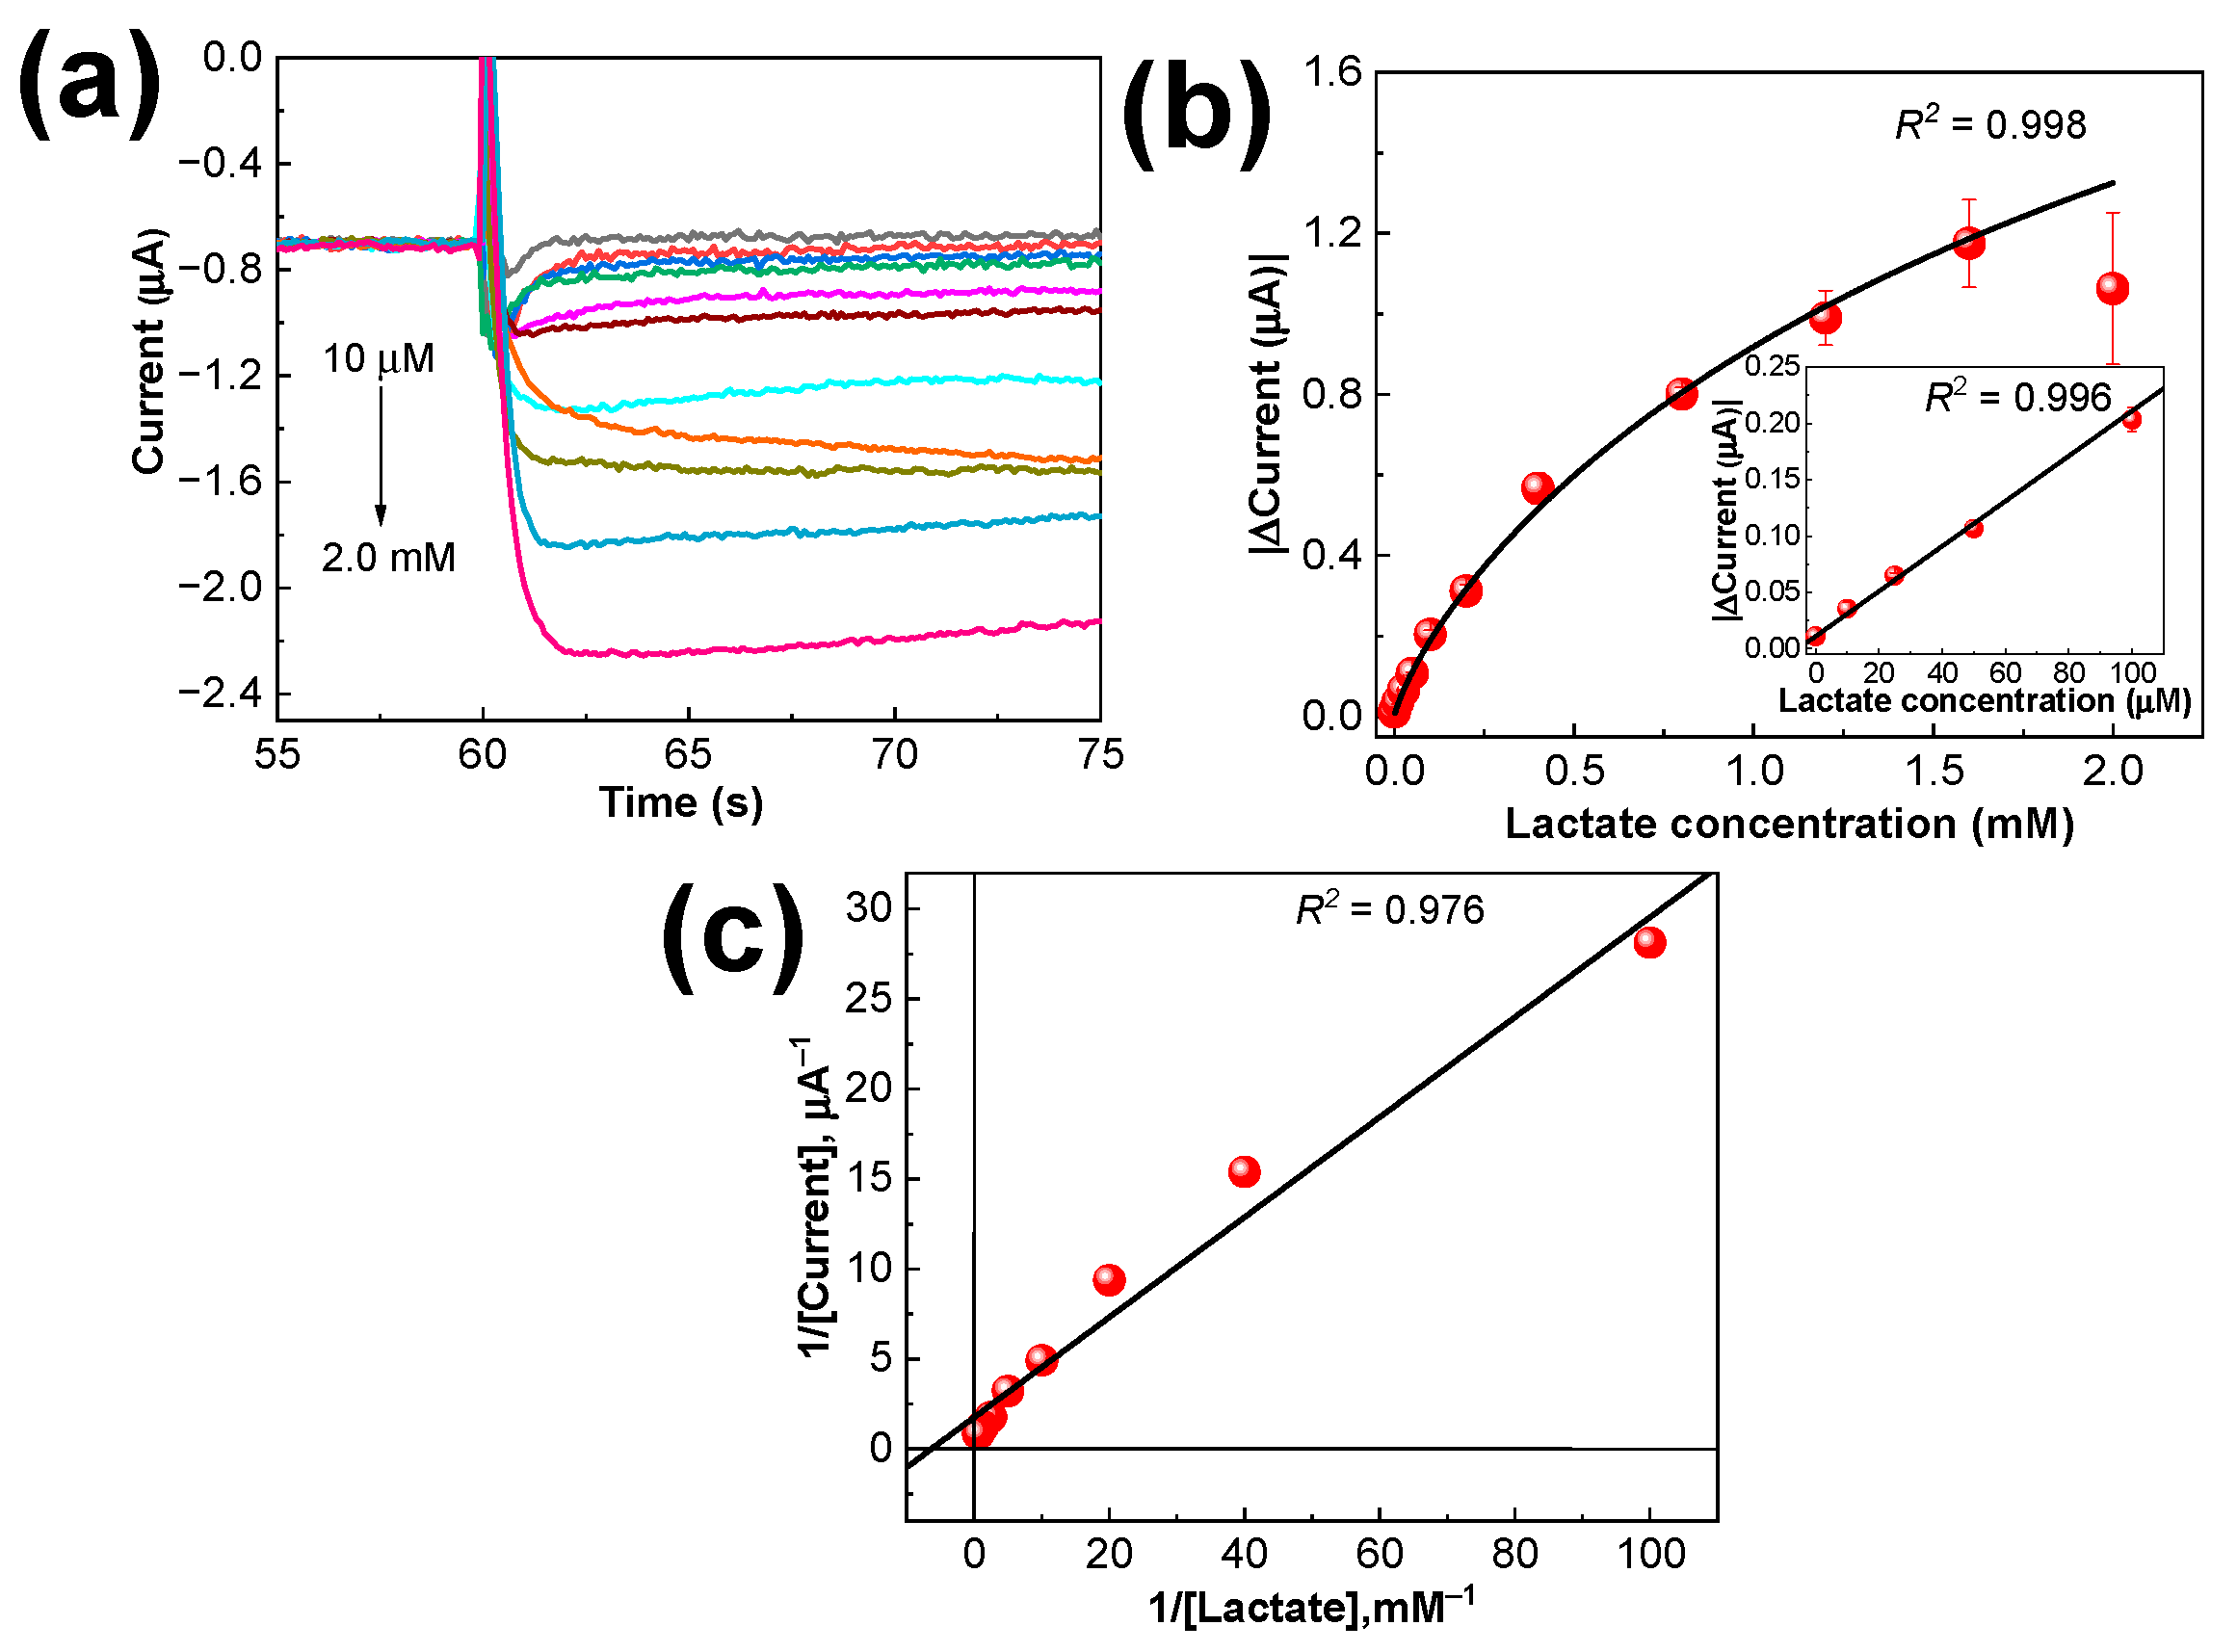
3.5. Calibration Plots

CA measurements were carried out for various concentrations of lactate (0.0, 0.01, 0.025, 0.05, 0.1, 0.2, 0.4, 0.8, 1.2, 1.6, and 2.0 mM) using LOXENs/PB/SPCE under the optimized conditions. As shown in Figure 6a, the current responses measured 10 s after lactate addition were stable and proportional to the added lactate concentration.
At higher lactate concentrations, however, the amperometric current responses became saturated. This saturation phenomenon due to lactate adsorption onto the nanozyme–enzyme nanosheet surface could be described by the Langmuir isotherm model. When the non-linear current responses were fitted with Langmuir isotherm model as given in Figure 6b and a high R2 value of 0.998 was obtained over a broad dynamic range of lactate concentration from 10 μM to 1.6 mM. LOXENs exhibits two discrete regions with regard to lactate concentration: namely the catalytic and inhibition regions. The initial catalytic region (10 μM to 1.6 mM lactate) results from a first-order reaction, and the reaction rate in this region is linear to the substrate concentration. A decreased current response was observed at 2 mM, which corresponds to a zero-order reaction. Therefore, the second region demonstrates an inhibition effect linked to the substrate, similar to a work reported elsewhere [34].
A linear calibration curve was constructed using data from the initial catalytic region (inset of Figure 6b). The plotted results are the average values of four measurements, with error bars indicating their standard deviation. The linear dynamic range was estimated to be 10–100 µM, and the regression equation is i (µA) = 0.002Clactate (µM)–0.0695, with R2 = 0.996 and a sensitivity of 15.9 µA mM−1 cm−2. The limit of detection (LOD) was 3.1 µM (S/N = 3). We calculated the limit of detection using the formula 3σ/m, where σ is the standard deviation of the blank and m is the slope obtained from the calibration curve using a standard approach [35]. Table 2 compares the analytical parameters of other amperometric lactate biosensors with our results. The sensitivity and LOD of our biosensor were comparable to the studies reported in Table 2. Additionally, the biosensor response (<10 s) was much faster than that in previous reports.

3.6. Kinetic Study of LOXENs

For lactate concentrations (10 µM to 1.6 mM), the biosensor response for the catalytic region was examined with the Michaelis–Menten kinetics. The Michaelis–Menten constant is an important parameter for determining the enzyme-substrate reaction kinetics, and it can be calculated using the Lineweaver–Burk equation as follows [32]:
1 i = 1 i m a x + K M i m a x 1 [ S ]
where i is the current, imax is the maximal current, KM is the Michaelis–Menten constant, and S is the substrate concentration. From the plot of 1/i vs. 1/[S] (Figure 6c), the two parameters were evaluated from the slope and intercept to be imax = 4.53 µA and KM = 0.158 mM. The obtained KM was lower than the previously reported value of 1.05 mM [34]. This decreased KM indicates retention of the original LOX conformation in LOXENs/PB/SPCE, which contributes to the higher affinity and activity of LOXENs toward the reaction of lactate.

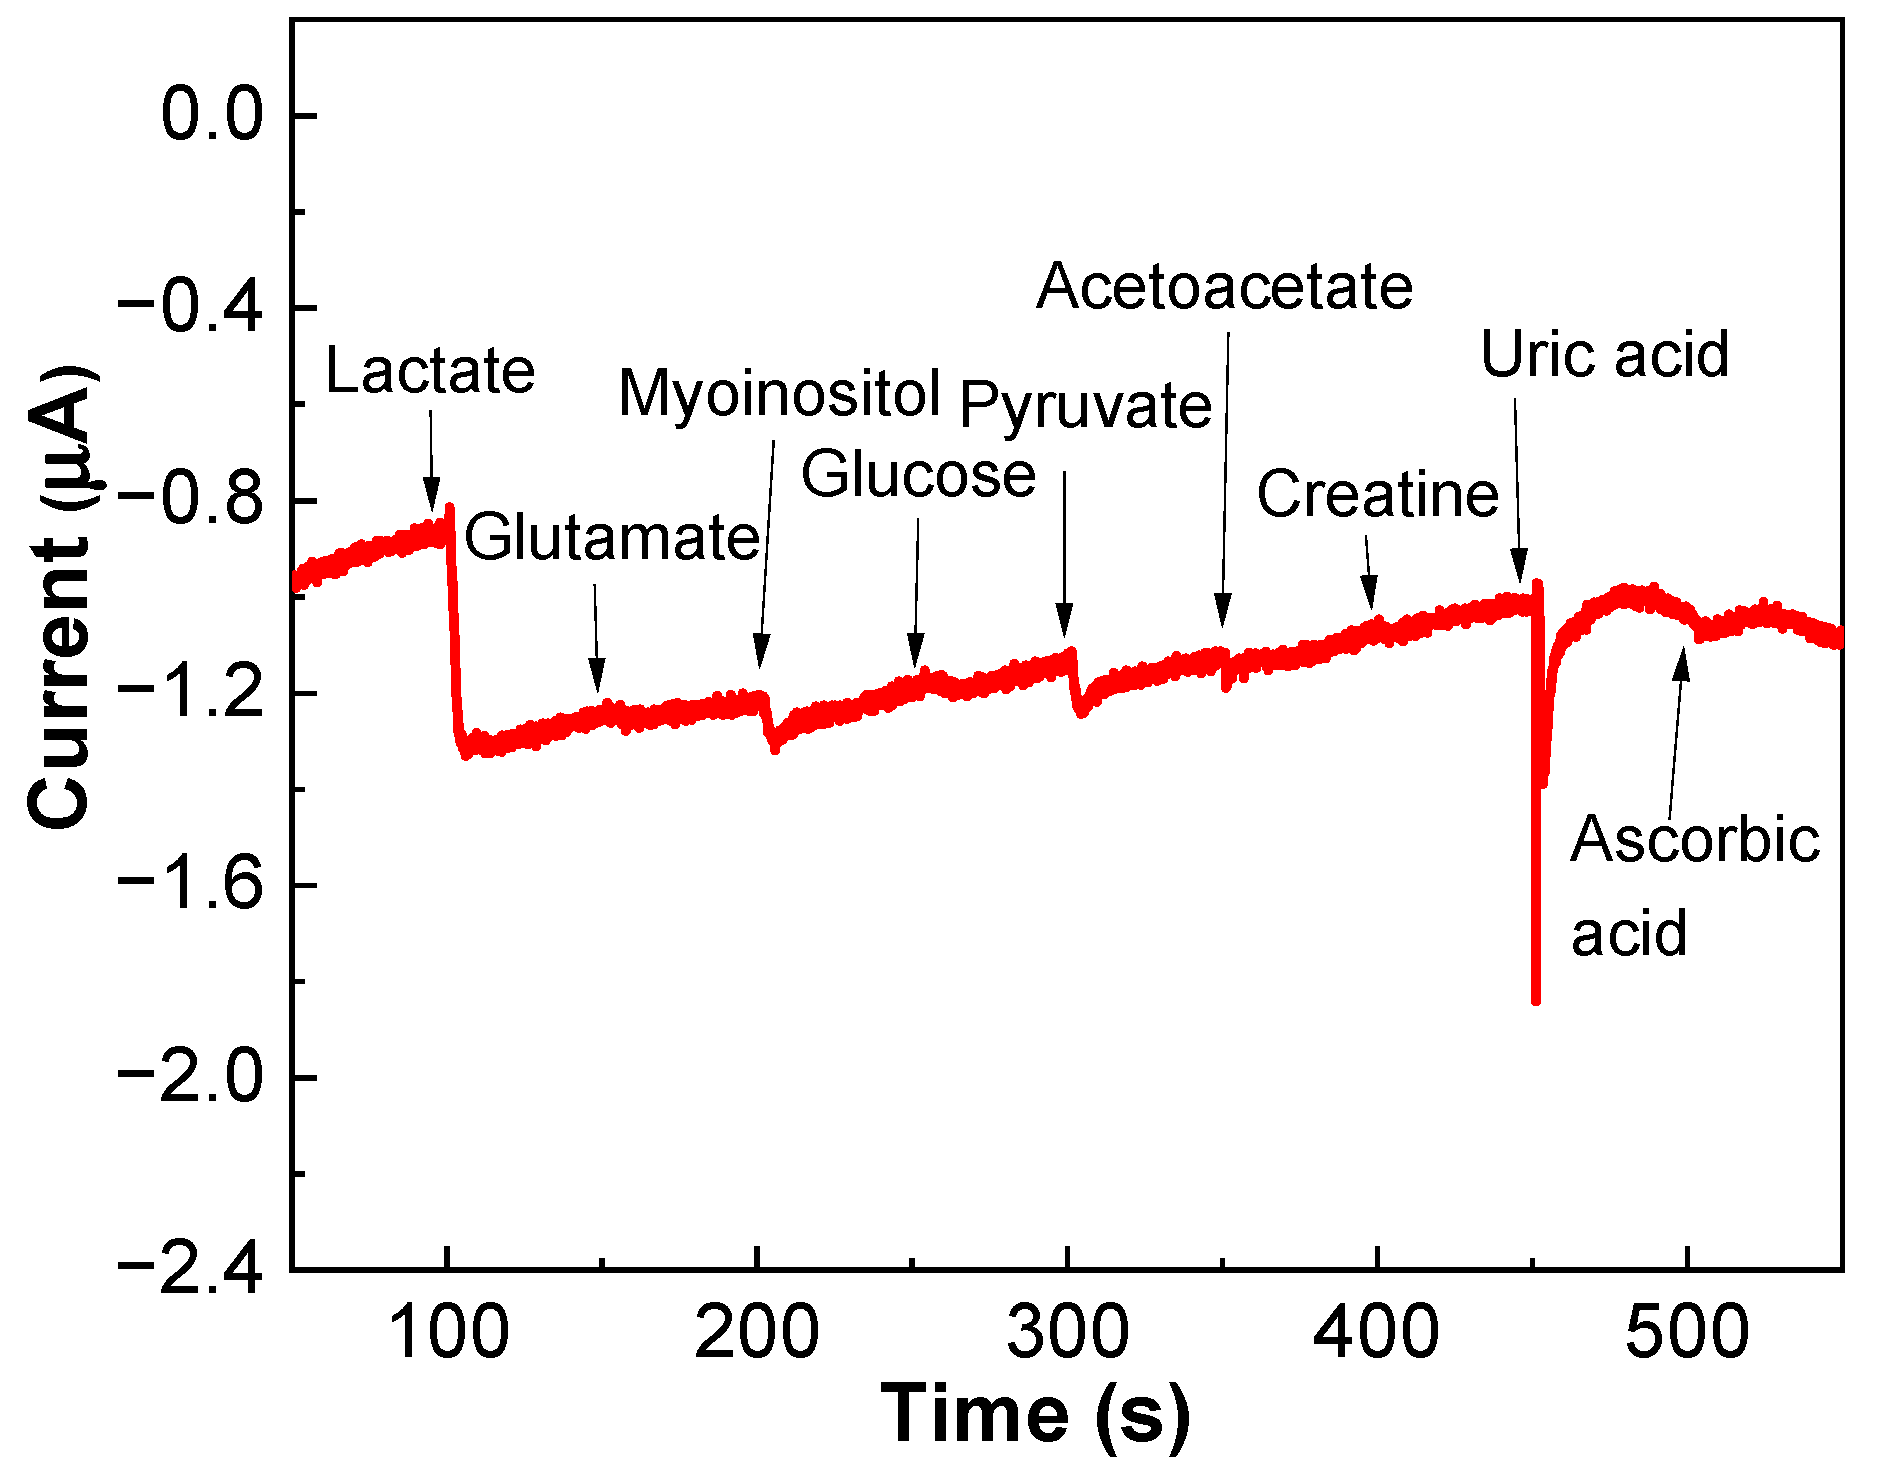
3.7. Interference Study

A biosensor’s resistance against interference is important for practical applications. Therefore, we tested the lactate sensing ability of LOXENs/PB/SPCE in the presence of common interfering species (100 µM each) at an applied potential of −0.1 V. According to Figure 7, the biosensor displayed rapid current response to lactate that was not impacted by co-existing interferents such as glutamate, glucose, acetoacetate, and creatine due to the substrate specificity. The additions of myoinositol, pyruvate, uric acid, and ascorbic acid exhibited less than 10% interference and therefore did not affect lactate detection. Although, on uric acid addition, a moderate level of noise and non-faradaic responses were recorded, it did not affect lactate detection. Moreover, it was reported that the mild operating potential of −0.1 V efficiently suppresses the interferences due to uric acid and ascorbic acid [44]. In particular, the anti-interference property of the biosensor is attributed to the electronegative sulfonate and disulfide functionalities in the PSSL copolymer backbone by actively repelling negatively charged species like uric acid and acetoacetate. These results suggest the possibility of selective lactate detection using LOXENs/PB/SPCE.

3.8. Reproducibility and Stability

Four individual LOXENs/PB/SPCE biosensors were employed to evaluate the reproducibility. The relative standard deviation was found to be 2.05% from four repeated measurements of the four biosensors, as shown in Figure S2a. The stability of the biosensors was assessed via CA experiments using 100 µM lactate. The biosensors were stored at 4 °C for up to 4 weeks and tested weekly (n = 2). The loss of initial current response was 8.6%, 15.9%, 19.2%, and 38.1% after 1, 2, 3, and 4 weeks. Even after 4 weeks, the sensor retained nearly 62% of the current response, proving the stability of nanozyme and LOXENs components in the biosensor (Figure S2b). Therefore, the biosensor exhibited good reproducibility and stability toward lactate detection.

3.9. Real Sample Testing

The practical applicability of the proposed biosensor was evaluated by determining the lactate concentration in spleen extracts from both the control and S. parauberis-infected groups of olive flounder using the standard addition method. The CA method for constructing the lactate calibration curve was followed, except that the spleen extracts replace the standard lactate solution. The results are presented in Table 3. The measured lactate concentration in the control group was 8.40 µM, whereas that in the S. parauberis-infected group was 29.9 µM (n = 4). The recovery percentage for the spiked infected samples was nearly acceptable and yet more studies are required. The lactate level in infected fish was approximately 3.5 times that of the control, suggesting increased lactate concentrations in the S. parauberis-infected group.
The reliability of the biosensor was verified by comparing the results to a standard calorimetric lactate assay kit. Following the standard kit protocol, a standard curve was obtained (Figure S3), which was used to determine the lactate concentrations of the control and S. parauberis-infected groups to be 10.2 and 27.2 µM, respectively. These values agree well with results measured using the biosensor, proving the feasibility of the biosensor for lactate detection in practical applications.

4. Conclusions

A simple and rapid lactate biosensor was fabricated based on nanozyme–enzyme nanosheets and successfully used to determine the lactate levels in S. parauberis-infected olive flounder. The conformation of LOX on the prepared LOXENs/PB/SPCE resulted in enhanced stability and biocompatibility. The biosensor features an improved sensitivity (15.9 μA mM−1 cm−2), a linear range of 10–100 μM, and a lower LOD (3.1 µM) for lactate detection. The mild operating potential used for detection (−0.1 V) not only enhances the selectivity toward lactate but also reduces the impact of easily oxidizable interferents. Additionally, the biosensor exhibited Langmuir-type responses up to a lactate concentration of 1.6 mM. The developed biosensor remained very stable over four weeks of storage and had high reproducibility. Moreover, the measurement results agreed with those obtained using the standard colorimetric lactate assay kit, proving the reliability of the biosensor. This fabricated biosensor is therefore an ideal tool for the rapid diagnosis of S. parauberis infection at fish farms.

Supplementary Materials

The following are available online at https://0-www-mdpi-com.brum.beds.ac.uk/article/10.3390/bios11110439/s1, Section S1: PB electrodeposition. Section S2: Synthesis of P-rGO. Figure S1: 1H-NMR spectra of spleen samples from the control (blue line) and S. parauberis infected fish (red line). (a) Lactate is represented as doublet peak at 1.33 ppm (1.326 and 1.338 ppm) and (b) quartet peak at 4.1 ppm in the 1H-NMR spectra, Figure S2: (a) Reproducibility of LOXENs/PB/SPCE in 100 μM lactate prepared in 50 mM PBS (pH 7.4). The error bars indicate the mean of four replicate measurements using each of four individual biosensors. (b) Stability of LOXENs/PB/SPCE after storage at 4 °C over a period of 4 weeks, Figure S3: Typical calibration curve of lactate standard obtained using calorimetric assay kit after background signal subtraction (n = 2 ± SD), Table S1: The concentrations of metabolites acquired by 1H-NMR spectroscopy from the spleen of olive flounder.

Author Contributions

Conceptualization, T.R., S.K. (Seonghye Kim), D.T., M.K. and S.-C.C.; methodology, T.R., S.K. (Seonghye Kim), D.T., M.K. and S.L.; software, T.R., S.K. (Seonghye Kim) and S.L.; validation, T.R., S.K. (Seonghye Kim), S.L., D.T. and M.K.; formal analysis, T.R., S.K. (Seonghye Kim), S.L. and M.K.; resources, S.-C.C. and S.K. (Suhkmann Kim); data curation, T.R. and S.K. (Seonghye Kim); writing—original draft preparation, T.R. and D.T.; writing—review and editing, T.R., S.K. (Seonghye Kim), D.T., H.-j.P., S.K. (Suhkmann Kim) and S.-C.C.; visualization, T.R., S.K. (Seonghye Kim), S.L. and D.T.; supervision, D.T., H.-j.P., S.K. (Suhkmann Kim) and S.-C.C.; project administration, H.-j.P., S.K. (Suhkmann Kim) and S.-C.C.; funding acquisition, S.K. (Suhkmann Kim) and S.-C.C. All authors have read and agreed to the published version of the manuscript.

Funding

This study was part of the project titled “Omics based on fishery disease control, technology development, and industrialization” funded by the Ministry of Oceans and Fisheries, Korea, grant number 20150242.

Institutional Review Board Statement

The study was conducted according to the guidelines of the Declaration of Helsinki, and approved by the Pukyong National University Institutional Animal Care Committee (PKNU-IACUC; Approval Number PKNU-2021-15 and the date of approval was 13 April 2021.

Informed Consent Statement

Not applicable.

Data Availability Statement

The data presented in this study are available on request from the corresponding author.

Acknowledgments

We thank Sivaguru Jayaraman for helpful discussions and software assistance during this research.

Conflicts of Interest

The authors declare no conflict of interest.

References

  1. Kim, D.-H.; Heo, M.-S. Characteristics and diagnostic methods of Streptococcosis causing disease in aquaculture. J. Life Sci. 2018, 28, 1118–1126. [Google Scholar] [CrossRef]
  2. Baeck, G.W.; Kim, J.H.; Gomez, D.K.; Park, S.C. Isolation and characterization of Streptococcus sp. from diseased flounder (Paralichthys olivaceus) in Jeju Island. J. Vet. Sci. 2006, 7, 53–58. [Google Scholar] [CrossRef] [PubMed] [Green Version]
  3. Park, Y.-K.; Nho, S.-W.; Shin, G.-W.; Park, S.-B.; Jang, H.-B.; Cha, I.-S.; Ha, M.-A.; Kim, Y.-R.; Dalvi, R.S.; Kang, B.-J.; et al. Antibiotic susceptibility and resistance of Streptococcus iniae and Streptococcus parauberis isolated from olive flounder (Paralichthys olivaceus). Vet. Microbiol. 2009, 136, 76–81. [Google Scholar] [CrossRef]
  4. Nho, S.-W.; Shin, G.-W.; Park, S.-B.; Jang, H.-B.; Cha, I.-S.; Ha, M.-A.; Kim, Y.-R.; Park, Y.-K.; Dalvi, R.S.; Kang, B.-J.; et al. Phenotypic characteristics of Streptococcus iniae and Streptococcus parauberis isolated from olive flounder (Paralichthys olivaceus). FEMS Microbiol. Lett. 2009, 293, 20–27. [Google Scholar] [CrossRef] [PubMed] [Green Version]
  5. Lee, Y.; Nguyen, T.L.; Kim, A.; Kim, N.; Roh, H.J.; Han, H.-J.; Jung, S.-H.; Cho, M.-Y.; Kang, H.Y.; Kim, D.-H. Complete genome sequence of multiple-antibiotic-resistant Streptococcus parauberis strain SPOF3K, isolated from diseased olive flounder (Paralichthys olivaceus). Genome Announc. 2018, 6, e00248-18. [Google Scholar] [CrossRef] [PubMed] [Green Version]
  6. Nho, S.W.; Hikima, J.; Cha, I.S.; Park, S.B.; Jang, H.B.; del Castillo, C.S.; Kondo, H.; Hirono, I.; Aoki, T.; Jung, T.S. Complete genome sequence and immunoproteomic analyses of the bacterial fish pathogen Streptococcus parauberis. J. Bacteriol. 2011, 193, 3356–3366. [Google Scholar] [CrossRef] [Green Version]
  7. Lee, Y.; Kim, N.; Roh, H.; Kim, A.; Han, H.-J.; Cho, M.; Kim, D.-H. Transcriptome analysis unveils survival strategies of Streptococcus parauberis against fish serum. PLoS ONE 2021, 16, e0252200. [Google Scholar] [CrossRef]
  8. Lee, A.-R.; Kim, H.; Jeon, K.-Y.; Ko, E.-J.; Kim, A.; Kim, N.; Roh, H.; Lee, Y.; Park, J.; Kim, D.-H.; et al. Differential proteome profile of gill and spleen in three pathogen-infected Paralichthys olivaceus. Genes Genom. 2021, 43, 1–12. [Google Scholar] [CrossRef]
  9. Mishra, A.; Nam, G.-H.; Gim, J.-A.; Lee, H.-E.; Jo, A.; Kim, H.-S. Current challenges of Streptococcus infection and effective molecular, cellular, and environmental control methods in aquaculture. Mol. Cells 2018, 41, 495. [Google Scholar] [CrossRef]
  10. Mata, A.I.; Gibello, A.; Casamayor, A.; Blanco, M.M.; Domínguez, L.; Fernández-Garayzábal, J.F. Multiplex PCR assay for detection of bacterial pathogens associated with warm-water streptococcosis in fish. Appl. Environ. Microbiol. 2004, 70, 3183–3187. [Google Scholar] [CrossRef] [Green Version]
  11. Lau, S.K.; Woo, P.C.; Luk, W.-K.; Fung, A.M.; Hui, W.-T.; Fong, A.H.; Chow, C.-W.; Wong, S.S.; Yuen, K.-Y. Clinical isolates of Streptococcus iniae from Asia are more mucoid and β-hemolytic than those from North America. Diagn. Microbiol. Infect. Dis. 2006, 54, 177–181. [Google Scholar] [CrossRef]
  12. Facklam, R.; Elliott, J.; Shewmaker, L.; Reingold, A. Identification and characterization of sporadic isolates of Streptococcus iniae isolated from humans. J. Clin. Microbiol. 2005, 43, 933–937. [Google Scholar] [CrossRef] [Green Version]
  13. Dodson, S.V.; Maurer, J.J.; Shotts, E.B. Biochemical and molecular typing of Streptococcus iniae isolated from fish and human cases. J. Fish Dis. 2001, 22, 331–336. [Google Scholar] [CrossRef]
  14. Tounta, V.; Liu, Y.; Cheyne, A.; Larrouy-Maumus, G. Metabolomics in infectious diseases and drug discovery. Mol. Omics 2021, 17, 376–393. [Google Scholar] [CrossRef]
  15. Solanky, K.S.; Burton, I.W.; MacKinnon, S.L.; Walter, J.A.; Dacanay, A. Metabolic changes in Atlantic salmon exposed to Aeromonas salmonicida detected by 1H-nuclear magnetic resonance spectroscopy of plasma. Dis. Aquat. Org. 2005, 65, 107–114. [Google Scholar] [CrossRef]
  16. Cheng, Z.-X.; Ma, Y.-M.; Li, H.; Peng, X.-X. N-acetylglucosamine enhances survival ability of tilapias infected by Streptococcus iniae. Fish Shellfish Immunol. 2014, 40, 524–530. [Google Scholar] [CrossRef]
  17. Ma, Y.-M.; Yang, M.-J.; Wang, S.; Li, H.; Peng, X.-X. Liver functional metabolomics discloses an action of L-leucine against Streptococcus iniae infection in tilapias. Fish Shellfish Immunol. 2015, 45, 414–421. [Google Scholar] [CrossRef] [PubMed]
  18. Zhao, X.-L.; Han, Y.; Ren, S.-T.; Ma, Y.-M.; Li, H.; Peng, X.-X. L-proline increases survival of tilapias infected by Streptococcus agalactiae in higher water temperature. Fish Shellfish Immunol. 2015, 44, 33–42. [Google Scholar] [CrossRef]
  19. Guidi, L.R.; Santos, F.A.; Ribeiro, A.C.S.R.; Fernandes, C.; Silva, L.H.M.; Gloria, M.B.A. A simple, fast and sensitive screening LC-ESI-MS/MS method for antibiotics in fish. Talanta 2017, 163, 85–93. [Google Scholar] [CrossRef] [PubMed]
  20. Du, H.; Fu, J.; Wang, S.; Liu, H.; Zeng, Y.; Yang, J.; Xiong, S. 1H-NMR metabolomics analysis of nutritional components from two kinds of freshwater fish brain extracts. RSC Adv. 2018, 8, 19470–19478. [Google Scholar] [CrossRef] [Green Version]
  21. Purohit, B.; Kumar, A.; Mahato, K.; Chandra, P. Novel sensing assembly comprising engineered gold dendrites and MWCNT-AuNPs nanohybrid for acetaminophen detection in human urine. Electroanalysis 2020, 32, 561–570. [Google Scholar] [CrossRef]
  22. Romero, M.R.; Garay, F.; Baruzzi, A.M. Design and optimization of a lactate amperometric biosensor based on lactate oxidase cross-linked with polymeric matrixes. Sens. Actuators B Chem. 2008, 131, 590–595. [Google Scholar] [CrossRef]
  23. Mahmudunnabi, R.G.; Farhana, N.F.; Kashaninejad, Z.; Firoz, S.H.; Shim, Y.; Shiddiky, M.J.A. Nanozymes-based electrochemical biosensors for disease biomarker detection. Analyst 2020, 145, 4398–4420. [Google Scholar] [CrossRef]
  24. Xuan, X.; Pérez-Ràfols, C.; Chen, C.; Cuartero, M.; Crespo, G.A. Lactate Biosensing for Reliable On-Body Sweat Analysis. ACS Sens. 2021, 6, 2763–2771. [Google Scholar] [CrossRef]
  25. Vokhmyanina, D.V.; Andreeva, K.D.; Komkova, M.A.; Karyakina, E.E.; Karyakin, A.A. ‘Artificial peroxidase’ nanozyme–enzyme based lactate biosensor. Talanta 2020, 208, 120393. [Google Scholar] [CrossRef] [PubMed]
  26. Ricci, F.; Amine, A.; Palleschi, G.; Moscone, D. Prussian Blue based screen printed biosensors with improved characteristics of long-term lifetime and pH stability. Biosens. Bioelectron. 2003, 18, 165–174. [Google Scholar] [CrossRef] [Green Version]
  27. Goran, J.M.; Lyon, J.L.; Stevenson, K.J. Amperometric detection of l-lactate using nitrogen-doped carbon nanotubes modified with lactate oxidase. Anal. Chem. 2011, 83, 8123–8129. [Google Scholar] [CrossRef] [PubMed]
  28. Shimomura, T.; Sumiya, T.; Ono, M.; Ito, T.; Hanaoka, T.A. Amperometric L-lactate biosensor based on screen-printed carbon electrode containing cobalt phthalocyanine, coated with lactate oxidase-mesoporous silica conjugate layer. Anal. Chim. Acta 2012, 714, 114–120. [Google Scholar] [CrossRef]
  29. Uzunoglu, A.; Ramirez, I.; Andreasen, E.; Stanciu, L.A. Layer by layer construction of ascorbate interference-free amperometric lactate biosensors with lactate oxidase, ascorbate oxidase, and ceria nanoparticles. Microchim. Acta 2016, 183, 1667–1675. [Google Scholar] [CrossRef]
  30. Cunha-Silva, H.; Arcos-Martinez, M.J. Dual range lactate oxidase-based screen printed amperometric biosensor for analysis of lactate in diversified samples. Talanta 2018, 188, 779–787. [Google Scholar] [CrossRef]
  31. Rajarathinam, T.; Kwon, M.; Thirumalai, D.; Kim, S.; Lee, S.; Yoon, J.-H.; Paik, H.-j.; Kim, S.; Lee, J.; Ha, H.K.; et al. Polymer-dispersed reduced graphene oxide nanosheets and Prussian blue modified biosensor for amperometric detection of sarcosine. Anal. Chim. Acta 2021, 1175, 338749. [Google Scholar] [CrossRef]
  32. Wu, H.F.; Southam, A.D.; Hines, A.; Viant, M.R. High-throughput tissue extraction protocol for NMR- and MS-based metabolomics. Anal. Biochem. 2008, 372, 204–212. [Google Scholar] [CrossRef] [PubMed]
  33. Petropoulos, K.; Piermarini, S.; Bernardini, S.; Palleschi, G.; Moscone, D. Development of a disposable biosensor for lactate monitoring in saliva. Sens. Actuators B Chem. 2016, 237, 8–15. [Google Scholar] [CrossRef]
  34. Cunha-Silva, H.; Pires, F.; Dias-Cabral, A.C.; Arcos-Martinez, M.J. Inhibited enzymatic reaction of crosslinked lactate oxidase through a pH-dependent mechanism. Colloids Surf. B 2019, 184, 110490. [Google Scholar] [CrossRef]
  35. Mocak, J.; Bond, A.M.; Mitchell, S.; Scollary, G. A statistical overview of standard (IUPAC and ACS) and new procedures for determining the limits of detection and quantification: Application to voltammetric and stripping techniques (technical report). Pure Appl. Chem. 1997, 69, 297–328. [Google Scholar] [CrossRef]
  36. Lamas-Ardisana, P.J.; Loaiza, O.A.; Anorga, L.; Jubete, E.; Borghei, M.; Ruiz, V.; Ochoteco, E.; Cabanero, G.; Grande, H.J. Disposable amperometric biosensor based on lactate oxidase immobilised on platinum nanoparticle-decorated carbon nanofiber and poly(diallyldimethylammonium chloride) films. Biosens. Bioelectron. 2014, 56, 345–351. [Google Scholar] [CrossRef] [PubMed]
  37. Patel, N.G.; Erlenkötter, A.; Cammann, K.; Chemnitius, G.-C. Fabrication and characterization of disposable type lactate oxidase sensors for dairy products and clinical analysis. Sens. Actuators B Chem. 2000, 67, 134–141. [Google Scholar] [CrossRef]
  38. Ghamouss, F.; Ledru, S.; Ruille, N.; Lantier, F.; Boujtita, M. Bulk-modified modified screen-printing carbon electrodes with both lactate oxidase (LOD) and horseradish peroxide (HRP) for the determination of L-lactate in flow injection analysis mode. Anal. Chim. Acta 2006, 570, 158–164. [Google Scholar] [CrossRef]
  39. Suman, S.; Singhal, R.; Sharma, A.L.; Malthotra, B.D.; Pundir, C.S. Development of a lactate biosensor based on conducting copolymer bound lactate oxidase. Sens. Actuators B 2005, 107, 768–772. [Google Scholar] [CrossRef]
  40. Gavalas, V.G.; Chaniotakis, N.A. Polyelectrolyte stabilized oxidase based biosensors: Effect of diethylaminoethyl-dextran on the stabilization of glucose and lactate oxidases into porous conductive carbon. Anal. Chim. Acta 2000, 404, 67–73. [Google Scholar] [CrossRef]
  41. Wang, R.; Zhai, Q.; An, T.; Gong, S.; Cheng, W. Stretchable gold fiber-based wearable textile electrochemical biosensor for lactate monitoring in sweat. Talanta 2021, 222, 121484. [Google Scholar] [CrossRef] [PubMed]
  42. Jia, W.; Bandodkar, A.J.; Valdes-Ramirez, G.; Windmiller, J.R.; Yang, Z.; Ramirez, J.; Chan, G.; Wang, J. Electrochemical tattoo biosensors for real-time noninvasive lactate monitoring in human perspiration. Anal. Chem. 2013, 85, 6553–6560. [Google Scholar] [CrossRef]
  43. Vinoth, R.; Nakagawa, T.; Mathiyarasu, J.; Mohan, A.M.V. Fully Printed Wearable Microfluidic Devices for High-Throughput Sweat Sampling and Multiplexed Electrochemical Analysis. ACS Sens. 2021, 6, 1174–1186. [Google Scholar] [CrossRef] [PubMed]
  44. Takeda, K.; Kusuoka, R.; Inukai, M.; Igarashi, K.; Ohno, H.; Nakamura, N. An amperometric biosensor of L-fucose in urine for the first screening test of cancer. Biosens. Bioelectron. 2021, 174, 112831. [Google Scholar] [CrossRef] [PubMed]
Scheme 1. Design and mechanism of the proposed lactate biosensor.
Biosensors 11 00439 sch001
Figure 1. (a) Concentrations of lactate as potential biomarker identified through NMR spectroscopy. (b) ROC analysis result for lactate.
Biosensors 11 00439 g001
Figure 2. FE-SEM images of (a) bare SPCE, (b) PB/SPCE, (c) P-rGO/SPCE, (d) P-rGO/PB/SPCE, and (e) LOXENs/PB/SPCE.
Biosensors 11 00439 g002
Figure 3. (a) CV results of the modified biosensors (bare SPCE, PB/SPCE, P-rGO/PB/SPCE, and LOXENs/PB/SPCE) in 5 mM K3[Fe(CN)6] prepared in 0.1 M KCl at 50 mV s−1. (b) The corresponding ipa values plot.
Biosensors 11 00439 g003
Figure 4. CA current changes of biosensors in 50 mM PBS (pH 7.4) after adding 100 µM lactate.
Biosensors 11 00439 g004
Figure 5. (a) Current changes in response to 100 µM lactate for LOXENs/PB/SPCE fabricated using various loadings of LOX. (b) Current changes under various applied potentials for P-rGO/PB/SPCE and LOXENs/PB/SPCE in 50 mM PBS (pH 7.4). (c) Current changes to 100 µM lactate solution prepared in PBS (50 mM, various pH) for LOXENs/PB/SPCE.
Biosensors 11 00439 g005
Figure 6. (a) Amperometric results of LOXENs/PB/SPCEs at −0.1 V in 50 mM PBS (pH 7.4) with successive additions of lactate. (b) Fitting the Langmuir model to the current responses (measured 10 s after lactate addition) to a maximum of 1.6 mM lactate. Inset: Calibration curve for lactate concentrations up to 100 µM. (c) Lineweaver–Burk model fitting to the catalytic region using the current responses to lactate additions up to 1.6 mM (n = 4).
Biosensors 11 00439 g006
Figure 7. Chronoamperometric results of LOXENs/PB/SPCE in PBS (pH 7.4) at –0.1 V, following successive addition of 100 µM each of lactate, glutamate, myoinositol, glucose, pyruvate, acetoacetate, creatine, uric acid, and ascorbic acid.
Biosensors 11 00439 g007
Table 1. Comparison of lactate concentration in the spleen of control and S. parauberis-infected olive flounder.
MetaboliteConcentration (mM, Mean ± SD)p Value
Adjusted by FDR
ROC Analysis
ControlS. parauberisAUC
(95% CI)
SensitivitySpecificity 
Lactate0.014 ± 0.0060.035 ± 0.0081.59 × 10−40.978
(0.877−1)
90%100%
SD: standard deviation, FDR: false discovery rate, ROC: receiver operating characteristics, AUC: area under the curve.
Table 2. Comparison of the state-of-the-art analytical performance of various amperometric lactate biosensors.
BiosensorsOperating Potential
vs. Ag/AgCl (V)
Linear Range
(μM)
LOD
(µM)
Response Time
(s)
Sensitivity
(µA mM−1 cm−2)
References
LOX/PtNp–CNF–PDDA/SPCEs0.5025–1500-1136.8[36]
LOX–FSM8.0/Naf/CoPC–SPCEs0.4518.3–150018.3904.54[28]
LOX/Pt/SPCE0.600–10000.5500.448[37]
HRP/LOX/SPCE–0.1010–180 -0.00084[38]
LOX/albumin–mucin hydrogel/Pt disc0.650.70–15000.7900.79[22]
LOX/poly (An-co-FAn) film0.40100–5500100501.18[39]
LOX/Polyelectrolyte/Porous carbon electrode0.6075–10001020–6015.59[40]
PB/LOx/chitosan coated gold fiber−0.100–30,000137-19.13[41]
LOx/TTF/MWCNT/Printed tattoo electrode0.0500–20,000-continuous 30 min10.31[42]
LOX–chit–CNT/TTF–CNT/Au−0.170–24000--68 [43]
LOXENs/PB/SPCE−0.1010–1003.11015.9This work
PtNp: platinum nanoparticle, CNF: carbon nanofibers, PDDA: poly(diallyldimethylammonium) chloride, FSM8.0: mesoporous silica, Naf: Nafion, CoPC: cobalt phthalocyanine, HRP: horseradish peroxidase, poly (An-co-FAn): poly(aniline-co-fluoroaniline), TTF: tetrathiafulvalene, MWCNT: multiwalled carbon nanotubes, chit: chitosan, CNT: carbon nanotubes, Au: gold.
Table 3. Comparison of lactate concentrations measured in control and S. parauberis-infected fish spleen samples using the biosensor and the colorimetric assay kit.
MethodsSamplesAdded (µM)Found ± SD (µM)Recovery (%)RSD (%)
Proposed biosensorControl group08.40 ± 2.4-28.6
50116.3 ± 6.0199.25.1
100181.6 ± 5.2167.62.8
150229.4 ± 7.2144.93.1
S. parauberis infected group029.9 ± 8.2-27.4
50129.3 ± 2.7161.82.1
100237.4 ± 2.7182.71.1
150303.0 ± 2.7168.40.9
Colorimetric assay kitControl 10.2
S. parauberis infected group 27.2
SD: standard deviation, RSD: relative standard deviation.
Publisher’s Note: MDPI stays neutral with regard to jurisdictional claims in published maps and institutional affiliations.

