Raman Scattering-Based Biosensing: New Prospects and Opportunities
by
 , and
, and
Kseniya V. Serebrennikova
, 
Anna N. Berlina
,
Dmitriy V. Sotnikov
,
Anatoly V. Zherdev
 and
and
Boris B. Dzantiev
* A.N. Bach Institute of Biochemistry, Research Center of Biotechnology, Russian Academy of Sciences, 119071 Moscow, Russia
*
Author to whom correspondence should be addressed.
Biosensors 2021, 11(12), 512; https://0-doi-org.brum.beds.ac.uk/10.3390/bios11120512
Submission received: 12 November 2021
/
Revised: 10 December 2021
/
Accepted: 11 December 2021
/
Published: 13 December 2021
(This article belongs to the Special Issue Surface Enhanced Raman Spectroscopy Based Sensors and Biosensors)
Abstract
:The growing interest in the development of new platforms for the application of Raman spectroscopy techniques in biosensor technologies is driven by the potential of these techniques in identifying chemical compounds, as well as structural and functional features of biomolecules. The effect of Raman scattering is a result of inelastic light scattering processes, which lead to the emission of scattered light with a different frequency associated with molecular vibrations of the identified molecule. Spontaneous Raman scattering is usually weak, resulting in complexities with the separation of weak inelastically scattered light and intense Rayleigh scattering. These limitations have led to the development of various techniques for enhancing Raman scattering, including resonance Raman spectroscopy (RRS) and nonlinear Raman spectroscopy (coherent anti-Stokes Raman spectroscopy and stimulated Raman spectroscopy). Furthermore, the discovery of the phenomenon of enhanced Raman scattering near metallic nanostructures gave impetus to the development of the surface-enhanced Raman spectroscopy (SERS) as well as its combination with resonance Raman spectroscopy and nonlinear Raman spectroscopic techniques. The combination of nonlinear and resonant optical effects with metal substrates or nanoparticles can be used to increase speed, spatial resolution, and signal amplification in Raman spectroscopy, making these techniques promising for the analysis and characterization of biological samples. This review provides the main provisions of the listed Raman techniques and the advantages and limitations present when applied to life sciences research. The recent advances in SERS and SERS-combined techniques are summarized, such as SERRS, SE-CARS, and SE-SRS for bioimaging and the biosensing of molecules, which form the basis for potential future applications of these techniques in biosensor technology. In addition, an overview is given of the main tools for success in the development of biosensors based on Raman spectroscopy techniques, which can be achieved by choosing one or a combination of the following approaches: (i) fabrication of a reproducible SERS substrate, (ii) synthesis of the SERS nanotag, and (iii) implementation of new platforms for on-site testing.
1. Introduction
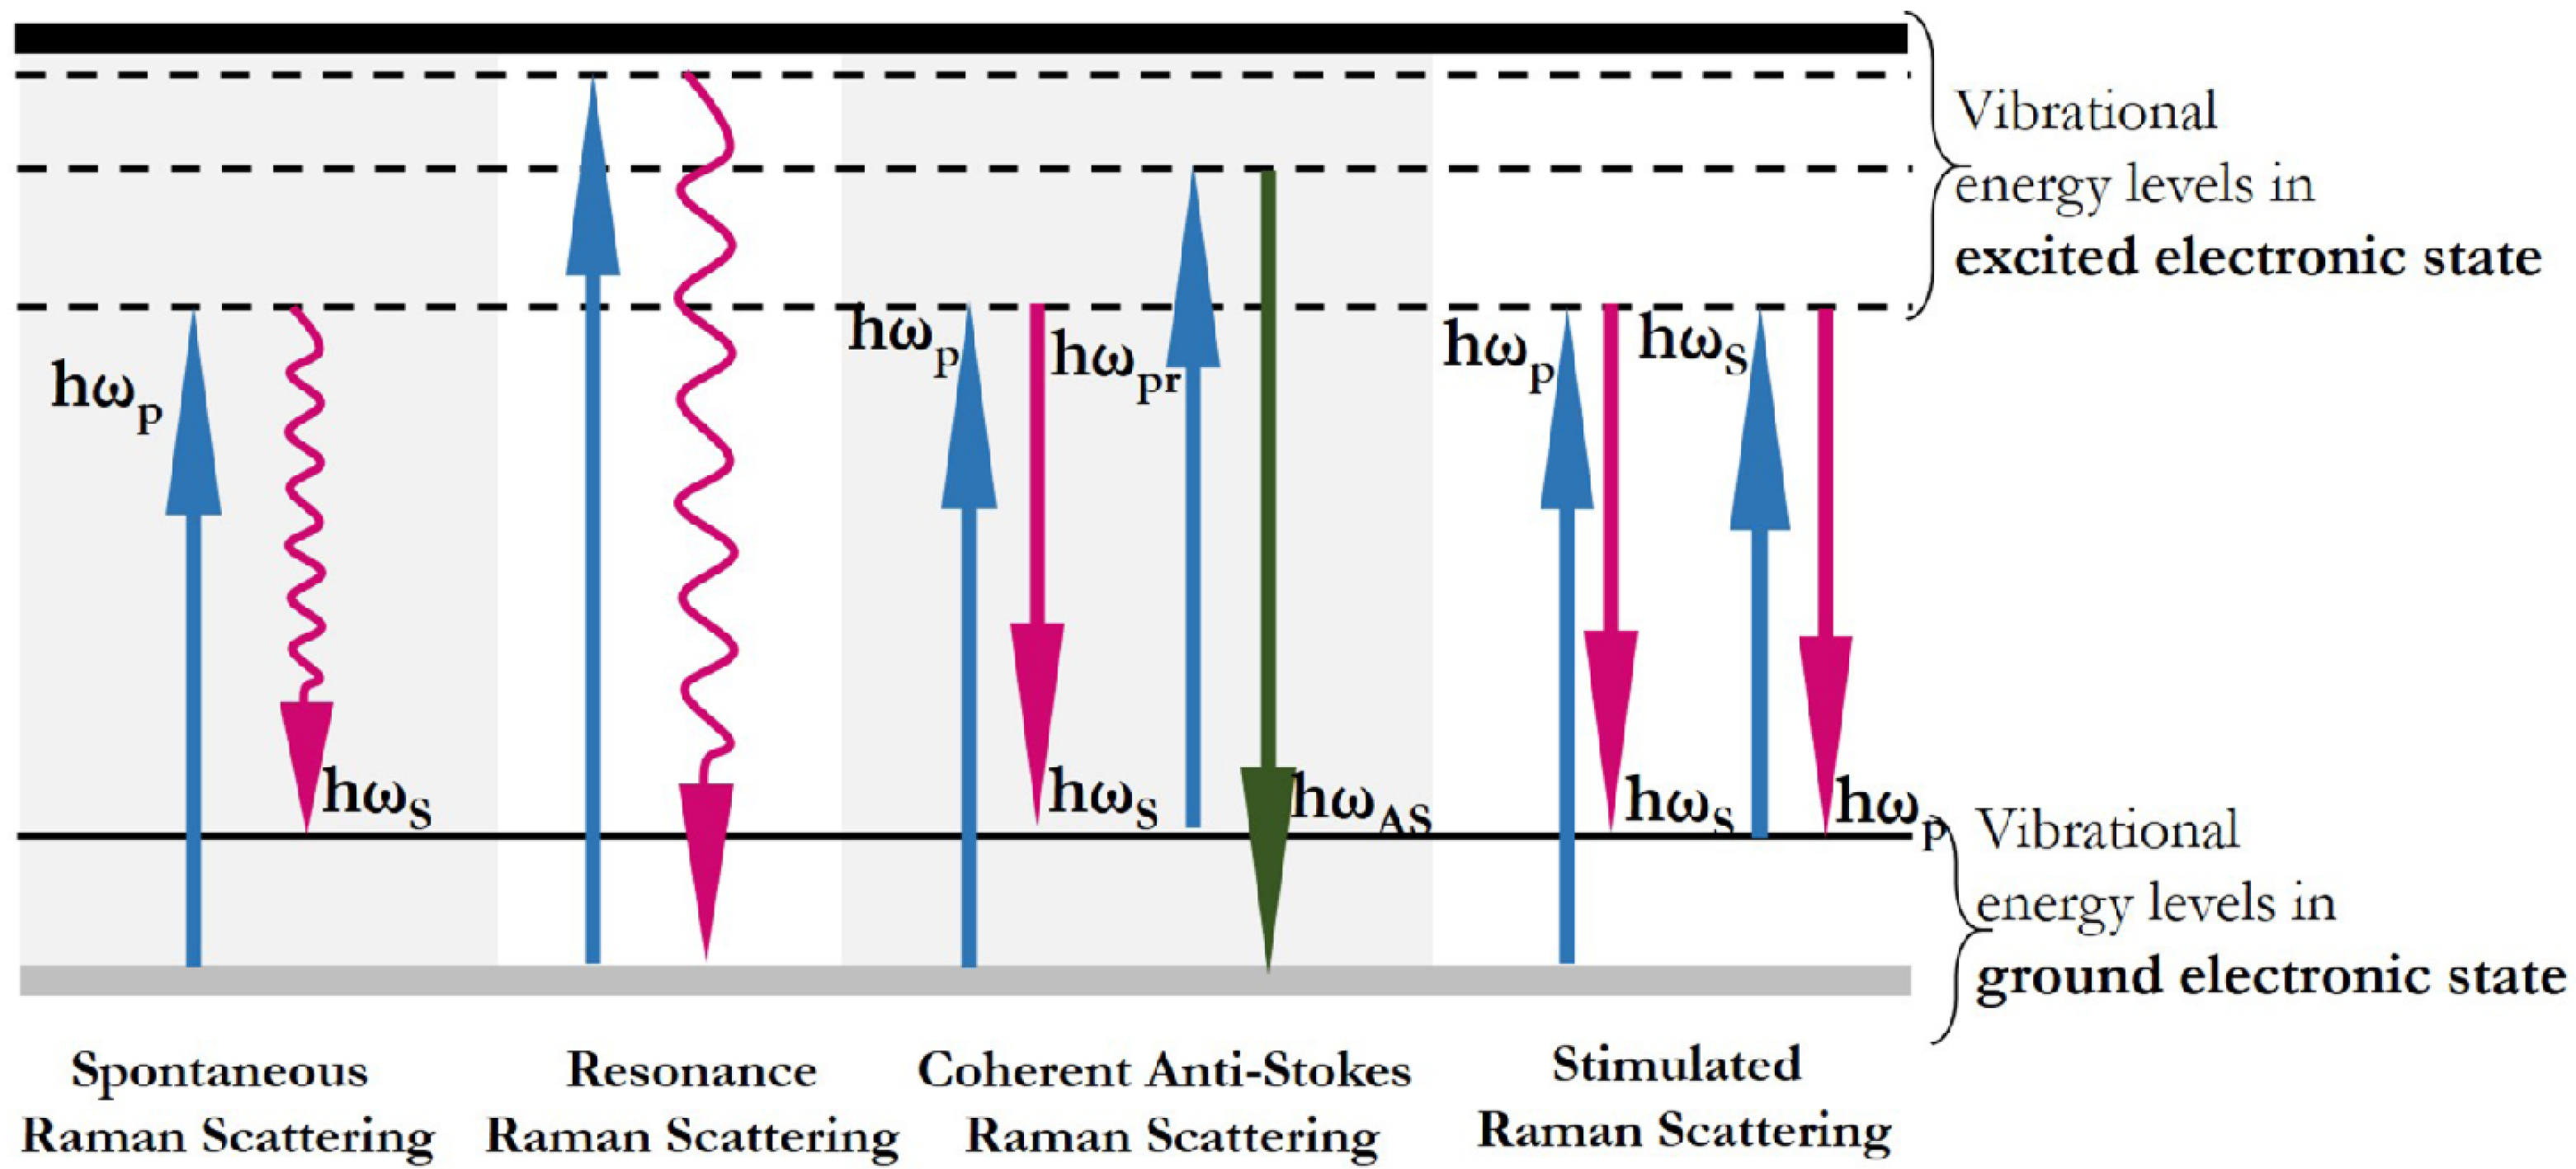
Currently, Raman spectroscopy is a promising analytical tool that provides a chemical fingerprint for molecular identification [1,2]. Raman spectroscopy relies on inelastically scattered light and allows for the identification of vibrational states (phonons) of molecules. The phenomenon of inelastic light scattering by molecules was observed for the first time in 1928 by the group of the Indian scientist Raman [3]. Most of the scattered light does not change in frequency when photons of light interact with a substance (Rayleigh scattering). However, under incident light, inelastic light scattering processes can also occur, resulting in the emission of scattered light with more or less frequency (anti-Stokes and Stokes bands, respectively) due to molecular vibrations [4]. Figure 1 shows a diagram of energy levels and transitions corresponding to the processes of inelastic and Rayleigh light scattering. Thus, a Raman spectrum is formed, consisting of bands, the position of which depends on the vibrational frequencies that are characteristic of each functional group of the sample molecules. The widespread use of Raman spectroscopy and its integration into a number of analytical methods occurred much later than the discovery of the effect of inelastic scattering, only in the 1960s, with the advent of commercially available lasers to excite the sample [5,6]. Currently, Raman spectroscopy is successfully applied for the qualitative and quantitative determination of unknown compounds in complex samples [7,8], as well as for the registration of structural changes [9,10].
Despite its speed, accuracy, and reliability, the weak point of spontaneous Raman spectroscopy is the rather low scattering cross-section of ordinary molecules, resulting in a weak signal. Moreover, the application of Raman spectroscopy requires individual optimization of research parameters, including excitation lasers, a filtering mechanism, and an objective lens, which depend on the object of study. The above factors have boosted the development of Raman techniques, of which there are now more than 25 types [11], including Raman techniques based on resonant [12,13], coherent [14,15], surface-enhanced [16,17,18], and tip-enhanced [19,20] Raman scattering phenomena.
The discovery of different types of Raman techniques provided an enormous stimulus to biomedical scientific and applied research because the spectrum of scattered photons for each molecule is unique, allowing for easy identification of a matter of interest. Moreover, Raman spectroscopy provides a number of advantages, such as noninvasiveness, no need for sample preparation, the ability to work with aqueous samples, and the possibility of combining these with other methods of analysis. The nondestructiveness of the method makes it suitable for in vivo analysis and diagnosis, providing information about the structure, conformation, and interaction of biomolecules [21]. Thus, the effectiveness of Raman spectroscopy in establishing the composition and functions of the components of the photosystem was shown, which provides an understanding of the detailed mechanisms of photosynthesis [22,23]. Beyond this, Raman techniques are a promising tool for creating chemically selective hyperspectral images, allowing thousands of Raman spectra to be obtained from the whole field of view, for example, by scanning a focused laser beam through a sample. The resulting data can be used to image the location and number of different components. By analyzing biological samples, hyperspectral imaging can show the distribution of proteins, lipids, nucleic acids, and carbohydrates [21,24,25,26]. Previously, there have been reviews of recent developments in Raman spectroscopy in relation to various objects of research [27,28,29] and areas of method applications [30,31,32,33].
In this review, we focus on Raman spectroscopy techniques that are most commonly used in life science research, including coherent anti-Stokes Raman spectroscopy (CARS), stimulated Raman spectroscopy (SRS), resonance Raman spectroscopy (RRS), and surface-enhanced Raman spectroscopy (SERS), to assess the detection capabilities of and prospects for applying these Raman techniques in the biosensing field. In Section 1, we briefly discuss the fundamental principles of the selected techniques and overview their application for analysis of biological samples regarding the advantages they offer over all Raman spectroscopy techniques. RRS, one of the Raman enhancement techniques, allows for studying the structural elements of chromophores, amino acids, and proteins by adjusting the excitation wavelength in the absorption band of individual elements. It has enormous potential for studying biomolecules [34,35]. Other Raman enhancement techniques, namely, nonlinear Raman spectroscopy, which is based on coherent anti-Stokes Raman scattering or stimulated Raman scattering, provide a higher signal sensitivity in the spectra with a cutoff of the possible fluorescence of the sample, which also makes these techniques promising for studies of biomolecules [36,37]. The limitations of nonlinear Raman techniques and RRS, as well as possible ways to overcome them to achieve the required characteristics, are considered in parallel. However, despite the improvement of the signal up to eight orders of magnitude achieved using the above techniques, the largest signal enhancement up to 14 orders of magnitude is provided by SERS. Consequently, the future development of these techniques for bioanalytical applications lies in their combination with SERS.
In Section 2, we focus on the fabrication of SERS-active substrates and their recent application in surface-enhanced nonlinear and resonance Raman techniques for the analysis of biological samples with an assessment of their potential for immunoanalytical applications. However, it should be noted that the use of surface-enhanced coherent Raman techniques is limited to molecular imaging of functional molecules in tissues and cells. Therefore, among the existing variety of enhancement Raman techniques, SERS remains the most studied and widely used analytical tool for biosensor purposes. In this regard, most of Section 2 is devoted to approaches to the fabrication of SERS substrates and SERS nanotags, as well as the implementation of various receptor molecules for the development of biosensor systems.
Despite the fact that SERS is a well-studied and widespread method for creating biosensors, its adaptation for analysis of real samples and on-site monitoring is limited by insufficient signal reproducibility and accuracy. These limitations can be removed by integrating SERS into a microfluidic platform, as well as combining the high sensitivity of SERS with the advantages of other methods to create a high-performance biosensor system. Recent advances in the development of SERS chips and a combination of multiple methods for high-throughput analysis are discussed in Section 3.
Miniaturization and simplification of readout devices are a major thread in successful implementation of Raman spectroscopy in real-life practice. Of particular interest are portable Raman spectrometers for on-site sample identification. In Section 4, we discuss the successful development of portable devices for implementing the Raman spectroscopy techniques discussed in this review.
1.1. Resonance Raman Spectroscopy
One of the approaches to amplify the Raman signal is to use the resonant excitation frequency. Resonance Raman scattering is observed when the frequency of the incident light coincides with one of the frequencies of the electronic transition of the molecule under study (see second combination of energy levels in Figure 1). The given accordance of frequencies leads to significant enhancement of optical signals as compared with common Raman scattering (for which only a very small fraction of the exciting photons causes radiation). In the case of RRS, the features of electronic absorption determine the intensities of various Raman lines and thus change the ratio of these intensities. By this way, the RRS spectra, in contrast to the common Raman spectra, depends on the exciting line [38]. Consequently, the excitation wavelength in the case of RRS varies for individual molecules. The characteristic features of this technique include: (i) a high gain, which is 3–8 orders of magnitude higher than the intensity of spontaneous Raman scattering; (ii) selective amplification of some normal vibrations relevant for a given electronic absorption band; (iii) in some instances, the effect of the progressions of intense overtones in resonance Raman (RR) spectra, and the connection between RR line intensity and the parameters of the electronically excited state [39,40]. Taken together, these advantages allow RRS to be considered an effective technique for studying the vibrational and electronic structure of chromophores within a biomolecule or the entire cell and to be used in the field of life sciences and medicine to study a particular chromophore that plays a key role in bioprocesses (e.g., to study cellular changes during bioprocesses). Thus, RRS was first applied to study the changes during the aggregation of a light-harvesting complex of photosystem II under illumination [40]. Since then, research in the field of photosynthetic processes has continued, with a number of works describing the mechanisms of photoprotection and photoinactivation provided by chlorophyll and carotenoid molecules [23,41,42]. The RRS showed high selectivity to the chromophore centers of heme proteins because excitation in the UV (UVRRS) and visible regions allows one to enhance the vibrational bands of the chromophore element and to study aromatic protein residues and peptide bonds, respectively, by tuning the laser to the wavelength of the electronic transition [43,44,45].
Another practical area in which the RRS technique has found application is the monitoring of antibody titers during the production of recombinant antibodies in cell cultures [46]. In this case, RR spectra provide information on changes in the composition of proteins and nucleic acids to characterize growth as well as the quality and quantity of the product. Despite the aforementioned sensitivity, specificity, and minimization of the effect of fluorescence, it is worth noting the drawbacks of this technique. The process of photodegradation inside the sample due to excitation under resonant Raman conditions requires the rapid movement of the sample under the illuminating beam, which does not allow combining RRS with microscopy for visualizing biological samples [47]. Another challenge consists of the need for expensive and complex equipment, including spectrometers, Rayleigh rejection filters, and powerful lasers, which hinders the practical implementation of the method.
1.2. Coherent Raman Spectroscopy
The application of incident lasers in spectroscopic methods allows for the generation of such an electromagnetic field density in the sample that the response of the light substance becomes nonlinear [48,49]. In this case, the displacement of the charged particle from the equilibrium position and, accordingly, the polarization of the medium, which is a secondary source of radiation, occurs not in direct proportion to the applied field, but with a deviation from the linear dependence. Under these conditions, the generation of various optical harmonics arises, including coherent anti-Stokes and stimulated Raman scattering, which are the subject of nonlinear optics. CARS and SRS are the most common techniques and are considered promising tools for studying molecular distributions in cells and tissues, as well as for visualizing biological structures [50,51]. CARS is a third-order nonlinear optical process in which photons of pump frequency ωp, the Stokes frequency ωS, and probe frequency ωpr interact in such a way that a signal is generated in the anti-Stokes field at a frequency of ωAS = (ωp − ωS) + ωpr when the frequency difference ωp − ωS matches the Raman-active molecular vibration ΩR. In other words, the system uses a sequence of laser sources. First, laser radiation, as in conventional Raman spectroscopy, transforms the molecule into an excited state. The second scanning laser detects such excited molecules and shifts the final radiation. As a result, the final signal is shifted in the blue region of the spectrum. Compared to spontaneous Raman scattering, the CARS signal is several orders of magnitude higher and is shifted to the blue field relative to the excitation waves, which provides spectra free from the background fluorescence of the sample [15,52]. Duncan et al. [53] were the first who designed the CARS microscope to study onion skin cells. However, the initial steps toward the application of this method as a label-free imaging technique of biomolecules were only made at the end of the 1990s with the invention of modern CARS microscopes [54]. Further development of the CARS technique was aimed at suppressing the nonresonant background affecting CARS measurements. Therefore, to reduce the nonresonant contribution to the signal, researchers have proposed several approaches, including the use of time-resolved CARS [55,56], spectral interferometric polarization CARS [57], epi-detection of CARS signal [58], multiplex CARS [59,60], and deep learning models to extract vibrational information from spectra [61].
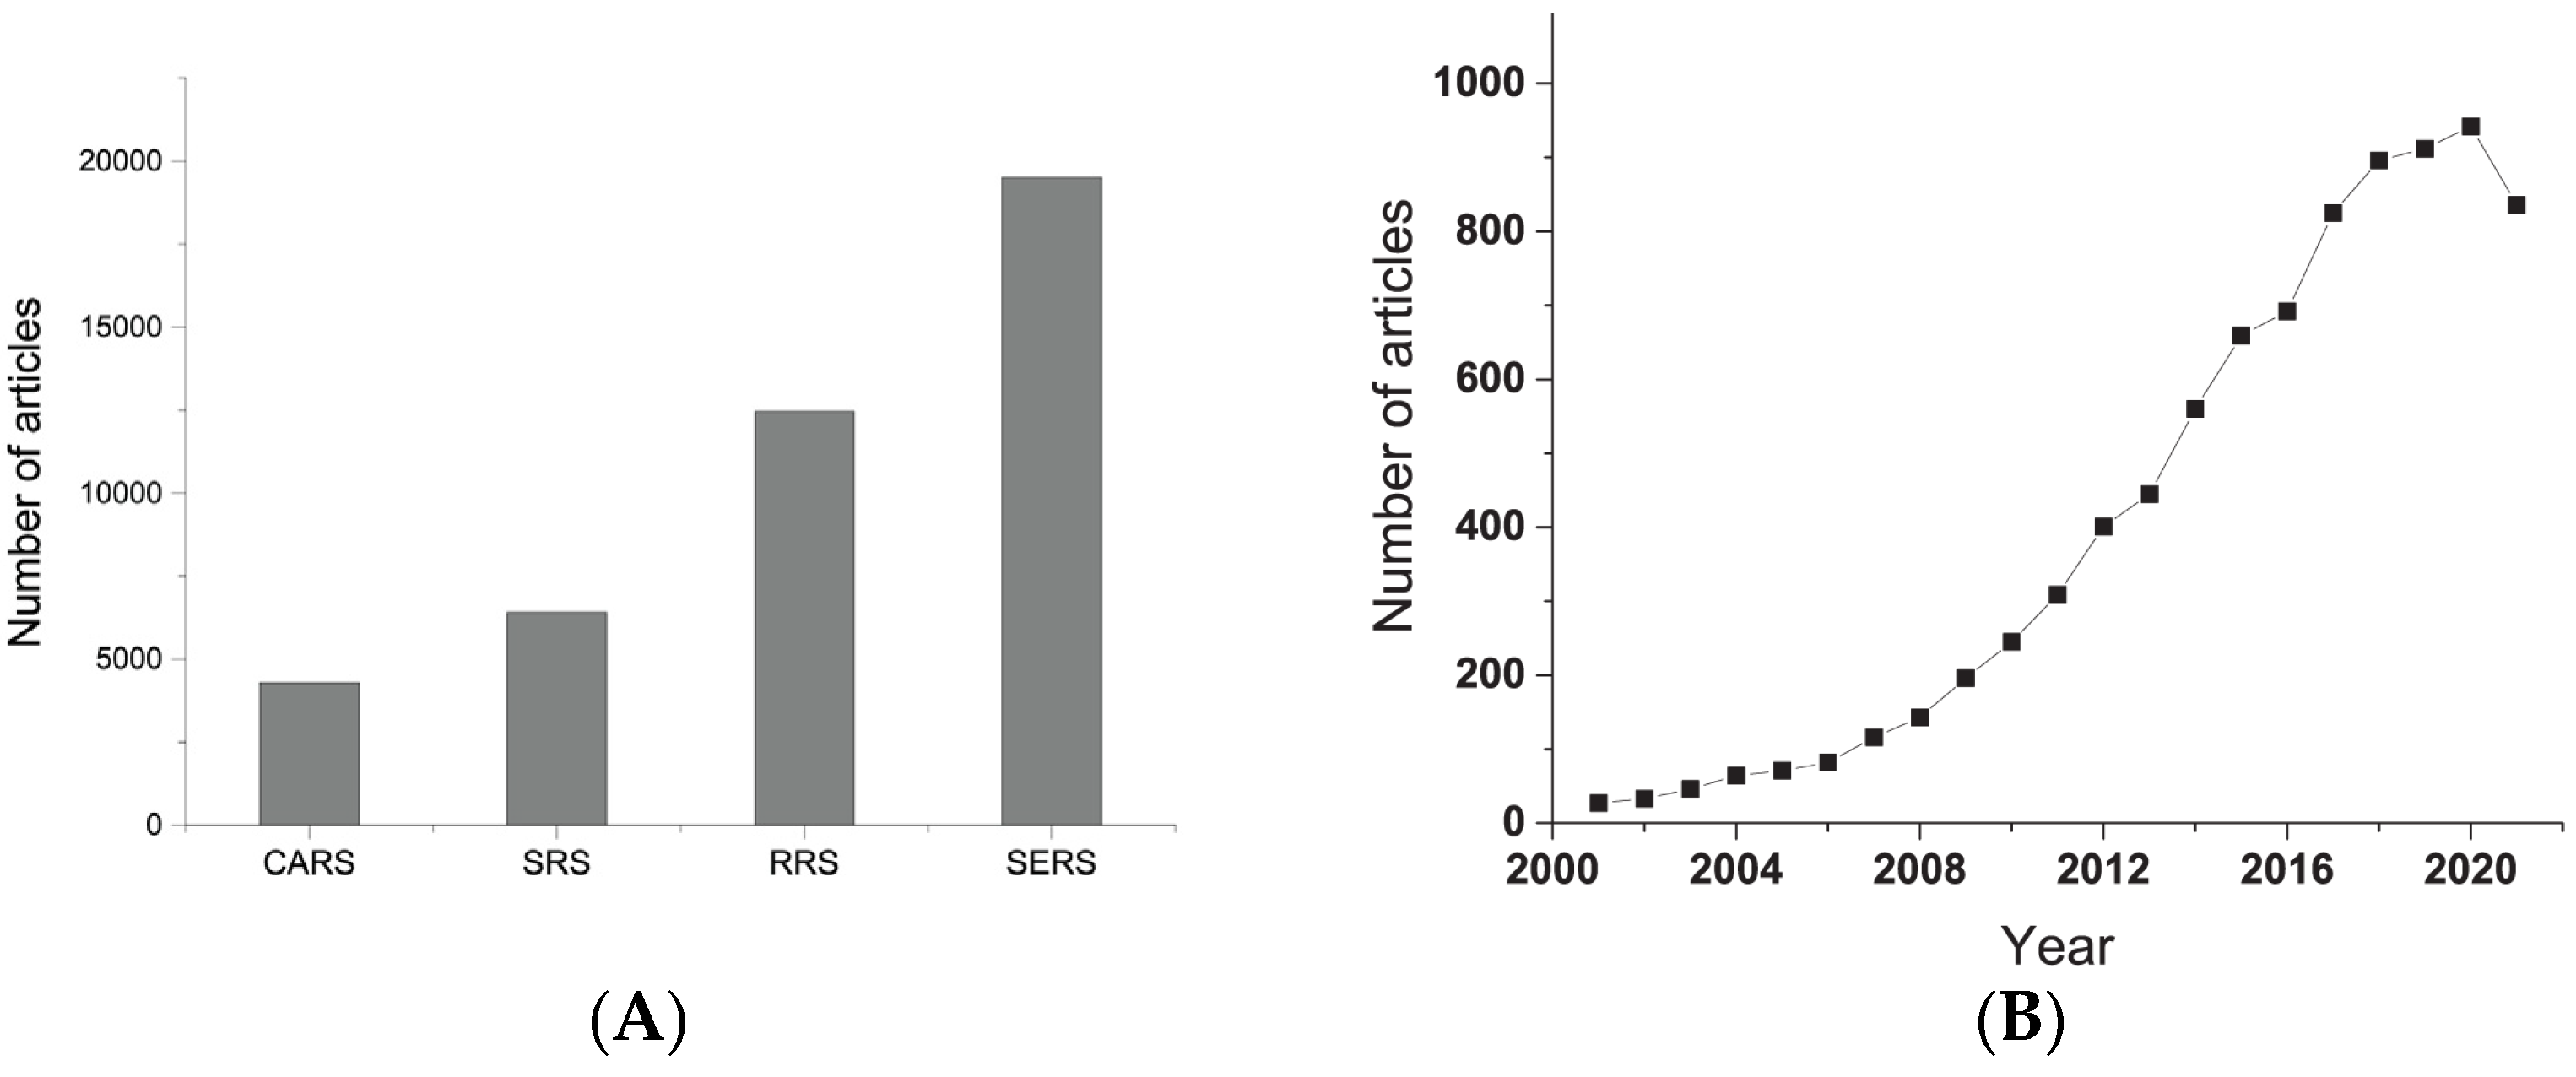
Over the past two decades, not many studies have been published covering nonlinear Raman techniques (Figure 2A), but there is undoubtedly interest in this area of research, which is evidenced by the successful application of CARS for the label-free visualization of lipid, protein, and nucleic acid distribution in cells [60,62]; pigments in living cells [63]; and skin tissues [64]. The CARS technique is of particular importance in the field of cancer cell identification and diagnosis research [65,66,67].
The SRS microscopy is similar to CARS and was first implemented using two low-power continuous-wave lasers to acquire Raman spectra in liquid benzene [68]. Much later, in 2008, the capabilities of SRS-based microscopy for biomedical purposes were demonstrated [69]. SRS is based on the interaction of two beams, a Stokes (ωS) and a pump (ωp), resulting in the stimulated excitation of the vibrational transition when the frequency difference coincides with the Raman active frequency of the sample (Figure 1). The advantages of SRS over CARS include the absence of a nonresonant background, and the position of the spectral lines completely coincides with those in the spontaneous Raman spectrum. Moreover, the intensities of the SRS signal are directly proportional to the concentration of the substance, which makes it a perspective method for quantitative detection. The use of pump laser with a constant frequency and a scanning Stokes laser provides unique responses of molecules after double excitation, which is the difference between SRS and other types of Raman scattering. When the pump energy matches the difference between excited and ground energy states of the molecule, it causes an increase in the generated signal by orders. The effectiveness of SRS microscopy for image interpretation and the quantification of complex biologic specimens has been confirmed in a number of recent studies [70,71,72].
For studies of SRS and CARS microscopy, ultrafast laser-pulsed systems are required to excite the sample, but the high cost of such systems prevents their widespread use. In addition, the obtained spectra of various compounds will qualitatively differ from the Raman spectra, which narrows their field of application to visualization and does not allow these techniques to be widely used in current biosensing technologies.
1.3. Surface-Enhanced Raman Spectroscopy
Compared to the techniques described above, SERS is a continuously evolving field of research and is of particular interest for the identification of trace molecules. The SERS phenomenon, which arises as a result of signal amplification on the substrate surface due to the excitation of plasmon resonances, was first discovered in 1974 by Fleischmann and his group [73]. However, the interpretation of the observed phenomenon was obtained only in 1977 as a result of studies on the spectra of pyridine, nitrogen heterocycles, and amines on the silver surface [74]. Following these publications, a study was conducted on the SERS detection of single molecules [7,8], which prompted the study of the enhancement mechanism of Raman scattering. To date, two mechanisms have been proposed, electromagnetic and chemical enhancement, which determine a huge increase in the Raman scattering cross section of adsorbed molecules. It was stated that the electromagnetic mechanism makes the greatest contribution and provides in some cases up to a 1010 amplification of Raman scattering [75]. The electromagnetic mechanism is associated with an increase in the electromagnetic field upon the excitation of localized surface plasmons. In this case, the resonant frequency of conduction electrons in a metallic nanostructure depends on the size, shape, and roughness of the nanomaterial. Examples of reproducible substrate surfaces for SERS that provide significant amplification of the electromagnetic field will be discussed below. The enhancement factor provided by the chemical mechanism is approximately 103 and stems from changes in the electronic structures of molecules near the metal surface during chemical interaction [76,77].
Understanding the nature of the Raman enhancement effect gave impetus to the development of SERS and the combination of SERS with coherent nonlinear Raman techniques and RRS, as well as their application in life sciences. Scientific research in the field of SERS demonstrates the growing interest in the technique associated with its high sensitivity, the ability to detect molecules by characteristic spectra, simplicity of sample preparation, and rapidity due to the unique ability to amplify the Raman signal up to 15 orders of magnitude [78,79]. The intensive development of the method over the past 20 years (see Figure 2B) has been facilitated by advances in the synthesis and modification of nanoscale SERS-active materials and the improvement of devices, including the advent of handheld spectrometers. Thus, the development of technologies has made it possible to observe the Raman scattering of small volumes of molecules up to single-molecule detection [9], and to increase the resolution, which both open the possibility for in vivo and in vitro biosensing. Several reviews have demonstrated the potential of SERS for the detection of oligonucleotides, proteins, and tumor cells in biofluids [10,30,31].
As a result of the assumption of the possibility of achieving single-molecule detection by Raman techniques, the combination of enhanced local fields near metal surfaces with the resonant effect of Raman scattering or coherent Raman scattering allowed for the development of the following techniques: SERRS, SE-SRS, and SE-CARS. The contribution of plasmonic effects of metal nanostructures in the form of films or colloidal nanoparticles was estimated by studying the enhancement of the coherent and resonance Raman signal for various biological objects [34,36,37,43,78,80].
Despite the advances of SERS, the practical implementation of the SERS-combined techniques requires standardized procedures for obtaining a uniform substrate surface and detecting a signal from a molecule of interest in a hot spot area, which remain urgent tasks today. Moreover, the analysis of complex samples containing a variety of biomolecules complicates the identification of the target molecule. In this regard, the performance of Raman techniques can be greatly amplified through the use of bioreceptor molecules with specificity for the target molecule. One such example is a SERS-based biosensing platform that combines the specificity of antigen–antibody interactions with the sensitivity of SERS. Below, we consider the current developments for the high-performance detection and characterization of biological objects, including the variety of metal substrates and SERS nanotags as well as SERS-based biosensor applications.
2. Application of SERS and SERS-Combined Raman Techniques in the Detection of Biomolecules
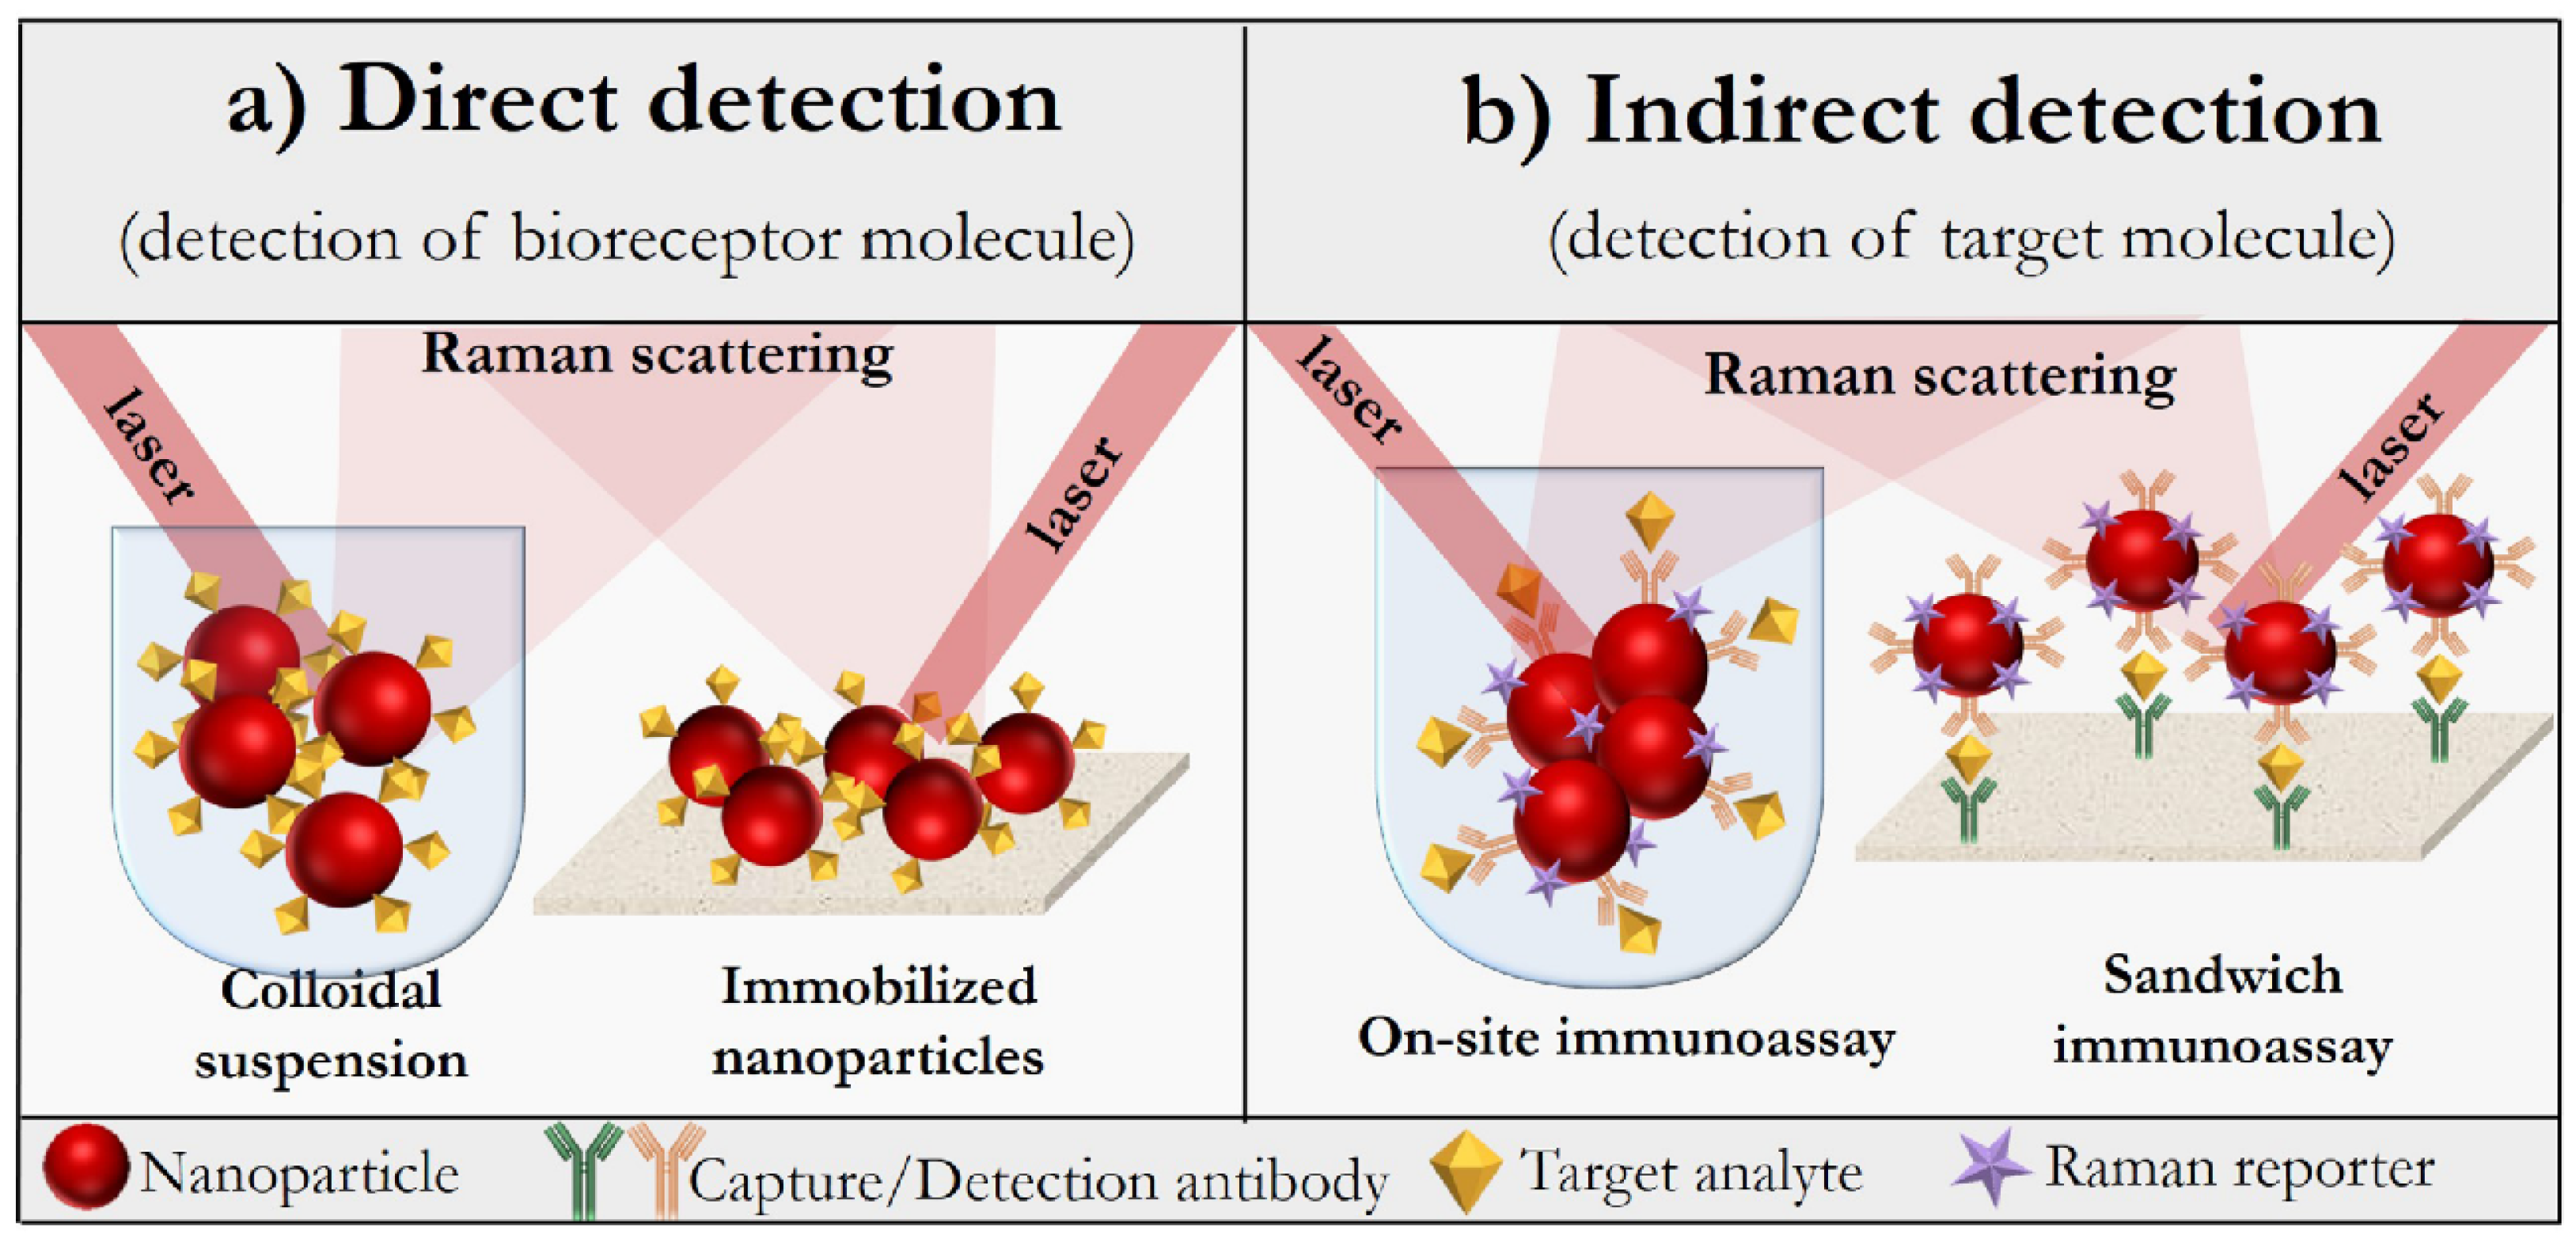
Generally, SERS-based detection is divided into two approaches, that is, direct or label-free detection and indirect detection, using Raman reporter molecule-labeled SERS nanotags [76,79]. The label-free approach allows for the obtaining of the Raman spectra of biomolecules adsorbed on nanostructured SERS-active substrates. The principle of this approach is schematically illustrated in Figure 3a of this review. In order for the specificity of detection to be improved, various bioreceptor molecules, including antibodies and aptamers, which specifically bind the analyte, are immobilized on a metallic nanostructured substrate. In this case, the sample is identified by comparing the Raman spectra before and after the binding of the target molecule. However, in the direct approach, any changes in the biomolecule’s environment contribute to the Raman spectrum, which complicates the use of direct detection in complex sample matrices due to the influence of the background signal. Moreover, not all types of analytes can be discriminated against their own spectra of molecules [81].
On the contrary, in the indirect approach, specific target detection is performed by detecting the vibration spectrum of a Raman reporter molecule, which is a chemical compound, most often a dye or sulfo-derivatives of the aromatic series, with a rather large scattering cross-section, resulting in intensive bands of the SERS spectrum. This approach is illustrated in Figure 3b. The high sensitivity is achieved due to the choice of a suitable reporter molecule and its proximity to the SERS nanotag. However, the indirect approach also has its disadvantage associated with the impossibility of obtaining molecular information about the target biomolecule itself. To summarize, depending on the objectives pursued and the sample matrix, a particular Raman technique should be chosen from the existing variety of methods, followed by the design of a suitable plasmonic nanostructured substrate or SERS nanotag [82]. This chapter aims to discuss the assembling of direct and indirect SERS-based platforms for the characterization and detection of various molecules with the potential for their use in the biosensor field.
2.1. Direct and Indirect Approaches of SERS-Based Techniques
In the direct approach of SERS, the sensitivity and specificity of the system are determined by the properties of the substrate and the functionalization of its surface, respectively. As stated earlier, the phenomenon of SERS is based on the enhancement of the local field provided by the surface plasmon resonances of metallic nanostructures. The enhancement effect appears when a biomolecule is adsorbed or is located near the surface of a metal substrate (the distance should be less 30 nm) [83].
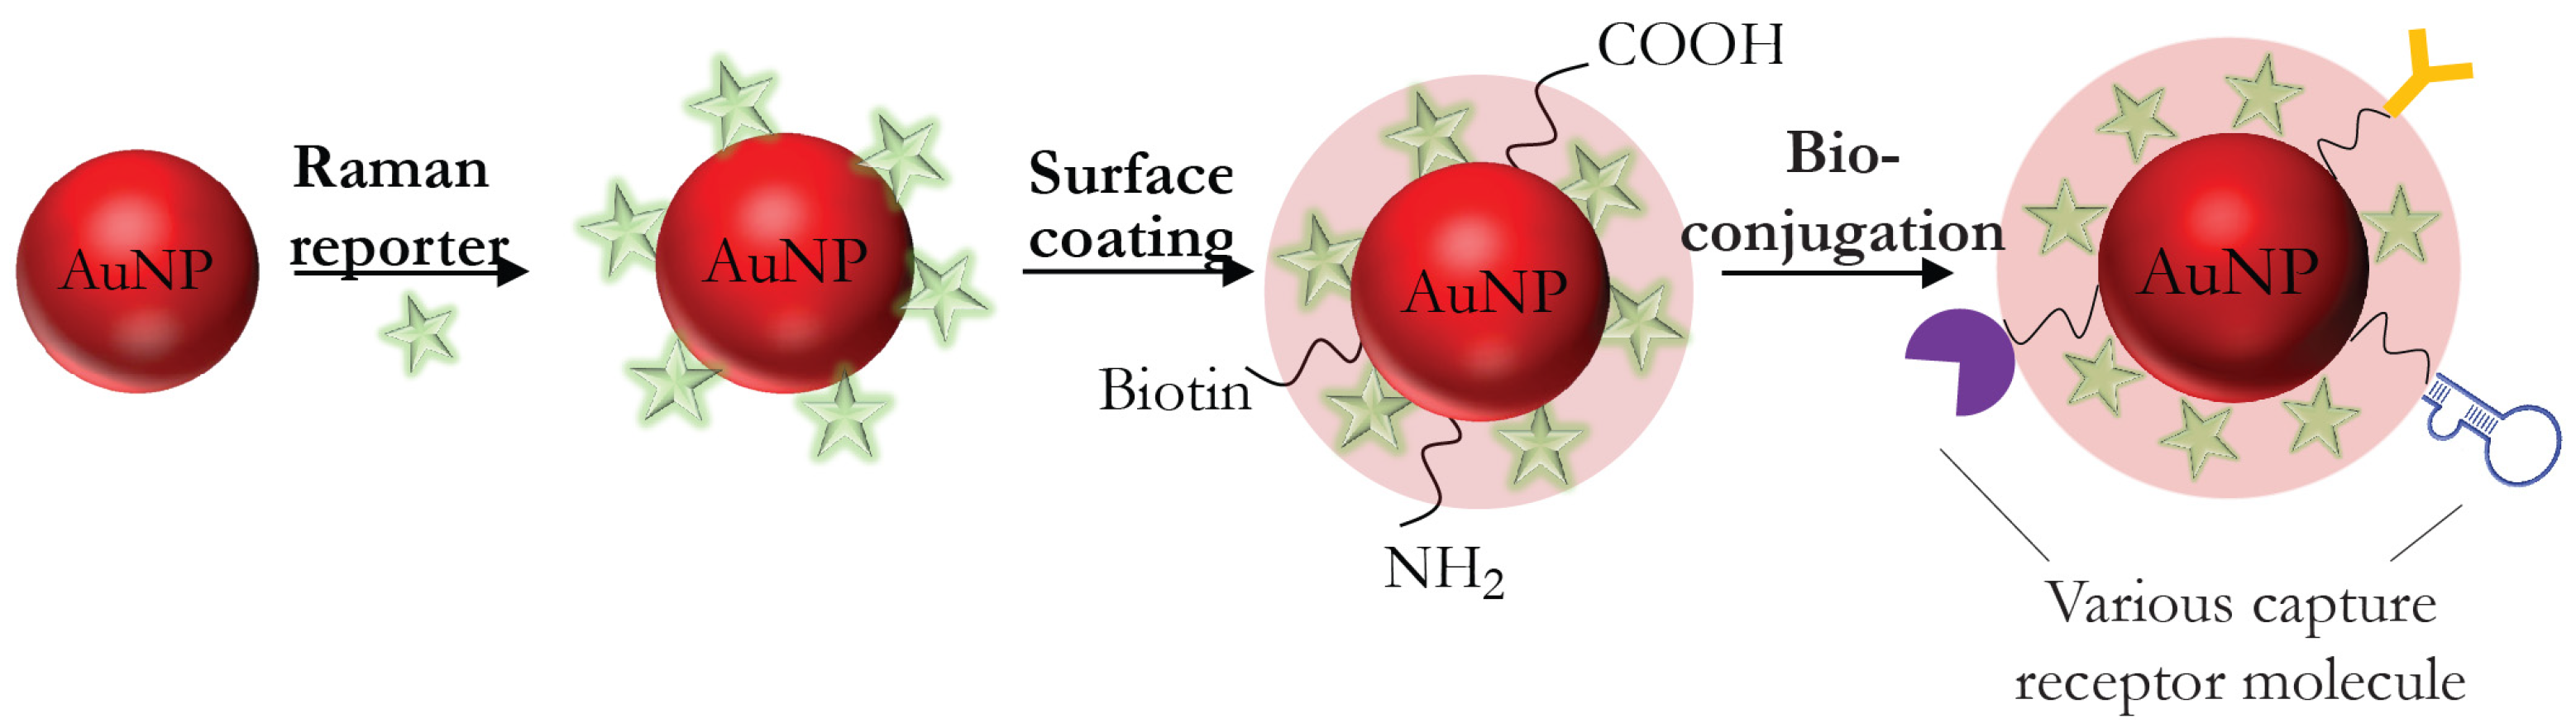
In most cases, the SERS-based technique application involves an indirect approach for the identification and quantitative detection of molecules because it allows the achieving of the necessary sensitivity for the determination of analytes with a small Raman scattering cross section. A distinctive feature of the indirect approach is the use of the SERS nanotag, which provides the formation of the SERS signal when it binds to the target analyte. The SERS nanotag contains the following components: (i) a metallic nanostructured substrate, (ii) a protective shell or layer that ensures the stability and biocompatibility of the SERS nanotag (the nonessential component of the SERS nanotag), (iii) capture receptor molecule, and (iv) the Raman reporter molecule responsible for the formation of the fingerprint spectrum. Figure 4 illustrates the structure of the SERS nanotag typically applied to design the indirect SERS detection. The indirect SERS techniques offer unique opportunities for qualitative and quantitative analysis due to the variety of SERS nanotags and sensor design. In order for the insufficient stability of colloidal nanoparticles and the irreproducibility of the Raman signal associated with the desorption of reporter molecules from the surface of nanoparticles or competition for binding with other molecules to be eliminated, a protective shell or layer is used in some cases.
Modification of the SERS nanotag with bioreceptor molecules that specifically bind the analyte gave rise to the development of SERS-based biosensors. To date, many successful studies have been published on the use of SERS nanotags in bioimaging and biosensors [84,85,86]. However, to date, the only example of the indirect detection using the SERS nanotag in nonlinear Raman spectroscopy has been described. The potential of SE-CARS using a SERS nanotag has been demonstrated for the visualization of the basal cell marker p63 location in prostate tissue sections [35]. In this work, the SERS nanotag included Au/Ag nanoshells modified with a reporter molecule 5,5′-dithiobis (2-nitrobenzoic acid) and stabilized with a protective layer of triethylene glycol with a terminal carboxyl group, through which bioconjugation with p63 antibodies was carried out. The visualization of the sample by CARS microscopy in combination with the SERS nanotag made it possible to localize tumor-relevant antigens in tissue samples selectively, sensitively, and quickly.
In order for an indirect SERS approach based on antigen–antibody (or another receptor molecule) interactions to be implemented, a sandwich scheme for fabricating a SERS biosensor is traditionally applied. The sandwich scheme includes the following components: (i) the capture antibody (fixed on the substrate surface or freely located in solution), (ii) an antigen (the target analyte—it can be a protein, cell, etc.), and (iii) a labeled detection antibody. As noted above, at the moment, there is only one example of the development of immuno–SE-CARS, and the adaptation of SERS-combined nonlinear Raman spectroscopy techniques for indirect analysis of biomolecules is under development; therefore, further in the review, biosensors based on the indirect SERS approach will be considered.
To summarize, the direct approach allows for on-site identification and quantification of the analyte based on unique SERS fingerprint spectra. The direct approach is most preferable for on-site detection because the additional stage of obtaining the SERS nanotag, where the reporter molecule must be in close proximity to the surface of the noble metal nanoparticle, complicates the detection procedure. In addition, of particular interest is the ability to identify components in a mixture without a separation step. However, it should be noted that compounds of matrixes may interfere the registered spectra as well as at values of specific spectral peaks. In this case, preference is given to the indirect approach, where the analyte is captured using a receptor molecule and the extrinsic SERS signal is acquired from the reporter molecule, which together reduces the contribution of interfering components to the determination of the target analyte. Therefore, the choice of a suitable approach for SERS detection is based on the purpose of the study, as well as the matrix of the sample in which the analyte is identified.
2.1.1. Substrate Fabrication
Great efforts have been made to develop various types of nanostructured substrates, which are characterized by a high enhancement factor (EF) [48,49,87,88,89]. The most common materials for the formation of colloidal and solid substrates are silver and gold nanoparticles due to their unique optical and electronic properties, exhibiting plasmon resonance bands in a wide range of spectra from the visible to the near infrared. Varying the size and shape of nanostructures leads to a change in the amplitude, position, and width of the surface plasmon resonance (SPR) line. The variety of substrates described in the literature can be divided into two groups: colloidal substrates and solid substrates. The traditional methods of the synthesis of colloidal metal substrates include the chemical reduction of metal salts or laser ablation. Currently, methods of synthesis and the application of various nanostructures, including nanospheres [35], nanovoids [90], nanostars [91,92], and nanoflowers [93] in SERS-based techniques, are described. The signal enhancement efficiency is influenced by the size and shape of the metal nanoparticles. Thus, nanoparticles less than 100 nm in size are considered optimal for the fabrication of SERS substrate because when large nanoparticles are irradiated with a laser, multipole excitation arises, which is nonradiative and reduces enhancement efficiency. When choosing the shape of metal nanoparticles, preference is given to anisotropic structures, such as star-shaped nanoparticles, which, due to their unique optical properties, are widely used in biosensors and imaging techniques [94]. Of particular interest is the aggregation of colloidal metal nanoparticles, which provides a high EF. For example, the random aggregation of spherical and complex nanoparticles can lead to the formation of regions with a strongly enhanced electromagnetic field, known as “hot spots” [95]. When the biomolecule is close to this region, the Raman enhancement increases up to 1015 orders of magnitude, and a single-molecule detection can be achieved [96]. However, it should be noted that an aggregated colloidal substrate can lead to an unreproducible and unstable signal, which is critical for bioanalytical applications of SERS and SERS-combined techniques.
Compared to colloidal metal substrates, solid substrates are characterized by homogeneity; ease of sample preparation, including surface functionalization and washing steps; and the allowing of the detection of single molecules in a small volume. The formation of solid substrates is carried out by self-assembly [97,98,99] or lithography [100,101,102] methods or using the combination of these methods, resulting in the creation of substrates with different SPR properties. Table 1 summarizes various approaches to create SERS-active substrates [86,94]. The self-assembly is a cost-effective and rapid approach for creating a SERS-active solid substrate. The quality and efficiency of the SERS-active substrate in this case depends on the functional groups on the solid support, the incubation time of the support in the colloidal solution, the plasmonic properties of the nanoparticles, and their concentration. However, in a uniform distribution of nanoparticles with a controlled size and shape, providing an enhanced and reproducible Raman signal can be achieved using nanolithography. Since its inception, this technology has received a large amount of attention because it allows for the fabrication of uniform, periodic nanostructures of SERS substrates. Thus, silicon nanopillars modified with metal nanoparticles with a high surface-to-volume ratio have proven their effectiveness in detecting various biomolecules [103,104,105]. Today, special attention is also paid to the fabrication of SERS substrates using biomimetic natural materials as a template for the further distribution of plasmonic nanostructures. One of these natural templates is diatoms, which are unicellular solitary or colonial microscopic organisms with a shell over the cell membrane. The shell of diatoms is composed of amorphous silica, forming an ordered structure of hierarchical micro-nanopores. Cai and coauthors have shown a simple and cost-effective method for fabricating the SERS substrate based on the nanoimprinting technology to replicate the micro-nanopore pattern of the diatom shell on polydimethylsiloxane (PDMS) film [106]. After that, gold nanoparticles were sprayed onto the PDMS film with nanopillars, adjusting the size and gap between the particles by varying the duration of the process. The effectiveness of the SERS substrate was shown by the example of the detection of the pesticide carbendazim with high sensitivity.
Along with the advantages of noble metals, mention must be made of the laboriousness and high cost of the procedures for manufacturing (the lithography of nanospheres, electron beam lithography, etc.) SERS substrates based on them. In addition to noble metals, dielectrics and semiconductors are considered alternative materials for fabricating SERS substrates. In recent years, three-dimensional hybrid metal/semiconductor nanostructures have attracted much attention as reusable SERS substrates. When assembling a dielectric template or semiconductor structure with noble metal nanoparticles, the SPR frequency of the nanoparticles shifts to the IR region, resulting in an increase in SERS due to the coincidence of the biomolecule Raman signal with the SPR of nanoparticles. Pal et al. fabricated reusable Ag/ZnO/Au SERS substrates by using thermal evaporation, hydrothermal growth, and sputtering for the formation of silver film, ZnO nanorods, and gold nanoparticle deposition, respectively [107]. Under the optimized structure of a hybrid SERS substrate, the highly sensitive detection of λ-DNA was achieved. Among the promising semiconductor materials is titanium dioxide, which, after elemental doping with metallic and nonmetallic structures, forms a SERS-active substrate. Thus, Keshavarz et al. proposed a SERS substrate based on a quantum-structured (Q-structured) TiOx template and TiO2 quantum particles with oxygen vacancies, which are self-assembled on the template [108]. Evaluation of the efficiency of the SERS substrate showed the nanomolar range of the epidermal growth factor receptor detection. In the work of Qu et al. [109], the etched glass substrates were used with the layer of immobilized gold nanoparticles, followed by a protective polydopamine coating and antibody immobilization. The implementation of multicomposites based on several types of nanoparticles in combination with a Raman reporter molecule made it possible to obtain a multilayer structure. The presence of nanosized cubes of Au–Ag on the surface of a silicon wafer made it possible to increase the number of “hot spots” and to improve the detection limit of alpha-fetoprotein in a sandwich immunoassay to levels [110].
Recently, organic semiconductor thin films have been found to be an alternative substrate for SERS because they increase SERS activity mediated by charge transfer between the substrate and the analyte [111]. Organic thin films have a number of advantages, including simple and fast synthesis, the ability to customize the optoelectronic properties, and the structural identity of the resulting films. Thus, Yilmaz et al. [112] confirmed the effectiveness of a substrate on the basis of organic semiconductor for SERS detection. They fabricated hydrophobic film based on α,ω-diperfluorohexylquaterthiophene (DFH-4T) by vapor deposition and applied it as a substrate for acquiring SERS spectrum of methylene blue, thereby achieving EF of 3.4 × 10³. The subsequent modification of the DFH-4T film with a thin gold layer resulted in an enhancement up to 1010 with the possibility of detecting a sub-zeptomole level of methylene blue. The achieved gain demonstrate that organic semiconductor films are promising for the fabrication of SERS substrates that allow the identification of low analyte concentrations down to a single molecule, avoiding expensive procedures for preparing substrates, and their application in various fields of research, including the development of biosensors.

Table 1.
Methods for fabricating SERS-active solid substrates, summarized according to the following reviews.
Table 1.
Methods for fabricating SERS-active solid substrates, summarized according to the following reviews.
| Method | Approach | Features | Ref. |
|---|---|---|---|
| Self-assembly (or bottom-up methods) | Chemical immobilization | Immobilization of the nanoparticles of various shapes and sizes through bifunctional reagents (linkers) containing amine or thiol groups on a solid support. The common bifunctional reagents are aminosilanes (APTES) and mercaptosilanes (MPTS). | [113,114] |
| Electrostatic interaction | Electrostatic deposition of nanoparticles onto a polymer-modified solid support. The common polymers are poly (diallydimethylammonium chloride) (PDDA) and polyvinylpyrrolidone (PVP). | [98,115] | |
| Capillary force-induced assembly | The deposition of a colloidal solution of nanoparticles onto a solid surface, followed by the evaporation of the solvent-creating capillary force-induced assembly of metal nanoparticles. | [99,109] | |
| Langmuir film fabrication | Assembling of metal monolayer at an air–liquid interface, followed by the transfer of the film onto a solid support. | [97] | |
| Lithography (or top-down methods) | Electron beam lithography | Design of metal pattern using an electron beam. | [100] |
| Hole–mask colloidal lithography | Controlled self-assembly of colloidal nanoparticles serving as a mask for the formation of a metal plasmon pattern. | [101] | |
| Nanoimprint lithography | Fabrication of metal plasmonic structures on rigid and flexible substrates. | [106,116] |
2.1.2. Direct SERS-Based Biosensing
Pursuant to the definition given in [117] a label-free biosensor is a device that converts a cellular signal into a quantitative signal and was originally designed as an analytical tool for analysis of biomolecular interactions. The implementation of the direct SERS approach makes it possible to acquire the fingerprint spectrum of a substance under the condition of its immediate proximity to the active SERS substrate. Despite all the advantages of the direct detection approach, its prevalence is limited by the difficulty of obtaining reliable spectra of biomolecules, among other interfering components of biofluids. However, interest in measuring the intrinsic spectra of biomolecules is not diminishing because label-free detection provides information on the conformation and orientation of molecules and allows the analysis of molecular dynamic changes in bioprocesses and interactions between biomolecules and other compounds. To date, a successful application of the direct surface-enhanced Raman approach is confirmed in the detection of whole cells, bacteria, and proteins [80,118,119,120].
Recent developments of direct SERS-based biosensor systems are summarized in Table 2. To improve the reliability of the direct approach and enhance the binding of the analyte to the nanostructured substrate, researchers proposed a preliminary coupling reaction. Thus, in the study of Chen and coauthors [121], a direct SERRS is proposed, wherein the quantitative determination of the protein is carried through the formation of bicinchoninic acid (BCA)–Cu+ complex. The sensing mechanism included two stages: (1) the reduction of Cu2+ to Cu+ by proteins in alkaline conditions; (2) the formation of a chelate (BCA)–Cu+ complex. After a coupling reaction between the BCA–Cu+ complex and the target protein, a silver colloid was added to the resulting mixture, and the SERRS spectra were measured. With a decrease in the bovine serum albumin concentration, a decrease in the characteristic band associated with the chelate complex was observed. A sensitive SERRS detection of estrogen using the coupling reaction between phenolic estrogens and Pauly’s reagents was proposed [122]. The one-step and simple method included mixing the analyzed hormone with Pauly’s reagents (azo coupling) and adding the mixture to a solution of silver nanoparticles, followed by the registration of concentration-dependent SERRS spectra.
SE-SRS is a promising tool for studying the ultrafast dynamics of the molecules adsorbed on a substrate with a high temporal and spectral resolution. Obtaining effective plasmonic SERS substrates that are stable under the conditions of a femtosecond laser and provide a flexible choice of an adsorbate molecule is an urgent task for the development of the method. Negru et al. proposed a protocol for the preparation of oligomers of gold nanospheres using polyvinylpyrrolidone to stop the oligomerization of the monomer, and the effectiveness of the synthesized substrate was confirmed by the study of a number of molecules, including β-carotene, by the SE-SRS technique [123].
At the end of 2019, the world was faced with a pandemic caused by the SARS-CoV-2 virus. The need to quickly diagnose and control the spread of the virus gave impetus to the development of new methods for identifying the virus with high detection sensitivity. In this area, advances in the SERS technique have made it possible to adapt this method for direct virus testing. Acquisition of the reliable spectra of spike protein, nucleocapsid protein, and inactivated SARS-CoV-2 virion particles was achieved by the design of SERS-active substrates. Thus, the combination of Mxenes, possessing the advantages of metallic conductivity, hydrophilicity, tunable electronic structure, etc., with Nb and Ta cations, resulting in the formation of Nb2C and Ta2C MXene nanosheets, allowed for a sensitive detection of SARS-CoV-2 spike protein [124]. In another work, Sanchez et al. modified several layers of MoS2 with a mixture of Au–Cu nanostars and virion particles of the S and N proteins to determine the spike protein with nanomolar sensitivity [125].
Apart from the sensing application of direct SERS techniques, they have been successfully implemented for in vivo and ex vivo studies [31]. The study of biological tissues and fluids using SERS-based techniques is not an easy task, but several approaches have been proposed to solve it, such as the implementation of SERS substrates based on metal nanoparticles directly into the sample, applying a colloidal solution of the substrate to the sample, or freezing the sample with liquid nitrogen followed by grinding and mixing with the SERS substrate [126].
SERS is a promising tool for the nondestructive study of samples under physiological conditions. The potential of the SERS for ex vivo studies of cerebrospinal fluid has been shown by the example of identifying the meningitis pathogens [127]. The authors showed that by synthesizing a suitable SERS substrate—in this case, Au–Ag-coated polycarbonate membranes, which meets the requirements of a high enhancement factor and chemical stability—it is possible to achieve the label-free detection of the inflammatory marker neopterin, the level of which increases in the cerebrospinal fluid infected with Neisseria meningitidis, Streptococcus pneumoniae, and Haemophilus influenzae.
Achieving high sensitivity up to the detection of a single molecule using SE-SRS is challenging due to the potential for the damage of substrates by ultrafast pulses and a high pump–probe background. Compared to SERS, the SE-SRS technique, which provides an improved imaging speed, allows it to be used to identify chemical changes in living systems. Thus, Zong et al. achieved the single-molecule detection of adenine released from S. aureus cells as a result of starvation using aggregate gold nanoparticles dropped onto a glass surface [78]. The results obtained can be extended to the detection of biomarkers in tissues by using SERS nanotags containing bioreceptor molecules specific to the analyte.
The combination of antibody-modified SERS substrates with nonlinear optical microscopy (SE-CARS) is a promising approach for ex vivo and in vivo live cell imaging. Thus, Machtoub et al., using an ex vivo model of amyotrophic lateral sclerosis, investigated cellular metabolic states by the SE-CARS technique using iron oxide paramagnetic particles labeled with anti-CD4 antibodies [128,129]. It was shown that the high intensity of SE-CARS, caused by the binding of lipids to labeled antibodies, correlates with the identified areas of brain damage.
Table 2.
SERS and SERS-combined techniques for direct label free biosensing.
| Analyte | SERS Substrate | LOD | Laser Wavelength, Laser Power | Features | Year, Ref. |
|---|---|---|---|---|---|
| Pyruvate, adenosine triphosphate (ATP), and lactate | Fe3O4 microspheres-decorated silver nanoparticles (30 nm) | 0.1, 0.01, and 1.0 pM for ATP, lactate, and pyruvate detection, respectively | 632.8 nm, ≈7 mW | Simultaneous detection of multiple analytes, provided by a combination of a microfluidic SERS platform and magnetic separation that creates hot spots. | 2019, [130] |
| Pyocyanin secreted by Pseudomonas aeruginosa | Microchannels made of poly (dimethylsiloxane) (PDMS) with integrated gold nanooctahedrons | 10−19 M | 785 nm laser, 1.74 mW | Detection of biomolecules without extraction from complex biological media using SERS-based microfluidic chip. | 2020, [131] |
| Thiram and carbaryl detection | Poly(ethylene terephthalate) covered with indium tin oxide and silver layers | 2.5 µg/mL for thiram and 0.012 µg/mL for carbaryl | 785 nm, 5 mW | Processing the foil with the dielectric barrier discharge method to create a rough surface and subsequent modification with silver nanoparticles allows for the fabrication of a flexible SERS substrate for analysis. | 2019, [132] |
| Dopamine | Two-dimensional WS2 grown on three-dimensional WO3 nanohelixes by sulfurization process | 10 nM | Ar-ion 633 nm | Application of two-dimensional dichalcogenides of transition metals in the construction of a substrate for the detection of biomolecules. | 2020, [133] |
| Manganese super oxide dismutase (MnSOD) | Glass substrate, modified with gold nanoantennas and thiolated DNA aptamer with specificity to MnSOD protein | Nanomolar range | 660 and 785 nm, 1 mW | Combination of the high sensitivity provided by gold nanoantennas with the specificity provided by the modification of the substrate with an aptamer. | 2015, [134] |
| Bilirubin | A hybrid of graphene oxide and gold nanostars applied to filter paper | 0.436 μM | 785 nm, 6.57 mW | Physical self-assembly between graphene oxide and gold nanostars to obtain SERS active substrate. | 2019, [135] |
| Bacteria mixture (Shigella flexneri, Escherichia coli O157:H7, Staphylococcus aureus, and Listeria monocytogenes) | Silver nanoparticles | 1.5 cfu/mL | He–Ne 632.8 nm, 14 mW | Homogeneous SERS detection of bacteria based on the binding of bacteria to the aptamer, followed by the in situ synthesis of silver nanoparticles on the bound aptamer. | 2017, [136] |
| Carbapenem-sensitive E. coli (CSEC) and carbapenem-resistant E. coli (CREC) | Silver-coated gold nanorods (Au@Ag NRs) | Identification of CSEC and CREC | 785 nm, 20% of the laser power | Homogeneous SERRS identification of bacteria, where the plasmon peak of the Au@Ag NRs nanostructure coincides with the laser wavelength, which provides the necessary sensitivity due to the resonance enhancement effect. | 2018, [137] |
| Biomarkers of breast cancer in human tears | Gold-decorated, hexagonal-close-packed polystyrene nanosphere monolayer | Identification of breast cancer markers | 785 nm, 10 mW | SERS biosensor for identification of breast cancer biomarkers, which are predictors of disease, based on the analysis of human tear spectra. | 2020, [138] |
2.1.3. Raman Reporter Molecules
To achieve a high performance of indirect SERS, the choice of a reporter molecule with a large Raman scattering cross section is also important. The distance between the Raman reporter molecule and the SERS substrate and the SERS nanotag is an important parameter contributing to the enhancement factor because the distance between the reporter molecule and the SERS substrate/nanotag makes the main contribution to the electromagnetic enhancement and the adsorption on the surface to the chemical enhancement. Fluorophores and chromophores, such as rhodamine, methylene blue, malachite green isothiocyanate, and crystal violet, as well as thiol-containing aromatic compounds (5,5′-ditho-bis (2-nitrobenzoic acid, DTNB), 4-nitrothiophenol, 4-aminothiophenol, 4-mercaptobenzoic acid, etc.), meet these requirements [139,140]. Most often, preference is given to thiol-containing compounds, which is explained by their high binding ability to the nanostructure surface, ensuring the close position of the reporter molecule to the metal surface and, accordingly, a high SERS electromagnetic EF. Along with the widely used reporter molecules that form an Au–S bond when interacting with metals, a new class of compounds of aryl diazonium salts, forming metal–C interfacial bonds, has been proposed [141]. The special advantages of this class of compounds are the ability to form several layers of reporters around the metal core with different functions. Recently, Javaid et al. [142] synthesized a new class of boron complexes based on pyridine–pyrazole ligands and proposed their use as reporter molecules. Evaluation of the SERS effect of Raman active dyes on the surface of gold nanoparticles with a size of 40 nm showed the efficiency of boron complexes with the retention of sharp characteristic peaks at a low concentration of the reporter molecule, which is an advantage for their potential use in quantitative analysis.
2.1.4. Protection Strategies for SERS Nanotags
To prevent the desorption of the Raman reporter molecule from the surface and the binding of other molecules to the SERS nanotag, metal nanoparticles modified with the reporter molecule are often coated with a nanoshell. The most common compounds for the formation of a protective shell are polyethylene glycol derivatives, silica, and bovine serum albumin [143,144,145]. Kim et al. used HS-PEG-COOH both to protect gold nanoparticles modified with Raman reporter molecules and to provide binding with antibodies through EDC/NHS coupling chemistry [146]. The formation of the Au–S bond between thiol-PEG and gold nanoparticles stabilized the structure of the SERS nanotag. The combination of magnetic beads as a capture substrate and two SERS nanotags containing Nile Blue A and malachite green isothiocyanate made it possible to detect botulinum toxins A and B. Silica encapsulation is one of the common protection strategies that, due to the ease of modification, biocompatibility, and stability, allows the obtained SERS nanotags to be used for analysis in biological matrices and in a multiplex analysis format [147]. Neng et al. synthesized silica-encapsulated SERS nanotags for the simultaneous detection of pathogenic antigens from West Nile virus, Rift Valley Fever virus, and Yersinia pestis using magnetic nanoparticle-based capture substrates [148].
To ensure the stability of the SERS nanotag to environmental interferents and significantly improve the signal intensity resulting from the formation of hot spots, researchers proposed a core-shell configuration of SERS nanotags, where the Raman reporter molecule is embedded in the gap between the metal core and the shell [145]. Recently, Duffield et al. have optimized the synthesis of silver-coated gold nanoparticles, between which DTNB is embedded, as well as bioconjugation conditions for the use of SERS nanotags in biomedical settings [149]. The authors showed that with an increase in the thickness of the silver shell, the SERS signal was enhanced. Compared to the widespread Ag@Au and Au@Ag, where the core is a spherical Au/Ag nanoparticle, the synthesis of nanorod-shaped metal nanoparticles as a core with a SPR closer to the near infrared region is of greater interest for biosensor development. Thus, Khlebtsov et al. [150] obtained Au@Ag nanorods, the so-called “anisotropic nanomatryoshkas,” and they demonstrated that by varying shell thickness, one can adjust the enhancement effectiveness. In addition, a study was carried out on the influence of the position of the Raman reporter molecule in the SERS nanotag (positioned between the core and the shell or adsorbed on the shell), and it was shown that the protection of the reporter molecule by the metal shell provides a strong and reproducible SERS signal.
2.1.5. Capture Receptor Molecules for Indirect Approach
The specificity of the SERS nanotag toward the molecule of interest is provided by the conjugation of the nanotag to the bioreceptor molecule. To date, there is a range of bioreceptor molecules for designing the SERS nanotag to specifically target the molecule of interest, including antibodies and aptamers. The choice of antibodies is preferable because it allows high-affinity specific binding to the target analyte [151]. SERS-based immunoassay techniques are described to determine bacteria [152], viruses [153], immunoglobulins [154], cancer biomarkers [110,155,156], infection diseases [157], and so on.
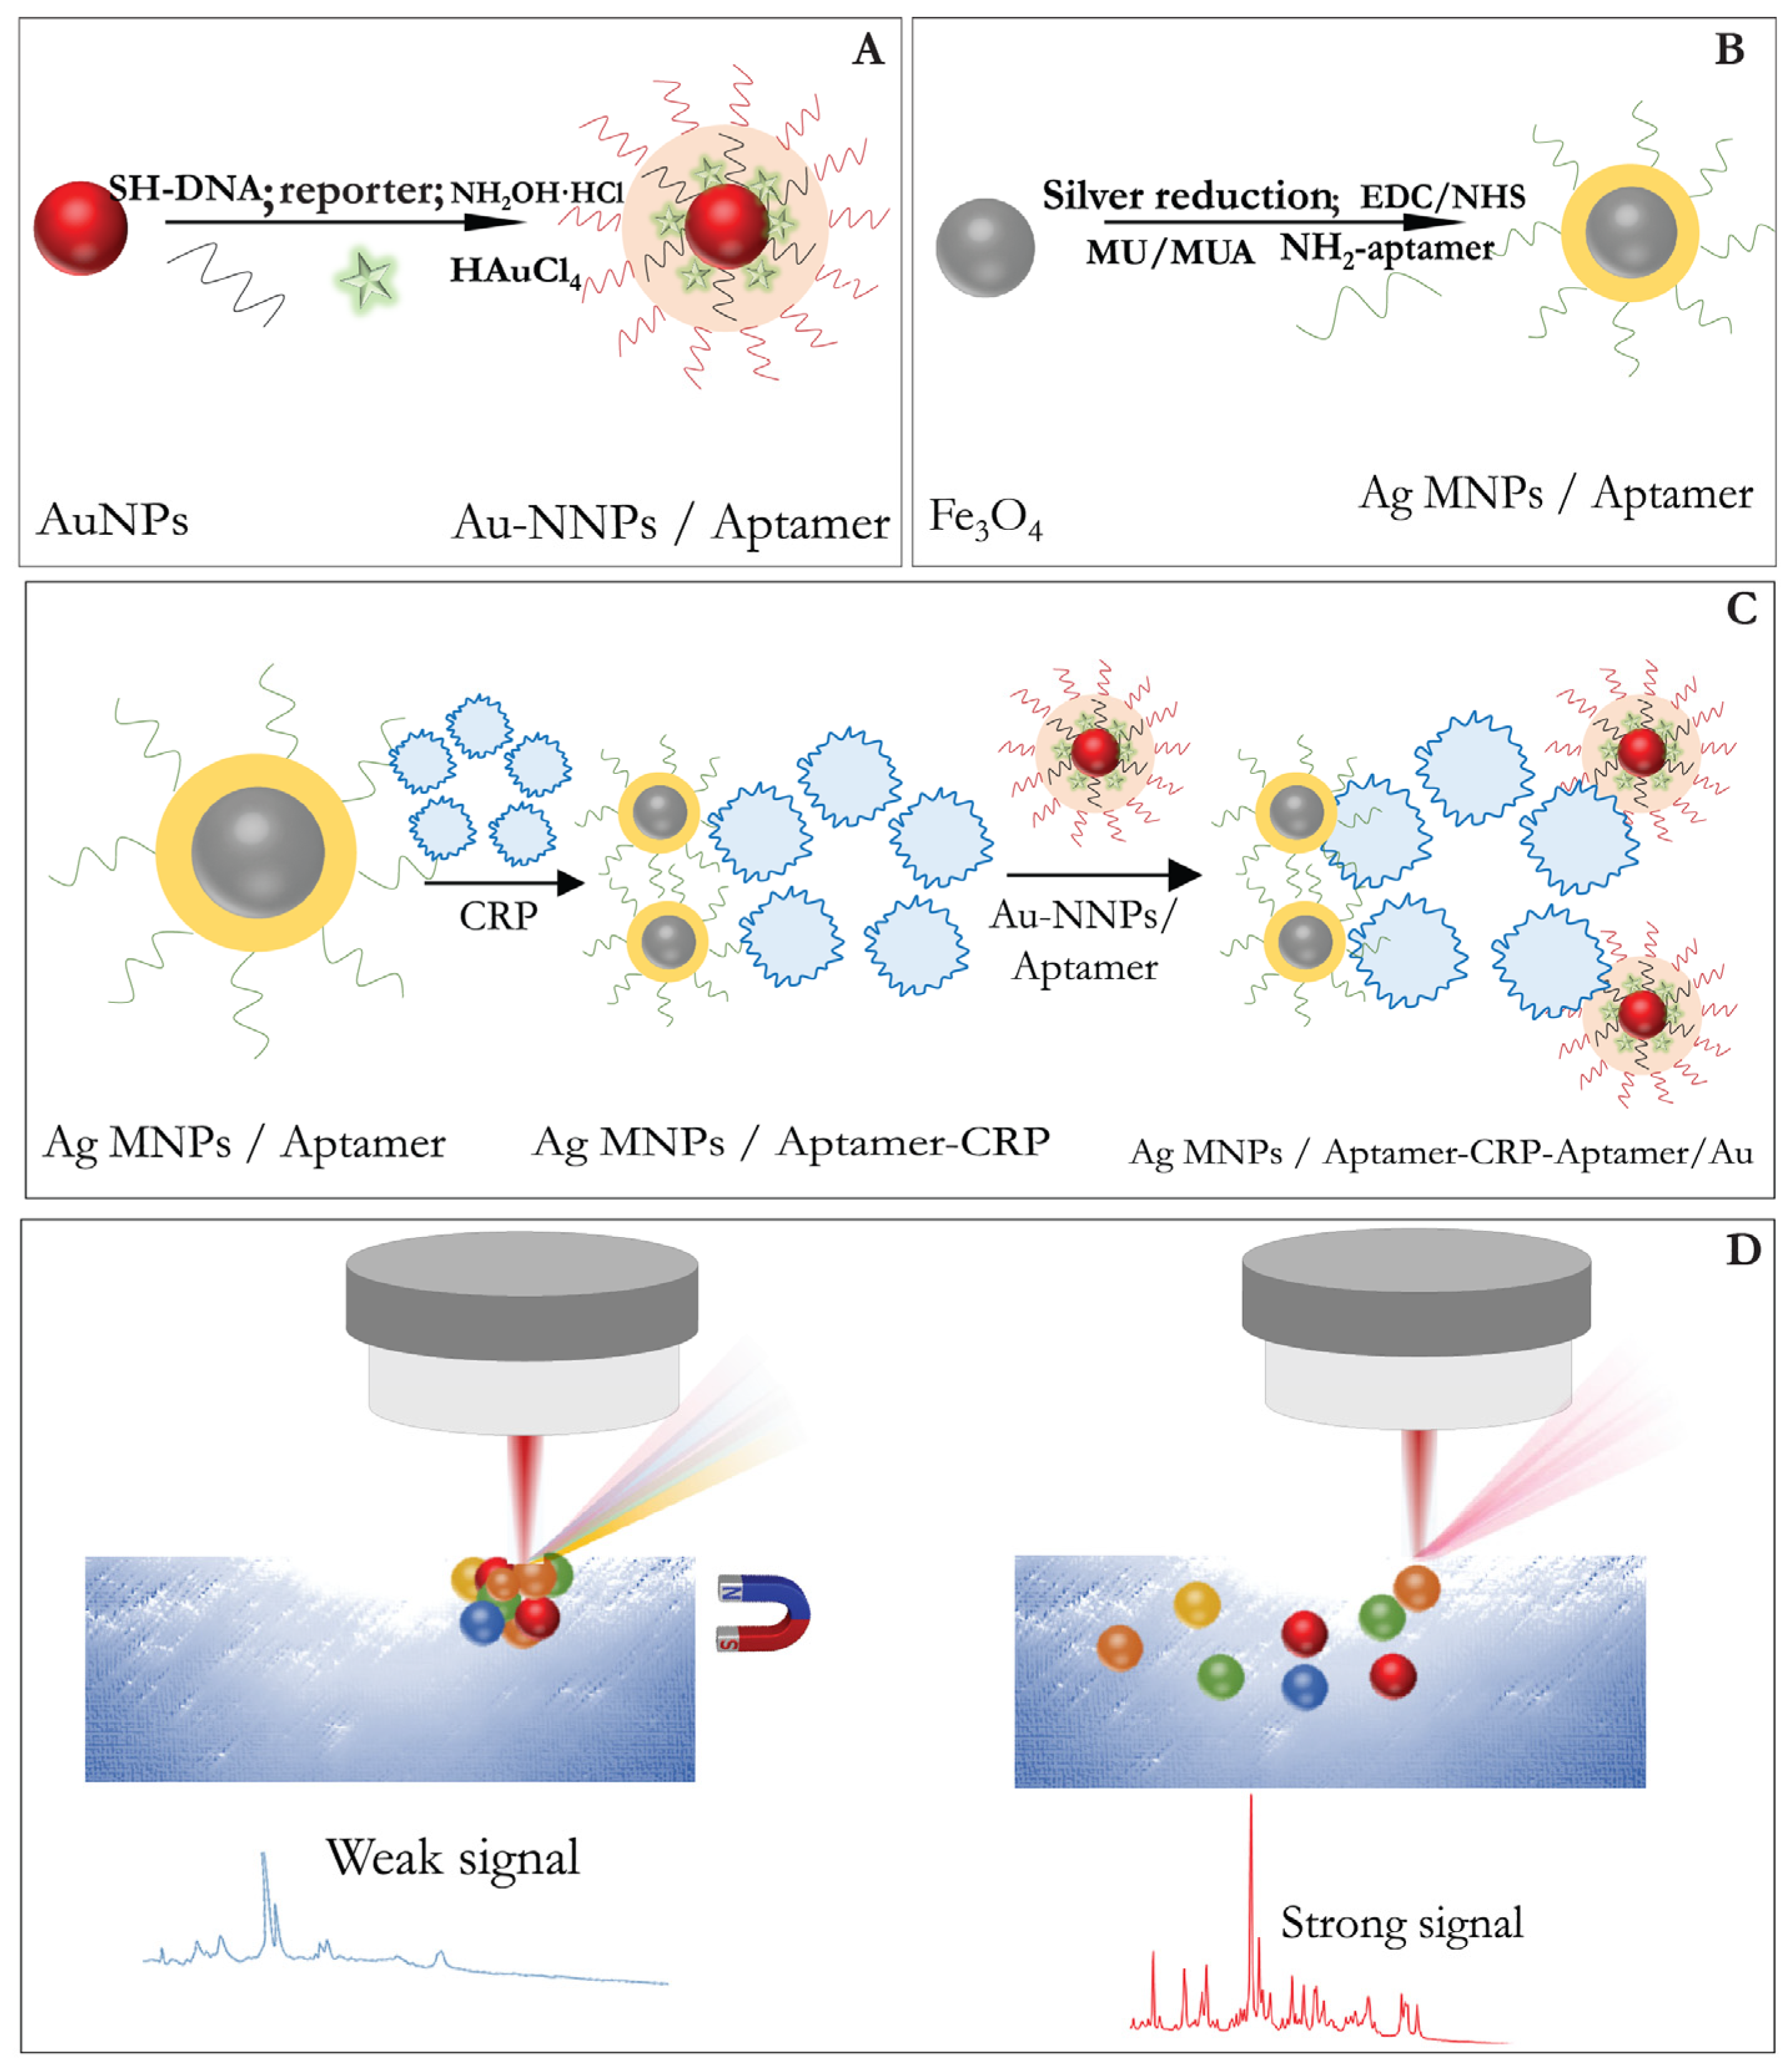
In the implementation of aptamer-based analysis, a sandwich scheme is used when both the SERS-active substrate and the SERS nanotag are functionalized with complementary chains of single-stranded DNA or RNA molecules to form a sandwich complex with the target molecule [158]. These assays have different sequence of stages. Figure 5, drawn in the review, integrates the assay stages for the case, where two kinds of nanoparticles are used as (i) a SERS substrate and a carrier for receptor moleclules, and (ii) a carrier for reporter and receptor molecules. The proposed aptasensor detects C-reactive protein. The primary NH2-functionalized aptamer, was immobilized on silver-coated magnetic nanoparticles (AgMNPs) and used as a capture substrate. Gold-coated magnetic nanoparticles (AuMNPs) modified with reporter molecules and secondary SH-functionalized aptamer, were applied as a detection probe. After the incubation of the CRP with the substrate, the complex AgNPs–CRP was magnetically separated. Thereafter, a detection probe was added to form a sandwich complex, “AgMNPs-CRP-AuMNPs,” the signal of which was recorded after the magnetic separation of the unbound AuMNP-based SERS nanotag. The described scheme of the aptasensor enabled the detection of CRP at a fM concentration range. The indirect sandwich SERS aptasensors were successfully developed for the detection of the insulin-like growth factor 2 receptor protein [159], 17β-estradiol [160], prostate cancer specific pca3 mimic DNA [161], C-reactive protein (CRP) [162], etc.
In recent years, there has been a growing interest in the use of antibody-mimic molecularly imprinted polymers (MIPs) that are prepared through copolymerization in the presence of a template [81]. MIPs are a cost-effective replacement for antibodies that are easily prepared and stable under harsh analytical conditions. Recently, the high sensitivity of the SERS sensors has been demonstrated, provided by the use of MIP-modified SERS substrates [87,88]. For example, Xing et al. first applied MIPs in dual MIP-based plasmonic sandwich assay for neuron-specific enolase detection in human serum [163]. A self-assembling layer of boronic acid-functionalized gold nanoparticles was formed on a glass substrate, and the glycated C-terminal epitope was immobilized through its affinity to boronate. Boronic acid-functionalized silver-coated silica nanoparticles were modified by reporter molecules and N-terminal glycated epitopes. Imprinting layers are formed directly on the surface of the SERS substrate and nanotag by the polycondensation of several silylating reagents containing functional groups capable of interacting with epitope sequences. After the glycated epitopes are washed with an acidic solution of acetonitrile, which destroys non-covalent and boronate bonds, the C-terminal epitope imprinted AuNP-modified glass slide is used as a substrate for capturing a biomarker from complex biological samples, and the SERS nanotag with imprinted N-terminal epitopes is used as a detection probe. Zhu et al. [164] proposed horseradish peroxidase-induced in situ polymerization of MIP-SERS substrate using Au/poly (dimethylsiloxane)/anodized aluminum oxide SERS substrate, patulin as a template, 4-vinyl pyridine as a functional monomer, and 1,4-diacryloylpiperazine as a cross-linker. The effectivity of synthesized MIP-SERS substrate was confirmed by selective and sensitive detection of patulin in real samples.
The choice of bioconjugation method depends on the terminal groups of the ligand on the surface of the SERS substrate. Bioconjugation of substrates containing carboxy or amino groups on the surface is carried out by covalent immobilization with the formation of an amide bond. For example, for silica-encapsulated SERS nanotag, thiol or amino-containing silanes with a bifunctional linker are used to bind to the receptor molecule [165]. In the absence of a stabilizing layer, both simple adsorption of bioreceptor molecules on the surface of the SERS substrate and covalent immobilization can be realized. A review of the applied methods of the conjugation of bioreceptor molecules with SERS substrates is given in the work of Langer et al. [86].
3. Recent Advances of Raman Spectroscopy in Biosensing
To date, the SERS technique is a promising analytical tool that provides a nondestructive and minimally invasive method for in vitro and in vivo analysis, requiring minimal sample preparation. The first and most widespread application of the SERS method for bioanalytical purposes is the immunoassay of various protein markers in biofluids [81,140]. Table 3 summarizes the recent research on the application of indirect SERS-based techniques in homogeneous and heterogeneous formats of biosensors. The homogeneous format of SERS detection implies a mandatory stage of separation of immune complexes and unreacted components, including the unbound SERS nanotag. For this purpose, magnetic nanoparticles are usually used [166,167]. Recently, a new scheme of SERS-based biosensor was proposed, in which the SERS active product is synthesized as a result of the formation of an immunocomplex [166]. The use of nanoparticles simultaneously with enzymes allowed for combining the functions of the carrier of active components of immunoassay (antibodies, antigens) and the enzymatic transformation of substrates [168]. The substrate of alkaline phosphatase, the so-called 5-bromo-4-chloro-3-indolyl phosphate (BCIP), in the immunoassay is hydrolyzed to the inorganic phosphate and sole active compound 5-bromo-4-chloro-3-indole (BCI) [169,170]. The resulting product of the reaction has characteristic bands detected during the SERS immunoassay.
Pham et al. proposed an enzyme-amplified SERS immunoassay for the detection of IgG and prostate-specific antigen. The principle of the method is based on the enzyme-catalyzed reduction of silver in the form of a shell on Au NP-assembled silica NPs modified by a Raman molecule. In the presence of the target analyte, the immune complex labeled with the enzyme alkaline phosphatase triggered the reaction of 2-phospho-l-ascorbic acid into ascorbic acid (AA). In turn, ascorbic acid reduces Ag+ to Ag, forming hot spots that enhance the signal from the SERS of the sample solution. Another example of the formation of the SERS active product is described as the highly sensitive detection of allergens by the SERS-based ratiometric enzyme-linked immunosorbent assay [171]. In the current study, antibody-modified AuNPs doped with a covalent organic framework were applied as the SERS nanotag. This SERS nanotag showed the properties of nanozymes and catalyzed the reduction of a 4-nitrothiophenol substrate with further reduction in the presence of sodium borohydride to 4-aminothiophenol. The latter formed the Au–S bond with gold nanostars, resulting in the formation of Raman hotspots. The concentration of the analyte under study was determined from the ratio of the signal intensities of the characteristic bands of 4-aminothiophenol and 4-nitrothiophenol, respectively. Compared to fluorescence and luminescence, the Raman peaks are narrower, which contributes to the implementation of the multiplex format of SERS analysis [140]. In particular, a multiplex SERS-based immunoassay for pathogen [148], cancer marker [172,173], and toxin [174] detection has been implemented recently. New platforms and advances are discussed below that expand the potential application of SERS biosensors for rapid and point-of-care analysis.
Table 3.
Indirect biosensing using SERS nanotags.
| Analyte | SERS Substrate/Receptor Molecule | Assay | SERS Nanotag | LOD | Sample | Features | Year, Ref. |
|---|---|---|---|---|---|---|---|
| Gp51 antigen of bovine leukemia virus | Magnetic gold nanoparticles (AuNPs)/the native (anti-gp51) and fragmented anti-gp51 antibody (Ab) | Homogenous SERS-based sandwich immunoassay | Gold nanorods modified with 5-thio-nitrobenzoic acid (DTNB) and specific anti-gp51 Ab | 0.95 μg/mL | Milk | Oriented and random Ab immobilization, application of two kinds of nanoparticles | 2013, [175] |
| Escherichia coli (E. coli) | Gold-coated magnetic spherical nanoparticles/polyclonal antibody (pAb) | Homogenous SERS-based sandwich immunoassay | Rod shaped AuNPs modified with DTNB, avidin, and biotin-labeled Ab | 8 cfu/mL | Real water samples | Two kinds of AuNPs | 2011, [153] |
| E. coli and Staphylococcus aureus (S. aureus) | Magnetic beads (400 nm)/anti-E. coli2, anti-S. aureus2 monoclonal antibody (mAb) | Homogenous SERS-based sandwich immunoassay | Poly-l-lysine-coated triple-bond-coded AuNPs modified with 4-cyanobenzenethiol (MBN) | 10 and 25 cfu/mL | Bottled water and milk | Simultaneous detection with “hot spot” effect resulting in a significant enhancement of the Raman signal at 2105 and 2227 cm−1 | 2020, [152] |
| Human immunoglobulin (hIgG) | 100 nm thick gold film evaporated on microscope slide or silicon wafer/goat anti-human IgG Ab | SERS immunoassay of human immunoglobulin | 60 nm gold nanoparticles modified with 4-nitrobenzenethiol (4-NBT) and anti-human IgG Ab | 3 pM on silicon and 28 pM on gold | Standard solution | Comparison of Si wafer and tradition gold surface | 2020, [154] |
| Human IgG, prostate-specific antigen (PSA) | 2D arrays of Au (42 nm-core)@Ag (4.5 nm-shell) NPs on ITO substrate/polyclonal anti H-IgG, PSA mAb | Heterogenous SERS-based sandwich immunoassay | SH-PEG-COOH-coated AuNPs modified with 4-mercaptobenzoic acid (MBA) and anti H-IgG or PSA mAb | 0.3 pg/mL (10 fM) for PSA and 0.05 pg/mL (0.3 fM) for H-IgG | Standard solution | Comparison of the size of AuNPs in SERS nanotag (26, 53, 110 nm) | 2017, [155] |
| Escherichia coli (E. coli) | Spherical gold coated magnetic nanoparticles/pAb | Homogenous SERS-based sandwich immunoassay | Gold nanorods labeled with alkaline phosphatase (ALP) enzyme and also modified with 5-bromo-4-chloro-3-indolyl phosphate (BCIP) and E. coli Ab | 10 cfu mL−1 | Standard solution | ALP activity; BCIP was hydrolyzed to SERS-active product; 5-bromo-4-chloro-3-indole (BCI) | 2018, [166] |
| IgM and IgG to SARS-CoV-2 | No SERS substrate/mouse anti-human IgM and IgG capture Abs | SERS-based LFIA | Gap-enhanced Raman nanotags (GERTs) with 4-nitrobenzenethiol (4-NBT) between core and shell, modified with COVID-19 recombinant antigens (CN97) | 1 ng/mL (IgM), 0.1 ng/mL (IgG) | Standard solution | Simultaneous determination of IgM and IgG | 2021, [176] |
| IgM and IgG to SARS-CoV-2 | No SERS substrate/anti-human IgM and anti-human IgG Abs | SERS-based LFIA | Ag shell on SiO2 core (SiO2@Ag) 5,5-dithiobis-(2-nitrobenzoic acid) modified with dual layers of DTNB and SARS-CoV-2 spike (S) protein | 1.28 × 10⁷-fold dilution by the IUPAC standard method, which is 800 times lower than that of the visualization results | Clinical serum samples (n = 68) | Simultaneous determination of IgM and IgG | 2021, [177] |
| Ferritin (FER) | Hydrophilic AgNPs onto the specific area of the hydrophobic polydimethylsiloxane (PDMS)–hydrophilic/hydrophobic Ag/PDMS/anti-FER Ab | SERS-based LFIA | Raspberry-like AuNPs modified with 4-MBA and anti-FER Ab | 0.41 pg/mL | Standard solution | Combination of SERS substrate and SERS nanotag in LFIA format | 2020, [178] |
| Carcinoembryonic antigen (CEA) | Hydrophilic AgNPs with polymethylmethacrylate (PMMA)/anti-CEA Ab | SERS-based LFIA | Flower-shaped Ag nanoplates modified with crystal violet and anti-CEA Ab | 4.92 pg/mL | Standard solution | Combination of SERS substrate and SERS nanotag in LFIA format | 2021, [156] |
| α-Fetoprotein (AFP) | Few layers of MoS2 nanosheets exfoliated by NaK alloys/capture mAb | SERS-based sandwich immunoassay | Au@AgNCs and R6G–mAb complex | 0.03 pg/mL | Human blood serum samples | The sandwich immunocomplex “capture probe/target/SERS tag” was deposited on a silicon wafer and decorated with silver-coated gold nanocubes to increase the density of “hot spots” on the surface of the immunosensor | 2021, [110] |
| Human immunoglobulin (hIgG) | AuNP array (AuA)-coated solid substrate/rabbit anti-human IgG Ab | SERS-based sandwich immunoassay | AuNPs modified with 4-aminothiophenol (4-ATP) and rabbit anti-human IgG Ab | 0.1 μg mL−1 | Human serum samples | The combination of a SERS substrate based on AuNP array with SERS nanotag resulted in sensitive detection | 2021, [109] |
| Pancreatic cancer marker MUC4 | Immobilization of gold nanoflowers onto thiol-functionalized silicon wafer/Anti-MUC4 Ab | SERS-based sandwich immunoassay | Gold nanoflowers modified with 4-mercaptobenzoic acid and anti-MUC4 Ab | 0.1 ng mL−1 | Standard solution | Raman mapping was applied for a large substrate area to decrease a “spot-to-spot” variation of SERS signal | 2020, [179] |
| IgG/PSA | No SERS substrate/anti-rabbit IgG/anti-PSA Ab | Homogeneous enzyme-amplified SERS immunoassay | AuNP-assembled silica NPs (SiO2@Au-RLC@Ag) with Ag shell modified with 4-aminothiophenol (4-ATP) Polyclonal alkaline phosphatase (AP)-conjugated goat anti-rabbit IgG or AP-streptavidin-biotin-conjugated anti-PSA Ab were used as a tracer Ab to produce ascorbic acid for reduction of Ag+ to Ag | 0.09 ng/mL for IgG and 0.006 ng/mL for PSA | Human serum samples | Enzyme-induced Ag growth on the surface of SERS nanotag to produce the amplification of the SERS signal | 2020, [180] |
| Carcinoembryonic antigen (CEA) | Silver shell magnetic nanoparticles Fe3O4@Ag MNPs/anti-CEA monoclonal antibody | SERRS-based sandwich immunoassay | Silver-coated gold nanorods (Au@AgNRs) modified with diethylthiatricarbocyanineiodide (DTTC), coated with mPEG-SH and conjugated with anti-CEA antibodies | 4.75 fg/mL | Human serum samples | Au@AgNRs were in resonance with the resonant Raman dye DTTC at 785 nm excitation laser | 2016, [181] |
| Mannose-capped lipoarabinomannan (ManLAM) | Resonance Raman-enhanced adlayer of cyanine 5 on a smooth gold surface/polyclonal rabbit antibody for Mycobacterium tuberculosis | SERRS-based sandwich immunoassay | AuNPs modified with 5,5′-dithiobis (succinimidyl-2-nitrobenzoate; DSNB) and MAb to ManLAM | 1.1 ng/mL | Human serum samples | Cy5 modified gold substrates were characterized; the SERRS performance was compared with SERS and revealed a ≈9.3 gain in sensitivity of immunoassay | 2019, [182] |
3.1. Microfluidic SERS-Based Biosensors
One of the directions for improving SERS technique is the combination of detecting devices with microfluidic approaches [183]. Microfluidics allow the researcher to increase analysis productivity by separating reagent streams and simultaneously detecting multiple analytes on a single chip. In addition, the use of microchannels minimizes sample volumes, and the complex configuration of interlaced channels allows for controlled flows, the uniform mixing of reagents, and improved reproducibility of results [184,185]. On the one hand, volume minimization is an obvious improvement in analytical techniques. On the other hand, it imposes more stringent requirements on the sensitivity of tag detection. Therefore, the combination of microfluidics with such a highly sensitive method as SERS seems to be the most logical option. In addition, microchannel detection allows for a high surface-to-volume ratio to be achieved, which is critical for efficient SERS measurements, whereas in-stream analysis reduces sample heating, which is one of the significant limitations of Raman techniques [183,186]. This harmonious combination of the two technologies has given rise to growing interest in the development of microfluidic analytical devices with SERS detection.
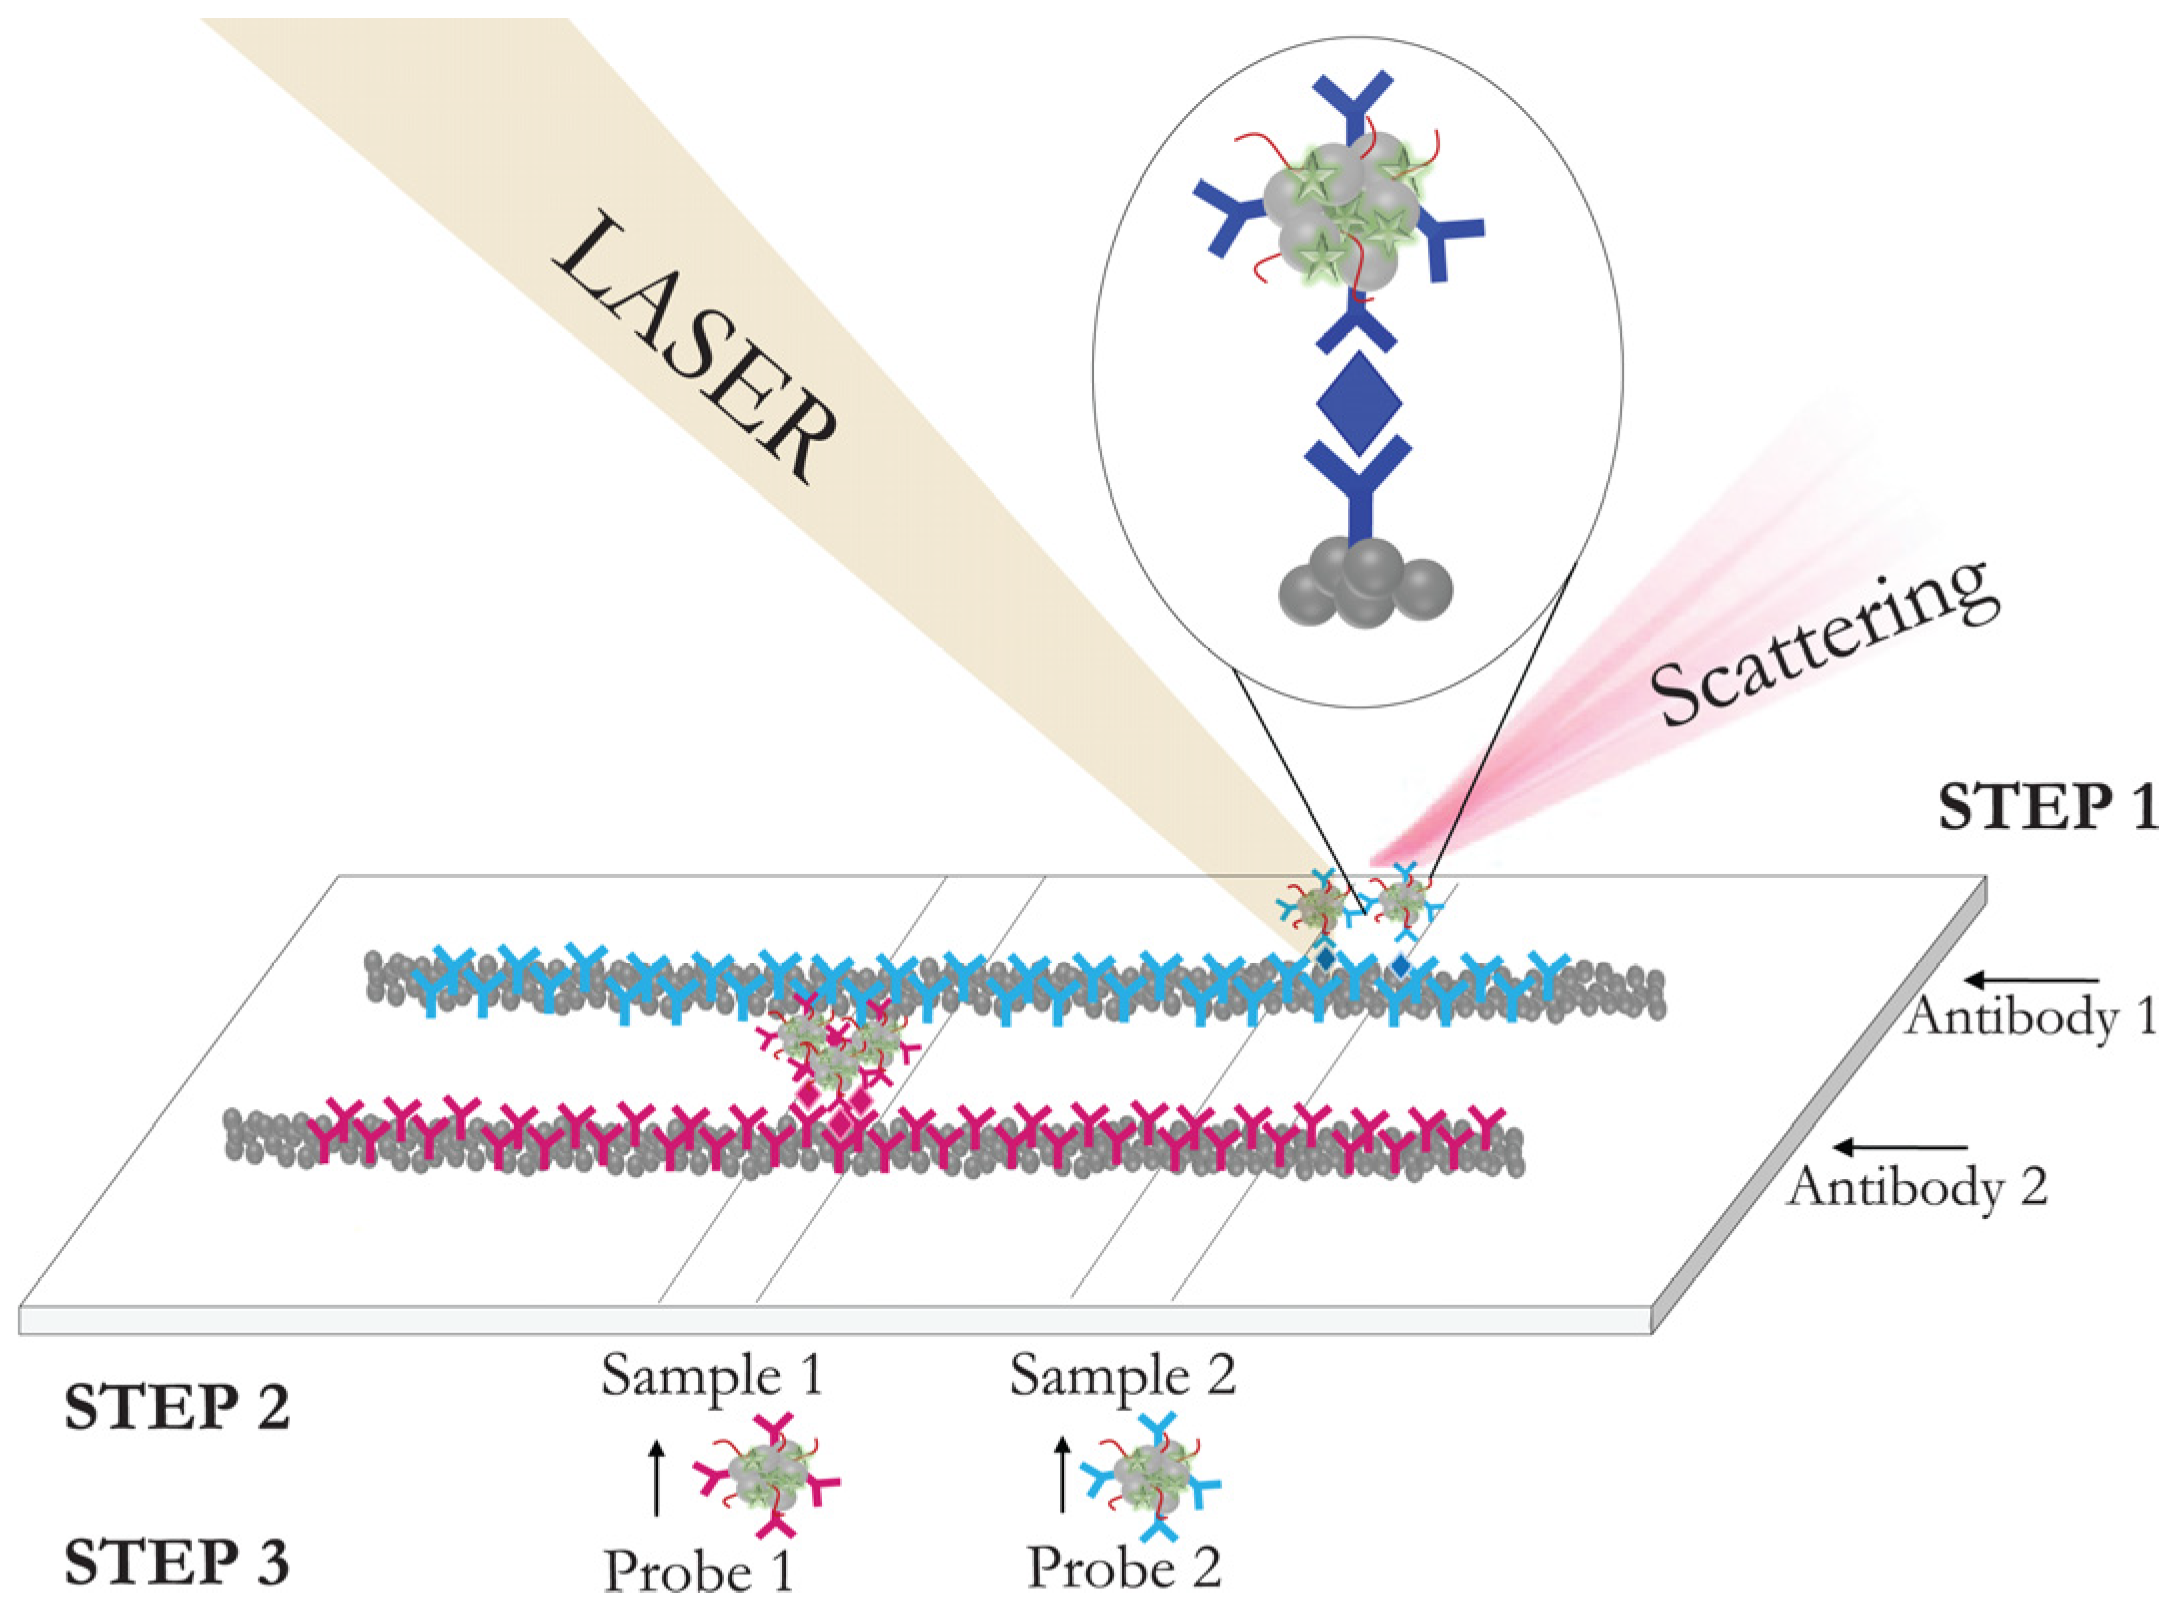
To date, such analytical devices are successfully adapted for the detection of a wide range of analytes, including medicines and drugs [185,187], pesticides [188,189], hormones [190], antibiotics [191], disease markers [184,192,193,194], nucleic acids [195], whole cells [196], and others [186]. Figure 6, drawn in the review, represents the basic principle of measurements that is used in the listed above developments and its application to multi-analysis cases. When individual compounds are detected, the detection limit reaches the fg/mL range, and when detecting cells—single cells in milliliters [196]. The capabilities of separating streams and creating capillary matrices in microfluidic systems are perfectly combined with the capabilities of the simultaneous detection of multiple tags (thanks to the characteristic “fingerprints” of SERS nanotags). This opens up wide possibilities for creating systems for the multiplex detection of various analytes. Chen et al. developed a microfluidic matrix for the simultaneous detection of four markers of inflammation: C reactive protein, interleukin-6, serum amyloid A, and procalcitonin, using labels with SERS-encoded core-surface structures [192]. Multiplex detection can be useful for other tasks as well. For example, Wang et al. simultaneously used three different SERS-labeled molecular probes targeting different epitopes of the same pathogen to ensure the detection of pathogenic targets at the level of individual cells with subspecies specificity [196].
3.2. Integration of SERS with Different Methods
Recently, there has been a tendency in which (i) the conditions for the analysis become more complicated, and (ii) it has become possible to use two methods for determining the analyte content at once. The proposed strategy is a dual detection approach that combines several methods for determining the content of the target analyte or cells, which enables the comparison of approaches under the same conditions in terms of sensitivity or detection limit. Recently, SERS-combined techniques have been summarized in a review by Zhang et al. [197]. Thus, SERS was experimentally integrated with electrochemical techniques [198], fluorescence detection [199], and the polymerase chain reaction (PCR) method [200]. Thus, in the work of Wang et al. [199], nanostars modified with antibodies and aptamers were used to identify circulating tumor cells. Gold nanoflowers were arranged in an orderly manner on the Au-ITO electrode as a substrate and then modified with an aptamer interacting with circulating tumor cells. Nanostars treated with polyethylene glycol followed by the immobilization of two hairpin trigger DNA molecules with fluorescent and reporter tags, as well as antibodies against the determined cells, were used as the SERS nanotag. After the complex was formed on the substrate, it was possible to estimate its amount by the fluorescence intensity or by the Raman shift. When comparing two analytical methods (fluorescence and SERS), the authors showed a twofold reduced limit achieved by SERS detection. Castaño-Guerrero et al. [198] combined the possibility of the simultaneous electrochemical and SERS detection of specific antigen–antibody interactions in the determination of cancer embryonic antigen. Here, the authors used a specific antigen–antibody interaction in a sandwich immunoassay format. The first capturing antibodies were covalently immobilized onto gold screen-printed electrodes modified with cysteamine to form accessible, functional groups for crosslinking with antibodies. The second antibodies were immobilized on gold nanostars together with a reporter molecule (4-ATP). Electrochemical impedance spectroscopy was performed by the authors prior to the addition of the Raman probe to assess the capabilities of electrochemical detection in this format. Thus, the analysis itself was carried out in two stages, and both methods of detection were separated in time. The authors point to a 10-fold gain in sensitivity when using SERS; however, when switching from buffer to serum containing the cancer embryonic antigen, the detection limit dropped by 10 times, which was probably due to the impossibility of avoiding the matrix effect of the blood serum sample.
The dual mode of determining three types of bacteria (Escherichia coli, Salmonella, Staphylococcus aureus) in contaminated milk, with the possibility of qualitative and quantitative determination, was demonstrated by Xu et al. [201]. In this work, two types of nanoparticles were applied: functionalized upconverting nanoparticles as a fluorescent probe and bimetallic (Au@Ag) magnetic nanoparticles modified with 4-mercaptophenylboronic acid (4-MPBA) as a SERS tag. Interestingly, for the interaction, the authors chose a phenylboronic acid derivative, which can be used for binding with the carbohydrate moiety of the wall bacteria. Here, 4-MPBA, as both a SERS reporter and bacteria capturer, was applied for the development, and there was no need to use additional reporters to form a Raman probe. Despite the fact that three different species of bacteria bind the same to the phenylboronic acid residue, the SERS reporter spectra differ for these species. The authors called this the fingerprints of bacteria, that is, the individual differences of bacteria made their own changes in the spectral characteristics of the bacteria used, which made it possible to use this parameter to identify the bacteria in the mixture. Thus, the above study does not so much show the advantage of fluorescence or SERS, but rather shows how this method and the corresponding reporter can be used, as well as how the signal changes depending on whether the bacterium is alive or killed.
Lee et al. [200] proposed the integration of PCR with paper-based SERS for the detection of the bacterial DNA of Mycoplasma pneumoniae as a model. At the first stage, it was necessary to accumulate bacterial DNA by PCR. Silver nanowires were applied to the surface of the paper-based device. In the presence of the target DNA, after several cycles of amplification (0–30), the applied EvaGreen dye was reversibly incorporated into the DNA structure. In this case, the observed SERS signal was low. If the desired DNA was not formed in the process, then the dye would adhere to the silver nanowires on the surface of the paper to form so-called hot spots, and the signal was amplified accordingly. In this case, the SERS signal was read from the surface of the paper. The difference between a positive and a negative result was observed when comparing the intensities at the test and control points.
3.3. SERS-Based Lateral Flow Immunoassay
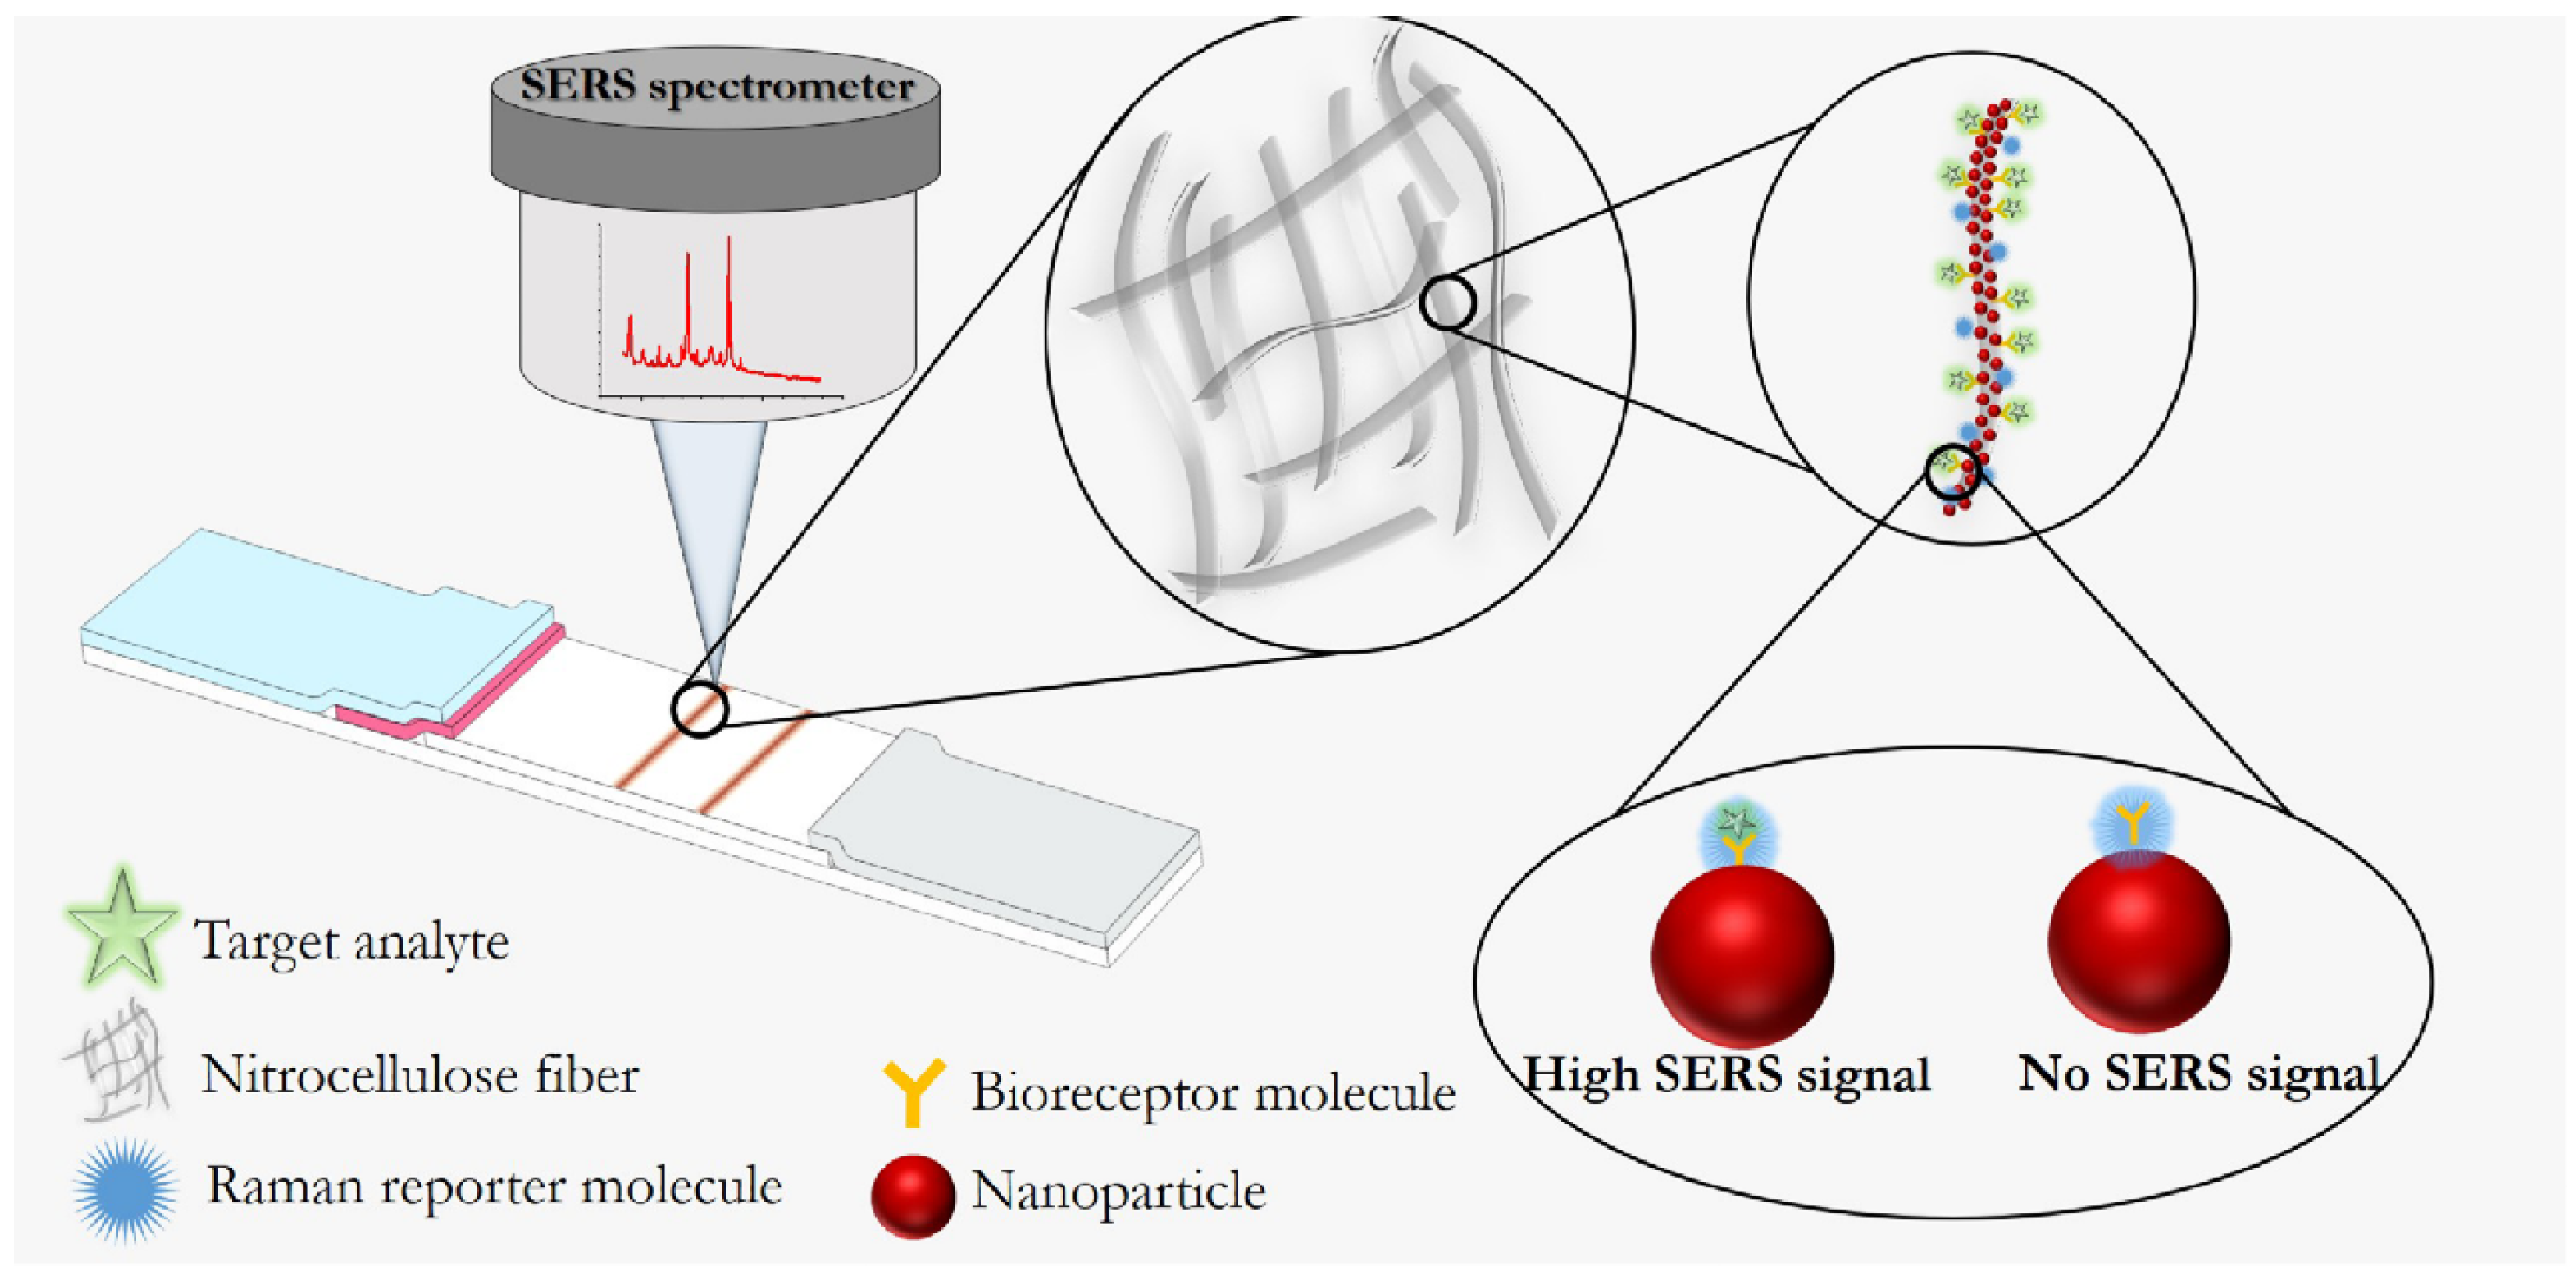
The development of rapid point-of-care systems for the determination of various compounds is a priority direction in life science research. Among the existing approaches, lateral flow immunoassay (LFIA) tests based on antigen–antibody interactions in a flow of reagents on a membrane carrier with the formation of visually detectable nanoparticle-labeled immune complexes are in demand. The indisputable advantages of LFIA are its low cost and ease of testing. However, insufficient sensitivity and insufficiently high-quality (“yes/no”) results reduce the effectiveness of test systems. In this regard, the integration of LFIA with SERS detection is of great interest because capture antibodies immobilized in the test zone concentrate the SERS nanotag, and the lateral flow format of assay allows the study to be carried out without additional washing and separation steps [202]. The recent applications of SERS-based LFIA for target marker detection are shown in Table 3.
The schematic illustration of SERS-based LFIA is given in Figure 7. For the assembly of SERS-based LFIA, antibodies and aptamers (oligonucleotide sequences) are used as receptor molecules to interact with the target compound. The choice of antibodies is preferable because it provides high-affinity specific binding to the target analyte. Nanoparticles of noble metals (most often gold nanoparticles), which are used in traditional LFIA as a detectable label and in SERS immunoassay as part of the nanotag, combine these two analytical methods. This is because the modification of nanoparticles with a reporter and receptor molecules leads to the formation of a SERS nanotag. The result of the interaction of the selected receptor molecules with the analyte will be a change (increase or decrease) in the amount of SERS nanotags bound in the test zone. The spectra of reporter molecules from SERS nanotags make it possible to identify the content of analytes during the formation of an immune complex. Previously, the strategies to design high-performance SERS-based LFIA systems and prospects for their application were summarized in the review by Khlebtsov et al. [203].
In the design of the SERS-based LFIA, an important parameter is the shape of the metal nanoparticles in the SERS nanotag [204]. Sánchez-Purrà et al. [204] provided the comparison of gold nanoparticles of different shapes for the detection of viruses in LFIA. According to the study, nanoflowers, nanostars, and other particles with sharp spikes and corners potentially have advantages for use in SERS-based LFIA because they can have higher signal amplification due to the redistribution of electric fields at the ends. In this regard, it is preferable to use the formed nanoparticles in systems with low sensitivity to improve the performance of the analysis. For example, Lin et al. compared the performance of SERS-based LFIA for the determination of biphenol A using the SERS nanotags based on star-shaped and spherical gold nanoparticles of the same size (40 nm) [205]. The authors showed that the use of SERS nanotags, including gold nanostars modified with 4-ATP and anti-BPA antibodies, can increase the visual and quantitative detection limit of bisphenol A by 20 and 205 times, respectively, compared to gold nanospheres.
A similar efficiency of star-shaped gold nanoparticles was shown for the determination of the nucleoprotein of the influenza virus by the SERS-LFIA method [206]. In this work, the star-shaped nanoparticles with a size of about 100 nm, modified with 4-ATP and monoclonal antibodies specific to nucleoproteins, were used as a SERS nanotag. The detection limit for the influenza virus nucleoprotein was 37 and 300 times better than the characteristics of fluorescent and standard LFIA, correspondingly. The size of nanoparticles also plays an important role in the development of SERS-based LFIA. Chen et al. [176] demonstrated that it is preferable to use particles larger than 40 nm due to the stronger effect of surface electromagnetic amplification and as a result of the higher SERS signal. However, in the synthesis and selection of the SERS nanotag, the most important factors are the stability of the nanoparticles, the quality of the coating, the size of the gap, and the number of reporter molecules per particle, which can be detected using Raman spectrometers.
Thus, Khlebtsov et al. synthesized gold nanorods covered with a gold shell with a gap between the core and shell of 1 nm and the included reporter molecule 1,4-nitrobenzenthiole (NBT), which, after conjugation with specific antibodies, were used as a SERS nanotag in the SERS-LFIA of troponin I [207]. The authors compared the sensitivity of the developed SERS-LFIA and the standard LFIA assembled with the same immunoreagents and showed a 30-fold gain in sensitivity when using the SERS nanotag in conjunction with the SERS signal registration. The efficiency of a 1 nm gap between the metal core and the shell was confirmed in another work [176], where the so-called gold “nanomatreshki” were obtained, consisting of a spherical gold core and a shell with a 4-NBT reporter molecule inserted between the layers. Gap-enhanced nanoparticles were functionalized with a recombinant antigen and used to develop SERS-LFIA for the simultaneous detection of anti-SARS-CoV-2 IgM and IgG antibodies. The sensitivity for IgM and IgG antibodies detection was two orders of magnitude higher than the characteristics of commercial LFIA tests for antibodies to SARS-CoV-2.
Tang and coauthors [156] proposed a new approach for improving the sensitivity of SERS-LFIA that consists in integrating a sandwich scheme of SERS immunoassay with LFIA. Thus, hydrophobic and hydrophilic regions were formed on the analytical membrane in the test and control zones, consisting of a hydrophobic polymethyl methacrylate layer with a sprayed hydrophilic silver layer on which antibodies to carcinoembryonic antigen (anti-CEA) were immobilized. The flower-shaped silver nanoplates modified with a crystal violet reporter molecule and anti-CEA antibodies were used as a SERS nanotag. Ultrasensitive analysis of carcinoembryonic antigen was achieved using the developed SERS-LFIA.
4. Toward Portable Raman Spectrometers
The widespread use of Raman spectroscopy is limited by the need for sophisticated and expensive equipment. Over the past decade, portable and relatively inexpensive Raman spectrometers have been manufactured with a view to making rapid and nondestructive on-site detection available. Table 4 summarizes the development of portable Raman analyzers and their applications for the identification of various objects. Portable spectrometers are equipped with a fixed optical head and a laser with adjustable power. The choice of a suitable laser avoiding fluorescent interference depends on the molecule to be identified. A number of studies have proven the effectiveness of handheld spectrometers for the detection of drugs [208,209,210] and different toxins [211]. Going forward, the miniaturization of equipment has also affected nonlinear optical microscopy techniques, CARS microscopy, and SRS microscopy. The practical implementation of CARS in clinical practice in the form of an endoscope or a miniaturized portable microscope is of great interest, but it is associated with a number of technical difficulties, summarized in the review by Tu and Boppart [212]. Overcoming technical complexities is possible by choosing between Raman spectroscopy over a large spectral range or imaging using single-frequency Raman lasers. Thus, several attempts have been made to design portable CARS imaging systems, including miniaturized CARS microscopes with a single femtosecond laser and custom optics [213] and all-fiber coherent Raman systems [214]. A handheld SRS microscope is also an essential tool for in situ chemical and biological imaging. Liao et al. [215] were the first to develop a miniature SRS microscope based on a time-separated pump and Stokes pulses that ensure there is no nonlinear background. The applicability of the developed SRS microscope was demonstrated by the chemical imaging of pesticide residues in spinach leaves and cancerous tissues and the study of several other objects.
The integration of LFIA test strips with portable SERS readout devices is a promising direction for point-of-care testing because it will expand the scope of rapid tests, enable multiplex assays, and improve their effectiveness by moving from qualitative to quantitative analysis. Thus, Tran et al. [216] constructed portable SERS-based LFIA for human chorionic gonadotropin. The design of the device included a fiber optical probe with a linear focus and a miniature 785 nm laser diode. The test zone of the LFIA strip was scanned using a motorized stage; the acquisition time for one strip was 5 s. The detection limit for hCG, achieved using a portable Raman spectrometer, was 15 times lower than that of commercial LFIA tests. Recently, Xiao et al. [217] reported a portable SERS-based LFIA for the simultaneous detection of alpha-fetoprotein (AFP), carcinoembryonic antigen (CEA), and prostate-specific antigen (PSA). The authors designed a multichannel LFIA reaction column with a 785 nm miniature diode laser and a stepper motor that moves the test strips inserted into the column in the desired direction. The Raman probe allows the automatic and point-by-point registration of Raman signals at several points of the test zone, whereas the acquisition time is 1 s for one test zone. The obtained values of the intensities of the Raman signal are averaged over all points using the developed software. Compared to ELISA, the proposed portable SERS-LFIA allows for more accurate and quick determination of biomarkers. However, with the transition to portable Raman spectrometers, a decrease in sensitivity is often noted in comparison with laboratory massive devices. Therefore, the design of portable handheld SERS-based LFIA tests combining the high sensitivity of the SERS technique and the rapidity of the LFIA remains an urgent direction of development.
5. Conclusions and Future Prospects
This review summarizes and presents the achievements of Raman spectroscopy methods and derivatives, CARS, SRS, RRS, and SERS, as well as their combination and association with bioanalytical and microscopic methods. Fundamental aspects of these methods are briefly summarized. The phenomenon of Raman scattering and approaches to its registration underlie spectroscopic research in various fields of life sciences, including biology, biochemistry, biotechnology, and medicine. Raman spectroscopy techniques are used for the noninvasive, label-free identification of molecules and the determination of their chemical composition and spatial orientation. In addition, they find their application for the hyperspectral imaging of the localization and number of molecules in biological objects and environments. CARS and SRS make it possible to increase the signal intensity at certain wavelengths that are in resonance with the natural vibrations of the molecule, which opens up additional opportunities for the highly selective spectral visualization of the objects under study. The limitations of nonlinear Raman spectroscopy and approaches to their resolution are briefly described. In this review, special attention is paid to the combination of SERS upon contact or close proximity of the target molecule with a metal substrate, with techniques of nonlinear Raman spectroscopy and RRS, and with immunochemical methods that ensure the detection of compounds with high sensitivity and specificity. This review summarizes the existing approaches for the formation of SERS substrates and nanotags, as well as schemes for the SERS-based analysis of molecules. The potential of using SERS-based techniques as a method for detecting immunochemical interactions is obvious and is supported by a number of successful developments discussed in this review.
However, the use of SERS-based techniques in the detection and imaging of various molecules may be limited by several factors. First, the main problem is in measuring Raman spectra and applying this method for the quantitative analysis of a substance is associated with the inhomogeneous distribution of “hot spots” on the surface of the substrate, which contributes to significant changes in the reproducibility of the SERS signal. This problem of the preparation of SERS-active substrates is described by many authors who offer their solutions [218,219,220]; however, it has not yet been possible to develop a fundamentally new scheme for the fabrication of nanocomposite materials with the ideally uniform distribution of hot spots. Moreover, much attention needs to be paid to the study of a wider range of molecules of different origins, which find their application in life science [221]. The compilation of a public database of Raman spectra based on research data will provide the fast and reliable identification of unknown analytes by comparing the obtained data with the reference data. Along with this, in most works, there is no validation of the developed SERS-based biosensors. However, at present, isolated cases of the use of such techniques in clinical practice are already known, which indicates future high growth in the development of not only fundamental research but also technological applications in the medical and biological fields. Moreover, the ongoing development of standardized procedures for obtaining SERS substrates and nanotags that provide a high and reproducible signal, as well as miniaturization of spectrometers and the transition to portable devices for biosensing and imaging, are a huge step toward successfully removing the limitations of the Raman techniques.
Author Contributions
Conceptualization, K.V.S.; methodology, K.V.S. and A.V.Z.; formal analysis, K.V.S., A.N.B. and D.V.S.; investigation, K.V.S., A.N.B., D.V.S. and A.V.Z.; writing—original draft preparation, K.V.S., A.N.B. and D.V.S.; writing—review and editing, K.V.S., A.V.Z. and B.B.D.; visualization, K.V.S.; supervision, B.B.D. All authors have read and agreed to the published version of the manuscript.
Funding
This research was funded by the Russian Science Foundation, grant number 21-74-20155.
Institutional Review Board Statement
Not applicable.
Informed Consent Statement
Not applicable.
Acknowledgments
The authors are grateful to N.S. Komova (Research Center of Biotechnology of the Russian Academy of Sciences) for assistance in preparation of illustrative material.
Conflicts of Interest
The authors declare no conflict of interest. The funders had no role in the design of the study; in the collection, analyses, or interpretation of data; in the writing of the manuscript; or in the decision to publish the results.
References
- Tanwar, S.; Paidi, S.K.; Prasad, R.; Pandey, R.; Barman, I. Advancing Raman spectroscopy from research to clinic: Translational potential and challenges. Spectrochim. Acta Part A Mol. Biomol. Spectrosc. 2021, 260, 119957. [Google Scholar] [CrossRef]
- Li, Y.-S.; Church, J.S. Raman spectroscopy in the analysis of food and pharmaceutical nanomaterials. J. Food Drug Anal. 2014, 22, 29–48. [Google Scholar] [CrossRef] [Green Version]
- Raman, C.V.; Krishnan, K.S. A new type of secondary radiation. Nature 1928, 121, 501–502. [Google Scholar] [CrossRef]
- Andrews, D.L. Rayleigh Scattering and Raman Effect, Theory. In Encyclopedia of Spectroscopy and Spectrometry, 3rd ed.; Lindon, J.C., Tranter, G.E., Koppenaal, D.W., Eds.; Academic Press: Oxford, UK, 2017; pp. 924–930. [Google Scholar]
- Porto, S.P.S.; Wood, D.L. Ruby optical maser as a Raman source. J. Opt. Soc. Am. 1962, 52, 251–252. [Google Scholar] [CrossRef]
- Demtröder, W. Laser Raman Spectroscopy. In Laser Spectroscopy: Basic Concepts and Instrumentation; Demtröder, W., Ed.; Springer: Berlin/Heidelberg, Germany, 2003; pp. 499–530. [Google Scholar]
- Wetzel, H.; Gerischer, H. Surface enhanced Raman scattering from pyridine and halide ions adsorbed on silver and gold sol particles. Chem. Phys. Lett. 1980, 76, 460–464. [Google Scholar] [CrossRef]
- Moskovits, M.; DiLella, D.P. Surface-enhanced Raman spectroscopy of benzene and benzene-d6 adsorbed on silver. J. Chem. Phys. 1980, 73, 6068–6075. [Google Scholar] [CrossRef]
- Almehmadi, L.M.; Curley, S.M.; Tokranova, N.A.; Tenenbaum, S.A.; Lednev, I.K. Surface enhanced Raman spectroscopy for single molecule protein detection. Sci. Rep. 2019, 9, 12356. [Google Scholar] [CrossRef] [Green Version]
- Wang, H.-N.; Register, J.K.; Fales, A.M.; Gandra, N.; Cho, E.H.; Boico, A.; Palmer, G.M.; Klitzman, B.; Vo-Dinh, T. Surface-enhanced Raman scattering nanosensors for in vivo detection of nucleic acid targets in a large animal model. Nano Res. 2018, 11, 4005–4016. [Google Scholar] [CrossRef]
- Saletnik, A.; Saletnik, B.; Puchalski, C. Overview of popular techniques of Raman spectroscopy and their potential in the study of plant tissues. Molecules 2021, 26, 1537. [Google Scholar] [CrossRef]
- Robert, B. Resonance Raman spectroscopy. Photosynth. Res. 2009, 101, 147–155. [Google Scholar] [CrossRef]
- Efremov, E.V.; Ariese, F.; Gooijer, C. Achievements in resonance Raman spectroscopy review of a technique with a distinct analytical chemistry potential. Anal. Chim. Acta 2008, 606, 119–134. [Google Scholar] [CrossRef]
- Cheng, J.-X.; Xie, X.S. Coherent anti-Stokes Raman scattering microscopy: Instrumentation, theory, and applications. J. Phys. Chem. B 2004, 108, 827–840. [Google Scholar] [CrossRef]
- Djaker, N.; Lenne, P.-F.; Marguet, D.; Colonna, A.; Hadjur, C.; Rigneault, H. Coherent anti-Stokes Raman scattering microscopy (CARS): Instrumentation and applications. Nucl. Instrum. Methods Phys. Res. Sect. A Accel. Spectrom. Detect. Assoc. Equip. 2007, 571, 177–181. [Google Scholar] [CrossRef]
- Haynes, C.L.; McFarland, A.D.; Van Duyne, R.P. Surface-enhanced Raman spectroscopy. Anal. Chem. 2005, 77, 338A–346A. [Google Scholar] [CrossRef] [Green Version]
- Pérez-Jiménez, A.I.; Lyu, D.; Lu, Z.; Liu, G.; Ren, B. Surface-enhanced Raman spectroscopy: Benefits, trade-offs and future developments. Chem. Sci. 2020, 11, 4563–4577. [Google Scholar] [CrossRef] [Green Version]
- Tahir, M.A.; Dina, N.E.; Cheng, H.; Valev, V.K.; Zhang, L. Surface-enhanced Raman spectroscopy for bioanalysis and diagnosis. Nanoscale 2021, 13, 11593–11634. [Google Scholar] [CrossRef] [PubMed]
- Kumar, N.; Mignuzzi, S.; Su, W.; Roy, D. Tip-enhanced Raman spectroscopy: Principles and applications. EPJ Tech. Instrum. 2015, 2, 9. [Google Scholar] [CrossRef] [Green Version]
- Mahapatra, S.; Li, L.; Schultz, J.F.; Jiang, N. Tip-enhanced Raman spectroscopy: Chemical analysis with nanoscale to angstrom scale resolution. J. Chem. Phys. 2020, 153, 010902. [Google Scholar] [CrossRef]
- Shipp, D.; Sinjab, F.; Notingher, I. Raman spectroscopy: Techniques and applications in the life sciences. Adv. Opt. Photonics 2017, 9, 315. [Google Scholar] [CrossRef] [Green Version]
- Ruban, A.V.; Horton, P.; Robert, B. Resonance Raman spectroscopy of the photosystem II light-harvesting complex of green plants: A comparison of trimeric and aggregated states. Biochemistry 1995, 34, 2333–2337. [Google Scholar] [CrossRef]
- Gall, A.; Pascal, A.A.; Robert, B. Vibrational techniques applied to photosynthesis: Resonance Raman and fluorescence line-narrowing. Biochim. Biophys. Acta 2015, 1847, 12–18. [Google Scholar] [CrossRef]
- Kuhar, N.; Sil, S.; Umapathy, S. Potential of Raman spectroscopic techniques to study proteins. Spectrochim. Acta A Mol. Biomol. Spectrosc. 2021, 258, 119712. [Google Scholar] [CrossRef]
- Nahmad-Rohen, A.; Regan, D.; Masia, F.; McPhee, C.; Pope, I.; Langbein, W.; Borri, P. Quantitative label-free imaging of lipid domains in single bilayers by hyperspectral coherent Raman scattering. Anal. Chem. 2020, 92, 14657–14666. [Google Scholar] [CrossRef] [PubMed]
- Chiu, L.-d.; Ho, S.-H.; Shimada, R.; Ren, N.-Q.; Ozawa, T. Rapid in vivo lipid/carbohydrate quantification of single microalgal cell by Raman spectral imaging to reveal salinity-induced starch-to-lipid shift. Biotechnol. Biofuels 2017, 10, 9. [Google Scholar] [CrossRef] [Green Version]
- Peña-Rodríguez, O.; Pal, U. Geometrical Tunability of linear optical response of silica−gold double concentric nanoshells. J. Phys. Chem. C 2010, 114, 4414–4417. [Google Scholar] [CrossRef]
- Sun, J.; Li, W.; Zhu, X.; Jiao, S.; Chang, Y.; Wang, S.; Dai, S.; Xu, R.; Dou, M.; Li, Q.; et al. A novel multiplex mycotoxin surface-enhanced Raman Spectroscopy immunoassay using functional gold nanotags on a silica photonic crystal microsphere biochip. J. Agric. Food Chem. 2021, 69, 11494–11501. [Google Scholar] [CrossRef] [PubMed]
- Tripathi, R.M.; Park, S.H.; Kim, G.; Kim, D.-H.; Ahn, D.; Kim, Y.M.; Kwon, S.J.; Yoon, S.-Y.; Kang, H.J.; Chung, S.J. Metal-induced redshift of optical spectra of gold nanoparticles: An instant, sensitive, and selective visual detection of lead ions. Int. Biodeterior. Biodegrad. 2019, 144, 104740. [Google Scholar] [CrossRef]
- Henry, A.-I.; Sharma, B.; Cardinal, M.F.; Kurouski, D.; Van Duyne, R.P. Surface-enhanced Raman spectroscopy biosensing: In vivo diagnostics and multimodal imaging. Anal. Chem. 2016, 88, 6638–6647. [Google Scholar] [CrossRef]
- Laing, S.; Jamieson, L.E.; Faulds, K.; Graham, D. Surface-enhanced Raman spectroscopy for in vivo biosensing. Nat. Rev. Chem. 2017, 1, 0060. [Google Scholar] [CrossRef]
- Huang, L.-S.; Lin, K.-C. Detection of iron species using inductively coupled plasma mass spectrometry under cold plasma temperature conditions. Spectrochim. Acta Part B At. Spectrosc. 2001, 56, 123–128. [Google Scholar] [CrossRef]
- Wei, C.; Xu, M.-M.; Fang, C.-W.; Jin, Q.; Yuan, Y.-X.; Yao, J.-L. Improving the sensitivity of immunoassay based on MBA-embedded Au@SiO2 nanoparticles and surface enhanced Raman spectroscopy. Spectrochim. Acta Part A Mol. Biomol. Spectrosc. 2017, 175, 262–268. [Google Scholar] [CrossRef]
- Machtoub, L.; Pfeiffer, R.; Backovic, A.; Frischauf, S.; Wick, M.C. Molecular imaging cellular SPIO uptake with nonlinear optical microscopy. J. Med. Imaging Radiat. Sci. 2010, 41, 159–164. [Google Scholar] [CrossRef]
- Schlücker, S.; Salehi, M.; Bergner, G.; Schütz, M.; Ströbel, P.; Marx, A.; Petersen, I.; Dietzek, B.; Popp, J. Immuno-surface-enhanced coherent anti-Stokes Raman scattering microscopy: Immunohistochemistry with target-specific metallic nanoprobes and nonlinear Raman microscopy. Anal. Chem. 2011, 83, 7081–7085. [Google Scholar] [CrossRef]
- Kenison, J.P.; Fast, A.; Guo, F.; LeBon, A.; Jiang, W.; Potma, E.O. Imaging properties of surface-enhanced coherent anti-Stokes Raman scattering microscopy on thin gold films. J. Opt. Soc. Am. B 2017, 34, 2104–2114. [Google Scholar] [CrossRef]
- McNay, G.; Eustace, D.; Smith, W.E.; Faulds, K.; Graham, D. Surface-enhanced Raman scattering (SERS) and surface-enhanced resonance Raman scattering (SERRS): A review of applications. Appl. Spectrosc. 2011, 65, 825–837. [Google Scholar] [CrossRef] [PubMed]
- Kelley, A. Resonance Raman and resonance hyper-Raman intensities: Structure and dynamics of molecular excited states in solution. J. Phys. Chem. A 2008, 112, 11975–11991. [Google Scholar] [CrossRef] [PubMed]
- Finnie, P.; Ouyang, J.; Lefebvre, J. Full Spectrum Raman Excitation Mapping Spectroscopy. Sci. Rep. 2020, 10, 9172. [Google Scholar] [CrossRef]
- Czernuszewicz, R.; Zaczek, M. Resonance Raman Spectroscopy. In Encyclopedia of Inorganic Chemistry; Wiley: New York, NY, USA, 2008. [Google Scholar] [CrossRef]
- Andreeva, A.; Velitchkova, M. Resonance Raman studies of carotenoid molecules within Photosystem I particles. Biotechnol. Biotechnol. Equip. 2009, 23, 488–492. [Google Scholar] [CrossRef] [Green Version]
- Tracewell, C.A.; Cua, A.; Bocian, D.F.; Brudvig, G.W. Resonance Raman spectroscopy of carotenoids in Photosystem II core complexes. Photosynth. Res. 2005, 83, 45–52. [Google Scholar] [CrossRef]
- Ioannou, A.; Pinakoulaki, E. Resonance Raman detection of the heme Fe(II)-NO/2-nitrovinyl species in myoglobin. J. Mol. Struct. 2018, 1152, 257. [Google Scholar] [CrossRef]
- Smulevich, G. Solution and crystal phase resonance Raman spectroscopy: Valuable tools to unveil the structure and function of heme proteins. J. Porphyr. Phthalocyanines 2019, 23, 691–700. [Google Scholar] [CrossRef]
- Liu, Y.; Kincaid, J.R. Resonance Raman studies of gas sensing heme proteins. J. Raman Spectrosc. Reson. 2021, 1. [Google Scholar] [CrossRef]
- Ashton, L.; Xu, Y.; Brewster, V.L.; Cowcher, D.P.; Sellick, C.A.; Dickson, A.J.; Stephens, G.M.; Goodacre, R. The challenge of applying Raman spectroscopy to monitor recombinant antibody production. Analyst 2013, 138, 6977–6985. [Google Scholar] [CrossRef] [PubMed]
- Cialla-May, D.; Schmitt, M.; Popp, J. Theoretical principles of Raman spectroscopy. Phys. Sci. Rev. 2019, 4. [Google Scholar] [CrossRef]
- Bai, S.; Sugioka, K. Recent Advances in the fabrication of highly sensitive surface-enhanced Raman scattering substrates: Nanomolar to attomolar level sensing. Light Adv. Manuf. 2021, 2, 13. [Google Scholar] [CrossRef]
- Ouyang, L.; Ren, W.; Zhu, L.; Irudayaraj, J. Prosperity to challenges: Recent approaches in SERS substrate fabrication. Rev. Anal. Chem. 2017, 36, 20160027. [Google Scholar] [CrossRef]
- Moura, C.C.; Tare, R.S.; Oreffo, R.O.; Mahajan, S. Raman spectroscopy and coherent anti-Stokes Raman scattering imaging: Prospective tools for monitoring skeletal cells and skeletal regeneration. J. R. Soc. Interface 2016, 13. [Google Scholar] [CrossRef] [PubMed] [Green Version]
- Prince, R.; Potma, E. Coherent Raman scattering microscopy: Capable solution in search of a larger audience. J. Biomed. Opt. 2021, 26, 060601. [Google Scholar] [CrossRef]
- Arora, R.; Petrov, G.I.; Yakovlev, V.V. Analytical capabilities of coherent anti-Stokes Raman scattering microspectroscopy. J. Mod. Opt. 2008, 55, 3237–3254. [Google Scholar] [CrossRef] [PubMed]
- Duncan, M.D.; Reintjes, J.; Manuccia, T.J. Scanning coherent anti-Stokes Raman microscope. Opt. Lett. 1982, 7, 350–352. [Google Scholar] [CrossRef] [PubMed]
- Zumbusch, A.; Holtom, G.R.; Xie, X.S. Three-dimensional vibrational imaging by coherent anti-Stokes Raman scattering. Phys. Rev. Lett. 1999, 82, 4142–4145. [Google Scholar] [CrossRef] [Green Version]
- Ogilvie, J.; Beaurepaire, E.; Alexandrou, A.; Joffre, M. Fourier-transform coherent anti-Stokes Raman scattering microscopy. Opt. Lett. 2006, 31, 480–482. [Google Scholar] [CrossRef] [PubMed] [Green Version]
- Kinegawa, R.; Hiramatsu, K.; Hashimoto, K.; Badarla, V.R.; Ideguchi, T.; Goda, K. High-speed broadband Fourier-transform coherent anti-stokes Raman scattering spectral microscopy. J. Raman Spectrosc. 2019, 50, 1141–1146. [Google Scholar] [CrossRef]
- Littleton, B.; Shah, P.; Kavanagh, T.; Richards, D. Three-color coherent anti-Stokes Raman scattering with optical nonresonant background removal. J. Raman Spectrosc. 2019, 50, 1303–1310. [Google Scholar] [CrossRef]
- Schie, I.W.; Weeks, T.; McNerney, G.P.; Fore, S.; Sampson, J.K.; Wachsmann-Hogiu, S.; Rutledge, J.C.; Huser, T. Simultaneous forward and epi-CARS microscopy with a single detector by time-correlated single photon counting. Opt. Express 2008, 16, 2168–2175. [Google Scholar] [CrossRef] [Green Version]
- Lee, J.Y.; Kim, S.-H.; Moon, D.W.; Lee, E.S. Three-color multiplex CARS for fast imaging and microspectroscopy in the entire CHn stretching vibrational region. Opt. Express 2009, 17, 22281–22295. [Google Scholar] [CrossRef]
- Guerenne-Del Ben, T.; Rajaofara, Z.; Couderc, V.; Sol, V.; Kano, H.; Leproux, P.; Petit, J.-M. Multiplex coherent anti-Stokes Raman scattering highlights state of chromatin condensation in CH region. Sci. Rep. 2019, 9, 13862. [Google Scholar] [CrossRef] [Green Version]
- Valensise, C.M.; Giuseppi, A.; Vernuccio, F.; De la Cadena, A.; Cerullo, G.; Polli, D. Removing non-resonant background from CARS spectra via deep learning. APL Photonics 2020, 5, 061305. [Google Scholar] [CrossRef]
- Le, T.T.; Yue, S.; Cheng, J.X. Shedding new light on lipid biology with coherent anti-Stokes Raman scattering microscopy. J. Lipid Res. 2010, 51, 3091–3102. [Google Scholar] [CrossRef] [Green Version]
- Shao, Y.; Gu, W.; Jiang, L.; Zhu, Y.; Gong, A. Study on the visualization of pigment in haematococcus pluvialis by Raman spectroscopy technique. Sci. Rep. 2019, 9, 12097. [Google Scholar] [CrossRef]
- Egawa, M. Raman microscopy for skin evaluation. Analyst 2021, 146, 1142–1150. [Google Scholar] [CrossRef]
- Cui, S.; Zhang, S.; Yue, S. Raman spectroscopy and imaging for cancer diagnosis. J. Healthc. Eng. 2018, 2018, 8619342. [Google Scholar] [CrossRef] [PubMed]
- Guerenne-Del Ben, T.; Couderc, V.; Duponchel, L.; Sol, V.; Leproux, P.; Petit, J.M. Multiplex coherent anti-Stokes Raman scattering microspectroscopy detection of lipid droplets in cancer cells expressing TrkB. Sci. Rep. 2020, 10, 16749. [Google Scholar] [CrossRef]
- Kim, S.-H.; Lee, E.-S.; Lee, J.Y.; Lee, E.S.; Lee, B.-S.; Park, J.E.; Moon, D.W. Multiplex coherent anti-Stokes Raman spectroscopy images intact atheromatous lesions and concomitantly identifies distinct chemical profiles of atherosclerotic lipids. Circ. Res. 2010, 106, 1332–1341. [Google Scholar] [CrossRef] [PubMed]
- Owyoung, A.; Jones, E.D. Stimulated Raman spectroscopy using low-power cw lasers. Opt. Lett. 1977, 1, 152–154. [Google Scholar] [CrossRef]
- Freudiger, C.W.; Min, W.; Saar, B.G.; Lu, S.; Holtom, G.R.; He, C.; Tsai, J.C.; Kang, J.X.; Xie, X.S. Label-Free biomedical imaging with high sensitivity by stimulated Raman scattering microscopy. Science 2008, 322, 1857–1861. [Google Scholar] [CrossRef] [Green Version]
- Li, J.; Lin, P.; Tan, Y.; Cheng, J.X. Volumetric stimulated Raman scattering imaging of cleared tissues towards three-dimensional chemical histopathology. Biomed. Opt. Express 2019, 10, 4329–4339. [Google Scholar] [CrossRef] [PubMed]
- Ji, M.; Lewis, S.; Camelo-Piragua, S.; Ramkissoon, S.H.; Snuderl, M.; Venneti, S.; Fisher-Hubbard, A.; Garrard, M.; Fu, D.; Wang, A.C.; et al. Detection of human brain tumor infiltration with quantitative stimulated Raman scattering microscopy. Sci. Transl. Med. 2015, 7, 309ra163. [Google Scholar] [CrossRef] [Green Version]
- Shin, K.S.; Francis, A.T.; Hill, A.H.; Laohajaratsang, M.; Cimino, P.J.; Latimer, C.S.; Gonzalez-Cuyar, L.F.; Sekhar, L.N.; Juric-Sekhar, G.; Fu, D. Intraoperative assessment of skull base tumors using stimulated Raman scattering microscopy. Sci. Rep. 2019, 9, 20392. [Google Scholar] [CrossRef] [PubMed]
- Fleischmann, M.; Hendra, P.J.; McQuillan, A.J. Raman spectra of pyridine adsorbed at a silver electrode. Chem. Phys. Lett. 1974, 26, 163–166. [Google Scholar] [CrossRef]
- Jeanmaire, D.L.; Van Duyne, R.P. Surface raman spectroelectrochemistry: Part I. Heterocyclic, aromatic, and aliphatic amines adsorbed on the anodized silver electrode. J. Electroanal. Chem. Interfac. Electrochem. 1977, 84, 1–20. [Google Scholar] [CrossRef]
- Yamamoto, Y.S.; Ozaki, Y.; Itoh, T. Recent progress and frontiers in the electromagnetic mechanism of surface-enhanced Raman scattering. J. Photochem. Photobiol. C Photochem. Rev. 2014, 21, 81–104. [Google Scholar] [CrossRef]
- Pilot, R.; Signorini, R.; Durante, C.; Orian, L.; Bhamidipati, M.; Fabris, L. A Review on surface-enhanced Raman scattering. Biosensors 2019, 9, 57. [Google Scholar] [CrossRef] [PubMed] [Green Version]
- Shvalya, V.; Filipič, G.; Zavašnik, J.; Abdulhalim, I.; Cvelbar, U. Surface-enhanced Raman spectroscopy for chemical and biological sensing using nanoplasmonics: The relevance of interparticle spacing and surface morphology. Appl. Phys. Rev. 2020, 7, 031307. [Google Scholar] [CrossRef]
- Zong, C.; Premasiri, R.; Lin, H.; Huang, Y.; Zhang, C.; Yang, C.; Ren, B.; Ziegler, L.D.; Cheng, J.-X. Plasmon-enhanced stimulated Raman scattering microscopy with single-molecule detection sensitivity. Nat. Commun. 2019, 10, 5318. [Google Scholar] [CrossRef] [Green Version]
- Zhang, C.; Zhang, D.; Cheng, J.-X. Coherent Raman scattering microscopy in biology and medicine. Annu. Rev. Biomed. Eng. 2015, 17, 415–445. [Google Scholar] [CrossRef] [Green Version]
- Kitahama, Y.; Ozaki, Y. Surface-enhanced resonance Raman scattering of hemoproteins and those in complicated biological systems. Analyst 2016, 141, 5020–5036. [Google Scholar] [CrossRef]
- Wang, Z.; Zong, S.; Wu, L.; Zhu, D.; Cui, Y. SERS-activated platforms for immunoassay: Probes, encoding methods, and applications. Chem. Rev. 2017, 117, 7910–7963. [Google Scholar] [CrossRef]
- Hamm, L.; Gee, A.; De Silva Indrasekara, A.S. Recent advancement in the surface-enhanced Raman spectroscopy-based biosensors for infectious disease diagnosis. Appl. Sci. 2019, 9, 1448. [Google Scholar] [CrossRef] [Green Version]
- Israelsen, N.D.; Hanson, C. Nanoparticle properties and synthesis effects on surface-enhanced Raman scattering enhancement factor: An introduction. Sci. World J. 2015, 2015, 124582. [Google Scholar] [CrossRef] [Green Version]
- Tu, D.; Holderby, A.; Coté, G.L. Aptamer-based surface-enhanced resonance Raman scattering assay on a paper fluidic platform for detection of cardiac troponin I. J. Biomed. Opt. 2020, 25, 097001. [Google Scholar] [CrossRef] [PubMed]
- Guerrini, L.; Pazos-Perez, N.; Garcia-Rico, E.; Alvarez-Puebla, R. Cancer characterization and diagnosis with SERS-encoded particles. Cancer Nanotechnol. 2017, 8, 5. [Google Scholar] [CrossRef]
- Langer, J.; Jimenez de Aberasturi, D.; Aizpurua, J.; Alvarez-Puebla, R.A.; Auguié, B.; Baumberg, J.J.; Bazan, G.C.; Bell, S.E.J.; Boisen, A.; Brolo, A.G.; et al. Present and future of surface-enhanced Raman scattering. ACS Nano 2020, 14, 28–117. [Google Scholar] [CrossRef] [Green Version]
- Fan, M.; Andrade, G.F.S.; Brolo, A.G. A review on the fabrication of substrates for surface enhanced Raman spectroscopy and their applications in analytical chemistry. Anal. Chim. Acta 2011, 693, 7–25. [Google Scholar] [CrossRef]
- Liu, X.; Guo, J.; Li, Y.; Wang, B.; Yang, S.; Chen, W.; Wu, X.; Guo, J.; Ma, X. SERS substrate fabrication for biochemical sensing: Towards point-of-care diagnostics. J. Mater. Chem. B 2021, 9, 8378–8388. [Google Scholar] [CrossRef]
- Ghahremani, M.; Habil, M.K.; Zapata-Rodriguez, C.J. Anapole-assisted giant electric field enhancement for surface-enhanced coherent anti-Stokes Raman spectroscopy. Sci. Rep. 2021, 11, 10639. [Google Scholar] [CrossRef]
- Steuwe, C.; Kaminski, C.F.; Baumberg, J.J.; Mahajan, S. Surface Enhanced Coherent Anti-Stokes Raman Scattering on Nanostructured Gold Surfaces. Nano Lett. 2011, 11, 5339–5343. [Google Scholar] [CrossRef]
- Harmsen, S.; Huang, R.; Wall, M.A.; Karabeber, H.; Samii, J.M.; Spaliviero, M.; White, J.R.; Monette, S.; O’Connor, R.; Pitter, K.L.; et al. Surface-enhanced resonance Raman scattering nanostars for high-precision cancer imaging. Sci. Transl. Med. 2015, 7, 271ra7. [Google Scholar] [CrossRef] [Green Version]
- Oliveira, M.J.; de Almeida, M.P.; Nunes, D.; Fortunato, E.; Martins, R.; Pereira, E.; Byrne, H.J.; Águas, H.; Franco, R. Design and simple assembly of gold nanostar bioconjugates for surface-enhanced Raman spectroscopy immunoassays. Nanomaterials 2019, 9, 1561. [Google Scholar] [CrossRef] [Green Version]
- Wu, D.; Hu, M.; Zhang, Y.; Zhou, J.; Wang, Z. Long-range ordered silver nanoflower array structure for surface enhanced Raman scattering detecting. Appl. Surf. Sci. 2020, 505, 144520. [Google Scholar] [CrossRef]
- Das, G.M.; Managò, S.; Mangini, M.; De Luca, A.C. Biosensing using SERS active gold nanostructures. Nanomaterials 2021, 11, 2679. [Google Scholar] [CrossRef]
- Zhu, M.; Li, M.; Su, M.; Liu, J.; Liu, B.; Ge, Y.; Liu, H.; Hu, J. Can “hot spots” be stable enough for surface-enhanced Raman scattering? J. Phys. Chem. C 2021, 125, 13443–13448. [Google Scholar] [CrossRef]
- Wang, H.N.; Fales, A.M.; Zaas, A.K.; Woods, C.W.; Burke, T.; Ginsburg, G.S.; Vo-Dinh, T. Surface-enhanced Raman scattering molecular sentinel nanoprobes for viral infection diagnostics. Anal. Chim. Acta 2013, 786, 153–158. [Google Scholar] [CrossRef] [PubMed] [Green Version]
- Zhao, H.; Hasi, W.; Bao, L.; Liu, Y.; Han, S.; Lin, D. A silver self-assembled monolayer-decorated polydimethylsiloxane flexible substrate for in situ SERS detection of low-abundance molecules. J. Raman Spectrosc. 2018, 49, 1469–1477. [Google Scholar] [CrossRef]
- Jamali, S.B.; Khaskheli, M.A.; Abro, M.I.; Chand, R.; Rekik, N.; Affan, H.; Ikram, R. Confirming the SERS enhancement at large mapping area using self-assembly of silver nanocube at liquid-liquid cyclohexane/water interface. J. Mol. Liquids 2021, 326, 115365. [Google Scholar] [CrossRef]
- Fahes, A.; En Naciri, A.; Navvabpour, M.; Jradi, S.; Akil, S. Self-assembled Ag nanocomposites into ultra-sensitive and reproducible large-area SERS-Active opaque substrates. Nanomaterials 2021, 11, 2055. [Google Scholar] [CrossRef] [PubMed]
- Peters, R.F.; Gutierrez-Rivera, L.; Dew, S.K.; Stepanova, M. Surface enhanced Raman spectroscopy detection of biomolecules using EBL fabricated nanostructured substrates. J. Vis. Exp. 2015, 97, e52712. [Google Scholar] [CrossRef] [PubMed] [Green Version]
- Bruzas, I.; Lum, W.; Gorunmez, Z.; Sagle, L. Advances in surface-enhanced Raman spectroscopy (SERS) substrates for lipid and protein characterization: Sensing and beyond. Analyst 2018, 143, 3990–4008. [Google Scholar] [CrossRef]
- Zou, Q.; Mo, S.; Pei, X.; Wang, Y.; Xue, T.; Mayilamu, M.; Qin, G. Fabrication of novel biological substrate based on photolithographic process for surface enhanced Raman spectroscopy. AIP Adv. 2018, 8, 085302. [Google Scholar] [CrossRef] [Green Version]
- Chen, K.-H.; Pan, M.-J.; Jargalsaikhan, Z.; Ishdorj, T.-O.; Tseng, F.-G. Development of surface-enhanced Raman scattering (SERS)-based surface-corrugated nanopillars for biomolecular detection of colorectal cancer. Biosensors 2020, 10, 163. [Google Scholar] [CrossRef]
- Cui, S.; Tian, C.; Mao, J.; Wu, W.; Fu, Y. Nanopillar array-based plasmonic metasurface for switchable multifunctional biosensing. Opt. Commun. 2022, 506, 127548. [Google Scholar] [CrossRef]
- Karadan, P.; Aggarwal, S.; Anappara, A.A.; Narayana, C.; Barshilia, H.C. Tailored periodic Si nanopillar based architectures as highly sensitive universal SERS biosensing platform. Sens. Actuators B Chem. 2018, 254, 264–271. [Google Scholar] [CrossRef]
- Cai, J.; Wang, Z.; Wang, M.; Zhang, D. Au nanoparticle-grafted hierarchical pillars array replicated from diatom as reliable SERS substrates. Appl. Surf. Sci. 2021, 541, 148374. [Google Scholar] [CrossRef]
- Pal, A.K.; Pagal, S.; Prashanth, K.; Chandra, G.K.; Umapathy, S.; Mohan, B. Ag/ZnO/Au 3D hybrid structured reusable SERS substrate as highly sensitive platform for DNA detection. Sens. Actuators B Chem. 2019, 279, 157–169. [Google Scholar] [CrossRef]
- Keshavarz, M.; Kassanos, P.; Tan, B.; Venkatakrishnan, K. Metal-oxide surface-enhanced Raman biosensor template towards point-of-care EGFR detection and cancer diagnostics. Nanoscale Horiz. 2020, 5, 294–307. [Google Scholar] [CrossRef]
- Qu, Q.; Wang, J.; Zeng, C.; Wang, M.; Qi, W.; He, Z. AuNP array coated substrate for sensitive and homogeneous SERS-immunoassay detection of human immunoglobulin G. RSC Adv. 2021, 11, 22744–22750. [Google Scholar] [CrossRef]
- Er, E.; Sánchez-Iglesias, A.; Silvestri, A.; Arnaiz, B.; Liz-Marzán, L.M.; Prato, M.; Criado, A. Metal nanoparticles/MoS2 surface-enhanced Raman scattering-based sandwich immunoassay for α-fetoprotein detection. ACS Appl. Mater. Interfaces 2021, 13, 8823–8831. [Google Scholar] [CrossRef] [PubMed]
- Yang, B.; Jin, S.; Guo, S.; Park, Y.; Chen, L.; Zhao, B.; Jung, Y.M. Recent development of SERS technology: Semiconductor-based study. ACS Omega 2019, 4, 20101–20108. [Google Scholar] [CrossRef]
- Yilmaz, M.; Babur, E.; Ozdemir, M.; Gieseking, R.L.; Dede, Y.; Tamer, U.; Schatz, G.C.; Facchetti, A.; Usta, H.; Demirel, G. Nanostructured organic semiconductor films for molecular detection with surface-enhanced Raman spectroscopy. Nat. Mater. 2017, 16, 918–924. [Google Scholar] [CrossRef]
- Perumal, J.; Lim, H.Q.; Attia, A.B.E.; Raziq, R.; Leavesley, D.I.; Upton, Z.; Dinish, U.S.; Olivo, M. novel cellulose fibre-based flexible plasmonic membrane for point-of-care SERS biomarker detection in chronic wound healing. Int. J. Nanomed. 2021, 16, 5869–5878. [Google Scholar] [CrossRef]
- Harmsen, S.; Wall, M.A.; Huang, R.; Kircher, M.F. Cancer imaging using surface-enhanced resonance Raman scattering nanoparticles. Nat. Protoc. 2017, 12, 1400–1414. [Google Scholar] [CrossRef] [PubMed] [Green Version]
- Yang, L.; Wu, T.; Fu, C.; Chen, G.; Xu, S.; Xu, W. SERS determination of protease through a particle-on-a-film configuration constructed by electrostatic assembly in an enzymatic hydrolysis reaction. RSC Adv. 2016, 6, 90120–90125. [Google Scholar] [CrossRef]
- Barcelo, S.J.; Wu, W.; Li, X.; Li, Z.; Williams, R.S. Nanoimprint lithography of plasmonic platforms for SERS applications. Appl. Phys. A 2015, 121, 443–449. [Google Scholar] [CrossRef]
- Fang, Y. Label-free receptor assays. Drug Discov. Today Technol. 2010, 7, e5–e11. [Google Scholar] [CrossRef] [Green Version]
- Ma, H.; Tang, X.; Liu, Y.; Han, X.X. Surface-enhanced Raman scattering for direct protein function investigation: Controlled immobilization and orientation. Anal. Chem. 2019, 91, 8767–8771. [Google Scholar] [CrossRef] [Green Version]
- Kim, N.; Thomas, M.R.; Bergholt, M.S.; Pence, I.J.; Seong, H.; Charchar, P.; Todorova, N.; Nagelkerke, A.; Belessiotis-Richards, A.; Payne, D.J.; et al. Surface enhanced Raman scattering artificial nose for high dimensionality fingerprinting. Nat. Commun. 2020, 11, 207. [Google Scholar] [CrossRef] [PubMed]
- Yang, Y.; Zhang, Z.; Wan, M.; Wang, Z.; Zhao, Y.; Sun, L. Highly sensitive surface-enhanced Raman spectroscopy substrates of Ag@PAN electrospinning nanofibrous membranes for direct detection of bacteria. ACS Omega 2020, 5, 19834–19843. [Google Scholar] [CrossRef] [PubMed]
- Chen, L.; Yu, Z.; Lee, Y.; Wang, X.; Zhao, B.; Jung, Y.M. Quantitative evaluation of proteins with bicinchoninic acid (BCA): Resonance Raman and surface-enhanced resonance Raman scattering-based methods. Analyst 2012, 137, 5834–5838. [Google Scholar] [CrossRef]
- Liu, Y.; Chen, Y.; Zhang, Y.; Kou, Q.; Zhang, Y.; Wang, Y.; Chen, L.; Sun, Y.; Zhang, H.; MeeJung, Y. Detection and identification of estrogen based on surface-enhanced resonance Raman scattering (SERRS). Molecules 2018, 23, 1330. [Google Scholar] [CrossRef] [Green Version]
- Negru, B.; McAnally, M.O.; Mayhew, H.E.; Ueltschi, T.W.; Peng, L.; Sprague-Klein, E.A.; Schatz, G.C.; Van Duyne, R.P. Fabrication of gold nanosphere oligomers for surface-enhanced femtosecond stimulated Raman spectroscopy. J. Phys. Chem. C 2017, 121, 27004–27008. [Google Scholar] [CrossRef]
- Peng, Y.; Lin, C.; Long, L.; Masaki, T.; Tang, M.; Yang, L.; Liu, J.; Huang, Z.; Li, Z.; Luo, X.; et al. Charge-transfer resonance and electromagnetic enhancement synergistically enabling MXenes with excellent SERS sensitivity for SARS-CoV-2 S protein detection. Nano-Micro Lett. 2021, 13, 52. [Google Scholar] [CrossRef] [PubMed]
- Sanchez, J.E.; Jaramillo, S.A.; Settles, E.; Salazar, J.J.V.; Lehr, A.; Gonzalez, J.; Rodríguez Aranda, C.; Navarro-Contreras, H.R.; Raniere, M.O.; Harvey, M.; et al. Detection of SARS-CoV-2 and its S and N proteins using surface enhanced Raman spectroscopy. RSC Adv. 2021, 11, 25788–25794. [Google Scholar] [CrossRef]
- McAughtrie, S.; Faulds, K.; Graham, D. Surface enhanced Raman spectroscopy (SERS): Potential applications for disease detection and treatment. J. Photochem. Photobiol. C Photochem. Rev. 2014, 21, 40–53. [Google Scholar] [CrossRef] [Green Version]
- Kamińska, A.; Witkowska, E.; Kowalska, A.; Skoczyńska, A.; Ronkiewicz, P.; Szymborski, T.; Waluk, J. Rapid detection and identification of bacterial meningitis pathogens in ex vivo clinical samples by SERS method and principal component analysis. Anal. Methods 2016, 8, 4521–4529. [Google Scholar] [CrossRef] [Green Version]
- Machtoub, L.H.; Pfeiffer, R.; Bataveljic, D.; Andjus, P.R.; Jordi, H. Monitoring lipids uptake in neurodegenerative disorders by SECARS microscopy. E-J. Surf. Sci. Nanotechnol. 2010, 8, 362–366. [Google Scholar] [CrossRef] [Green Version]
- Machtoub, L.; Bataveljic, D.; Andjus, P. Molecular imaging of brain lipid environment of lymphocytes in amyotrophic lateral sclerosis using magnetic resonance imaging and SECARS microscopy. Physiol. Res. Acad. Sci. Bohemoslov. 2011, 60 (Suppl. S1), S121–S127. [Google Scholar] [CrossRef]
- Sun, D.; Cao, F.; Tian, Y.; Li, A.; Xu, W.; Chen, Q.; Shi, W.; Xu, S. Label-free detection of multiplexed metabolites at Single-cell level via a SERS-microfluidic droplet platform. Anal. Chem. 2019, 91, 15484–15490. [Google Scholar] [CrossRef]
- García-Lojo, D.; Gómez-Graña, S.; Martín, V.F.; Solís, D.M.; Taboada, J.M.; Pérez-Juste, J.; Pastoriza-Santos, I. Integrating plasmonic supercrystals in microfluidics for ultrasensitive, label-free, and selective surface-enhanced Raman spectroscopy detection. ACS Appl. Mater. Interfaces 2020, 12, 46557–46564. [Google Scholar] [CrossRef]
- Nowicka, A.B.; Czaplicka, M.; Kowalska, A.A.; Szymborski, T. Flexible PET/ITO/Ag SERS platform for label-free detection of pesticides. Biosensors 2019, 9, 111. [Google Scholar] [CrossRef] [PubMed] [Green Version]
- Lee, N.; Shin, M.-H.; Lee, E.; Cho, S.-H.; Hwang, H.; Cho, K.; Kim, J.K.; Hahn, S.K. Three-dimensional tungsten disulfide Raman biosensor for dopamine detection. ACS Appl. Bio Mater. 2020, 3, 7687–7695. [Google Scholar] [CrossRef]
- Cottat, M.; D’Andrea, C.; Yasukuni, R.; Malashikhina, N.; Grinyte, R.; Lidgi-Guigui, N.; Fazio, B.; Sutton, A.; Oudar, O.; Charnaux, N.; et al. High sensitivity, high selectivity SERS detection of MnSOD using optical nanoantennas functionalized with aptamers. J. Phys. Chem. C 2015, 119, 15532–15540. [Google Scholar] [CrossRef]
- Pan, X.; Li, L.; Lin, H.; Tan, J.; Wang, H.; Liao, M.; Chen, C.; Shan, B.; Chen, Y.; Li, M. A graphene oxide-gold nanostar hybrid based-paper biosensor for label-free SERS detection of serum bilirubin for diagnosis of jaundice. Biosens. Bioelectron. 2019, 145, 111713. [Google Scholar] [CrossRef] [PubMed]
- Gao, W.; Li, B.; Yao, R.; Li, Z.; Wang, X.; Dong, X.; Qu, H.; Li, Q.; Li, N.; Chi, H.; et al. Intuitive label-free SERS detection of bacteria using aptamer-based in situ silver nanoparticles synthesis. Anal. Chem. 2017, 89, 9836–9842. [Google Scholar] [CrossRef] [PubMed]
- Li, J.; Wang, C.; Kang, H.; Shao, L.; Hu, L.; Xiao, R.; Wang, S.; Gu, B. Label-free identification carbapenem-resistant Escherichia coli based on surface-enhanced resonance Raman scattering. RSC Adv. 2018, 8, 4761–4765. [Google Scholar] [CrossRef] [Green Version]
- Kim, S.; Kim, T.G.; Lee, S.H.; Kim, W.; Bang, A.; Moon, S.W.; Song, J.; Shin, J.-H.; Yu, J.S.; Choi, S. Label-Free Surface-enhanced Raman spectroscopy biosensor for on-site breast cancer detection using human tears. ACS Appl. Mater. Interfaces 2020, 12, 7897–7904. [Google Scholar] [CrossRef]
- Sánchez-Purrà, M.; Roig-Solvas, B.; Rodriguez-Quijada, C.; Leonardo, B.M.; Hamad-Schifferli, K. Reporter selection for nanotags in multiplexed surface enhanced Raman spectroscopy assays. ACS Omega 2018, 3, 10733–10742. [Google Scholar] [CrossRef]
- Smolsky, J.; Kaur, S.; Hayashi, C.; Batra, S.K.; Krasnoslobodtsev, A.V. Surface-enhanced Raman scattering-based immunoassay technologies for detection of disease biomarkers. Biosensors 2017, 7, 7. [Google Scholar] [CrossRef] [Green Version]
- Luo, Y.; Xiao, Y.; Onidas, D.; Iannazzo, L.; Ethève-Quelquejeu, M.; Lamouri, A.; Félidj, N.; Mahouche-Chergui, S.; Brulé, T.; Gagey-Eilstein, N.; et al. Raman reporters derived from aryl diazonium salts for SERS encoded-nanoparticles. Chem. Commun. 2020, 56, 6822–6825. [Google Scholar] [CrossRef] [PubMed]
- Javaid, R.; Sayyadi, N.; Mylvaganam, K.; Venkatesan, K.; Wang, Y.; Rodger, A. Design and synthesis of boron complexes as new Raman reporter molecules for sensitive SERS nanotags. J. Raman Spectrosc. 2020, 51, 2408–2415. [Google Scholar] [CrossRef]
- Liu, B.; Ni, H.; Zhang, D.; Wang, D.; Fu, D.; Chen, H.; Gu, Z.; Zhao, X. Ultrasensitive detection of protein with wide linear dynamic range based on core–shell SERS nanotags and photonic crystal beads. ACS Sens. 2017, 2, 1035–1043. [Google Scholar] [CrossRef]
- Andreiuk, B.; Nicolson, F.; Clark, L.M.; Panikkanvalappil, S.R.; Kenry; Rashidian, M.; Harmsen, S.; Kircher, M.F. Design and synthesis of gold nanostars-based SERS nanotags for bioimaging applications. Nanotheranostics 2022, 6, 10–30. [Google Scholar] [CrossRef]
- Khlebtsov, N.G.; Lin, L.; Khlebtsov, B.N.; Ye, J. Gap-enhanced Raman tags: Fabrication, optical properties, and theranostic applications. Theranostics 2020, 10, 2067–2094. [Google Scholar] [CrossRef]
- Kim, K.; Choi, N.; Jeon, J.H.; Rhie, G.E.; Choo, J. SERS-based immunoassays for the detection of botulinum toxins A and B using magnetic beads. Sensors 2019, 19, 4081. [Google Scholar] [CrossRef] [PubMed] [Green Version]
- Zhang, W.; Jiang, L.; Piper, J.A.; Wang, Y. SERS nanotags and their applications in biosensing and bioimaging. J. Anal. Test. 2018, 2, 26–44. [Google Scholar] [CrossRef]
- Neng, J.; Li, Y.; Driscoll, A.J.; Wilson, W.C.; Johnson, P.A. Detection of multiple pathogens in serum using silica-encapsulated nanotags in a surface-enhanced Raman scattering-based immunoassay. J. Agric. Food Chem. 2018, 66, 5707–5712. [Google Scholar] [CrossRef]
- Duffield, C.; Lyu, N.; Wang, Y. Synthesis and characterization of reporter molecules embedded core-shell nanoparticles as SERS nanotags. J. Innov. Opt. Health Sci. 2021, 14, 2141007. [Google Scholar] [CrossRef]
- Khlebtsov, B.; Khanadeev, V.; Khlebtsov, N. Surface-enhanced Raman scattering inside Au@Ag core/shell nanorods. Nano Res. 2016, 9, 2303–2318. [Google Scholar] [CrossRef]
- Marks, H.; Schechinger, M.; Garza, J.; Locke, A.; Coté, G. Surface enhanced Raman spectroscopy (SERS) for in vitro diagnostic testing at the point of care. Nanophotonics 2017, 6, 681–701. [Google Scholar] [CrossRef]
- Bai, X.; Shen, A.; Hu, J. A sensitive SERS-based sandwich immunoassay platform for simultaneous multiple detection of foodborne pathogens without interference. Anal. Methods 2020, 12, 4885–4891. [Google Scholar] [CrossRef]
- Guven, B.; Basaran-Akgul, N.; Temur, E.; Tamer, U.; Boyacı, İ.H. SERS-based sandwich immunoassay using antibody coated magnetic nanoparticles for Escherichia coli enumeration. Analyst 2011, 136, 740–748. [Google Scholar] [CrossRef]
- Kunushpayeva, Z.; Rapikov, A.; Akhmetova, A.; Sultangaziyev, A.; Dossym, D.; Bukasov, R. Sandwich SERS immunoassay of human immunoglobulin on silicon wafer compared to traditional SERS substrate, gold film. Sens. Bio-Sens. Res. 2020, 29, 100355. [Google Scholar] [CrossRef]
- Karn-orachai, K.; Sakamoto, K.; Laocharoensuk, R.; Bamrungsap, S.; Dharakul, T.; Miki, K. SERS-based immunoassay on 2D-arrays of Au@Ag core–shell nanoparticles: Influence of the sizes of the SERS probe and sandwich immunocomplex on the sensitivity. RSC Adv. 2017, 7, 14099–14106. [Google Scholar] [CrossRef] [Green Version]
- Tang, S.; Liu, H.; Tian, Y.; Chen, D.; Gu, C.; Wei, G.; Jiang, T.; Zhou, J. Surface-enhanced Raman scattering-based lateral flow immunoassay mediated by hydrophilic-hydrophobic Ag-modified PMMA substrate. Spectrochim. Acta Part A Mol. Biomol. Spectrosc. 2021, 262, 120092. [Google Scholar] [CrossRef] [PubMed]
- Yadav, S.; Sadique, M.A.; Ranjan, P.; Kumar, N.; Singhal, A.; Srivastava, A.K.; Khan, R. SERS based lateral flow immunoassay for point-of-care detection of SARS-CoV-2 in clinical samples. ACS Appl. Bio Mater. 2021, 4, 2974–2995. [Google Scholar] [CrossRef]
- Pyrak, E.; Krajczewski, J.; Kowalik, A.; Kudelski, A.; Jaworska, A. Surface enhanced Raman spectroscopy for DNA biosensors—How far are we? Molecules 2019, 24, 4423. [Google Scholar] [CrossRef] [Green Version]
- Liu, Y.; Tian, H.; Chen, X.; Liu, W.; Xia, K.; Huang, J.; de la Chapelle, M.L.; Huang, G.; Zhang, Y.; Fu, W. Indirect surface-enhanced Raman scattering assay of insulin-like growth factor 2 receptor protein by combining the aptamer modified gold substrate and silver nanoprobes. Microchim. Acta 2020, 187, 160. [Google Scholar] [CrossRef]
- Pu, H.; Xie, X.; Sun, D.W.; Wei, Q.; Jiang, Y. Double strand DNA functionalized Au@Ag Nps for ultrasensitive detection of 17β-estradiol using surface-enhanced raman spectroscopy. Talanta 2019, 195, 419–425. [Google Scholar] [CrossRef]
- Yu, J.; Jeon, J.; Choi, N.; Lee, J.O.; Kim, Y.-P.; Choo, J. SERS-based genetic assay for amplification-free detection of prostate cancer specific PCA3 mimic DNA. Sens. Actuators B Chem. 2017, 251, 302–309. [Google Scholar] [CrossRef]
- Hu, Z.; Zhou, X.; Duan, J.; Wu, X.; Wu, J.; Zhang, P.; Liang, W.; Guo, J.; Cai, H.; Sun, P.; et al. Aptamer-based novel Ag-coated magnetic recognition and SERS nanotags with interior nanogap biosensor for ultrasensitive detection of protein biomarker. Sens. Actuators B Chem. 2021, 334, 129640. [Google Scholar] [CrossRef]
- Xing, R.; Wen, Y.; Dong, Y.; Wang, Y.; Zhang, Q.; Liu, Z. Dual molecularly imprinted polymer-based plasmonic immunosandwich assay for the specific and sensitive detection of protein biomarkers. Anal. Chem. 2019, 91, 9993–10000. [Google Scholar] [CrossRef] [PubMed]
- Zhu, Y.; Wu, L.; Yan, H.; Lu, Z.; Yin, W.; Han, H. Enzyme induced molecularly imprinted polymer on SERS substrate for ultrasensitive detection of patulin. Anal. Chim. Acta 2020, 1101, 111–119. [Google Scholar] [CrossRef]
- Żygieło, M.; Piotrowski, P.; Witkowski, M.; Cichowicz, G.; Szczytko, J.; Królikowska, A. Reduced Self-Aggregation and improved stability of silica-coated Fe3O4/Ag SERS-active nanotags functionalized with 2-mercaptoethanesulfonate. Front. Chem. 2021, 9, 697595. [Google Scholar] [CrossRef]
- Bozkurt, A.G.; Buyukgoz, G.G.; Soforoglu, M.; Tamer, U.; Suludere, Z.; Boyaci, I.H. Alkaline phosphatase labeled SERS active sandwich immunoassay for detection of Escherichia coli. Spectrochim. Acta A Mol. Biomol. Spectrosc. 2018, 194, 8–13. [Google Scholar] [CrossRef] [PubMed]
- Hwang, M.J.; Jang, A.S.; Lim, D.-K. Comparative study of fluorescence and surface-enhanced Raman scattering with magnetic microparticle-based assay for target bacterial DNA detection. Sens. Actuators B Chem. 2021, 329, 129134. [Google Scholar] [CrossRef]
- Yu, Z.; Chen, L.; Wang, Y.; Wang, X.; Song, W.; Ruan, W.; Zhao, B.; Cong, Q. A SERS-active enzymatic product used for the quantification of disease-related molecules. J. Raman Spectrosc. 2014, 45, 75–81. [Google Scholar] [CrossRef]
- Dong, J.; Li, Y.; Zhang, M.; Li, Z.; Yan, T.; Qian, W. Ultrasensitive surface-enhanced Raman scattering detection of alkaline phosphatase. Anal. Methods 2014, 6, 9168–9172. [Google Scholar] [CrossRef]
- Ingram, A.; Moore, B.D.; Graham, D. Simultaneous detection of alkaline phosphatase and beta-galactosidase activity using SERRS. Bioorg. Med. Chem. Lett. 2009, 19, 1569–1571. [Google Scholar] [CrossRef] [PubMed]
- Su, Y.; Wu, D.; Chen, J.; Chen, G.; Hu, N.; Wang, H.; Wang, P.; Han, H.; Li, G.; Wu, Y. Ratiometric surface enhanced raman scattering immunosorbent assay of allergenic proteins via covalent organic framework composite material based nanozyme tag triggered raman signal “turn-on” and amplification. Anal. Chem. 2019, 91, 11687–11695. [Google Scholar] [CrossRef]
- Wang, Z.; Yang, H.; Wang, M.; Petti, L.; Jiang, T.; Jia, Z.; Xie, S.; Zhou, J. SERS-based multiplex immunoassay of tumor markers using double SiO2@Ag immune probes and gold-film hemisphere array immune substrate. Colloids Surf. A Physicochem. Eng. Asp. 2018, 546, 48–58. [Google Scholar] [CrossRef]
- Chen, R.; Liu, B.; Ni, H.; Chang, N.; Luan, C.; Ge, Q.; Dong, J.; Zhao, X. Vertical flow assays based on core–shell SERS nanotags for multiplex prostate cancer biomarker detection. Analyst 2019, 144, 4051–4059. [Google Scholar] [CrossRef] [PubMed]
- Zhang, W.; Tang, S.; Jin, Y.; Yang, C.; He, L.; Wang, J.; Chen, Y. Multiplex SERS-based lateral flow immunosensor for the detection of major mycotoxins in maize utilizing dual Raman labels and triple test lines. J. Hazard. Mater. 2020, 393, 122348. [Google Scholar] [CrossRef] [PubMed]
- Baniukevic, J.; Boyaci, I.H.; Bozkurt, A.G.; Tamer, U.; Ramanavicius, A.; Ramanaviciene, A. Magnetic gold nanoparticles in SERS-based sandwich immunoassay for antigen detection by well oriented antibodies. Biosens. Bioelectron. 2013, 43, 281–288. [Google Scholar] [CrossRef] [PubMed]
- Chen, S.; Meng, L.; Wang, L.; Huang, X.; Ali, S.; Chen, X.; Yu, M.; Yi, M.; Li, L.; Chen, X.; et al. SERS-based lateral flow immunoassay for sensitive and simultaneous detection of anti-SARS-CoV-2 IgM and IgG antibodies by using gap-enhanced Raman nanotags. Sens. Actuators B Chem. 2021, 348, 130706. [Google Scholar] [CrossRef] [PubMed]
- Liu, H.; Dai, E.; Xiao, R.; Zhou, Z.; Zhang, M.; Bai, Z.; Shao, Y.; Qi, K.; Tu, J.; Wang, C.; et al. Development of a SERS-based lateral flow immunoassay for rapid and ultra-sensitive detection of anti-SARS-CoV-2 IgM/IgG in clinical samples. Sens Actuators B Chem 2021, 329, 129196. [Google Scholar] [CrossRef] [PubMed]
- Ma, Y.; Liu, H.; Chen, Y.; Gu, C.; Wei, G.; Jiang, T. Improved lateral flow strip based on hydrophilic–hydrophobic SERS substrate for ultra−sensitive and quantitative immunoassay. Appl. Surf. Sci. 2020, 529, 147121. [Google Scholar] [CrossRef]
- Beyene, A.B.; Hwang, B.J.; Tegegne, W.A.; Wang, J.-S.; Tsai, H.-C.; Su, W.-N. Reliable and sensitive detection of pancreatic cancer marker by gold nanoflower-based SERS mapping immunoassay. Microchem. J. 2020, 158, 105099. [Google Scholar] [CrossRef]
- Pham, X.-H.; Hahm, E.; Kim, T.H.; Kim, H.-M.; Lee, S.H.; Lee, S.C.; Kang, H.; Lee, H.-Y.; Jeong, D.H.; Choi, H.S.; et al. Enzyme-amplified SERS immunoassay with Ag-Au bimetallic SERS hot spots. Nano Res. 2020, 13, 3338–3346. [Google Scholar] [CrossRef]
- Rong, Z.; Wang, C.; Wang, J.; Wang, D.; Xiao, R.; Wang, S. Magnetic immunoassay for cancer biomarker detection based on surface-enhanced resonance Raman scattering from coupled plasmonic nanostructures. Biosens. Bioelectron. 2016, 84, 15–21. [Google Scholar] [CrossRef]
- Owens, N.A.; Pinter, A.; Porter, M.D. Surface-enhanced resonance Raman scattering for the sensitive detection of a tuberculosis biomarker in human serum. J. Raman Spectrosc. 2019, 50, 15–25. [Google Scholar] [CrossRef] [Green Version]
- Chen, Y.-T.; Lee, Y.-C.; Lai, Y.-H.; Lim, J.-C.; Huang, N.-T.; Lin, C.-T.; Huang, J.-J. Review of integrated optical biosensors for point-of-care applications. Biosensors 2020, 10, 209. [Google Scholar] [CrossRef]
- Gao, R.; Lv, Z.; Mao, Y.; Yu, L.; Bi, X.; Xu, S.; Cui, J.; Wu, Y. SERS-Based Pump-Free Microfluidic Chip for Highly Sensitive Immunoassay of Prostate-Specific Antigen Biomarkers. ACS Sens. 2019, 4, 938–943. [Google Scholar] [CrossRef] [PubMed]
- Zhang, W.-S.; Wang, Y.-N.; Wang, Y.; Xu, Z.-R. Highly reproducible and fast detection of 6-thioguanine in human serum using a droplet-based microfluidic SERS system. Sens. Actuators B Chem. 2019, 283, 532–537. [Google Scholar] [CrossRef]
- Kant, K.; Abalde-Cela, S. Surface-enhanced Raman scattering spectroscopy and microfluidics: Towards ultrasensitive label-free sensing. Biosensors 2018, 8, 62. [Google Scholar] [CrossRef] [Green Version]
- Ackermann, K.R.; Henkel, T.; Popp, J. Quantitative online detection of low-concentrated drugs via a SERS microfluidic system. Chemphyschem 2007, 8, 2665–2670. [Google Scholar] [CrossRef] [PubMed]
- Lee, D.; Lee, S.; Seong, G.H.; Choo, J.; Lee, E.K.; Gweon, D.G.; Lee, S. Quantitative analysis of methyl parathion pesticides in a polydimethylsiloxane microfluidic channel using confocal surface-enhanced Raman spectroscopy. Appl. Spectrosc. 2006, 60, 373–377. [Google Scholar] [CrossRef] [PubMed]
- Yazdi, S.H.; White, I.M. Multiplexed detection of aquaculture fungicides using a pump-free optofluidic SERS microsystem. Analyst 2013, 138, 100–103. [Google Scholar] [CrossRef]
- Ahi, E.E.; Torul, H.; Zengin, A.; Sucularlı, F.; Yıldırım, E.; Selbes, Y.; Suludere, Z.; Tamer, U. A capillary driven microfluidic chip for SERS based hCG detection. Biosens. Bioelectron. 2022, 195, 113660. [Google Scholar] [CrossRef]
- Wang, L.; Zhou, G.; Guan, X.-l.; Zhao, L. Rapid preparation of surface-enhanced Raman substrate in microfluidic channel for trace detection of amoxicillin. Spectrochim. Acta Part A Mol. Biomol. Spectrosc. 2020, 235, 118262. [Google Scholar] [CrossRef]
- Chen, R.; Du, X.; Cui, Y.; Zhang, X.; Ge, Q.; Dong, J.; Zhao, X. Vertical Flow Assay for Inflammatory Biomarkers Based on Nanofluidic Channel Array and SERS Nanotags. Small 2020, 16, 2002801. [Google Scholar] [CrossRef]
- Zheng, Z.; Wu, L.; Li, L.; Zong, S.; Wang, Z.; Cui, Y. Simultaneous and highly sensitive detection of multiple breast cancer biomarkers in real samples using a SERS microfluidic chip. Talanta 2018, 188, 507–515. [Google Scholar] [CrossRef]
- Gao, R.; Cheng, Z.; Wang, X.; Yu, L.; Guo, Z.; Zhao, G.; Choo, J. Simultaneous immunoassays of dual prostate cancer markers using a SERS-based microdroplet channel. Biosens. Bioelectron. 2018, 119, 126–133. [Google Scholar] [CrossRef]
- Nie, Y.; Jin, C.; Zhang, J.X.J. Microfluidic In situ patterning of silver nanoparticles for surface-enhanced Raman spectroscopic sensing of biomolecules. ACS Sens. 2021, 6, 2584–2592. [Google Scholar] [CrossRef] [PubMed]
- Wang, C.; Madiyar, F.; Yu, C.; Li, J. Detection of extremely low concentration waterborne pathogen using a multiplexing self-referencing SERS microfluidic biosensor. J. Biol. Eng. 2017, 11, 9. [Google Scholar] [CrossRef] [Green Version]
- Zhang, Y.; Zhao, S.; Zheng, J.; He, L. Surface-enhanced Raman spectroscopy (SERS) combined techniques for high-performance detection and characterization. TrAC Trends Anal. Chem. 2017, 90, 1–13. [Google Scholar] [CrossRef]
- Castaño-Guerrero, Y.; Moreira, F.T.; Sousa-Castillo, A.; Correa-Duarte, M.A.; Sales, M.G.F. SERS and electrochemical impedance spectroscopy immunoassay for carcinoembryonic antigen. Electrochim. Acta 2021, 366, 137377. [Google Scholar] [CrossRef]
- Wang, J.; Zhang, R.; Ji, X.; Wang, P.; Ding, C. SERS and fluorescence detection of circulating tumor cells (CTCs) with specific capture-release mode based on multifunctional gold nanomaterials and dual-selective recognition. Anal. Chim. Acta 2021, 1141, 206–213. [Google Scholar] [CrossRef] [PubMed]
- Lee, H.G.; Choi, W.; Yang, S.Y.; Kim, D.-H.; Park, S.-G.; Lee, M.-Y.; Jung, H.S. PCR-coupled paper-based surface-enhanced Raman scattering (SERS) sensor for rapid and sensitive detection of respiratory bacterial DNA. Sens. Actuators B Chem. 2021, 326, 128802. [Google Scholar] [CrossRef]
- Xu, Y.; Hassan, M.M.; Zhu, A.; Li, H.; Chen, Q. Dual-Mode of Magnetic Assisted Au@ Ag SERS Tags and Cationic Conjugated UCNPs for qualitative and quantitative analysis of multiple foodborne pathogens. Sens. Actuators B Chem. 2021, 344, 130305. [Google Scholar] [CrossRef]
- Kim, K.; Kashefi-Kheyrabadi, L.; Joung, Y.; Kim, K.; Dang, H.; Chavan, S.G.; Lee, M.-H.; Choo, J. Recent advances in sensitive surface-enhanced Raman scattering-based lateral flow assay platforms for point-of-care diagnostics of infectious diseases. Sens. Actuators B Chem. 2021, 329, 129214. [Google Scholar] [CrossRef]
- Khlebtsov, B.; Khlebtsov, N. Surface-enhanced Raman scattering-based lateral-flow immunoassay. Nanomaterials 2020, 10, 2228. [Google Scholar] [CrossRef]
- Sánchez-Purrà, M.; Roig-Solvas, B.; Versiani, A.; Rodriguez-Quijada, C.; de Puig, H.; Bosch, I.; Gehrke, L.; Hamad-Schifferli, K. Design of SERS nanotags for multiplexed lateral flow immunoassays. Mol. Syst. Des. Eng. 2017, 2, 401–409. [Google Scholar] [CrossRef] [PubMed]
- Lin, L.-K.; Stanciu, L. Bisphenol A detection using gold nanostars in a SERS improved lateral flow immunochromatographic assay. Sens. Actuators B Chem. 2018, 276, 222–229. [Google Scholar] [CrossRef]
- Maneeprakorn, W.; Bamrungsap, S.; Apiwat, C.; Wiriyachaiporn, N. Surface-enhanced Raman scattering based lateral flow immunochromatographic assay for sensitive influenza detection. RSC Adv. 2016, 6, 112079–112085. [Google Scholar] [CrossRef]
- Khlebtsov, B.N.; Bratashov, D.N.; Byzova, N.A.; Dzantiev, B.B.; Khlebtsov, N.G. SERS-based lateral flow immunoassay of troponin I by using gap-enhanced Raman tags. Nano Res. 2019, 12, 413–420. [Google Scholar] [CrossRef]
- Dégardin, K.; Guillemain, A.; Roggo, Y. Comprehensive study of a handheld raman spectrometer for the analysis of counterfeits of solid-dosage form medicines. J. Spectrosc. 2017, 2017, 3154035. [Google Scholar] [CrossRef]
- Kranenburg, R.F.; Verduin, J.; de Ridder, R.; Weesepoel, Y.; Alewijn, M.; Heerschop, M.; Keizers, P.H.J.; van Esch, A.; van Asten, A.C. Performance evaluation of handheld Raman spectroscopy for cocaine detection in forensic case samples. Drug Test. Anal. 2021, 13, 1054–1067. [Google Scholar] [CrossRef] [PubMed]
- Bin, L.; Shoushan, W.; Minnan, Z.; Qun, J.; Qing, W. Portable handheld Raman spectrometer for the identification of new psychoactive substances. Infrared Laser Eng. 2020, 49, 20200101. [Google Scholar] [CrossRef]
- Pilot, R. SERS detection of food contaminants by means of portable Raman instruments. J. Raman Spectrosc. 2018, 49, 954–981. [Google Scholar] [CrossRef]
- Tu, H.; Boppart, S.A. Coherent anti-Stokes Raman scattering microscopy: Overcoming technical barriers for clinical translation. J Biophotonics 2014, 7, 9–22. [Google Scholar] [CrossRef] [PubMed] [Green Version]
- Murugkar, S.; Smith, B.; Srivastava, P.; Moica, A.; Naji, M.; Brideau, C.; Stys, P.K.; Anis, H. Miniaturized multimodal CARS microscope based on MEMS scanning and a single laser source. Opt. Express 2010, 18, 23796–23804. [Google Scholar] [CrossRef]
- Brinkmann, M.; Fast, A.; Hellwig, T.; Pence, I.; Evans, C.L.; Fallnich, C. Portable all-fiber dual-output widely tunable light source for coherent Raman imaging. Biomed. Opt. Express 2019, 10, 4437–4449. [Google Scholar] [CrossRef] [PubMed]
- Liao, C.-S.; Wang, P.; Huang, C.Y.; Lin, P.; Eakins, G.; Bentley, R.T.; Liang, R.; Cheng, J.-X. In vivo and in situ spectroscopic imaging by a handheld stimulated Raman scattering microscope. ACS Photonics 2018, 5, 947–954. [Google Scholar] [CrossRef]
- Tran, V.; Walkenfort, B.; König, M.; Salehi, M.; Schlücker, S. Rapid, quantitative, and ultrasensitive point-of-care testing: A portable SERS reader for lateral flow assays in clinical chemistry. Angew. Chem. 2019, 58, 442–446. [Google Scholar] [CrossRef]
- Xiao, R.; Lu, L.; Rong, Z.; Wang, C.; Peng, Y.; Wang, F.; Wang, J.; Sun, M.; Dong, J.; Wang, D.; et al. Portable and multiplexed lateral flow immunoassay reader based on SERS for highly sensitive point-of-care testing. Biosens. Bioelectron. 2020, 168, 112524. [Google Scholar] [CrossRef]
- Sivanesan, A.; Izake, E.L.; Agoston, R.; Ayoko, G.A.; Sillence, M. Reproducible and label-free biosensor for the selective extraction and rapid detection of proteins in biological fluids. J. Nanobiotechnol. 2015, 13, 43. [Google Scholar] [CrossRef] [PubMed] [Green Version]
- Zhang, C.; Chen, S.; Jiang, Z.; Shi, Z.; Wang, J.; Du, L. Highly sensitive and reproducible SERS substrates based on ordered micropyramid array and silver nanoparticles. ACS Appl. Mater. Interfaces 2021, 13, 29222–29229. [Google Scholar] [CrossRef] [PubMed]
- Indrasekara, A.S.D.S. Design criteria to fabricate plasmonic gold nanomaterials for surface-enhanced Raman scattering (SERS)-based biosensing. J. Appl. Phys. 2021, 129, 231102. [Google Scholar] [CrossRef]
- Orlando, A.; Franceschini, F.; Muscas, C.; Pidkova, S.; Bartoli, M.; Rovere, M.; Tagliaferro, A. A comprehensive review on Raman spectroscopy applications. Chemosensors 2021, 9, 262. [Google Scholar] [CrossRef]
Figure 1.
Energy level diagram demonstrating the Raman, RRS, CARS, and SRS processes.

Figure 2.
(A) The number of articles published over the past two decades (January 2001–October 2021) according to the Web of Science (WoS) database found using the following keywords: (a) coherent Raman scattering; (b) stimulated Raman scattering; (c) resonance Raman scattering; (d) surface-enhanced Raman scattering. (B) Dynamics of published articles on the SERS over the past two decades (January 2001–October 2021) according to the WoS database.

Figure 3.
Schematic representation of the direct (a) and indirect (b) approaches for SERS-based detection.
Figure 3.
Schematic representation of the direct (a) and indirect (b) approaches for SERS-based detection.

Figure 4.
Design of SERS nanotag consisting of a metal nanoparticle core, modified by reporter molecule (green stars), protected by biocompatible layer (pink shell), and functionalized by a capture receptor molecule.
Figure 4.
Design of SERS nanotag consisting of a metal nanoparticle core, modified by reporter molecule (green stars), protected by biocompatible layer (pink shell), and functionalized by a capture receptor molecule.

Figure 5.
Schematic illustration of SERS aptasensor for CRP detection based on AgMNPs and Au-NNPs as SERS nanotag and magnetic capture substrate, respecitvely. The analysis included the following steps: (A) fabrication of SERS nanotag; (B) obtaining of AgMNPs modified with aptamer; (C) incubation of the CRP with Ag MNPs and SERS nanotag resulting in the formation of the sandwich complex AgMNPs–CRP–Au–NNPs; (D) magnetic separation of unbound SERS nanotag followed by SERS detection.

Figure 6.
SERS microfluidic chip with AgNPs in microchannels, functionalized with capture antibodies. After injection of analyzed samples and SERS nanotags, the sandwich complexes are formed in microchannels, and SERS signals indicate presence of corresponding analytes.
Figure 6.
SERS microfluidic chip with AgNPs in microchannels, functionalized with capture antibodies. After injection of analyzed samples and SERS nanotags, the sandwich complexes are formed in microchannels, and SERS signals indicate presence of corresponding analytes.

Figure 7.
Principle of SERS-based LFIA.

Table 4.
Raman detection using portable devices.
| Analyte | Substrate | LOD | Laser Wavelength, Laser Power | Features | Year, Ref. |
|---|---|---|---|---|---|
| Solid-dosage form medicines (62 formulations) | Direct measurement without SERS substrate | ND | 785 nm, 270 mW | Positive identification of some generics and one placebo in comparison with instrumental method | 2017, [208] |
| Cocaine mixtures (90 cocaine samples) | - | between 10 wt% and 40 wt% | 785-nm, ≈250-mW | Direct identification in the mixtures with different content of cocaine, spectral identification by handled Raman spectrometer (comparison of results with GC–MS) | 2021, [209] |
| In vivo imaging of the rat spinal cord, 20 µm and 4.5 µm polystyrene beads | Cover slip | - | ≈800 nm, 300 mW | CARS microscope application for different assays including bioimaging | 2010, [213] |
| Dermal structures in human and animal skin | Microscope cover slide without cover slip | - | tunable from 780 to 980 nm, 400 mW | Human skin tissues and mouse ear tissues were analyzed with lipid contrast by CARS microscopy | 2019, [214] |
| Sample of mixed dried microspheres of PS and PMMA | Piece of paper | - | 887 nm, 40 mW | Spectroscopic SRS microscopy, real-time hyperspectral SRS imaging | 2018, [215] |
| Pesticide residue (thiabendazol) in spinach leaves | In situ label-free imaging | - | 1040 nm, a tunable 80 MHz pulsed laser | SRS microscope in which a fiber delivered two laser pulses for imaging | 2018, [215] |
| Human chorionic gonadotropin (hCG) | Au/Au core/satellite nanoparticles, Raman reporter molecule thio-2-napthol and the linker molecule (11-mercaptoundecyl)-N,N,N-trimethylammonium bromide | 1.6 mIU mL−1 | 785 nm diode laser, up to 450 mW | Anti-hCG detection antibody was conjugated to the SERS nanotags | 2018, [216] |
| Cancer markers (AFP, CEA, and PSA) | Gold nanorod nanotags functionalized with the Raman reporter molecule DTNB | 0.01 ng/mL | 785 nm diode laser, laser power range: 0–500 mW | SERS-based lateral flow immunoassay (LFIA) reader integrated with a multichannel LFIA reaction column, detection in human serum samples | 2020, [217] |
Publisher’s Note: MDPI stays neutral with regard to jurisdictional claims in published maps and institutional affiliations. |
© 2021 by the authors. Licensee MDPI, Basel, Switzerland. This article is an open access article distributed under the terms and conditions of the Creative Commons Attribution (CC BY) license (https://creativecommons.org/licenses/by/4.0/).
Share and Cite
MDPI and ACS Style
Serebrennikova, K.V.; Berlina, A.N.; Sotnikov, D.V.; Zherdev, A.V.; Dzantiev, B.B. Raman Scattering-Based Biosensing: New Prospects and Opportunities. Biosensors 2021, 11, 512. https://0-doi-org.brum.beds.ac.uk/10.3390/bios11120512
AMA Style
Serebrennikova KV, Berlina AN, Sotnikov DV, Zherdev AV, Dzantiev BB. Raman Scattering-Based Biosensing: New Prospects and Opportunities. Biosensors. 2021; 11(12):512. https://0-doi-org.brum.beds.ac.uk/10.3390/bios11120512
Chicago/Turabian StyleSerebrennikova, Kseniya V., Anna N. Berlina, Dmitriy V. Sotnikov, Anatoly V. Zherdev, and Boris B. Dzantiev. 2021. "Raman Scattering-Based Biosensing: New Prospects and Opportunities" Biosensors 11, no. 12: 512. https://0-doi-org.brum.beds.ac.uk/10.3390/bios11120512
Note that from the first issue of 2016, this journal uses article numbers instead of page numbers. See further details here.