Dissociation Constant of Integrin-RGD Binding in Live Cells from Automated Micropipette and Label-Free Optical Data


 , , and
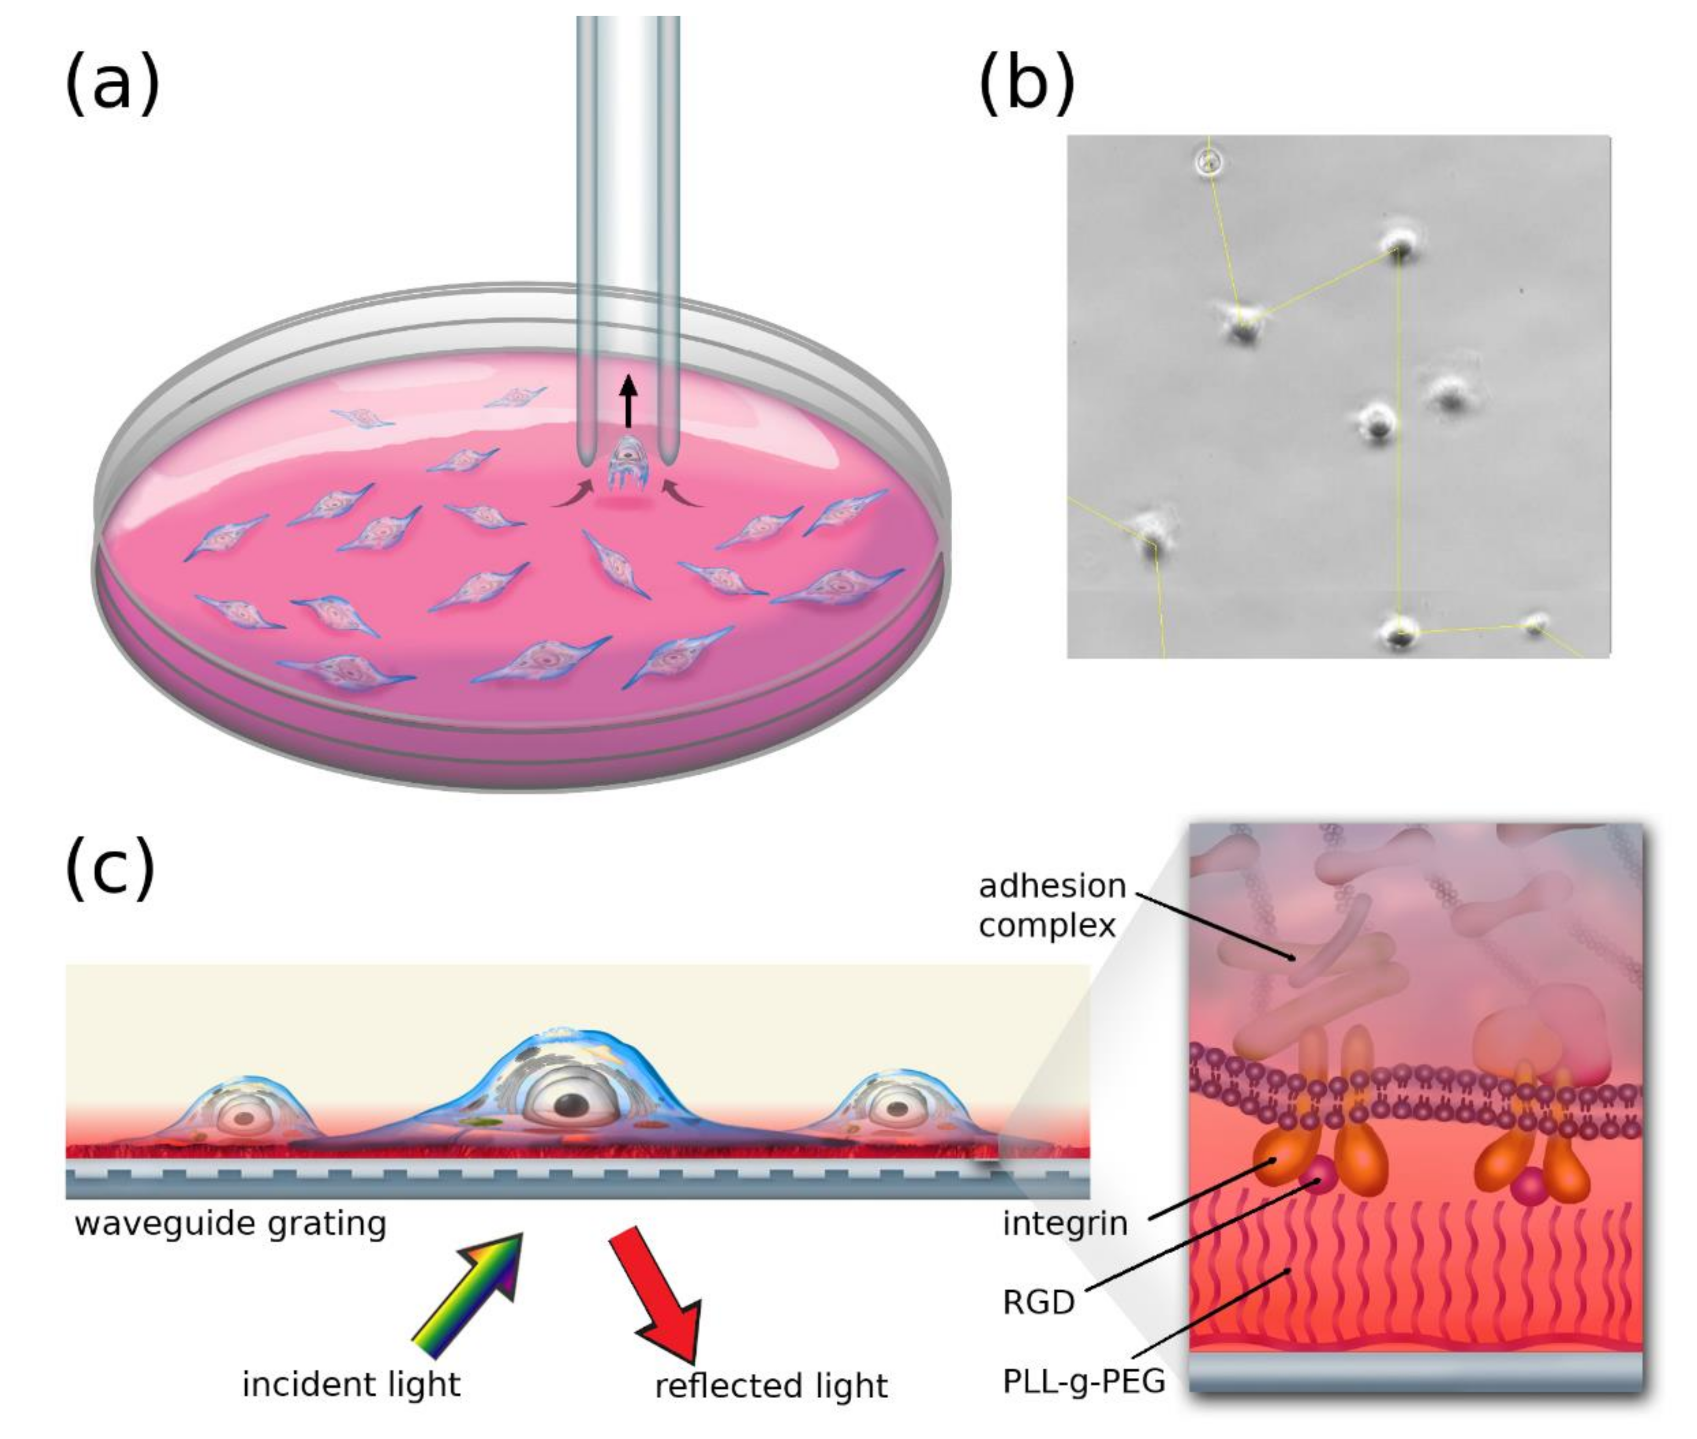
Abstract
:1. Introduction
2. Materials and Methods
2.1. Cell Culture and Seeding
2.2. Surface Coating
2.3. Micropipette Measurements
2.4. The Resonant Waveguide Grating (RWG) Imager Biosensor
3. Results
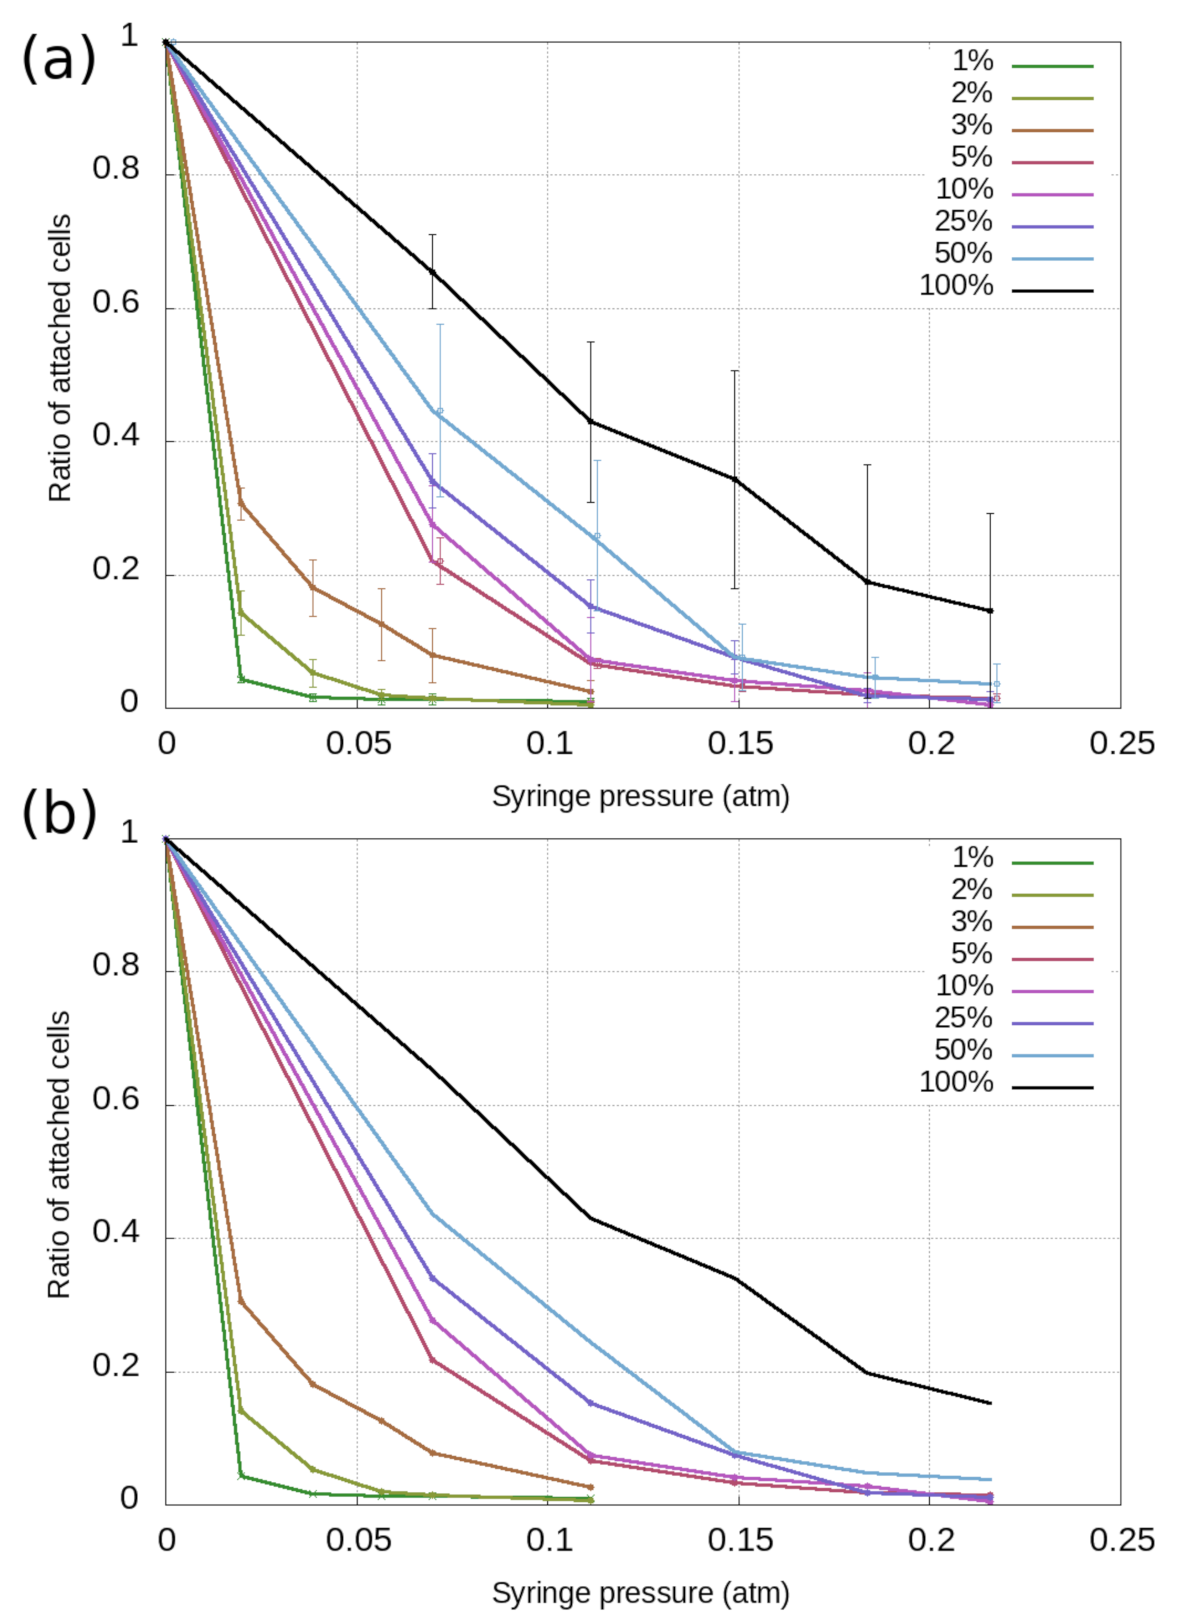
3.1. Cell-Based Dissociation Assay
3.2. Cell Adhesion on RGD-Tuned Surfaces with RWG Biosensor
3.3. Analysis of Subpopulations
4. Discussion and Outlook
Author Contributions
Funding
Institutional Review Board Statement
Informed Consent Statement
Data Availability Statement
Conflicts of Interest
References
- Beckerle, M.C. Cell Adhesion; Oxford University Press Inc.: New York, NY, USA, 2001. [Google Scholar]
- Slack, J.M.W. Molecular Biology of the Cell. In Principles of Tissue Engineering, 4th ed.; Elsevier: Amsterdam, The Netherlands, 2013. [Google Scholar] [CrossRef]
- Galbraith, C.G.; Yamada, K.M.; Sheetz, M.P. The relationship between force and focal complex development. J. Cell Biol. 2002, 159, 695–705. [Google Scholar] [CrossRef] [PubMed]
- Dermutz, H.; Gruter, R.R.; Truong, A.M.; Demkó, L.; Voros, J.; Zambelli, T. Local polymer replacement for neuron patterning and in situ neurite guidance. Langmuir 2014, 30, 7037–7046. [Google Scholar] [CrossRef]
- Saftics, A.; Turk, B.; Sulyok, A.; Nagy, N.; Gerecsei, T.; Szekacs, I.; Kurunczi, S.; Horvath, R. Biomimetic Dextran-Based Hydrogel Layers for Cell Micropatterning over Large Areas Using the FluidFM BOT Technology. Langmuir 2019, 35, 2412–2421. [Google Scholar] [CrossRef]
- Irvine, D.J.; Mayes, A.M.; Griffith, L.G. Nanoscale clustering of RGD peptides at surfaces using comb polymers. 1. Synthesis and characterization of comb thin films. Biomacromolecules 2001, 2, 85–94. [Google Scholar] [CrossRef]
- Cavalcanti-Adam, E.A.; Micoulet, A.; Blümmel, J.; Auernheimer, J.; Kessler, H.; Spatz, J.P. Lateral spacing of integrin ligands influences cell spreading and focal adhesion assembly. Eur. J. Cell Biol. 2006, 85, 219–224. [Google Scholar] [CrossRef]
- Huang, J.; Grater, S.V.; Corbellini, F.; Rinck, S.; Bock, E.; Kemkemer, R.; Kessler, H.; Ding, J.; Spatz, J.P. Impact of order and disorder in RGD nanopatterns on cell adhesion. Nano Lett. 2009, 9, 1111–1116. [Google Scholar] [CrossRef] [Green Version]
- VandeVondele, S.; Vörös, J.; Hubbell, J.A. RGD-grafted poly-L-lysine-graft-(polyethylene glycol) copolymers block non-specific protein adsorption while promoting cell adhesion. Biotechnol. Bioeng. 2003, 82, 784–790. [Google Scholar] [CrossRef]
- Schlapak, R.; Armitage, D.; Saucedo-Zeni, N.; Chrzanowski, W.; Hohage, M.; Caruana, D.; Howorka, S. Selective protein and DNA adsorption on PLL-PEG films modulated by ionic strength. Soft Matter 2009, 5, 613–625. [Google Scholar] [CrossRef]
- Kanyo, N.; Kovacs, K.D.; Saftics, A.; Szekacs, I.; Peter, B.; Santa-Maria, A.R.; Walter, F.R.; Dér, A.; Deli, M.A.; Horvath, R. Glycocalyx regulates the strength and kinetics of cancer cell adhesion revealed by biophysical models based on high resolution label-free optical data. Sci. Rep. 2020, 10, 1–20. [Google Scholar] [CrossRef] [PubMed]
- Guo, L.; Chen, B.; Liu, R.; Liu, P.; Xia, G.; Wang, Y.; Li, X.; Chen, W.; Wang, X.; Jiang, H. Biocompatibility assessment of polyethylene glycol-poly l-lysine-poly lactic-co-glycolic acid nanoparticles in vitro and in vivo. J. Nanosci. Nanotechnol. 2015, 15, 3710–3719. [Google Scholar] [CrossRef] [PubMed]
- Orgovan, N.; Peter, B.; Bősze, S.; Ramsden, J.J.; Szabó, B.; Horvath, R. Dependence of cancer cell adhesion kinetics on integrin ligand surface density measured by a high-throughput label-free resonant waveguide grating biosensor. Sci. Rep. 2015, 4, 4034. [Google Scholar] [CrossRef] [PubMed] [Green Version]
- Chandra, P.; Prakash, R.; Applications, T. Nanobiomaterial Engineering; Springer: Berlin/Heidelberg, Germany, 2020. [Google Scholar] [CrossRef]
- Ungai-Salánki, R.; Peter, B.; Gerecsei, T.; Orgovan, N.; Horvath, R.; Szabó, B. A practical review on the measurement tools for cellular adhesion force. Adv. Colloid Interface Sci. 2019, 269, 309–333. [Google Scholar] [CrossRef] [PubMed] [Green Version]
- Salánki, R.; Hős, C.; Orgovan, N.; Peter, B.; Sándor, N.; Bajtay, Z.; Erdei, A.; Horvath, R.; Szabó, B. Single cell adhesion assay using computer controlled micropipette. PLoS ONE 2014, 9, e111450. [Google Scholar] [CrossRef] [PubMed] [Green Version]
- Gerecsei, T.; Erdődi, I.; Peter, B.; Hős, C.; Kurunczi, S.; Derényi, I.; Szabó, B.; Horvath, R. Adhesion force measurements on functionalized microbeads: An in-depth comparison of computer controlled micropipette and fluidic force microscopy. J. Colloid Interface Sci. 2019, 555, 245–253. [Google Scholar] [CrossRef]
- Zhu, D.M.; Dustin, M.L.; Cairo, C.W.; Golan, D.E. Analysis of two-dimensional dissociation constant of laterally mobile cell adhesion molecules. Biophys. J. 2007, 92, 1022–1034. [Google Scholar] [CrossRef] [Green Version]
- Yu, L.; Hou, Y.; Xie, W.; Camacho, J.L.C.; Cheng, C.; Holle, A.; Young, J.; Trappmann, B.; Zhao, W.; Melzig, M.F.; et al. Ligand Diffusion Enables Force-Independent Cell Adhesion via Activating α5β1 Integrin and Initiating Rac and RhoA Signaling. Adv. Mater. 2020, 32, 1–12. [Google Scholar] [CrossRef]
- Bell, G.I.; Dembo, M.; Bongrand, P. Cell adhesion. Competition between nonspecific repulsion and specific bonding. Biophys. J. 1984, 45, 1051–1064. [Google Scholar] [CrossRef] [Green Version]
- Goodman, S.L.; Holzemann, G.; Sulyok, G.A.; Kessler, H. Nanomolar small molecule inhibitors for alphav(beta)6, alphav(beta)5, and alphav(beta)3 integrins. J. Med. Chem. 2002, 45, 1045–1051. [Google Scholar] [CrossRef]
- Frank, A.O.; Otto, E.; Mas-Moruno, C.; Schiller, H.B.; Marinelli, L.; Cosconati, S.; Bochen, A.; Vossmeyer, D.; Zahn, G.; Stragies, R.; et al. Conformational control of integrin-subtype selectivity in isodgr peptide motifs: A biological switch. Angew. Chem. Int. Ed. 2010, 49, 9278–9281. [Google Scholar] [CrossRef] [Green Version]
- Kapp, T.G.; Rechenmacher, F.; Neubauer, S.; Maltsev, O.V.; Cavalcanti-Adam, E.A.; Zarka, R.; Reuning, U.; Notni, J.; Wester, H.J.; Mas-Moruno, C.; et al. A comprehensive evaluation of the activity and selectivity profile of ligands for RGD-binding integrins. Sci. Rep. 2017, 7, 1–13. [Google Scholar] [CrossRef] [Green Version]
- Van der Flier, A.; Badu-Nkansah, K.; Whittaker, C.A.; Crowley, D.; Bronson, R.T.; Lacy-Hulbert, A.; Hynes, R.O. Endothelial α5 and αv integrins cooperate in remodeling of the vasculature during development. Development 2010, 137, 2439–2449. [Google Scholar] [CrossRef] [PubMed] [Green Version]
- Koo, L.Y.; Irvine, D.J.; Mayes, A.M.; Lauffenburger, D.A.; Griffith, L.G. Co-regulation of cell adhesion by nanoscale RGD organization and mechanical stimulus. J. Cell Sci. 2002, 115, 1423–1433. [Google Scholar] [PubMed]
- Assa-Munt, N.; Jia, X.; Laakkonen, P.; Ruoslahti, E. Solution structures and integrin binding activities of an RGD peptide with two isomers. Biochemistry 2001, 40, 2373–2378. [Google Scholar] [CrossRef] [PubMed]
- Bochen, A.; Marelli, U.K.; Otto, E.; Pallarola, D.; Mas-Moruno, C.; Di Leva, F.S.; Boehm, H.; Spatz, J.P.; Novellino, E.; Kessler, H.; et al. Biselectivity of isoDGR peptides for fibronectin binding integrin subtypes α5β1 and αvβ6: Conformational control through flanking amino acids. J. Med. Chem. 2013, 56, 1509–1519. [Google Scholar] [CrossRef] [PubMed]
- Sztilkovics, M.; Gerecsei, T.; Peter, B.; Saftics, A.; Kurunczi, S.; Szekacs, I.; Szabo, B.; Horvath, R. Single-cell adhesion force kinetics of cell populations from combined label-free optical biosensor and robotic fluidic force microscopy. Sci. Rep. 2020, 10, 1–13. [Google Scholar] [CrossRef] [PubMed] [Green Version]


Publisher’s Note: MDPI stays neutral with regard to jurisdictional claims in published maps and institutional affiliations. |
© 2021 by the authors. Licensee MDPI, Basel, Switzerland. This article is an open access article distributed under the terms and conditions of the Creative Commons Attribution (CC BY) license (http://creativecommons.org/licenses/by/4.0/).
Share and Cite
Gerecsei, T.; Chrenkó, P.; Kanyo, N.; Péter, B.; Bonyár, A.; Székács, I.; Szabo, B.; Horvath, R. Dissociation Constant of Integrin-RGD Binding in Live Cells from Automated Micropipette and Label-Free Optical Data. Biosensors 2021, 11, 32. https://0-doi-org.brum.beds.ac.uk/10.3390/bios11020032
Gerecsei T, Chrenkó P, Kanyo N, Péter B, Bonyár A, Székács I, Szabo B, Horvath R. Dissociation Constant of Integrin-RGD Binding in Live Cells from Automated Micropipette and Label-Free Optical Data. Biosensors. 2021; 11(2):32. https://0-doi-org.brum.beds.ac.uk/10.3390/bios11020032
Chicago/Turabian StyleGerecsei, Tamás, Péter Chrenkó, Nicolett Kanyo, Beatrix Péter, Attila Bonyár, Inna Székács, Balint Szabo, and Robert Horvath. 2021. "Dissociation Constant of Integrin-RGD Binding in Live Cells from Automated Micropipette and Label-Free Optical Data" Biosensors 11, no. 2: 32. https://0-doi-org.brum.beds.ac.uk/10.3390/bios11020032