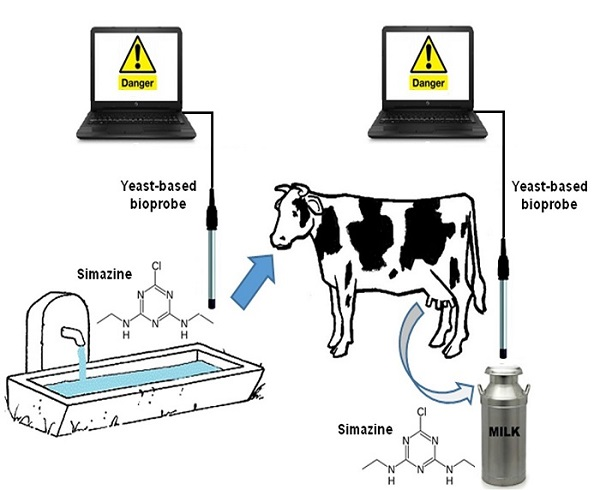
Towards Simazine Monitoring in Agro-Zootechnical Productions: A Yeast Cell Bioprobe for Real Samples Screening


 and
and
Abstract
:
1. Introduction
2. Materials and Methods
2.1. Simazine Solution
2.2. Other Chemical Solutions
2.3. Samples
2.4. S. cerevisiae Suspensions
2.5. Yeast Cell Proliferation Control
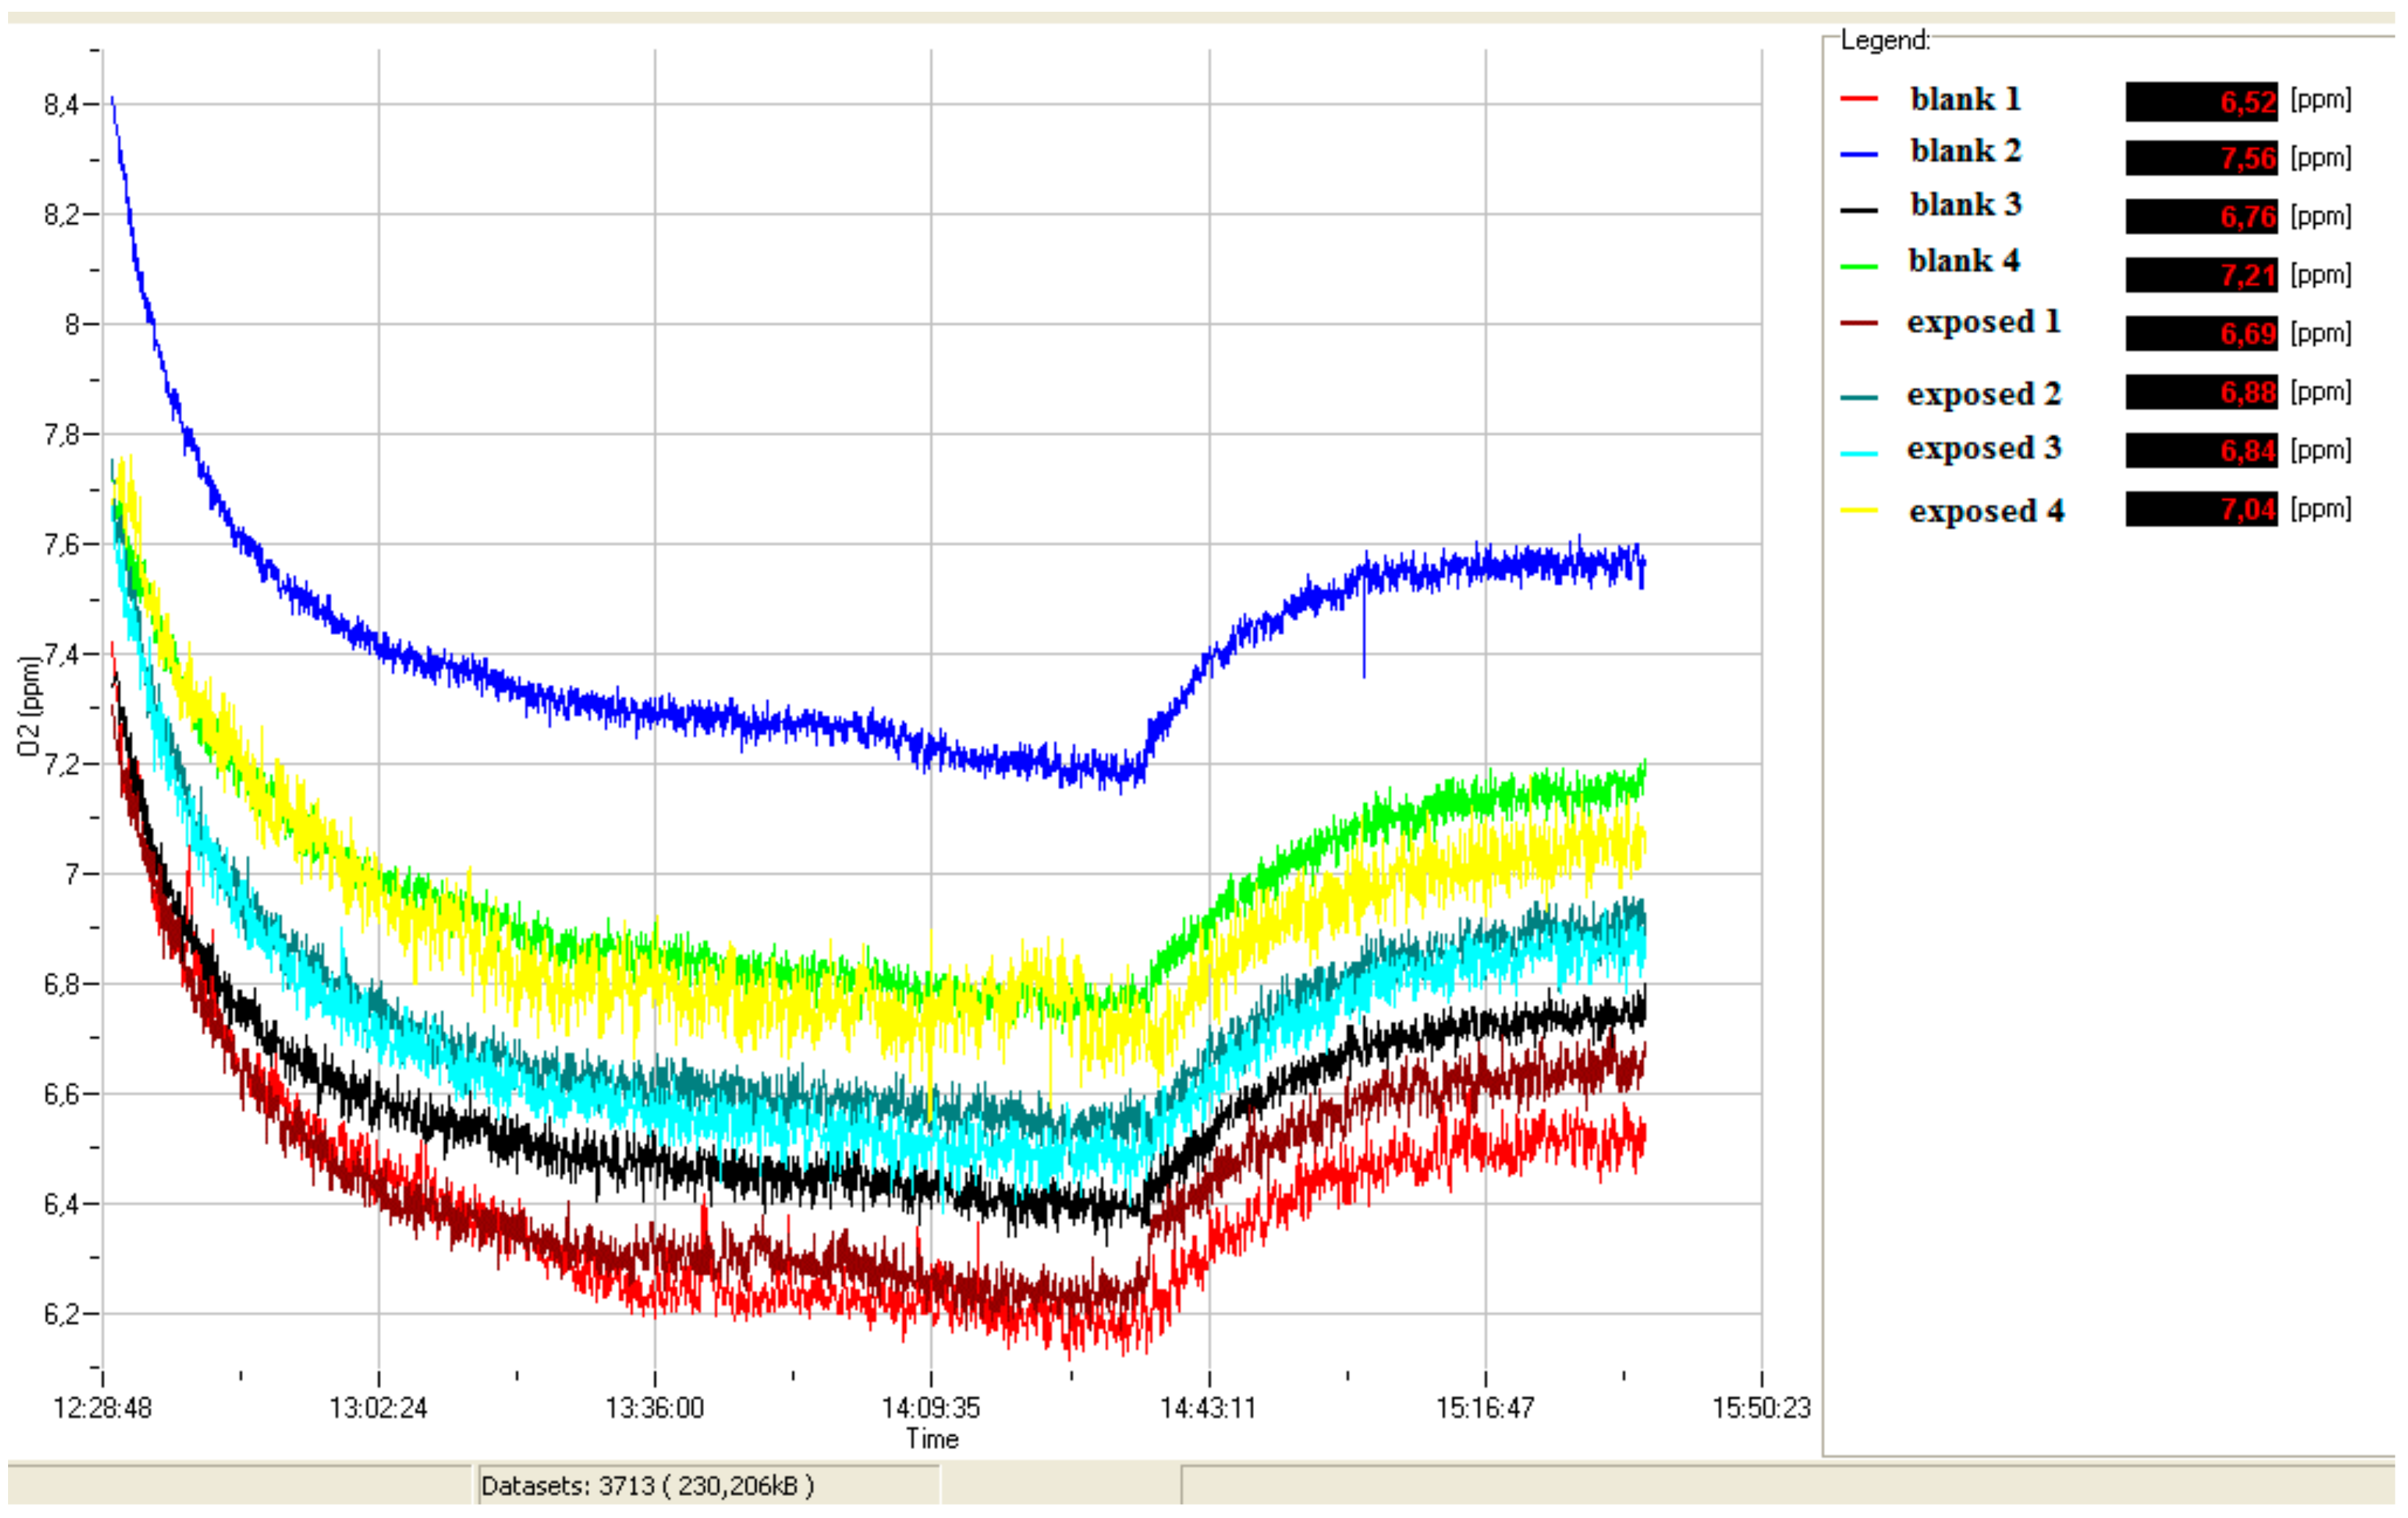
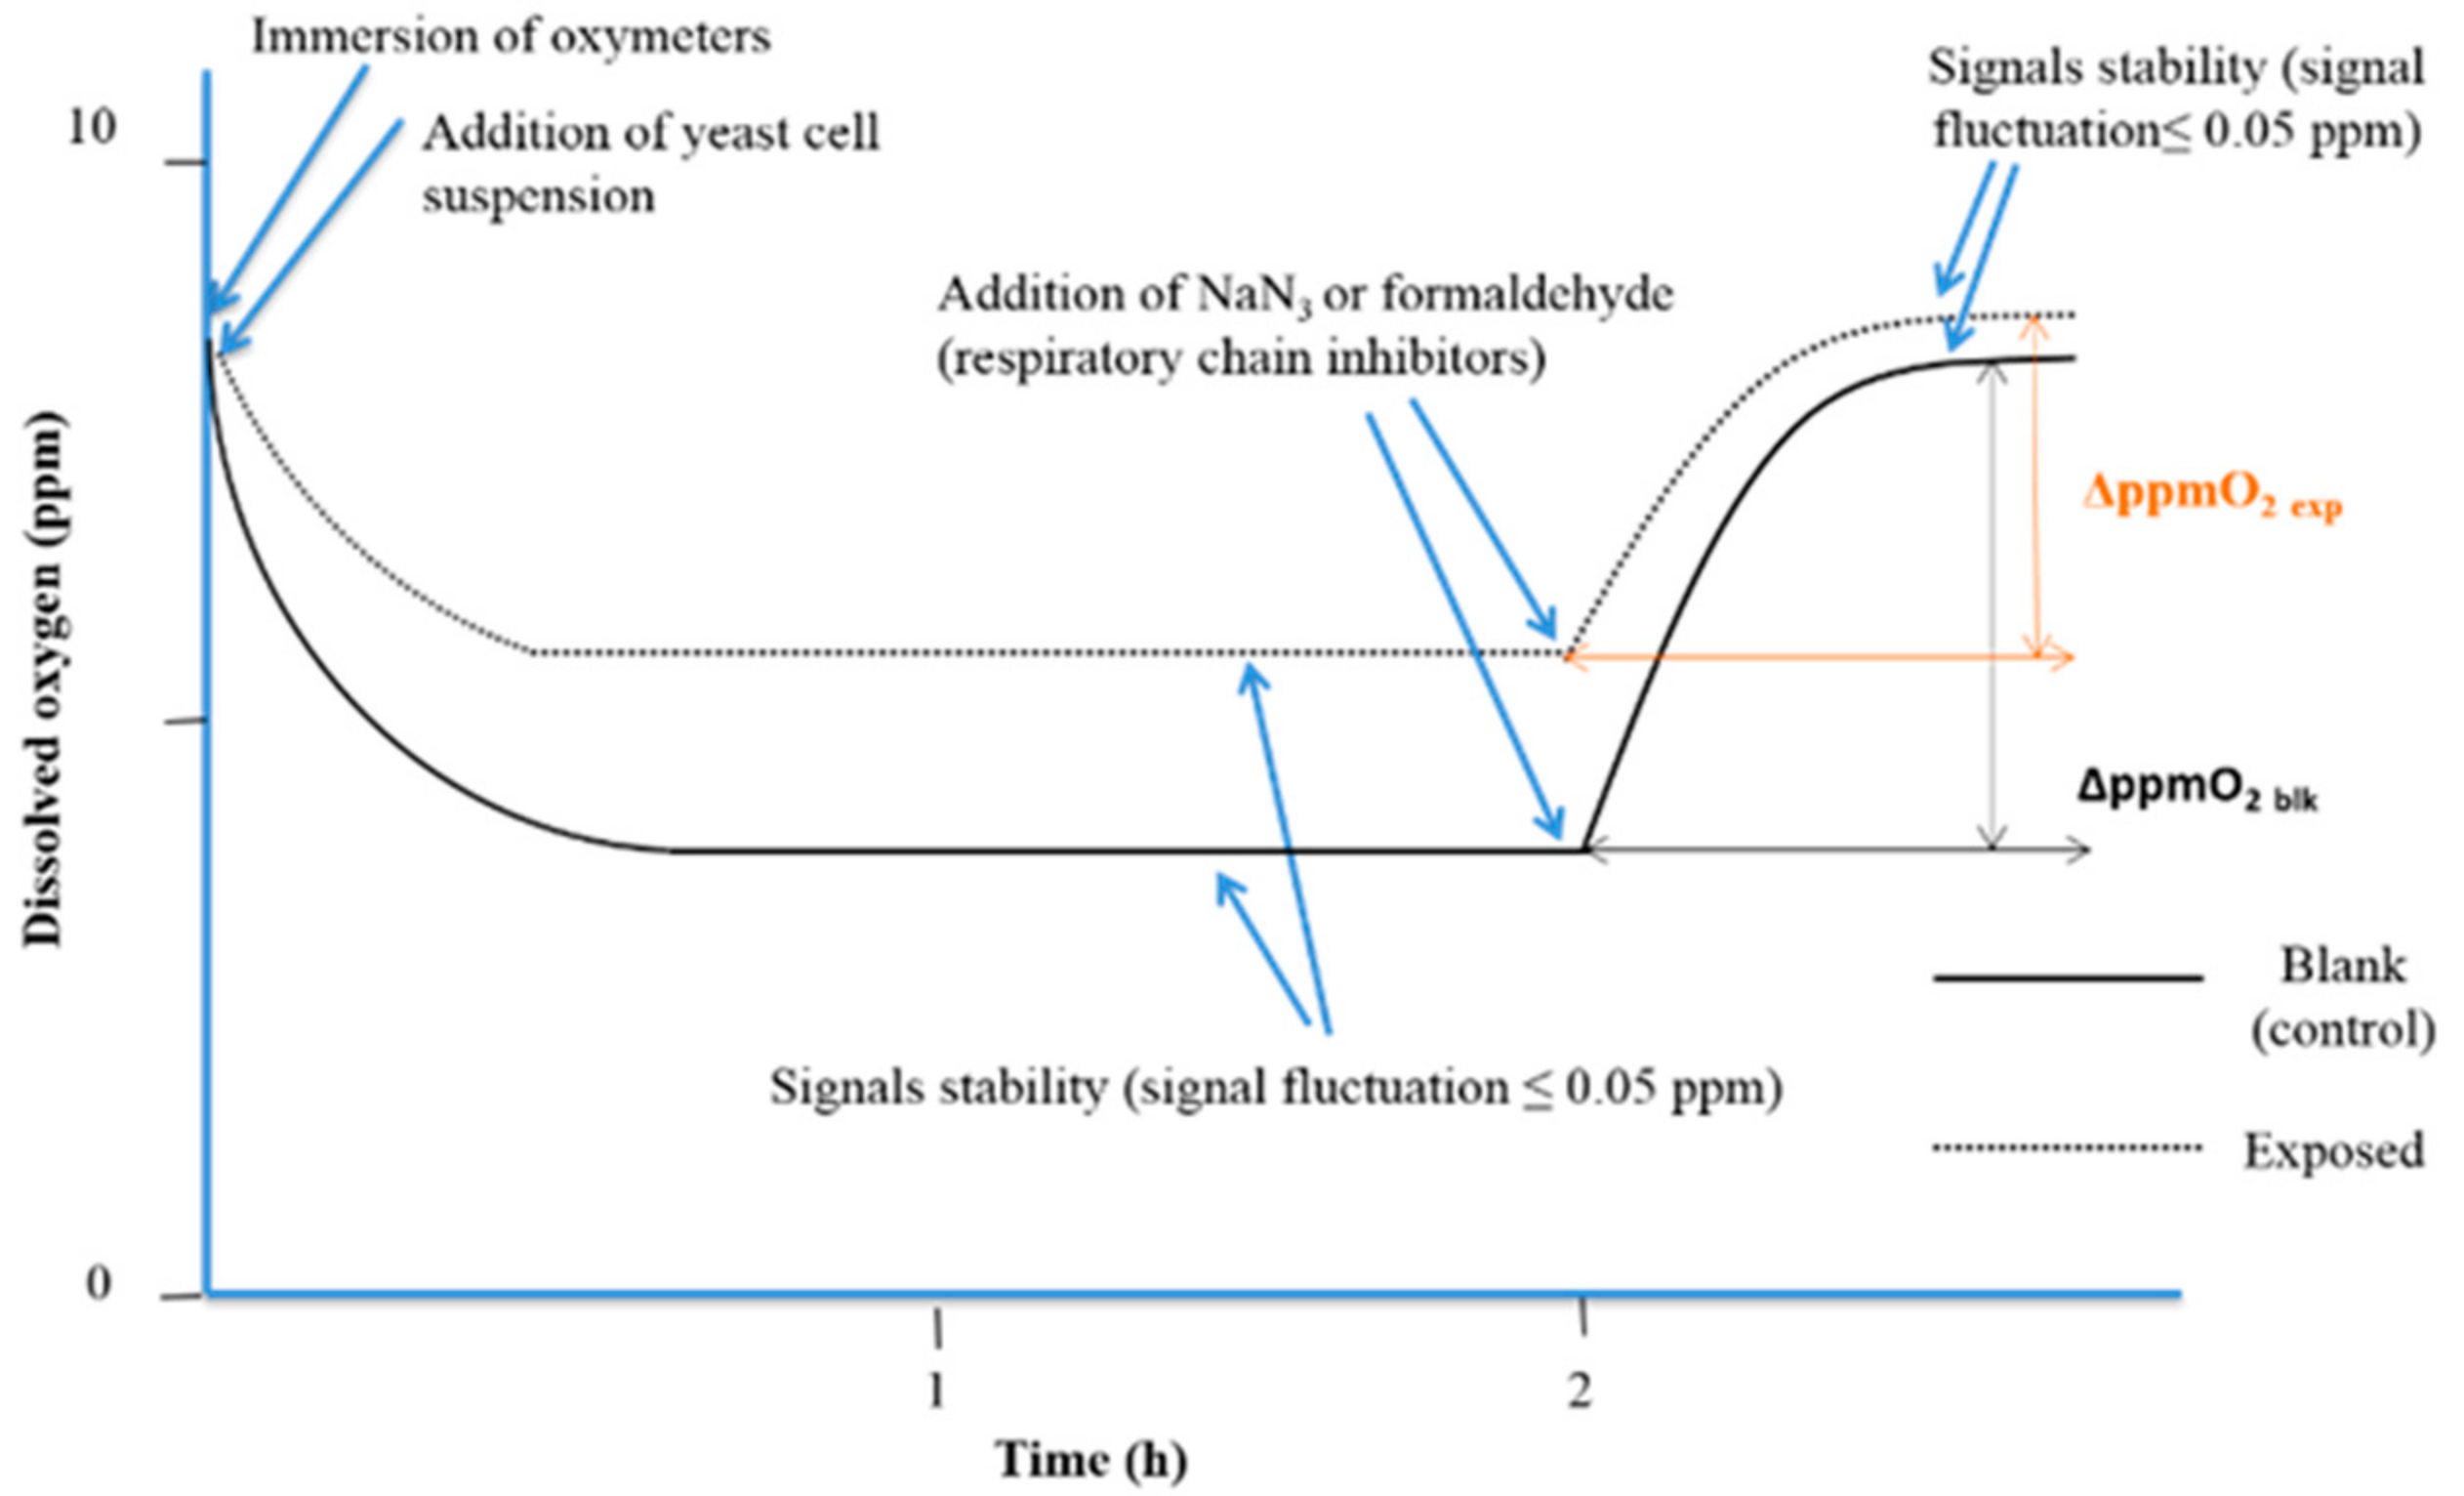
2.6. Bioassays
- Blank samples: 12.500 mL sample + 2.500 mL of 3 mol/L glucose solution + 0.150 mL of methanolic solution (concentration < 0.1%) without simazine
- Simazine-spiked samples: 12.500 mL sample + 2.500 mL of 3 mol/L glucose solution + 0.150 mL methanolic solution (concentration < 0.1%) of simazine
- Blank samples: 13.875 mL of sample + 0.750 mL of 3.2% w/v boric acid solution + 0.375 mL of methanolic solution (concentration < 0.1%) without simazine
- Simazine-spiked samples: 13.875 mL of sample + 0.750 mL of 3.2% w/v boric acid solution + 0.375 mL methanolic solution (concentration < 0.1%) of simazine
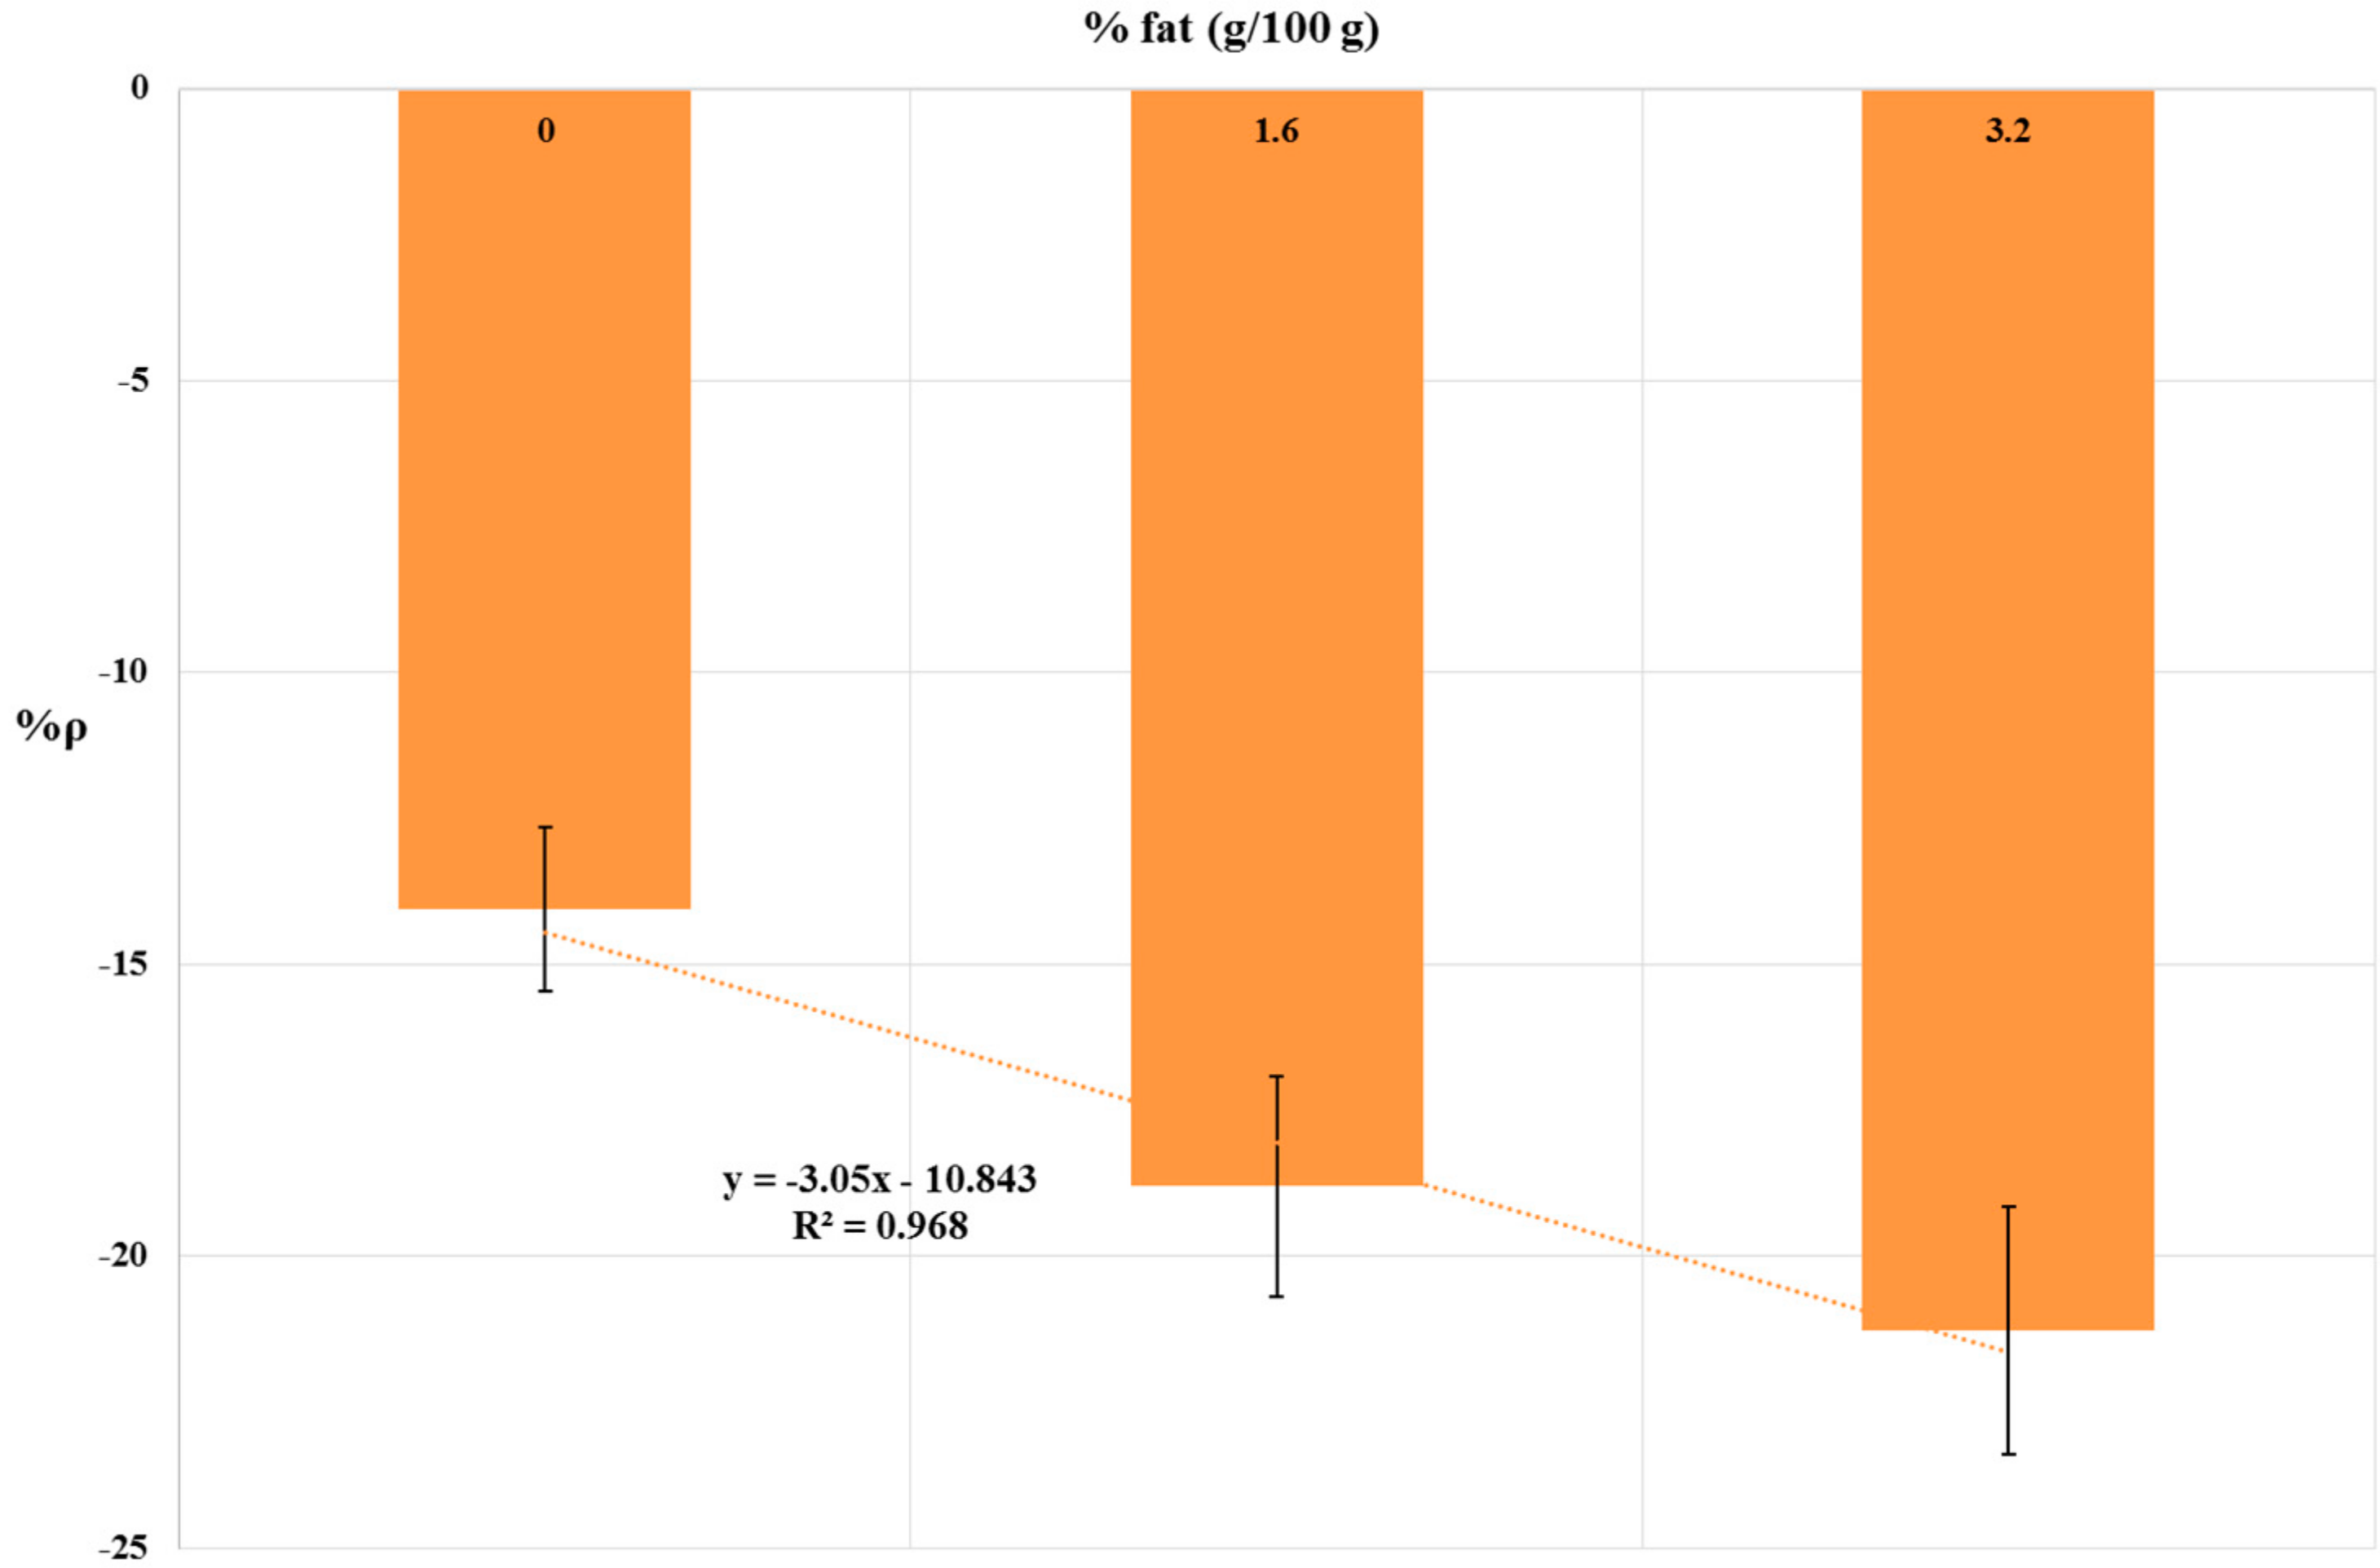
Sample Matrix Effect: Influence of Milk Fat Content
- Blank samples: 13.875 mL of sample + 0.750 mL of 3.2% w/v boric acid solution + 0.375 mL of methanolic solution (concentration < 0.1%) without simazine
- Simazine-spiked samples: 13.875 mL of sample + 0.750 mL of 3.2% w/v boric acid solution + 0.375 mL methanolic solution (concentration < 0.1%) of simazine (final concentration 10 ppb)
3. Results
4. Discussion
4.1. Yeast Cell Proliferation Control
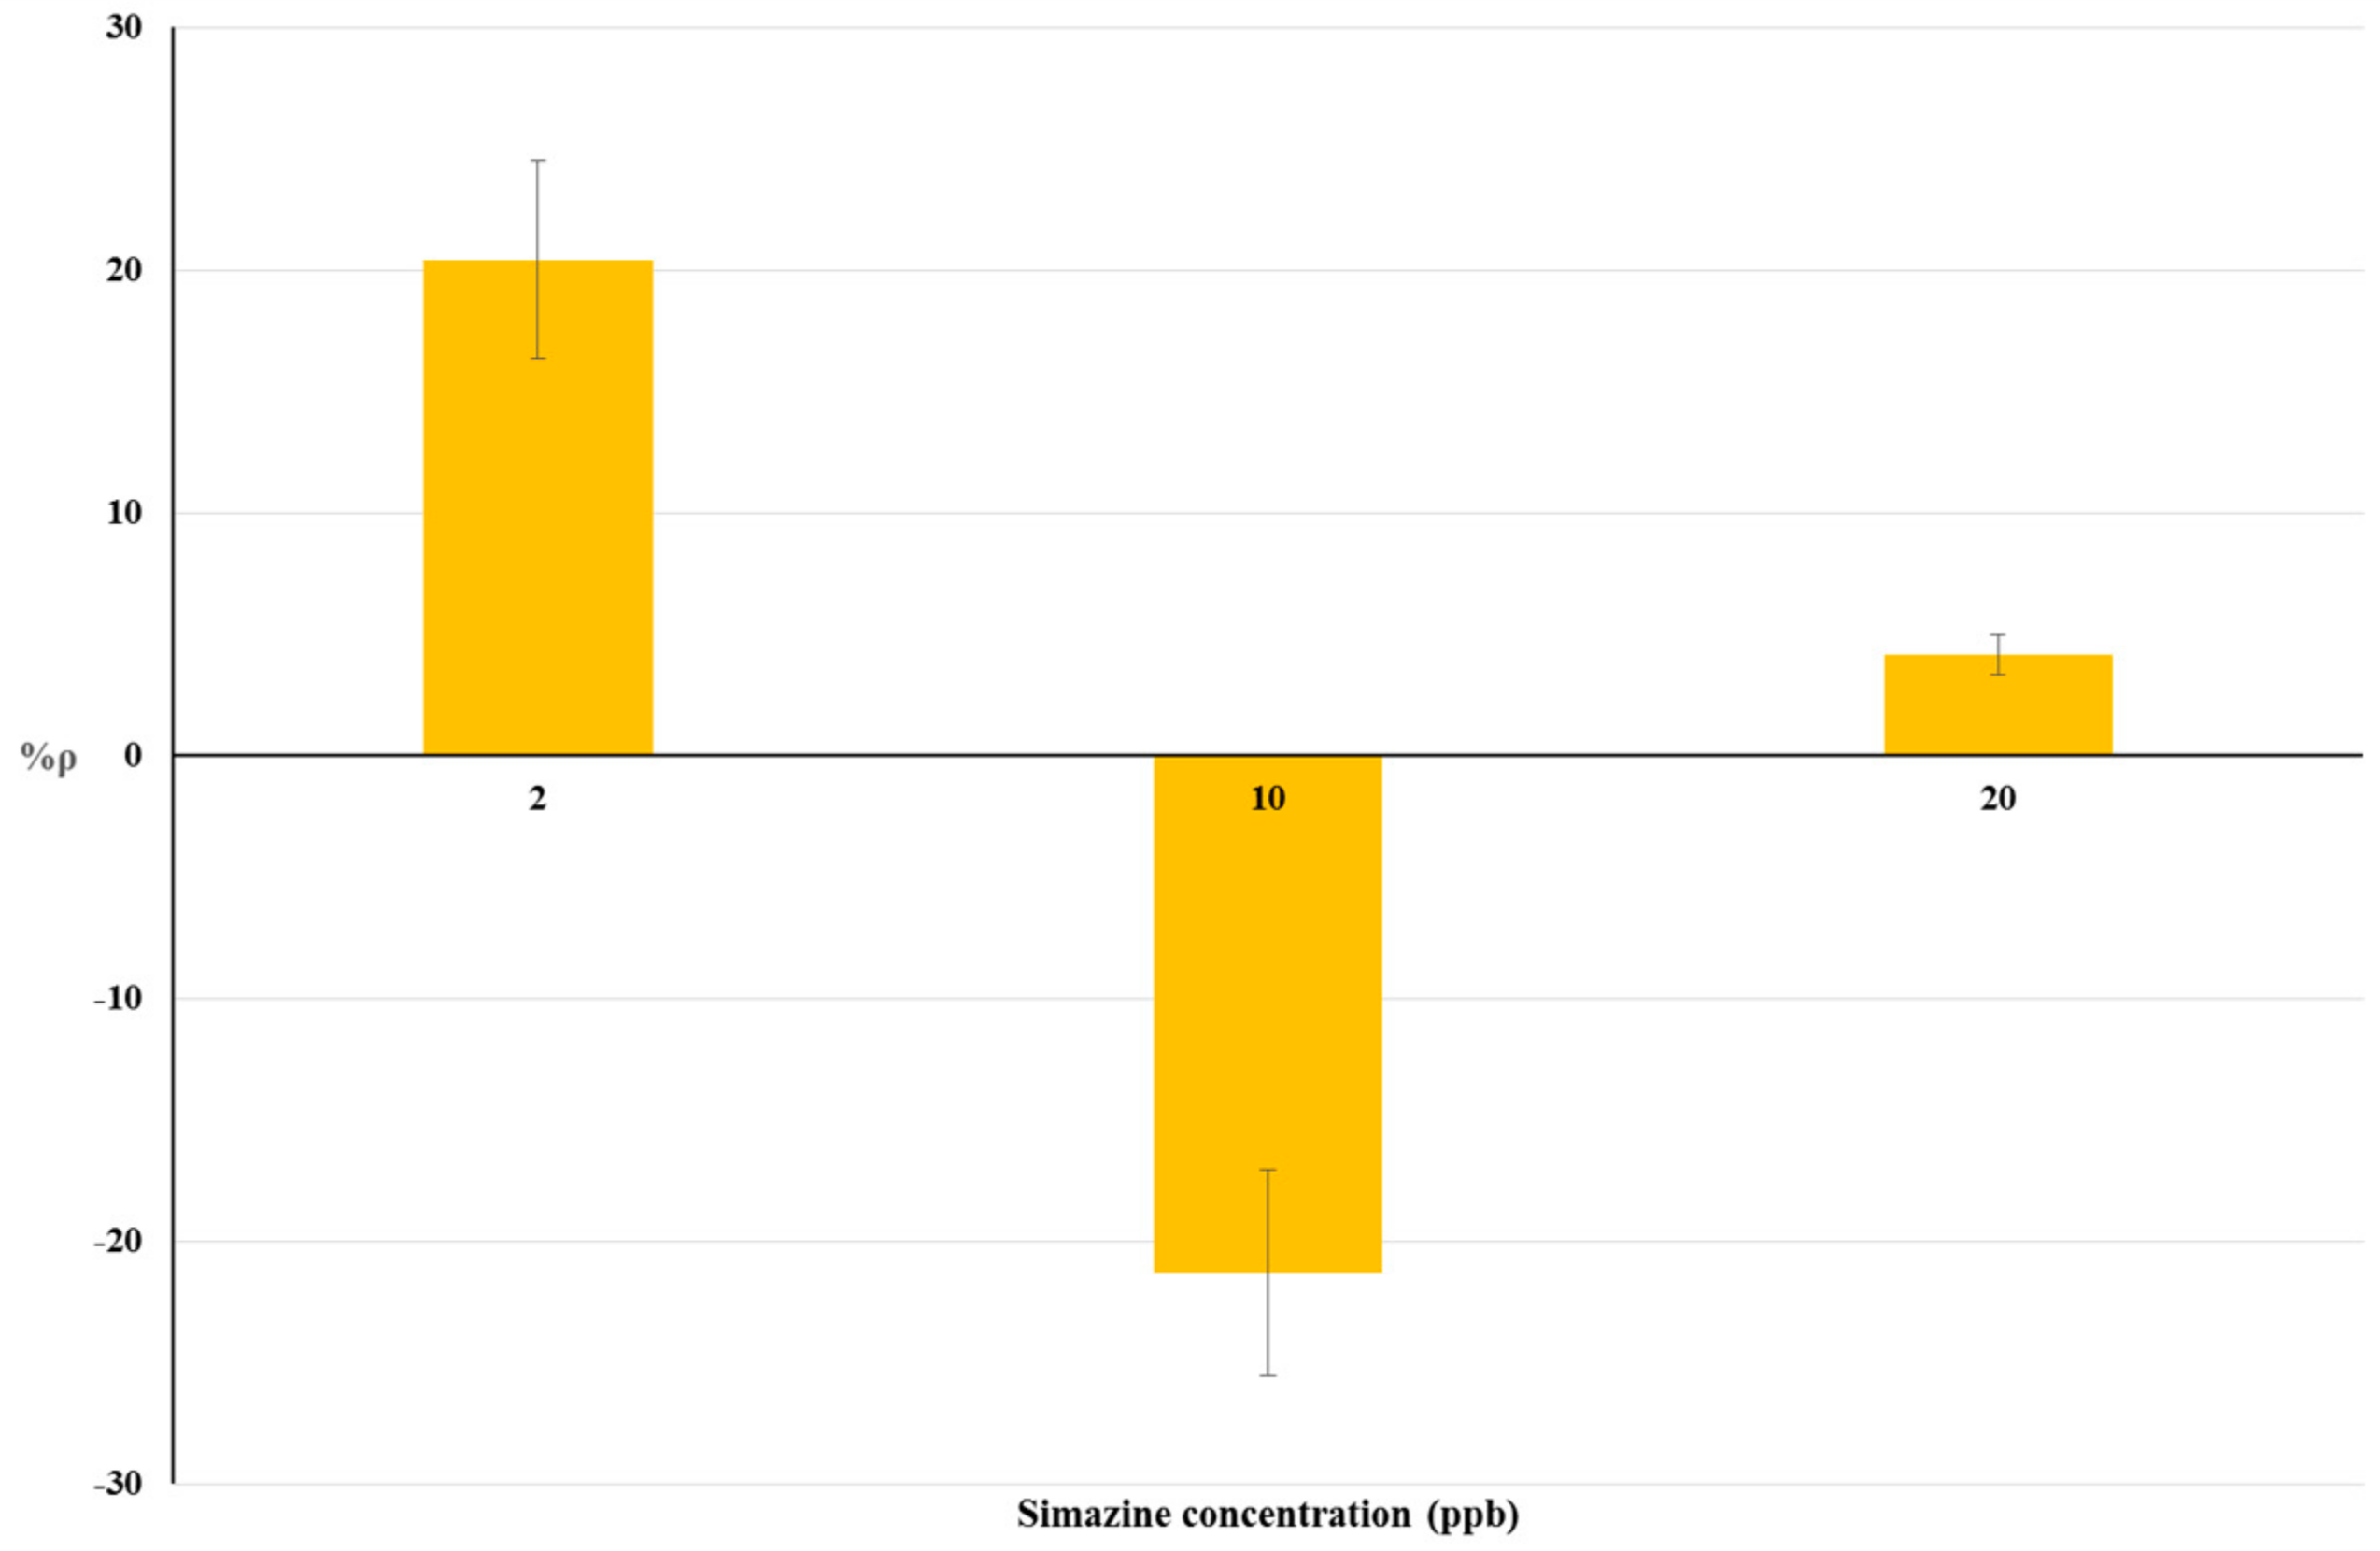
4.2. Bioassays on Livestock Drinking Water and Raw Cow’s Milk Samples
Sample Matrix Effect: Influence of Milk Fat Content
5. Conclusions
Supplementary Materials
Author Contributions
Funding
Acknowledgments
Conflicts of Interest
References
- Velisek, J.; Stara, A.; Machova, J.; Svobodova, Z. Effects of long-term exposure to simazine in real concentrations on common carp (Cyprinus carpio L.). Ecotoxicol. Environ. Saf. 2012, 76, 79–86. [Google Scholar] [CrossRef] [PubMed]
- Council Directive (EU) No 91/414/ECC of 15 July 1991 Concerning the Placing of Plant Protection Products on the Market. Available online: https://eur-lex.europa.eu/legal-content/EN/TXT/PDF/?uri=CELEX:31991L0414&from=en (accessed on 7 July 2018).
- Silva, M.; Iyer, P. Toxicity endpoint selections for a simazine risk assessment. Birth Defects Res. Part B Dev. Reprod. Toxicol. 2014, 101, 308–324. [Google Scholar] [CrossRef] [PubMed]
- Heri, T.; Pfiser, F.; Carroll, B.; Parshley, T.; Nabors, J.B. Production, Development, and Registration of Triazine Herbicides. In The Triazines Herbicides 50 Years Revolutionizing Agriculture; LeBaron, H.M., McFarland, J.E., Burnside, O.C., Eds.; Elsevier: Amsterdam, The Netherlands, 2008; p. 34. ISBN 978044451167. [Google Scholar]
- Gunasekara, A.S. Environmental Fate of Simazine; Environmental Monitoring Branch, Cal/EPA Department of Pesticide Regulation; 2004; Available online:. Available online: http://citeseerx.ist.psu.edu/viewdoc/download?doi=10.1.1.444.9905&rep=rep1&type=pdf (accessed on 7 July 2018).
- ISPRA. National Report on Pesticides in Water—2013–2014 Data. 2016. Available online: http://www.isprambiente.gov.it/en/publications/reports/national-report-on-pesticides-in-water-2013-2013-2014-data?set_language=en (accessed on 8 Sepetember 2018).
- Jame, Y.W.; Cessna, A.J.; Biederbeck, V.O.; Grover, R.; Smith, A.E.; Korven, H.C. Herbicide residues and yield effects from repeated flood-irrigations of alfalfa with water containing monuron or simazine. Can. J. Plant Sci. 1999, 79, 639–645. [Google Scholar] [CrossRef] [Green Version]
- MacLachlan, D. Pesticide Risk Profile for the Grazing of Pasture and/or Cutting of Hay and Feeding to Cattle and Sheep. 2010. Available online: http://www.elmsavers.com.au/wp-content/uploads/downloads/misc/aqis.pdf (accessed on 8 September 2018).
- Farkaš, P.; Schultzová, K.; Kovačičová, J.; Szokolay, A. Analysis of triazine herbicides residues in butter and pasteurized milk. Z. Lebensm Unters Forch. 1988, 186, 319–322. [Google Scholar] [CrossRef]
- De Felipe, M.R.; Fernandez-Pascual, M.; Pozuelo, J.M. Effects of the herbicides Lindex and Simazine on chloroplast and nodule development, nodule activity, and grain yield in Lupinus albus L. Plant Soil. 1987, 101, 99–105. [Google Scholar] [CrossRef]
- Zorrilla, L.M.; Gibson, E.K.; Stoker, T.E. The effects of simazine, a chlorotriazine herbicide, on pubertal development in the female Wistar rat. Reprod. Toxicol. 2010, 29, 393–400. [Google Scholar] [CrossRef] [PubMed]
- Sai, L.; Liu, Y.; Qu, B.; Yu, G.; Guo, Q.; Bo, C.; Ng, J.C. The effects of simazine, a chlorotriazine herbicide, on the expression of genes in developing male Xenopus laevis. Bull. Environ. Contam. Toxicol. 2015, 95, 157–163. [Google Scholar] [CrossRef] [PubMed]
- Florian, C.P.; Mansfield, S.R.; Schroeder, J.R. Differences in GPR30 regulation by chlorotriazine herbicides in human breast cells. Biochem. Res. Int. 2016, 2016, 2984081. [Google Scholar] [CrossRef] [PubMed]
- Yu, J.; Li, X.; Yang, J.; Wu, Y.; Li, B. Effects of Simazine Exposure on Neuronal Development-Related Factors in MN9D Cells. Med. Sci. Monit. 2016, 22, 2831–2838. [Google Scholar] [CrossRef] [PubMed] [Green Version]
- Stara, A.; Machova, J.; Velisek, J. Effect of chronic exposure to simazine on oxidative stress and antioxidant response in common carp (Cyprinus carpio L.). Environ. Toxicol. Pharmacol. 2012, 33, 334–343. [Google Scholar] [CrossRef] [PubMed]
- Allender, W.J.; Glastonbury, J.W. Simazine toxicosis in sheep. Vet. Hum. Toxicol. 1992, 34, 422–423. [Google Scholar] [PubMed]
- Palmer, J.S.; Radeleff, R.D. The Toxicity of Some Organic Herbicides to Cattle, Sheep, and Chickens. US Dept Agric Prod Res Rep. 1969, 106, 26–27. [Google Scholar]
- Portolés, T.; Pitarch, E.; López, F.J.; Hernández, F. Development and validation of a rapid and wide-scope qualitative screening method for detection and identification of organic pollutants in natural water and wastewater by gas chromatography time-of-flight mass spectrometry. J. Chromatogr. A 2011, 1218, 303–315. [Google Scholar] [CrossRef] [PubMed] [Green Version]
- Diaz, R.; Ibáñez, M.; Sancho, J.V.; Hernández, F. Qualitative validation of a liquid chromatography–quadrupole-time of flight mass spectrometry screening method for organic pollutants in waters. J. Chromatogr. A 2013, 1276, 47–57. [Google Scholar] [CrossRef] [PubMed] [Green Version]
- Bueno, M.J.M.; Hernando, M.D.; Agüera, A.; Fernández-Alba, A.R. Application of passive sampling devices for screening of micro-pollutants in marine aquaculture using LC–MS/MS. Talanta 2009, 77, 1518–1527. [Google Scholar] [CrossRef]
- Segura, P.A.; MacLeod, S.L.; Lemoine, P.; Sauvé, S.; Gagnon, C. Quantification of carbamazepine and atrazine and screening of suspect organic contaminants in surface and drinking waters. Chemosphere 2011, 84, 1085–1094. [Google Scholar] [CrossRef] [PubMed]
- Tian, H. Determination of chloramphenicol, enrofloxacin and 29 pesticides residues in bovine milk by liquid chromatography–tandem mass spectrometry. Chemosphere 2011, 83, 349–355. [Google Scholar] [CrossRef] [PubMed]
- Beale, D.J.; Porter, N.A.; Roddick, F.A. A fast screening method for the presence of atrazine and other triazines in water using flow injection with chemiluminescent detection. Talanta 2009, 78, 342–347. [Google Scholar] [CrossRef] [PubMed]
- Obare, S.O.; De, C.; Guo, W.; Haywood, T.L.; Samuels, T.A.; Adams, C.P.; Masika, N.O.; Murray, D.H.; Anderson, G.A.; Campbell, K.; et al. Fluorescent chemosensors for toxic organophosphorus pesticides: A review. Sensors 2010, 10, 7018–7043. [Google Scholar] [CrossRef] [PubMed]
- Abegão, L.M.G.; Ribeiro, J.H.F.; Ribeiro, P.A.; Raposo, M. Nano-molar deltamethrin sensor based on electrical impedance of PAH/PAZO layer-by-layer sensing films. Sensors 2013, 13, 10167–10176. [Google Scholar] [CrossRef] [PubMed]
- Mazouz, Z.; Rahali, S.; Fourati, N.; Zerrouki, C.; Aloui, N.; Seydou, M.; Yaakoubi, N.; Chehimi, M.M.; Othmane, A.; Kalfat, R. Highly Selective Polypyrrole MIP-Based Gravimetric and Electrochemical Sensors for Picomolar Detection of Glyphosate. Sensors 2017, 17, 2586. [Google Scholar] [CrossRef] [PubMed]
- Dragone, R.; Grasso, G.; Muccini, M.; Toffanin, S. Portable bio/chemosensoristic devices: Innovative systems for environmental health and food safety diagnostics. Front. Public Health 2017, 5, 1–6. [Google Scholar] [CrossRef] [PubMed]
- Dragone, R.; Grasso, G. Biosensoristic Devices: Monitoring and Diagnostics in Agro-Zootechnical Productions. Cameroon-Nigeria-Italy Scientific Cooperation: Veterinary Public Health and Sustainable Food Safety to Promote “One Health/One Prevention”. 2012. Available online: http://old.iss.it/binary/publ/cont/12_49_web.pdf#page=80 (accessed on 7 July2018).
- Peña-Vázquez, E.; Maneiro, E.; Pérez-Conde, C.; Moreno-Bondi, M.C.; Costas, E. Microalgae fiber optic biosensors for herbicide monitoring using sol–gel technology. Biosens. Bioelectron. 2009, 24, 3538–3543. [Google Scholar] [CrossRef] [PubMed]
- Braconi, D.; Bernardini, G.; Santucci, A. Saccharomyces cerevisiae as a model in ecotoxicological studies: A post-genomics perspective. J. Proteom. 2016, 137, 19–34. [Google Scholar] [CrossRef] [PubMed]
- Frazzoli, C.; Dragone, R.; Mantovani, A.; Massimi, C.; Campanella, L. Functional toxicity and tolerance patterns of bioavailable Pd (II), Pt (II), and Rh (III) on suspended Saccharomyces cerevisiae cells assayed in tandem by a respirometric biosensor. Anal. Bioanal. Chem. 2007, 389, 2185–2194. [Google Scholar] [CrossRef] [PubMed]
- Dragone, R.; Frazzoli, C.; Grasso, G.; Rossi, G. Sensor with intact or modified yeast cells as rapid device for toxicological test of chemicals. J. Agric. Chem. Environ. 2014, 3, 35–40. [Google Scholar] [CrossRef]
- Dragone, R.; Cheng, R.; Grasso, G.; Frazzoli, C. Diuron in Water: Functional Toxicity and Intracellular Detoxification Patterns of Active Concentrations Assayed in Tandem by a Yeast-Based Probe. Int. J. Environ. Res. Public Health 2015, 12, 3731–3740. [Google Scholar] [CrossRef] [PubMed] [Green Version]
- Gonzales, C.; Touraud, E.; Spinelli, S.; Thomas, O. Organic Constituents. In Uv-Visible Spectrophotometry of Water and Wastewater, 2nd ed.; Thomas, O., Burgess, C., Eds.; Elsevier: Amsterdam, The Netherlands, 2017; p. 99. ISBN 9780444638977. [Google Scholar]
- Goodridge, L.; Hill, A.R.; Lencki, R.W. A review of international standards and the scientific literature on farm milk bulk-tank sampling protocols. J. Dairy Sci. 2004, 87, 3099–3104. [Google Scholar] [CrossRef]
- Appicciafuoco, B.; Dragone, R.; Frazzoli, C.; Bolzoni, G.; Mantovani, A.; Ferrini, A.M. Microbial screening for quinolones residues in cow milk by bio-optical method. J. Pharm. Biomed. Anal. 2015, 106, 179–185. [Google Scholar] [CrossRef] [PubMed]
- Roostita, R.; Fleet, G.H. Growth of yeasts in milk and associated changes to milk composition. Int. J. Food Microbiol. 1996, 31, 205–219. [Google Scholar] [CrossRef]
- Schmidt, M.; Schaumberg, J.Z.; Steen, C.M.; Boyer, M.P. Boric acid disturbs cell wall synthesis in Saccharomyces cerevisiae. Int. J. Microbiol. 2010, 2010, 930465. [Google Scholar] [CrossRef] [PubMed]
- Harada, K.; Higuchi, R.; Utsumi, I. Studies on Sorbic Acid: Part IV Inhibition of the Respiration in Yeast. Agric. Biol. Chem. 1968, 32, 940–946. [Google Scholar] [CrossRef]
- Burlini, N.; Pellegrini, R.; Facheris, P.; Tortora, P.; Guerritore, A. Metabolic effects of benzoate and sorbate in the yeast Saccharomyces cerevisiae at neutral pH. Arch. Microbiol. 1993, 159, 220–224. [Google Scholar] [CrossRef]
- Lupetti, A.; Danesi, R.; Campa, M.; Del Tacca, M.; Kelly, S. Molecular basis of resistance to azole antifungals. Trends Mol. Med. 2002, 8, 76–81. [Google Scholar] [CrossRef]
- Lotlikar, P.D. Effects of Herbicides on Oxidative Phosphorylation in Mitochondria from Cabbage, Brassica oleracea. Ph.D. Thesis, Oregon State University, Corvallis, OR, USA, 1960. [Google Scholar]
- Fitzmayer, K.M.; Geiger, J.G.; Van Den Avyle, M.J. Effects of chronic exposure to simazine on the cladoceran, Daphnia pulex. Arch. Environ. Contam. Toxicol. 1982, 111, 603–609. [Google Scholar] [CrossRef]
- Berg, J.M.; Tymoczko, J.L.; Stryer, L. The Regulation of Cellular Respiration Is Governed Primarily by the Need for ATP. In Biochemistry, 5th ed.; W H Freeman: New York, NY, USA, 2002; Section 18.6. Available online: https://0-www-ncbi-nlm-nih-gov.brum.beds.ac.uk/books/NBK22448/ (accessed on 8 September 2018).
- Lotlikar, P.D.; Remmert, L.F.; Freed, V.H. Effects of 2,4-D and other herbicides on oxidative phosphorylation in mitochondria from cabbage. Weed Sci. 1968, 16, 161–165. [Google Scholar] [CrossRef]
- Metcalf, E.C.; Collin, H.A. The effect of simazine on the growth and respiration of a cell suspension culture of celery. New Phytol. 1978, 81, 243–248. [Google Scholar] [CrossRef]
- Wolfger, H.; Mamnun, Y.M.; Kuchler, K. The yeast Pdr15p ATP-binding cassette (ABC) protein is a general stress response factor implicated in cellular detoxification. J. Biol. Chem. 2004, 279, 11593–11599. [Google Scholar] [CrossRef] [PubMed]
- Remy, E.; Niño-González, M.; Godinho, C.P.; Cabrito, T.R.; Teixeira, M.C.; Sá-Correia, I.; Duque, P. Heterologous expression of the yeast Tpo1p or Pdr5p membrane transporters in Arabidopsis confers plant xenobiotic tolerance. Sci. Rep. 2017, 7, 4529. [Google Scholar] [CrossRef] [PubMed]
- Connell, D.W. The Octanol-Water Partition Coefficient. In Handbook of Ecotoxicology; Peter Calow DSc: Oxford, UK, 1997; pp. 775–784. ISBN 9781444313512. [Google Scholar]
- Barchanska, H.; Jodo, E.; Price, R.G.; Baranowska, I.; Abuknesha, R. Monitoring of atrazine in milk using a rapid tube-based ELISA and validation with HPLC. Chemosphere 2012, 87, 1330–1334. [Google Scholar] [CrossRef] [PubMed]
- Fox, P.F.; Uniacke-Lowe, T.; McSweeney, P.L.; Paul, L. Milk lipids. In Dairy Chemistry and Biochemistry, 2nd ed.; Blackie Academic & Professional: London, UK, 1998; pp. 70–72. ISBN 978-3-319-14891-5. [Google Scholar]


| Livestock Drinking Water | Raw Cow’s Milk |
|---|---|
| 0.02 | 2 |
| 0.1 1 | 10 2 |
| 0.2 | 20 |
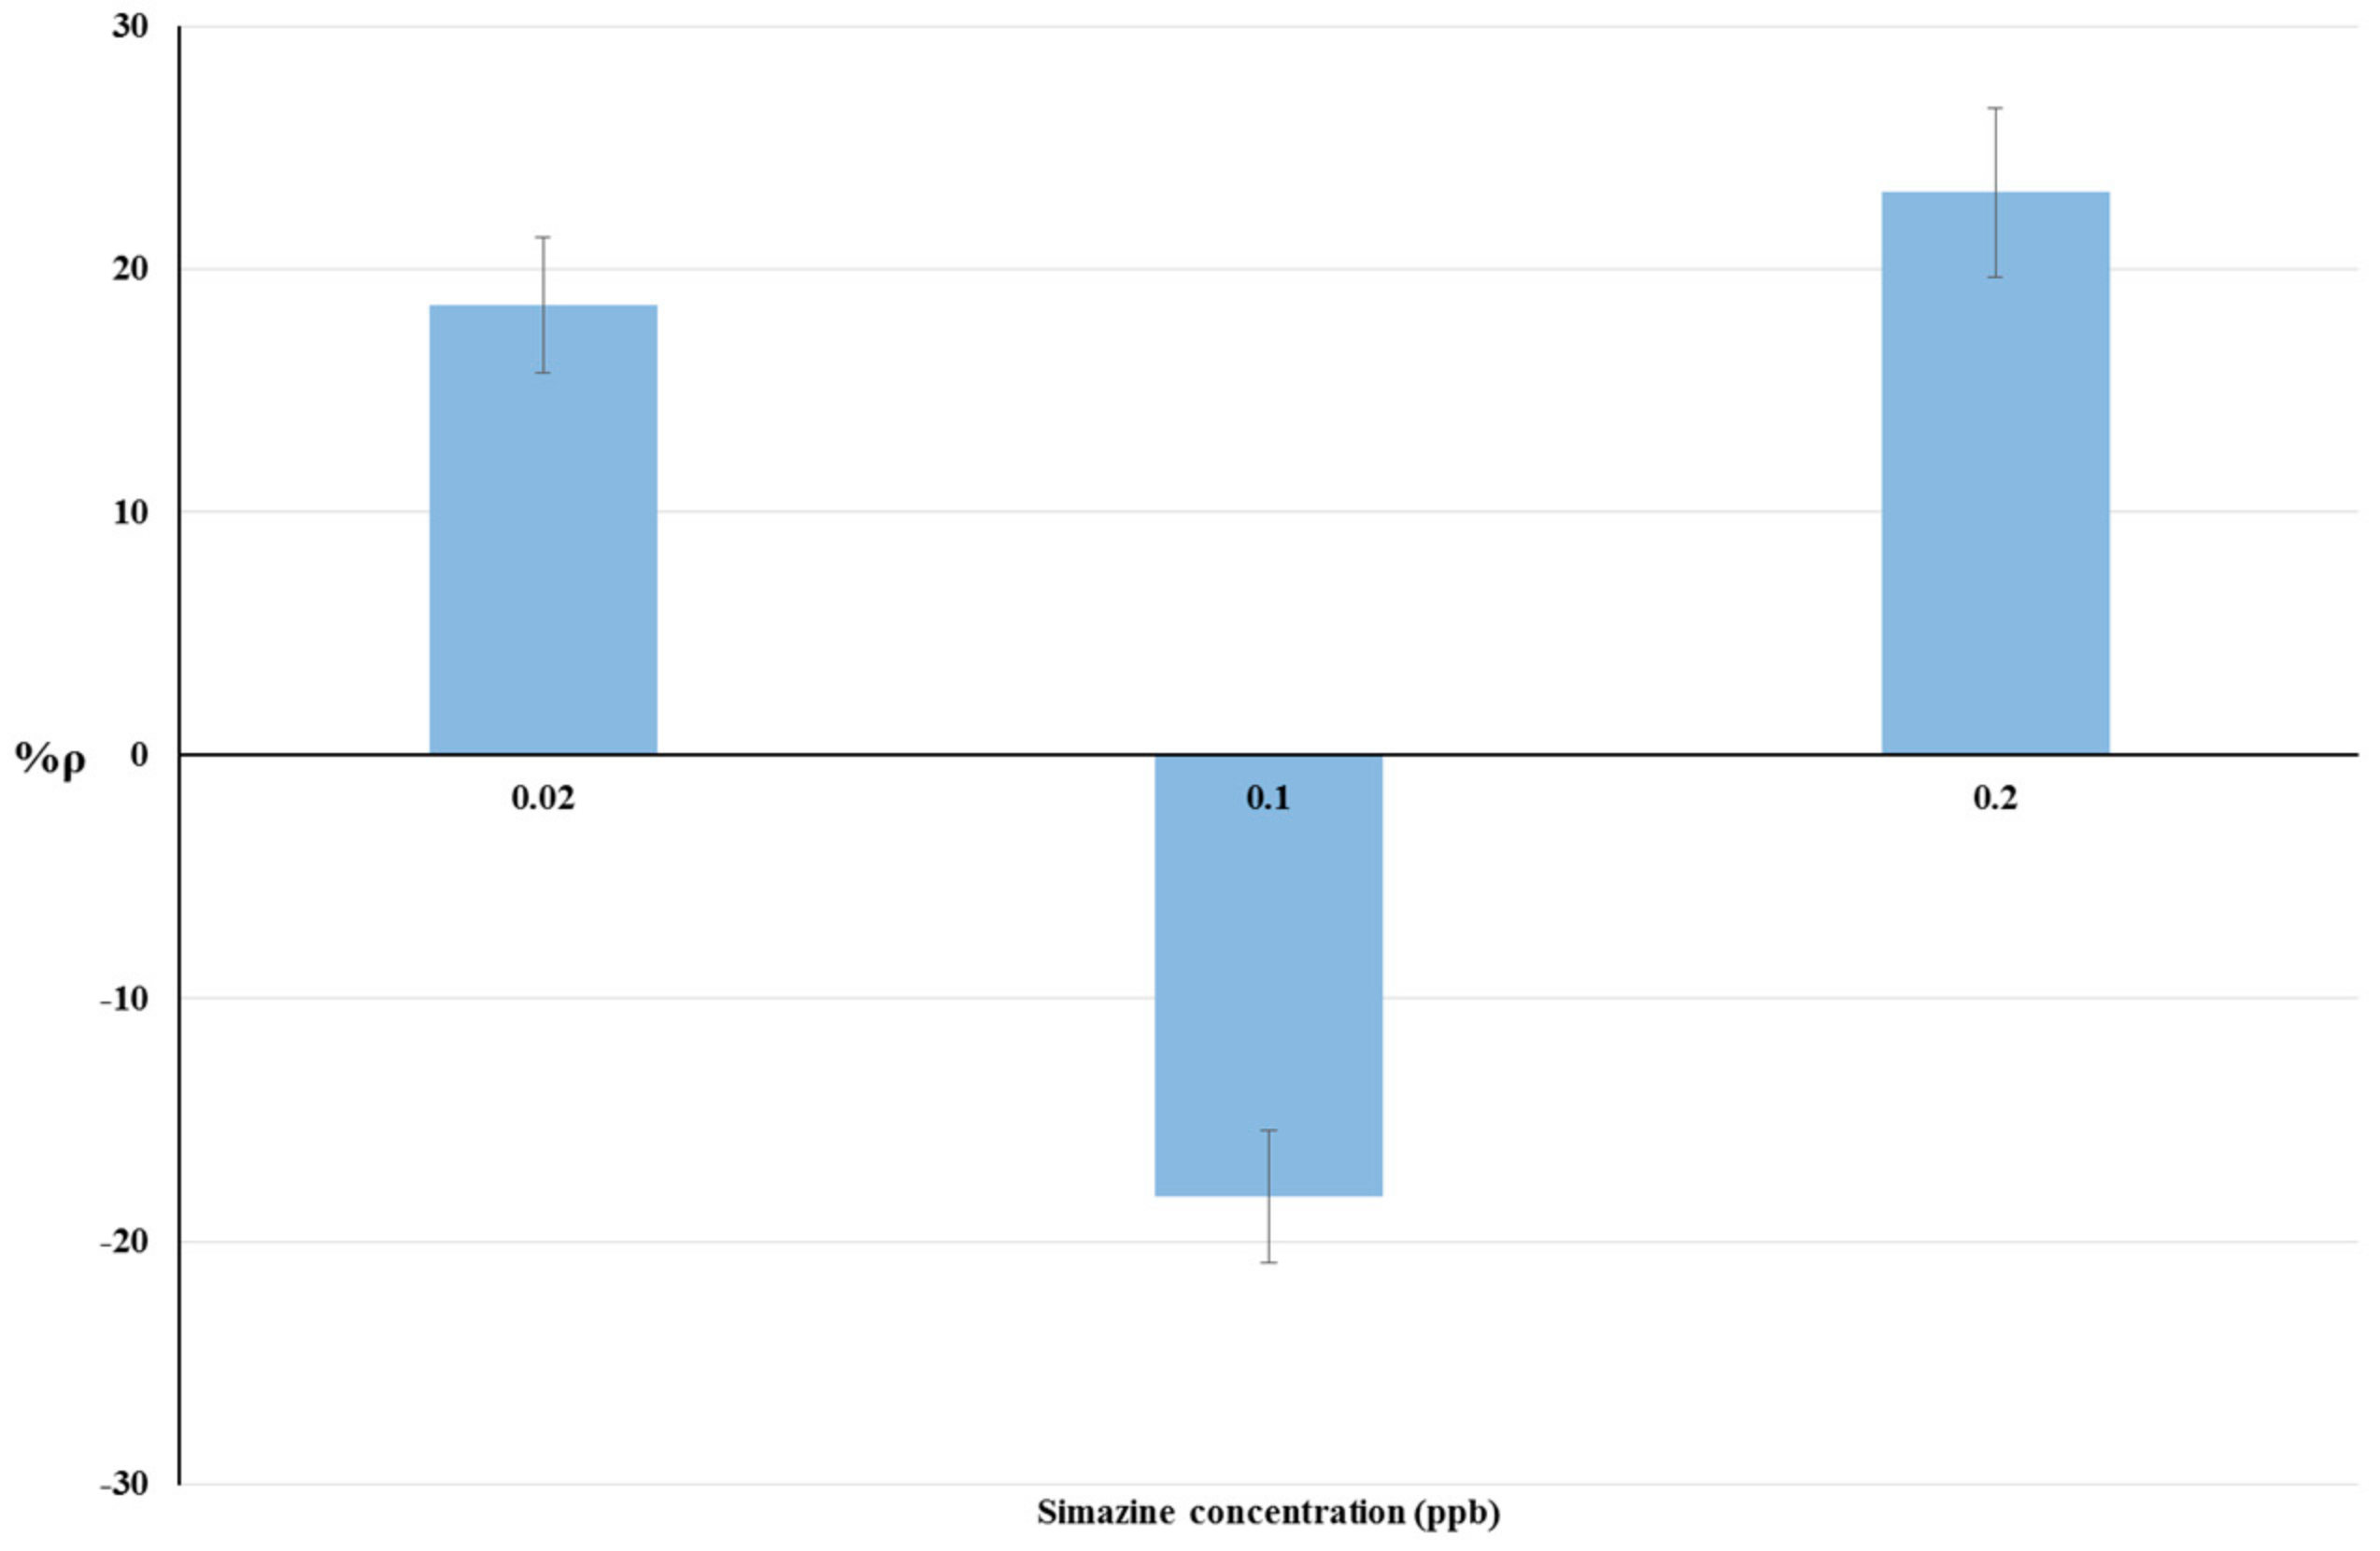
| Livestock Drinking Water | Raw Cow’s Milk | ||
|---|---|---|---|
| Simazine Concentration (ppb) | %ρ 1 | Simazine Concentration (ppb) | %ρ 1 |
| 0.02 | 18.53 | 2 | 20.43 |
| 0.1 | −18.13 | 10 | −21.28 |
| 0.2 | 23.17 | 20 | 4.15 |
| Milk Fat Content | %ρ 1 |
|---|---|
| 0 | −14.07 |
| 1.6 | −18.81 |
| 3.2 | −21.28 |
© 2018 by the authors. Licensee MDPI, Basel, Switzerland. This article is an open access article distributed under the terms and conditions of the Creative Commons Attribution (CC BY) license (http://creativecommons.org/licenses/by/4.0/).
Share and Cite
Grasso, G.; Caracciolo, L.; Cocco, G.; Frazzoli, C.; Dragone, R. Towards Simazine Monitoring in Agro-Zootechnical Productions: A Yeast Cell Bioprobe for Real Samples Screening. Biosensors 2018, 8, 112. https://0-doi-org.brum.beds.ac.uk/10.3390/bios8040112
Grasso G, Caracciolo L, Cocco G, Frazzoli C, Dragone R. Towards Simazine Monitoring in Agro-Zootechnical Productions: A Yeast Cell Bioprobe for Real Samples Screening. Biosensors. 2018; 8(4):112. https://0-doi-org.brum.beds.ac.uk/10.3390/bios8040112
Chicago/Turabian StyleGrasso, Gerardo, Ludovico Caracciolo, Giulia Cocco, Chiara Frazzoli, and Roberto Dragone. 2018. "Towards Simazine Monitoring in Agro-Zootechnical Productions: A Yeast Cell Bioprobe for Real Samples Screening" Biosensors 8, no. 4: 112. https://0-doi-org.brum.beds.ac.uk/10.3390/bios8040112