
Factors Affecting Voriconazole Trough Concentration and Optimal Maintenance Voriconazole Dose in Chinese Children

 ,
,
Abstract
:1. Introduction
2. Results
2.1. Demographics and Clinical Characteristics
2.2. Measurement of Plasma Voriconazole Concentrations and Dosing: Empiric and TDM-Guided
2.3. Variability of Voriconazole Concentrations
2.4. Factors Affecting Voriconazole Trough Concentrations
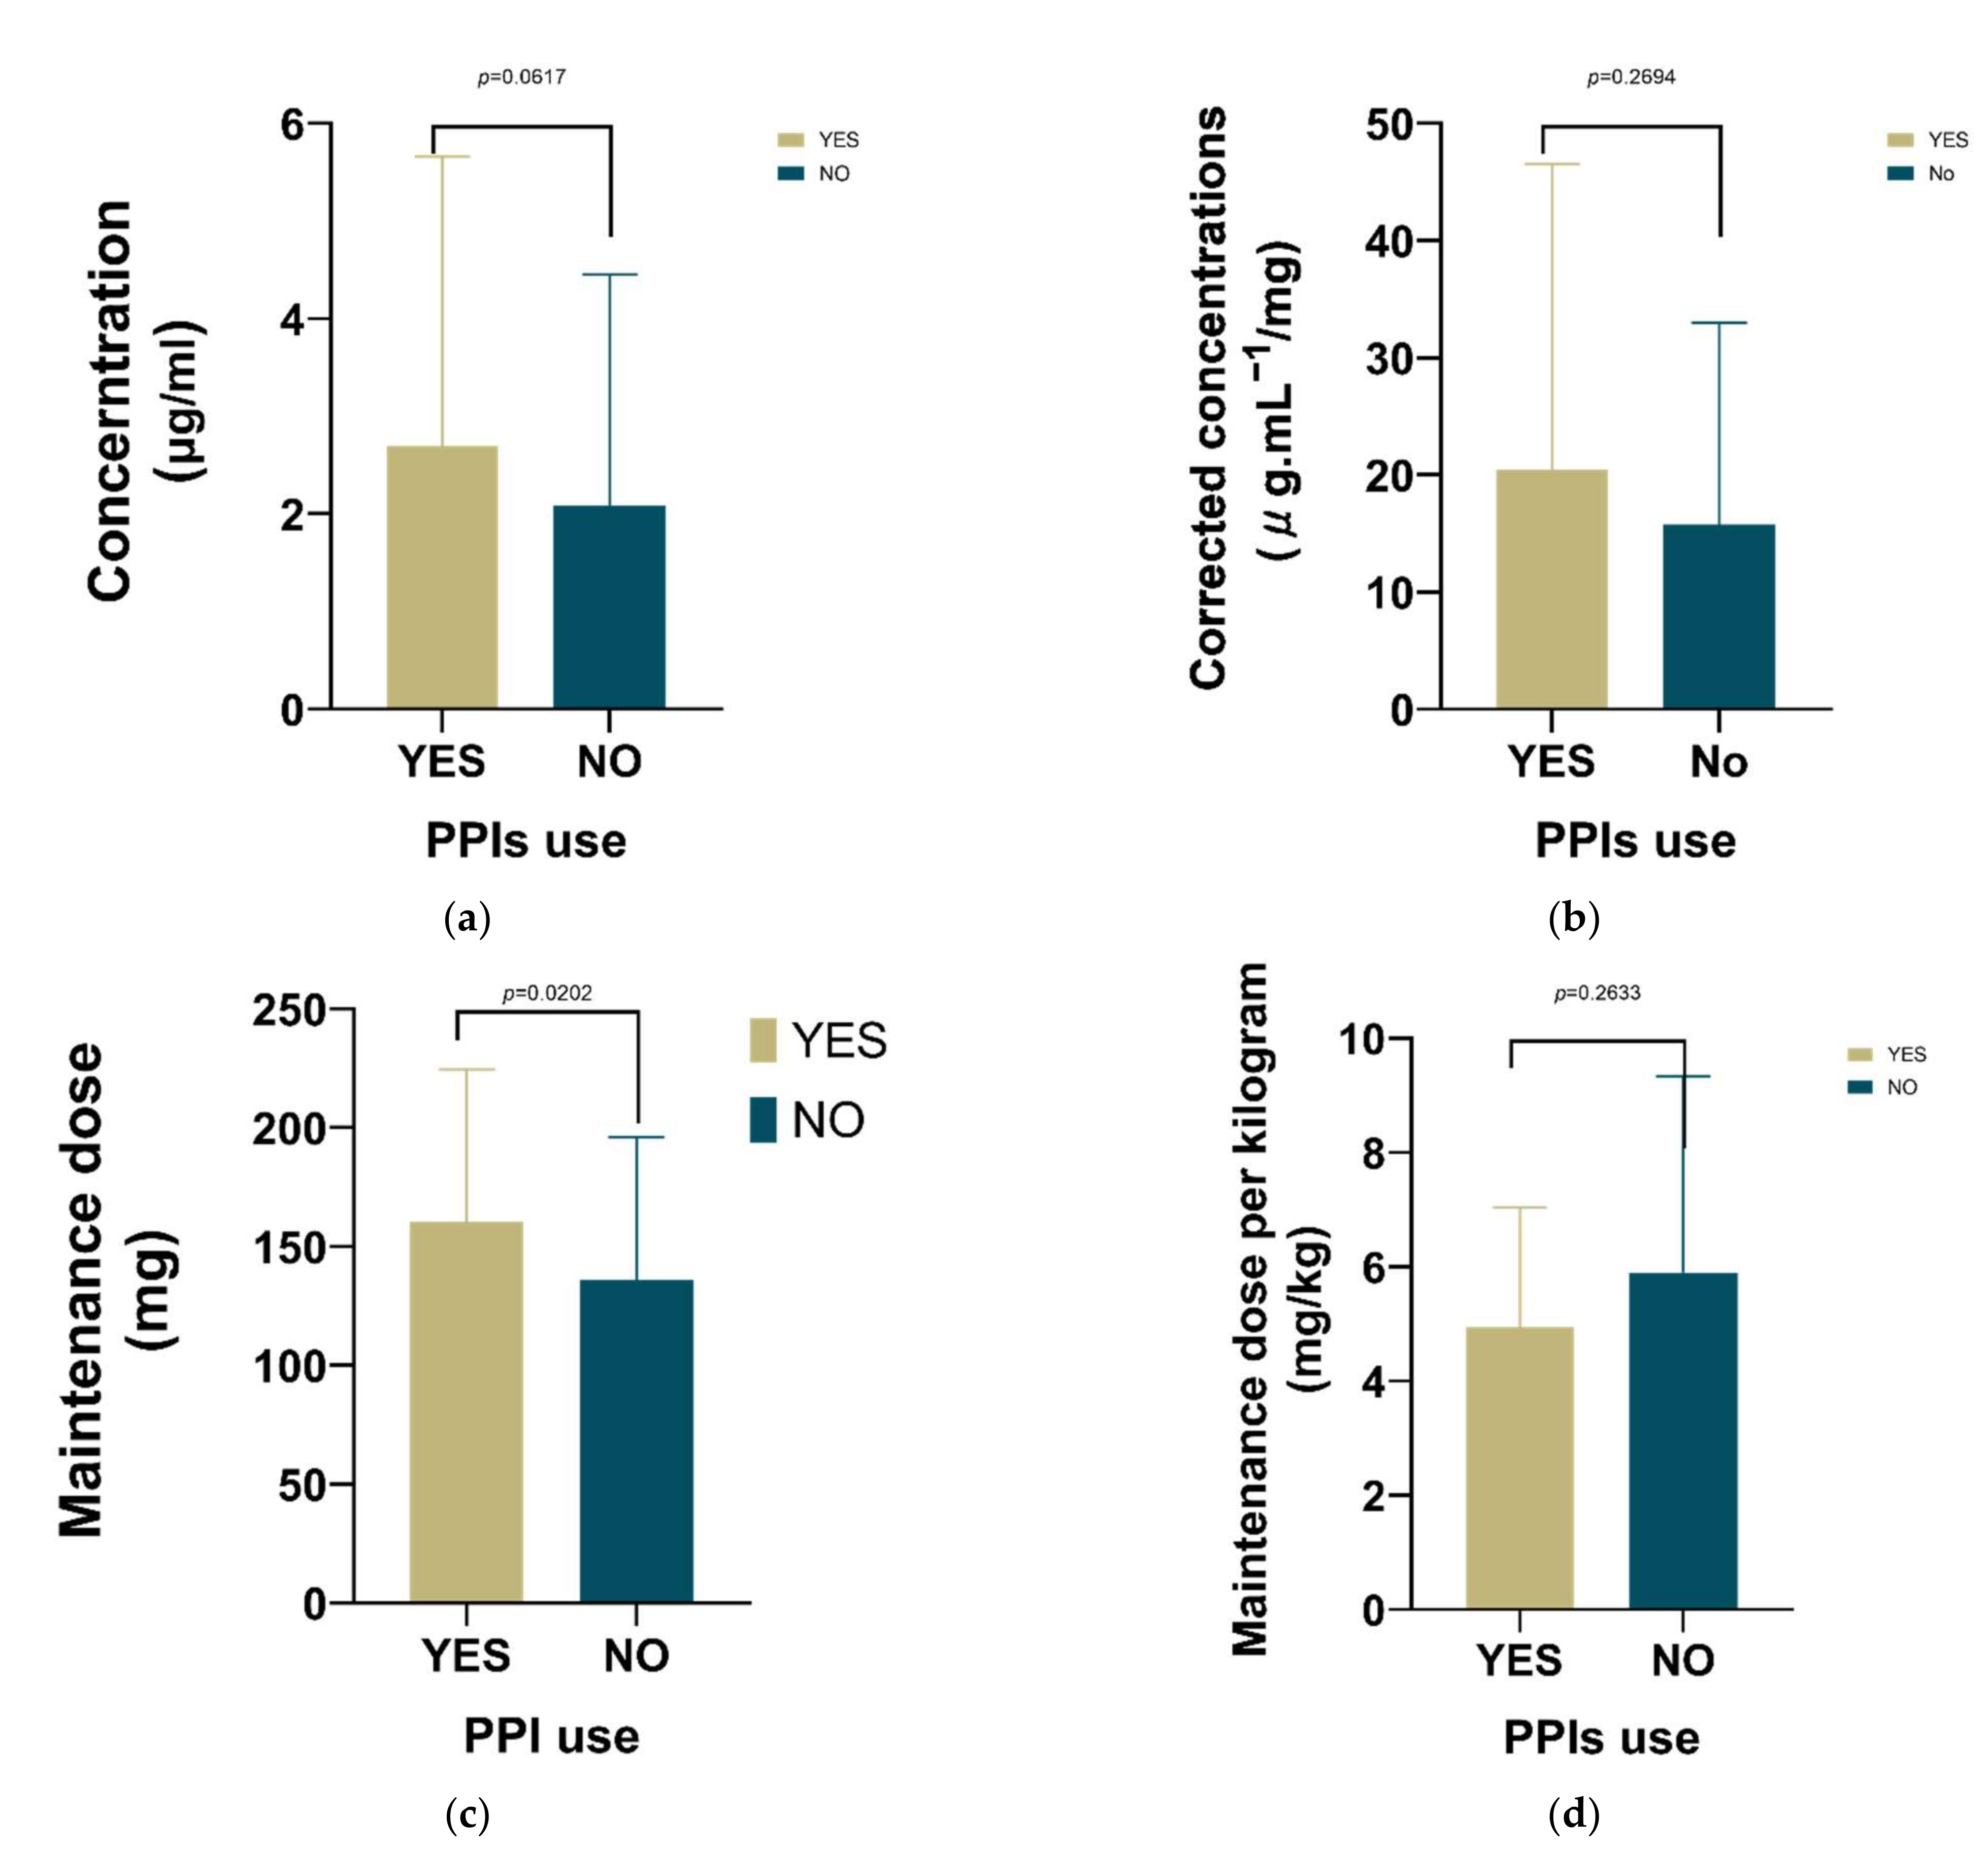
2.5. Effect of Drug Combination
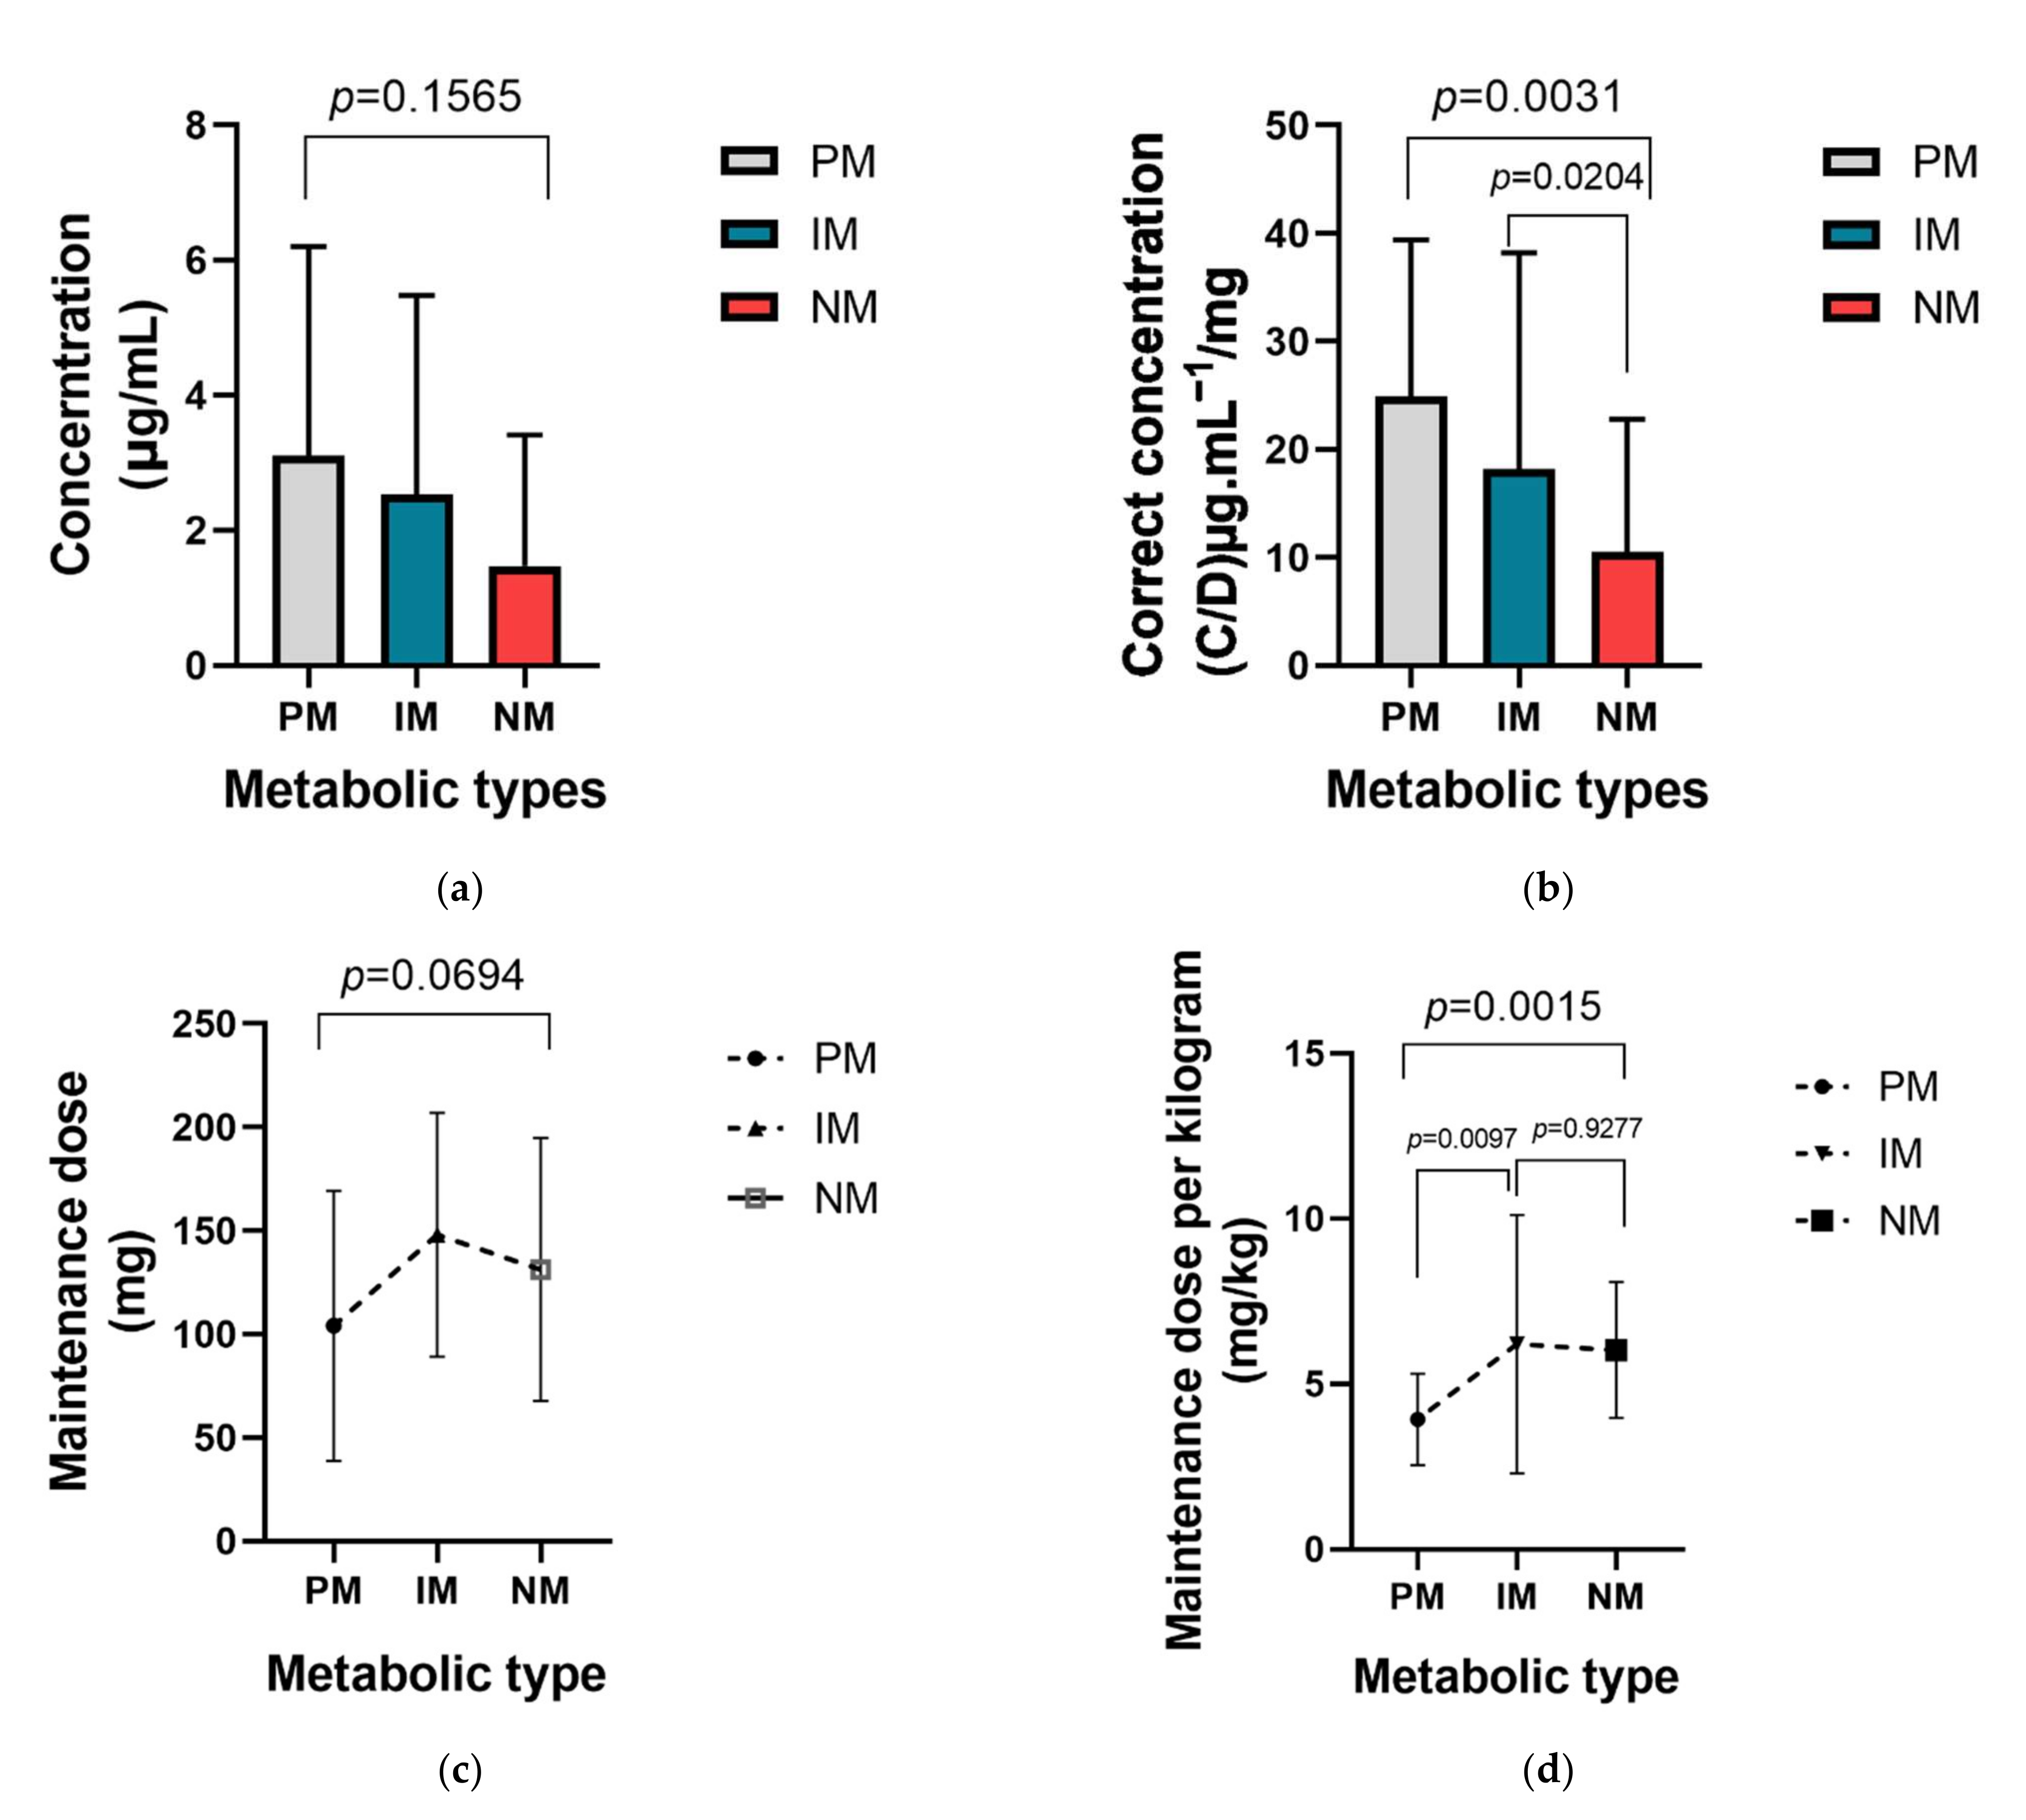
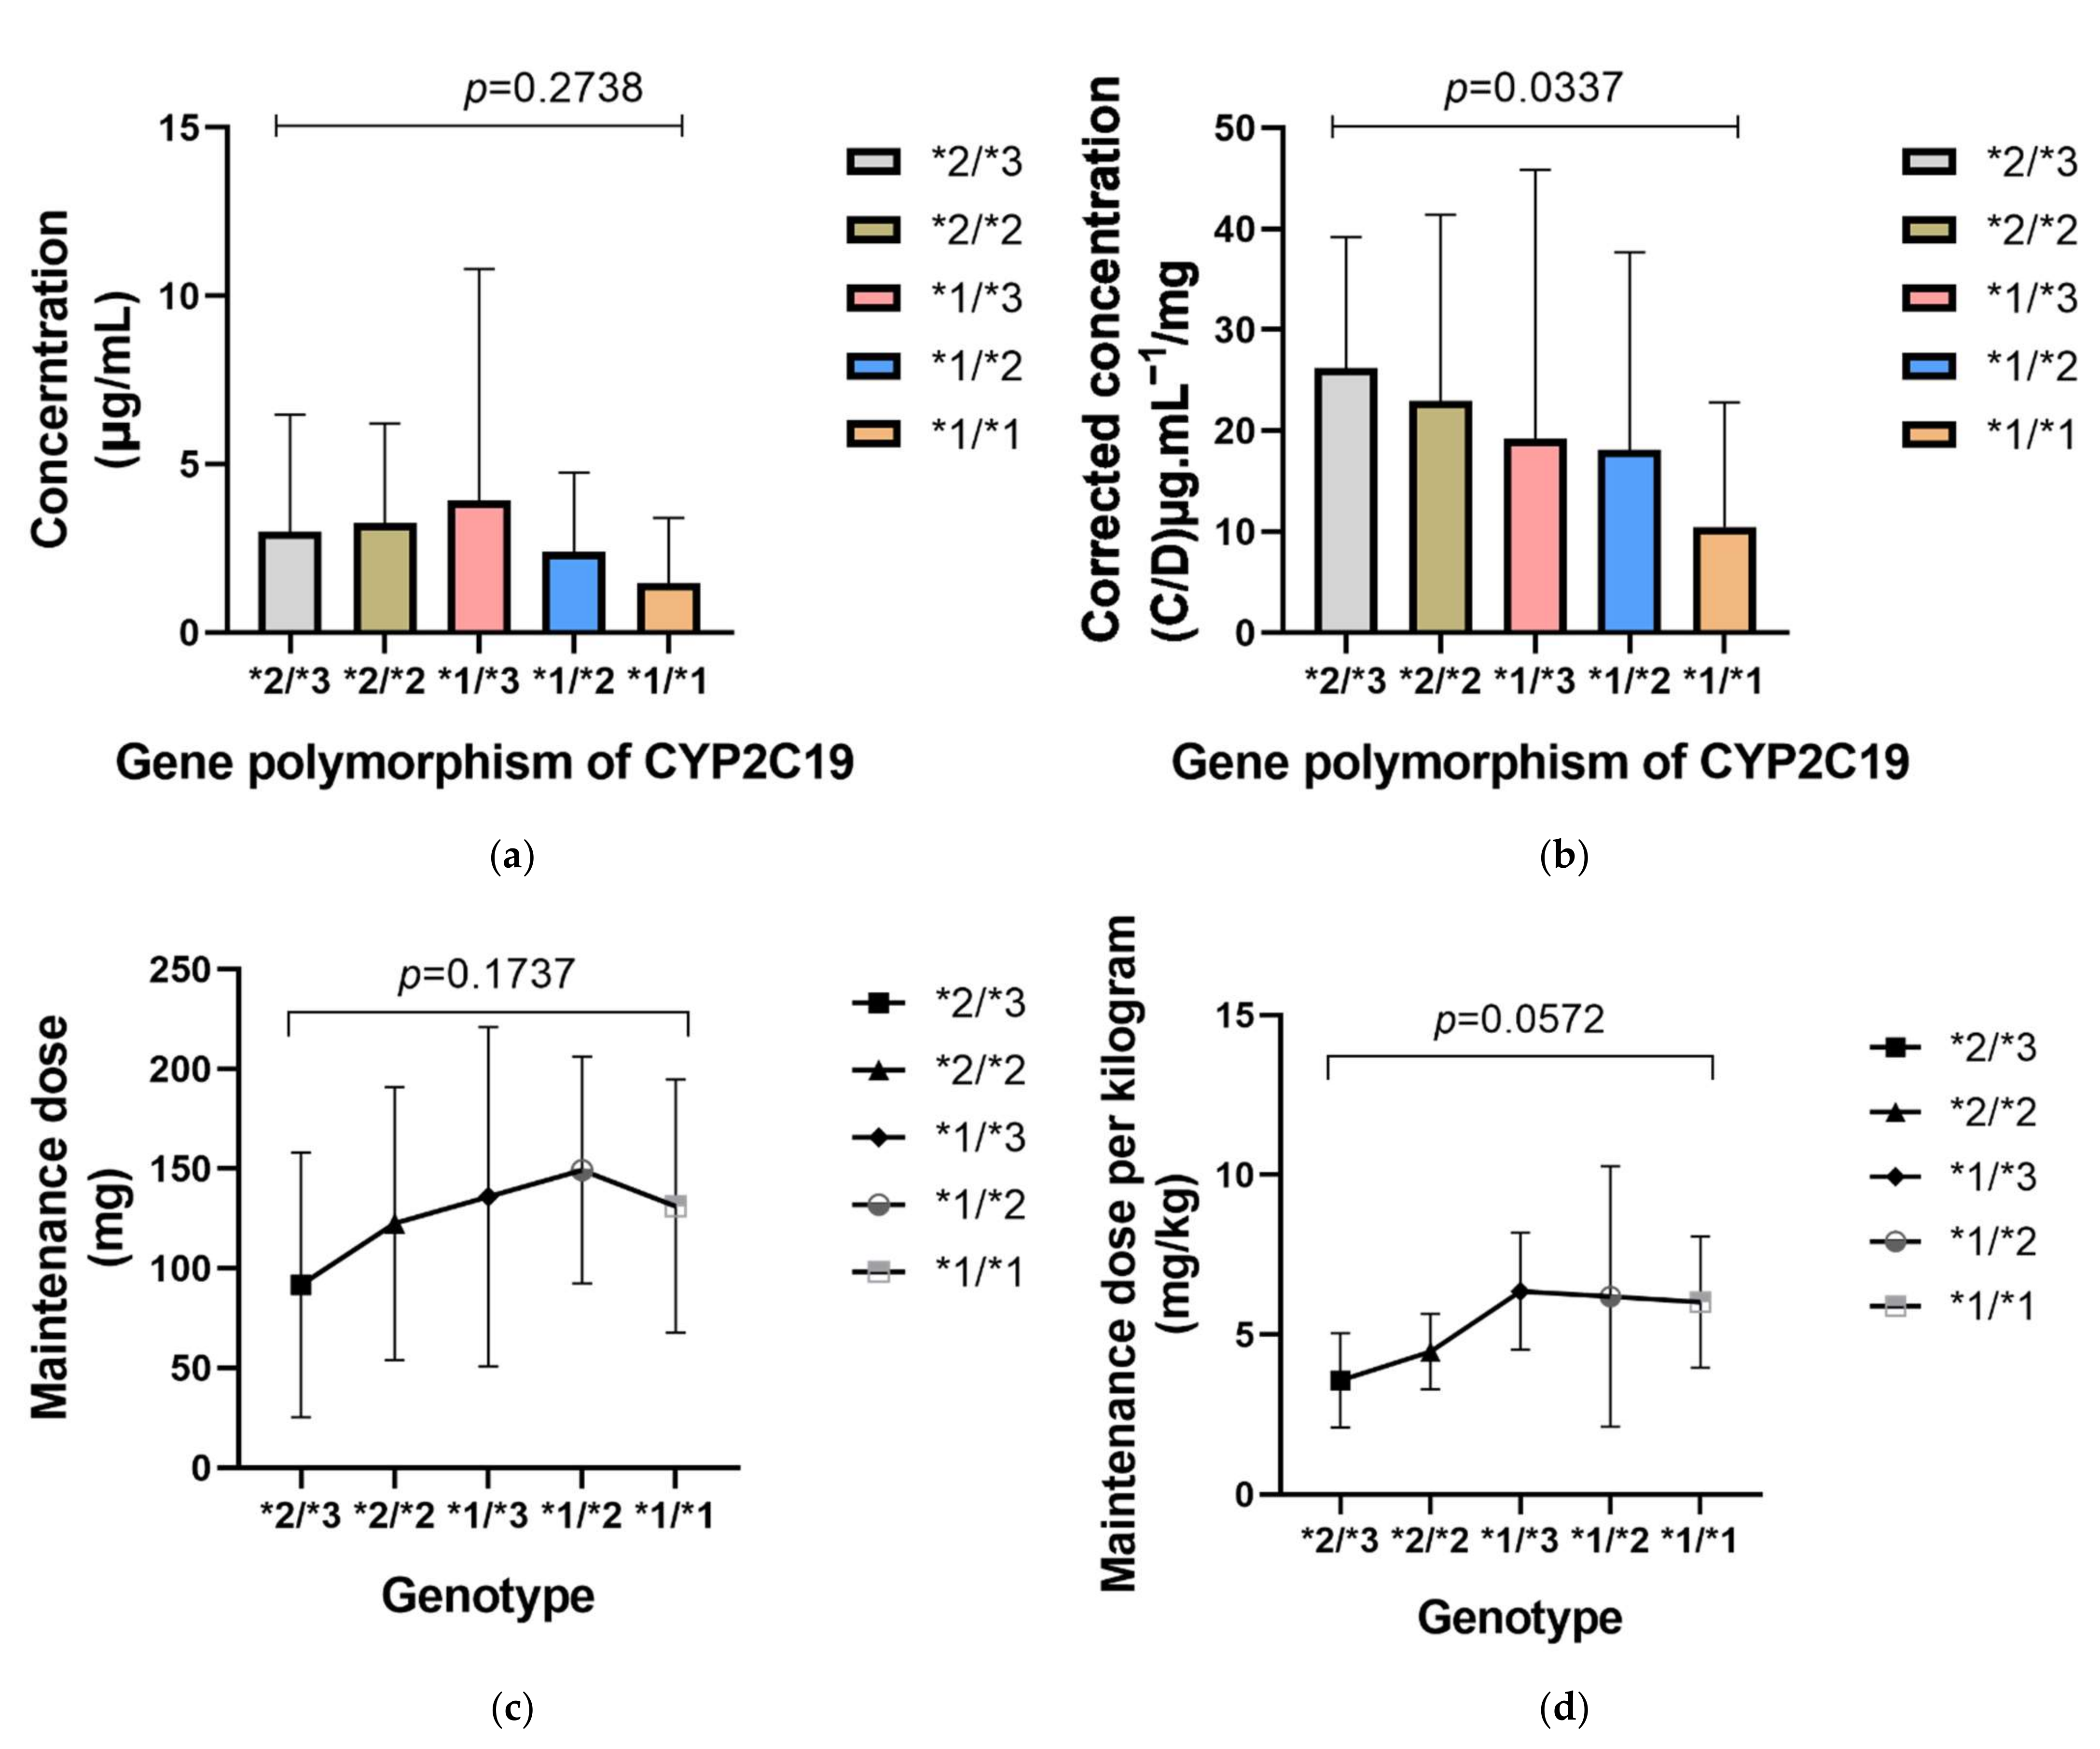
2.6. Effect of CYP2C19
3. Discussion
4. Materials and Methods
4.1. Patients
4.2. Data Collection
4.3. Voriconazole Administration and Plasma Trough Concentration Measurement
4.4. CPY2C19 Genotype and Phenotype Assignment
4.5. Outcome and Safety Assessment
4.6. Statistical Analysis
5. Conclusions
Author Contributions
Funding
Institutional Review Board Statement
Informed Consent Statement
Data Availability Statement
Acknowledgments
Conflicts of Interest
References
- Papachristou, S.; Iosifidis, E.; Roilides, E. Invasive Aspergillosis in Pediatric Leukemia Patients: Prevention and Treatment. J. Fungi 2019, 5, 14. [Google Scholar] [CrossRef] [PubMed] [Green Version]
- Lehrnbecher, T.; Robinson, P.; Fisher, B.; Alexander, S.; Ammann, R.A.; Beauchemin, M.; Carlesse, F.; Groll, A.H.; Haeusler, G.M.; Santolaya, M.; et al. Guideline for the Management of Fever and Neutropenia in Children With Cancer and Hematopoietic Stem-Cell Transplantation Recipients: 2017 Update. J. Clin. Oncol. 2017, 35, 2082–2094. [Google Scholar] [CrossRef] [PubMed] [Green Version]
- VFEND® (Voriconazole) Tablets, for Oral Use and for Intravenous Use. 2021. Available online: https://www.drugfuture.com/fda/drugview/021266 (accessed on 15 September 2021).
- Denning, D.W.; Ribaud, P.; Milpied, N.; Caillot, D.; Herbrecht, R.; Thiel, E.; Haas, A.; Ruhnke, M.; Lode, H. Efficacy and safety of voriconazole in the treatment of acute invasive aspergillosis. Clin. Infect. Dis. Off. Publ. Infect. Dis. Soc. Am. 2002, 34, 563–571. [Google Scholar] [CrossRef] [PubMed] [Green Version]
- Hoban, D.J.; Zhanel, G.G.; Karlowsky, J.A. In vitro susceptibilities of Candida and Cryptococcus neoformans isolates from blood cultures of neutropenic patients. Antimicrob. Agents Chemother. 1999, 43, 1463–1464. [Google Scholar] [CrossRef] [PubMed] [Green Version]
- Tissot, F.; Agrawal, S.; Pagano, L.; Petrikkos, G.; Groll, A.H.; Skiada, A.; Lass-Flörl, C.; Calandra, T.; Viscoli, C.; Herbrecht, R. ECIL-6 guidelines for the treatment of invasive candidiasis, aspergillosis and mucormycosis in leukemia and hematopoietic stem cell transplant patients. Haematologica 2017, 102, 433–444. [Google Scholar] [CrossRef] [PubMed] [Green Version]
- Hohmann, N.; Kocheise, F.; Carls, A.; Burhenne, J.; Weiss, J.; Haefeli, W.E.; Mikus, G. Dose-Dependent Bioavailability and CYP3A Inhibition Contribute to Non-Linear Pharmacokinetics of Voriconazole. Clin. Pharmacokinet. 2016, 55, 1535–1545. [Google Scholar] [CrossRef]
- Kadam, R.S.; Van Den Anker, J.N. Pediatric Clinical Pharmacology of Voriconazole: Role of Pharmacokinetic/Pharmacodynamic Modeling in Pharmacotherapy. Clin. Pharmacokinet. 2016, 55, 1031–1043. [Google Scholar] [CrossRef]
- Bartelink, I.H.; Wolfs, T.; Jonker, M.; de Waal, M.; Egberts, T.C.; Ververs, T.T.; Boelens, J.J.; Bierings, M. Highly variable plasma concentrations of voriconazole in pediatric hematopoietic stem cell transplantation patients. Antimicrob. Agents Chemother. 2013, 57, 235–240. [Google Scholar] [CrossRef] [Green Version]
- Neely, M.; Rushing, T.; Kovacs, A.; Jelliffe, R.; Hoffman, J. Voriconazole pharmacokinetics and pharmacodynamics in children. Clin. Infect. Dis. Off. Publ. Infect. Dis. Soc. Am. 2010, 50, 27–36. [Google Scholar] [CrossRef] [Green Version]
- Friberg, L.E.; Ravva, P.; Karlsson, M.O.; Liu, P. Integrated population pharmacokinetic analysis of voriconazole in children, adolescents, and adults. Antimicrob. Agents Chemother. 2012, 56, 3032–3042. [Google Scholar] [CrossRef] [Green Version]
- Walsh, T.J.; Karlsson, M.O.; Driscoll, T.; Arguedas, A.G.; Adamson, P.; Saez-Llorens, X.; Vora, A.J.; Arrieta, A.C.; Blumer, J.; Lutsar, I.; et al. Pharmacokinetics and safety of intravenous voriconazole in children after single- or multiple-dose administration. Antimicrob. Agents Chemother. 2004, 48, 2166–2172. [Google Scholar] [CrossRef] [Green Version]
- Takahashi, T.; Mohamud, M.A.; Smith, A.R.; Jacobson, P.A.; Jaber, M.M.; Alharbi, A.F.; Fisher, J.; Kirstein, M.N. CYP2C19 Phenotype and Body Weight-Guided Voriconazole Initial Dose in Infants and Children after Hematopoietic Cell Transplantation. Antimicrob. Agents Chemother. 2021, 65, e0062321. [Google Scholar] [CrossRef]
- Martin, J.M.; Macias-Parra, M.; Mudry, P.; Conte, U.; Yan, J.L.; Liu, P.; Capparella, M.R.; Aram, J.A. Safety, Efficacy, and Exposure-Response of Voriconazole in Pediatric Patients With Invasive Aspergillosis, Invasive Candidiasis or Esophageal Candidiasis. Pediatric Infect. Dis. J. 2017, 36, e1–e13. [Google Scholar] [CrossRef] [Green Version]
- Kang, S.; Yee, J.; Kim, J.Y.; Han, H.W.; Kang, S.O.; Lee, K.E.; Gwak, H.S. Factors Associated With Voriconazole Concentration in Pediatric Patients. Ther. Drug Monit. 2020, 42, 866–871. [Google Scholar] [CrossRef]
- Geist, M.J.; Egerer, G.; Burhenne, J.; Riedel, K.D.; Weiss, J.; Mikus, G. Steady-state pharmacokinetics and metabolism of voriconazole in patients. J. Antimicrob. Chemother. 2013, 68, 2592–2599. [Google Scholar] [CrossRef] [PubMed] [Green Version]
- Moriyama, B.; Obeng, A.O.; Barbarino, J.; Penzak, S.R.; Henning, S.A.; Scott, S.A.; Agúndez, J.; Wingard, J.R.; McLeod, H.L.; Klein, T.E.; et al. Clinical Pharmacogenetics Implementation Consortium (CPIC) Guidelines for CYP2C19 and Voriconazole Therapy. Clin. Pharmacol. Ther. 2017, 102, 45–51. [Google Scholar] [CrossRef] [Green Version]
- Chen, K.; Zhang, X.; Ke, X.; Du, G.; Yang, K.; Zhai, S. Individualized Medication of Voriconazole: A Practice Guideline of the Division of Therapeutic Drug Monitoring, Chinese Pharmacological Society. Ther. Drug Monit. 2018, 40, 663–674. [Google Scholar] [CrossRef] [PubMed]
- Groll, A.H.; Castagnola, E.; Cesaro, S.; Dalle, J.H.; Engelhard, D.; Hope, W.; Roilides, E.; Styczynski, J.; Warris, A.; Lehrnbecher, T. Fourth European Conference on Infections in Leukaemia (ECIL-4): Guidelines for diagnosis, prevention, and treatment of invasive fungal diseases in paediatric patients with cancer or allogeneic haemopoietic stem-cell transplantation. Lancet. Oncol. 2014, 15, e327–e340. [Google Scholar] [CrossRef]
- Liu, L.; Zhou, X.; Wu, T.; Jiang, H.; Yang, S.; Zhang, Y. Dose optimisation of voriconazole with therapeutic drug monitoring in children: A single-centre experience in China. Int. J. Antimicrob. Agents 2017, 49, 483–487. [Google Scholar] [CrossRef]
- Karlsson, M.O.; Lutsar, I.; Milligan, P.A. Population pharmacokinetic analysis of voriconazole plasma concentration data from pediatric studies. Antimicrob. Agents Chemother. 2009, 53, 935–944. [Google Scholar] [CrossRef] [Green Version]
- Walsh, T.J.; Driscoll, T.; Milligan, P.A.; Wood, N.D.; Schlamm, H.; Groll, A.H.; Jafri, H.; Arrieta, A.C.; Klein, N.J.; Lutsar, I. Pharmacokinetics, safety, and tolerability of voriconazole in immunocompromised children. Antimicrob. Agents Chemother. 2010, 54, 4116–4123. [Google Scholar] [CrossRef] [PubMed] [Green Version]
- Michael, C.; Bierbach, U.; Frenzel, K.; Lange, T.; Basara, N.; Niederwieser, D.; Mauz-Körholz, C.; Preiss, R. Voriconazole pharmacokinetics and safety in immunocompromised children compared to adult patients. Antimicrob. Agents Chemother. 2010, 54, 3225–3232. [Google Scholar] [CrossRef] [Green Version]
- Hu, L.; Dai, T.T.; Zou, L.; Li, T.M.; Ding, X.S.; Yin, T. Therapeutic Drug Monitoring of Voriconazole in Children from a Tertiary Care Center in China. Antimicrob. Agents Chemother. 2018, 62, e00955-18. [Google Scholar] [CrossRef] [Green Version]
- Boast, A.; Curtis, N.; Cranswick, N.; Gwee, A. Voriconazole dosing and therapeutic drug monitoring in children: Experience from a paediatric tertiary care centre. J. Antimicrob. Chemother. 2016, 71, 2031–2036. [Google Scholar] [CrossRef] [Green Version]
- Benitez, L.L.; Carver, P.L. Adverse Effects Associated with Long-Term Administration of Azole Antifungal Agents. Drugs 2019, 79, 833–853. [Google Scholar] [CrossRef] [PubMed]
- Boyd, A.E.; Modi, S.; Howard, S.J.; Moore, C.B.; Keevil, B.G.; Denning, D.W. Adverse reactions to voriconazole. Clin. Infect. Dis. Off. Publ. Infect. Dis. Soc. Am. 2004, 39, 1241–1244. [Google Scholar] [CrossRef] [PubMed]
- Chen, L.; Qin, S.; Xie, J.; Tang, J.; Yang, L.; Shen, W.; Zhao, X.; Du, J.; He, G.; Feng, G.; et al. Genetic polymorphism analysis of CYP2C19 in Chinese Han populations from different geographic areas of mainland China. Pharmacogenomics 2008, 9, 691–702. [Google Scholar] [CrossRef] [PubMed]
- Yu, G.; Li, G.F.; Markowitz, J.S. Atomoxetine: A Review of Its Pharmacokinetics and Pharmacogenomics Relative to Drug Disposition. J. Child Adolesc. Psychopharmacol. 2016, 26, 314–326. [Google Scholar] [CrossRef] [Green Version]
- Li-Wan-Po, A.; Girard, T.; Farndon, P.; Cooley, C.; Lithgow, J. Pharmacogenetics of CYP2C19: Functional and clinical implications of a new variant CYP2C19*17. Br. J. Clin. Pharmacol. 2010, 69, 222–230. [Google Scholar] [CrossRef] [Green Version]
- Amsden, J.R.; Gubbins, P.O. Pharmacogenomics of triazole antifungal agents: Implications for safety, tolerability and efficacy. Expert Opin. Drug Metab. Toxicol. 2017, 13, 1135–1146. [Google Scholar] [CrossRef]
- Allegra, S.; Fatiguso, G.; Francia, S.; Pirro, E.; Carcieri, C.; Cusato, J.; Nicolò, A.; Avataneo, V.; Perri, G.D.; D'Avolio, A. Pharmacogenetic of voriconazole antifungal agent in pediatric patients. Pharmacogenomics 2018, 19, 913–925. [Google Scholar] [CrossRef]
- Hicks, J.K.; Crews, K.R.; Flynn, P.; Haidar, C.E.; Daniels, C.C.; Yang, W.; Panetta, J.C.; Pei, D.; Scott, J.R.; Molinelli, A.R.; et al. Voriconazole plasma concentrations in immunocompromised pediatric patients vary by CYP2C19 diplotypes. Pharmacogenomics 2014, 15, 1065–1078. [Google Scholar] [CrossRef] [Green Version]
- Dolton, M.J.; Ray, J.E.; Chen, S.C.; Ng, K.; Pont, L.G.; McLachlan, A.J. Multicenter study of voriconazole pharmacokinetics and therapeutic drug monitoring. Antimicrob. Agents Chemother. 2012, 56, 4793–4799. [Google Scholar] [CrossRef] [PubMed] [Green Version]
- Tian, X.; Zhang, C.; Qin, Z.; Wang, D.; Yang, J.; Zhang, X. Impact of CYP2C19 Phenotype and Drug-Drug Interactions on Voriconazole Concentration in Pediatric Patients. Antimicrob. Agents Chemother. 2021, 65, e0020721. [Google Scholar] [CrossRef]
- Blanco-Dorado, S.; Maroñas, O.; Latorre-Pellicer, A.; Rodríguez Jato, M.T.; López-Vizcaíno, A.; Gómez Márquez, A.; Bardán García, B.; Belles Medall, D.; Barbeito Castiñeiras, G.; Pérez Del Molino Bernal, M.L.; et al. Impact of CYP2C19 Genotype and Drug Interactions on Voriconazole Plasma Concentrations: A Spain Pharmacogenetic-Pharmacokinetic Prospective Multicenter Study. Pharmacotherapy 2020, 40, 17–25. [Google Scholar] [CrossRef]
- Hashemizadeh, Z.; Badiee, P.; Malekhoseini, S.A.; Raeisi Shahraki, H.; Geramizadeh, B.; Montaseri, H. Observational Study of Associations between Voriconazole Therapeutic Drug Monitoring, Toxicity, and Outcome in Liver Transplant Patients. Antimicrob. Agents Chemother. 2017, 61, e01211.17. [Google Scholar] [CrossRef] [Green Version]
- Zhao, Y.C.; Lin, X.B.; Zhang, B.K.; Xiao, Y.W.; Xu, P.; Wang, F.; Xiang, D.X.; Xie, X.B.; Peng, F.H.; Yan, M. Predictors of Adverse Events and Determinants of the Voriconazole Trough Concentration in Kidney Transplantation Recipients. Clin. Transl. Sci. 2021, 14, 702–711. [Google Scholar] [CrossRef] [PubMed]
- Dote, S.; Sawai, M.; Nozaki, A.; Naruhashi, K.; Kobayashi, Y.; Nakanishi, H. A retrospective analysis of patient-specific factors on voriconazole clearance. J. Pharm. Health Care Sci. 2016, 2, 10. [Google Scholar] [CrossRef] [PubMed] [Green Version]
- Wei, X.; Zhao, M.; Fu, P.; Xiao, X. Risk factors associated with insufficient and potentially toxic voriconazole plasma concentrations: An observational study. J. Chemother. 2019, 31, 401–407. [Google Scholar] [CrossRef]
- Mafuru, M.; Wu, S.; He, S.; Lu, X.; Huang, J.; Jiang, H. The Influence of Proinflammatory Cytokines on Voriconazole Trough Concentration in Patients With Different Forms of Hematologic Disorders. J. Clin. Pharmacol. 2019, 59, 1340–1350. [Google Scholar] [CrossRef]
- Takahashi, T.; Smith, A.R.; Jacobson, P.A.; Fisher, J.; Rubin, N.T.; Kirstein, M.N. Impact of Obesity on Voriconazole Pharmacokinetics among Pediatric Hematopoietic Cell Transplant Recipients. Antimicrob. Agents Chemother. 2020, 64, e00653-20. [Google Scholar] [CrossRef]
- Allegra, S.; Fatiguso, G.; De Francia, S.; Favata, F.; Pirro, E.; Carcieri, C.; De Nicolò, A.; Cusato, J.; Di Perri, G.; D’Avolio, A. Therapeutic drug monitoring of voriconazole for treatment and prophylaxis of invasive fungal infection in children. Br. J. Clin. Pharmacol. 2018, 84, 197–203. [Google Scholar] [CrossRef] [PubMed] [Green Version]
- Theuretzbacher, U.; Ihle, F.; Derendorf, H. Pharmacokinetic/pharmacodynamic profile of voriconazole. Clin. Pharmacokinet. 2006, 45, 649–663. [Google Scholar] [CrossRef] [PubMed]
- Hope, W.W. Population pharmacokinetics of voriconazole in adults. Antimicrob. Agents Chemother. 2012, 56, 526–531. [Google Scholar] [CrossRef] [PubMed] [Green Version]
- Zhao, Y.; Hou, J.; Xiao, Y.; Wang, F.; Zhang, B.; Zhang, M.; Jiang, Y.; Li, J.; Gong, G.; Xiang, D.; et al. Predictors of Voriconazole Trough Concentrations in Patients with Child-Pugh Class C Cirrhosis: A Prospective Study. Antibiotics 2021, 10, 1130. [Google Scholar] [CrossRef] [PubMed]


| Characteristics | ≤2 y | 2 y–6 y | 6 y–12 y | 12 y–18 y | p |
|---|---|---|---|---|---|
| Sex(male) | 8 (53.3%) | 12 (42.9%) | 13 (61.9%) | 16 (53.3%) | 0.616 |
| Weight(kg) | 11.5 (9.20–14.0) | 16.0 (14.5–18.0) | 30 (23.5–35.8) | 54.7 (43.6–61.8) | <0.0001 * |
| IFI diagnosis | 15 (16.0%) | 28 (29.8%) | 21 (22.3%) | 30 (31.9%) | |
| Proven | 2 (13.3%) | 5 (17.9%) | 2 (9.50%) | 6 (20.0%) | 0.3535 |
| Probable | 8 (53.3%) | 8 (28.6%) | 9 (42.9%) | 6 (20.0%) | |
| Possible | 5 (33.3%) | 15 (53.6%) | 10 (47.6%) | 18 (60.0%) | |
| Infection site | |||||
| Pulmonary infection | 13 (86.7%) | 11 (39.3%) | 9 (42.9%) | 21 (70.0%) | 0.1600 |
| Bloodstream infection | 1 (6.67%) | 7 (25.0%) | 5 (23.8%) | 3 (10.0%) | |
| Perineum infection | 0 (0.00%) | 1 (3.57%) | 0 (0.00%) | 0 (0.00%) | |
| Oral infection | 0 (0.00%) | 1 (3.57%) | 0 (0.00%) | 0 (0.00%) | |
| Unknown | 1 (6.67%) | 8 (28.6%) | 7 (33.3%) | 6 (20.0%) | |
| Treatment indication | |||||
| Therapeutic | 3 (20.0%) | 6 (21.4%) | 2 (9.5%) | 8 (26.7%) | 0.6782 |
| Empirical | 6 (40.0%) | 8 (28.6%) | 7 (33.3%) | 6 (20.0%) | |
| Prophylactic | 6 (40.0%) | 14 (50.0%) | 12 (57.1%) | 16 (53.3%) | |
| Drug combination | |||||
| PPIs 2 | 3 (20.0%) | 12 (42.9%) | 8 (38.1%) | 18 (60.0%) | 0.0737 |
| Glucocorticoids | 5 (33.3%) | 5 (17.9%) | 6 (28.6%) | 11 (36.7%) | 0.3692 |
| Immunosuppressive drugs | 0 (0.00%) | 3 (10.7%) | 0 (0.00%) | 6 (80.0%) | 0.0546 |
| CYP2C19 1 Genotype | |||||
| 1/*1 | 1 (6.67%) | 12 (42.9%) | 4 (19.1%) | 2 (6.7%) | 0.0004 * |
| 1/*2 | 6 (40.0%) | 5 (17.9%) | 7 (33.3%) | 10 (33.3%) | |
| 1/*3 | 3 (20.0%) | 0 (0.00%) | 1 (4.76%) | 0 (0.00%) | |
| 2/*2 | 1 (6.67%) | 0 (0.00%) | 1 (4.76%) | 1 (3.33%) | |
| 2/*3 | 0 (0.00%) | 0 (0.00%) | 3 (14.29%) | 0 (0.00%) | |
| Unknown | 4 (26.7%) | 11 (39.3%) | 5 (23.8%) | 17 (56.7%) | |
| Alanine transaminase | 35.86 ± 24.21 | 35.45 (12.15–60.35) | 33.30 (19.15–49.90) | 16.70 (8.73–32.08) | 0.0829 |
| Aspartate aminotransferase | 31.80 (27.80–49.40) | 31.25 (17.78–43.93) | 27.70 (17.45–40.00) | 15.00 (11.48–33.90) | 0.0033 * |
| Total bilirubin | 8.20 (5.70–10.00) | 9.75 (6.25–19.18) | 13.77 ± 7.77 | 10.85 (7.95–15.50) | 0.1392 |
| Direct bilirubin | 3.00 (2.10–3.90) | 3.85 (2.55–7.63) | 4.80 (3.10–7.20) | 4.40 (3.13–6.65) | 0.0718 |
| Albumin | 35.29 ± 4.78 | 33.22 ± 5.45 | 33.41 ± 3.72 | 33.40 (29.65–37.25) | 0.5002 |
| Blood Urea Nitrogen | 2.52 (1.72–3.79) | 4.02 (2.92–5.86) | 4.67 (2.56–7.11) | 5.59 (4.3–7.50) | 0.0032 * |
| Creatinine | 18.44 ± 4.19 | 20.00 (18.15–27.20) | 33.40 (25.45–36.95) | 58.05 (43.43–95.38) | <0.0001 * |
| Uric Acid | 237.1 ± 100.5 | 228.0 ± 104.5 | 206.0 (162.8–295.4) | 229.4 (161.5–311.0) | 0.9342 |
| Characteristics | ≤2 y | 2 y–6 y | 6 y–12 y | 12 y–18 y | p |
|---|---|---|---|---|---|
| Administration route (Oral) | 12 (85.7%) | 27 (96.4%) | 20 (95.2%) | 24 (80.0%) | 0.1615 |
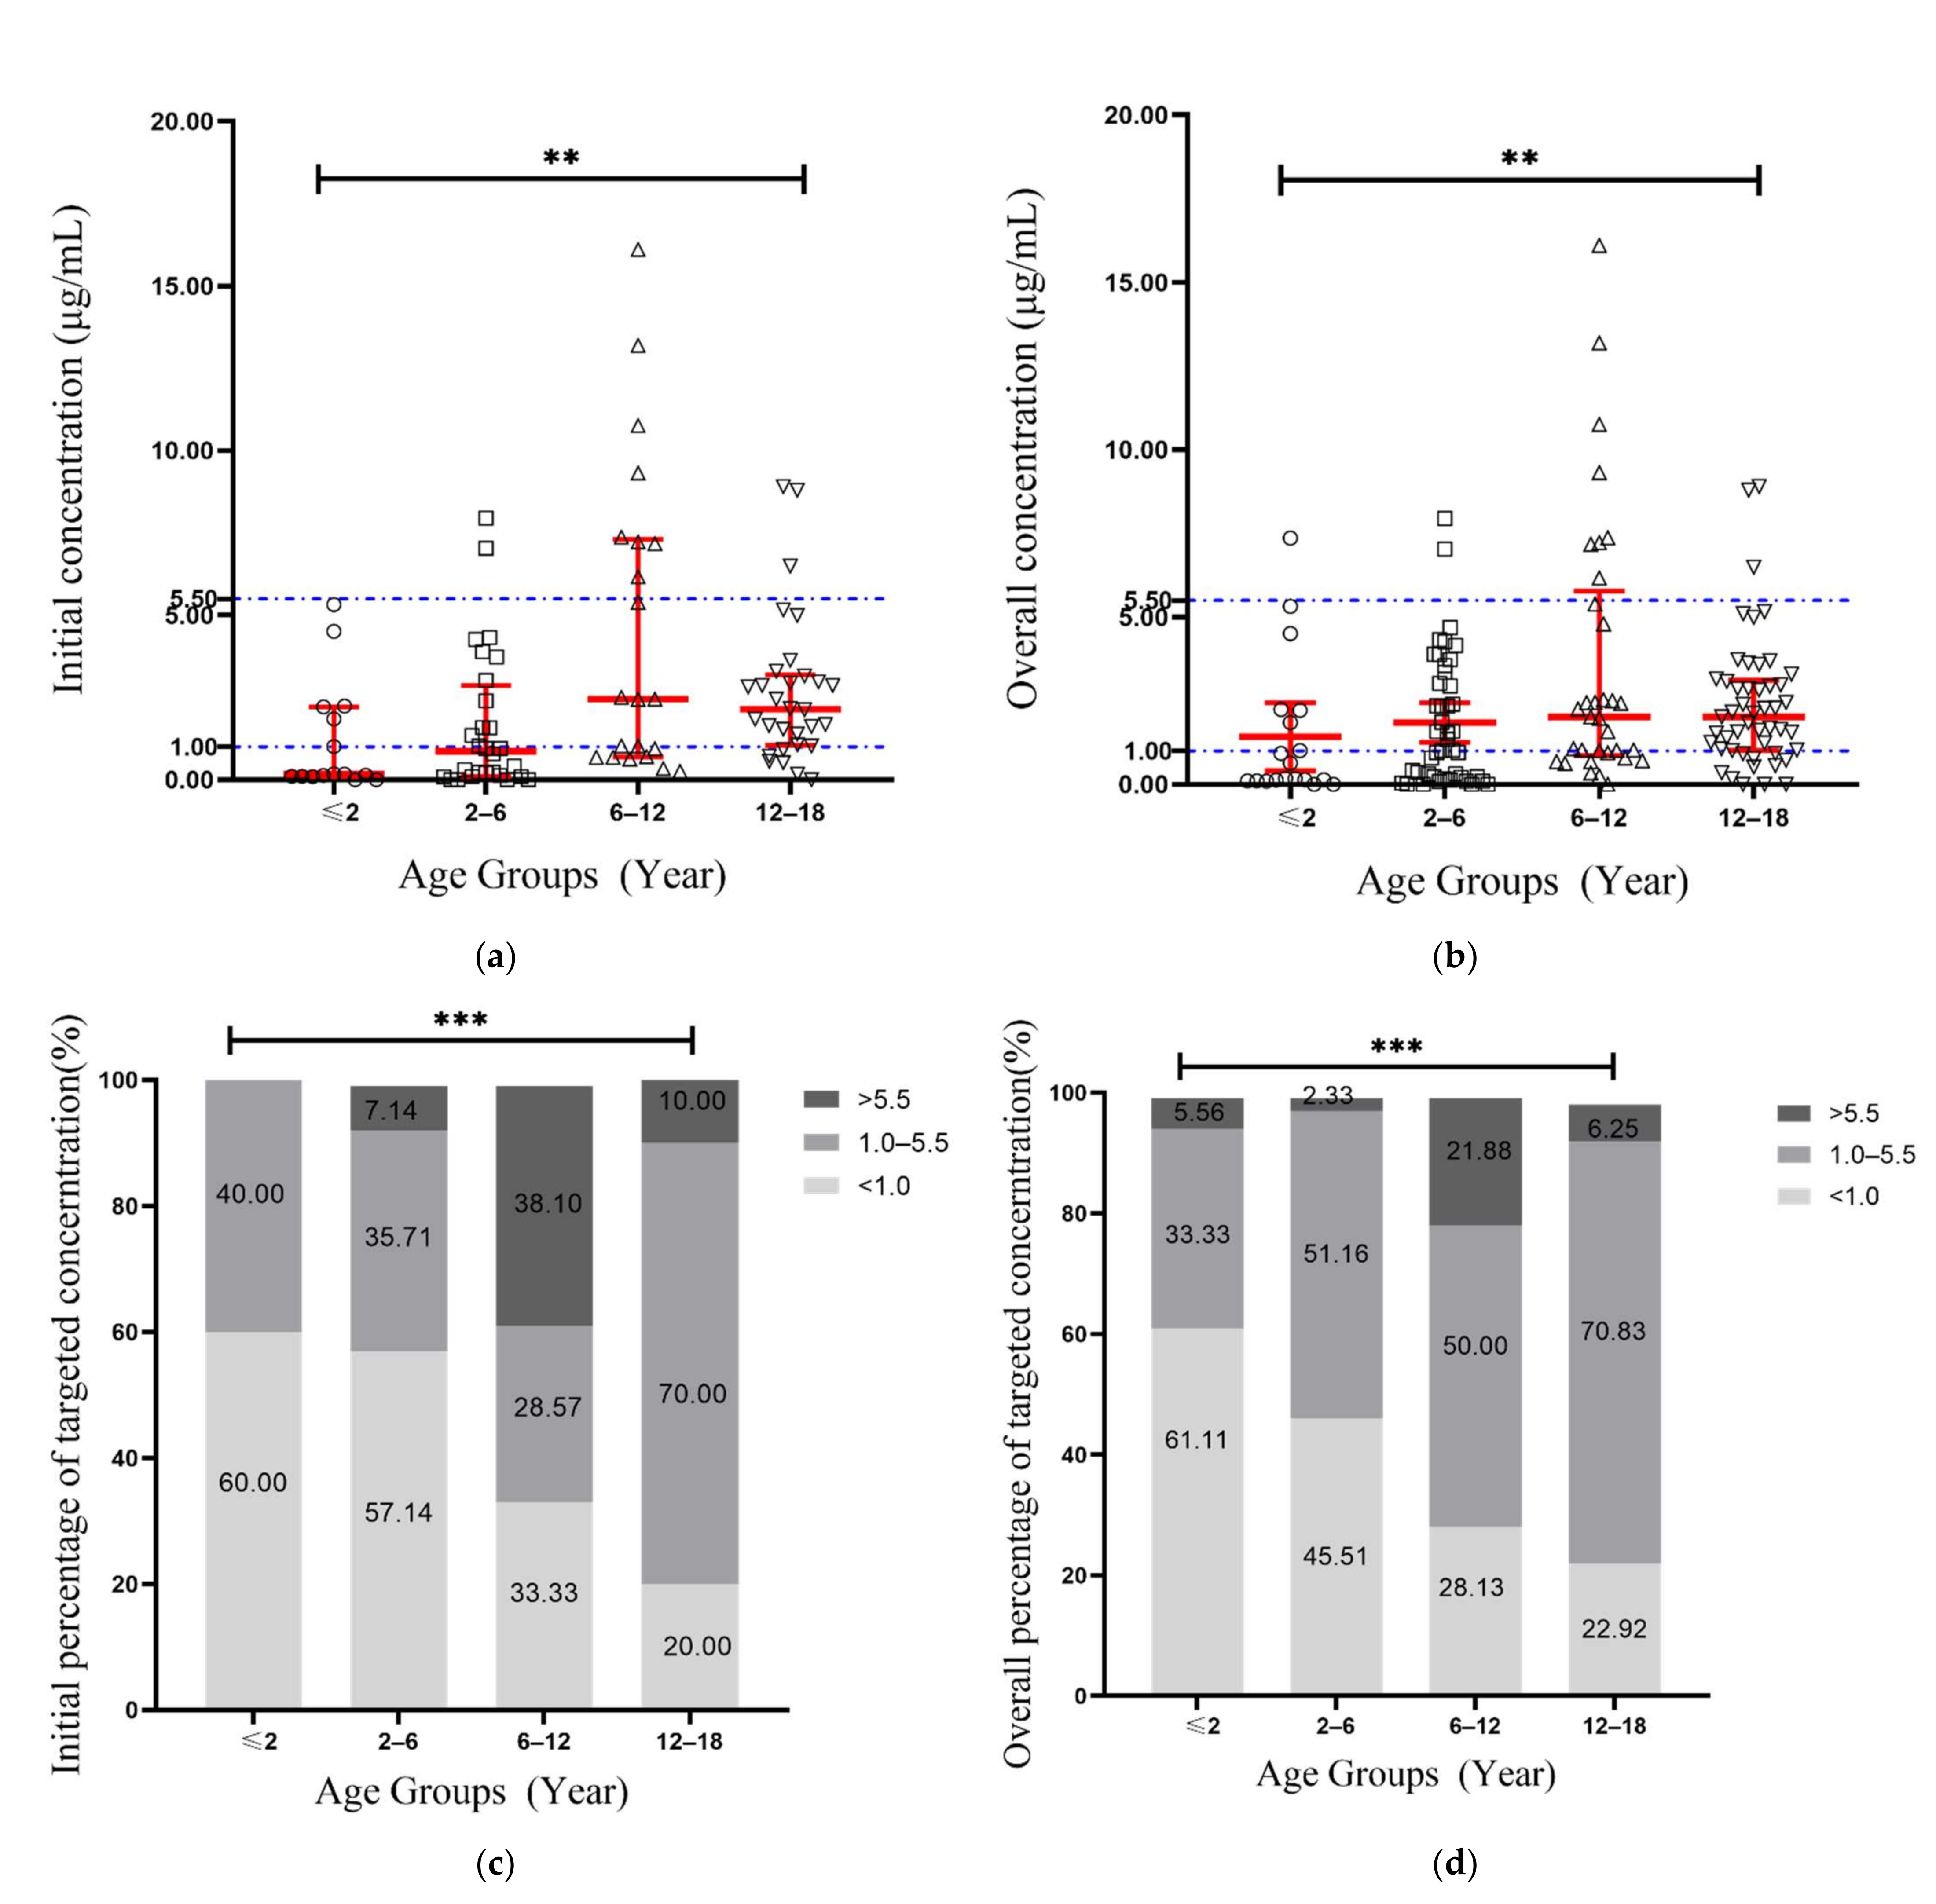
| Initial Ctrough (µg/mL) | 0.17 (0.11–2.1) | 0.87 (0.11–2.86) | 2.45 (0.69–7.30) | 2.14 (1.05–3.19) | 0.0014 * |
| 9 (60.0%) | 16 (57.1%) | 7 (33.3%) | 6 (20.0%) | 0.004 * | |
| 6 (40.0%) | 10 (35.7%) | 6 (28.6%) | 21 (70.0%) | ||
| 0 (0.00%) | 2 (7.14%) | 8 (38.1%) | 3 (10.0%) | ||
| VRC Ctrough (µg/mL) | 0.18 (0.11–2.21) | 1.19 (0.22–3.27) | 2.02 (0.86–5.78) | 2.02 (1.02–3.12) | 0.0096 |
| Dose adjustment | 4 (26.7%) | 7 (25.0%) | 8 (38.1%) | 2 (6.67%) | 0.0568 |
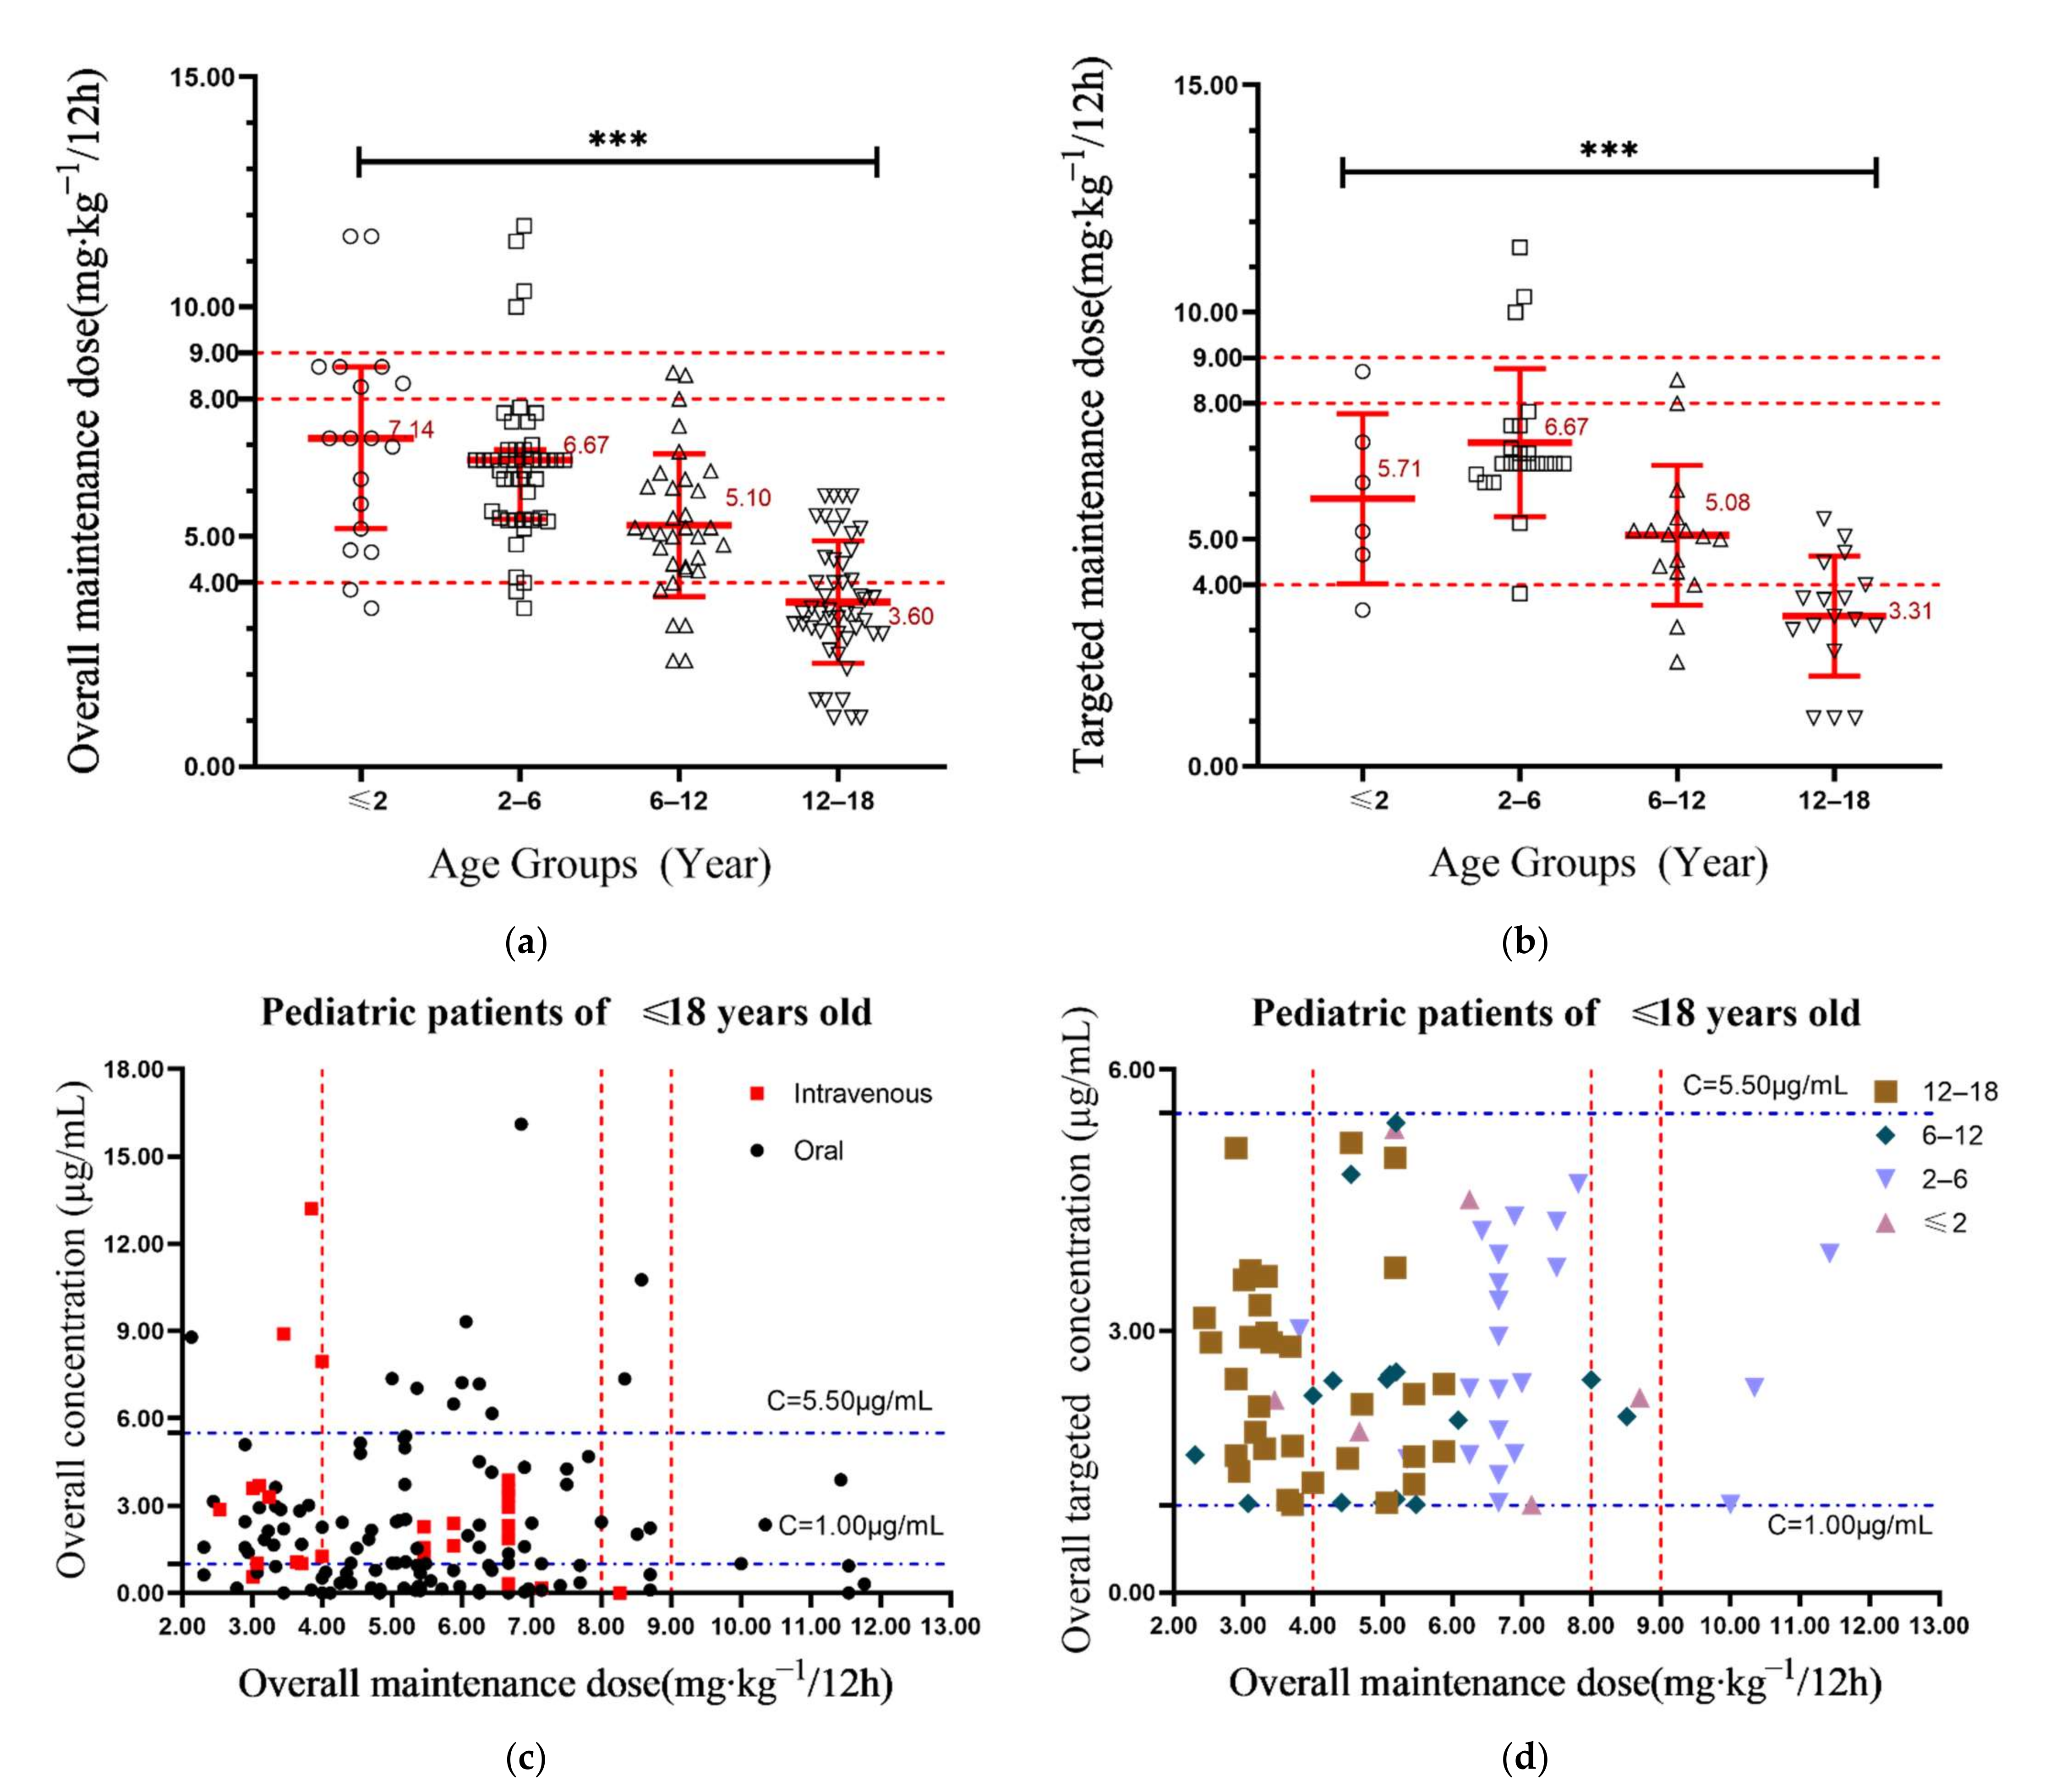
| Initial dose () | 7.10 (4.70–8.70) | 6.30 (5.40–6.90) | 5.20 (4.35–6.40) | 3.35 (3.08–4.13) | <0.0001 * |
| Overall dose () | 7.14 (5.17–8.70) | 6.67 (5.38–6.90) | 5.10 (4.29–6.07) | 3.60 (2.92–4.62) | <0.0001 * |
| Target initial dose () | 5.75 (4.38–7.50) | 6.90 (6.60–7.50) | 5.10 (4.85–5.90) | 3.30 (3.15–4.5) | <0.0001 * |
| Target overall dose () | 5.71 (4.36–7.53) | 6.67 (6.61–7.50) | 5.09 (4.32–5.41) | 3.31 (2.77–4.25) | <0.0001 * |
| Pairwise Comparison | Adjusted p Value | |||
|---|---|---|---|---|
| Initial Concentration (µg/mL) | Overall Concentration (µg/mL) | Overall Maintenance Dose(mg/kg) | Targeted Maintenance Dose (mg/kg) | |
| ≤2 y vs. 2 y–6 y | 1.00 | 1.00 | 1.00 | 1.00 |
| ≤2 y vs. 6 y–12 y | 0.012 * | 0.023 * | 0.023 * | 1.00 |
| ≤2 y vs. 12 y–18 y | 0.035 * | 0.042 * | <0.001 * | 0.047 * |
| 2 y–6 y vs. 6 y–12 y | 0.028 * | 0.258 | 0.024 * | 0.011 * |
| 2 y–6 y vs. 12 y–18 y | 0.087 | 0.489 | <0.001 * | <0.001 * |
| 6 y–12 y vs. 12 y–18 y | 1.00 | 1.00 | 0.001 * | 0.094 |
| Demographic Variable | Coefficient Index | p-Value |
|---|---|---|
| Age | 0.263 * | 0.005 |
| Weight (kg) | 0.288 * | 0.001 |
| BMI | 0.179 | 0.056 |
| Height | 0.277 * | 0.003 |
| First maintenance dose | −0.062 | 0.770 |
| Dose before sampling | 0.266 * | <0.001 |
| Physiological and biochemical indexes | ||
| Aspartate aminotransferase | −0.207 * | 0.017 |
| Alanine transaminase | 0.071 | 0.421 |
| Total Bilirubin | 0.207 * | 0.017 |
| Direct Bilirubin | 0.175 * | 0.045 |
| Albumin | −0.199 * | 0.022 |
| Urea nitrogen | 0.216 * | 0.013 |
| Creatinine | 0.267 * | 0.002 |
| Administration route | 0.046 | 0.585 |
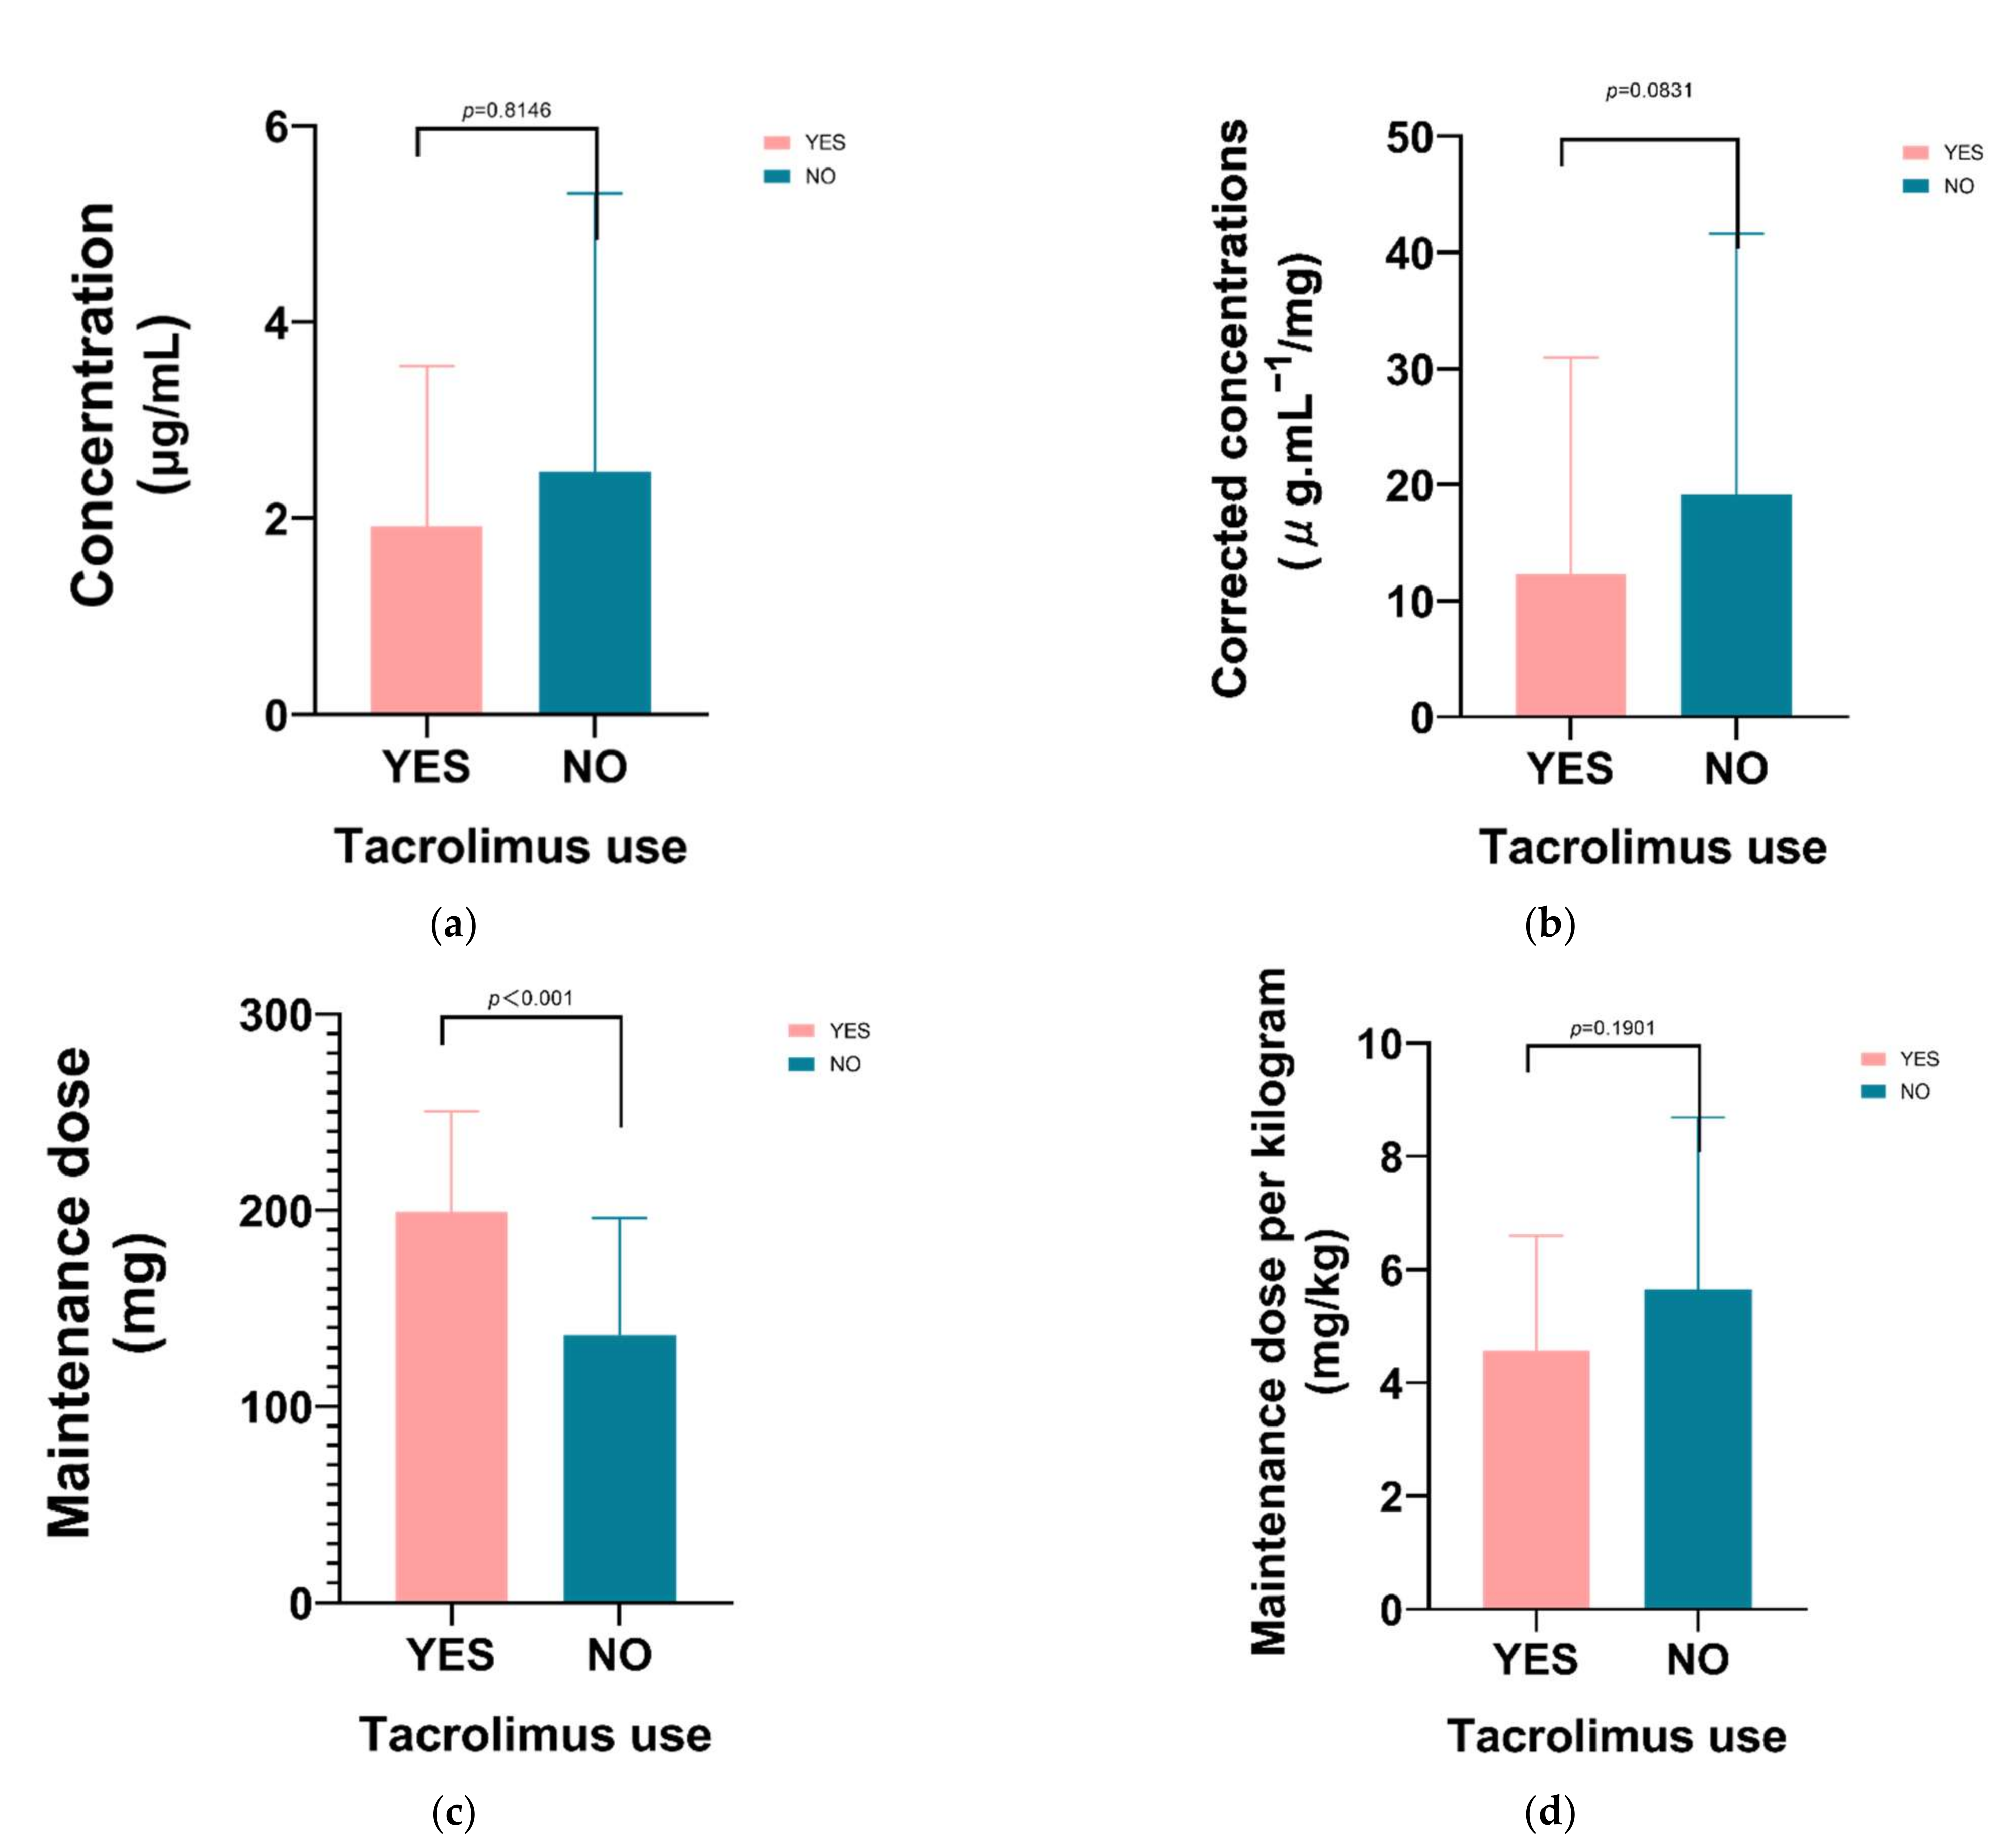
| Proton pump inhibitors use | 0.136 | 0.128 |
| Immunosuppressants use | −0.020 | 0.813 |
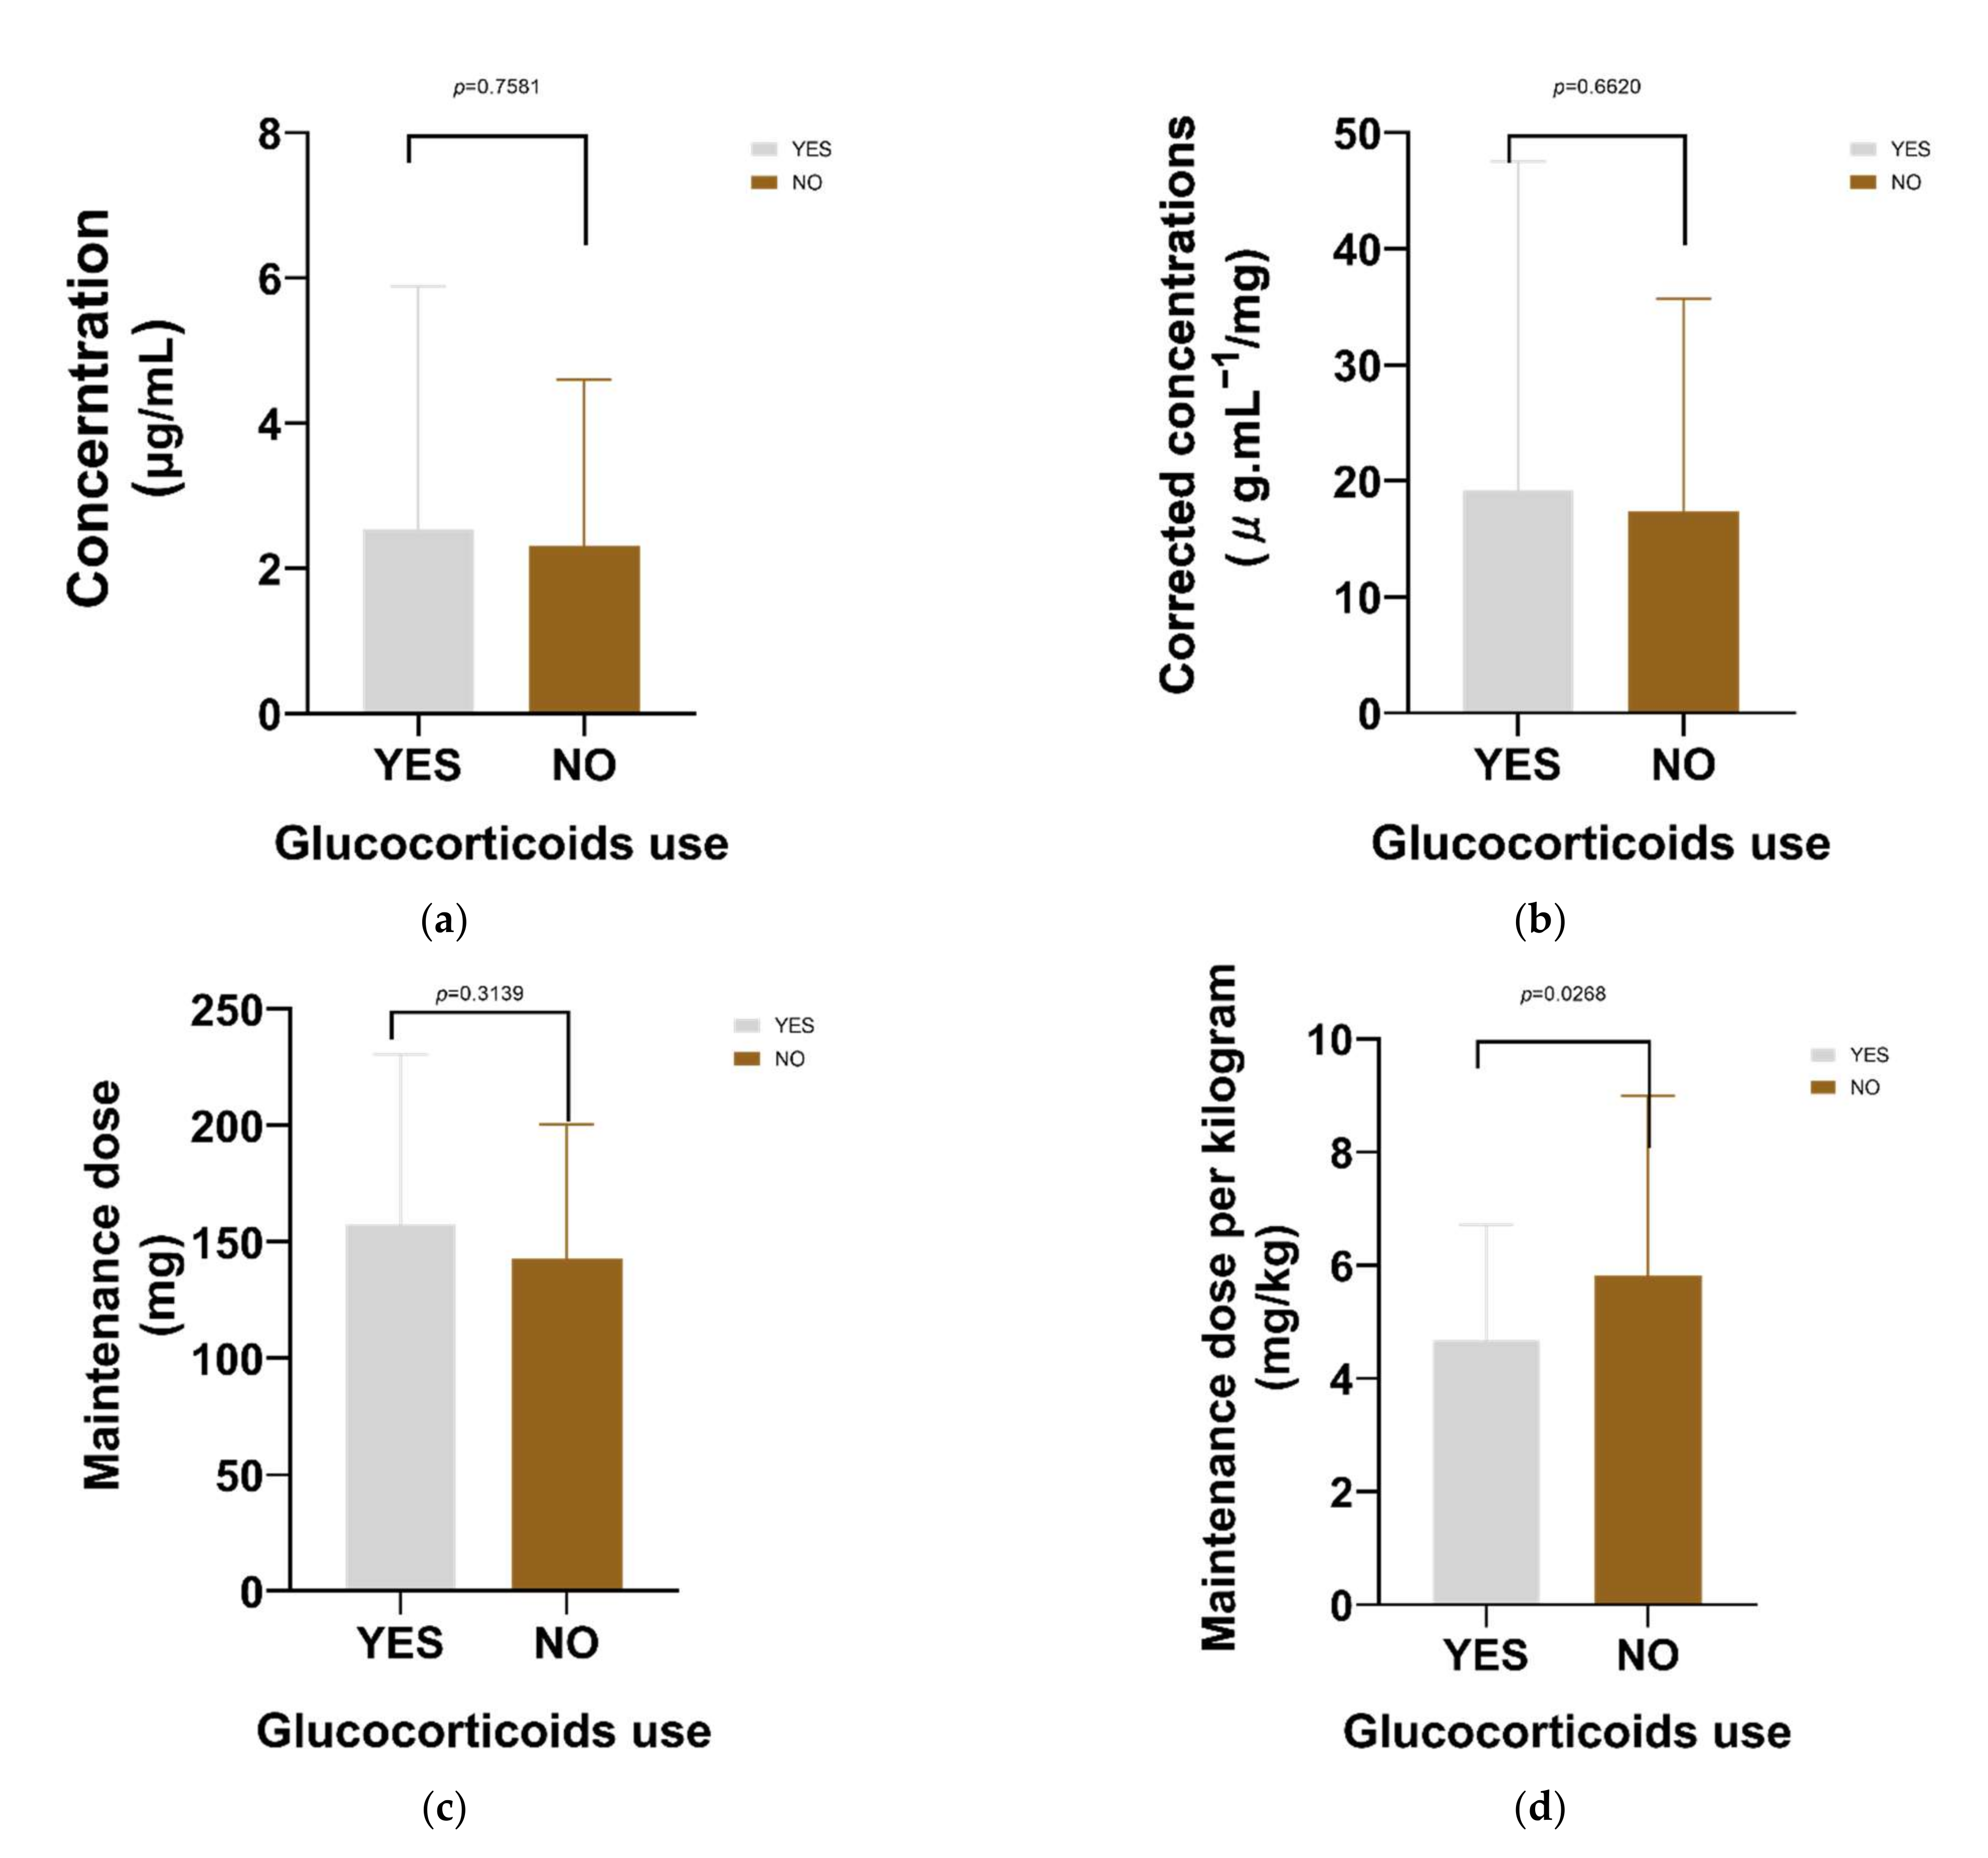
| Glucocorticoid use | −0.026 | 0.758 |
| CYP2C19 phenotypes | −0.263 * | 0.011 |
| CYP2C19 genotype | −0.236 * | 0.024 |
| Coefficient | T | p Value | VIF | |
|---|---|---|---|---|
| Weight | −0.050 | −2.398 | 0.019 * | 2.033 |
| Dose before sampling | 0.033 | 5.407 | 0.000 * | 2.070 |
| Direct Bilirubin | 0.055 | 3.976 | 0.000 * | 1.114 |
| Urea nitrogen | 0.216 | 2.109 | 0.038 * | 1.135 |
| CYP2C19 phenotype (IM) | −1.789 | −2.042 | 0.045 * | 2.863 |
| CYP2C19 phenotype (NM) | −2.020 | −2.194 | 0.031 * | 2.794 |
| Constant value | −0.655 | −0.600 | 0.550 | |
| F | 8.551 | |||
| p | <0.001 * | |||
| R2 | 0.362 | |||
| Dependent variable: voriconazole trough concentration | ||||
| Final Factors | References | No. of Patients | No. of Concentration | Study Cohort | R2 |
|---|---|---|---|---|---|
| Weight, voriconazole dose, direct bilirubin, urea nitrogen and CYP2C19 phenotypes | result of this study | 94 | 145 | Pediatric patients | 0.362 |
| Age, CYP2C19 phenotype, PPIs | Tian et al., 2021 [35] | 108 | 348 | Pediatric patients | 0.234 |
| CYP2C19 phenotypes, hemoglobin, platelet count, PPIs | Zhao et al., 2021 [38] | 93 | 213 | Kidney transplantation recipients | 0.336 |
| C-reactive protein (CRP) level, albumin, glucocorticoid | Dote et al., 2019 [39] | 63 | 77 | Elderly patients | / |
| Sex, daily dose, CYP2C19 genotyping, platelet, and MELD score | Zhao et al., 2019 [40] | 43 | 144 | Child–Pugh class C patients | 0.348 |
| Age, gamma-glutamyl transferase, IL-6, PPIs, CYP2C19 phenotypes | Mafuru et al., 2019 [41] | 113 | 250 | Patients With Hematologic Disorders | 0.290 |
| Weight, oral voriconazole, phenytoin or rifampin, and PPIs | Dolton et al., 2012 [34] | 201 | 783 | Adults | / |
| CYP2C19 phenotype | Blanco et al., 2019 [36] | 78 | / | Adults | / |
| Administration routes, PPIs | Lin Hu et al., 2018 [24] | 42 | 138 | Pediatric patients | 0.553 |
Publisher’s Note: MDPI stays neutral with regard to jurisdictional claims in published maps and institutional affiliations. |
© 2021 by the authors. Licensee MDPI, Basel, Switzerland. This article is an open access article distributed under the terms and conditions of the Creative Commons Attribution (CC BY) license (https://creativecommons.org/licenses/by/4.0/).
Share and Cite
Zhao, Y.-C.; Zou, Y.; Hou, J.-J.; Xiao, C.-L.; Zhang, B.-K.; Li, J.-K.; Xiang, D.-X.; Sandaradura, I.; Yan, M. Factors Affecting Voriconazole Trough Concentration and Optimal Maintenance Voriconazole Dose in Chinese Children. Antibiotics 2021, 10, 1542. https://0-doi-org.brum.beds.ac.uk/10.3390/antibiotics10121542
Zhao Y-C, Zou Y, Hou J-J, Xiao C-L, Zhang B-K, Li J-K, Xiang D-X, Sandaradura I, Yan M. Factors Affecting Voriconazole Trough Concentration and Optimal Maintenance Voriconazole Dose in Chinese Children. Antibiotics. 2021; 10(12):1542. https://0-doi-org.brum.beds.ac.uk/10.3390/antibiotics10121542
Chicago/Turabian StyleZhao, Yi-Chang, Yang Zou, Jing-Jing Hou, Chen-Lin Xiao, Bi-Kui Zhang, Jia-Kai Li, Da-Xiong Xiang, Indy Sandaradura, and Miao Yan. 2021. "Factors Affecting Voriconazole Trough Concentration and Optimal Maintenance Voriconazole Dose in Chinese Children" Antibiotics 10, no. 12: 1542. https://0-doi-org.brum.beds.ac.uk/10.3390/antibiotics10121542