
Vapor Phosphorylation of Cellulose by Phosphorus Trichlo-Ride: Selective Phosphorylation of 6-Hydroxyl Function—The Synthesis of New Antimicrobial Cellulose 6-Phosphate(III)-Copper Complexes


Abstract
:1. Introduction
2. Results and Discussion
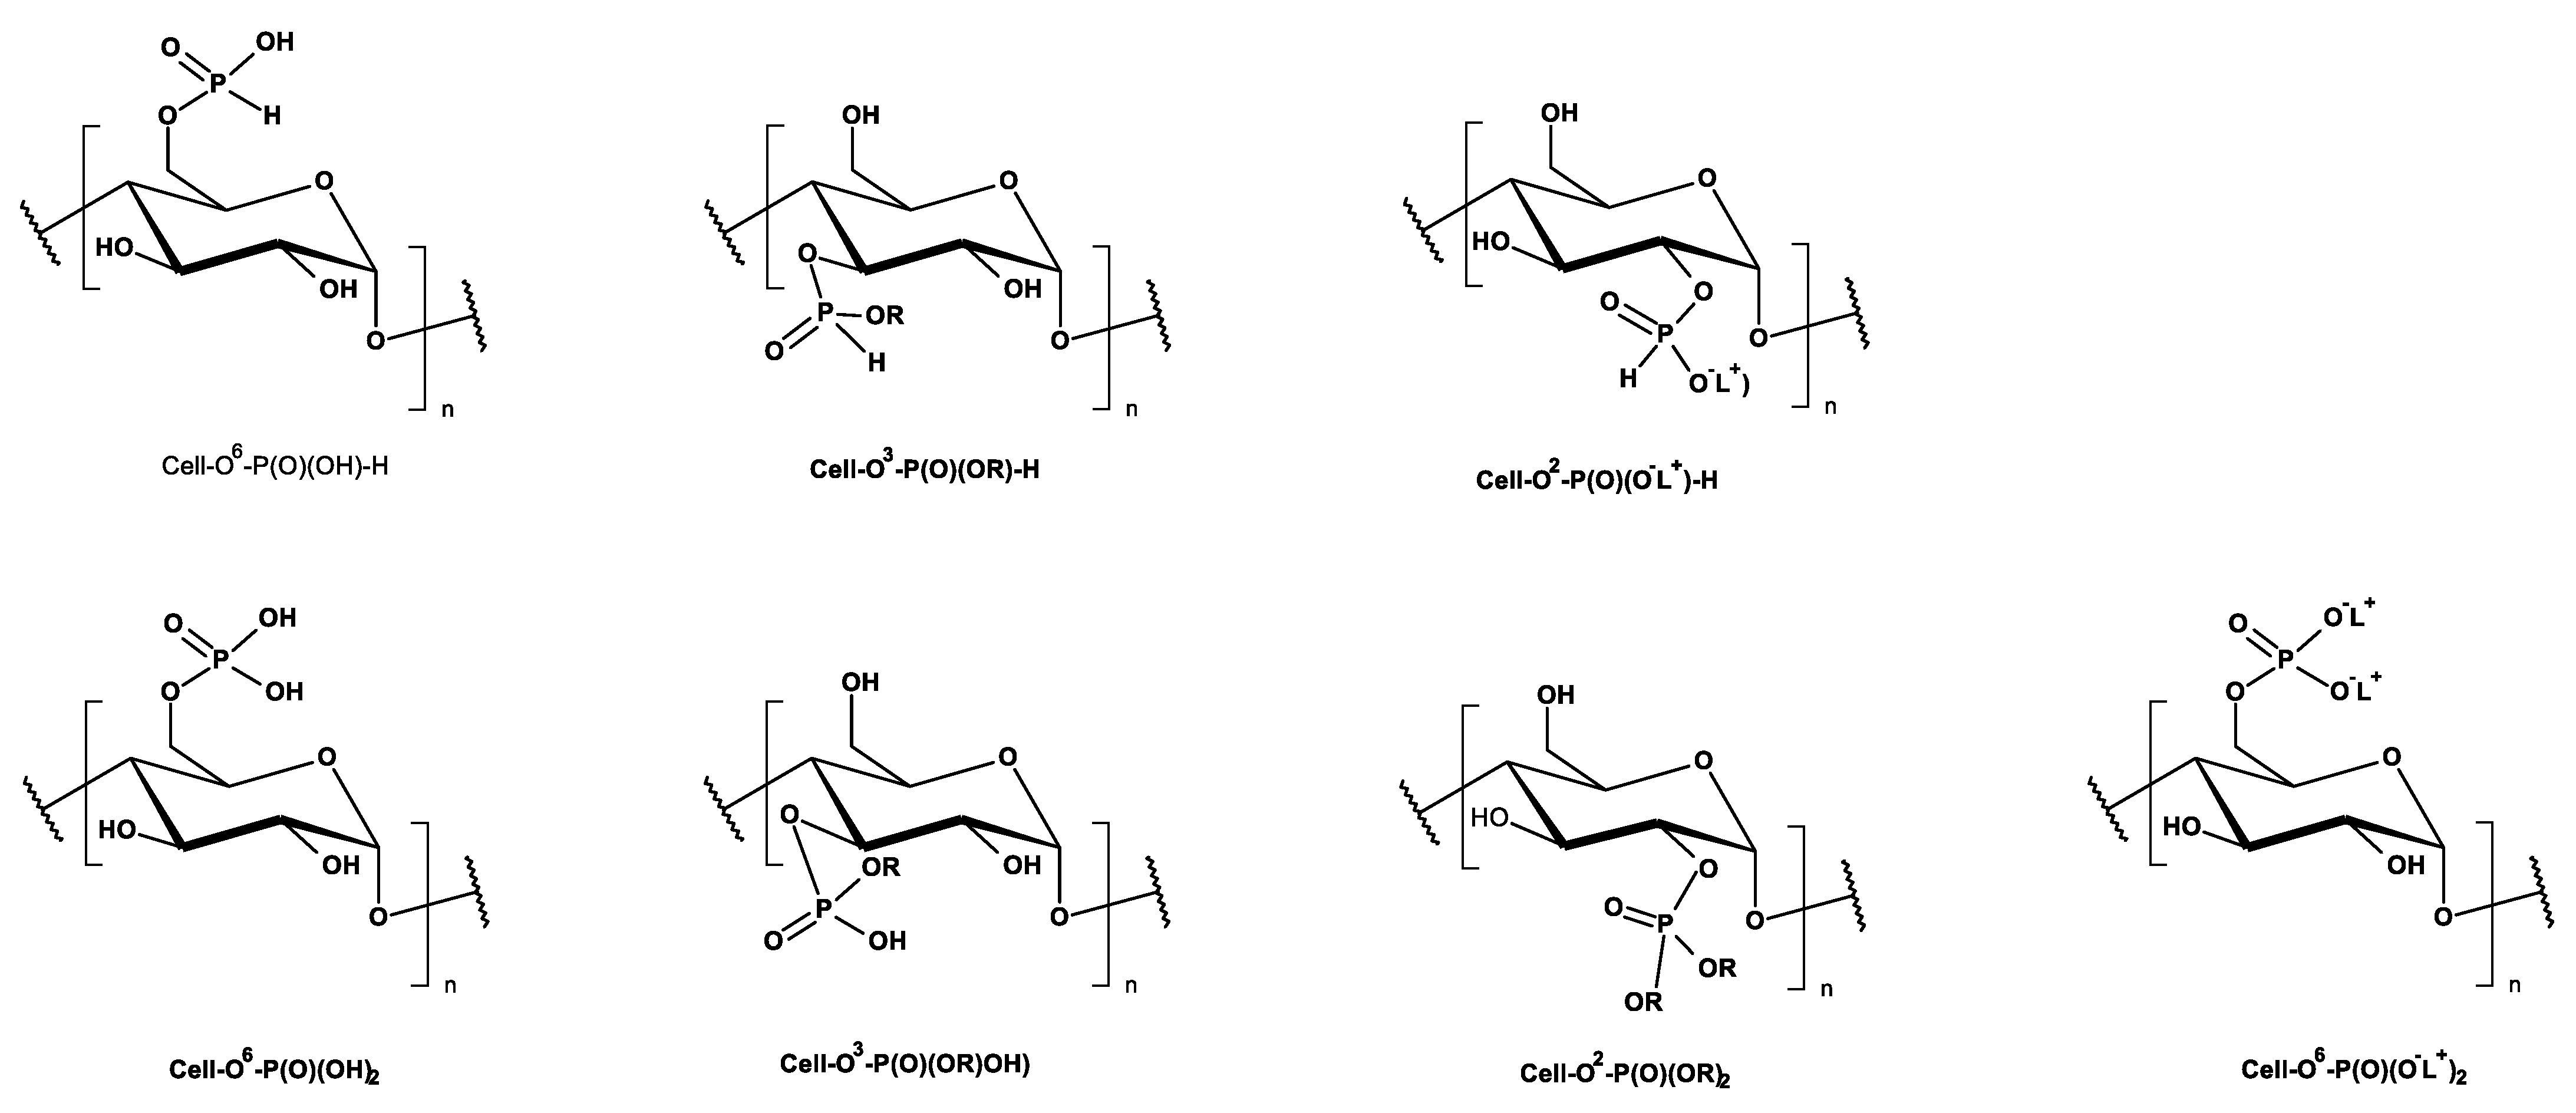
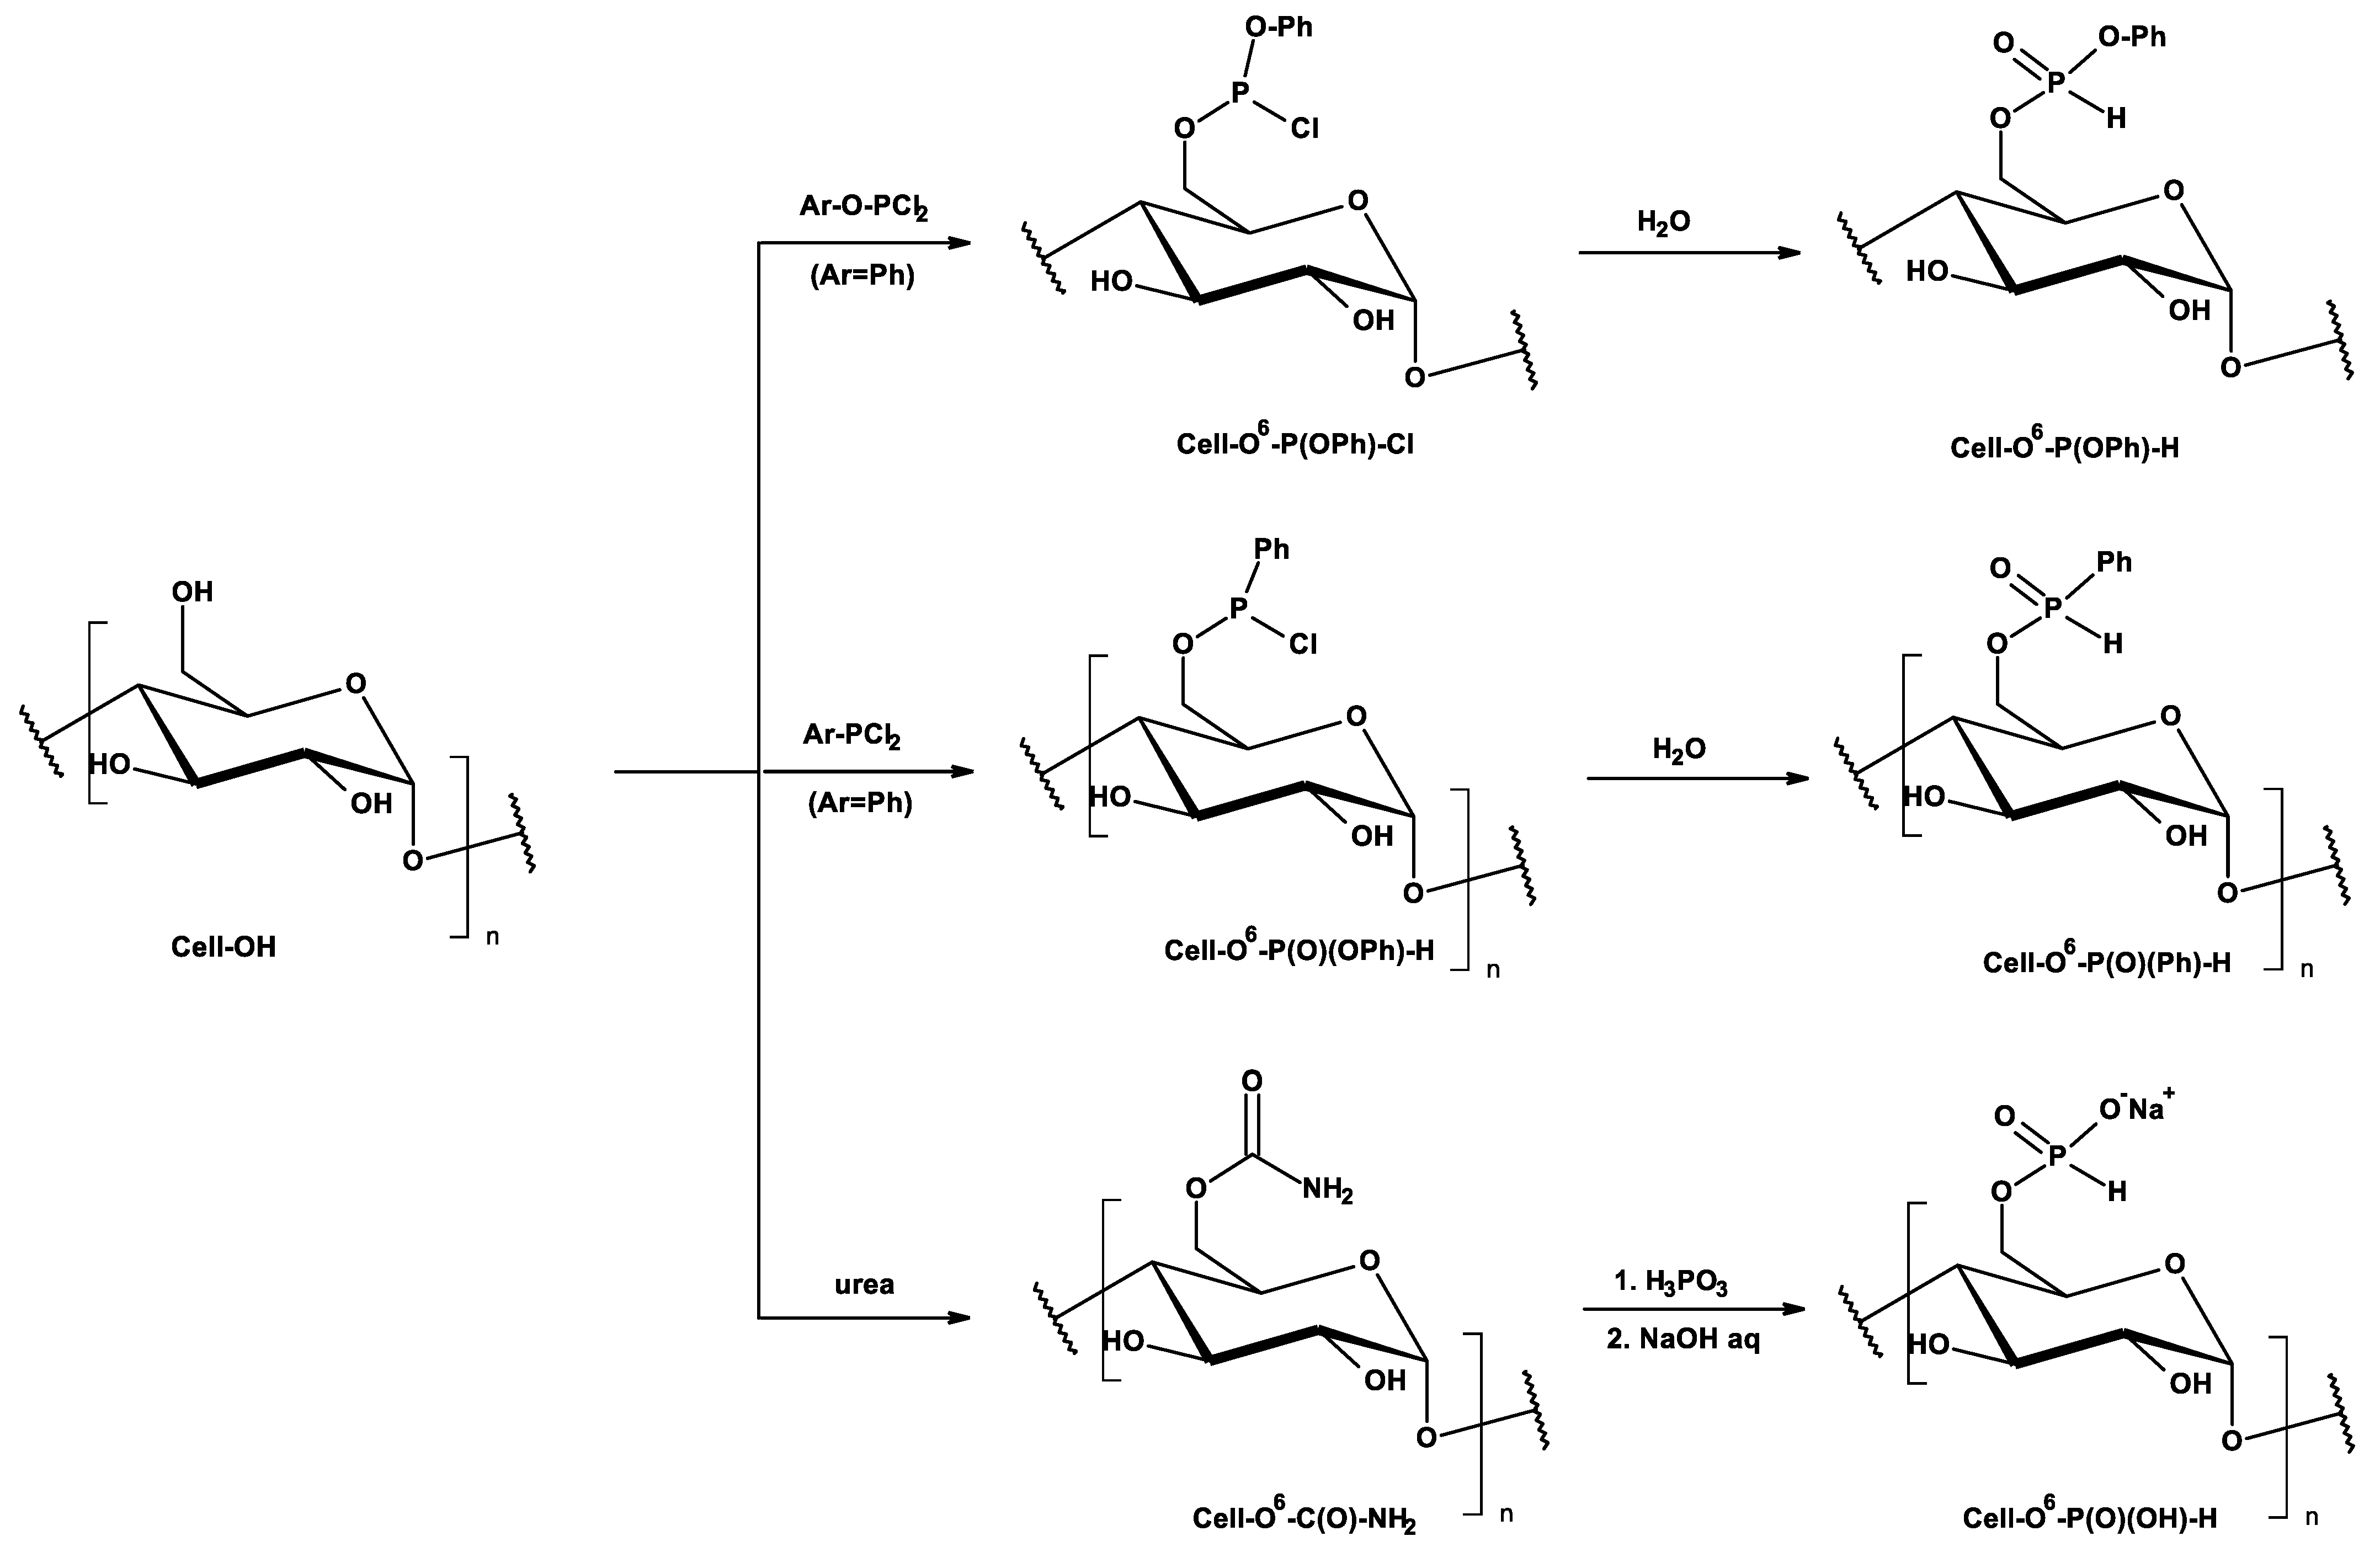
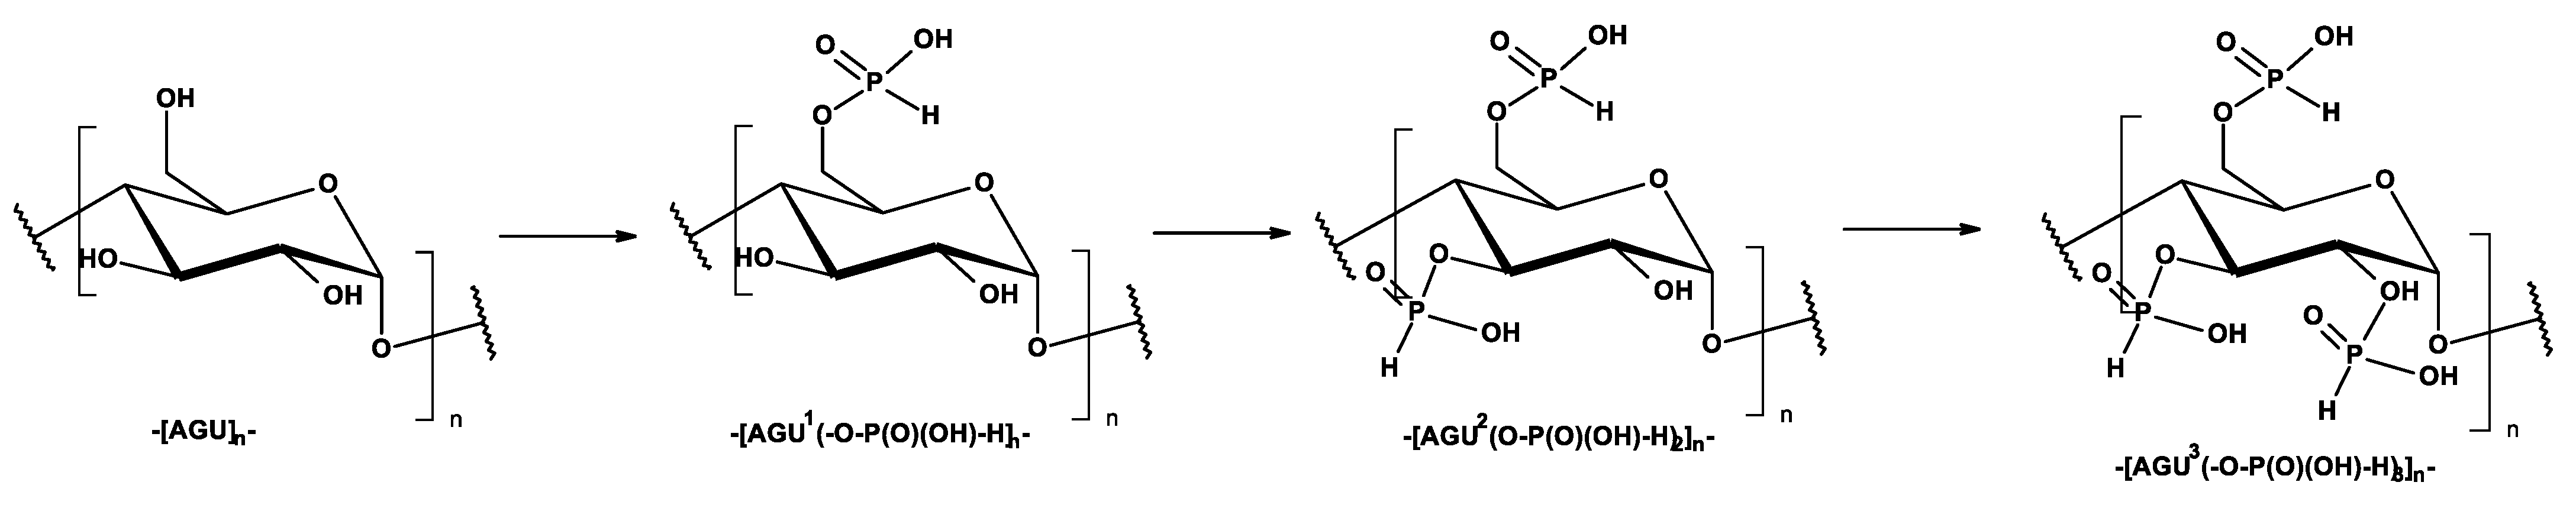
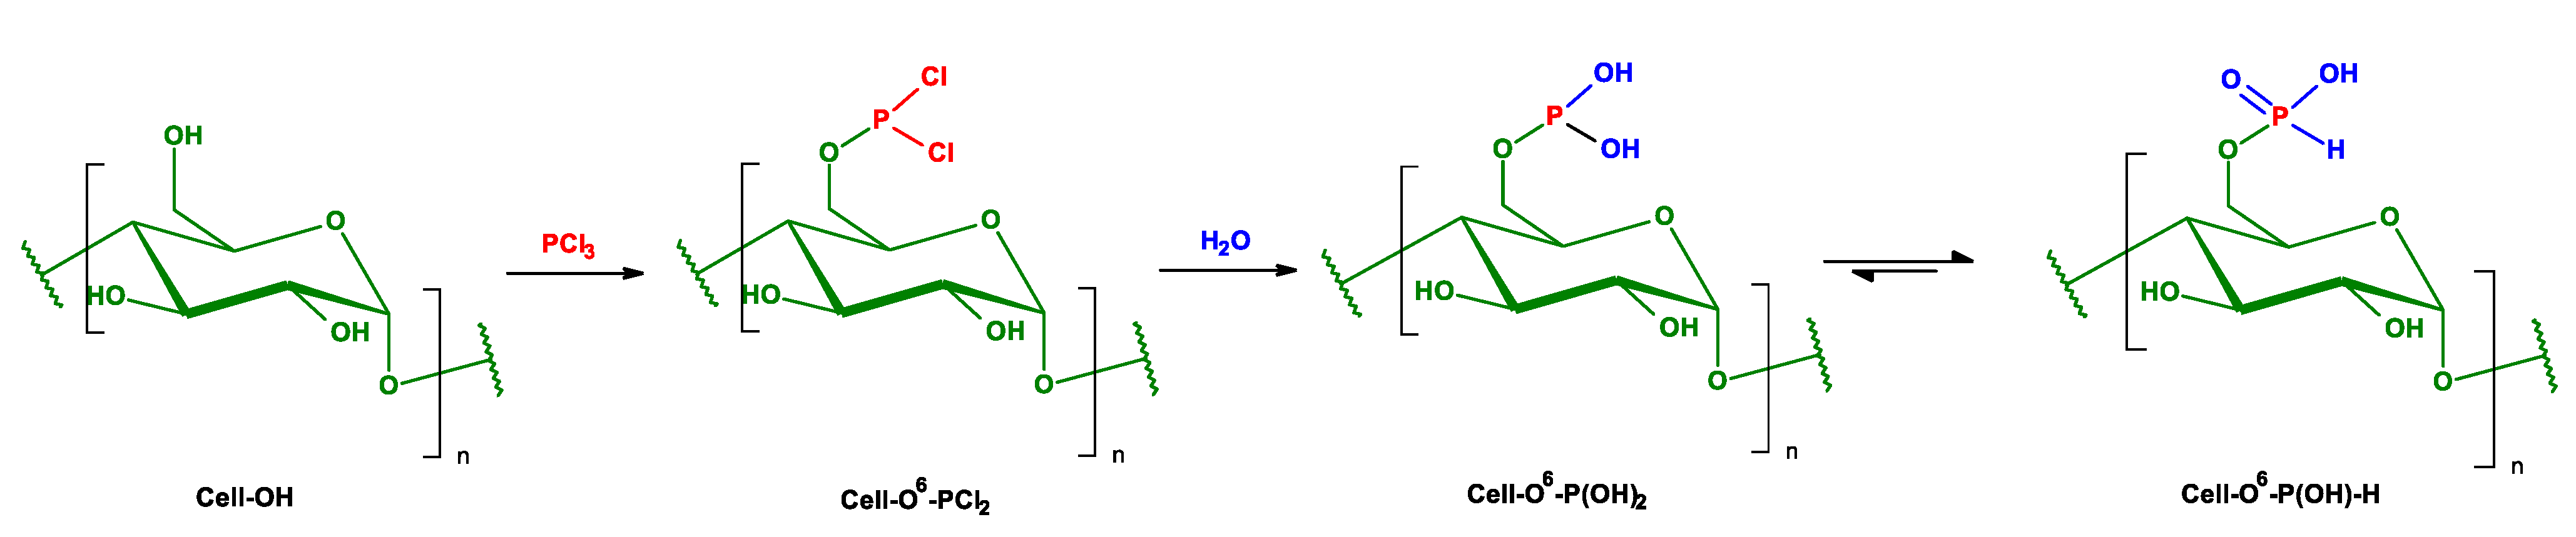
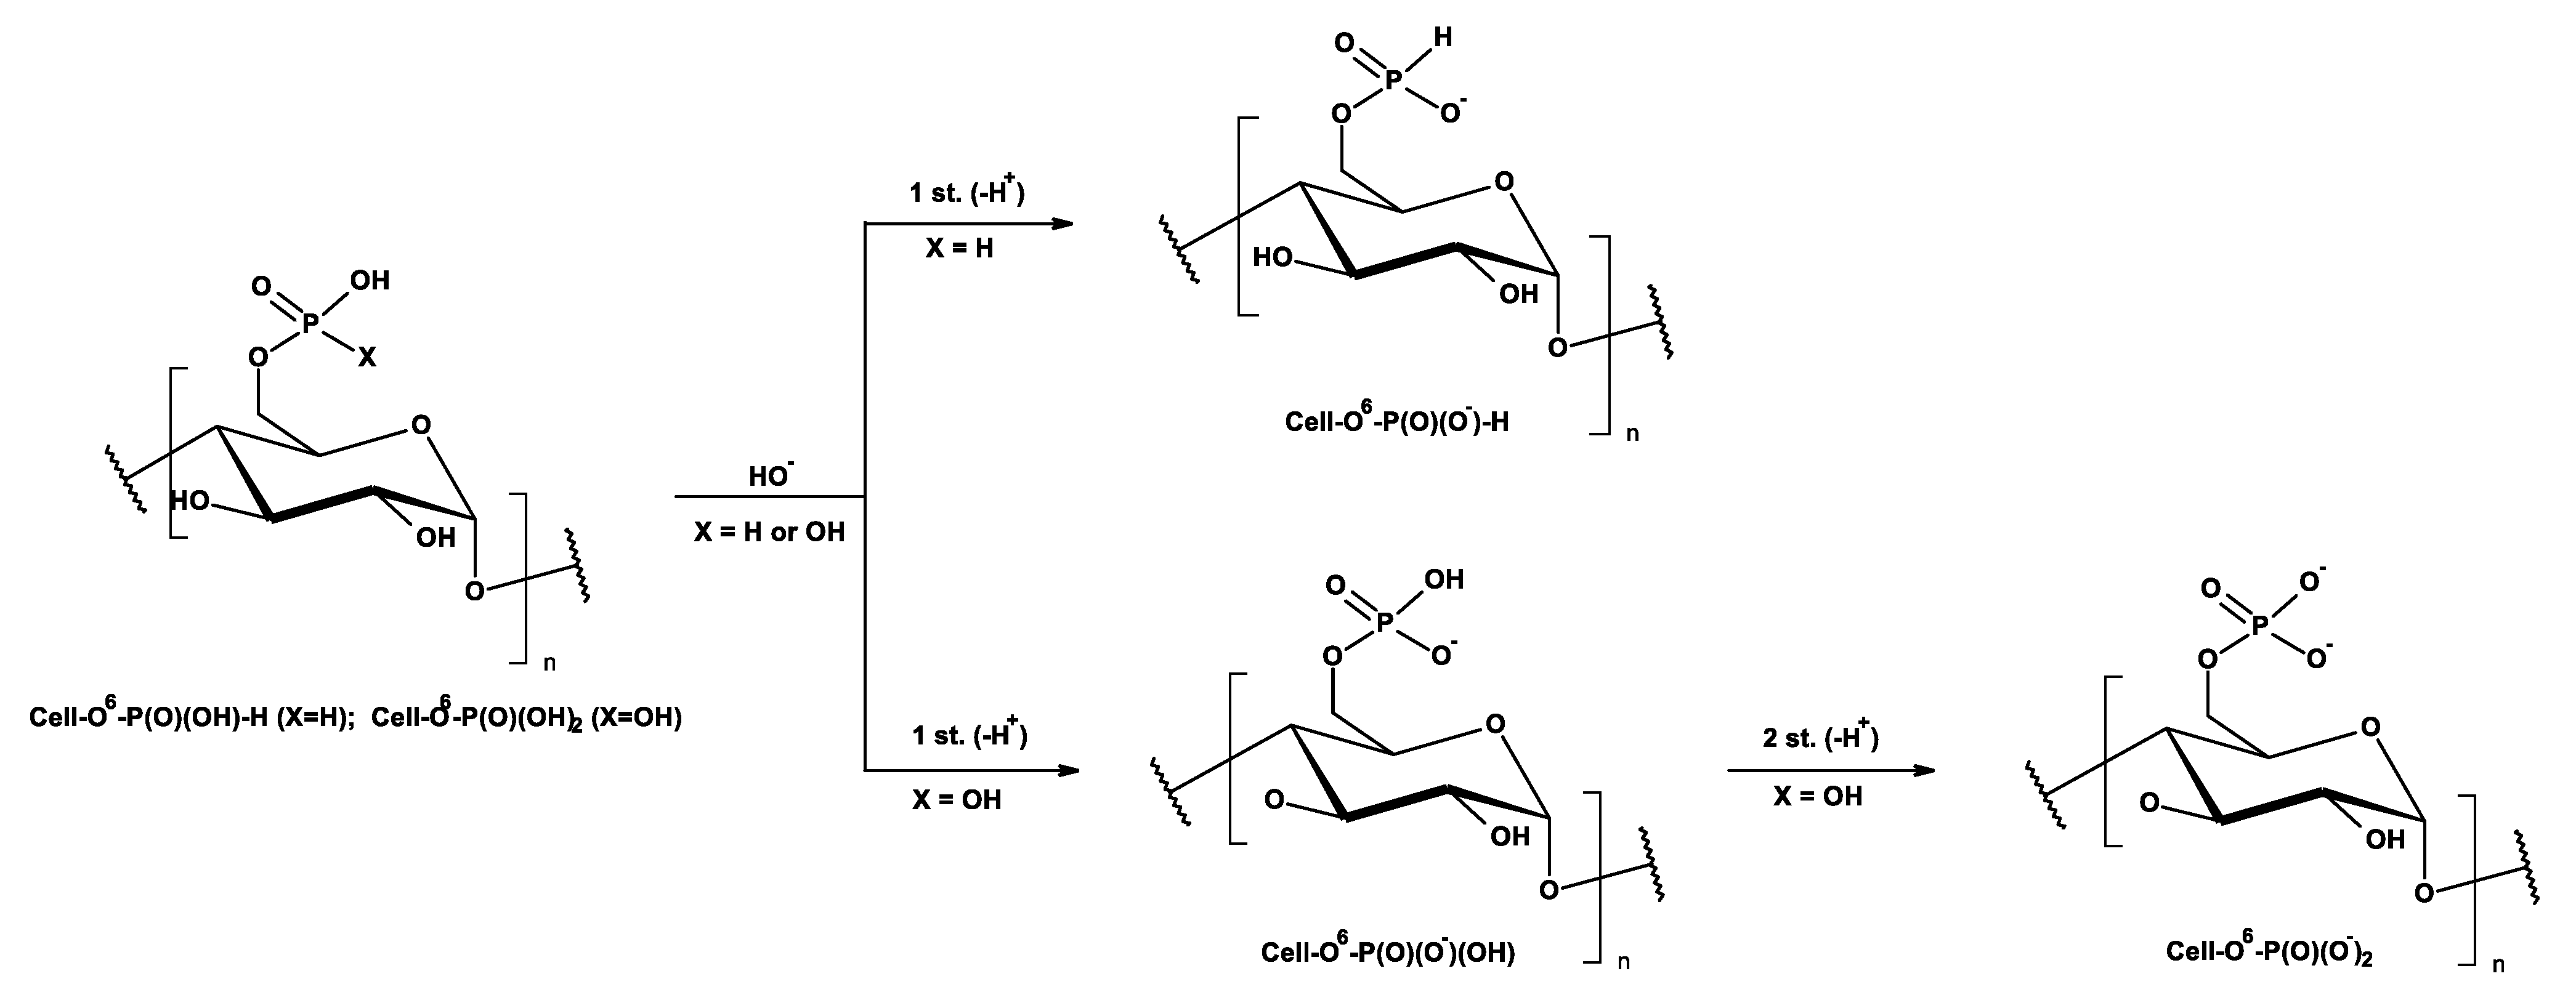
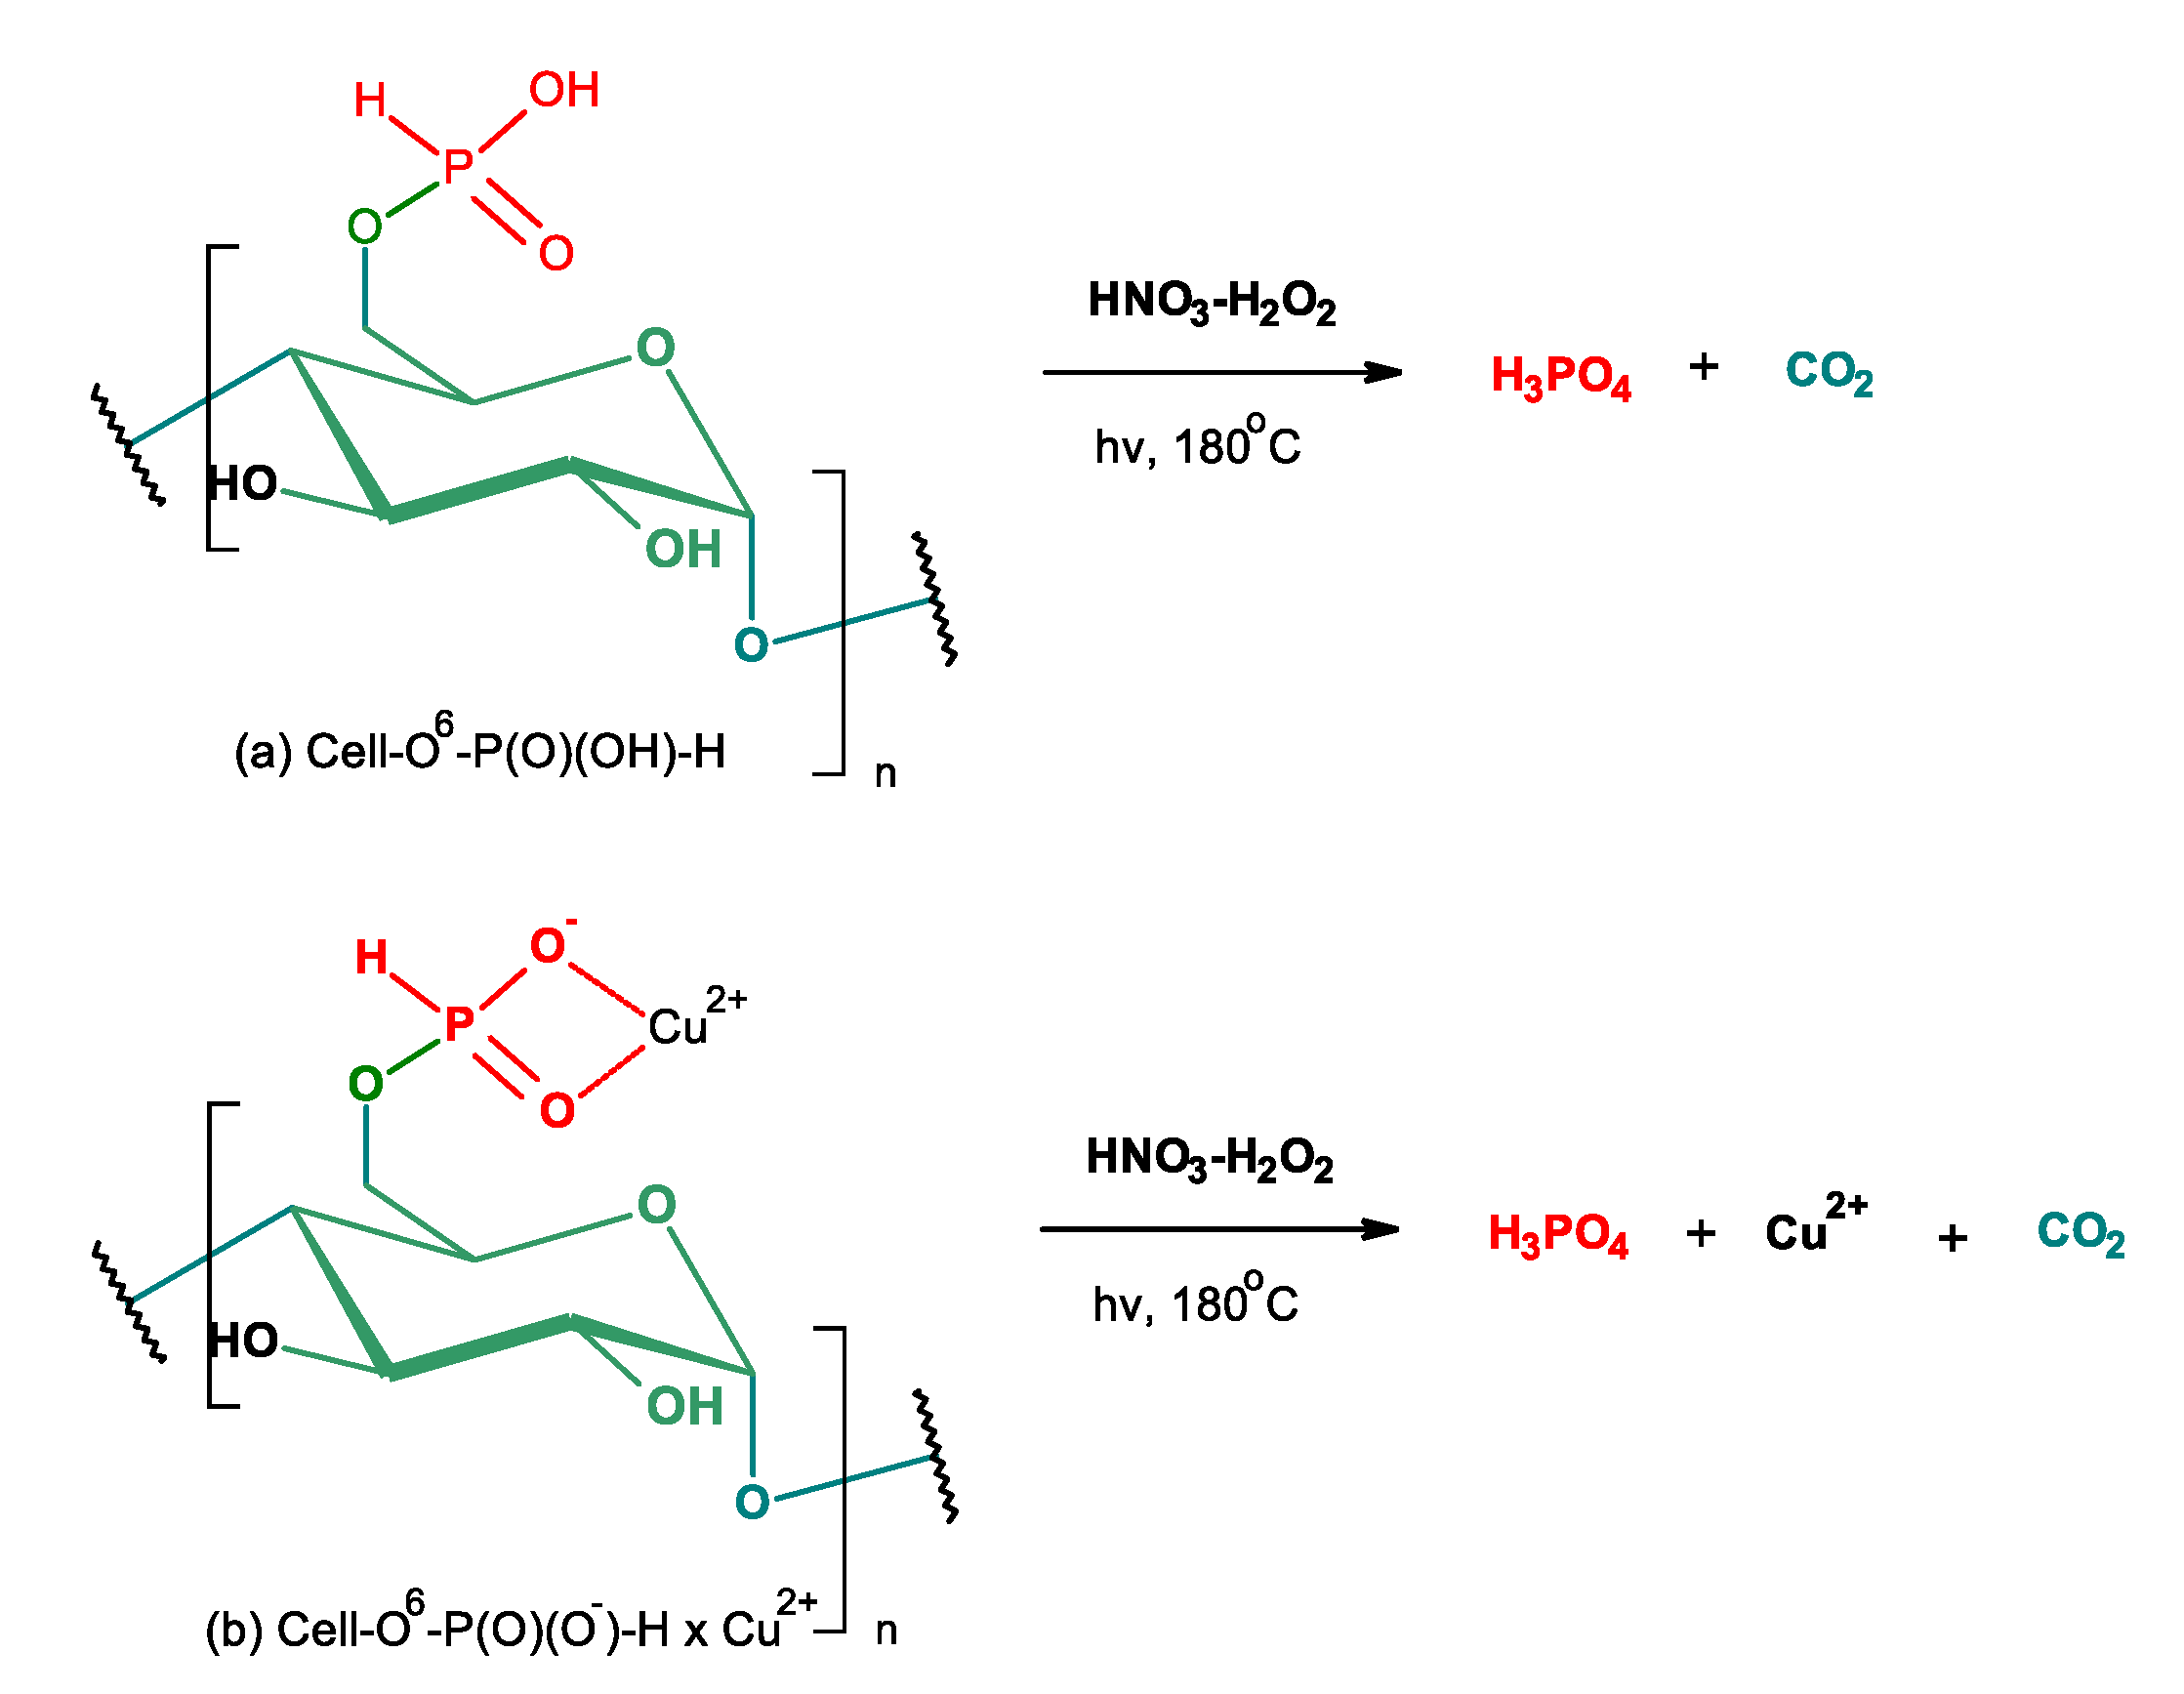
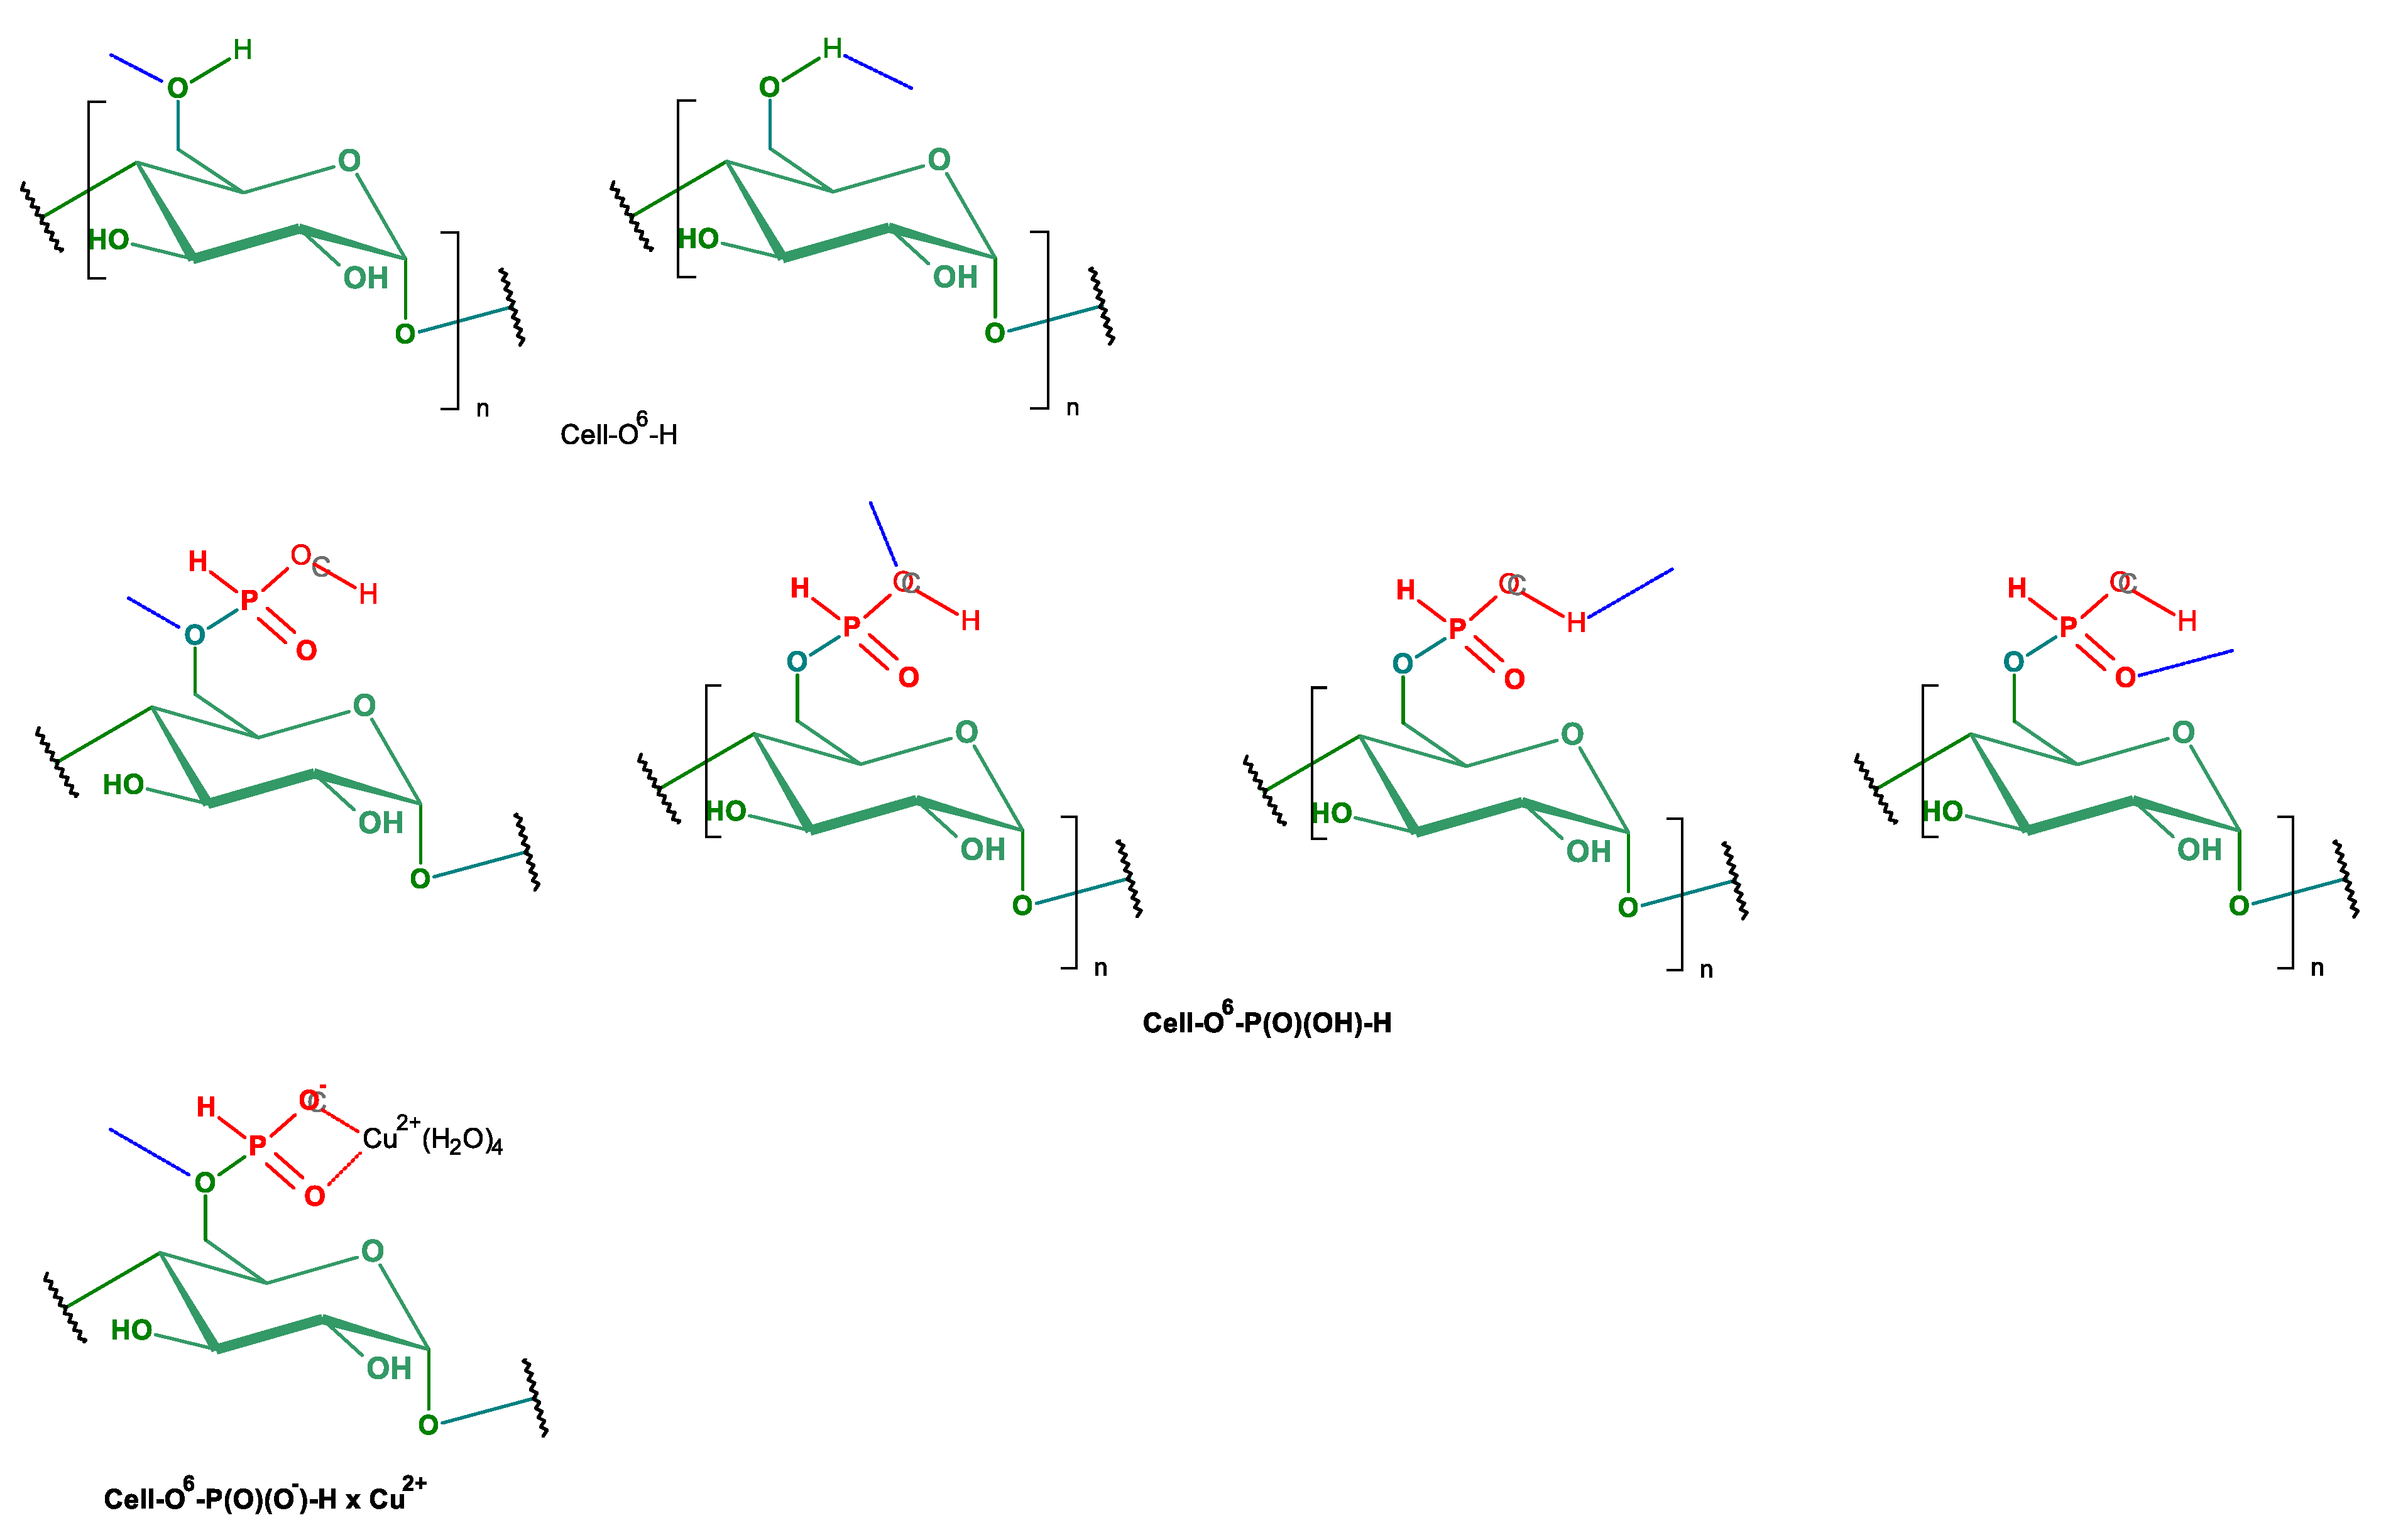
2.1. Phosphorylation of Cellulose
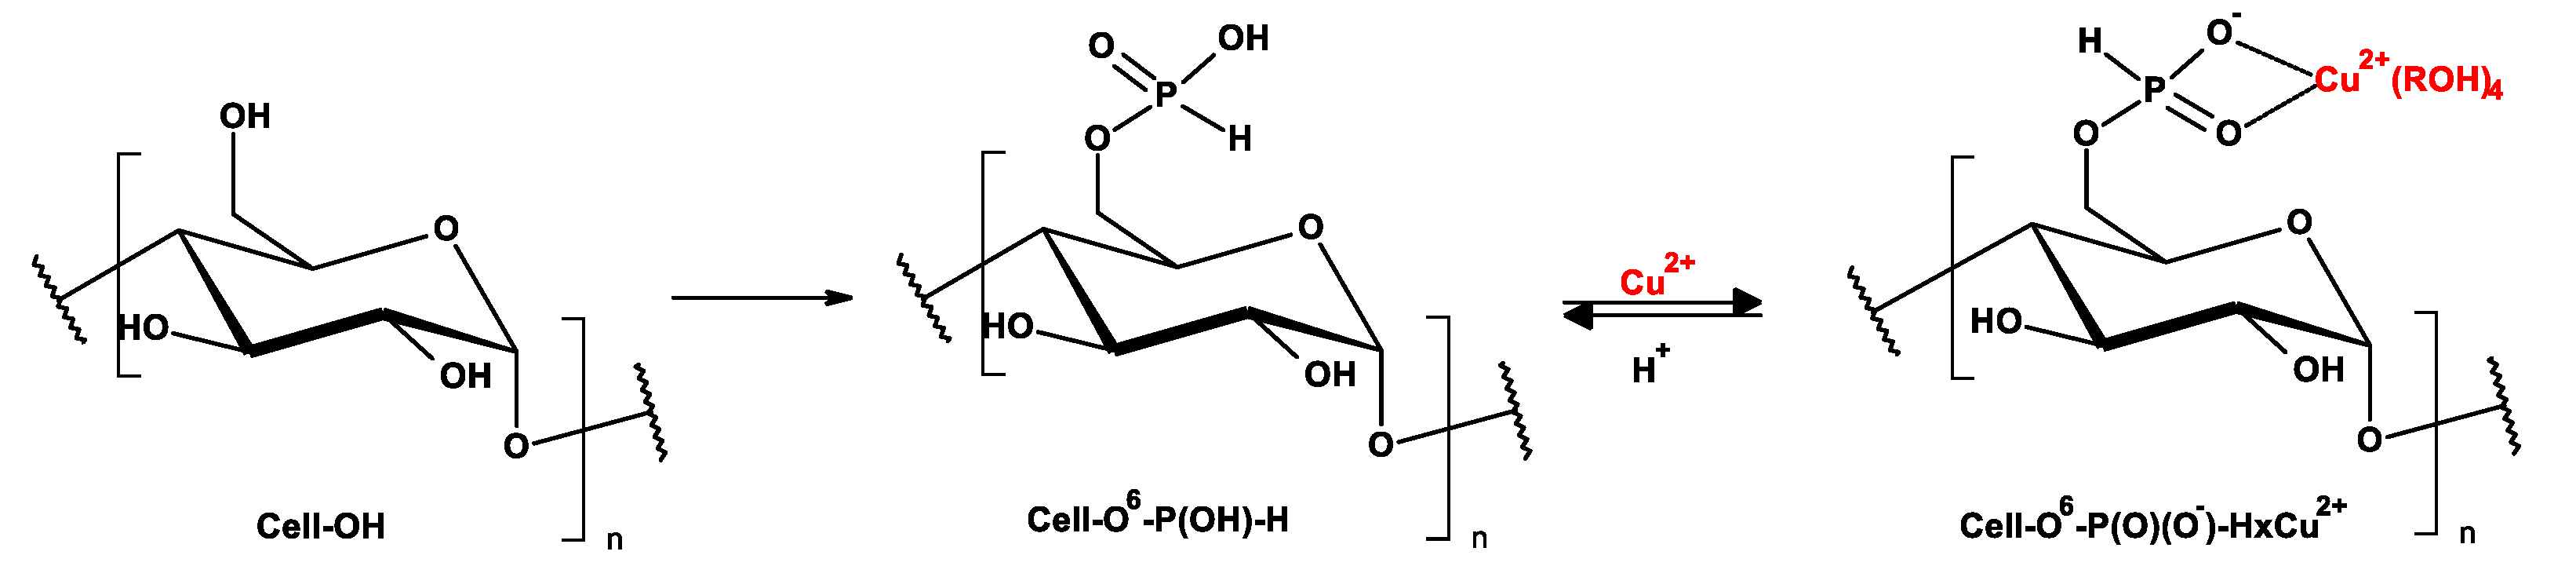
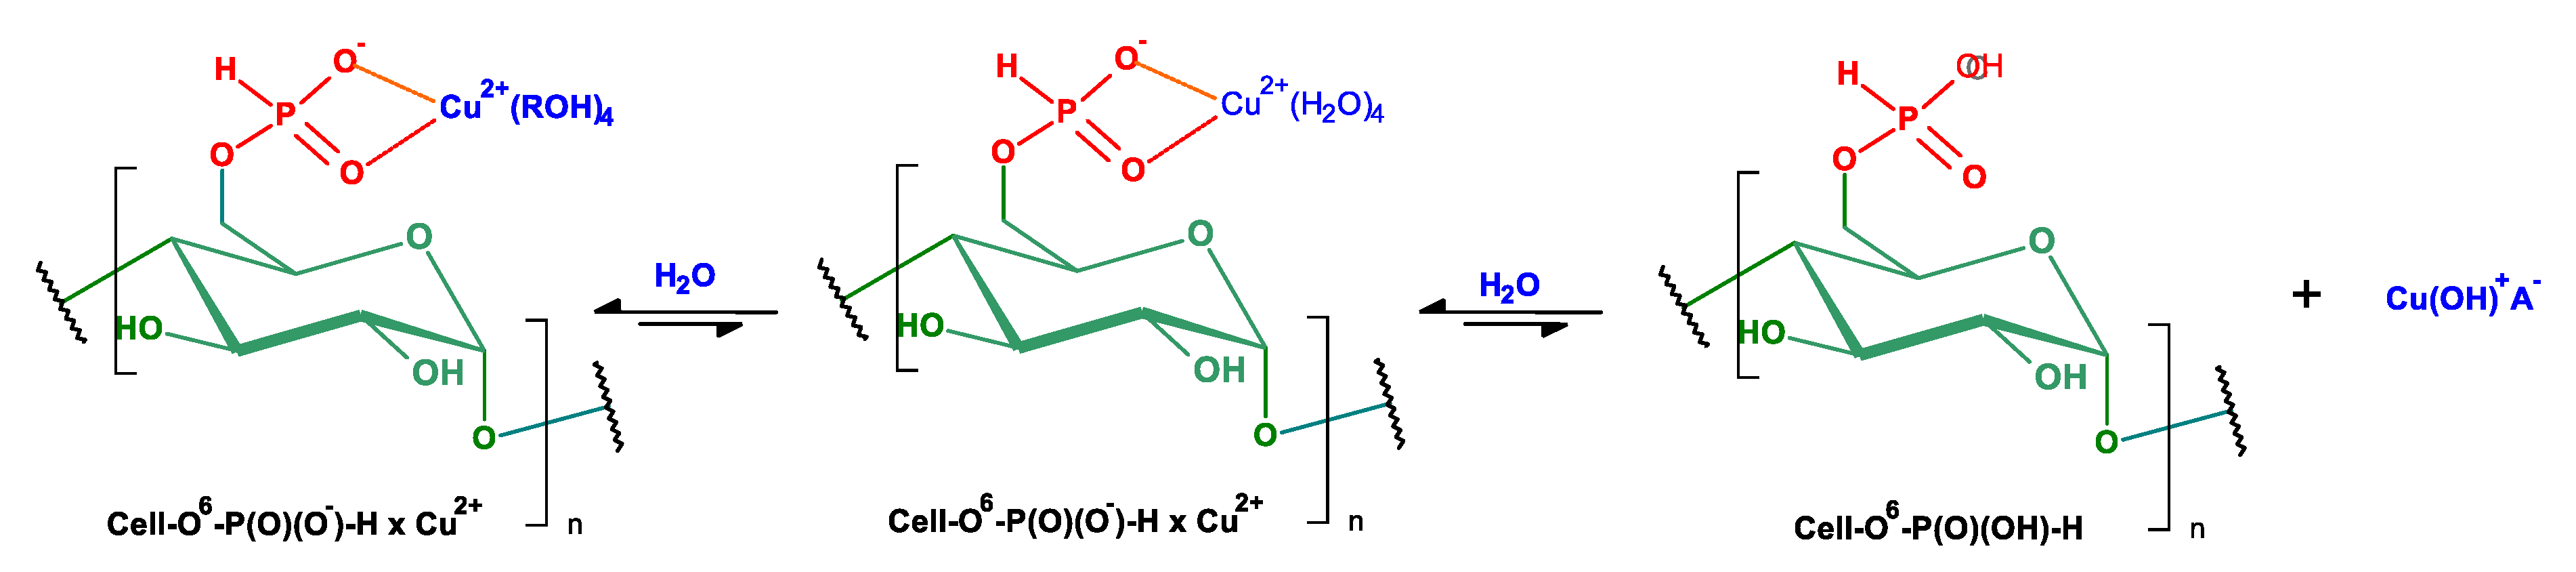
2.2. Complexation Reactions of Phosphorylated Cellulose—Synthesis of Complexes
2.3. Solubility of Cell-O6-P(O)(OH)-H
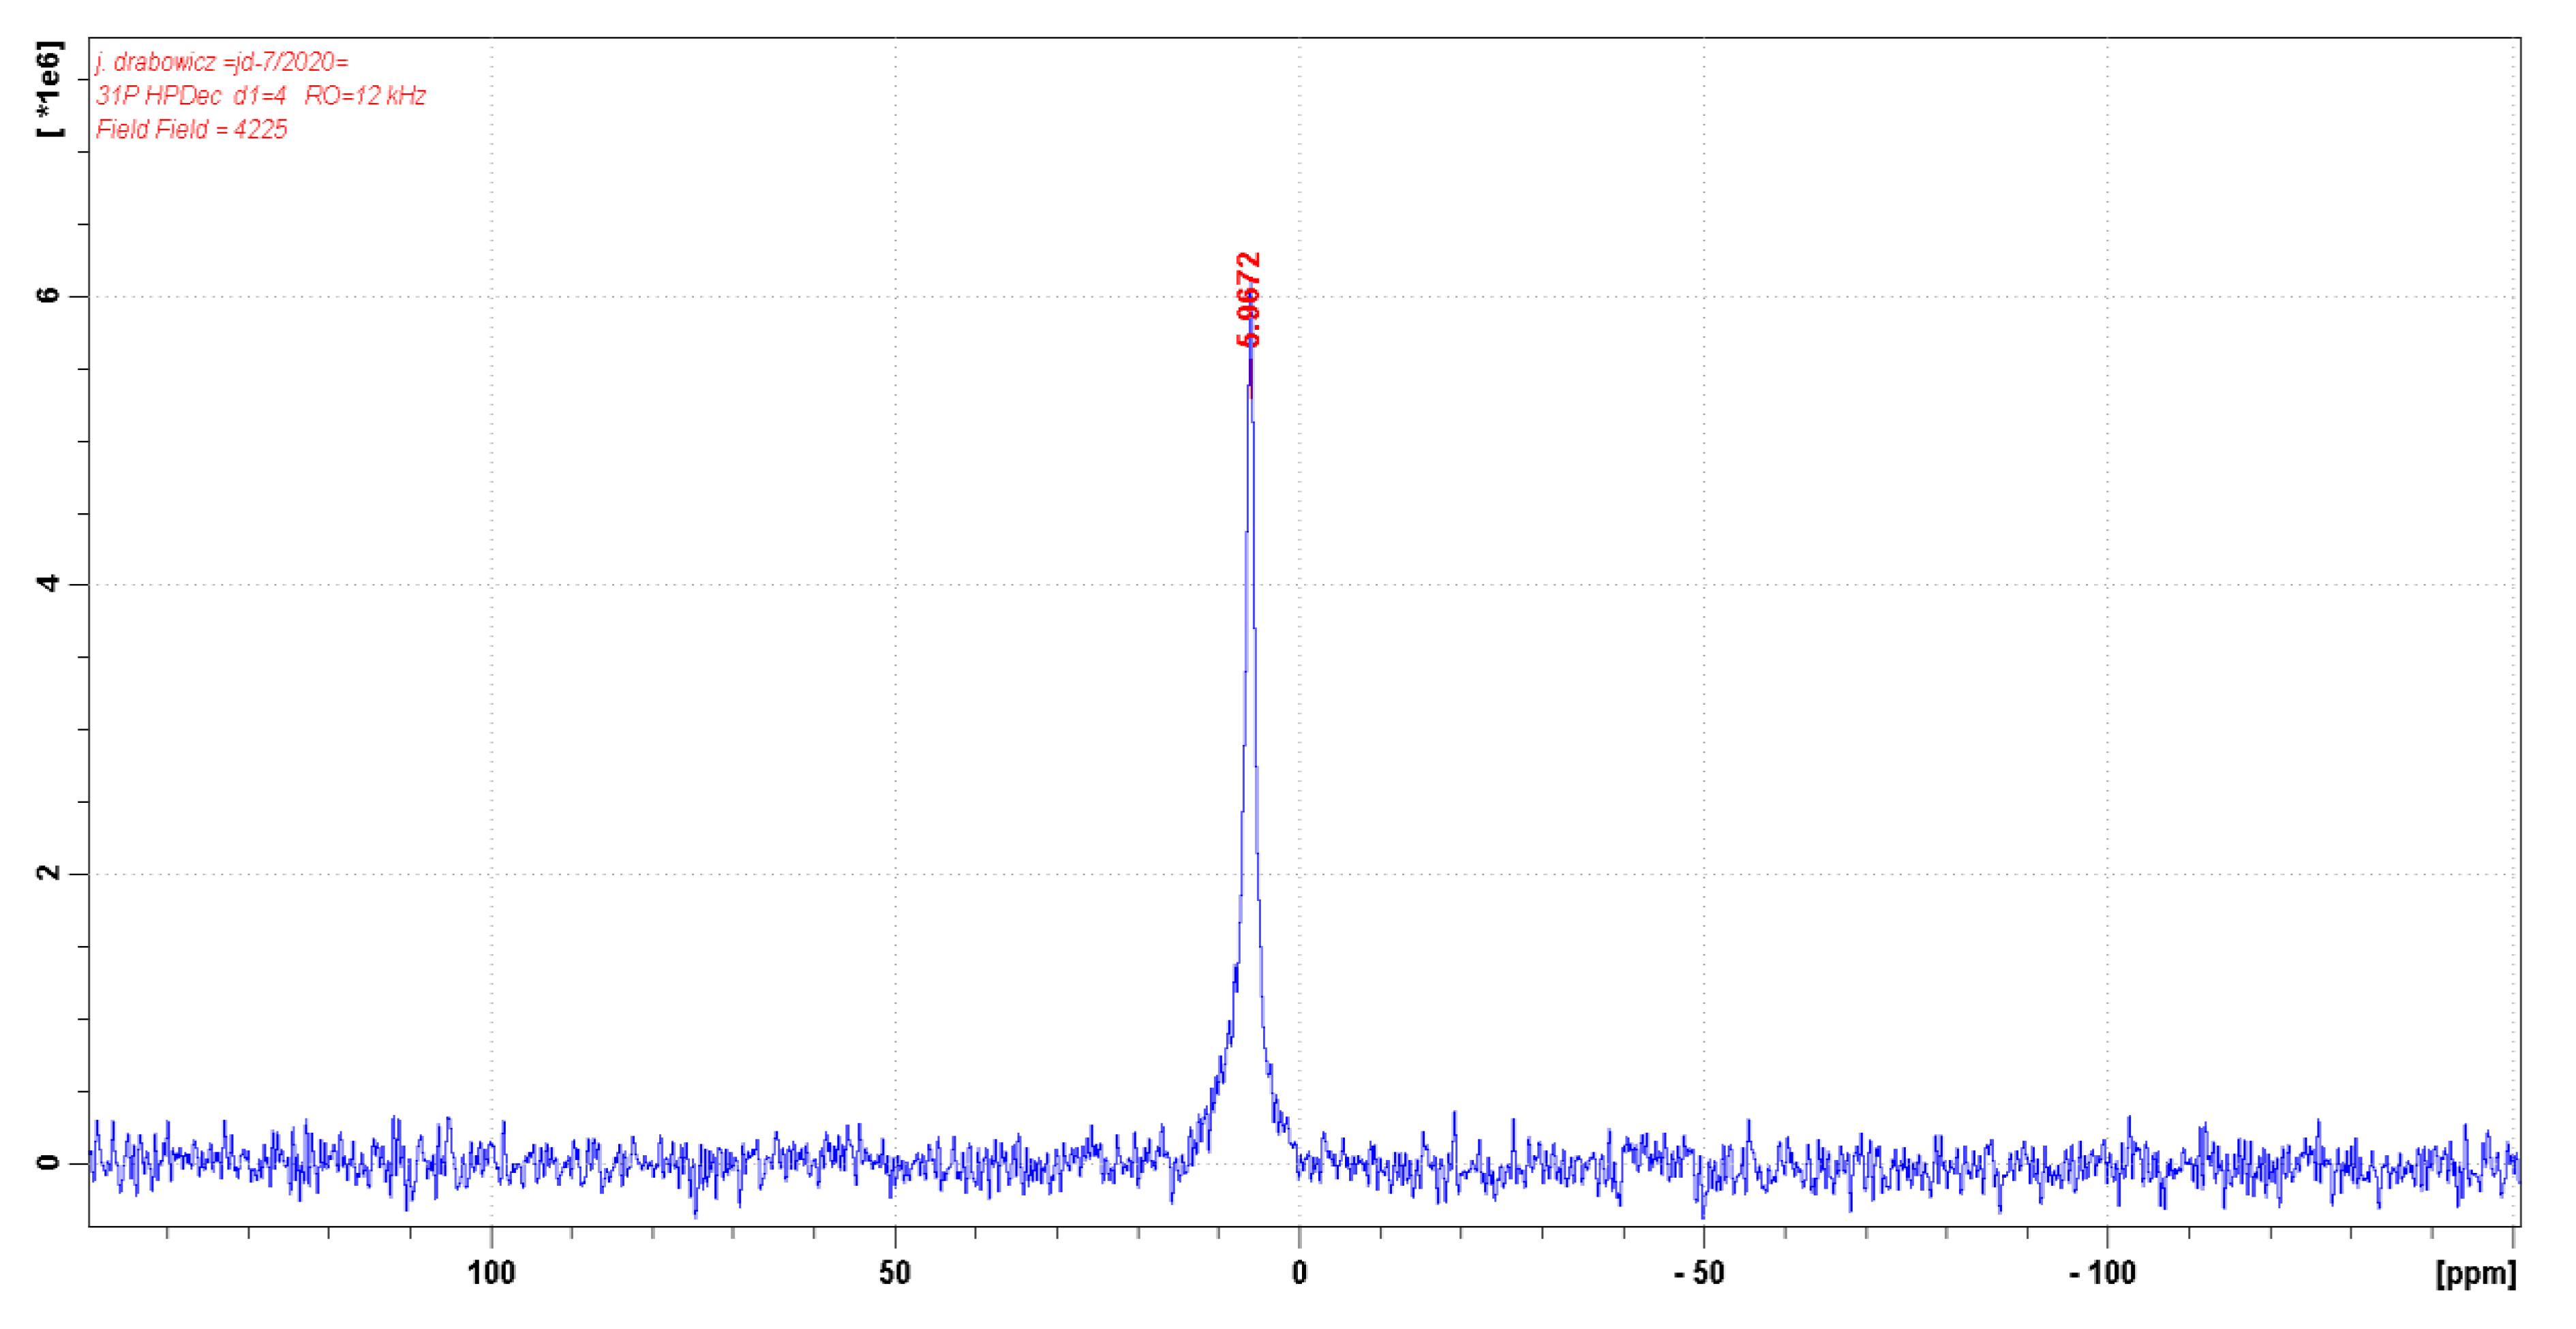
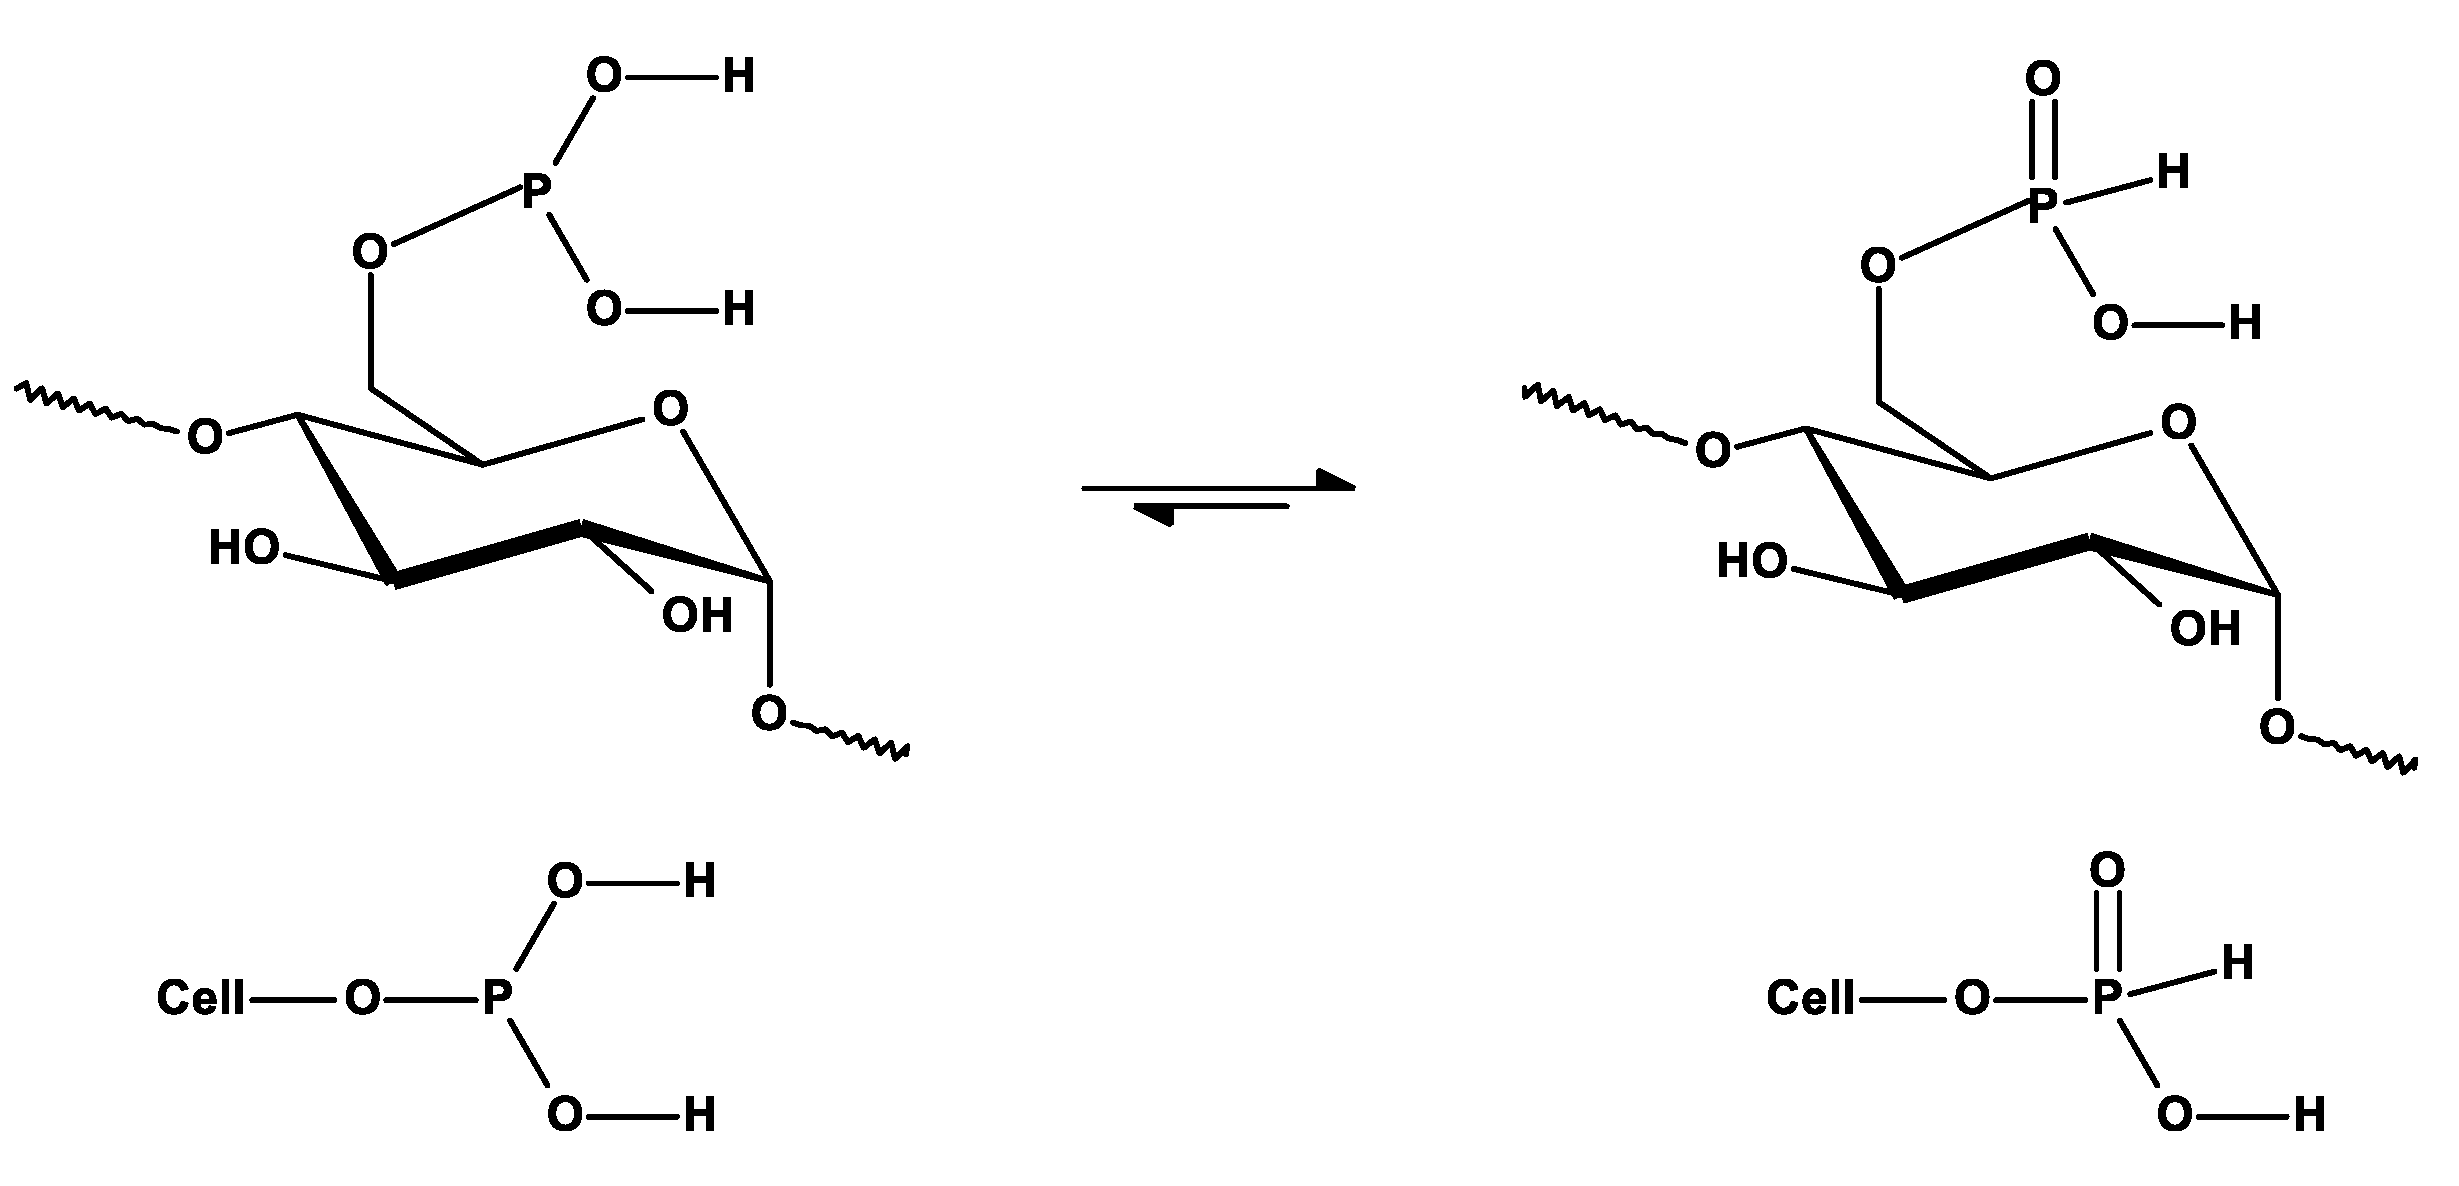
2.4. 31P-NMR of Cell-O-P(O)(OH)-H
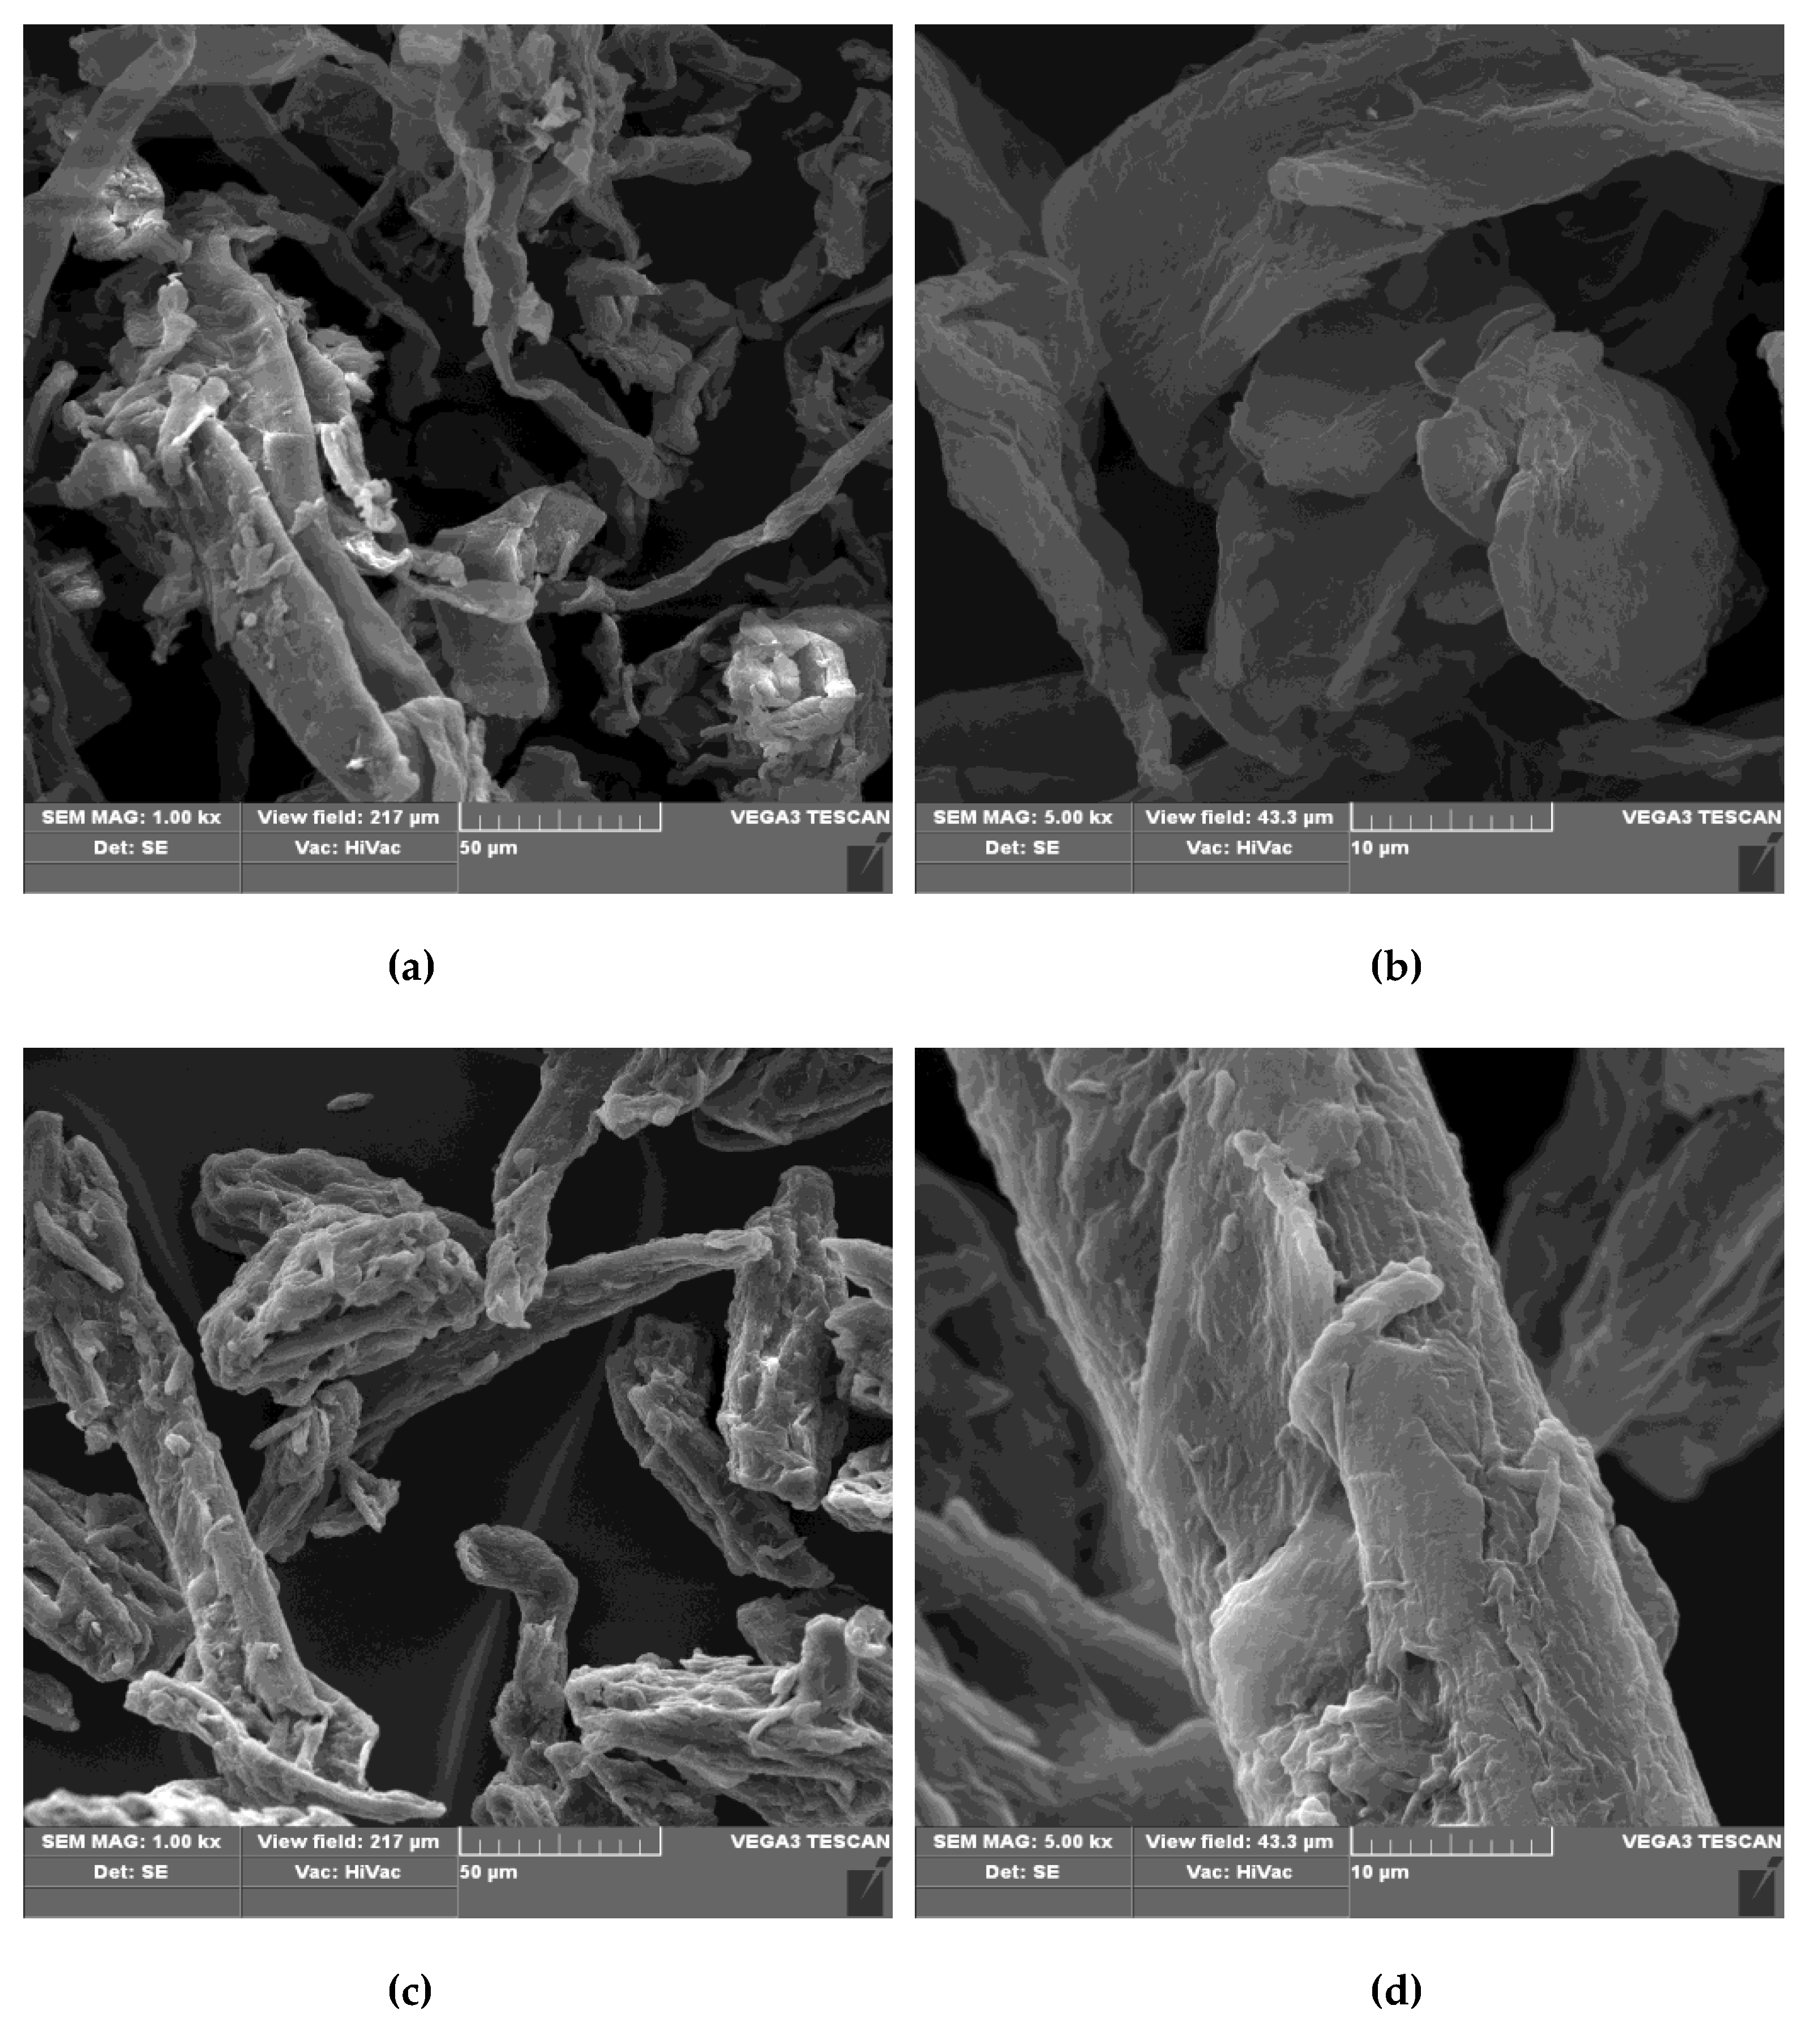
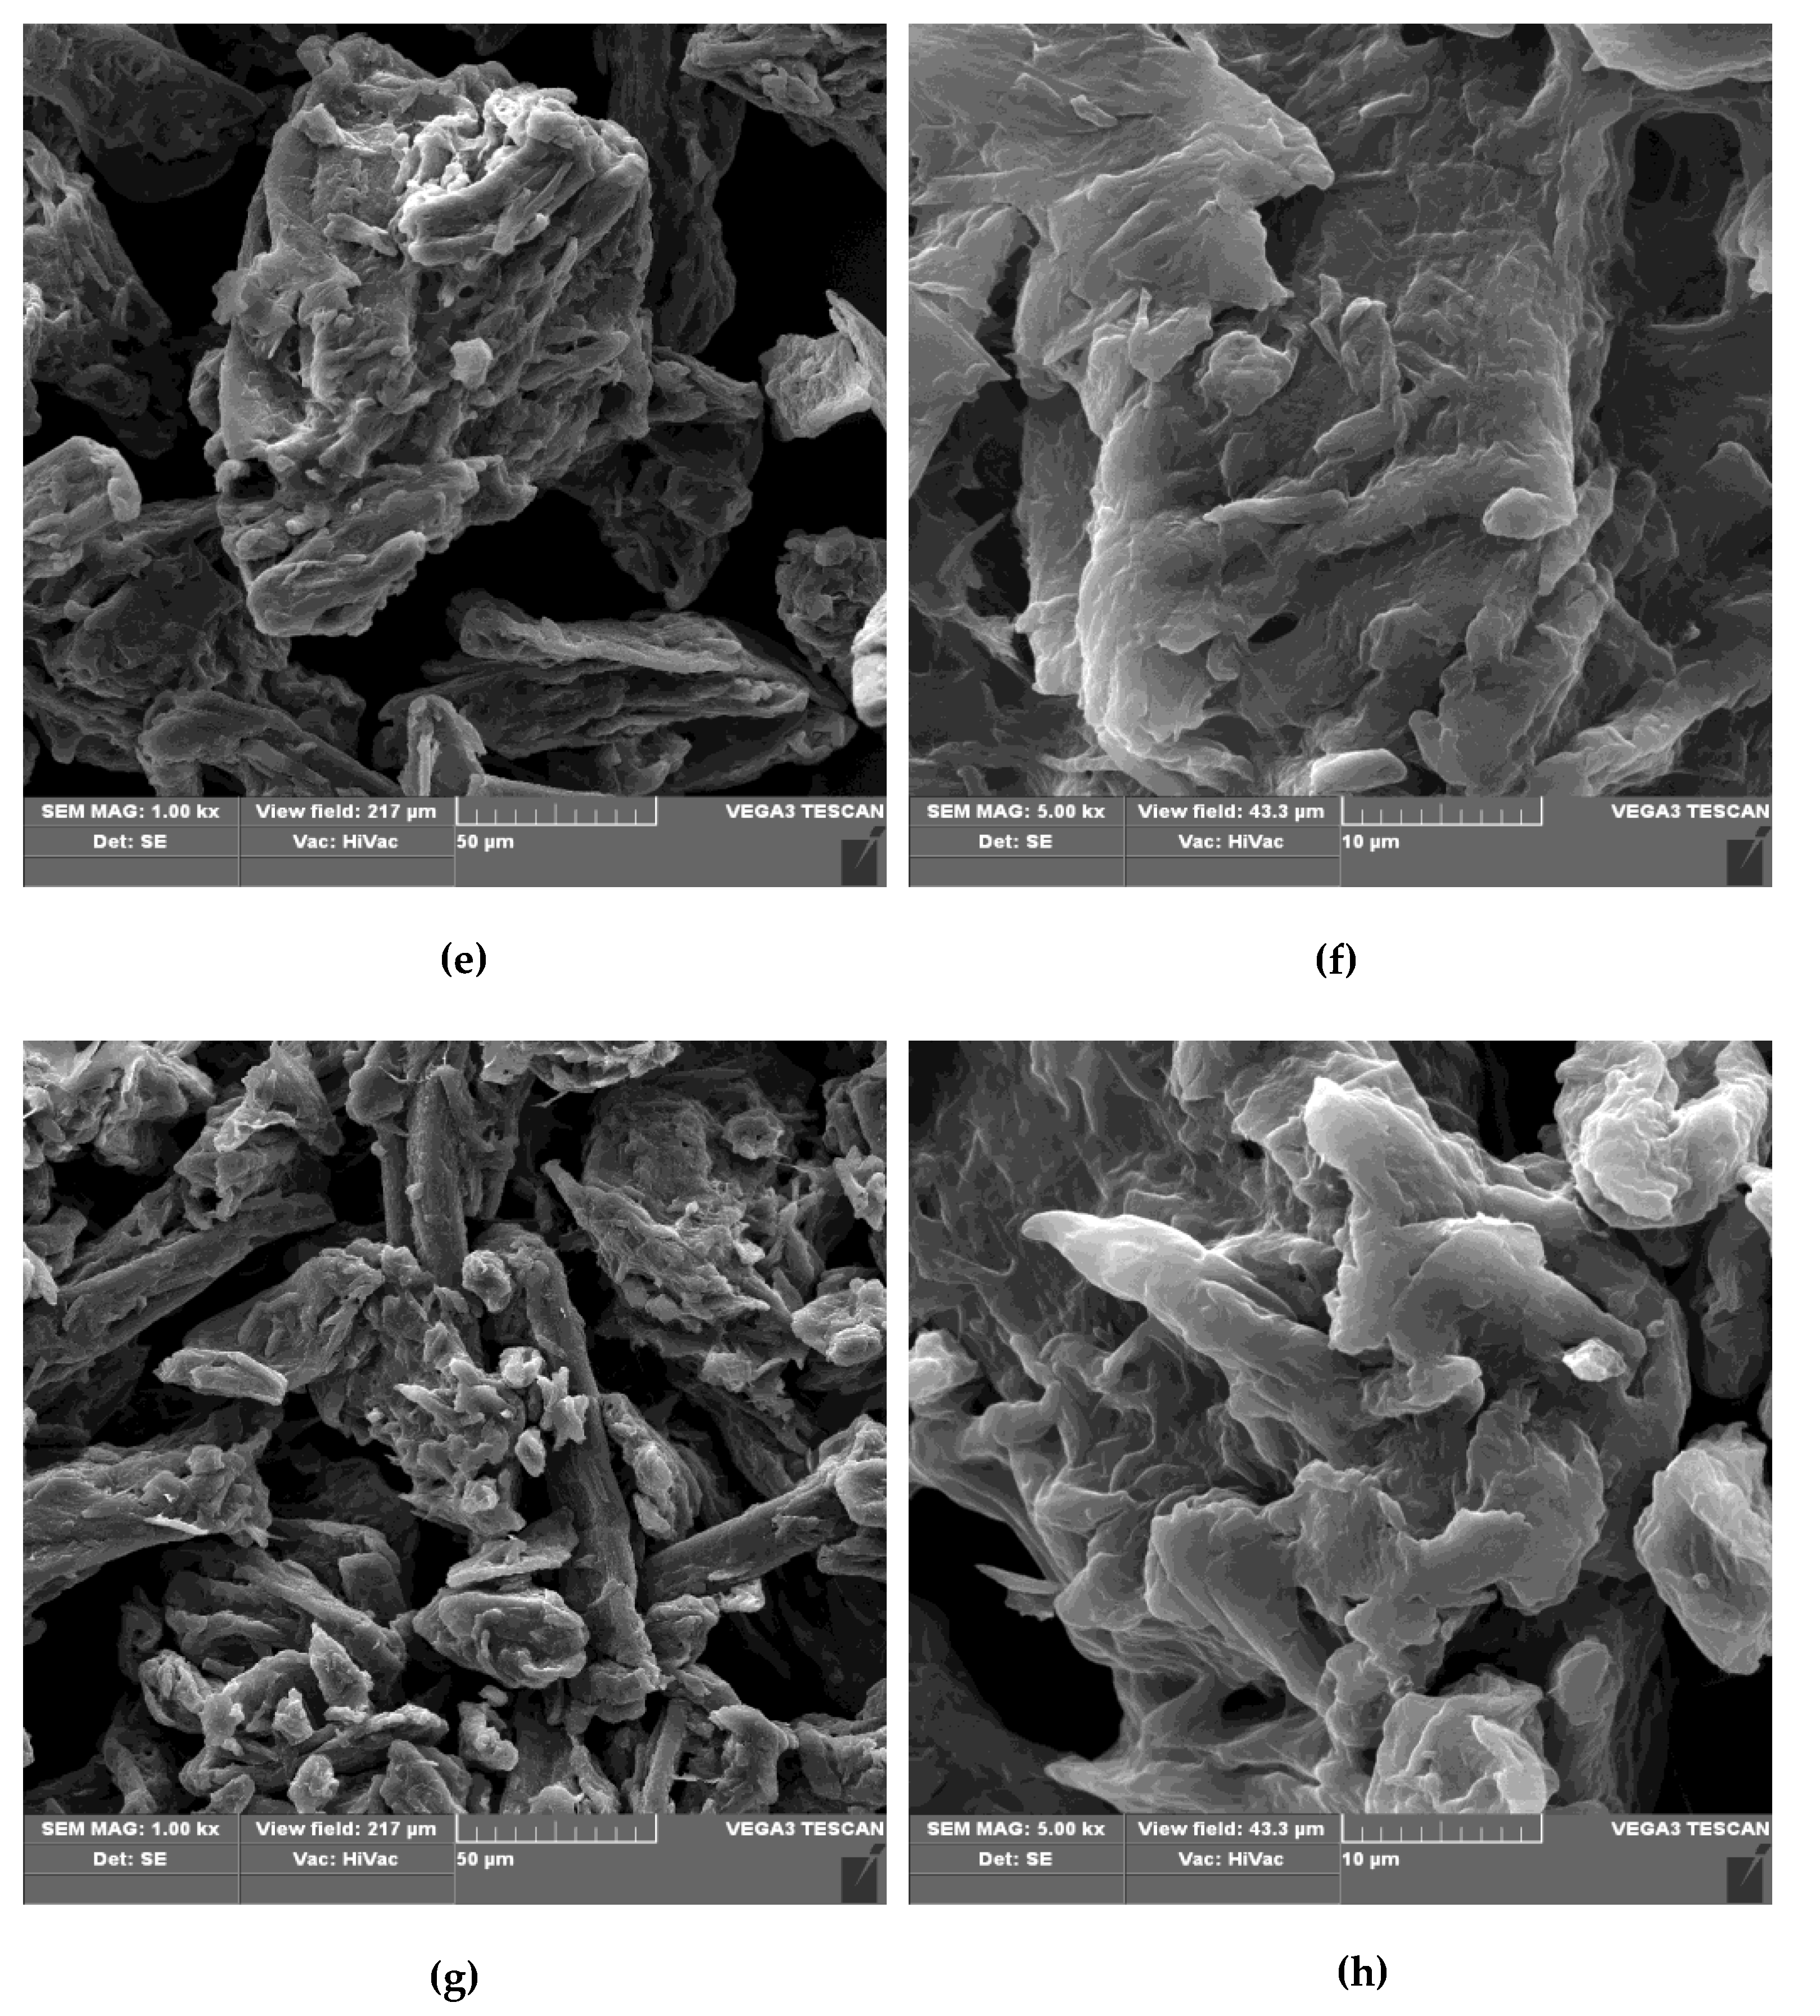
2.5. SEM—Scanning Electron Microscopy of Cellulose Phosphates

| No. | Fibre | Characterization | SEM [Image Magnification] | Ref |
|---|---|---|---|---|
| 1 | MCC (Avicel PH-101) | Nonfibrous nature and the presence of pinholes at its surface. | ×1000; ×5000 | [63] |
| CNF& Ac-CNF | Cellulose nanofibers and acetylated nanofibers | ×15,000 | [64] | |
| BC | Interwoven mesh of BC fibrils network; The average fibril diameter 71 nm | ×5000 | [57] | |
| BCC5 | Interwoven mesh of BC fibrils network; The average fibril diameter 107 nm | |||
| 2 | MCC | Rough surface morphology | ×1000 | [58] |
| MCC-P | Sponge-like surface character and compact structure | |||
| 3 | CNF | Cellulose nano fibers: diameter 0.5–1.0 µm | ×20,000 | [59] |
| CNF-P | ||||
| CNF/HAp | ||||
| 4 | BC | Cellulose nano fibers: diameter 2.25 µm | ×20,000 | [60] |
| BC-P | ||||
| BC-P/TiO2 | ||||
| 5 | KF | Cellulose fibers: diameter 20–25 µm | ×1000; ×2000 | [61] |
| KF-P | Cellulose fibers with holes; diameter 20–25 µm; |
- (a)
- the phosphorylation occurs on the surface HO-C6 group of cellulose and, therefore, does not disturb hydrogen bonds formed between adjacent cellulose chains in the starting cellulose;
- (b)
- the phosphorylation causes the substitution the polar HO group by even more polar -P(O)(OH)-H group with two groups able to form hydrogen bonds; and,
- (c)
- the phosphorylation takes place in ca. 2 AGU subunits in (AGU) 100 chains (DP = 0.018).
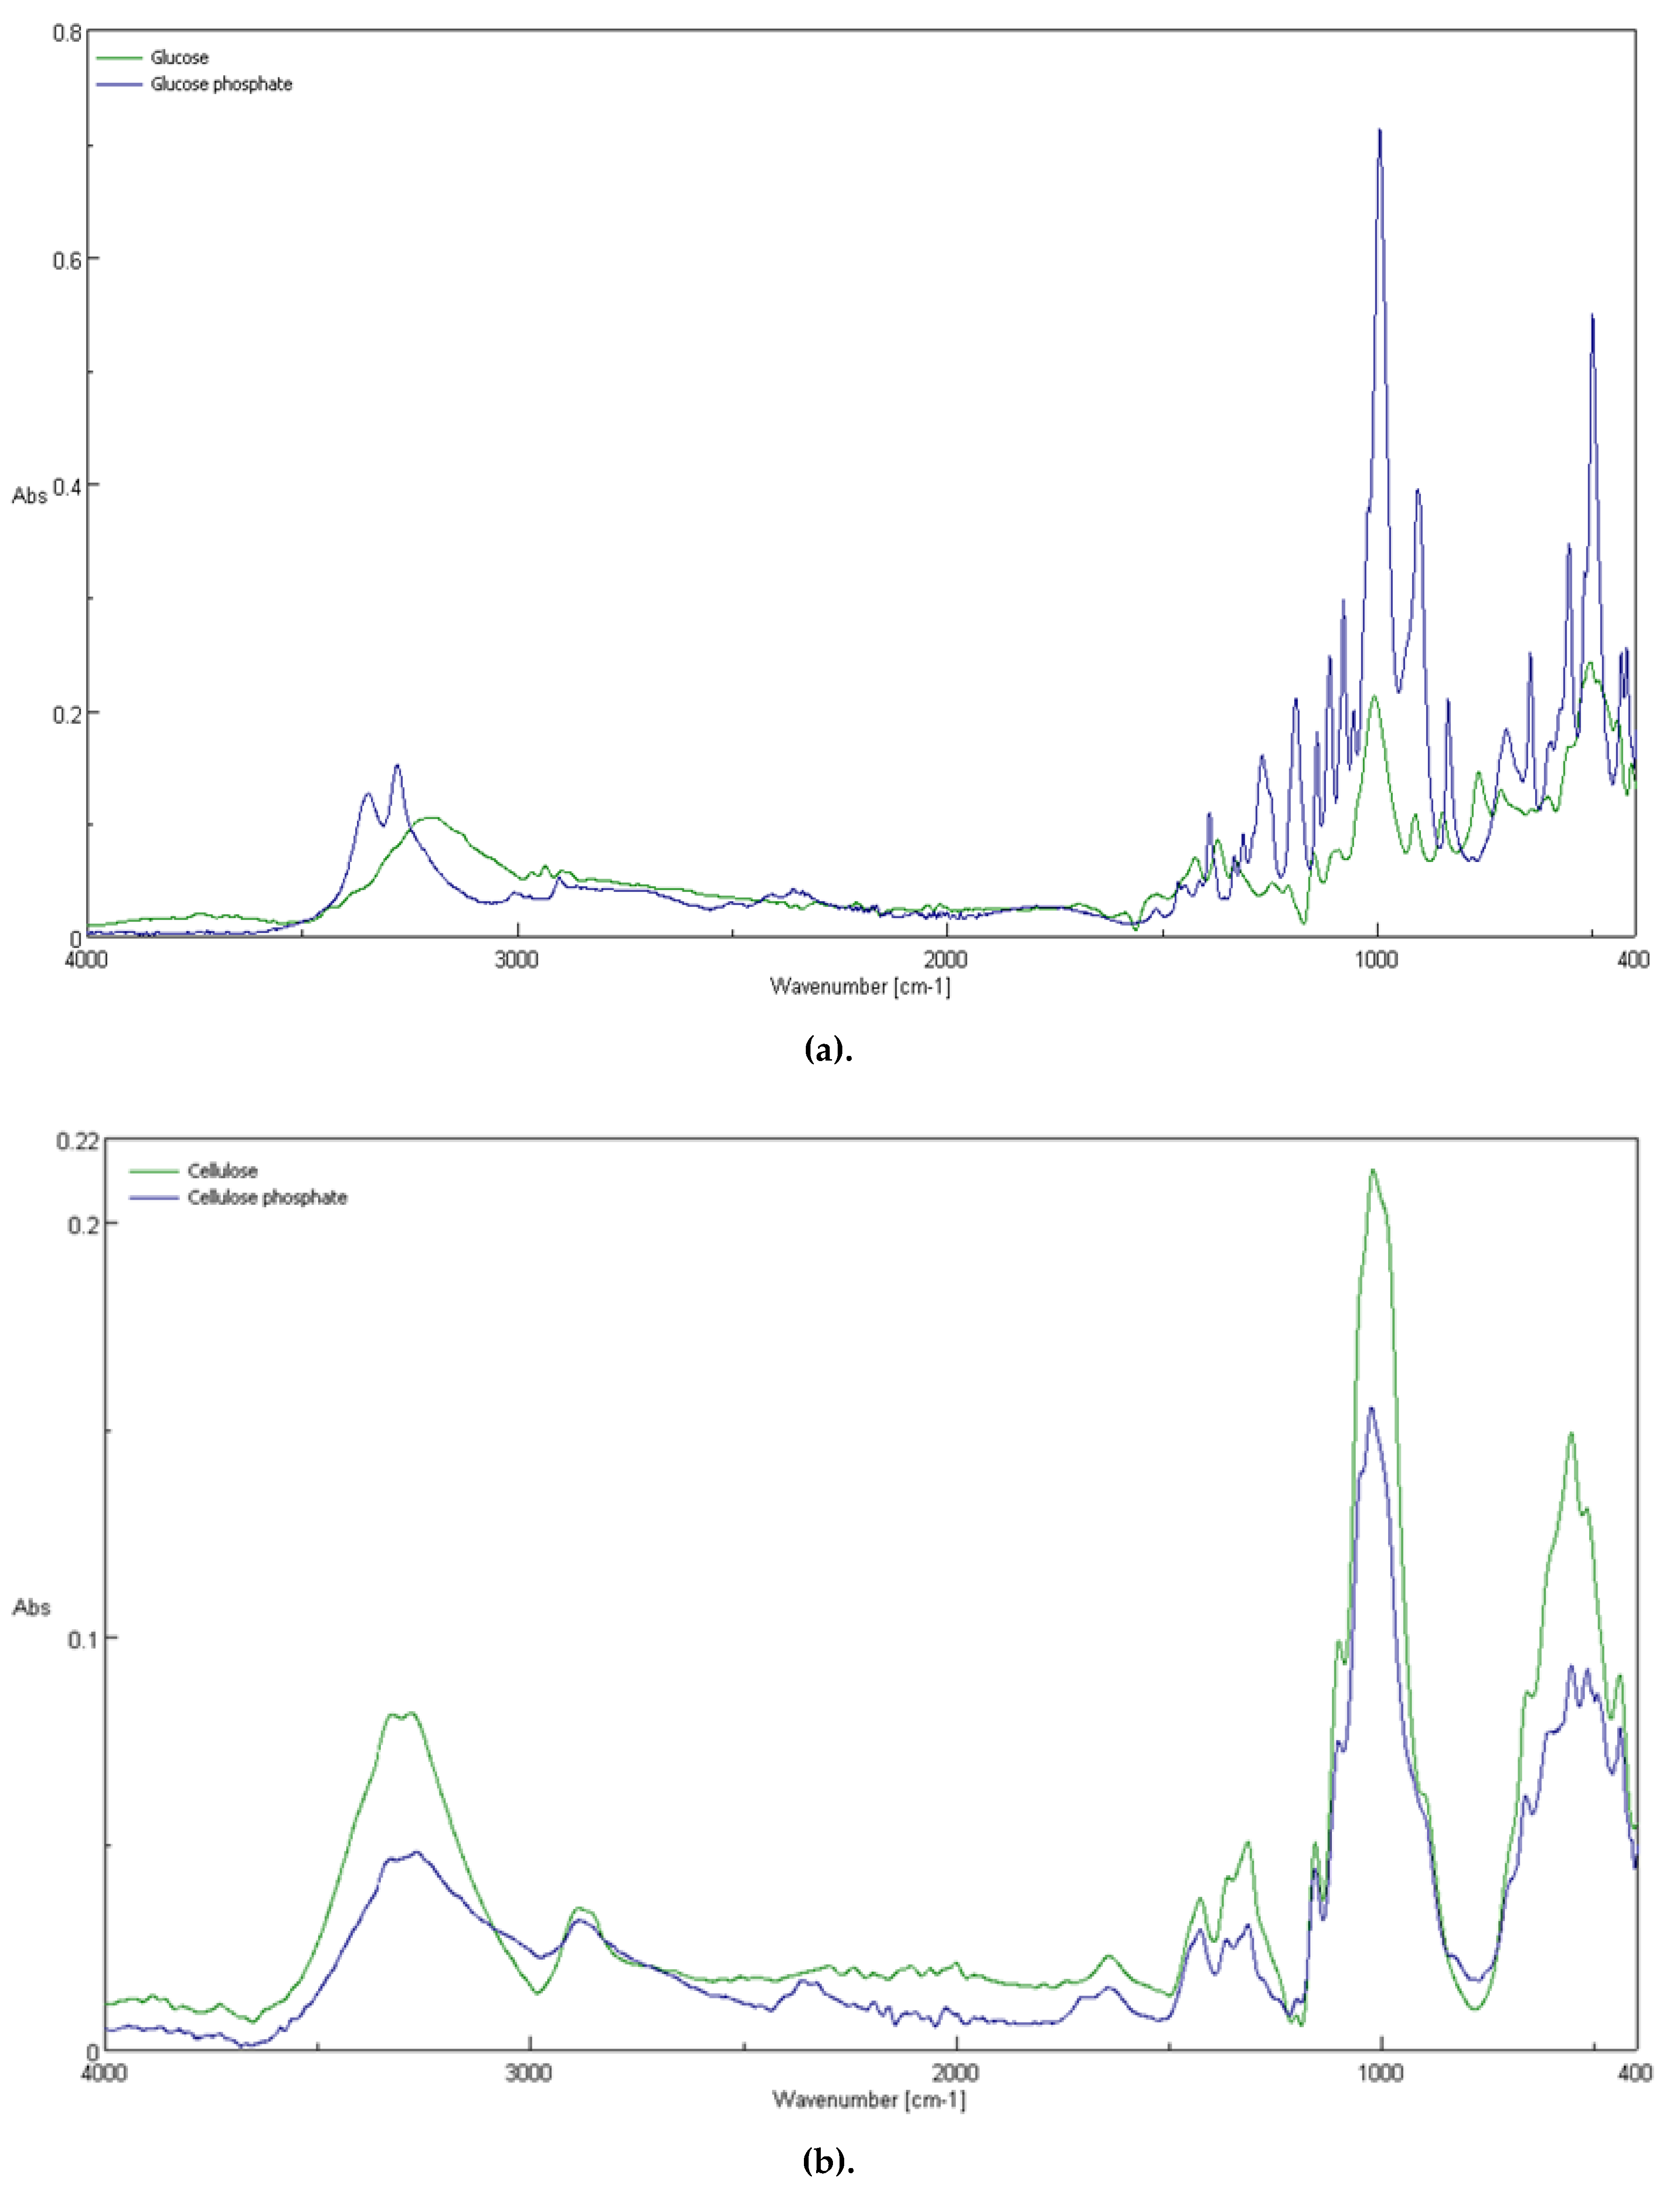
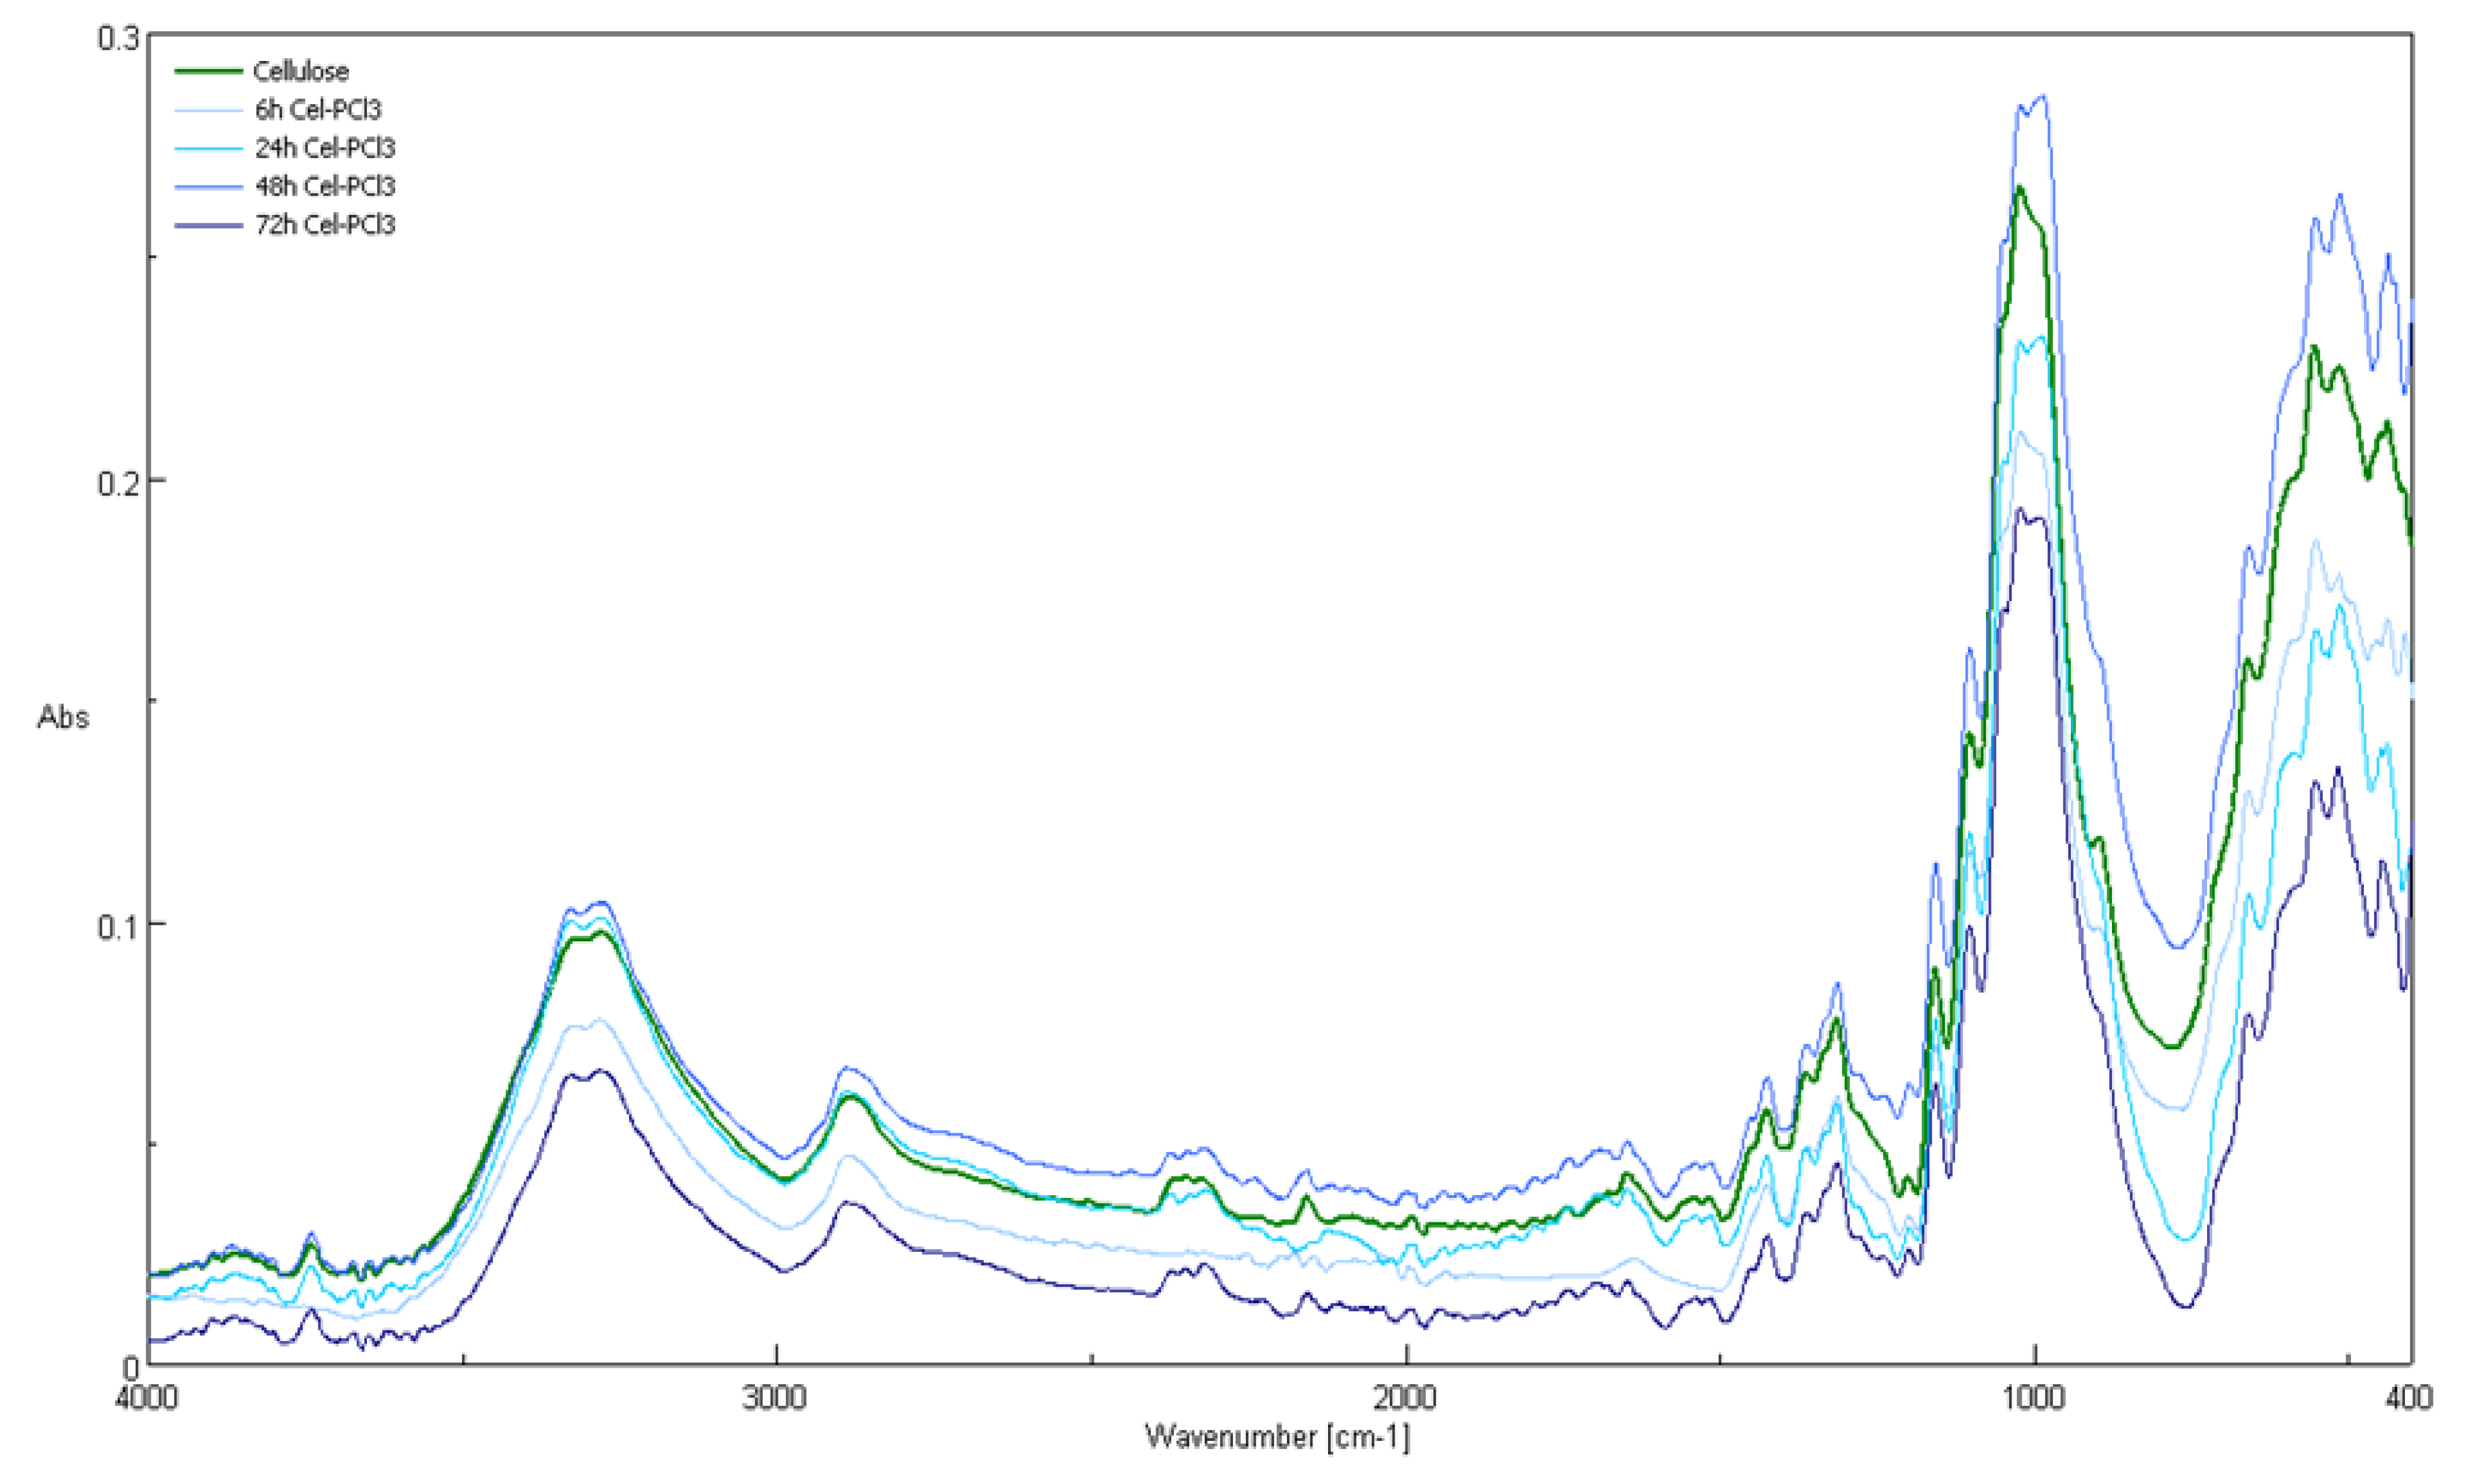
2.6. Attenuated Total Reflection Fourier Transform Infrared (ATR-FTIR) Spectroscopy
| Compound/Frequency [cm−1]. | Type of Vibrations | ||||
|---|---|---|---|---|---|
| Gluc-OH /a | Gluc-O6-P(O)(OH)2 | Cellulose (Avicell) | Cell-O6-P(O)(OH)-H | Cellulose-O-P(O)(OH)2 | |
| 3410, 3333 | 3360 | 3300 | 3300 | 3300 | intermolecularly bonded OH stretching mode |
| 2944, 2913 | 2930 | 2893 | 2893 | 2893 | C-H stretching |
| 2860 | symmetric vibration of C-H | ||||
| 2320 | P-H | ||||
| 1849 to 1634 | Vibrations of C=O | ||||
| 1450 | 1470 | bending vibration of CH | |||
| 1362 to 1191 | 1380 | 1429 | 1429 | 1429 | in-plane OH bend |
| 1370 | 1370 | 1370 | CH2 bending mode | ||
| 1250–1300 | 1250–1300 | 1250–1300 | P=O | ||
| 1120 | 1120 | 1120 | C-O-C asymmetric stretch | ||
| 1060 | 1060 | 1060 | C-C-O stretching mode | ||
| 1191 to 995 | 1000 | 1000 | 1000 | C-C stretching modes | |
| 893 | 893 | 893 | C1 group vibration | ||
| 670 | 670 | 670 | OH wagging | ||
| 520–600 | P(O)-H | ||||
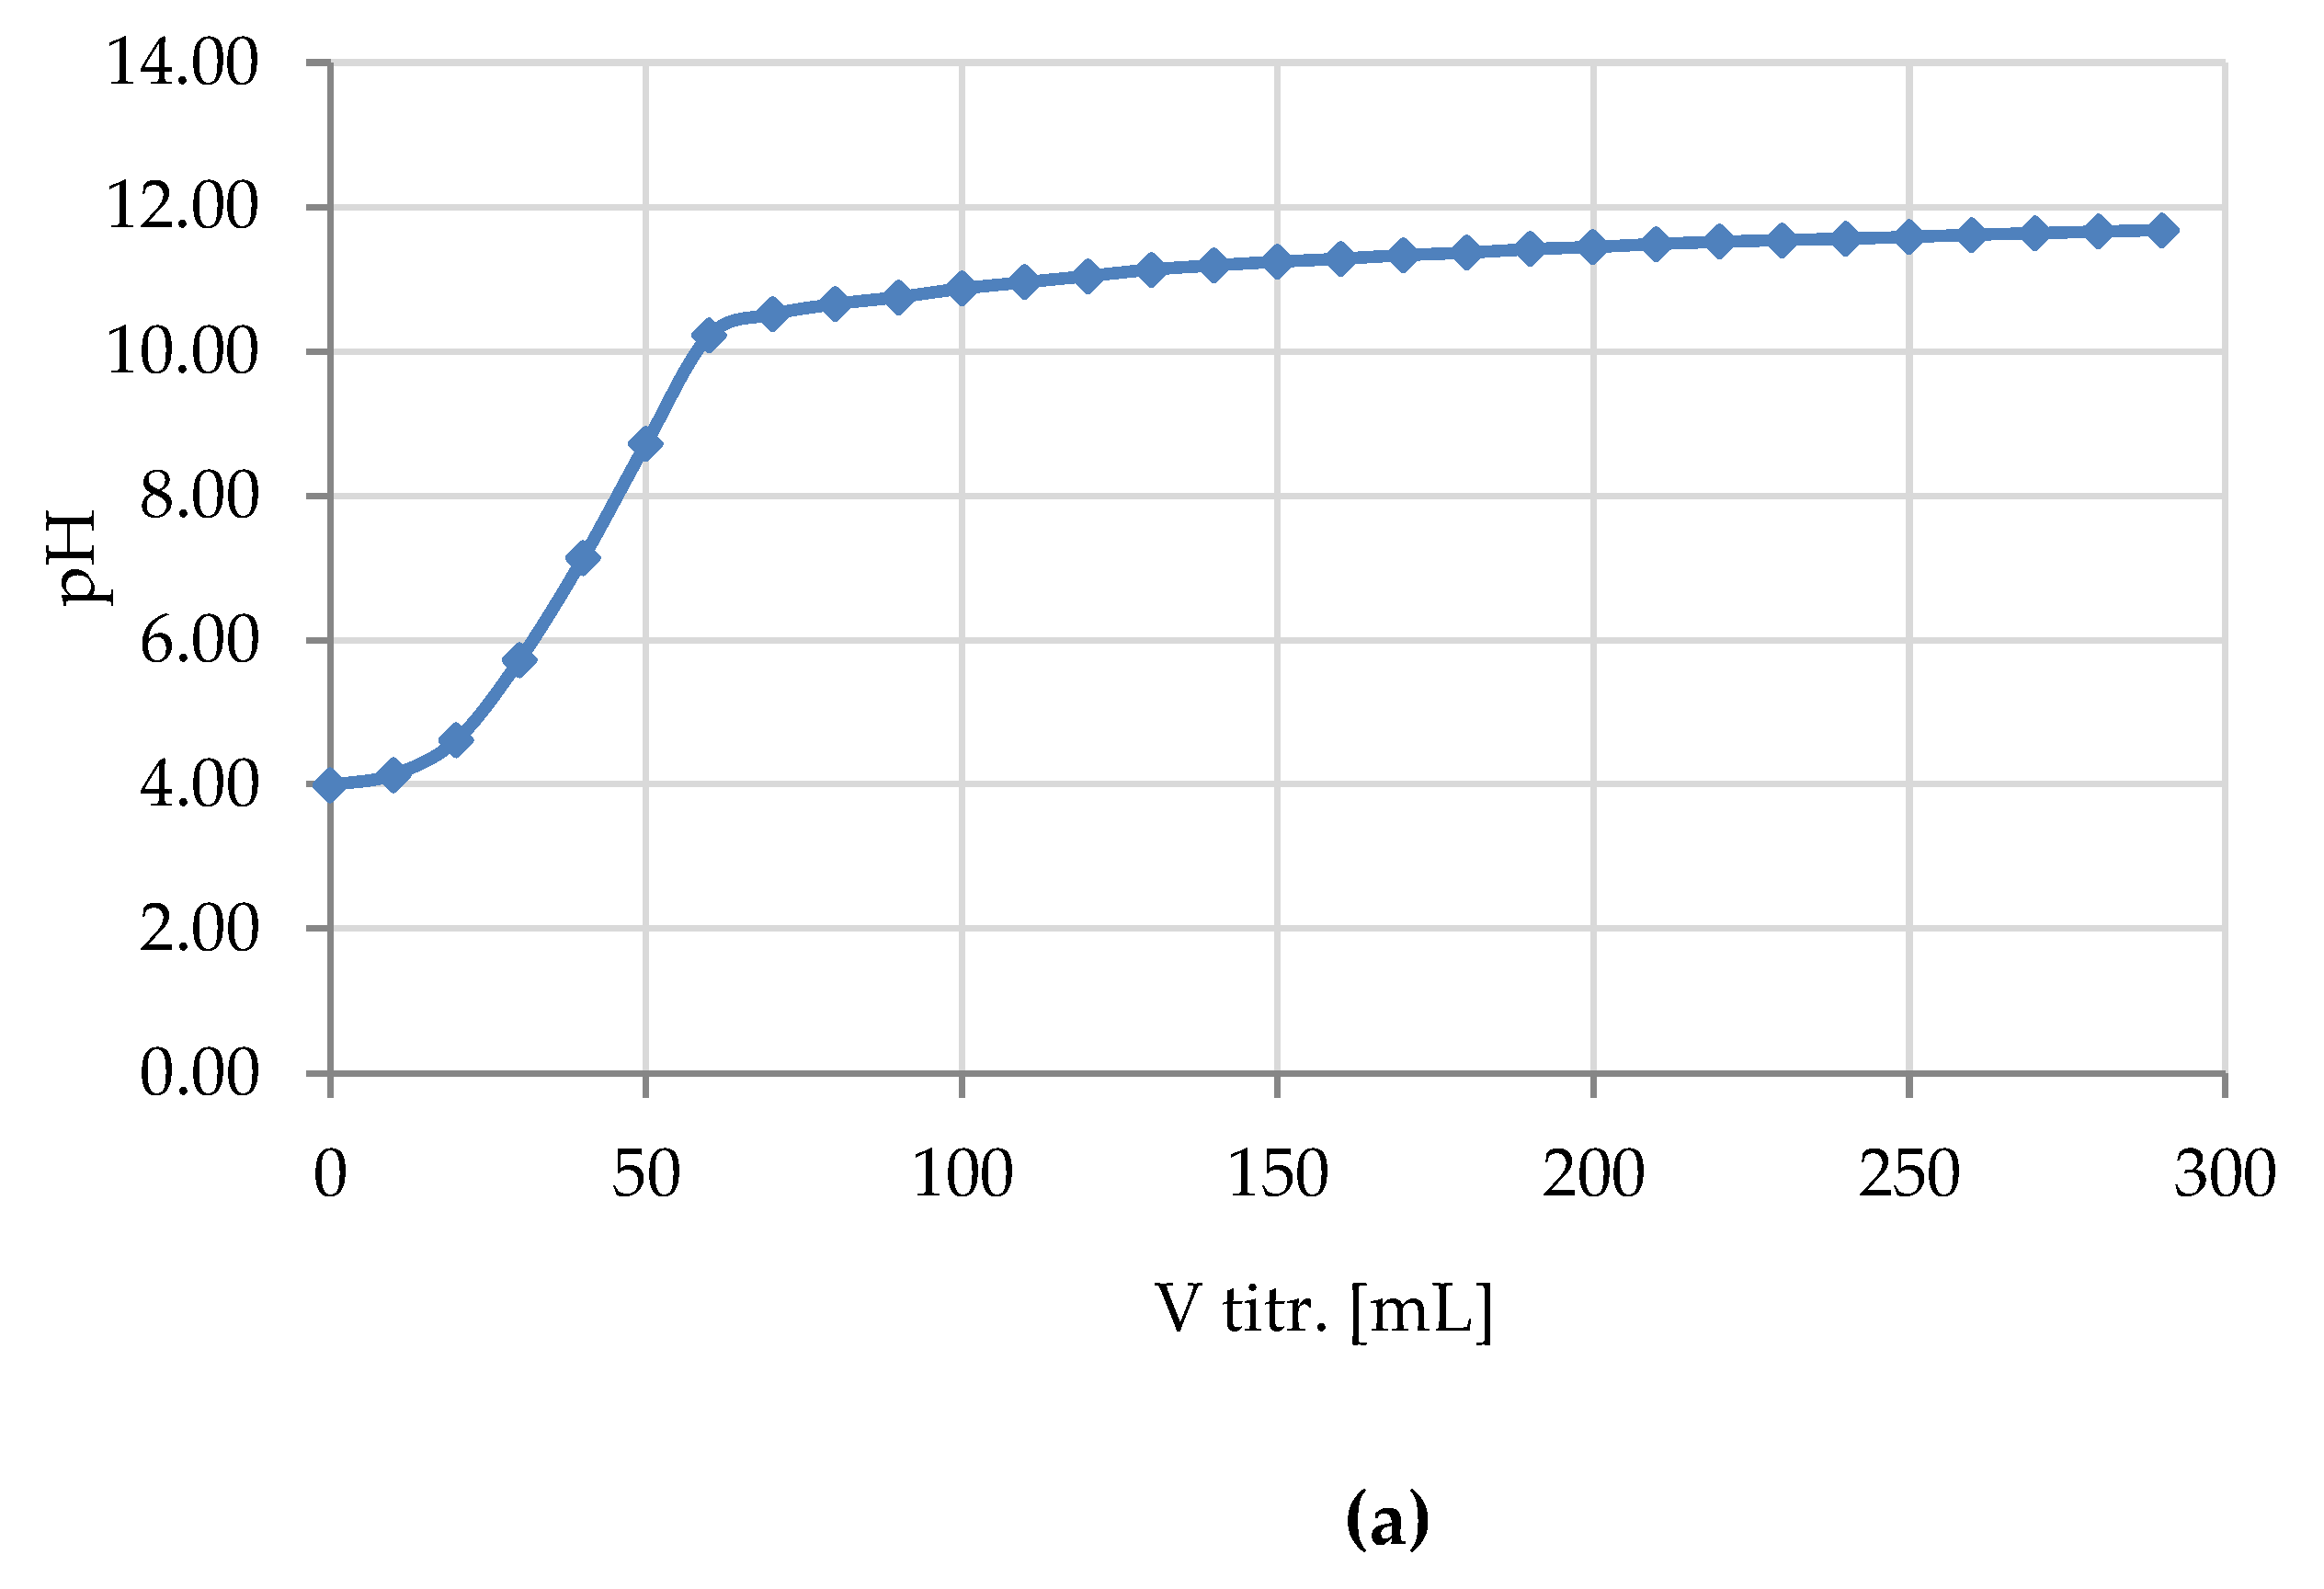
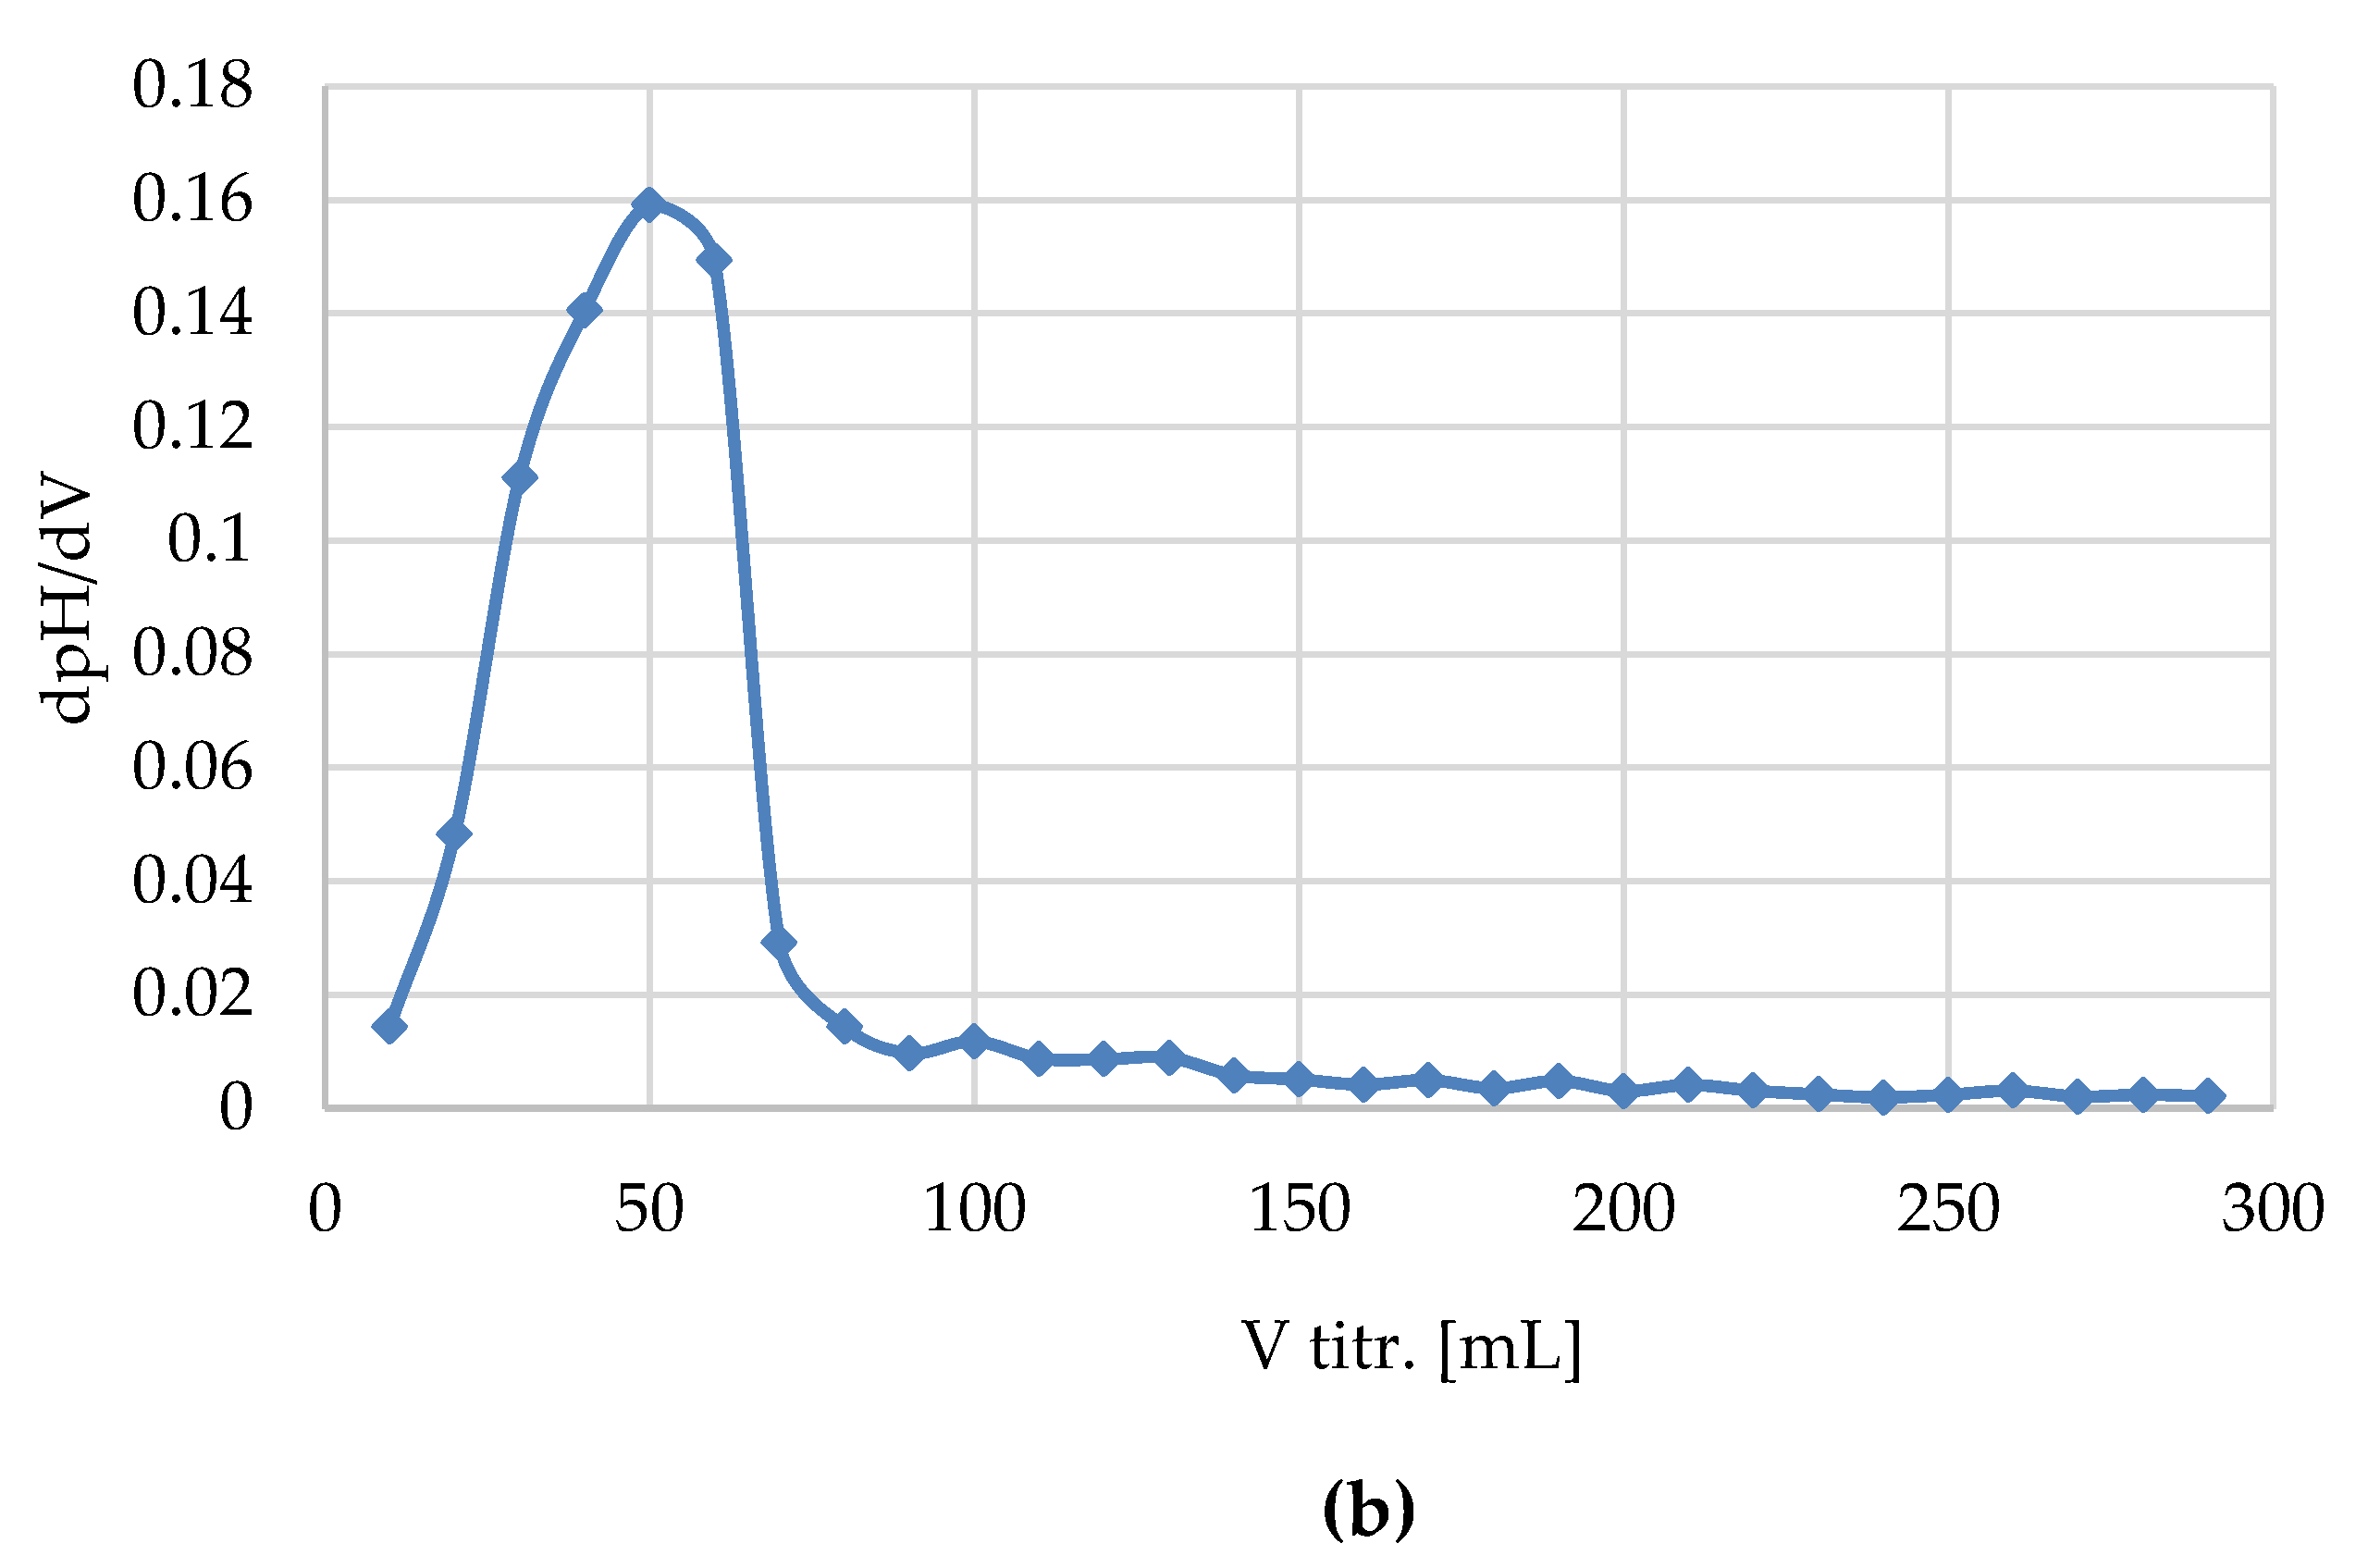
2.7. Alkalimetric Titration
2.8. Digestion of Samples Prior to Phosphorus and/or Copper Determination
2.9. Flame Atomic Absorption Spectroscopy FAAS
2.10. Specific Surface Area, Total Pore Volume and Average Pore Diameter Measurement
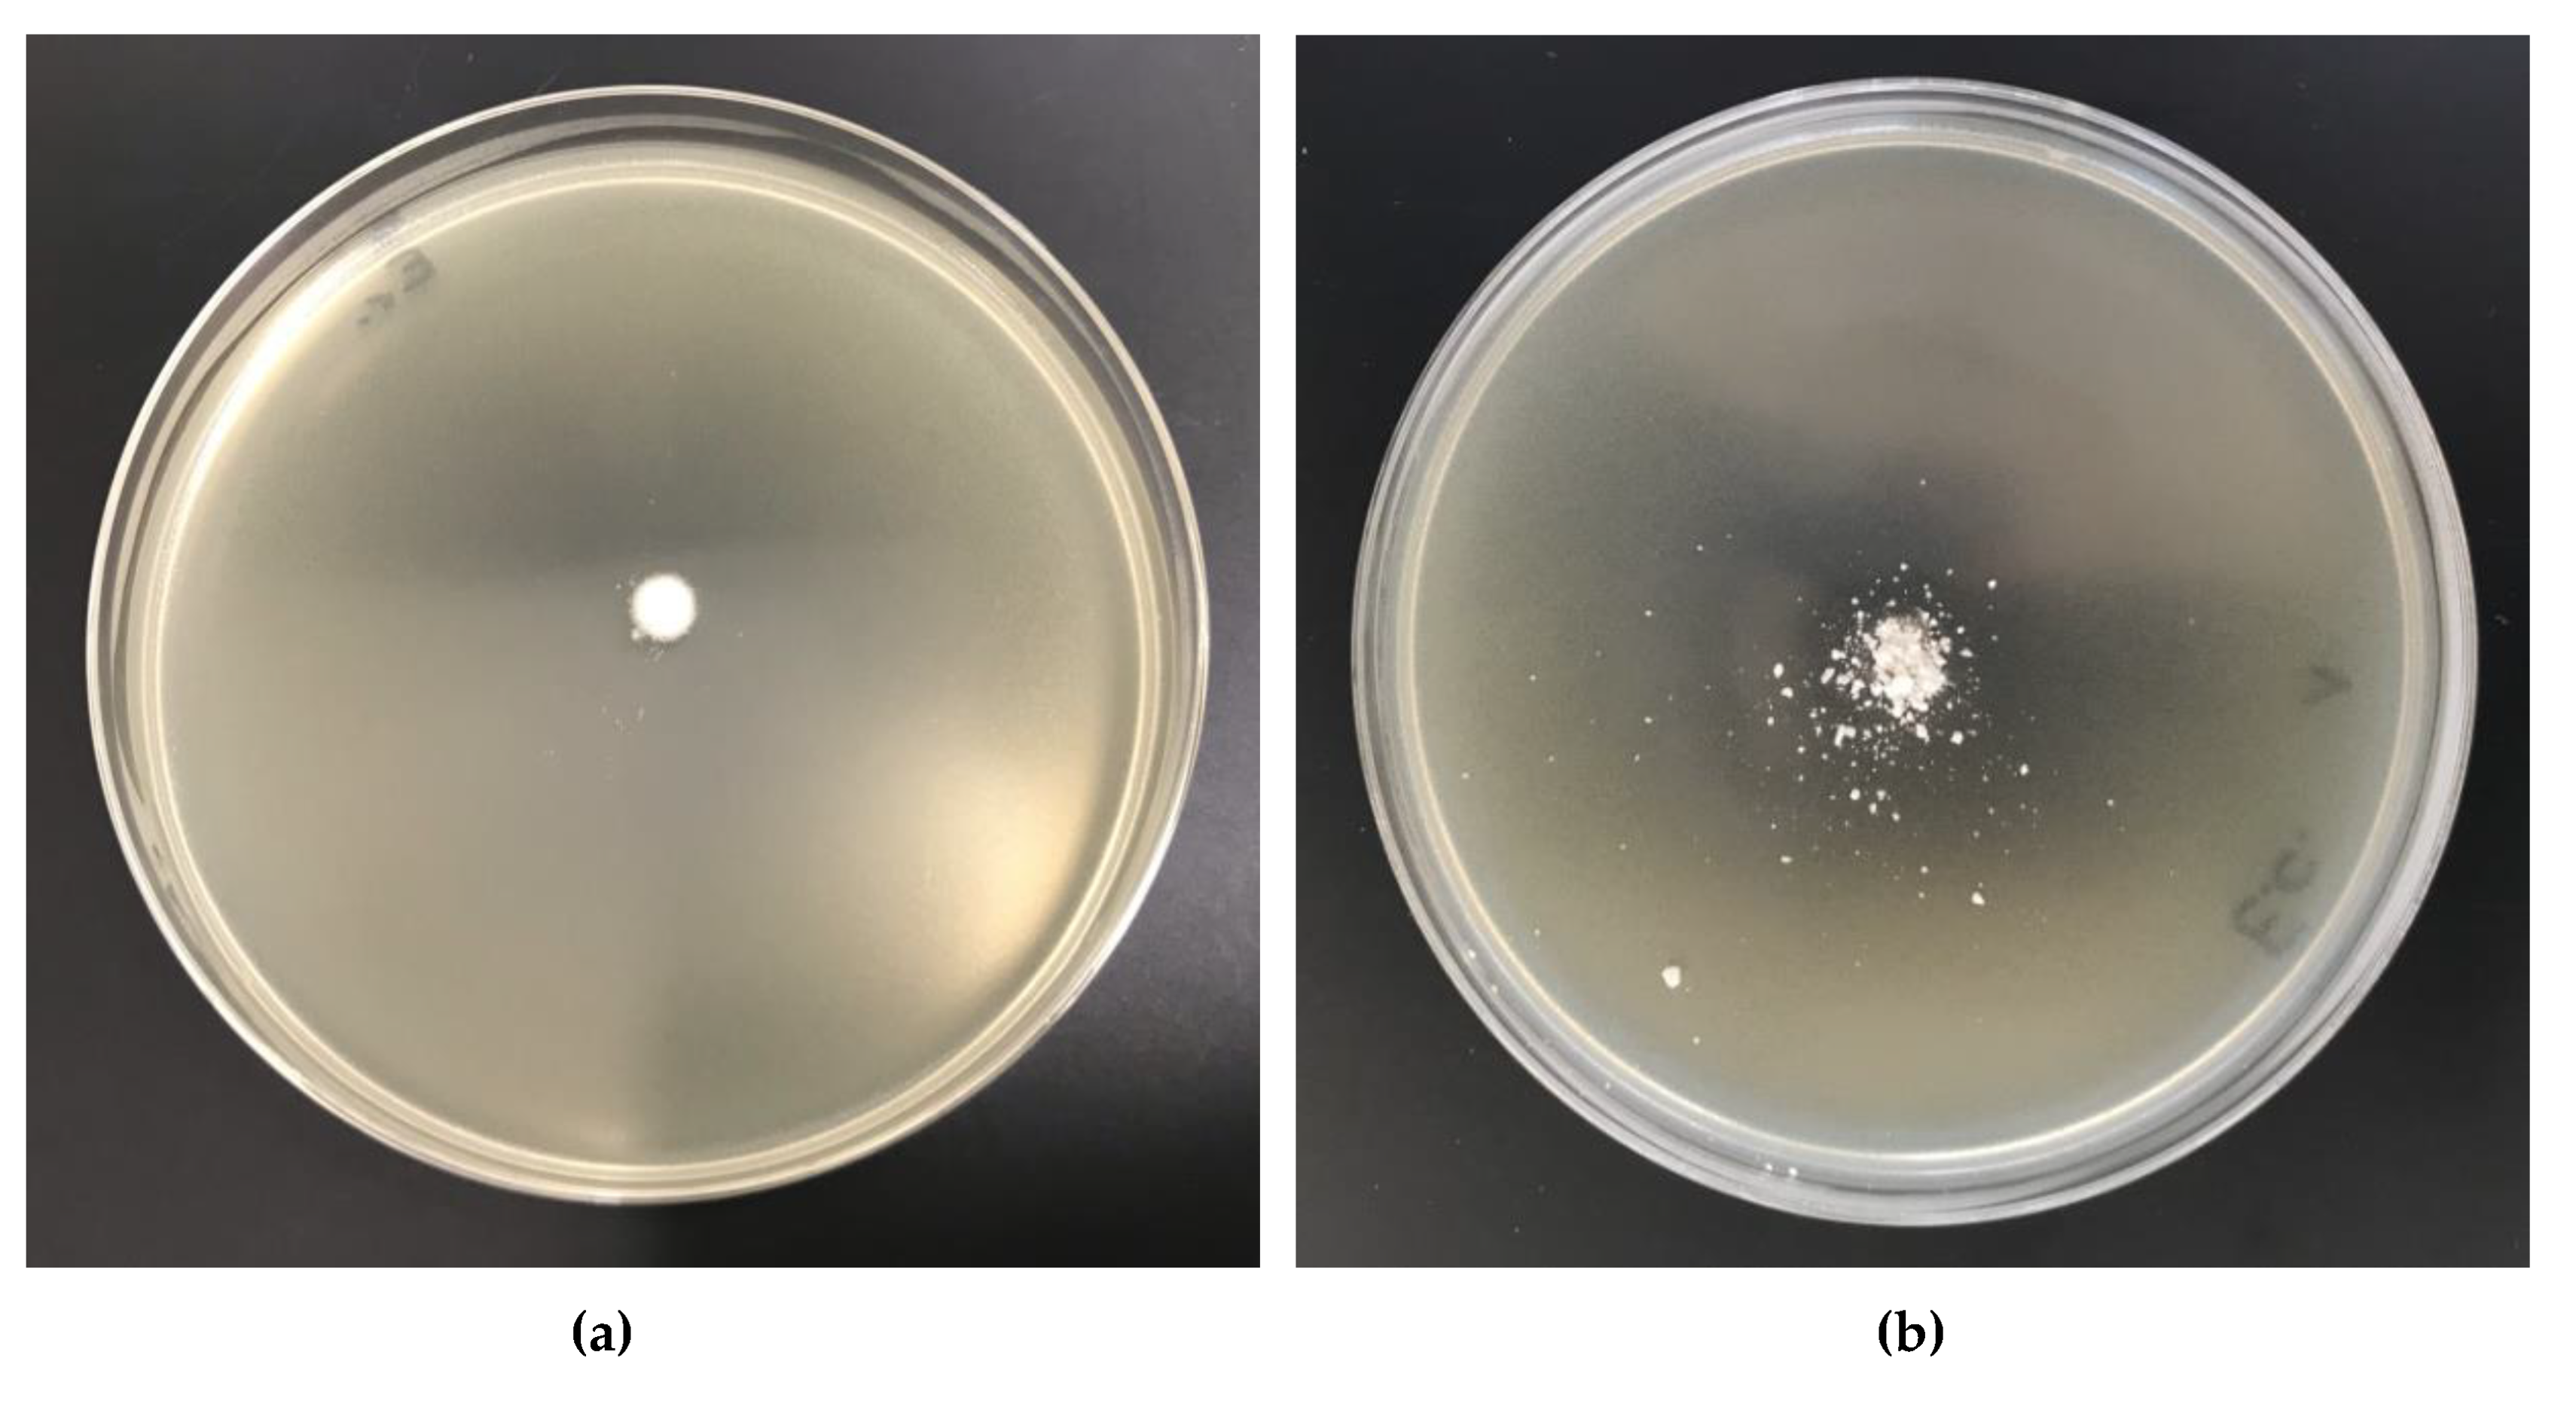
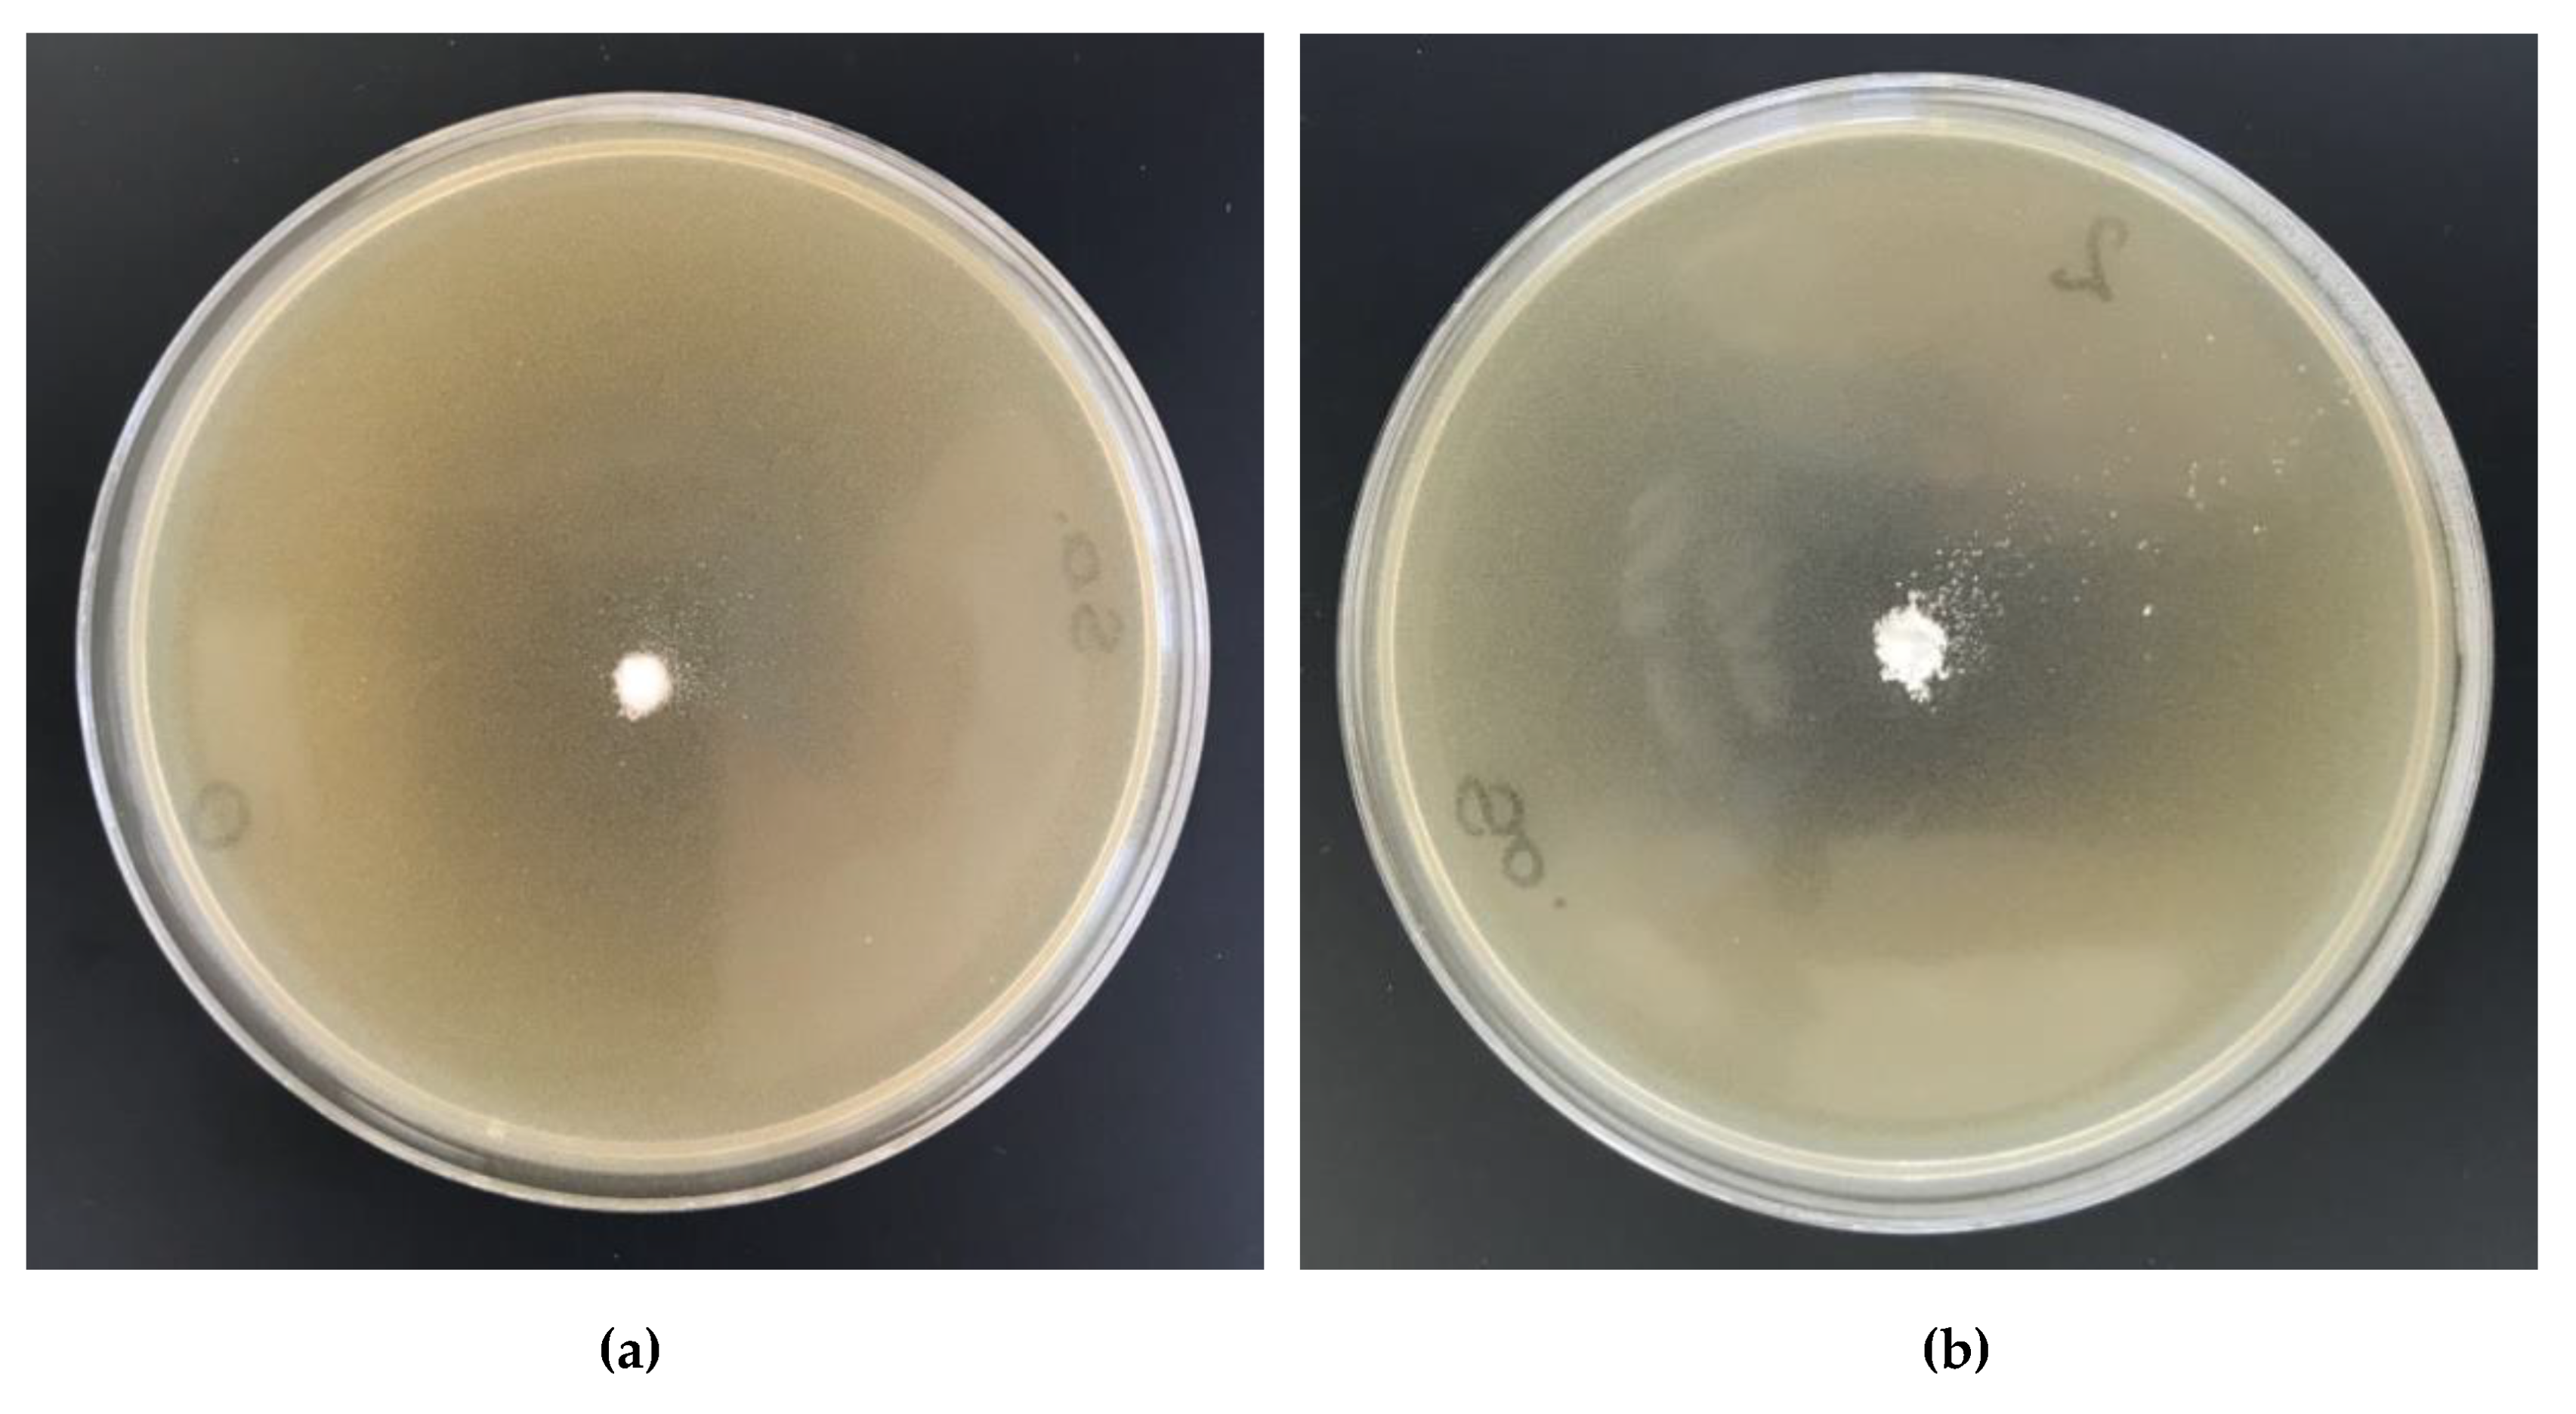
2.11. Antibacterial Activity
3. Materials and Methods
3.1. Materials
3.2. Methods
3.2.1. Specific Surface Area
3.2.2. SEM/EDS—Scanning Electron Microscopy/Energy-Dispersive X-ray Spectroscopy
3.2.3. ATR-FTIR—Attenuated Total Reflection Fourier Transform Infrared Spectroscopy
3.2.4. Potentiometric Titration of Cell-O6-P(O)(OH)-H
3.2.5. ICP-MS—Inductively Coupled Plasma Mass Spectrometry—Determination of Phosphorus by Means of Inductively Coupled Plasma Mass Spectrometry
3.2.6. Degradation of Cell-O6-P(O)(OH)-H
3.2.7. FAAS—Atomic Absorption Spectrometry with Flame Excitation
3.2.8. Microbial Activity
4. Conclusions
Supplementary Materials
Author Contributions
Funding
Data Availability Statement
Acknowledgments
Conflicts of Interest
References
- Klemm, D.; Heublein, B.; Fink, H.-P.; Bohn, A. Cellulose: Fascinating biopolymer and sustainable raw material. Angew. Chem. Int. Ed. 2005, 44, 3358–3393. [Google Scholar] [CrossRef]
- Belgacem, M.N.; Gandini, A. Surface Modification of CelluloseFibres. In Monomers, Polymers&Composites from RenewableResources; Belgacem, M.N., Gandini, A., Eds.; Elsevier: Amsterdam, The Netherlands, 2008; Chpt. 18; pp. 385–401. ISBN 9780080453163. [Google Scholar]
- Saitoh, K.; Ohno, H.; Matsuo, S. Structure and mechanical behavior of cellulose nanofiber and micro-fibrils by molecular dynamics simulation. SoftNanosci. Lett. 2013, 3, 58–67. [Google Scholar] [CrossRef]
- Rojas, O.J. (Ed.) Cellulose Chemistry and Properties: Fibers, Nanocelluloses and Advanced Materials; Springer International Publisher: Cham, Switzerland, 2016; Volume 271, ISBN 978-3-319-26015-0. [Google Scholar]
- Heinze, T.; Petzold, K. Cellulose Chemistry: Novel Products & Synthesis Paths. In Monomers, Polymers & Composites from Renewable Resources; Belgacem, M.N., Gandini, A., Eds.; Elsevier: Amsterdam, The Netherlands, 2008; Chpt. 16; pp. 343–369. ISBN 9780080453163. [Google Scholar]
- Dufresne, A. Cellulose-Based Composites & Nanocomposites. In Monomers, Polymers & Composites from Renewable Resources; Belgacem, M.N., Gandini, A., Eds.; Elsevier: Amsterdam, The Netherlands, 2008; Chpt. 19; pp. 401–419. ISBN 9780080453163. [Google Scholar]
- Klemm, D.; Kramer, F.; Moritz, S.; Lindstrom, T.; Ankerfors, M.; Gray, D.; Dorris, A. Nanocelluloses: A new family of nature-based materials. Angew. Chem. Int. Ed. 2011, 50, 5438–5466. [Google Scholar] [CrossRef] [PubMed]
- Lam, E.; Male, K.B.; Chong, J.H.; Leung, A.C.W.; Luong, J.H.T. Applications of functionalized and nanoparticle-modified nanocrystalline cellulose. Trends Biotechnol. 2012, 30, 283–291. [Google Scholar] [CrossRef]
- Thomas, B.; Raj, M.C.; Athira, B.K.; Rubiyah, M.H.; Joy, J.; Moores, A.; Drisko, G.L.; Sanchez, C. Nanocellulose, a versatile green platform: From biosources to materials and their applications. ChemicalReviews 2018, 118, 11575–11625. [Google Scholar] [CrossRef]
- Rol, F.; Belgacem, M.; Gandini, A.; Bras, J. Recentadvances in surface-modifiedcellulosenanofibrils. Prog. Polym. Sci. 2019, 88, 241–264. [Google Scholar] [CrossRef]
- Kostag, M.; Gericke, M.; Heinze, T.; El Seoud, O.A. Twenty-five years of cellulose chemistry: Innovations in the dissolution of the biopolymer and its transformation into esters and ethers. Cellulose 2019, 26, 139–184. [Google Scholar] [CrossRef]
- Teixeira, M.A.; Paiva, M.C.; Amorim, M.T.P.; Felgueira, H.P. Electrospun nanocomposites containing cellulose and its derivatives modified with specialized biomolecules for an enhanced wound healing. Nanomaterials 2020, 10, 557. [Google Scholar] [CrossRef] [Green Version]
- Illy, N.; Fache, M.; Menard, R.; Negrell, C.; Caillol, S.; David, G. Phosphorylation of bio-based compounds: The state of the art. Polym. Chem. 2015, 6, 6257–6291. [Google Scholar] [CrossRef] [Green Version]
- Blacklock, N.J.; Macleod, M.A. The effect of cellulose phosphate on intestinal absorption and urinary excretion of calcium: Some experience in its use in the treatment of calcium stone formation. Br. J. Urol. 1974, 46, 385–392. [Google Scholar] [CrossRef]
- Pak, C.Y.C. Clinical pharmacology of sodium cellulose phosphate. J. Clin. Pharmacol. 1979, 19, 451–457. [Google Scholar] [CrossRef] [PubMed]
- Lake, K.D.; Brown, D.C.; McLeod, D.C. New drug therapy for kidney stones: A review of cellulose sodium phosphate, acetohydroxamic acid, and potassium citrate. Ann. Pharmacother. 1985, 19, 510–519. [Google Scholar] [CrossRef]
- Horrocks, A.R.; Kandola, B.K.; Davies, P.J.; Zhang, S.; Padbury, S.A. Developments in flame retardant textiles—A review. Polym. Degrad. Stab. 2005, 88, 3–12. [Google Scholar] [CrossRef]
- Ghanadpour, M.; Carosio, F.; Larsson, P.T.; Wagberg, L. Phosphorylated cellulose nanofibrils: A renewable nanomaterial for the preparation of intrinsically flame-retardant materials. Biomacromolecules 2015, 16, 3399–3410. [Google Scholar] [CrossRef] [PubMed]
- Schmitt, D.H.; Fritz, J.S. Metal ion separations using cellulose phosphate as an ion-exchanger. Talanta 1968, 15, 515–524. [Google Scholar] [CrossRef]
- Kabay, N.; Demircioglu, M.; Yayli, S.; Yuksel, M.; Saglam, M.; Levison, P.R. Removal of metal ions from aqueous solution by cellulose ion exchangers. Sep. Sci. Technol. 1999, 34, 41–51. [Google Scholar] [CrossRef]
- Mautner, A.; Maples, H.A.; Kobkeatthawin, T.; Kokol, V.; Karim, Z.; Li, K.; Bismarck, A. Phosphorylated nanocellulose papers for copper adsorption from aqueous solutions. Int. J. Environ. Sci. Technol. 2016, 13, 1861–1872. [Google Scholar] [CrossRef] [Green Version]
- Peterson, E.A.; Sober, H. Column chromatography of proteins: Substituted celluloses. Methods Enzymol. 1962, 5, 3–27. [Google Scholar] [CrossRef]
- Padilha, P.M.; Rocha, C.; Moreira, C.; Campos, T.S.; Federici, C. Preconcentration of heavy metals ions from aqueous solutions by means of cellulose phosphate: An application in water analysis. Talanta 1997, 45, 317–323. [Google Scholar]
- Granja, P.L.; Pouysegu, L.; Deffieux, D.; Daude, G.; De Jeso, B.; Labrugere, C.; Baquey, C.; Barbosa, M.A. Cellulose phosphates as biomaterials. II. Surface chemical modification of regenerated cellulose hydrogels. J. Appl. Polym. Sci. 2001, 82, 3354–3365. [Google Scholar] [CrossRef]
- Edwards, J.V.; Howley, P.S. Human neutrophil elastase and collagenase sequestration with phosphorylated cotton wound dressings. J. Biomed. Mater. Res. 2007, 83A, 446–454. [Google Scholar] [CrossRef]
- Mucalo, M.R.; Kato, K.; Yokogawa, Y. Phosphorylated, cellulose-based substrates as potential adsorbents for bone morphogenetic proteins in biomedical applications: A protein adsorption screening study using cytochrome C as a bone morphogenetic protein mimic. Colloids Surf. B. 2009, 71, 52–58. [Google Scholar] [CrossRef] [PubMed]
- Bezerra, R.D.S.; Silva, M.M.F.; Morais, A.I.S.; Osajima, J.A.; Santos, M.R.M.C.; Airoldi, C.; Filho, E.C.S. Phosphated cellulose as an efficient biomaterial for aqueous drug ranitidine removal. Materials 2014, 7, 7907–7924. [Google Scholar] [CrossRef] [Green Version]
- Bezerra, R.D.S.; Morais, A.I.S.; Osajima, J.A.; Nunes, L.C.C.; Filho, E.C.S. Development of new phosphated cellulose for application as an efficient biomaterial for the incorporation/release of amitriptyline. Int. J. Biol. Macromol. 2016, 86, 362–375. [Google Scholar] [CrossRef] [PubMed]
- Dahiya, J.B.; Rana, S. Thermal degradation and morphological studies on cotton cellulose modified with various arylphosphorodichloridites. Polym. Int. 2004, 53, 995–1002. [Google Scholar] [CrossRef]
- Petreus, O.; Bubulac, T.; Petreus, I.; Georgeta Cazacu, G. Reactions of some phosphorus compounds with cellulose dissolved in aqueous alkaline solution. J. Appl. Polym. Sci. 2003, 90, 327–333. [Google Scholar] [CrossRef]
- Inagaki, N.; Nakamura, S.; Asai, H.; Katsuura, K. Phosphorylation of cellulose with phosphorous acid and thermal degradation of the product. J. Appl. Polym. Sci. 1976, 20, 2829–2836. [Google Scholar] [CrossRef]
- Suflet, D.M.; Chitanu, G.C.; Popa, V.I. Phosphorylation of polysaccharides: New results on synthesis and characterization of phosphorylated cellulose. React. Funct. Polym. 2006, 66, 1240–1249. [Google Scholar] [CrossRef]
- Petreus, T.; Stoica, B.A.; Petreus, O.; Goriuc, A.; Cotrutz, C.E.; Antoniac, I.-V.; Barbu-Tudoran, L. Preparation and cytocompatibility evaluation for hydrosoluble phosphorous acid-derivatized cellulose as tissue engineering scaffold material. J. Mater. Sci. Mater. Med. 2014, 25, 1115–1127. [Google Scholar] [CrossRef]
- Gospodinova, N.; Grelard, A.; Jeannin, M.; Chitanu, G.C.; Carpov, A.; Thiéry, V.; Besson, T. Efficient solvent-free micro wave phosphorylation of micro crystalline cellulose. Green Chem. 2002, 4, 220–222. [Google Scholar] [CrossRef]
- Kudzin, Z.H.; Kudzin, M.H.; Drabowicz, J.; Stevens, C.V. Aminophosphonic acids-phosphorus analogues of natural amino acids. Part 1: Syntheses of α-aminophosphonic acids. Curr. Org. Chem. 2011, 15, 2015–2071. [Google Scholar] [CrossRef]
- Drabowicz, J.; Jakubowski, H.; Kudzin, M.H.; Kudzin, Z.H. Nomenclature of aminoalkylphosphonic acids and derivatives. Evolution of the code system. Acta Biochim. Polon. 2015, 62, 139–150. [Google Scholar] [CrossRef] [PubMed]
- Kudzin, M.H.; Mrozińska, Z.; Walawska, A.; Sójka-Ledakowicz, J. Biofunctionalization of textile materials. 1. Biofunctionalization of poly(propylene) (PP) nonwovens fabrics by Alafosfalin. Coatings 2019, 9, 412. [Google Scholar] [CrossRef] [Green Version]
- Kudzin, M.H.; Mrozińska, Z. Biofunctionalization of textile materials. 2. Antimicrobial modification of poly(lactide) (PLA) nonwoven fabrics by fosfomycin. Polymers 2020, 12, 768. [Google Scholar] [CrossRef] [Green Version]
- Reid, D.J.; Mazzeno, L.W.; Buras, E.M. Composition of two types of cellulose phosphates. Ind. Eng. Chem. 1949, 41, 2831–2834. [Google Scholar] [CrossRef]
- Granja, P.L.; Pouysegu, L.; Petraud, M.; De Jeso, B.; Baquey, C.; Barbosa, M.A. Cellulose phosphates as biomaterials. I. Synthesis and characterization of highly phosphorylated cellulose gels. J. Appl. Polym. Sci. 2001, 82, 3341–3353. [Google Scholar] [CrossRef]
- Kokol, V.; Bozic, M.; Vogrincic, R.; Mathew, A.P. Characterisation and properties of homo- and heterogenously phosphorylated nanocellulose. Carbohyd. Polym. 2015, 125, 301–313. [Google Scholar] [CrossRef] [PubMed]
- Swatloski, R.P.; Spear, S.K.; Holbrey, J.D.; Rogers, R.D. Dissolution of cellulose with ionic liquids. J. Am. Chem. Soc. 2002, 124, 4974–4975. [Google Scholar] [CrossRef] [PubMed]
- Fox, S.C.; Li, B.; Xu, D.; Edgar, K.J. Regioselective esterification and etherification of cellulose: A Review. Biomacromolecules 2011, 12, 1956–1972. [Google Scholar] [CrossRef]
- Huang, Y.B.; Xin, P.P.; Li, J.X.; Shao, Y.Y.; Huang, C.B.; Pan, H. Room-temperature dissolution and mechanistic investigation of cellulose in a tetra-butylammonium acetate/dimethyl sulfoxide system. ACS Sustain. Chem. Eng. 2016, 4, 2286–2294. [Google Scholar] [CrossRef]
- Ferreira, D.C.; Oliveira, M.L.; Bioni, T.A.; Nawaz, H.; King, A.W.T.; Kilpelainen, I.; Hummel, M.; Sixta, H.; El Seoud, O.A. Binary mixtures of ionic liquids-DMSO as solvents for the dissolution and derivatization of cellulose: Effects of alkyl and alkoxy side chains. Carbohydr. Polym. 2019, 212, 206–214. [Google Scholar] [CrossRef] [Green Version]
- El Seoud, O.A.; Kostag, M.; Jedvert, K.; Malek, N.J. Cellulose in ionic liquids and alkaline solutions: Advances in the mechanisms of biopolymer dissolution and regeneration. Polymers 2019, 11, 1917. [Google Scholar] [CrossRef] [Green Version]
- Lethesh, K.C.; Evjen, S.; Venkatraman, V.; Shah, S.N.; Fiksdahl, A. Highly efficient cellulose dissolution by alkaline ionic liquids. Carbohyd. Polym. 2020, 229, 115594. [Google Scholar] [CrossRef]
- Rieland, J.M.; Love, B.J. Ionic liquids: A milestone on the pathway to greener recycling of cellulose from biomass. Resour. Conserv. Recycl. 2020, 155, 104678. [Google Scholar] [CrossRef]
- Bodachivskyi, I.; Page, C.J.; Kuzhiumparambil, U.; Hinkley, S.F.R.; Sims, I.M.; Williams, D.B.G. Dissolution of Cellulose: Are Ionic Liquids Innocent or Noninnocent Solvents? ACS Sustain. Chem. Eng. 2020, 8, 10142–10150. [Google Scholar] [CrossRef]
- Scopus Base. 3.376 Document Results on Cellulose NMR Spectroscopy. Available online: https://www-1scopus-1com-10000148n0bd1.han.p.lodz.pl/results/results.uri?src=s&st1=&st2=&sot=b&sdt=b&origin=searchbasic&rr=&sl=42&s=TITLE-ABS-KEY%20(cellulose%20NMR%20spectroscopy) (accessed on 25 January 2021).
- Scopus Base. 812 Document Results on Cellulose Solid State NMR Spectroscopy. Available online: https://www-1scopus-1com-10000148n0bd1.han.p.lodz.pl/results/results.uri?src=s&st1=&st2=&sot=b&sdt=b&origin=searchbasic&rr=&sl=54&s=TITLE-ABS-KEY%20(cellulose%20solid%20state%20NMR%20spectroscopy) (accessed on 25 January 2021).
- Iuga, A.; Ader, C.; Gröger, C.; Brunner, E. Applications of Solid-State 31P-NMR Spectroscopy. Annu. Rep. NMR Spectrosc. 2006, 60, 145–189. [Google Scholar] [CrossRef]
- Shi, Y.; Belosinschi, D.; Brouillette, F.; Belfkira, A.; Chabot, B. Phosphorylation of Kraft fibers with phosphate esters. Carbohyd. Polym. 2014, 106, 121–127. [Google Scholar] [CrossRef]
- de Castro Silva, F.; da Silva, M.M.F.; Lima, L.C.B.; Osajima, J.A.; da Silva Filho, E.C. Modifying cellulose with metaphosphoric acid and its efficiency in removing brilliant green dye. Int. J. Biol. Macromol. 2018, 114, 470–478. [Google Scholar] [CrossRef] [PubMed]
- Fiss, B.G.; Hatherly, L.; Stein, R.S.; Friščić, T.; Moores, A. Mechanochemical phosphorylation of polymers and synthesis of flame-retardant cellulose nanocrystals. ACS Sustain. Chem. Eng. 2019, 7, 7951–7959. [Google Scholar] [CrossRef]
- Rol, F.; Sillard, C.; Bardet, M.; Yarava, J.R.; Emsley, L.; Gablin, C.; Léonard, D.; Belgacem, N.; Bras, J. Cellulose phosphorylation comparison and analysis of phosphorate position on cellulose fibers. Carbohyd. Polym. 2020, 229, 115294. [Google Scholar] [CrossRef] [PubMed]
- Jia, Y.; Wang, X.; Huo, M.; Zhai, X.; Li, F.; Zhong, C. Preparation and characterization of a novel bacterial cellulose/chitosan bio-hydrogel. Nanomater. Nanotechnol. 2017, 7, 1–8. [Google Scholar] [CrossRef]
- Daud, W.R.W.; Kassim, M.H.M.; Seeni, A. Cellulose phosphate from oil palm biomass as potential biomaterials. BioResources 2011, 6, 1719–1740. [Google Scholar] [CrossRef]
- Li, K.; Wang, J.; Liu, X.; Xiong, X.; Liu, H. Biomimetic growth of hydroxyapatite on phosphorylated electrospun cellulose nanofibers. Carbohyd. Polym. 2012, 90, 1573–1581. [Google Scholar] [CrossRef]
- Ullah, S.; Acuna, J.J.S.; Pasa, A.A.; Bilmes, S.A.; Vela, M.E.; Benitez, G.; Rodrigues-Filho, U.P. Photoactive layer-by-layer films of cellulose phosphate and titanium dioxide containing phosphotungstic acid. Appl. Surf. Sci. 2013, 277, 111–120. [Google Scholar] [CrossRef] [Green Version]
- Nourry, G.; Belosinschi, D.; Boutin, M.P.; Brouillette, F.; Zerrouki, R. Hydro-phobization of phosphorylated cellulosic fibers. Cellulose 2016, 23, 3511–3520. [Google Scholar] [CrossRef]
- Quin, L.D.; Williams, A.J. Phosphonic and Phosphinic Acids and Derivatives. C. H-Phosphonates. In Practical Interpretation of P-31 NMR Spectra and Computer Assisted Structure Verification; Advanced Chemistry Development, Inc.: Toronto, ON, Canada, 2004; pp. 35–36. [Google Scholar]
- Ramos, L.A.; Assaf, J.M.; El Seoud, O.A.; Frollini, E. Influence of the supramolecular structure and physicochemical properties of cellulose on its dissolution in a lithium chloride/N,N-Dimethylacetamide solvent system. Biomacromolecules 2005, 6, 2638–2647. [Google Scholar] [CrossRef] [PubMed]
- Ashori, A.; Babaee, M.; Jonoobi, M.; Hamzeh, Y. Solvent-free acetylation of cellulose nanofibers for improving compatibility and dispersion. Carbohyd. Polym. 2014, 102, 369–375. [Google Scholar] [CrossRef]
- Keshk, S.M.A.S.; Bondock, S.; El-Zahhar, A.; Haija, M.A. Synthesis and characterization of novel Schiff’s bases derived from dialdehyde cellulose-6-phosphate. Cellulose 2019, 26, 3703–3712. [Google Scholar] [CrossRef]
- Wiercigroch, E.; Szafraniec, E.; Czamara, K.; Pacia, M.Z.; Majzner, K.; Kochan, K.; Kaczor, A.; Baranska, M.; Malek, K. Raman and infrared spectroscopy of carbohydrates: A review. Spectrochim. Acta A 2017, 185, 317–335. [Google Scholar] [CrossRef]
- Kaputskii, V.E.; Komar, V.P.; Skornyakov, I.V. Infrared spectra and structure of cellulose phosphates. J. Appl. Spectrosc. 1988, 48, 176–179. [Google Scholar] [CrossRef]
- Tasker, S.; Badyal, J.P.S.; Backson, S.C.E.; Richards, R.W. Hydroxyl accessibility in celluloses. Polymer 1994, 35, 4717–4721. [Google Scholar] [CrossRef]
- Ibrahim, M.; Alaam, M.; El-Haes, H.; Jalbout, A.F.; de Leon, A. Analysis of the structure and vibrational spectra of glucose and fructose. Ecl. Quím., Săo Paulo 2006, 31, 15–21. [Google Scholar] [CrossRef]
- Liu, P.; Borrell, P.F.; Bozic, M.; Kokol, V.; Oksman, K.; Mathew, A.P. Nanocelluloses and their phosphorylated derivatives for selective adsorption of Ag+, Cu2+ and Fe3+ from industrial effluents. J. Hazard. Mater. 2015, 294, 177–185. [Google Scholar] [CrossRef] [PubMed]
- Analytical Methods for Atomic Absorption Spectroscopy. The Perkin-Elmer Corporation. 1996. Available online: http://www1.lasalle.edu/~prushan/Intrumental%20Analysis_files/AA-Perkin%20Elmer%20guide%20to%20all!.pdf (accessed on 3 December 2020).
- Nadari, M. Surface Area: Brunauer–Emmett–Teller (BET) in Progress in Filtration and Separation; Elsevier, Ltd.: Amsterdam, The Netherlands, 2015; Chpt. 14; pp. 585–608. [Google Scholar] [CrossRef]
- Nakai, Y.; Nakajima, S.; Fukuoka, E.; Hasegawa, J. Crystallinity and physical characteristics of microcrystalline cellulose. Chem. Pharmac. Bull. 1997, 25, 96–101. [Google Scholar] [CrossRef] [Green Version]
- Ardizzone, S.; Dioguardi, F.S.; Mussini, T.; Mussini, P.R.; Rondinini, S.; Vercelli, B.; Vertova, A. Microcrystalline cellulose powders: Structure, surface features and water sorption capability. Cellulose 1999, 6, 57–69. [Google Scholar] [CrossRef]
- Vodáčková, P.; Vraníková, B.; Svačinová, P.; Franc, A.; Elbl, J.; Muselik, J.; Kubalák, R.; Solný, T. Evaluation and comparison of three types of spray dried coprocessed excipient Avicel® for direct compression. BioMed Res. Int. 2018, 2739428. [Google Scholar] [CrossRef]
- Gomide, F.T.F.; da Silva, A.S.A.; da Silva Bon, E.P.; Alves, T.L.M. Modification of microcrystalline cellulose structural properties by ball-milling and ionic liquid treatments and their correlation to enzymatic hydrolysis rate and yield. Cellulose 2019, 26, 7323–7335. [Google Scholar] [CrossRef]
- Oshima, T.; Taguchi, S.; Ohe, K.; Baba, Y. Phosphorylated bacterial cellulose for adsorption of proteins. Carbohyd. Polym. 2011, 83, 953–958. [Google Scholar] [CrossRef]
- EN ISO 20645:2006. Textile Fabrics. In Determination of Antibacterial Activity—Agar Diffusion Plate Test; International Organization for Standardization: Geneva, Switzerland, 2006. [Google Scholar]
- Jafari, A.; Pourakbar, L.; Farhadi, K.; Mohamadgolizad, L.; Goosta, Y. Biological synthesis of silver nanoparticles and evaluation of antibacterial and antifungal properties of silver and copper nanoparticles. Turk. J. Biol. 2015, 39, 556–561. [Google Scholar] [CrossRef]
- Hemmati, S.; AhanyKamangar, S.; Ahmeda, A.; Zangeneh, M.M.; Zangeneh, A. Application of copper nanoparticles containing natural compounds in the treatment of bacterial and fungal diseases. Appl. Organomet. Chem. 2020, 34, 5465. [Google Scholar] [CrossRef]
- Shankar, S.; Rhim, J.-W. Effect of copper salts and reducing agents on characteristics and antimicrobial activity of copper nanoparticles. Mater. Lett. 2014, 132, 307–311. [Google Scholar] [CrossRef]
- Almanza, D.L.V.; De Luna, J.L.A.; Herrera, M.U. Embedding of copper sulfate and copper oxide on multipurpose paper. IOP Conf. Ser., Mater. Sci. Eng. 2017, 201, 012038. [Google Scholar] [CrossRef] [Green Version]
- Nouri, A.; Ghorbanpour, M.; Lotfiman, S. Diffusion of Cu ions into nanoclay by molten salt ion exchange for antibacterial application. J. Phys. Sci. 2018, 29, 31–42. [Google Scholar] [CrossRef] [Green Version]
- Cano, A.P.; Gillado, A.V.; Montecillo, A.D.; Herrera, M.U. Copper sulfate-embedded and copper oxide-embedded filter paper and their antimicrobial properties. Mater. Chem. Phys. 2018, 207, 147–153. [Google Scholar] [CrossRef]
- Hay, R.W.; Nolan, K.B. Reactions of co-ordinated ligands. Hydrolysis of tetramethyl ethylenediamine-tetra-acetate and its copper(II) complexes. J. Chem. Soc., Dalton Trans. 1975, 1348–1351. [Google Scholar] [CrossRef]
- Yarovaya, O.V.; Kienskaya, K.I.; Nazarov, V.V. Synthesis and some colloidal properties of hydrosols prepared by the hydrolysis of copper(II) nitrate. Colloid J. 2004, 66, 367–371. [Google Scholar] [CrossRef]
- Pivovarov, S. Modeling of ionic equilibria of trace metals (Cu2+, Zn2+, Cd2+) in concentrated aqueous electrolyte solutions at 25 °C. J. Colloid Interf. Sci. 2005, 291, 421–432. [Google Scholar] [CrossRef] [PubMed]


| No. | Reaction Conditions | Phosphorylation | Ref. | ||||
|---|---|---|---|---|---|---|---|
| Reagents a | Reagent Ratio | Temp. [°C] | Time [h] | % | DS | ||
| 1 | Cell-OH/Ar-O-PCl2 | 1:3 | 90 | 6 | 0.23 | [29] | |
| 2 | Cell-OH, NaOH, H2O/ Py, Ph-PCl2 | 1:11.6 and/or | 100 | 1 | 0.78 | 0.04 | [30] |
| Cell-OH, NaOH, H2O/ Py, Ph-O-PCl2 | 1:10 | 100 | 1 | 0.23 | 0.01 | ||
| 3 | Cell-OH/H3PO3/urea or Cell-OH/H3PO3/urea (DMF) | 1:10:16.5 | 150 | 0.5–8.0 | 0.6–2.0 | [31] | |
| 1:2.7:5.5 (DMF) | 150 | 0.5–8.0 | |||||
| 1:10:17 | 150 | 2–5 | 12–13 | 0.96–1.0 | [32] | ||
| 1:10:17 | 150 | 4 | 12.6 | 1.01 | |||
| 8.6 * | 0.62 * | ||||||
| X:1:15 | 150 | 1–9 | 9.2–21.4 | 0.6–2.0 | [33] | ||
| 4 | Cell-OH/H3PO3/urea/ MW | 1:10:16 | 85 (MW) | 6 | 0.6 | [34] | |
| 1:10:16 | 105 (MW) | 2 | 2.8 | ||||
| Reagent | Reaction Time | |
|---|---|---|
| Cu(NO3)2 in HNO3 | 0.1 [mL] /a | |
| H2O | 0.5 [mL] | |
| Cell-O6-P(O)(OH)-H | 50 [mg] | 2 [h] |
| No. | Cell-O6-P(O)(OH)-H | Solution Components | Temp. [°C] | Time [h] | Solub. | |||
|---|---|---|---|---|---|---|---|---|
| Solvent 1 | mL | Solvent 2 | mL | |||||
| 1 | 25 mg | H2O | 2 | − | − | 25 | 2 | − |
| 2 | 25 mg | H2O | 2 | − | − | 50 | 2 | − |
| 3 | 25 mg | 0.1 M KOH | 2 | − | − | 25 | 2 | − |
| 4 | 25 mg | 0.1 M KOH | 2 | − | − | 50 | 2 | − |
| 5 | 25 mg | TBAA | 0.2 (g) | DMSO | 0.72 mL; (0.8 g) | 25 | 2 | +/− |
| 6 | 25 mg | TBAA | 0.2 (g) | DMSO | 0.72 mL; (0.8 g) | 50 | 2 | ++/− |
| Cell-O-P(O)(H)(OH) | Cell-O-P(O)(OH)2 | Cell-O-P(O) (OH)(O-Ph) | Vibration Mode | ||||
|---|---|---|---|---|---|---|---|
| [28] | [27] | [68] | [28] | [24] | [11] | [28] | |
| 3460 | 3400–3500 | 3400 | 3460 | 2990–3630 | 3402 | 3460 | OH |
| 2940; 1430 | 2800–2900 | 2920 | 2940; 1430 | 2891 | 2891 | 2940; 1430 | CH, CH2 |
| 1160; 1120 | 2360 | C-O-C | |||||
| 2320 | 2370 | 1383 | P–H | ||||
| 1650 | 1640–1660 | 1650 | 1625 | 1650 | H-OH | ||
| 1418; 1382; 1152; 1029 | C-O | ||||||
| 1250 | 1210 | 1250–1300 | 920–1000 | 1383 | 1370 | P=O | |
| 920–1000 | 1395 | 1000–1400 | P-OH | ||||
| 1000–1060 | 810 | 1 | 1040–1190 | P-O-C | |||
| 1075 | 1075 | 1075 | C-OH | ||||
| 905–910 | 700–100 | 905–910 | 905–910 | pyranose ring | |||
| 520–600 | P(O)-H | ||||||
| Cellulose- Phosphates | Potentiometric Titrations | Ref. | |
|---|---|---|---|
| Mode of Titration | Defl. Points | ||
| Cell-O-P(O)(OH)-H | Direct titrations with KOH or LiOH | 1 | [31,32] |
| Cell-O-P(O)(OH)2 | Direct titrations with LiOH, NaOH, KOH or Ba(OH)2 | 2 | [18,27,30] /a |
| Reverse titration using KOH/HCl | 1 | [41,70] | |
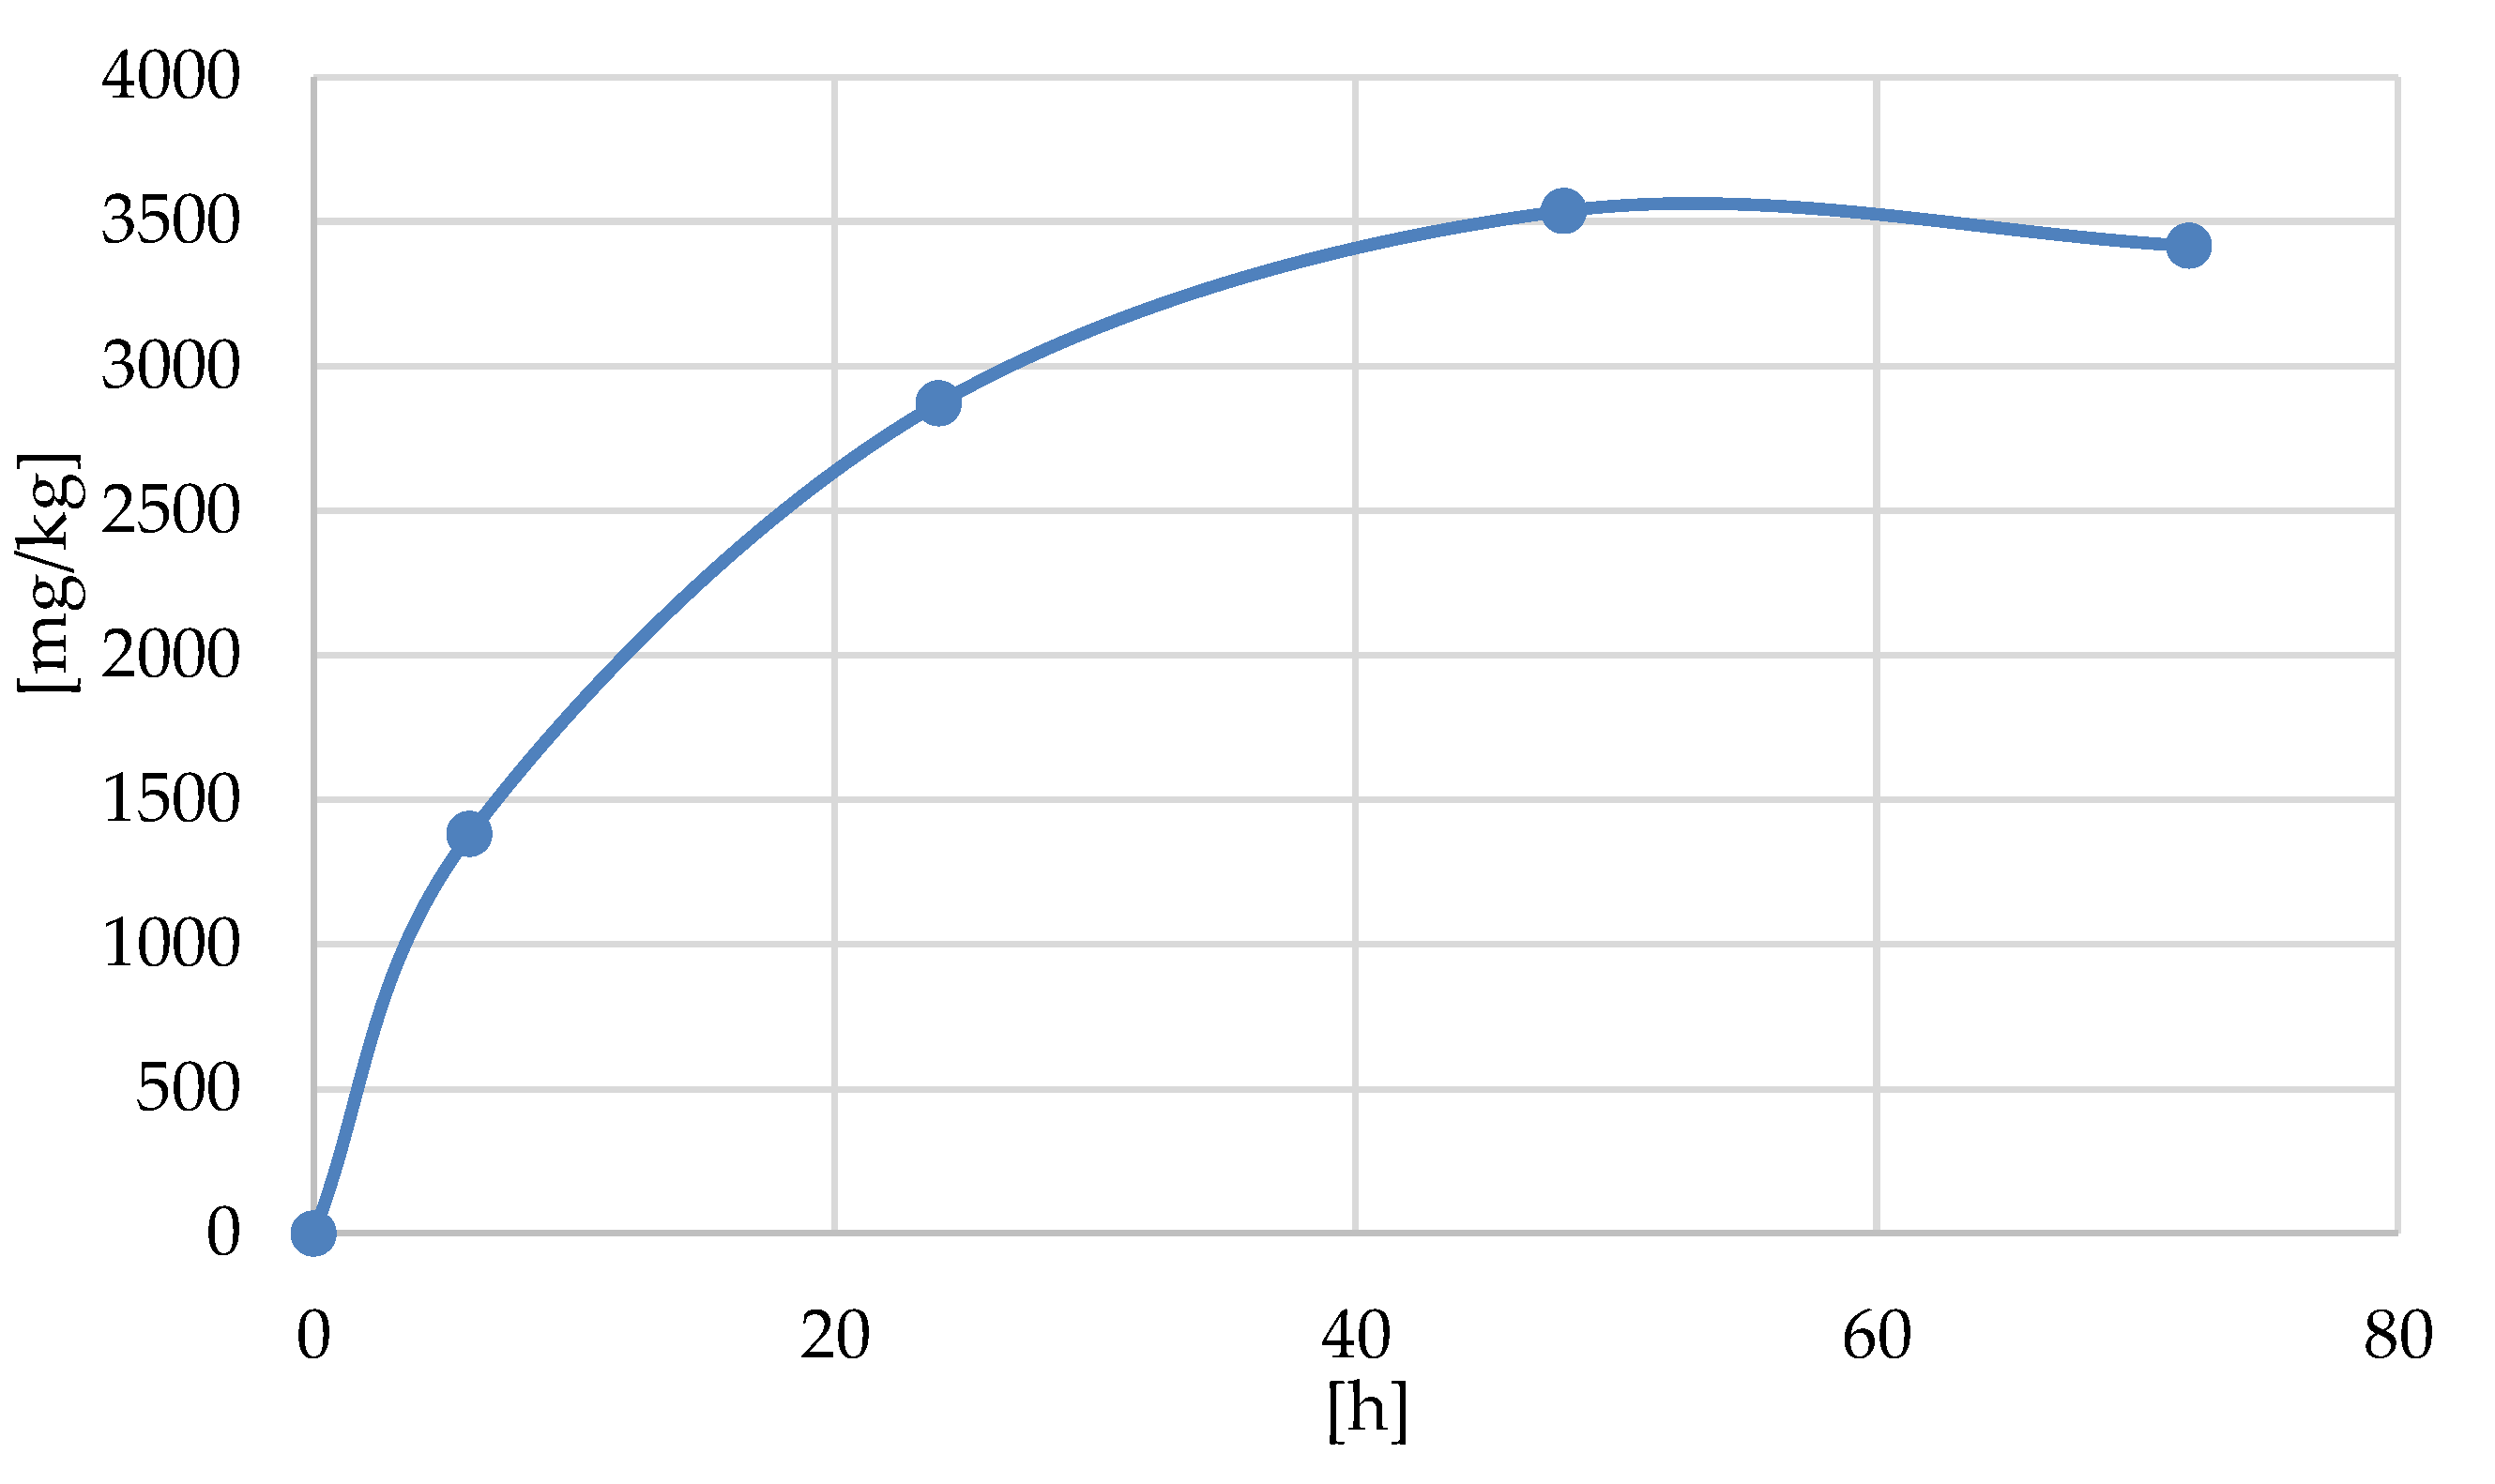
| Samples /a | Element Analysis /b | DP /c | ||||
|---|---|---|---|---|---|---|
| EA | ICP MS P | |||||
| C [%] | H [%] | mg/kg | g/100 g [%] | mM/kg | ||
| Cellulose | 44.35 ± 0.04 | 6.22 ± 0.04 | 0 | 0 | 0 | 0 |
| Cell-O6-P(O)(OH)-H (6 h) | 41.25 ± 0.04 | 6.20 ± 0.02 | 1381 ± 12 | 0.1381 | 44.5 | 0.007 |
| Cell-O6-P(O)(OH)-H (24 h) | 41.21 ± 0.04 | 6.23 ± 0.03 | 2872 ± 55 | 0.2872 | 92.6 | 0.015 |
| Cell-O6-P(O)(OH)-H (48 h) | 41.18 ± 0.06 | 6.15 ± 0.03 | 3537 ± 16 | 0.3537 | 114.1 | 0.019 |
| Cell-O6-P(O)(OH)-H (72 h) | 40.98 ± 0.06 | 6.21 ± 0.06 | 3416 ± 20 | 0.3416 | 110.2 | 0.018 |
| No. | Sample /a | Phosphorylation Time [h] | Cu Concentration | ||
|---|---|---|---|---|---|
| mg/kg /b | g/100 g [%] | mMol/ kg | |||
| 1 | Cell-O6-P(O)(OH)-H | 0 | 0 | 0 | 0 |
| 2 | Cell-O6-P(O)(O−)-H (6 h) × Cu2+ | 6 | 263.8 | 0.0264 | 4.15 |
| 3 | Cell-O6-P(O)(O−)-H (24 h) × Cu2+ | 24 | 423.6 | 0.0424 | 6.67 |
| 4 | Cell-O6-P(O)(O−)-H (48 h) × Cu2+ | 48 | 659.2 | 0.0659 | 10.37 |
| 5 | Cell-O6-P(O)(O−)-H (72 h) × Cu2+ | 72 | 655.4 | 0.0655 | 10.32 |
| No. | Cellulose, Cell-O6-P(O)(OH)-H and Cell-O6-P(O)(O−)-H(48 h) × Cu2+ | Specific Surface Area /a SBET [m2/g] | Ref. | |
|---|---|---|---|---|
| N2-BET Method | H2O(gas)-BET Method | |||
| 1 | Microcrystalline cellulose | 1 | 149 | [73] |
| 1.2 | 161 | |||
| 2 | Avicel PH 102 MCC powder | 1.3 | [74] | |
| 3 | Cellulose linters | 2.8 | [63] | |
| Cellulose mercerized linters | 1.0 | |||
| 4 | Avicel CE 15 | 0.5 | [75] | |
| Avicel DG | 1.2 | |||
| Avicel HFE 102 | 0.6 | |||
| 5 | Avicel PH-101 | 5.71 | [76] | |
| Avicel PH-101 (ball milled) | 0.87 | |||
| 6 | Cellulose Avicel PH-101 | 1.99 | This work | |
| Cell-O6-P(O)(OH)-H (6 h) | 1.11 | |||
| Cell-O6-P(O)(OH)-H (24 h) | 0.88 | |||
| Cell-O6-P(O)(OH)-H (48 h) | 0.88 | |||
| Cell-O6-P(O)(OH)-H (72 h) | 0.83 | |||
| Cell-O6-P(O)(O−)-H(48 h)×Cu2+ | 1.75 | |||
| No. | Cell-O6-P(O)(OH)-H (t) /a | Cu in Cell-O6-P(O)(O−) × Cu2+)-H | ZOI /b [mm] | |||
|---|---|---|---|---|---|---|
| In The Starting Composite | Spots Deposited | Bacteria Average /c | ||||
| mg/ kg /d | μg/ disc /a | μMol/ disc /a | E.c. | S.a. | ||
| 1 | Cell-O6-P(O)(OH)-H | 0 | 0 | 0 | - | - |
| 2 | Cell-O6-P(O)(OH)-H (6 h) × Cu2+ | 263.8 | 0.26 | 0.04 | - | - |
| 3 | Cell-O6-P(O)(OH)-H (24 h) × Cu2+ | 423.6 | 0.42 | 0.07 | - | - |
| 4 | Cell-O6-P(O)(OH)-H (48 h) × Cu2+ | 659.2 | 0.66 | 0.10 | 1 | 1 |
| 5 | Cell-O6-P(O)(OH)-H (72 h) × Cu2+ | 655.4 | 0.66 | 0.10 | 1 | 1 |
| No | Antibacterial Agent | Agent Deposited On Spot | ZOI [mm] | Lit. | ||
|---|---|---|---|---|---|---|
| mg/spot | μmol/spot | Escherichia coli | Staphylococcus aureus | |||
| 1.1 | CuCl2 | 0.05 | 15 | 14 | [79] | |
| 1.2 | AgNO3 | 0.05 | 16 | 15 | ||
| 2.3 | CuNPS /a | 0.05 | 17 | 16 | ||
| 3.4 | Gentamycin | 0.01 | 0.02 | 19 | 13 | |
| 1.5 | Penicillin | 0.01 | 0.03 | 0 | 17 | |
| 1.6 | Tetracycline | 0.03 | 0.07 | 19 | 19 | |
| 2.1 | CuSO4 | 0.06 | 0.38 | 0 | 0 | [80] |
| 0.12 | 0.75 | 0 | 0 | |||
| 0.24 | 1.5 | 9.4 | 8.2 | |||
| 1.92 | 12 | 13 | 14 | |||
| 2.2 | Oxytetracycline | 1.80 | 3.9 | 23 | 23 | |
| 2.3 | CNPs /b | 0.06 | 0.9 | 15 | 14 | |
| 0.12 | 1.8 | 17 | 20 | |||
| 0.24 | 3.6 | 23 | 22 | |||
| 1.92 | 30. | 38 | 37 | |||
| Nr. | Name | CAS |
|---|---|---|
| 1 | Cellulose microcrystalline (Avicel PH-101), ~50 μm particle size | 9004–34–6 |
| 2 | Phosphorus trichloride, 99% | 7719–12–2 |
| 3 | D-Glucose 6-phosphate disodium salt hydrate, ≥98% | 3671–99–6 |
| 4 | Nitric acid, 65%, Suprapur® | 7697–37–2 |
| 5 | Hydrogen peroxide 29.0–32.0% | 7722–84–1 |
| 6 | Copper(II) nitrate [Cu(NO3)2 (1000 mg/L Cu) in 0.5 M HNO3 | 13778–31–9 |
Publisher’s Note: MDPI stays neutral with regard to jurisdictional claims in published maps and institutional affiliations. |
© 2021 by the authors. Licensee MDPI, Basel, Switzerland. This article is an open access article distributed under the terms and conditions of the Creative Commons Attribution (CC BY) license (http://creativecommons.org/licenses/by/4.0/).
Share and Cite
Kudzin, M.H.; Mrozińska, Z.; Urbaniak, P. Vapor Phosphorylation of Cellulose by Phosphorus Trichlo-Ride: Selective Phosphorylation of 6-Hydroxyl Function—The Synthesis of New Antimicrobial Cellulose 6-Phosphate(III)-Copper Complexes. Antibiotics 2021, 10, 203. https://0-doi-org.brum.beds.ac.uk/10.3390/antibiotics10020203
Kudzin MH, Mrozińska Z, Urbaniak P. Vapor Phosphorylation of Cellulose by Phosphorus Trichlo-Ride: Selective Phosphorylation of 6-Hydroxyl Function—The Synthesis of New Antimicrobial Cellulose 6-Phosphate(III)-Copper Complexes. Antibiotics. 2021; 10(2):203. https://0-doi-org.brum.beds.ac.uk/10.3390/antibiotics10020203
Chicago/Turabian StyleKudzin, Marcin H., Zdzisława Mrozińska, and Paweł Urbaniak. 2021. "Vapor Phosphorylation of Cellulose by Phosphorus Trichlo-Ride: Selective Phosphorylation of 6-Hydroxyl Function—The Synthesis of New Antimicrobial Cellulose 6-Phosphate(III)-Copper Complexes" Antibiotics 10, no. 2: 203. https://0-doi-org.brum.beds.ac.uk/10.3390/antibiotics10020203