Article

Antimicrobial Resistance Patterns of Escherichia coli Isolated from Sheep and Beef Farms in England and Wales: A Comparison of Disk Diffusion Interpretation Methods

1
School of Veterinary Medicine and Science, University of Nottingham, Sutton Bonington LE12 5RD, UK
2
School of Biosciences, University of Nottingham, Sutton Bonington LE12 5RD, UK
*
Author to whom correspondence should be addressed.
Submission received: 5 March 2021 / Revised: 12 April 2021 / Accepted: 14 April 2021 / Published: 16 April 2021

Abstract

:
Little data exist on the levels of antimicrobial resistance from bacteria isolated from British sheep and beef cattle. The aim of this study was to investigate antimicrobial resistance patterns on sheep and beef farms in England and Wales using multiple interpretation methods. Fecal samples (n = 350) from sheep and beef cattle were collected from 35 farms. Disk diffusion antimicrobial susceptibility testing against ten antimicrobials was carried out for 1115 (699 sheep, 416 beef) β-glucuronidase-positive Escherichia coli isolates. Susceptibility was interpreted using clinical breakpoints, which determine clinically resistant bacteria, and epidemiological and livestock-specific cut-off values, which determine microbiological-resistant bacteria (non-wild type). Using livestock-specific cut-off values, a high frequency of wild type for all ten antimicrobials was observed in isolates from sheep (90%) and beef cattle (85%). Cluster analysis was performed to identify patterns in antimicrobial resistance. Interpretation of susceptibility using livestock-specific cut-off values showed a cluster of isolates that were non-wild type to cefotaxime and amoxicillin/clavulanic acid, whereas clinical breakpoints did not. A multilevel logistic regression model determined that tetracycline use on the farm and soil copper concentration were significantly associated with tetracycline non-wild type isolates. The results suggest that using human clinical breakpoints could lead to both the under-reporting and over-reporting of antimicrobial resistance in sheep and beef cattle.

1. Introduction

Antimicrobial resistance is a worldwide public health concern. The administration of antimicrobials leads to the selection of antimicrobial-resistant bacteria, and food-producing animals are one of several potential sources of antimicrobial resistance [1]. Although antimicrobial use is thought to be low in sheep and beef cattle [2,3], the large numbers of sheep and cattle in the UK may potentially contribute to the dissemination of antimicrobial-resistant bacteria [4,5]. National surveillance of antimicrobial resistance from bacteria isolated from sheep and beef cattle only uses samples that are submitted for clinical diagnostics [6]. The use of clinical isolates suggests that antimicrobial resistance to commonly used antimicrobials, such as tetracycline and ampicillin, is relatively high in sheep and cattle [7]. However, clinical samples are potentially biased as they usually come from sick animals which may have been treated with antimicrobials. At present in the UK, active national surveillance of healthy sheep or cattle does not exist.
There are few studies investigating antimicrobial susceptibility of organisms isolated from healthy sheep and beef cattle in the UK. These studies suggest that antimicrobial resistance on sheep and beef farms is relatively uncommon [8,9,10], although extended spectrum beta-lactamase (ESBL)-positive beef farms may be increasing [11,12]. Examining the presence of ESBL E. coli has been the focus of more recent studies on beef farms [11,12]. Therefore, other resistance types may have been missed in these studies. Other studies have investigated a larger range of antimicrobial resistances, but only investigated a few farms [8,10]. Hence, variance between farms with respect to antimicrobial resistance patterns was not investigated. More information regarding antimicrobial resistance on sheep and beef farms in the UK is required. Indeed, a systematic review of antimicrobial resistance on British sheep and cattle farms called for additional efforts in collecting farm-level antimicrobial resistance data [7].
Previously identified factors associated with antimicrobial resistance in pigs and veal calves in countries other than the UK include the use of antimicrobials, either as therapeutics to treat sick animals or as growth promoters [13,14,15]. Antimicrobial growth promoters are not used in the UK. The number of animals on the farm, region of the farm and type of animals sampled have also been reported as factors associated with antimicrobial resistance in bacteria isolated from animals [16,17]. It has been shown that bacterial isolates of animal origin may present with resistance even when the animals have not been exposed to antimicrobials [18,19]. Markland et al. [20] illustrated that when cefotaxime-resistant bacteria were present in samples from beef cattle, resistant bacteria were more abundant in soil samples. This indicated that the environment, such as soils and forage, may be a natural source of antimicrobial-resistant bacteria for food-producing animals [20]. However, the factors that affect the prevalence of antimicrobial-resistant bacteria in soils are unclear [21]. One potential explanation is that heavy metals such as copper and zinc may co-select for antimicrobial resistance in soil. The effect of metal concentrations in soil on the prevalence of antimicrobial resistance in farm animals requires further investigation.
Disk diffusion testing is a commonly used phenotypic method for determining antimicrobial susceptibility. Scientists typically interpret the results of such tests using clinical breakpoints and will mainly adhere to guidelines set by the European Committee on Antimicrobial Susceptibility Testing (EUCAST) or Clinical and Laboratory Standards Institute (CLSI) [22,23]. However, these clinical breakpoints are only relevant for human medicine [24]. CLSI has set very few veterinary clinical breakpoints, and at present, European veterinary breakpoints do not exist. Research suggests that using human clinical breakpoints to interpret veterinary data may lead to calculating a higher antimicrobial resistance prevalence than actually occurs [10].
An alternative method to interpret antimicrobial susceptibility data is to use epidemiological cut-off (ECOFF) values to determine fully susceptible isolates (wild type, WT) from non-fully susceptible isolates (non-wild type, NWT). EUCAST defines a WT organism as one with the absence of acquired and mutational resistance mechanisms to the drug in question [25]. Thus, the ECOFFs determine microbiological resistance, whereas clinical breakpoints determine clinical resistance. The ECOFF values are established by EUCAST through analysis of the distribution of their inhibitory zone diameters [26]. However, the distributions of inhibitory zone diameters for isolates of animal origin may differ from the distributions of inhibitory zone diameters for EUCAST isolates [10,27]. Therefore, ECOFF values may not reflect WT organisms isolated from livestock.
Instead, the normalised resistance interpretation (NRI) method can be used to calculate tailor-made cut-off values. The method was originally developed to calibrate the disk diffusion test to compare results between laboratories [28]. It has also been used to investigate the susceptibility of organisms of animal origin when EUCAST or CLSI breakpoints do not exist [29,30]. Furthermore, the NRI method has been used when clinical breakpoints or ECOFF values do not appear appropriate [10,27]. An inappropriate cut-off value occurs when the cut-off splits the normal distribution of inhibition zone diameters. Therefore, it may be useful to interpret the inhibitory zone diameters of isolates of animal origin using clinical breakpoints, ECOFF values and the NRI method so that comparisons can be made and the appropriate cut-off value can be chosen. A previous study based on isolates from four sheep farms compared these three interpretation methods and suggested that sheep-specific cut-off values were most fitting [10]. There needs to be additional studies with a larger number of participating farms to confirm these results, and similar studies have not been carried out for other livestock species. Additionally, the implications in terms of interpretation of antimicrobial resistance patterns requires further investigation. Therefore, the aim of this study was to investigate and compare antimicrobial resistance patterns on thirty-five sheep and beef farms in England and Wales using multiple interpretation methods, based on bacteria isolated from feces. Further objectives were to identify clusters of antimicrobial resistance and to identify factors that were associated with antimicrobial resistance on sheep and beef farms.

2. Results

The total number of isolates tested for each farm is presented in Table 1. A total of 1115 β-glucuronidase-positive E. coli isolates underwent antimicrobial susceptibility testing. Of these, 699 isolates were from 203 sheep fecal samples collected from 27 different farms, and 416 isolates were from 134 beef cattle fecal samples from 19 different farms.

2.1. Comparison of Methods to Interpret Resistance

The cut-off values determined by the NRI method (COWT) for sheep and beef fecal derived isolates were larger for tetracycline compared with the clinical breakpoints (Table 2). The COWT values for sheep and beef were larger for ciprofloxacin, sulfamethoxazole-trimethoprim, cefotaxime and imipenem compared with the clinical breakpoints and ECOFF values. However, COWT values for sheep and beef were smaller for amoxicillin/clavulanic acid and ampicillin compared with the clinical breakpoints and ECOFF values. All COWT values had a standard deviation < 4.00 mm as recommended by Smith et al. [31]. COWT values with standard deviation between 3.36–4.00 mm were referred to as tentative COWT estimates. For beef cattle, four antimicrobials had tentative COWT estimates, and for sheep, two antimicrobials had tentative COWT estimates (Table 2).
Based on COWT values, 87.9% (980/1115) of all E. coli isolates were defined as WT organisms for all ten antimicrobials. Of the beef fecal isolates, 85.1% (354/416) were defined as WT for all ten antimicrobials. Of the sheep fecal isolates, 89.6% (626/699) were WT for all ten antimicrobials. The E. coli isolates had the lowest susceptibility to tetracycline, with 92.1% of sheep isolates being WT (Table 3) and 87.7% of beef isolates being WT (Table 4).

2.2. Farm-Level Susceptibility

All E. coli isolated from six farms were WT for the ten antimicrobials based on COWT values (6/35, 17%). Only 26% (9/35) of farms had all isolates WT to tetracycline, whereas all farms (35/35) had all isolates WT to imipenem (Table 5).

2.3. Cluster Analysis

The dendrograms from the single-linkage cluster analysis of susceptibility to eight antimicrobials in E. coli isolates from beef cattle fecal samples and sheep fecal samples are presented in Figure 1.
For both the sheep and beef isolates, the cluster analyses using clinical breakpoints identified a cluster of isolates that were non-susceptible to ampicillin and amoxicillin/clavulanic acid. This cluster was not identified when using the NRI COWT values. In all four cluster analyses, tetracycline was the least related to other antimicrobial susceptibilities. A cluster of sheep isolates non-wild type for cefotaxime and amoxicillin/clavulanic acid was identified using NRI COWT values, but not using clinical breakpoints.

2.4. Multilevel Logistic Regression Model

2.4.1. Base Model

The base multilevel logistic regression model indicated that 16% of the variance of an isolate being defined as non-wild type for tetracycline was due to between-farm differences and 76% of the variance was due to between-sample differences.

2.4.2. Univariable Multilevel Logistic Regression Models

A univariable multilevel logistic regression analysis was carried out to determine potential factors associated with the presence of tetracycline non-wild type isolates. Table 6 presents the associations of potential risk factors.

2.4.3. Multivariable Multilevel Logistic Regression Model

The odds of isolates being defined as non-wild type for tetracycline were 28 times higher (CrI = 2.50–520.09) when farms used tetracycline antimicrobials in their animals (Table 7). With every standardised unit increase for soil copper concentration, the odds of isolates being defined as non-wild type for tetracycline was 1.78 times higher (CrI = 1.02–3.21).
The multivariable multilevel logistic regression model indicated that 9% of the residual variance of an isolate being defined as non-wild type for tetracycline was due to between-farm differences and 76% of the residual variance was due to between-sample differences.

3. Discussion

In this study, antimicrobial resistance patterns in E. coli isolated from sheep and beef farms were assessed using different interpretation methods. The results show that antimicrobial resistance in feces on sheep and beef farms in England and Wales is generally low regardless of interpretation method, compared with samples from other livestock species in the UK [6]. However, interpretation method can have important implications on the understanding of resistance patterns. Different clusters of resistance patterns were determined when using clinical breakpoints compared with bespoke cut-off values using the NRI method.
The comparison of susceptibility interpretation methods showed that differences in the proportion of susceptible isolates may occur depending on the method used. There was little correlation between interpretations of susceptibility using clinical breakpoints, ECOFFs and COWT values for amoxicillin/clavulanic acid in particular. For the beef isolates, there was also little correlation between the interpretations for ciprofloxacin and sulfamethoxazole-trimethoprim. This is possibly because clinical breakpoints detect human clinical resistance, whereas ECOFFs and COWT values detect microbiological resistance. The results suggest that clinical breakpoints and ECOFFs are not appropriate for interpreting antimicrobial resistance in bacteria isolated from sheep or cattle feces as they do not fit the wild type distribution of isolates. Silva et al. [10] also showed that clinical breakpoints and ECOFFs may be inappropriate for the classification of ovine isolates as resistant and that these interpretation methods may over-report antimicrobial resistance in sheep populations [10]. Our results also indicate that clinical breakpoints and/or ECOFFs may slightly under-report, as well as over-report, antimicrobial resistance in sheep and beef isolates, particularly for sulfamethoxazole-trimethoprim, tetracycline and cefotaxime.
Silva et al. [10] further suggest that the sheep industry could establish sheep-specific cut-offs to avoid over-interpretation of resistance in ovine isolates. It is important to highlight that some of the sheep-specific cut-offs determined in the study by Silva et al. [10] were vastly different to those determined in our study. For example, Silva et al. [10] calculated the sheep COWT for tetracycline to be 14 mm, whereas we calculated a sheep COWT of 25 mm. The difference could be because of differences in the study population. The present study investigated sheep samples from 27 farms in England and Wales, whereas Silva et al. [10] used samples from just three farms in Scotland and one farm in Norway. Additionally, some isolates collected by Silva et al. [10] were from diseased animals and not from fecal samples. Nevertheless, this demonstrates the need for large-scale data collection from a variety of different farms before industry-wide cut-off values can be developed. These results also demonstrate the need to use the NRI method to calibrate the disk diffusion test to compare results between laboratories.
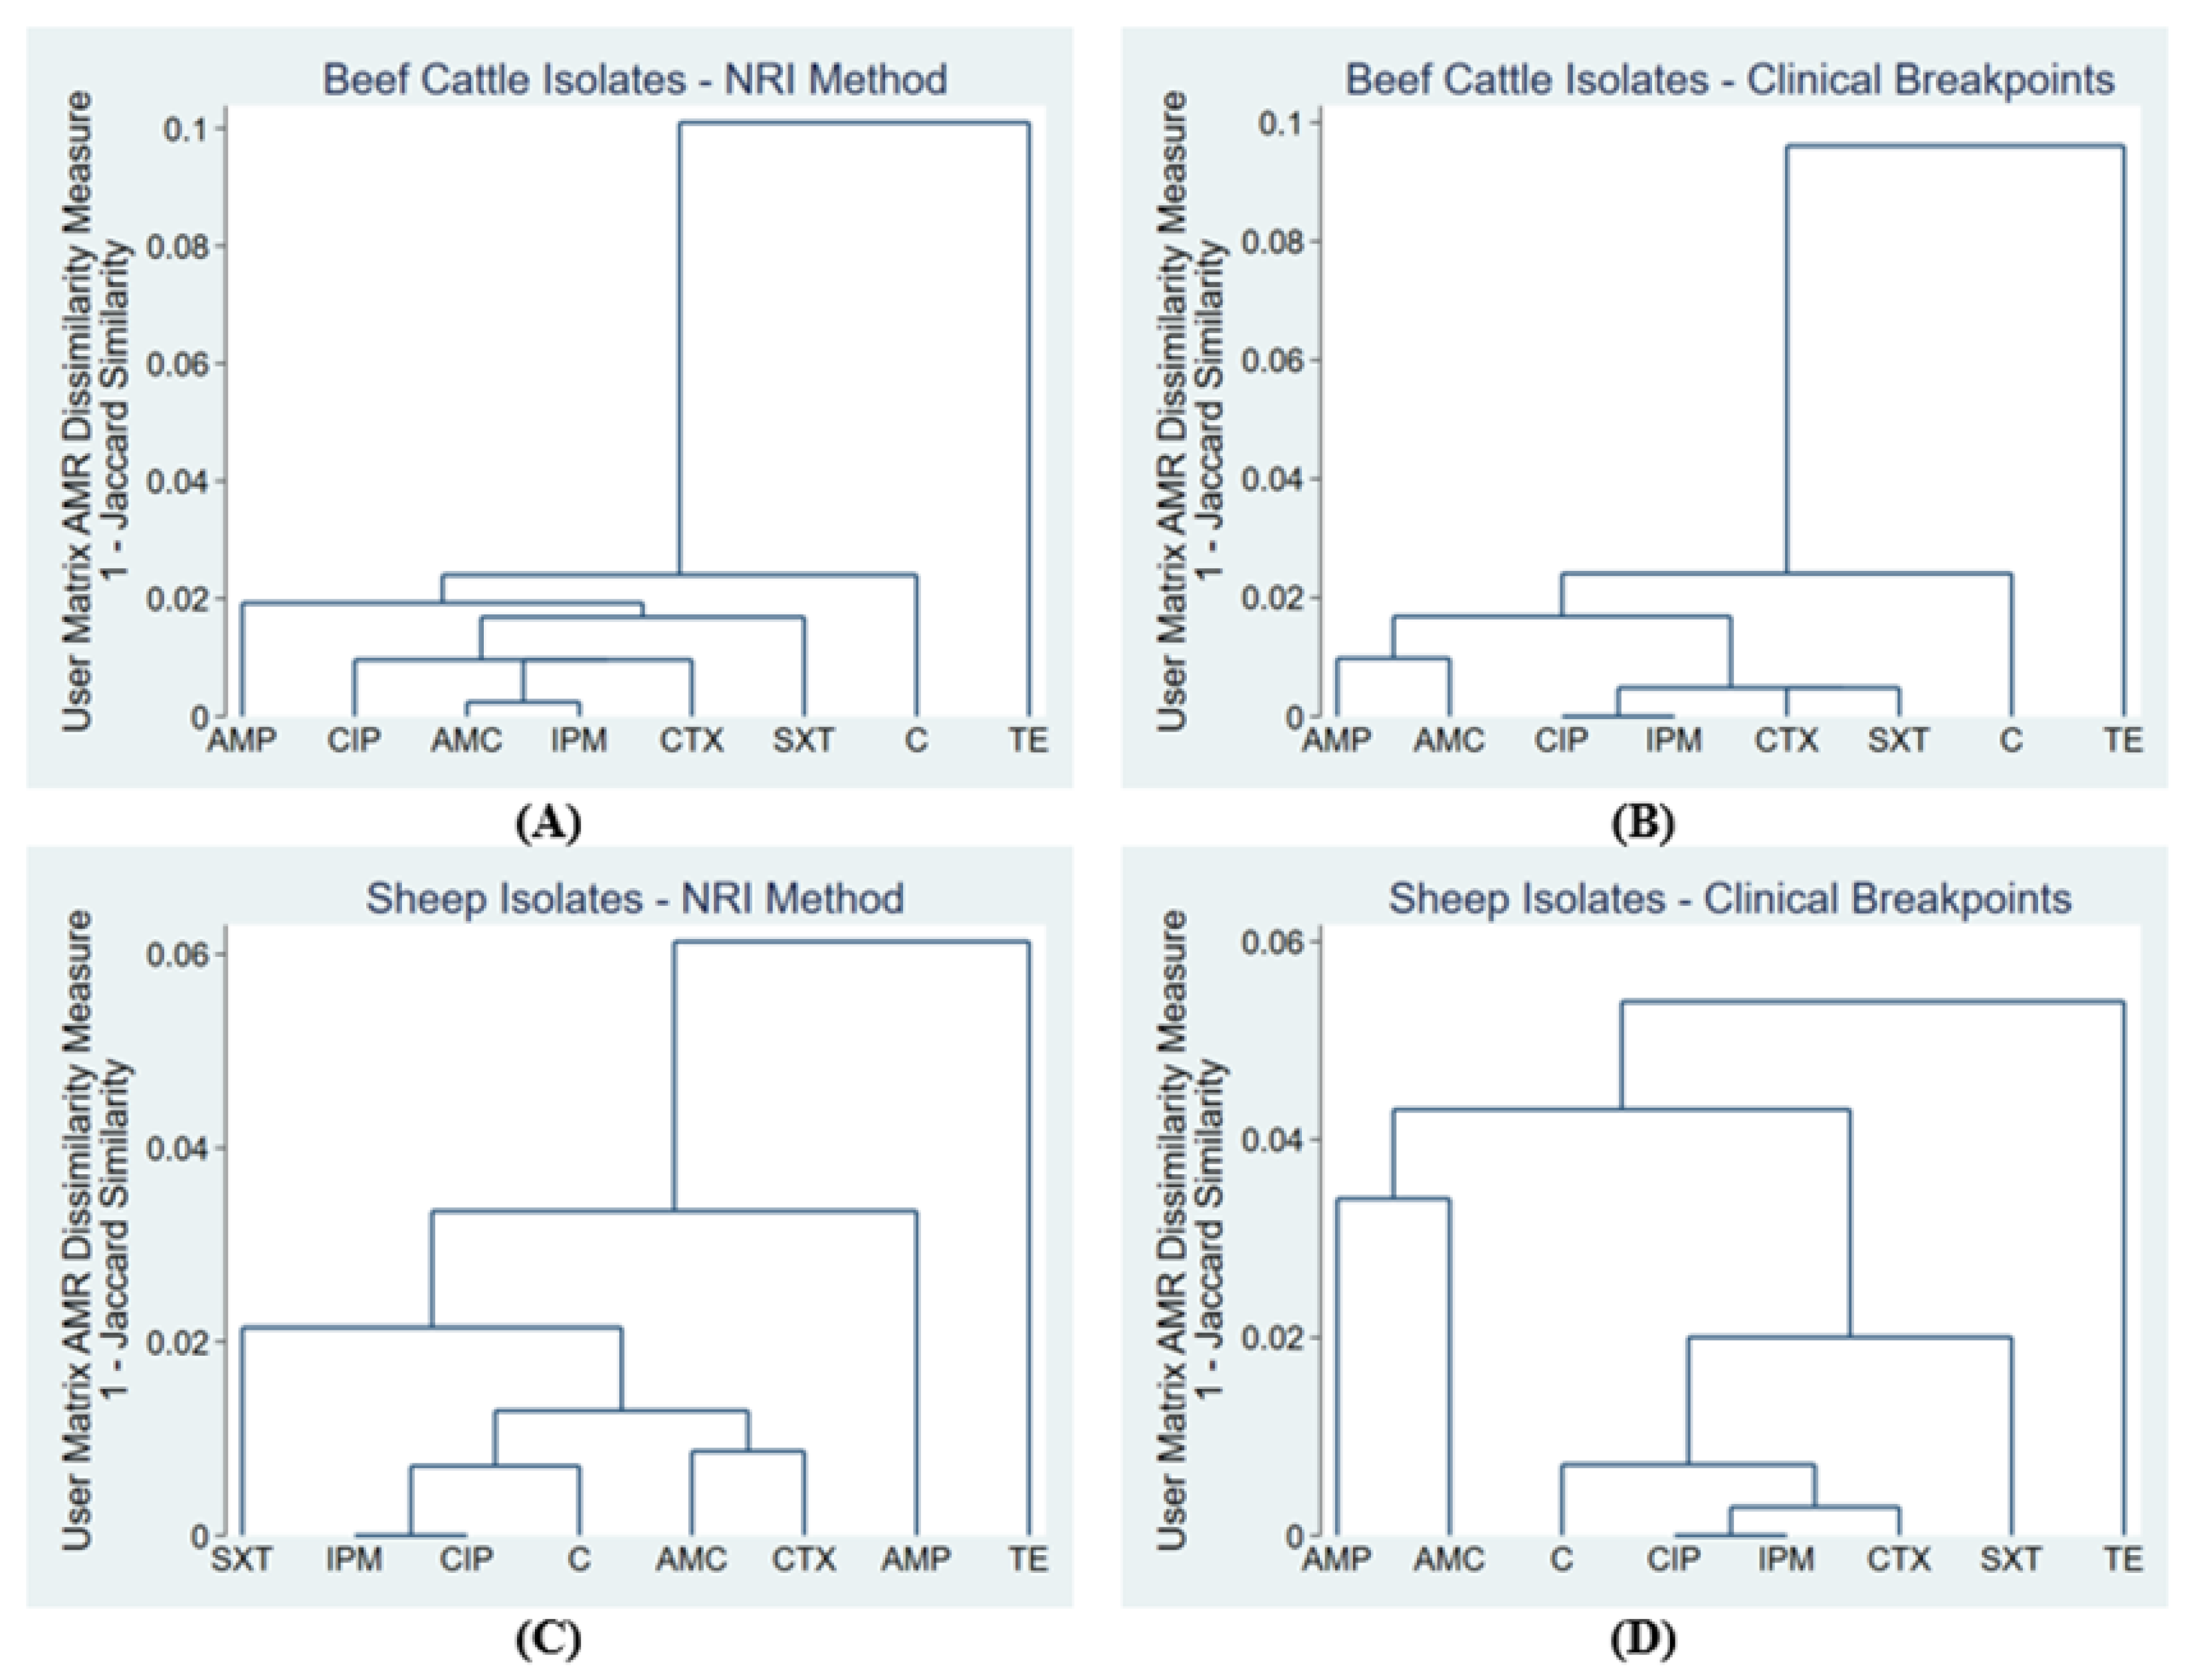
The differences in interpretation methods led to disparities in the groupings of antimicrobial resistances through cluster analysis. There was a cluster of isolates that were non-susceptible to ampicillin and amoxicillin/clavulanic acid for both the sheep and beef samples when the clinical breakpoints were used, but were not clustered as non-wild type when COWT values were used. A cluster of sheep isolates that were non-wild type for cefotaxime and amoxicillin/clavulanic acid was only determined with the COWT values. This may have implications for elucidating resistance mechanisms. Non-susceptibility to amoxicillin/clavulanic acid and ampicillin or cefotaxime suggests mechanisms of beta-lactam resistance, which requires further investigation through genotypic analysis [32]. These non-susceptibility and non-wild type patterns may have been missed if only one interpretation method was used.
A few cases of cefotaxime non-susceptibility in sheep and beef fecal isolates were reported in this study. Reduced susceptibility to cefotaxime has been reported in British beef cattle [12]. Although cefotaxime resistance in isolates from sheep has previously been reported in England and Wales, this was from clinical diagnostic samples [11], and to the authors’ knowledge, it has not been reported for apparently healthy sheep in England and Wales before. This may be because third-generation cephalosporins are very rarely used on sheep farms. The use of highest-priority critically important antimicrobials should only be used as a last resort, when susceptibility testing has been conducted and no other antimicrobial would be effective. As resistance to other lower priority antimicrobials is uncommon in sheep and beef cattle, the use of third-generation cephalosporins is usually not required. It has previously been shown that cefotaxime-resistant bacteria may be present on beef farms without any antimicrobial use and that the environment may be a source of cefotaxime resistance [19,20]. The presence of cefotaxime non-susceptibility raises concerns around the existence of extended spectrum beta-lactamases (ESBLs) in healthy sheep and beef cattle [32], especially as a group of sheep isolates resistant to both cefotaxime and amoxicillin/clavulanic acid was identified from the cluster analysis. Further screening of the cefotaxime non-susceptible isolates is required to determine the presence of ESBL resistance mechanisms [33].
The results suggest that antimicrobial resistance to commonly used antimicrobials (such as tetracycline and penicillin) in apparently healthy sheep and beef cattle in England and Wales is much lower than that reported from national clinical surveillance [6,34]. This is probably because clinical samples are more likely to come from sick animals that have already been treated with antimicrobials before submission. Additionally, beef and dairy cattle samples are often not separated when reporting antimicrobial resistance [6]. In apparently healthy dairy cattle, the proportion of resistant isolates is much higher than the beef cattle reported here [35]. Although antimicrobial resistance appears to be low on sheep and beef farms in England and Wales, these figures were higher than what was reported historically. In 1999, 3% of isolates from sheep, and 6% of isolates from cattle were resistant to one or more antimicrobials [9]. In contrast, in our study, 10% of isolates from sheep, and 15% of isolates from cattle were non-wild type for one or more antimicrobials. Similarly, less than 4% of E. coli isolates from Scottish beef farms between 2001 and 2004 were resistant to tetracycline [8], compared with 12% of beef isolates in our study. This difference in susceptibility may be due to differences in study design, for example, differences in the antimicrobials studied or sampling technique. Additionally, the use of different interpretation methods may play a role in the varying antimicrobial susceptibilities as an organism that is classed as non-wild type does not necessarily display clinical resistance. Alternatively, differences in susceptibilities between the studies may be due to changes in farm practices over the last twenty years. This highlights the need for regular and consistent surveillance of antimicrobial resistance on sheep and beef farms in the UK so that longitudinal comparisons can be made.
The majority of the variance in antimicrobial susceptibility between isolates was due to between-sample differences, whereas only a small proportion of variance was due to between-farm differences. Around half of the between-farm variance could be explained by the use of tetracycline on the farm and the concentration of copper in the soils; however, there was still a large proportion of between-sample variation that was unexplained. This suggests that differences in antimicrobial resistance patterns are due to the variability in management of individual animals rather than any whole flock or herd management practices. The results probably reflect that antimicrobials are not usually used as routine prophylactic (preventative) treatments on sheep and beef farms in the UK, and in most cases farmers only use antimicrobials for the treatment of sick individual animals [3,36]. This is encouraging as there has been a large push in the UK agriculture industry to voluntarily reduce antimicrobial use over the last five years, particularly targeted at whole flock and herd treatments [36,37]. The large sample-level variance may also be due to the individual characteristics of the animals. For example, cattle over the age of 25 months have been shown to carry significantly less antimicrobial-resistant E. coli compared with younger cattle [17]. It was not possible to gather much sample-level information in this study as fecal samples were collected from the ground rather than directly from the animals. To understand the sources of variance at the sample level, further investigation using samples obtained directly from individual animals is recommended. The high variability between samples suggests that future studies that aim to understand the drivers of antimicrobial resistance on farms should consider taking individual animal samples rather than pooled samples.
The use of phenicols and tetracyclines was significantly associated with tetracycline non-wild type isolates in the univariable analysis. The association between tetracycline use and tetracycline non-wild type isolates is not surprising and has previously been reported for other livestock species [13,15]. The use of a particular antimicrobial will result in the direct selection of the corresponding resistance [38]. Phenicol use might indirectly select for tetracycline resistance via cross-resistance mechanisms. Alternatively, phenicol use may be associated with tetracycline non-wild type isolates if farmers change their antimicrobial drug of choice from tetracycline to phenicol when they find tetracyclines are no longer as effective for them. Tetracyclines are used as first-line treatments for livestock in the UK, whereas phenicols are in a higher category of antimicrobial which should only be used when first-line treatments are unavailable, for example, in cases of clinical tetracycline resistance [39]. Other factors that were identified as significant influences on antimicrobial resistance in previous studies, such as weather [35] and farm size [17], were not significant in our study. One possible reason for this is that for the dependent variable, there was only a small proportion of non-wild type isolates for tetracycline.
The concentration of copper in the soils in the farm area and the use of tetracyclines were significantly associated with tetracycline non-wild type isolates in the multivariable analysis. Previous research indicates that the geochemical conditions of soils, particularly copper concentrations, are correlated with the abundance of antimicrobial resistance genes [40,41]. Furthermore, copper has been shown to co-select for tetracycline resistance in experimental conditions [42], and mathematical models suggest that this co-selection may occur at copper concentrations as low as 5.5 mg/mL [43]. Our results suggest that tetracycline non-susceptibility may be more prevalent on some farms due to the environmental exposure to copper in soils. There needs to be further investigation into the presence of copper resistance genes in the tetracycline non-wild type isolates obtained in this study.

Limitations

The study sample was small; however, the number of farms was comparable to that of similar studies investigating antimicrobial resistance at the farm level and the farms represented a range of farm types and sizes [44,45]. Additionally, the farms were mainly located in Wales and the West of England, where sheep and cattle are more densely populated [46,47]. This was a cross-sectional study and so changes in antimicrobial resistance over time could not be measured. Additionally, information was mainly only collected at the farm level, but analysis indicated that most of the variation in resistance was at the sample level. Further investigation using a longitudinal study design and collecting sample-level information from individual animals is required to understand additional variation in resistance levels on farms. The β-glucuronidase-positive E. coli isolates were the focus here, although other species not studied are likely to also be environmentally important.

4. Materials and Methods

4.1. Participant Recruitment

Farmers identified for participation in the study were those that had previously completed a sheep flock health survey, beef herd health survey or both. The survey was distributed by a British retailer; therefore, all farms participating in this study supply to the retailer. Those that indicated that they would be interested in sharing their antimicrobial use data in the survey were contacted by their preferred form of contact, either telephone or email. Farmers were contacted in order of preference until thirty-five farms were recruited. Preference was farms that had sheep and/or cattle numbers that were representative of the producer average based on previous survey data [3].
The study was approved by the University of Nottingham School of Veterinary Medicine and Science Ethics Committee (No. 1850 160916).

4.2. Sample Collection

Each farm was visited between February and October 2019. Ten fecal samples from either sheep or beef cattle were taken at each farm. Random samples of fresh feces were taken from the field or pen floor and each placed into a sterile bag. Previous research shows that taking samples from the floor provides similar antimicrobial resistance profiles to taking samples directly from the rectum of the animals [48,49]. Therefore, samples from the floor were taken to reduce stress on the animals. Location of sample collection was not the same for each farm due to the different production systems. Therefore, sample collection location was recorded (e.g., indoor pen or outdoor pasture). Farmers were asked if they thought any of the animals in the field/pen had been given antimicrobials in the past two weeks. If so, the fecal samples were excluded from further analysis. The samples were kept cool and were processed within 24 h at laboratories at the University of Nottingham.

4.3. Isolation of Escherichia coli

For each sample, 2 g of feces was weighed and suspended in 18 mL of Maximum Recovery Diluent (MRD) (Oxoid). Samples were serially diluted, and 200 µL aliquots were plated onto Tryptone Bile X-glucuronide (TBX) agar (Oxoid) for the detection of β-glucuronidase-positive E. coli. E. coli form blue colonies on these plates while other Enterobacteriaceae form white colonies. TBX plates were incubated at 35 °C for 24 h. For each sample, the number of colonies with a typical E. coli phenotype were counted. The plate with between 30 and 300 colonies was chosen, and six blue colonies from each plate were picked for streak plating. Single colonies were streaked onto Luria-Bertani (LB) agar (Lennox) and incubated at 35 °C for 24 h. From each plate, a single colony was put into a Microbank (Pro-Lab Diagnotics UK) and placed in a −80 °C freezer.

4.4. Antimicrobial Susceptibility Testing

At least three isolates from each sample were chosen for antimicrobial susceptibility testing. Antimicrobial susceptibility testing was undertaken following the EUCAST guidelines [22]. Antimicrobial resistance testing was carried out for ten antimicrobials using the disk diffusion method. Colonies were suspended in MRD until it reached 0.5 McFarland standard. The dilution was then streaked across a Mueller-Hinton Agar plate (Oxoid), and the 10 antimicrobial disks were placed onto the surface of the agar. The plates were incubated for 24 h at 35 °C. The zone diameters were then recorded using the EUCAST guidelines where possible [24]. For antimicrobials that do not have EUCAST breakpoints available, CLSI guidelines were followed [23]. All antimicrobials used are shown in Table 8 and were supplied by Oxoid (Basingstoke, UK).

4.5. Terminology

Epidemiological cut-off values determined by EUCAST are referred to by the acronym ECOFF. For differentiation from the ECOFF values, the sheep-specific and beef-specific cut-off values determined by the NRI method in this study are referred to by the acronym sheep COWT and beef COWT, respectively.
COWT and ECOFF values determine WT and NWT organisms, where WT organisms are characterised as devoid of phenotypically detectable acquired resistance mechanisms. The term “resistant” is reserved for clinically resistant organisms. Clinical breakpoints determine susceptible (S) and resistant (R) organisms, where S organisms are characterised by a level of antimicrobial activity associated with a high likelihood of therapeutic success [25].

4.6. Data Analysis

Data cleaning, descriptive analysis, cluster analyses and univariable multilevel logistic regression modelling were carried out in Stata software (Stata SE/16.1, Stata Corp., College Station, TX, USA). The isolates obtained from three samples from Farm 2 were excluded from analysis as the sampled sheep were recently administered antimicrobials. The data used for this study are available in the Supplementary Material.

4.6.1. Determining Cut-Off Values

Clinical breakpoints, ECOFFs and COWT values were used to determine the proportion of fully susceptible/wild type organisms. The normalised resistance interpretation (NRI) method was used to calculate sheep COWT and beef COWT. NRI is based on the assumption that the wild type distribution is normal. The mean and the standard deviation are calculated from a plot of probit values of their cumulative frequencies of observations against their respective susceptibility measures [28]. The COWT was determined as 2.5 standard deviations from the mean. The automatic and manual Excel programs used to calculate the COWT were made available through courtesy by P. Smith, W. Finnegan and G. Kronvall [50].
Upon inspection of the disk plots produced using the NRI automatic cut-off calculator, the calculated cut-offs for ciprofloxacin and chloramphenicol for sheep and imipenem and chloramphenicol for beef were deemed inappropriate. This was because of an outlying peak in the high-zone part. For these four NRI calculations, the manual NRI calculator was used instead. Usually, the first drop in the rolling means determines the putative peak used for the NRI calculations, whereas if there was an outlying peak in the high-zone part, the second drop in the rolling means was used to determine the putative peak [28].
The NRI method was used with permission from the patent holder, Bioscand AB, TÄBY, Sweden (European patent No 1383913, US Patent No. 7,465,559).

4.6.2. Descriptive Statistics

The proportion of susceptible/wild type E. coli isolates was calculated for each antimicrobial used for the susceptibility testing. The kappa-statistic was used to measure the level of agreement between the interpretations of clinical breakpoints, ECOFFs and COWT values. A score of 1 indicates perfect agreement, and a score of 0 indicates the amount of agreement that would be expected to be observed by chance [51]. The proportion of farms that had full susceptibility/wild type to each antimicrobial was also calculated.

4.6.3. Cluster Analysis

To determine potential groupings in antimicrobial resistances, single-linkage hierarchical agglomerative clustering was implemented [52]. The Jaccard similarity measure was used to compare antimicrobial susceptibility for ten antimicrobials, saving one minus the Jaccard measure as a dissimilarity matrix. Cluster analysis was performed four times to produce dendrograms for antimicrobial susceptibility for (1) sheep isolates using the COWT values, (2) sheep isolates using clinical breakpoints, (3) beef isolates using COWT values and (4) beef isolates using clinical breakpoints. A low dissimilarity measure indicated that two antimicrobial susceptibilities were related. A dissimilarity measure of zero indicated that all isolates were susceptible to both antimicrobials.

4.6.4. Multilevel Logistic Regression Base Model

A binary variable for tetracycline non-wild type (based on COWT values) was chosen as the dependent variable as this antimicrobial had the lowest proportion of antimicrobial susceptibility for both sheep and beef isolates. Multilevel logistic regression was not performed for the other antimicrobials because there were very few isolates that were non-susceptible to the other antimicrobial families. A base model with no predictor variables and three levels was run. If y ijk = 1 if the ith isolate from sample j from farm k is non-wild type for tetracycline and y ijk = 0 if it is wild type for tetracycline, then we model:
y ijk ~ Bernouilli ( π ijk )
logit ( π ijk ) = β + v k + u jk
v k = N ( 0 , σ v 2 ) ,   u jk ~ N ( 0 , σ u 2 )
where β is the probability of the isolate being non-wild type, u jk is the sample effects (with variance σ u 2 ) and v k is the farm effects (with variance σ v 2 ).
The intraclass correlation coefficients were determined to understand the underlying variation in susceptibility at the sample and farm level.

4.6.5. Multivariable Multilevel Random-Intercept Logistic Regression

Additional data were collected to investigate risk factors that might be associated with tetracycline non-susceptibility, based on the findings of previous research [13,14,16,20]. Meteorological data were extracted from UK Meteorological Office data [53]. The average maximum and minimum temperature (°C), and rainfall (mm) from the closest weather station for the month of sample collection were recorded for each farm. Soil data were extracted from the UK Soil Observatory based on the postcode of each farm [54]. Antimicrobial use data were collected using the bin method [55]. In a visit prior to the sample collection, farms were instructed to place any empty antimicrobial packaging used in sheep/beef cattle into a bin. The contents of the bin were collected during the sampling visit. From this, a binary variable for the presence/absence of each antimicrobial class was produced.
A univariable three-level logistic regression analysis was carried out to determine associations with isolates being tetracycline non-wild type. Variables with p ≤ 0.2 were considered for the multivariable three-level random-intercept logistic regression model. The multivariable multilevel logistic regression model was fitted in MLwiN 3.02 [56]. Initially, model exploration was conducted using first-order marginal quasi-likelihood. Then, Markov-chain Monte Carlo (MCMC) simulations using Metropolis–Hastings sampling with diffuse priors, a burn-in length of 5000 and a run of 50,000 iterations were used to fit the multivariable model. The Raftery–Lewis diagnostic suggested that a Markov chain of at least 435,000 was needed to estimate the 2.5% quantile for the intercept coefficient. Therefore, MCMC simulations with a burn-in length of 10,000 and a run of 500,000 iterations were used to fit the final multivariable multilevel logistic regression model. A forward and backward selection stepwise model-building approach was used, where only variables with p ≤ 0.05 were selected to remain in the model. If y ijk = 1 if the ith isolate from sample j from farm k is non-wild type to tetracycline and y ijk = 0 if it is wild type to tetracycline, then we model:
y ijk ~ Bernouilli ( π ijk )
logit ( π ijk ) = β 0 + β 1 TetracyclineUse ijk + β 2 CuConc ijk + v k + u jk
v k = N ( 0 , σ v 2 ) ,   u jk ~ N ( 0 , σ u 2 )
where β 0 is the intercept; β 1 is the coefficient for the effect of a unit increase of the predictor TetracyclineUse ijk on the outcome; β 2 is the coefficient for the effect of a unit increase of the predictor CuConc ijk on the outcome; and v k and u jk are the random effects at the farm and sample level, respectively.
The variance partitioning coefficients were calculated under the latent variable method, which assumes the binary outcome arises from an underlying continuous distribution and that the level 1 variance on the logit scale is π2/3 [57].
VPC k = σ v 2 / ( σ v 2 + σ u 2 + π 2 / 3 )
VPC j = ( σ v 2 + σ u 2 ) / ( σ v 2 + σ u 2 + π 2 / 3 )
where VPCk is the VPC at the farm level, VPCj is the VPC at the sample level, σ v 2 is the variance at the farm level, and σ u 2 is the variance at the sample level.
Selection of the best fitting model was based on the value of Bayesian Deviance Information Criterion (DIC). The model with the lowest DIC value was considered the best fitting model.

5. Conclusions

Antimicrobial non-susceptibility of E. coli isolated from healthy sheep and beef cattle in England and Wales appears to be low compared with reports from clinical diagnostic isolates. However, antimicrobial non-susceptibility from healthy animals may have increased in the past twenty years. The use of tetracyclines on farms and environmental copper exposure in soils may contribute to tetracycline resistance. Uniform methods of antimicrobial susceptibility testing are required to make longitudinal comparisons and monitor long-term changes in resistance patterns. Using human clinical breakpoints could lead to the under-reporting and over-reporting of antimicrobial resistance in sheep and beef cattle. The use of livestock-specific cut-off values for interpreting antimicrobial susceptibility can provide more appropriate estimates of susceptibility for sheep and beef cattle.

Supplementary Materials

The data used for this study are available in the Supplementary Material available online at https://0-www-mdpi-com.brum.beds.ac.uk/article/10.3390/antibiotics10040453/s1.

Author Contributions

Conceptualisation, C.D., H.W. and J.K.; methodology, C.D., H.W. and J.K.; formal analysis, C.D.; investigation, C.D.; resources, H.W. and J.K.; data curation, C.D.; writing—original draft preparation, C.D.; writing—review and editing, H.W. and J.K.; visualisation, C.D.; supervision, H.W. and J.K.; project administration, C.D., H.W. and J.K.; funding acquisition, J.K. All authors have read and agreed to the published version of the manuscript.

Funding

C.D. was funded by the Agricultural and Horticultural Development Board, ref. 61110063.

Institutional Review Board Statement

The study was approved by the University of Nottingham School of Veterinary Medicine and Science Ethics Committee (No. 1850 160916).

Informed Consent Statement

Informed consent was obtained from all farmers involved in the study.

Data Availability Statement

The data presented in this study are available in the Supplementary Material.

Acknowledgments

We would like to thank the farmers who took part in the study, Nikki Bollard for her technical help, and Lis King for her useful comments on the manuscript.

Conflicts of Interest

The authors declare no conflict of interest. The funders had no role in the design of the study; in the collection, analyses, or interpretation of data; in the writing of the manuscript, or in the decision to publish the results.

References

  1. Marshall, B.M.; Levy, S.B. Food Animals and Antimicrobials: Impacts on Human Health. Clin. Microbiol. Rev. 2011, 24, 718–733. [Google Scholar] [CrossRef] [PubMed] [Green Version]
  2. Davies, P.; Remnant, J.G.; Green, M.J.; Gascoigne, E.; Gibbon, N.; Hyde, R.; Porteous, J.R.; Schubert, K.; Lovatt, F.; Corbishley, A. Quantitative analysis of antibiotic usage in British sheep flocks. Vet. Rec. 2017, 181, 511. [Google Scholar] [CrossRef] [PubMed]
  3. Doidge, C.; Hudson, C.D.; Burgess, R.; Lovatt, F.; Kaler, J. Antimicrobial use practices and opinions of beef farmers in England and Wales. Vet. Rec. 2020, 187, e119. [Google Scholar] [CrossRef]
  4. DEFRA. Farming Statistics Final Land Use, Livestock Populations and Agricultural Workforce at 1 June 2018—England. Available online: https://assets.publishing.service.gov.uk/government/uploads/system/uploads/attachment_data/file/869064/structure-jun2018final-eng-28feb20.pdf (accessed on 4 November 2020).
  5. Welsh Government. Farming Facts and Figure, Wales. 2019. Available online: https://gov.wales/sites/default/files/statistics-and-research/2019-07/farming-facts-and-figures-2019-492.pdf (accessed on 12 December 2020).
  6. VMD. UK Veterinary Antibiotic Resistance and Sales Surveillance Report. 2019. Available online: https://assets.publishing.service.gov.uk/government/uploads/system/uploads/attachment_data/file/936107/UK-VARSS_2019_Report__2020_.pdf (accessed on 19 November 2020).
  7. Hennessey, M.; Whatford, L.; Payne-Gifford, S.; Johnson, K.F.; Van Winden, S.; Barling, D.; Häsler, B. Antimicrobial & antiparasitic use and resistance in British sheep and cattle: A systematic review. Prev. Vet. Med. 2020, 185, 105174. [Google Scholar] [CrossRef] [PubMed]
  8. Vali, L.; Hamouda, A.; Hoyle, D.V.; Pearce, M.C.; Whitaker, L.H.R.; Jenkins, C.; Knight, H.I.; Smith, A.W.; Amyes, S.G.B. Antibiotic resistance and molecular epidemiology of Escherichia coli O26, O103 and O145 shed by two cohorts of Scottish beef cattle. J. Antimicrob. Chemother. 2007, 59, 403–410. [Google Scholar] [CrossRef] [PubMed]
  9. Enne, V.I.; Cassar, C.; Sprigings, K.; Woodward, M.J.; Bennett, P.M. A high prevalence of antimicrobial resistant Escherichia coli isolated from pigs and a low prevalence of antimicrobial resistant E. coli from cattle and sheep in Great Britain at slaughter. FEMS Microbiol. Lett. 2008, 278, 193–199. [Google Scholar] [CrossRef] [Green Version]
  10. Silva, N.; Phythian, C.J.; Currie, C.; Tassi, R.; Ballingall, K.T.; Magro, G.; McNeilly, T.N.; Zadoks, R.N. Antimicrobial resistance in ovine bacteria: A sheep in wolf’s clothing? PLoS ONE 2020, 15, e0238708. [Google Scholar] [CrossRef]
  11. Snow, L.C.; Wearing, H.; Stephenson, B.; Teale, C.J.; Coldham, N.G. Investigation of the presence of ESBL-producing Escherichia coli in the North Wales and West Midlands areas of the UK in 2007 to 2008 using scanning surveillance. Vet. Rec. 2011, 169, 656. [Google Scholar] [CrossRef] [PubMed]
  12. Velasova, M.; Smith, R.P.; Lemma, F.; Horton, R.A.; Duggett, N.; Evans, J.; Tongue, S.C.; Anjum, M.F.; Randall, L. Detection of extended-spectrum β-lactam, AmpC and carbapenem resistance in Enterobacteriaceae in beef cattle in Great Britain in 2015. J. Appl. Microbiol. 2019, 126, 1081–1095. [Google Scholar] [CrossRef] [PubMed]
  13. Varga, C.; Rajić, A.; McFall, M.E.; Reid-Smith, R.J.; Deckert, A.E.; Checkley, S.L.; McEwen, S.A. Associations between reported on-farm antimicrobial use practices and observed antimicrobial resistance in generic fecal Escherichia coli isolated from Alberta finishing swine farms. Prev. Vet. Med. 2009, 88, 185–192. [Google Scholar] [CrossRef]
  14. Bosman, A.; Wagenaar, J.; Stegeman, J.; Vernooij, J.; Mevius, D. Antimicrobial resistance in commensal Escherichia coli in veal calves is associated with antimicrobial drug use. Epidemiol. Infect. 2014, 142, 1893–1904. [Google Scholar] [CrossRef] [Green Version]
  15. Gibbons, J.F.; Boland, F.M.; Egan, J.B.; Fanning, S.W.; Markey, B.K.; Leonard, F.C. Antimicrobial Resistance of Faecal Escherichia coli Isolates from Pig Farms with Different Durations of In-feed Antimicrobial Use. Zoonoses Public Health 2016, 63, 241–250. [Google Scholar] [CrossRef]
  16. Berge, A.C.; Hancock, D.D.; Sischo, W.M.; Besser, T.E. Geographic, farm, and animal factors associated with multiple antimicrobial resistance in fecal Escherichia coli isolates from cattle in the western United States. J. Am. Vet. Med. Assoc. 2010, 236, 1338–1344. [Google Scholar] [CrossRef]
  17. Mainda, G.; Bessell, P.R.; Muma, J.B.; McAteer, S.P.; Chase-Topping, M.E.; Gibbons, J.; Stevens, M.P.; Gally, D.L.; Bronsvoort, B.M.D. Prevalence and patterns of antimicrobial resistance among Escherichia coli isolated from Zambian dairy cattle across different production systems. Sci. Rep. 2015, 5, srep12439. [Google Scholar] [CrossRef] [PubMed] [Green Version]
  18. Mir, R.A.; Weppelmann, T.A.; Johnson, J.A.; Archer, D.; Morris, J.G., Jr.; Jeong, K.C. Identification and Characterization of Cefotaxime Resistant Bacteria in Beef Cattle. PLoS ONE 2016, 11, e0163279. [Google Scholar] [CrossRef] [Green Version]
  19. Mir, R.A.; Weppelmann, T.A.; Teng, L.; Kirpich, A.; Elzo, M.A.; Driver, J.D.; Jeong, K.C. Colonization Dynamics of Cefotaxime Resistant Bacteria in Beef Cattle Raised Without Cephalosporin Antibiotics. Front. Microbiol. 2018, 9, 500. [Google Scholar] [CrossRef] [PubMed]
  20. Markland, S.; Weppelmann, T.A.; Ma, Z.; Lee, S.; Mir, R.A.; Teng, L.; Ginn, A.; Lee, C.; Ukhanova, M.; Galindo, S.; et al. High Prevalence of Cefotaxime Resistant Bacteria in Grazing Beef Cattle: A Cross Sectional Study. Front. Microbiol. 2019, 10, 176. [Google Scholar] [CrossRef] [Green Version]
  21. Lee, S.; Mir, R.A.; Park, S.H.; Kim, D.; Kim, H.-Y.; Boughton, R.K.; Morris, J.G., Jr.; Jeong, K.C. Prevalence of extended-spectrum β-lactamases in the local farm environment and livestock: Challenges to mitigate antimicrobial resistance. Crit. Rev. Microbiol. 2020, 46, 1–14. [Google Scholar] [CrossRef] [PubMed]
  22. EUCAST. EUCAST Disk Diffusion Method for Antimicrobial Susceptibility Testing. Available online: https://www.eucast.org/fileadmin/src/media/PDFs/EUCAST_files/Disk_test_documents/2020_manuals/Manual_v_8.0_EUCAST_Disk_Test_2020.pdf (accessed on 24 November 2020).
  23. CLSI. Performance Standards for Antimicrobial Susceptibility Testing, 30th ed.; Clinical and Laboratory Standards Institute: Pittsburgh, PA, USA, 2020. [Google Scholar]
  24. EUCAST. Breakpoint Tables for Interpretation of MICs and Zone Diameters; Version 8.1; EUCAST: Växjö, Sweden, 2018; Available online: http://www.eucast.org (accessed on 24 November 2020).
  25. EUCAST. EUCAST Definitions of Clinical Breakpoints and Epidemiological Cutoff Values. Available online: https://www.eucast.org/fileadmin/src/media/PDFs/EUCAST_files/EUCAST_SOPs/EUCAST_definitions_of_clinical_breakpoints_and_ECOFFs.pdf (accessed on 24 November 2020).
  26. Kahlmeter, G. Defining antibiotic resistance-towards international harmonization. Upsala J. Med Sci. 2014, 119, 78–86. [Google Scholar] [CrossRef]
  27. Dias, D.; Torres, R.T.; Kronvall, G.; Fonseca, C.; Mendo, S.; Caetano, T. Assessment of antibiotic resistance of Escherichia coli isolates and screening of Salmonella spp. in wild ungulates from Portugal. Res. Microbiol. 2015, 166, 584–593. [Google Scholar] [CrossRef]
  28. Kronvall, G.; Smith, P. Normalized resistance interpretation, the NRI method. APMIS 2016, 124, 1023–1030. [Google Scholar] [CrossRef] [PubMed]
  29. Pereira, R.V.; Siler, J.D.; Ng, J.C.; Davis, M.A.; Grohn, Y.T.; Warnick, L.D. Effect of on-farm use of antimicrobial drugs on resistance in fecal Escherichia coli of preweaned dairy calves. J. Dairy Sci. 2014, 97, 7644–7654. [Google Scholar] [CrossRef] [PubMed] [Green Version]
  30. Lim, Y.-J.; Kim, D.-H.; Roh, H.J.; Park, M.-A.; Park, C.-I.; Smith, P. Epidemiological cut-off values for disc diffusion data generated by standard test protocols from Edwardsiella tarda and Vibrio harveyi. Aquac. Int. 2016, 24, 1153–1161. [Google Scholar] [CrossRef]
  31. Smith, P.; Schwarz, T.; Verner-Jeffreys, D.W. Use of normalised resistance analyses to set interpretive criteria for antibiotic disc diffusion data produce by Aeromonas spp. Aquaculture 2012, 326–329, 27–35. [Google Scholar] [CrossRef]
  32. Li, X.-Z.; Mehrotra, M.; Ghimire, S.; Adewoye, L. β-Lactam resistance and β-lactamases in bacteria of animal origin. Vet. Microbiol. 2007, 121, 197–214. [Google Scholar] [CrossRef]
  33. EUCAST. Subcommittee for Detection of Resistance Mechanisms and Specific Resistances of Clinical and/or Epidemiological Importance. EUCAST Guidelines for Detection of Resistance Mechanisms and Specific Resistances of Clinical and/or Epidemiological Importance, Version 2.0. Available online: http://www.eucast.org/fileadmin/src/media/PDFs/EUCAST_files/Resistance_mechanisms/EUCAST_detection_of_resistance_mechanisms_170711.pdf (accessed on 24 November 2020).
  34. Cheney, T.E.A.; Smith, R.P.; Hutchinson, J.P.; Brunton, L.A.; Pritchard, G.; Teale, C.J. Cross-sectional survey of antibiotic resistance in Escherichia coli isolated from diseased farm livestock in England and Wales. Epidemiol. Infect. 2015, 143, 2653–2659. [Google Scholar] [CrossRef] [Green Version]
  35. Schubert, H.; Morley, K.; Puddy, E.F.; Arbon, R.; Findlay, J.; Mounsey, O.; Gould, V.C.; Vass, L.; Evans, M.; Rees, G.M.; et al. Reduced Antibacterial Drug Resistance and blaCTX-M β-Lactamase Gene Carriage in Cattle-Associated Escherichia coli at Low Temperatures, at Sites Dominated by Older Animals, and on Pastureland: Implications for Surveillance. Appl. Environ. Microbiol. 2021, 87, e01468-20. [Google Scholar] [CrossRef]
  36. Doidge, C.; Ruston, A.; Lovatt, F.; Hudson, C.; King, L.; Kaler, J. Farmers’ Perceptions of Preventing Antibiotic Resistance on Sheep and Beef Farms: Risk, Responsibility, and Action. Front. Vet. Sci. 2020, 7, 524. [Google Scholar] [CrossRef]
  37. RUMA. Targets Task Force Report. Available online: https://www.ruma.org.uk/wp-content/uploads/2020/11/Targets-Task-Force-Report-2020-FINAL-181120-download.pdf (accessed on 30 November 2020).
  38. Harada, K.; Asai, T. Role of antimicrobial selective pressure and secondary factors on antimicrobial resistance prevalence in Escherichia coli from food-producing animals in Japan. J. Biomed. Biotechnol. 2010, 2010, 180682. [Google Scholar] [CrossRef] [Green Version]
  39. EMA. Categorisation of Antibiotics in the European Union. Available online: https://www.ema.europa.eu/en/documents/report/categorisation-antibiotics-european-union-answer-request-european-commission-updating-scientific_en.pdf (accessed on 30 November 2020).
  40. Knapp, C.W.; McCluskey, S.M.; Singh, B.K.; Campbell, C.D.; Hudson, G.; Graham, D.W. Antibiotic Resistance Gene Abundances Correlate with Metal and Geochemical Conditions in Archived Scottish Soils. PLoS ONE 2011, 6, e27300. [Google Scholar] [CrossRef]
  41. Knapp, C.W.; Callan, A.C.; Aitken, B.; Shearn, R.; Koenders, A.; Hinwood, A. Relationship between antibiotic resistance genes and metals in residential soil samples from Western Australia. Environ. Sci. Pollut. Res. 2017, 24, 2484–2494. [Google Scholar] [CrossRef]
  42. Song, J.; Rensing, C.; Holm, P.E.; Virta, M.; Brandt, K.K. Comparison of Metals and Tetracycline as Selective Agents for Development of Tetracycline Resistant Bacterial Communities in Agricultural Soil. Environ. Sci. Technol. 2017, 51, 3040–3047. [Google Scholar] [CrossRef] [PubMed]
  43. Arya, S.; Williams, A.; Reina, S.V.; Knapp, C.W.; Kreft, J.-U.; Hobman, J.L.; Stekel, D.J. Towards a general model for predicting minimal metal concentrations co-selecting for antibiotic resistance plasmids. Environ. Pollut. 2021, 275, 116602. [Google Scholar] [CrossRef] [PubMed]
  44. Carson, C.A.; Reid-Smith, R.; Irwin, R.J.; Martin, W.S.; McEwen, S.A. Antimicrobial resistance in generic fecal Escherichia coli from 29 beef farms in Ontario. Can. J. Vet. Res. 2008, 72, 119–128. [Google Scholar]
  45. Schmid, A.; Hörmansdorfer, S.; Messelhäusser, U.; Käsbohrer, A.; Sauter-Louis, C.; Mansfeld, R. Prevalence of Extended-Spectrum β-Lactamase-Producing Escherichia coli on Bavarian Dairy and Beef Cattle Farms. Appl. Environ. Microbiol. 2013, 79, 3027–3032. [Google Scholar] [CrossRef] [Green Version]
  46. APHA. Livestock Demographic Data Group: Cattle Population Report. Available online: http://apha.defra.gov.uk/documents/surveillance/diseases/lddg-pop-report-cattle-1118.pdf (accessed on 2 February 2021).
  47. APHA. Livestock Demographic Data Group: Sheep Population Report. Available online: http://apha.defra.gov.uk/documents/surveillance/diseases/lddg-pop-report-sheep-1118.pdf (accessed on 2 February 2021).
  48. Benedict, K.M.; Gow, S.P.; Checkley, S.; Booker, C.W.; McAllister, T.A.; Morley, P.S. Methodological comparisons for antimicrobial resistance surveillance in feedlot cattle. BMC Vet. Res. 2013, 9, 216. [Google Scholar] [CrossRef] [PubMed] [Green Version]
  49. Rosager, W.N.; Peter, N.J.; Lind, J.S.E.; Svend, H.; Matthew, D.; Steen, P.K. Comparison of antimicrobial resistance in E. coli isolated from rectal and floor samples in pens with diarrhoeic nursery pigs in Denmark. Prev. Vet. Med. 2017, 147, 42–49. [Google Scholar] [CrossRef] [Green Version]
  50. Smith, P.; Finnegan, W.; Ngo, T.; Kronvall, G. Influence of incubation temperature and time on the precision of MIC and disc diffusion antimicrobial susceptibility test data. Aquaculture 2018, 490, 19–24. [Google Scholar] [CrossRef]
  51. Fleiss, J.L.; Levin, B.; Paik, M.C. Statistical Methods for Rates and Proportions, 3rd ed.; John Wiley & Sons: Hoboken, NJ, USA, 2003. [Google Scholar]
  52. Romesburg, C. Cluster Analysis for Researchers; Lulu Press: Morrisville, NC, USA, 2004. [Google Scholar]
  53. Met Office. Historic Station Data. Available online: https://www.metoffice.gov.uk/research/climate/maps-and-data/historic-station-data (accessed on 24 November 2020).
  54. UK Soil Observatory. Advanced Soil Geochemical Atlas of England and Wales. Available online: http://ukso.org/static-maps/advanced-soil-geochemical-atlas-of-england-and-wales.html (accessed on 5 December 2020).
  55. Saini, V.; McClure, J.; Léger, D.; Dufour, S.; Sheldon, A.; Scholl, D.; Barkema, H. Antimicrobial use on Canadian dairy farms. J. Dairy Sci. 2012, 95, 1209–1221. [Google Scholar] [CrossRef]
  56. Charlton, C.; Rabash, J.; Browne, W.; Healy, M.; Cameron, B. MLwiN; 3.02; Centre for Multilevel Modelling, University of Bristol: Brisotl, UK, 2017. [Google Scholar]
  57. Leyland, A.H.; Groenewegen, P.P. Apportioning Variation in Multilevel Models. In Multilevel Modelling for Public Health and Health Services Research; Leyland, A.H., Groenewegen, P.P., Eds.; Springer: Cham, Switzerland, 2020; pp. 89–104. [Google Scholar] [CrossRef]
Figure 1. Single-linkage clustering dendrograms for non-susceptibility to eight antimicrobials (A) based on the NRI COWT values in E. coli isolates from beef cattle fecal samples (n = 416); (B) based on clinical breakpoints, in E. coli isolates from beef cattle fecal samples (n = 416); (C) based on the NRI COWT values, in E. coli isolates from sheep fecal samples (n = 699); and (D) based on clinical breakpoints, in E. coli isolates from sheep fecal samples (n = 699). AMP = ampicillin, AMC = amoxicillin/clavulanic acid, C = chloramphenicol, CIP = ciprofloxacin, CTX = cefotaxime, IPM = imipenem, SXT = sulfamethoxazole-trimethoprim, TE = tetracycline.
Antibiotics 10 00453 g001
Table 1. Description of the farms where E. coli isolates were obtained including number of animals, region and number of isolates tested.
Farm No.Regionn Beef Cattle (All Ages)n Ewesn Sheep Isolatesn Beef Isolates
1West Midlands2200030
2West Midlands2053701015
3West Midlands2819001316
4Wales1257501516
5South West England22400032
6West Midlands1723502515
7West Midlands3420032
8South West England5000036
9South West England2181058330
10Wales236840300
11Wales935502617
12Wales0250150
13Wales109584300
14South East England1988001013
15Wales39538280
16Wales41500390
17Wales17918501515
18Wales6008001515
19West Midlands1070030
20Wales161582300
21West Midlands0300390
22South West England49480290
23West Midlands157520400
24South West England64560300
25South West England209600290
26North East England2005002515
27North West England4200030
28South West England2410030
29Wales0300280
30Wales1454662715
31Wales23360390
32Wales56416001515
33West Midlands2850029
34West Midlands0600310
35Wales40425330
n = number.
Table 2. Epidemiological cut-off values calculated using the NRI method compared with clinical breakpoints and ECOFF values.
AntimicrobialsDisk ContentClinical Breakpoint (S ≥ mm)ECOFF WT ≥ mmSheep COWT WT ≥ mmSDBeef COWT WT ≥ mmSD
Neomycin30 μg--131.46141.87
Spectinomycin100 μg--191.91182.06
Tetracycline30 μg15-252.25262.17
Amoxicillin/Clavulanic Acid20–10 µg1916153.1515 *3.66
Ciprofloxacin5 µg252527 *3.72322.42
Ampicillin10 µg1414123.2611 *3.61
Sulfamethoxazole-Trimethoprim23.75–1.25 µg1421242.96242.72
Chloramphenicol30 µg171718 *3.5017 *3.65
Cefotaxime5 µg2021262.26263.04
Imipenem10 µg2224272.8227 *3.88
* SD > 3.34 mm and therefore COWT only a tentative estimate. S = susceptible, WT = wild type.
Table 3. Prevalence of antimicrobial susceptible (S) and wild type (WT) E. coli isolated from sheep using clinical breakpoints, ECOFFs and the NRI method.
Antimicrobialn
Isolates Sheep
Clinical Breakpoint (% S)ECOFF (% WT)Sheep COWT (% WT)Kappa
Neomycin 699--99.6%N/A
Spectinomycin699--95.9%N/A
Tetracycline69993.0%-92.1%0.938
Amoxicillin/Clavulanic Acid69995.4%97.4%98.1%0.689
Ciprofloxacin 699100%100%100%N/A
Ampicillin 69994.7%94.7%95.1%0.971
Sulfamethoxazole-Trimethoprim69998.0%98.0%97.9%0.976
Chloramphenicol69999.3%99.3%99.3%1.000
Cefotaxime 69999.7%99.1%98.7%0.585
Imipenem 699100%100%100%N/A
Table 4. Prevalence of antimicrobial susceptible (S) and wild type (WT) E. coli isolated from beef cattle using clinical breakpoints, ECOFFs and the NRI method.
Antimicrobialn
Isolates Beef
Clinical Breakpoint (% S)ECOFF (% WT)Beef COWT (% WT)Kappa
Neomycin 416--100%N/A
Spectinomycin 416--99.0%N/A
Tetracycline 41688.2%-87.7%0.977
Amoxicillin/Clavulanic Acid 41698.3%99.5%99.8%0.395
Ciprofloxacin 41699.8%99.8%99.0%0.423
Ampicillin 41697.8%97.8%97.8%1.000
Sulfamethoxazole-Trimethoprim41699.5%99.5%98.1%0.495
Chloramphenicol41697.6%97.6%97.6%1.000
Cefotaxime 41699.5%99.3%99.0%0.776
Imipenem416100%100%100%N/A
Table 5. Farm-level prevalence of antimicrobial susceptibility of all E. coli isolated from sheep and beef farms based on the NRI method (COWT) and clinical breakpoints.
AntimicrobialFarms Having All Isolates as Wild Type
COWTClinical breakpoint
Neomycin33/35 (94%)-
Spectinomycin21/35 (60%)-
Tetracycline9/35 (26%)10/35 (29%)
Amoxicillin/Clavulanic Acid30/35 (86%)18/35 (51%)
Ciprofloxacin32/35 (91%)34/35 (97%)
Ampicillin17/35 (49%)16/35 (46%)
Sulfamethoxazole-Trimethoprim22/35 (63%)26/35 (74%)
Chloramphenicol27/35 (77%)27/35 (77%)
Cefotaxime31/35 (86%)32/35 (91%)
Imipenem35/35 (100%)35/35 (100%)
Table 6. Univariable multilevel logistic regression analysis for risk factors associated with E. coli defined as non-wild type for tetracycline.
FactorUnitnOdds Ratio (95% CI)p-Value
Flock sizen ewes11150.91 (0.46, 1.81)0.792
Herd sizen cattle > 12 months11150.90 (0.44, 1.82)0.761
Region: WalesNo737
Yes3781.62 (0.37, 7.11)0.523
Region: West Midlands (England)No790
Yes3251.08 (0.23, 5.13)0.924
Region: Southern EnglandNo823
Yes2420.39 (0.07, 2.25)0.292
Indoor samplesNo568
Yes5472.90 (0.77, 10.97)0.116
Mixed species farmNo362
Yes 7531.93 (0.41, 9.09)0.404
Animal species sample originCattle416
Sheep6990.38 (0.11, 1.28)0.118
Maximum average temperature of sampling month°C11150.90 (0.45, 1.79)0.760
Minimum average temperature of sampling month°C11150.79 (0.49, 1.95)0.939
Average rainfall in sampling monthmm11151.23 (0.62, 2.42)0.556
Tetracycline useNo159
Yes95622.21 (1.46, 337.52)0.026
Penicillin useNo157
Yes9580.62 (0.09, 4.44)0.635
Aminoglycoside useNo363
Yes7520.52 (0.12, 2.19)0.376
Macrolide useNo634
Yes4811.95 (0.48, 7.90)0.384
Phenicol useNo825
Yes 2906.98 (1.82, 26.80)0.005
Sulphonamide useNo993
Yes1222.60 (0.32, 21.03)0.371
Soil copper concentrationmg/kg11151.72 (0.97–3.05)0.062
Soil zinc concentrationmg/kg11150.90 (0.45, 1.78)0.755
Soil lead concentrationmg/kg11151.60 (0.85, 3.00)0.144
Soil cobalt concentrationmg/kg11150.65 (0.34, 1.26)0.206
Table 7. Multivariable multilevel logistic regression analysis for risk factors associated with E. coli isolates being defined as non-wild type for tetracycline.
VariableUnitnOdds Ratio (95% CrI *)p-Value
Tetracycline useNo159
Yes95628.22 (2.50, 520.09)0.014
Soil copper concentrationmg/kg 11151.78 (1.02, 3.21)0.046
Random Effects Variance Estimate (95% CrI *)
Farm 1.24 (0.003, 4.47)
Sample 9.36 (4.86, 16.38)
* CrI = credible interval.
Table 8. Disk contents used to determine antimicrobial susceptibility of E. coli isolates and source of clinical breakpoints.
AntimicrobialsDisk ContentSource
Neomycin30 μgN/A
Spectinomycin100 μgN/A
Tetracycline30 μgCLSI
Amoxicillin/Clavulanic Acid20–10 µgEUCAST
Ciprofloxacin5 µgEUCAST
Ampicillin10 µgEUCAST
Sulfamethoxazole-Trimethoprim23.75–1.25 µgEUCAST
Chloramphenicol30 µgEUCAST
Cefotaxime5 µgEUCAST
Imipenem10 µgEUCAST
Publisher’s Note: MDPI stays neutral with regard to jurisdictional claims in published maps and institutional affiliations.

