
Antibacterial Potential by Rupture Membrane and Antioxidant Capacity of Purified Phenolic Fractions of Persea americana Leaf Extract

 , and
, and
Abstract
:1. Introduction
2. Results
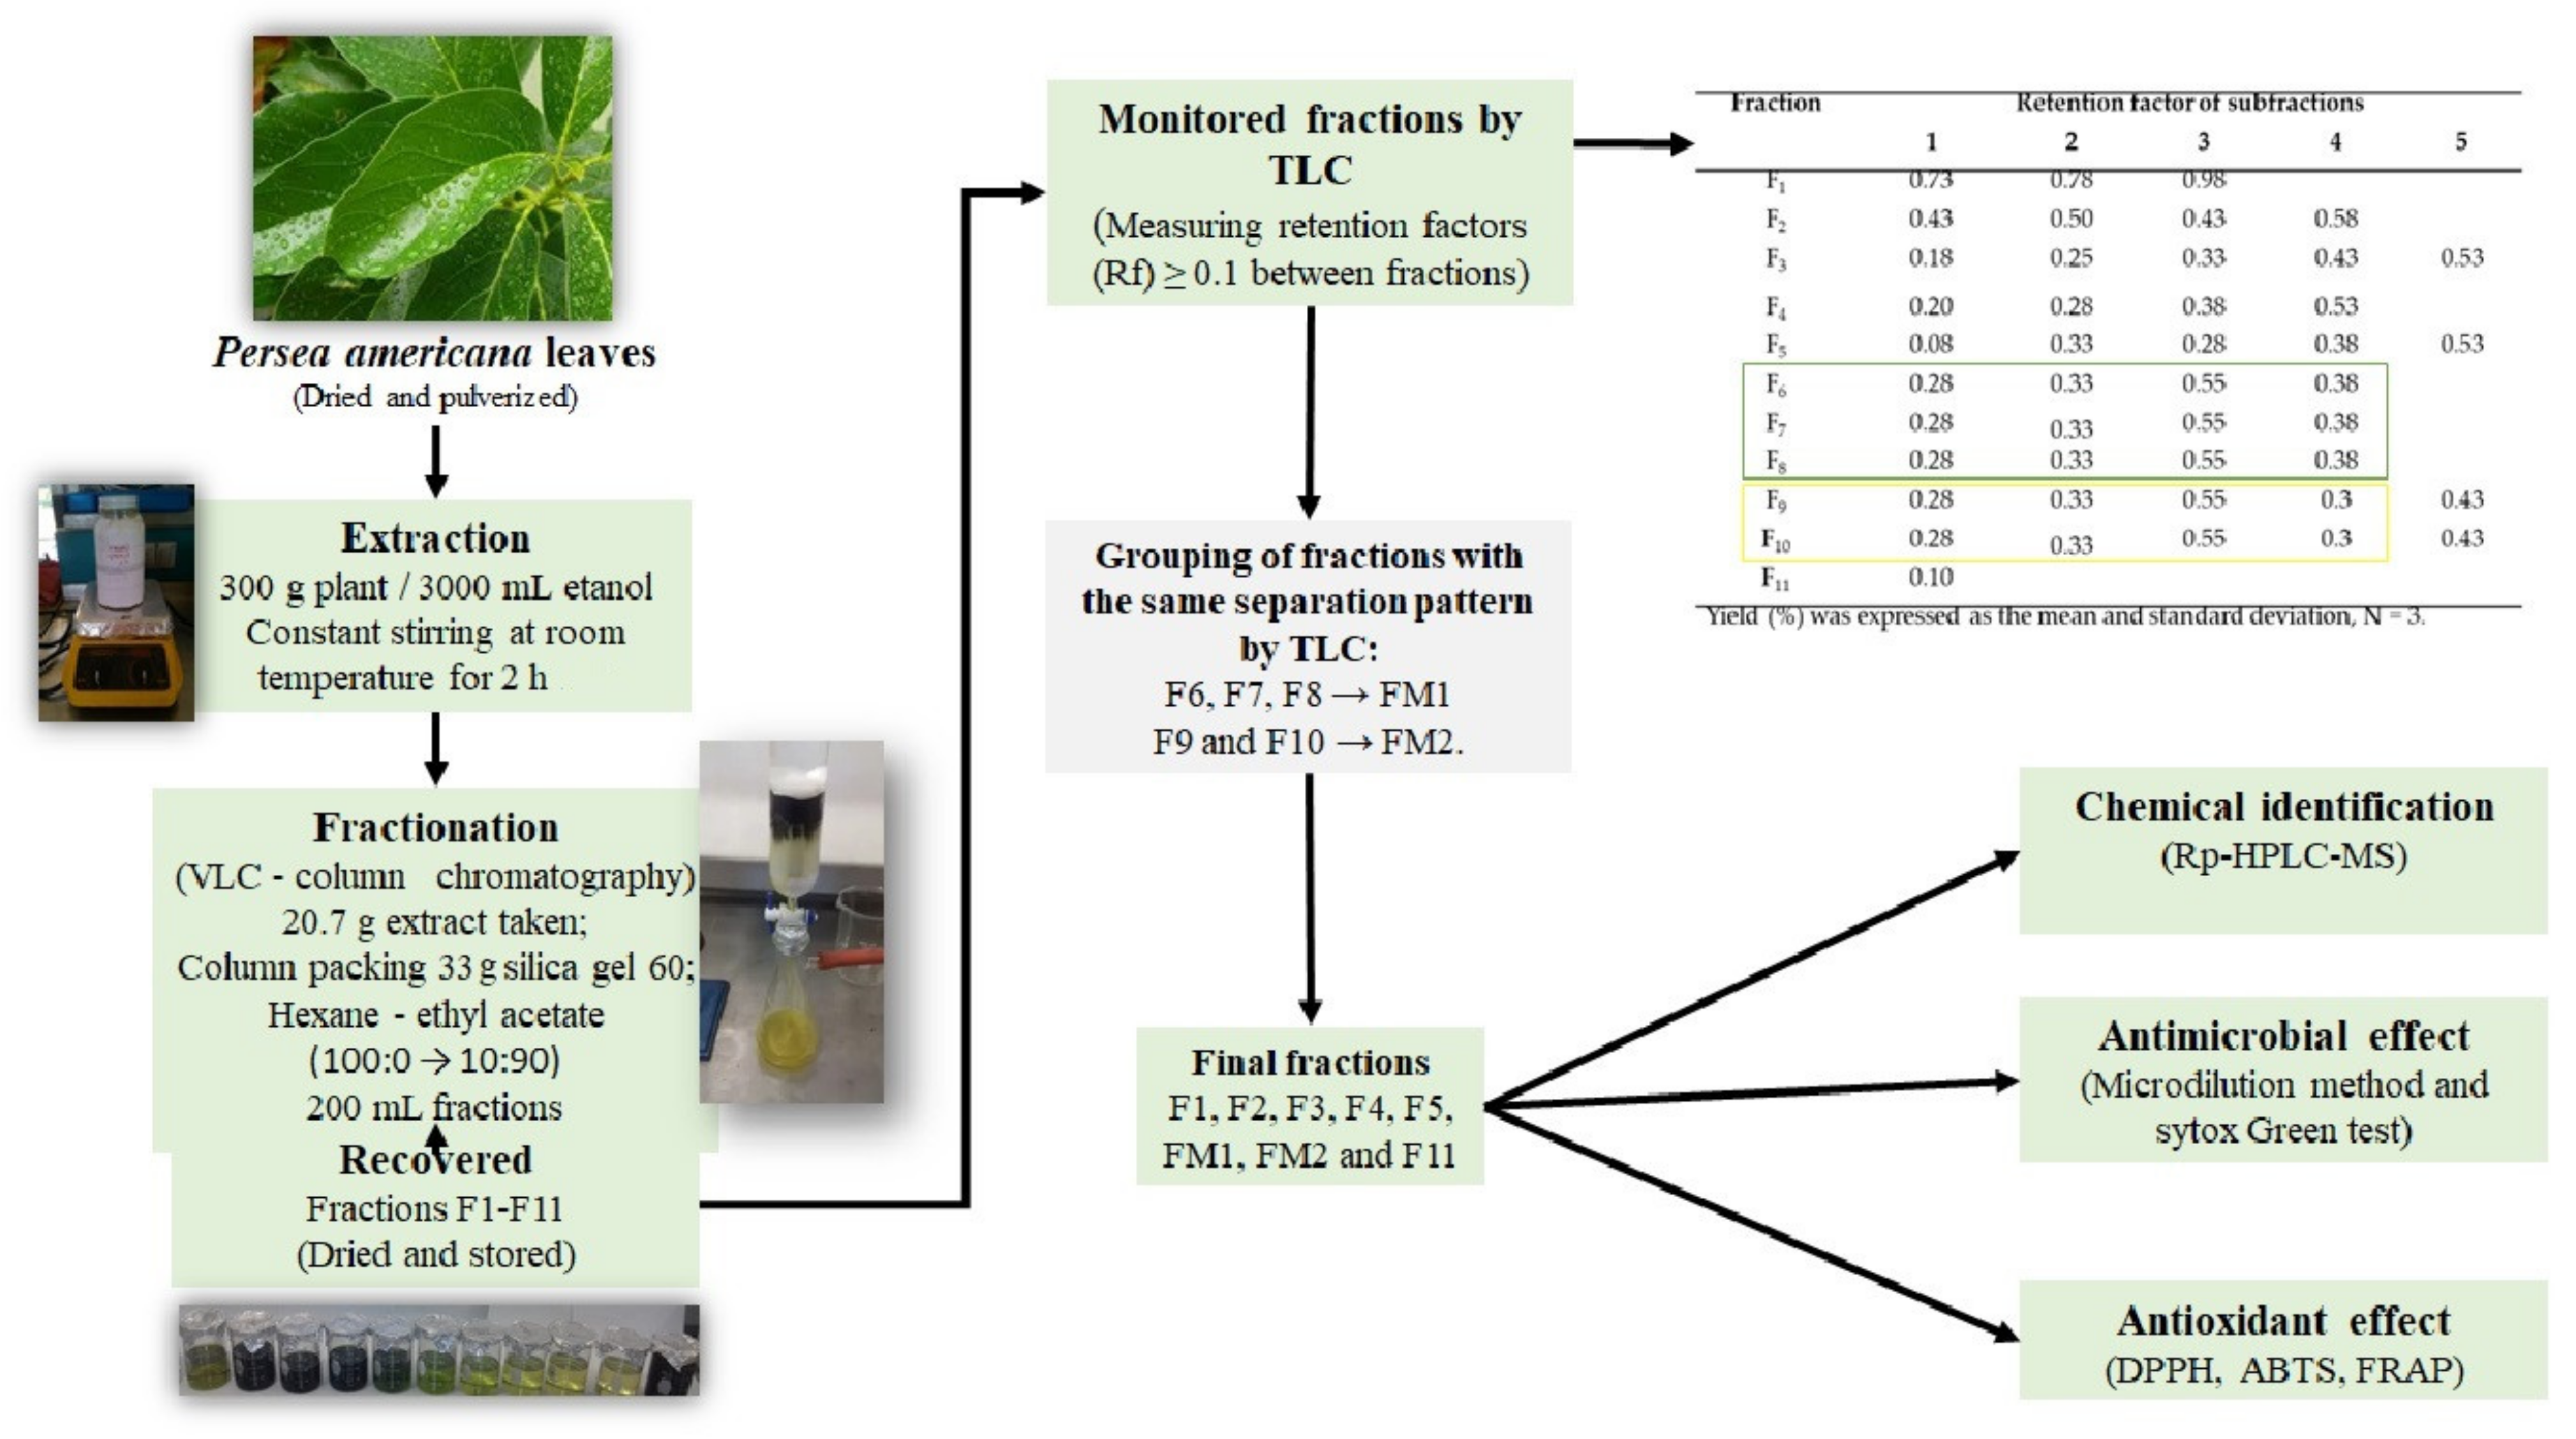
2.1. Extraction and Fractionation of P. americana Leaf
2.2. Antimicrobial Effect and Mechanism of Action
2.2.1. Minimal Inhibitory Concentration (MIC)
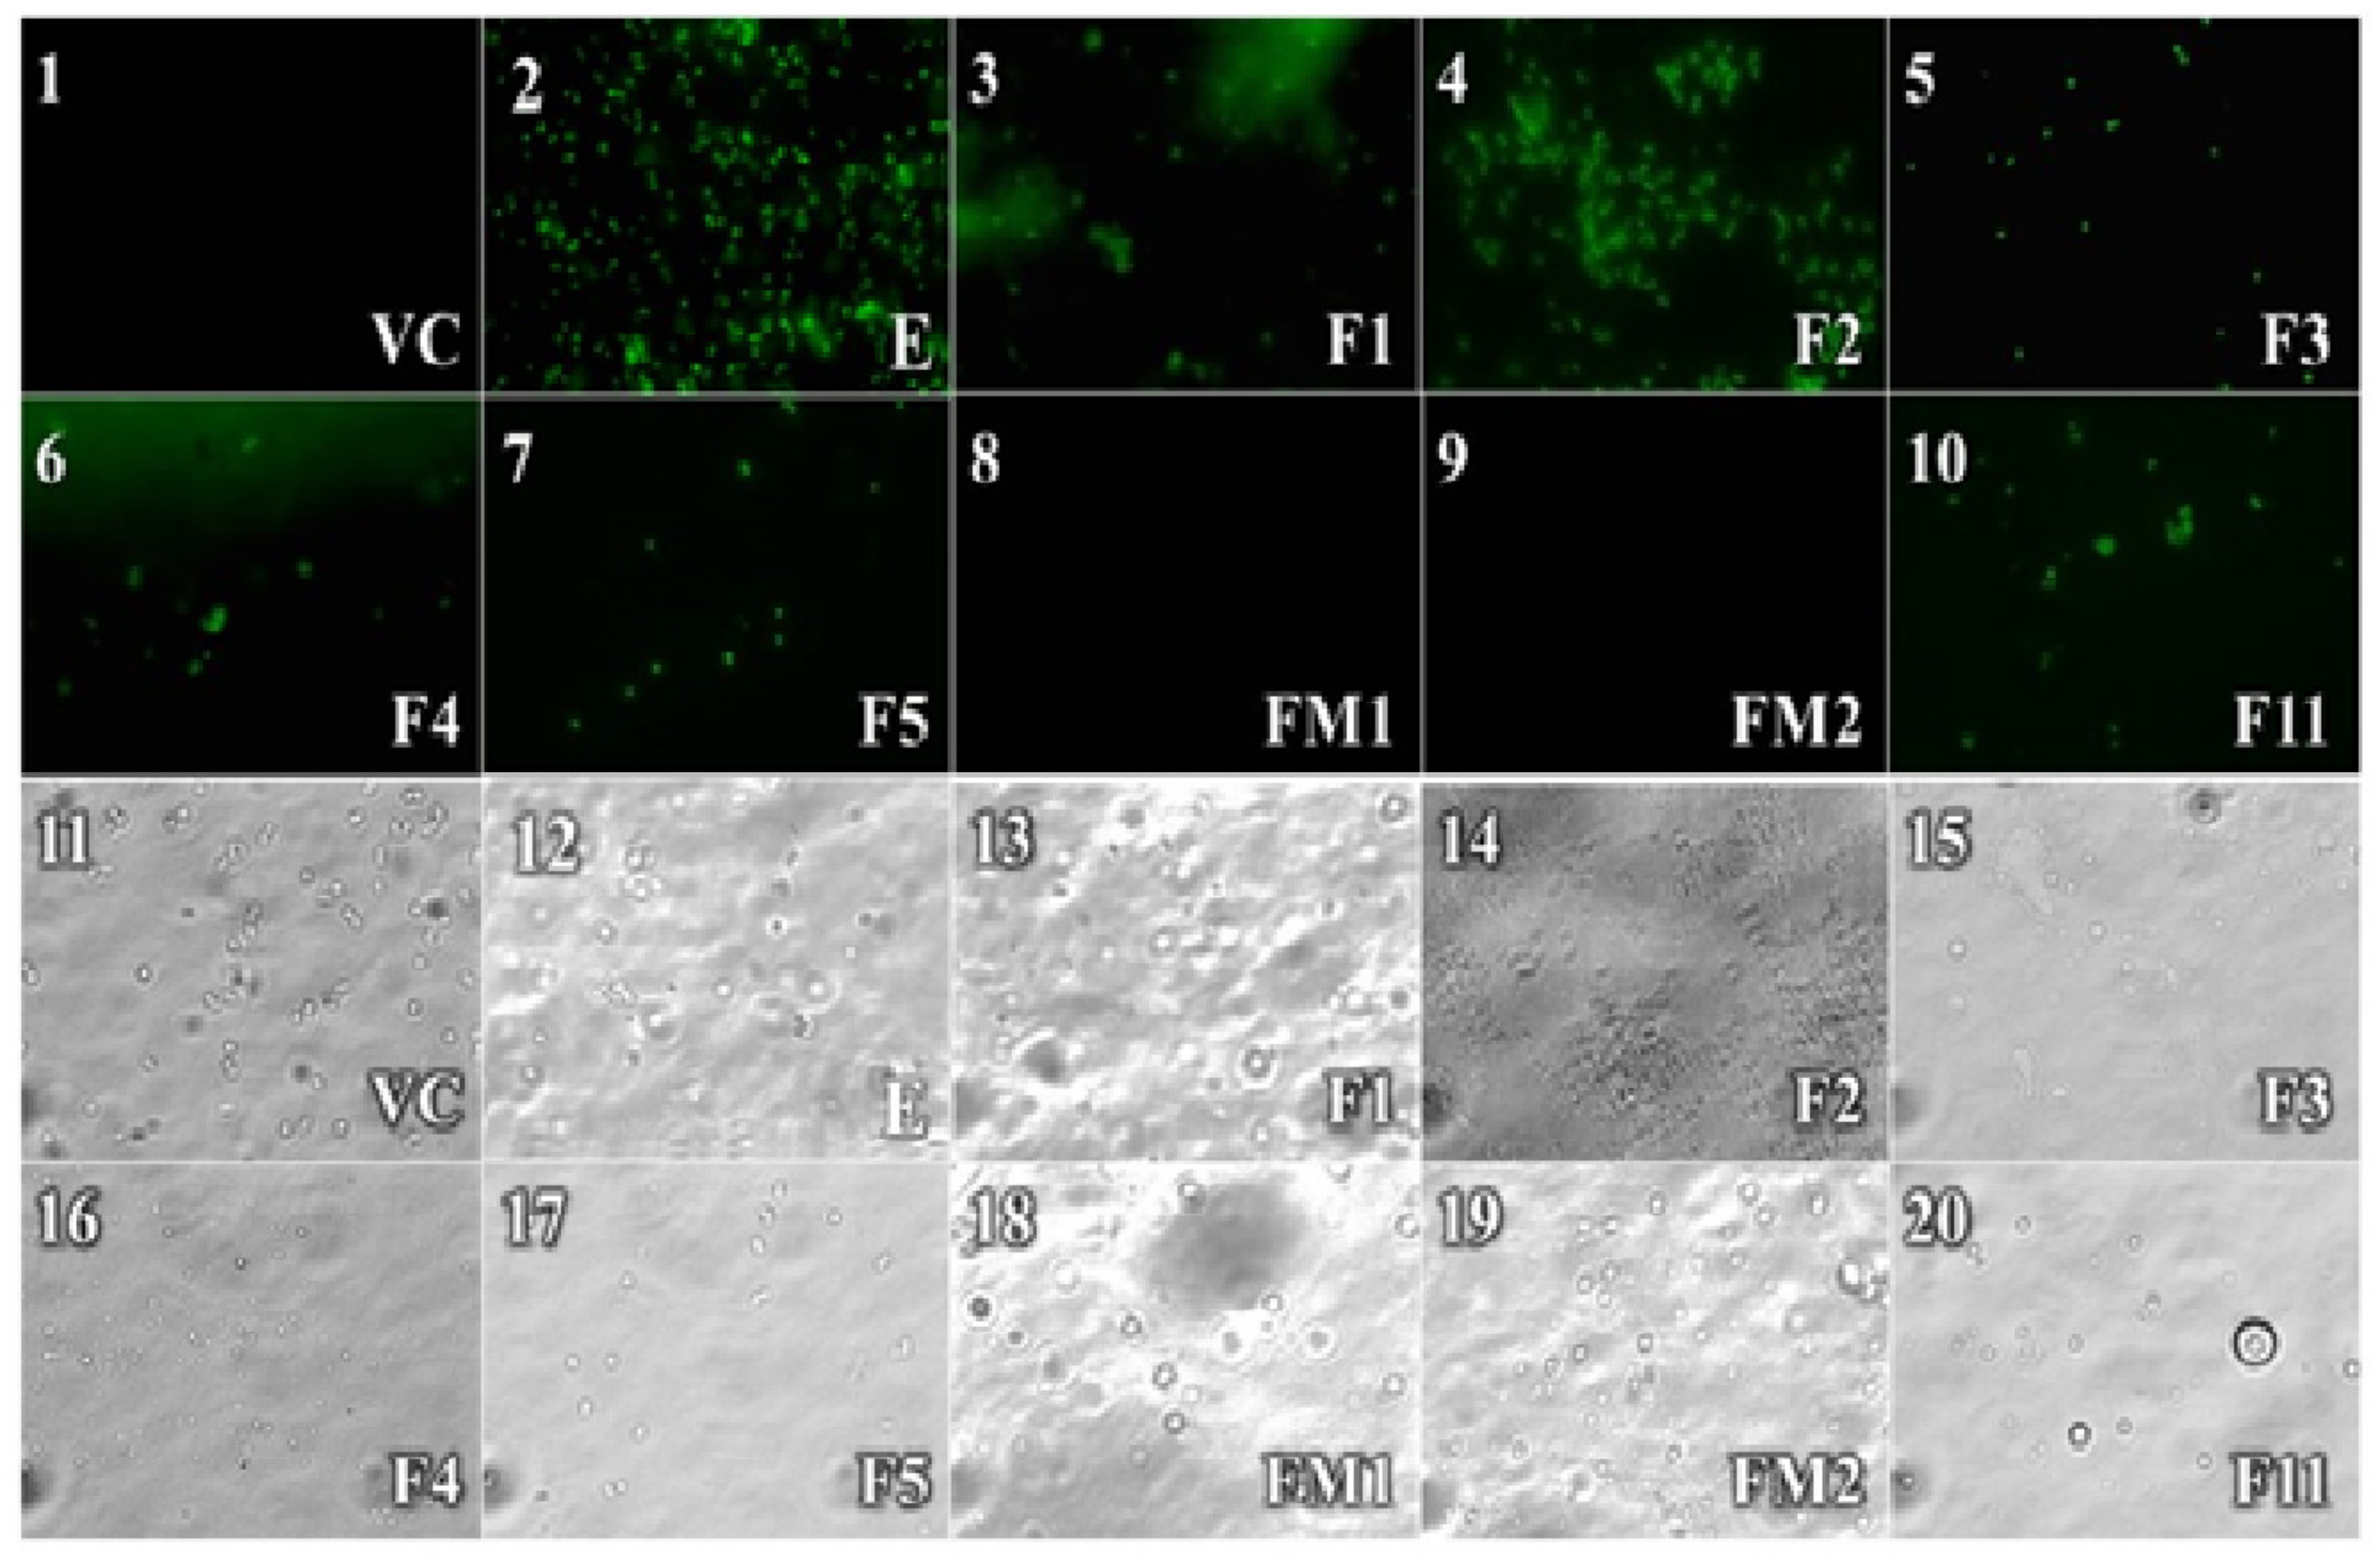
2.2.2. Sytox Green Test
2.3. Detection of Antioxidant Effect
2.4. Chemical Identification by Rp-HPLC-MS
3. Discussion
4. Materials and Methods
4.1. Extraction and Fractionation of P. americana Leaf
4.2. Antimicrobial Effect and Mechanism of Action
4.2.1. Bacterial Strains and Culture Conditions
4.2.2. Minimal Inhibitory Concentration (MIC)
4.2.3. Sytox Green Test
4.3. Detection of Antioxidant Effect
4.3.1. DPPH Radical Scavenging Method
4.3.2. ABTS Radical Scavenging Method
4.3.3. Antioxidant Power Test for Iron Reduction (FRAP)
4.3.4. Chemical Identification by Rp-HPLC-MS
4.4. Statistical Analysis
5. Conclusions
Author Contributions
Funding
Institutional Review Board Statement
Informed Consent Statement
Data Availability Statement
Acknowledgments
Conflicts of Interest
References
- Gruel, G.; Sellin, A.; Riveiro, H.; Pot, M.; Breurec, S.; Guyomard-Rabenirina, S.; Talarmin, A.; Ferdinand, S. Antimicrobial use and resistance in Escherichia coli from healthy food-producing animals in Guadeloupe. BMC Vet. Res. 2020, 17, 1–10. [Google Scholar] [CrossRef]
- Organización de las Naciones Unidas para la Alimentación y la Agricultura. Available online: http://www.fao.org/antimicrobial-resistance/background/es/ (accessed on 11 March 2021).
- Angulo, F.J.; Nargund, V.N.; Chiller, T.C. Evidence of an Association Between Use of Anti-microbial Agents in Food Animals and Anti-microbial Resistance Among Bacteria Isolated from Humans and the Human Health Consequences of Such Resistance. J. Vet. Med. 2004, 379, 374–379. [Google Scholar] [CrossRef] [PubMed]
- Prestinaci, F.; Pezzotti, P.; Pantosti, A. Antimicrobial resistance: A global multifaceted phenomenon. Pathog. Glob. Health 2016, 109, 309–318. [Google Scholar] [CrossRef] [PubMed] [Green Version]
- Spigaglia, P.; Mastrantonio, P.; Barbanti, F. Antibiotic Resistances of Clostridium difficile. Adv. Exp. Med. Biol. 2018, 1050, 137–159. [Google Scholar] [CrossRef] [PubMed]
- Ouwehand, A.C.; Forssten, S.; Hibberd, A.A.; Lyra, A. Probiotic approach to prevent antibiotic resistance. Ann. Med. 2016, 48, 245–255. [Google Scholar] [CrossRef] [PubMed]
- Høiby, N.; Bjarnsholt, T.; Givskov, M.; Molin, S.; Ciofu, O. Antibiotic resistance of bacterial biofilms. Int. J. Antimicrob. Agents 2010, 35, 322–332. [Google Scholar] [CrossRef] [Green Version]
- Durazzo, A. Study Approach of Antioxidant Properties in Foods: Update and Considerations. Foods 2017, 6, 17. [Google Scholar] [CrossRef] [Green Version]
- Villa-Silva, P.Y.; Iliná, A.; Ascacio-Valdés, J.A.; Esparza-González, S.C.; Cobos-Puc, L.E.; Rodríguez-Herrera, R.; Silva-Belmares, S.Y. Phenolic compounds of Tagetes lucida Cav. wth antibacterial effect due to membrane damage. Bol. Latinoam. y del Caribe Plantas Med. y Aromat. 2020, 19, 580–590. [Google Scholar] [CrossRef]
- Baranowska, M.; Bartoszek, A. Antioxidant and antimicrobial properties of bioactive phytochemicals from cranberry. Postep. Hig. Med. Dosw. 2016, 70, 1460–1468. [Google Scholar] [CrossRef]
- Figueroa, J.G.; Borrás-Linares, I.; Del Pino-García, R.; Curiel, J.A.; Lozano-Sánchez, J.; Segura Carretero, A. Functional ingredient from avocado peel: Microwave-assisted extraction, characterization and potential applications for the food industry. Food Chem. 2021, 352, 129300. [Google Scholar] [CrossRef]
- Boadi, N.O.; Saah, S.A.; Mensah, J.K.; Badu, M.; Addai-Arhinand, S. Phytoconstituents, antimicrobial and antioxidant properties of the leaves of Persea americana Mill cultivated in Ghana. J. Med. Plants Res. 2015, 9, 933–939. [Google Scholar] [CrossRef] [Green Version]
- Oboh, G.; Odubanjo, V.O.; Bello, F.; Ademosun, A.O.; Oyeleye, S.I.; Nwanna, E.E.; Ademiluyi, A.O. Aqueous extracts of avocado pear (Persea americana Mill.) leaves and seeds exhibit anti-cholinesterases and antioxidant activities in vitro. J. Basic Clin. Physiol. Pharmacol. 2016, 27, 131–140. [Google Scholar] [CrossRef]
- de Freitas, M.A.; Andrade, J.C.; Alves, A.I.S.; de dos Santos, F.A.G.; Leite-Andrade, M.C.; Sales, D.L.; Nunes, M.; Ribeiro, P.R.V.; Melo Coutinho, H.D.; Morais-Braga, M.F.B.; et al. Use of the natural products from the leaves of the fruitfull tree Persea americana against Candida sp. biofilms using acrylic resin discs. Sci. Total Environ. 2020, 703, 134779. [Google Scholar] [CrossRef]
- Cardoso, P.F.; Scarpassa, J.A.; Pretto-giordano, L.G.; Otaguiri, E.S.; Yamada-ogatta, S.F.; Nakazato, G.; Perugini, M.R.E.; Moreira, I.C.; Vilas-bôas, G.T. Antibacterial activity of avocado extracts (Persea americana Mill.) against Streptococcus agalactiae. Int. J. Exp. Bot. 2016, 85, 218–224. [Google Scholar]
- Jesus, D.; Oliveira, J.R.; Oliveira, F.E.; Higa, K.C.; Junqueira, J.C.; Jorge, A.O.C.; Oliveira, L.D. Persea americana Glycolic Extract: In Vitro Study of Antimicrobial Activity against Candida albicans Biofilm and Cytotoxicity Evaluation. Sci. World J. 2015, 2015, 1–5. [Google Scholar] [CrossRef] [Green Version]
- Lucky, E.; Jonathan, I. Antibacterial Activity of Persia americana Leaf Extracts Against Multidrug Antibacterial Activity of Persia americana Leaf Extracts Against Multidrug Resistant Bacterial Isolates. J. Biosci. 2017, 3, 29–34. [Google Scholar]
- Trujillo-Mayol, I.; Casas-Forero, N.; Pastene-Navarrete, E.; Silva, F.L.; Alarcón-Enos, J. Fractionation and Hydrolyzation of Avocado Peel Extract: Improvement of Antibacterial Activity. Antibiotics 2021, 10, 23. [Google Scholar] [CrossRef]
- Skenderidis, P.; Leontopoulos, S.; Petrotos, K.; Giavasis, I. Vacuum microwave-assisted aqueous extraction of polyphenolic compounds from avocado (Persea americana) solid waste. Sustainability 2021, 13, 2166. [Google Scholar] [CrossRef]
- Bergh, B.; Ellstrand, N. California Avocado Society. Available online: http://www.avocadosource.com/cas_yearbooks/cas_70_1986/cas_1986_pg_135-145.pdf (accessed on 28 March 2021).
- Tabeshpour, J.; Razavi, B.M.; Hosseinzadeh, H. Effects of Avocado (Persea americana) on Metabolic Syndrome: A Comprehensive Systematic Review. Phytother. Res. 2017, 31, 819–837. [Google Scholar] [CrossRef]
- Castro-López, C.; Bautista-Hernández, I.; González-Hernández, M.D.; Martínez-Ávila, G.C.; Rojas, R.; Gutiérrez-Díez, A.; Medina-Herrera, N.; Aguirre-Arzola, V.E. Polyphenolic Profile and Antioxidant Activity of Leaf Purified Hydroalcoholic Extracts from Seven Mexican. Molecules 2019, 24, 173. [Google Scholar] [CrossRef] [PubMed] [Green Version]
- Kulkarni, P.; Paul, R.; Ganesh, N. In vitro evaluation of genotoxicity of avocado (Persea americana) fruit and leaf extracts in human peripheral lymphocytes. J. Environ. Sci. Health Part C Environ. Carcinog. Ecotoxicol. Rev. 2010, 28, 172–187. [Google Scholar] [CrossRef] [PubMed]
- Park, S.; Hee, Y.; Rodriguez, I.; Hyung, J.; Kwak, H.J.; Oh, Y.; Oh, M.; Seon, M.; Wan, K.; Suk, J.; et al. Chemical constituents of leaves of Persea americana (avocado) and their protective effects against neomycin-induced hair cell damage. Rev. Bras. Farmacogn. 2019, 29, 739–743. [Google Scholar] [CrossRef]
- Yamassaki, F.T.; Campestrini, L.H.; Maurer, J.B.B. Chemical characterization and complement modulating activities of an arabinogalactan-protein-rich fraction from an aqueous extract of avocado leaves. Int. J. Biol. Macromol. 2018, 120, 513–521. [Google Scholar] [CrossRef] [PubMed]
- Torres-gurrola, G.; Mel, C. Phenotypic Variations in the Foliar Chemical Pro fi le of Persea americana Mill cv. Hass. Chem. Biodivers. 2016, 13, 1767–1775. [Google Scholar] [CrossRef]
- Solís Salas, L.M.; Cobos Puc, L.E.; Aguilar González, C.N.; Sierra Rivera, C.A.; Iliná, A.; Silva Belmares, S.Y. Chemistry of Medicinal Plants, Foods, and Natural Products and Thier Composites. In Composite Materials for Industry, Electronics and the Environment, 1st ed.; Mukbaniani, O.V., Balköse, D., Susanto, H., Haghi, A.K.A.A., Eds.; Apple Academic Press: Palm Bay, FL, USA, 2019; Volume 1, pp. 357–381. [Google Scholar]
- Qi, X.; Li, P.; Xu, X.; Yuan, Y.; Bu, S.; Li, D. Epidemiological and Molecular Investigations on Salmonella Responsible for Gastrointestinal Infections in the Southwest of Shanghai from 1998 to 2017. Microbiol. Front. 2019, 10, 1–12. [Google Scholar] [CrossRef]
- Song, D.S. Peritonitis bacteriana espontánea. Coreano J. Gastroenterol 2018, 72, 56–63. [Google Scholar] [CrossRef] [Green Version]
- Trastoy, R.; Manso, T.; Fernández-García, L.; Blasco, L.; Ambroa, A.; Pérez Del Molino, M.L.; Bou, G.; García-Contreras, R.; Wood, T.K.; Tomás, M. Mechanisms of Bacterial Tolerance and Persistence in the Gastrointestinal and Respiratory Environments. Clin. Microbiol Rev. 2018, 31, 1–46. [Google Scholar] [CrossRef] [Green Version]
- Kouamé, N.M.; Koffi, C.; N’zoué, K.S.; Yao, N.A.R.; Doukouré, B.; Kamagaté, M. Comparative Antidiabetic Activity of Aqueous, Ethanol, and Methanol Leaf Extracts of Persea americana and Their Effectiveness in Type 2 Diabetic Rats. Evid.-Based Complement. Altern. Med. 2019, 2019, 1–15. [Google Scholar] [CrossRef] [Green Version]
- Harris, D.C. Análisis Químico Cuantitativo, 3rd ed.; Reverté, S.A.: Barcelona, Spain, 2003; p. 407. [Google Scholar]
- Weber, P.; Hamburger, M.; Schafroth, N.; Potterat, O. Fitoterapia Flash chromatography on cartridges for the separation of plant extracts: Rules for the selection of chromatographic conditions and comparison with medium pressure liquid chromatography. Fitoterapia 2011, 82, 155–161. [Google Scholar] [CrossRef]
- Oetari, R.A.; Hasriyani, H.; Prayitno, A.; Sahidin, S. Gartanin compounds from extract ethanol pericarp mangosteen (Garcinia mangostana Linn.). Open Access Maced. J. Med. Sci. 2019, 7, 3891–3895. [Google Scholar] [CrossRef]
- Al-Amin, M.; Eltayeb, N.M.; Hossain, C.F.; Khairuddean, M.; Fazalul Rahiman, S.S.; Salhimi, S.M. Inhibitory Activity of Extract, Fractions, and Compounds from Zingiber montanum Rhizomes on the Migration of Breast Cancer Cells. Planta Med. 2020, 86, 387–394. [Google Scholar] [CrossRef]
- Calabrese, E.J. Cancer Biology and Hormesis: Human Tumor Cell Lines Commonly Display Hormetic (Biphasic) Dose Responses. Crit. Rev. Toxicol. 2005, 35, 463–582. [Google Scholar] [CrossRef]
- Calabrese, E.J. Hormetic mechanisms. Crit. Rev. Toxicol. 2013, 8444, 580–606. [Google Scholar] [CrossRef]
- Eliasi, U.L.; Sebola, D.; Oguttu, J.W.; Qekwana, D.N. Antimicrobial resistance patterns of Pseudomonas aeruginosa isolated from canine clinical cases at a veterinary academic hospital in South Africa. J. S. Afr. Vet. Assoc. 2020, 91, 1–6. [Google Scholar] [CrossRef]
- Hadadi-Fishani, M.; Khaledi, A.; Fatemi-Nasab, Z.S. Correlation between biofilm formation and antibiotic resistance in Pseudomonas aeruginosa: A meta-analysis. Infez. Med. 2020, 1, 47–54. [Google Scholar]
- Horna Quintana, G.; Silva Díaz, M.; Taboada William, V.; Tamaris Ortiz, J. Minimal Inhibitory Concentration and Minimal Bactericidal Concentration of ciprofloxacin in uropathogens isolated at Instituto Nacional de Enfermedades Neoplásicas. Rev. Med. Hered 2005, 16, 1–17. [Google Scholar]
- Fisher, C.R.; Schmidt-Malan, S.M.; Zhenkun, M.; Yuan, Y.; He, S.; Patel, R. In vitro activity of TNP-2092 against periprosthetic joint infection-associated staphylococci. Diagn. Microbiol. Infect. Dis. 2020, 97, 115040. [Google Scholar] [CrossRef]
- Balasubramanian, D.; Harper, L.; Shopsin, B.; Torres, V.J. Staphylococcus aureus pathogenesis in diverse host environments. Pathog. Dis. 2017, 75, 1–10. [Google Scholar] [CrossRef] [Green Version]
- Park, Y.S.; Adams-Haduch, J.M.; Kathleen, A.S.; Yarabinec, D.M.; Johnson, L.E.; Hingwe, A.; Lewis, J.S.; Jorgensen, J.H.; Doi, Y. Clinical and Microbiologic Characteristics of Cephalosporin-Resistant Escherichia coli at Three Centers in the United States. Antimicrob. Agents Chemother. 2012, 56, 1870–1876. [Google Scholar] [CrossRef] [Green Version]
- General. Ceftriaxone (NOM-177SSA1-1998). Available online: http://www.facmed.unam.mx/bmnd/gi_2k8/prods/PRODS/Ceftriaxona.htm (accessed on 15 April 2021).
- Kim, W.; Conery, A.L.; Rajamuthiah, R.; Fuchs, B.B. Identification of an Antimicrobial Agent Effective against Methicillin-Resistant Staphylococcus aureus Persisters Using a Fluorescence-Based Screening Strategy. PLoS ONE 2015, 1–15. [Google Scholar] [CrossRef]
- Roth, B.L.; Poot, M.; Yue, S.T.; Millard, P.J. Bacterial viability and antibiotic susceptibility testing with SYTOX green nucleic acid stain. Appl. Env. Microbiol. 1997, 63, 2421–2431. [Google Scholar] [CrossRef] [PubMed] [Green Version]
- Álvarez, C.; Barriga, A.; Albericio, F.; Romero, M.S.; Guzmán, F. Identification of Peptides in Flowers of Sambucus nigra with Antimicrobial Activity against Aquaculture Pathogens. Molecules 2018, 23, 1033. [Google Scholar] [CrossRef] [PubMed] [Green Version]
- Lee, H.; Dong, E.W.; Lee, D.G. Glochidioboside Kills Pathogenic Bacteria by Membrane Perturbation. Curr. Microbiol. 2015, 23, 1–11. [Google Scholar] [CrossRef] [PubMed]
- McKenzie, K.; Maclean, M.; Grant, M.H.; Ramakrishnan, P.; MacGregor, S.J.; Anderson, J.G. The effects of 405 nm light on bacterial membrane integrity determined by salt and bile tolerance assays, leakage of UV-absorbing material and SYTOX green labelling. Microbiology 2016, 162, 1680–1688. [Google Scholar] [CrossRef] [Green Version]
- Karen, L.; Elbing, R.B. Growth of E. coli on Solid Media. Curr. Protoc. Mol. Biol. 2019, 25, 82. [Google Scholar]
- Alissa, K.; Hung, Y.C.; Hou, C.Y.; Lim, G.C.W.; Ciou, J.Y. Developing new health material: The utilization of spray drying technology on avocado (Persea americana Mill.) seed powder. Foods 2020, 9, 139. [Google Scholar] [CrossRef] [Green Version]
- Viera, V.B.; Piovesan, N.; Rodrigues, J.B.; de Mello, R.O.; Prestes, R.C.; dos Santos, R.C.V.; de Vaucher, R.A.; Hautrive, T.P.; Kubota, E.H. Extraction of phenolic compounds and evaluation of the antioxidant and antimicrobial capacity of red onion skin (Allium cepa L.). Int. Food Res. J. 2017, 24, 990–999. [Google Scholar]
- Antasionasti, I.; Riyanto, S.; Rohman, A. Antioxidant Activities and Phenolics Contents of Avocado (Persea americana Mill.) Peel in vitro. Res. J. Med. Plants 2017, 11, 55–61. [Google Scholar] [CrossRef] [Green Version]
- Mroczek, T.; Dymek, A.; Widelski, J.; Wojtanowski, K.K. The bioassay-guided fractionation and identification of potent acetylcholinesterase inhibitors from narcissus C.V. ‘hawera’ using optimized vacuum liquid chromatography, high resolution mass spectrometry and bioautography. Metabolites 2020, 10, 395. [Google Scholar] [CrossRef]
- Re, R.; Pellegrini, N.; Proteggente, A.; Pannala, A.; Yang, M.; Rice-Evans, C. Antioxidant activity applying an improved ABTS radical cation decolorization assay. EMPA Act. 1999, 26, 1231–1237. [Google Scholar] [CrossRef]
- Gutierrez, G.; Acevedo, A.; Ballarte, N.; Llajaruna, P.; Aquise, S.; Espinoza, T.; Jacobo, Q. Antocianinas, fenoles totales y actividad antioxidante de las corontas del maíz morado (Zea mays L.): Método de extracción. Bol. Latinoam. Caribe Plantas Med. Aromát. 2009, 8, 509–518. [Google Scholar]
- Bravo, L. Polyphenols: Chemistry, Dietary Sources, Metabolism, and Nutritional Significance. Nutr. Rev. 1998, 56, 317–333. [Google Scholar] [CrossRef]
- Cerretani, L.; Bendini, A. Rapid Assays to Evaluate the Antioxidant Capacity of Phenols in Virgin Olive Oil. In Olives and Olive Oil in Health and Disease Prevention, 1st ed.; Preedy, V.R., Watson, R.R., Eds.; Elsevier Inc.: London, UK, 2010; Volume 1, pp. 625–635. [Google Scholar] [CrossRef]
- Ilyasov, I.R.; Beloborodov, V.L.; Selivanova, I.A.; Terekhov, R.P. ABTS/PP Decolorization Assay of Antioxidant Capacity Reaction Pathways. Int. J. Mol. Sci. 2020, 21, 1131. [Google Scholar] [CrossRef] [Green Version]
- Rodriguez-Jasso, R.M.; Mussatto, S.I.; Pastrana, L.; Aguilar, C.N.; Teixeira, J.A. Chemical composition and antioxidant activity of sulphated polysaccharides extracted from Fucus vesiculosus using different hydrothermal processes. Chem. Pap. 2013, 68, 203–209. [Google Scholar] [CrossRef] [Green Version]
- Yasir, M.; Das, S.; Kharya, M.D. The phytochemical and pharmacological pro fi le of Persea americana Mill. Pharmacogn. Rev. 2010, 4, 77–84. [Google Scholar] [CrossRef] [Green Version]
- Ajayi, O.E.; Awala, S.I.; Olalekan, O.T.; Alabi, O.A. Evaluation of Antimicrobial Potency and Phytochemical Screening of Persea americana Leaf Extracts against Selected Bacterial and Fungal Isolates of Clinical Importance. Microbiol. Res. J. Int. 2017, 20, 1–11. [Google Scholar] [CrossRef] [Green Version]
- Idris, S.; Ndukwe, G.I.; Gimba, C.E. Preliminary phytochemical screening and antimicrobial activity of seed extracts of Persea americana (avocado pear). Bayero J. Pure Appl. Sci. 2009, 2, 173–176. [Google Scholar] [CrossRef] [Green Version]
- Khoo, H.E. Anthocyanidins and anthocyanins: Colored pigments as food, pharmaceutical ingredients, and the potential health benefits. Food Nutr. Res. 2017, 61, 1–21. [Google Scholar] [CrossRef] [Green Version]
- Hwang, J.H.; Choi, H.; Hwang, I.; Kim, A.R.; Woo, E.; Lee, D.G. Synergistic Antibacterial and Antibiofilm Effect Between (+)-Medioresinol and Antibiotics In Vitro. Appl. Biochem. Biotechnol. 2013, 170, 1934–1941. [Google Scholar] [CrossRef]
- Cobrançosa, L.C.; Pereira, A.P.; Ferreira, I.C.F.R.; Marcelino, F.; Valentão, P.; Paula, B.; Seabra, R.; Estevinho, L.; Bento, A.; Pereira, J.A. Phenolic Compounds and Antimicrobial Activity of Olive. Molecules 2007, 12, 1153–1162. [Google Scholar]
- Díaz, M.E.; Rocha, G.; Kise, F.; Rosso, A.; Guevara, M.G.; Parisi, M.G. Antimicrobial activity of an aspartic protease fromo Salpicora origanifolia fruits. Lett. Appl. Microbiol. 2018, 67, 168–174. [Google Scholar] [CrossRef] [Green Version]
- Casero, C.; Estévez-braun, A.; Ravelo, Á.G.; Demo, M.; Méndez-álvarez, S.; Machín, F. Phytomedicine Achyrofuran is an antibacterial agent capable of killing methicillin-resistant vancomycin-intermediate Staphylococcus aureus in the nanomolar range. Eur. J. Integr. Med. 2013, 20, 133–138. [Google Scholar] [CrossRef]
- Mokdad-bzeouich, I.; Mustapha, N.; Chaabane, F.; Ghedira, Z.; Ghedira, K.; Ghoul, M.; Chebil, L.; Chekir-ghedira, L. Oligomerization of esculin improves its antibacterial activity and modulates antibiotic resistance. J. Antibiot. (Tokyo) 2014, 1–5. [Google Scholar] [CrossRef]
- Móricz, A.M.; Dariusz, S.; Knas, M.; Dlugosz, E.; Ott, P.G.; Kowalska, T.; Sajewicz, M. Antibacterial potential of the Cistus incanus L. phenolics as studied with use of thin-layer chromatography combined with direct bioautography and in situ hydrolysis. J. Chromatogr. A 2017, 26, 170–178. [Google Scholar] [CrossRef]
- Llivisaca, S.; Manzano, P.; Ruales, J.; Flores, J.; Esther, M.; Juan, P. Chemical, antimicrobial, and molecular characterization of mortiño (Vaccinium floribundum Kunth.) fruits and leaves. Food Sci. Nutr. 2018, 934–942. [Google Scholar] [CrossRef]
- Bostanghadiri, N.; Pormohammad, A.; Salimi, A.; Pouriran, R. Biomedicine & Pharmacotherapy Comprehensive review on the antimicrobial potency of the plant polyphenol Resveratrol. Biomed. Pharmacother. 2017, 95, 1588–1595. [Google Scholar] [CrossRef]
- Bisignano, C.; Filocamo, A.; Ginestra, G.; Giofre, S.V.; Navarra, M.; Romeo, R.; Mandalari, G. 3,4-DHPEA-EA from Olea Europaea L. is effective against standard and clinical isolates of Staphylococcus sp. Ann. Clin. Microbiol. Antimicrob. 2014, 13, 1–4. [Google Scholar] [CrossRef] [Green Version]
- Solanky Dipesh, S.E.H. Adaptation of the neutral bacterial comet assay to assess antimicrobial-mediated DNA double-strand breaks in Escherichia coli. J. Microbiol. Methods 2013, 91, 257–261. [Google Scholar] [CrossRef] [Green Version]
- Gómez, A.; Calcárcel, M. Técnicas Analíticas de Separación; Reverté, S.A.: Barcelona, Spain, 1988; p. 283. [Google Scholar]
- Guzmán Cefrino, J.; Cobos Puc, L.E.; Sierra Rivera, C.A.; Contreras Esquivel, J.C.; Durán Mendoza, T.; Silva Belmares, S.Y. Partial Characterization of the Potentially Bioactive Protein Fraction of Solanum marginatum L.F. Polibotánica 2019, 2019, 3–17. [Google Scholar] [CrossRef]
- Kurnatowska, A.; Kurnatowski, P.; Horwatt-Bożyczko, E.; Kurnatowska, A.J. Minimal inhibitory concentration (MIC) of caspofungin and itraconazole inhibiting growth of Candida strains calculated from the linear regression equation. Adv. Med. Sci. 2012, 57, 148–151. [Google Scholar] [CrossRef]
- García-Salas, P.; Gómez-Caravaca, A.M.; Arráez-Román, D.; Segura-Carretero, A.; Guerra-Hernández, E.; García-Villanova, B.; Fernández-Gutiérrez, A. Influence of technological processes on phenolic compounds, organic acids, furanic derivatives, and antioxidant activity of whole-lemon powder. Food Chem. 2013, 141, 869–878. [Google Scholar] [CrossRef] [PubMed]


| Fraction | Yield (%) | Retention Factor of Subfractions | ||||
|---|---|---|---|---|---|---|
| 1 | 2 | 3 | 4 | 5 | ||
| F1 | 36.94 ± 0.1 | 0.73 | 0.78 | 0.98 | ||
| F2 | 8.89 ± 0.2 | 0.43 | 0.50 | 0.43 | 0.58 | |
| F3 | 3.48 ± 0.1 | 0.18 | 0.25 | 0.33 | 0.43 | 0.53 |
| F4 | 4.12 ± 0.3 | 0.20 | 0.28 | 0.38 | 0.53 | |
| F5 | 2.77 ± 0.4 | 0.08 | 0.33 | 0.28 | 0.38 | 0.53 |
| F6 | 5.58 ± 0.3 | 0.28 | 0.33 | 0.55 | 0.38 | |
| F7 | 7.71 ± 0.5 | 0.28 | 0.33 | 0.55 | 0.38 | |
| F8 | 3.39 ± 0.2 | 0.28 | 0.33 | 0.55 | 0.38 | |
| F9 | 1.64 ± 0.3 | 0.28 | 0.33 | 0.55 | 0.3 | 0.43 |
| F10 | 0.51 ± 0.1 | 0.28 | 0.33 | 0.55 | 0.3 | 0.43 |
| F11 | 12.33 ± 0.3 | 0.10 | ||||
| µg/mL | Fraction | |||||||||
|---|---|---|---|---|---|---|---|---|---|---|
| C (+) | Extract | 1 | 2 | 3 | 4 | 5 | FM1 | FM2 | 11 | |
| 0.5 | 100.0 ± 0.0 a | 3.7 ± 1.0 a,b | 0.0 ± 0.0 a,c | 0.0 ± 0.0 a,b,c,d | 11.9 ± 1.3 b,c,d,e | 4.1 ± 0.7 a,d,f | 4.8 ± 1.9 a,b,c,d,g | 3.3 ± 0.8 a,b,c,d,f,g,,h | 1.5 ± 0.2 a,d,e,f,g,h,i | 14.5 ± 0.3 a,b,c,d,e,f,g,h,i |
| 1.0 | 100.0 ± 0.0 a | 17.8 ± 1.6 a,b | 25.2 ± 3.2 a,c | 17.1 ± 1.8 a,b,c,d | 32.6 ± 0.6 b,c,d,e | 31.1 ± 3.0 a,d,f | 21.3 ± 2.5 a,b,c,d,g | 15.0 ± 0.2 a,b,c,d,f,g,h | 3.0 ± 1.0 a,d,e,f,g,h,i | 31.2 ± 1.3 a,b,c,d,e,f,g,h,i |
| 2.0 | 100.0 ± 0.0 a | 20.4 ± 1.3 a,b | 24.9 ± 2.5 a,c | 14.9 ± 1.1 a,b,c,d | 31.7 ± 0.8 b,c,d,e | 32.5 ± 1.3 a,d,f | 17.5 ± 2.1 a,b,c,d,g | 19.8 ± 8.0 a,b,c,d,f,g,h | 14.3 ± 2.0 a,d,e,f,g,h,i | 33.1 ± 1.2 a,b,c,d,e,f,g,h,i |
| 3.9 | 100.0 ± 0.0 a | 23.1 ± 0.9 a,b | 25.5 ± 3.1 a,c | 17.0 ± 1.2 a,b,c,d | 30.6 ± 1.9 b,c,d,e | 32.8 ± 2.11 a,d,f | 15.1 ± 1.0 a,b,c,d,g | 23.1 ± 0.6 a,b,c,d,f,g,h | 12.7 ± 1.8 a,d,e,f,g,h,i | 33.3 ± 0.7 a,b,c,d,e,f,g,h,i |
| 7.8 | 100.0 ± 0.0 a | 21.6 ± 0.9 a,b | 26.3 ± 3.4 a,c | 18.1 ± 2.8 a,b,c,d | 17.4 ± 2.1 b,c,d,e | 28.9 ± 1.5 a,d,f | 12.6 ± 0.1 a,b,c,d,g | 15.1 ± 3.8 a,b,c,d,f,g,h | 8.1 ± 0.7 a,d,e,f,g,h,i | 35.4 ± 4.1 a,b,c,d,e,f,g,h,i |
| 15.6 | 100.0 ± 0.0 a | 24.6 ± 4.3 a,b | 23.3 ± 2.4 a,c | 18.3 ± 1.8 a,b,c,d | 29.4 ± 3.4 b,c,d,e | 22.3 ± 2.2 a,d,f | 15.4 ± 2.3 a,b,c,d,g | 21.7 ± 5.1 a,b,c,d,f,g,h | 16.3 ± 3.1 a,d,e,f,g,h,i | 32.8 ± 3.6 a,b,c,d,e,f,g,h,i |
| 31.3 | 100.0 ± 0.0 a | 41.9 ± 1.7 a,b | 24.9 ± 4.2 a,c | 15.2 ± 1.7 a,b,c,d | 28.8 ± 2.8 b,c,d,e | 24.5 ± 3.1 a,d,f | 25.5 ± 1.9 a,b,c,d,g | 39.3 ± 3.4 a,b,c,d,f,g,h | 27.9 ± 3.3 a,d,e,f,g,h,i | 37.3 ± 0.5 a,b,c,d,e,f,g,h,i |
| 62.5 | 100.0 ± 0.0 a | 46.1 ± 2.3 a,b | 26.4 ± 4.3 a,c | 10.0 ± 2.8 a,b,c,d | 30.7 ± 1.9 b,c,d,e | 33.7 ± 1.1 a,d,f | 42.9 ± 0.6 a,b,c,d,g | 51.2 ± 1.5 a,b,c,d,f,g,h | 27.0 ± 2.9 a,d,e,f,g,h,i | 36.8 ± 2.4 a,b,c,d,e,f,g,h,i |
| 125.0 | 100.0 ± 0.0 a | 46.1 ± 2.3 a,b | 67.3 ± 4.3 a,c | 46.4 ± 1.1 a,b,c,d | 50.6 ± 0.8 b,c,d,e | 73.9 ± 0.8 a,d,f | 41.6 ± 0.8 a,b,c,d,g | 74.8 ± 1.2 a,b,c,d,f,g,h | 41.7 ± 1.3 a,d,e,f,g,h,i | 45.0 ± 0.6 a,b,c,d,e,f,g,h,i |
| 250.0 | 100.0 ± 0.0 a | 46.1 ± 2.3 a,b | 55.2 ± 3.8 a,c | 16.4 ± 3.5 a,b,c,d | 23.8 ± 1.5 b,c,d,e | 71.7 ± 0.3 a,d,f | 79.2 ± 0.7 a,b,c,d,g | 78.5 ± 0.6 a,b,c,d,f,g,h | 67.6 ± 2.3 a,d,e,f,g,h,i | 36.2 ± 0.6 a,b,c,d,e,f,g,h,i |
| 500.0 | 100.0 ± 0.0 a | 52.7 ± 2.4 a,b | 56.4 ± 6.2 a,c | 82.1 ± 0.9 a,b,c,d | 60.9 ± 6.4 b,c,d,e | 80.5 ± 1.7 a,d,f | 74.4 ± 0.3 a,b,c,d,g | 87.4 ± 3.2 a,b,c,d,f,g,h | 65.9 ± 2.1 a,d,e,f,g,h,i | 30.1 ± 0.8 a,b,c,d,e,f,g,h,i |
| 1000.0 | 100.0 ± 0.0 a | 77.8 ± 1.0 a,b | 78.8 ± 2.5 a,c | 21.1 ± 2.4 a,b,c,d | 95.4 ± 3.0 b,c,d,e | 82.6 ± 1.0 a,d,f | 84.9 ± 1.7 a,b,c,d,g | 90.5 ± 3.0 a,b,c,d,f,g,h | 75.9 ± 2.5 a,d,e,f,g,h,i | 57.6 ± 1.2 a,b,c,d,e,f,g,h,i |
| µg/mL | Fraction | |||||||||
|---|---|---|---|---|---|---|---|---|---|---|
| C (+) | Extract | 1 | 2 | 3 | 4 | 5 | FM1 | FM2 | 11 | |
| 0.5 | 100.0 ± 0.0 a | 0.0 ± 0.0 a,b | 1.6 ± 0.7 a,b,c | 0.0 ± 0.0 a,b,c,d | 0.0 ± 0.0 a,b,c,e | 0.0 ± 0.0 a,b,e,d,e,f | 0.6 ± 0.0 a,b,e,d,e,g | 0.0 ± 0.0 a,b,d,e,f,g,h | 2.32 ± 0.9 a,b,c,d,e,f,g,h,i | 0.0 ± 0.0 a,c,d,e,f,g,h,i |
| 1.0 | 100.0 ± 0.0 a | 0.0 ± 0.0 a,b | 2.4 ± 0.7 a,b,c | 0.0 ± 0.0 a,b,c,d | 1.4 ± 0.0 a,b,c, | 2.18 ± 0.9 a,b,e,d,e,f | 1.6 ± 0.1 a,b,e,d,e,g | 3.7 ± 0.2 a,b,d,e,f,g,h | 13.53 ± 1.9 a,b,c,d,e,f,g,h,i | 5.5 ± 0.8 a,c,d,e,f,g,h,i |
| 2.0 | 100.0 ± 0.0 a | 0.0 ± 0.0 a,b | 4.7 ± 0.0 a,b,c | 0.0 ± 0.0 a,b,c,d | 4.4 ± 0.4 a,b,c,e | 3.2 ± 0.7 a,b,e,d,e,f | 2.1 ± 0.5 a,b,e,d,e,g | 7.6 ± 1.5 a,b,d,e,f,g,h | 14.14 ± 0.6 a,b,c,d,e,f,g,h,i | 10.2 ± 1.7 a,c,d,e,f,g,h,i |
| 3.9 | 100.0 ± 0.0 a | 0.0 ± 0.0 a,b | 5.2 ± 0.1 a,b,c | 0.9 ± 0.6 a,b,c,d | 9.1 ± 0.4 a,b,c,e | 4.6 ± 0.1 a,b,e,d,e,f | 3.9 ± 0.4 a,b,e,d,e,g | 8.9 ± 0.2 a,b,d,e,f,g,h | 10.18 ± 0.8 a,b,c,d,e,f,g,h,i | 11.7 ± 0.3 a,c,d,e,f,g,h,i |
| 7.8 | 100.0 ± 0.0 a | 0.0 ± 0.0 a,b | 5.8 ± 1.0 a,b,c | 6.3 ± 0.6 a,b,c,d | 10.8 ± 0.3 a,b,c,e | 5.7 ± 0.3 a,b,e,d.e,f | 6.1 ± 0.1 a,b,e,d,e,g | 11.5 ± 0.4 a,b,d,e,f,g,h | 15.58 ± 0.7 a,b,c,d,e,f,g,h,i | 16.0 ± 0.6 a.,c,d,e,f,g,h,i |
| 15.6 | 100.0 ± 0.0 a | 0.0 ± 0.0 | 7.4 ± 0.3 a,b.c | 7.6 ± 0.2 a,b,c,d | 11.4 ± 0.4 a,b,c,e | 7.9 ± 0.8 a,b,e,d,e,f | 8.8 ± 0.6 a,b,e,d,e,g | 12.5 ± 0.7 a,b,d,e,f,g,h | 16.37 ± 2.3 a,b,c,d,e,f,g,h,i | 20.9 ± 0.6 a,c,d,e,f,g,h,i |
| 31.3 | 100.0 ± 0.0 a | 2.3 ± 0.1 a,b | 11.6 ± 1.0 a,b,c | 9.7 ± 0.4 a,b,c,d | 12.7 ± 0. a,b,c,e | 10.3 ± 0.6 a,b,e,d,e,f | 8.9 ± 0.8 a,b,e,d,e,g | 12.1 ± 0.5 a,b,d,e,f,g,h | 21.64 ± 0.4 a,b,c,d,e,f,g,h,i | 27.6 ± 1.1 a,c,d,e,f,g,h,i |
| 62.5 | 100.0 ± 0.0 a | 18.5 ± 1.5 a,b | 14.4 ± 0.1 a,b,c | 12.4 ± 0.3 a,b,c,d | 21.6 ± 0.6 a,b,c,e | 10.8 ± 0.5 a,b,e,d,e,f | 14.7 ± 0.1 a,b,e,d,e,g | 20.6 ± 0.7 a,b,d,e,f,g,h | 25.09 ± 0.3 a,b,c,,d,e,f,g,h,i | 31.6 ± 2.4 a,c,d,e,f,g,h,i |
| 125.0 | 100.0 ± 0.0 a | 14.4 ± 2.4 a,b | 35.2 ± 0.1 a,b,c | 18.0 ± 0.4 a,b,c,d | 25.7 ± 0.7 a,b,c,e | 15.4 ± 0.4 a,b,e,d,e,f | 26.2 ± 1.2 a,b.e,d,e,g | 39.3 ± 1.8 a,b,d,e,f,g,h | 26.70 ± 0.4 a,b,c,d,e,f,g,h,i | 38.0 ± 1.1 a,c,d,e,f,g,h,i |
| 250.0 | 100.0 ± 0.0 a | 28.9 ± 0.0 a,b | 40.7 ± 0.3 a,b,c | 29.9 ± 0.6 a,b,c,d | 26.1 ± 1.1 a,b,c,e | 31.7 ± 0.2 a,b,e,d,e,f | 55.4 ± 1.2 a,b,e,d,e,g | 49.3 ± 0.5 a,b,d,e,f,g,h | 39.20 ± 1.6 a,b,c,d,e,f,g,h,i | 46.2 ± 1.0 a,c,d,e,f,g,h,i |
| 500.0 | 100.0 ± 0.0 a | 34.6 ± 0.1 a,b | 54.5 ± 0.5 a,b,c | 45.4 ± 0.3 a,b,c,d | 53.6 ± 1.5 a,b,c,e | 68.2 ± 0.5 a,b,e,d,e,f | 77.1 ± 0.5 a,b,e,d,e,g | 66.0 ± 5.3 a,b,d,e,f,g,h | 67.13 ± 1.5 a.,b,c,d,e,f,g,h,i | 44.4 ± 0.7 a,c,d,e,f,g,h,i |
| 1000.0 | 100.0 ± 0.0 a | 43.2 ± 1.4 a,b | 64.3 ± 1.0 a,b,c | 50.5 ± 1.3 a,b,c,d | 52.5 ± 1.0 a,b,c,e | 91.5 ± 1.0 a,b,e,d,e,f | 88.6 ± 1.2 a,b,e,d,e,g | 64.4 ± 1.4 a,b,d,e,f,g,h | 79.8 ± 0.5 a,b,c,d,e,f,g,h,i | 47.0 ± 1.0 a,c,d,e,f,g,h,i |
| µg/mL | Fraction | |||||||||
|---|---|---|---|---|---|---|---|---|---|---|
| C (+) | Extract | 1 | 2 | 3 | 4 | 5 | FM1 | FM2 | 11 | |
| 0.5 | 100.0 ± 0.0 a | 1.0 ± 0.5 a,b | 0.0 ± 0.0 a,b,,c | 0.00 ± 0.0 a,b,c,d | 3.8 ± 0.3 a,b,c,d,e | 2.33 ± 1.0 a,b,c,d,e,f | 5.5 ± 1.5 a,b,c,d,e,f,g | 4.3 ± 1.1 a,b,c,d,e,f,h | 0.6 ± 0.0 a,b,c,d,e,f,h,i | 6.2 ± 0.8 a,b,d,e,f,g,h,i |
| 1.0 | 100.0 ± 0.0 a | 2.9 ± 0.4 a,b | 3.4 ± 0.5 a,,b,c | 10.6 ± 0.8 a,b,c,d | 10.2 ± 1.3 a,b,c,d,e | 9.3 ± 0.5 a,b,c,d,e,f | 12.5 ± 0.6 a,b,c,d,e,f,g | 13.2 ± 0.3 a,b,c,d,e,f,h | 6.5 ± 0.7 a,b,c,d,e,f,h,i | 11.4 ± 0.3 a,b,d,e,f,,g,h,i |
| 2.0 | 100.0 ± 0.0 a | 3.0 ± 0.6 a,b | 3.6 ± 0.9 a,b,c | 12.1 ± 1.1 a,b,c,d | 11.4 ± 1.5 a,b,c,d,e | 10.7 ± 1.2 a,b,c,d,e,f | 11.4 ± 1.1 a,b,c,d,e,f,g | 14.2 ± 0.7 a,b,c,d,e,f,h | 6.2 ± 0.8 a,b,c,d,e,f,h,i | 12.8 ± 1.0 a,b,d,e,f,g,h,i |
| 3.9 | 100.0 ± 0.0 a | 5.3 ± 1.3 a | 3.7 ± 1.3 a,b | 11.2 ± 1.1 a,b,c,d | 9.2 ± 3.3 a,b,c,d,e | 12.3 ± 0.9 a,b,c,d,e,f | 13.5 ± 0.6 a,b,c,d,e,f,g | 14.3 ± 0.5 a,b,c,d,e,f,h | 7.2 ± 0.1 a,b,c,d,e,f,h,i | 11.5 ± 1.6 a,b,d,e,f,g,h,i |
| 7.8 | 100.0 ± 0.0 a | 6.3 ± 0.7 a,b | 6.3 ± 1.9 a,b | 6.4 ± 1.6 a,b,c,d | 6.4 ± 1.6 a,b,c,d,e | 12.1 ± 1.2 a,b,c,d,e,f | 15.0 ± 0.4 a,b,c,d,e,f,g | 15.1 ± 0.8 a,b,c,d,e,f,h | 7.3 ± 0.2 a,b,c,d,e,f,h,i | 12.9 ± 1.0 a,b,d,e,f,g,h,i |
| 15.6 | 100.0 ± 0.0 a | 13.1 ± 1.0 a,b | 7.7 ± 0.3 a,b | 6.8 ± 0.9 a,b,c,d | 7.2 ± 1.0 a,b,c,d,e | 14.4 ± 0.6 a,b,c,d,e,f | 16.6 ± 1.7 a,b,c,d,e,f,g | 15.2 ± 0.5 a,b,c,d,e,f,h | 7.6 ± 0.1 a,b,c,d,e,f,h,i | 12.7 ± 1.2 a,b,d,e,f,g,h,i |
| 31.3 | 100.0 ± 0.0 a | 15.1 ± 0.2 a,b | 9.4 ± 0.8 a,b | 7.9 ± 0.7 a,b,c,d | 9.1 ± 2.1 a,b,c,d,e | 14.9 ± 0.6 a,b,c,d,e,f | 17.4 ± 0.5 a,b,c,d,e,f,g | 30.4 ± 0.6 a,b,c,d,e,f,h | 8.4 ± 0.3 a,b,c,d,e,f,h,i | 19.1 ± 0.8 a,b,d,e,f,g,h,i |
| 62.5 | 100.0 ± 0.0 a | 40.6 ± 1.8 a,b | 11.1 ± 0.8 a,b | 12.7 ± 1.5 a,b,c,d | 11.7 ± 1.0 a,b,c,d,e | 14.2 ± 1.3 a,b,c,d,e,f | 31.3 ± 2.7 a,b,c,d,e,f,g | 65.2 ± 1.7 a,b,c,d,e,f,h | 15.8 ± 0.5 a,b,c,d,e,f,h,i | 23.6 ± 0.8 a,b,d,e,f,g,h,i |
| 125.0 | 100.0 ± 0.0 a | 45.6 ± 2.6 a,b | 23.6 ± 0.7 a,b | 22.2 ± 0.5 a,b,c,d | 21.5 ± 2.1 a,b,c,d,e | 37.3 ± 2.3 a,b,c,d,e,f | 33.5 ± 3.5 a,b,c,d,e,f,g | 80.0 ± 5.6 a,b,c,d,e,f,h | 25.0 ± 0.9 a,b,c,d,e,f,h,i | 31.9 ± 1.0 a,b,d,e,f,g,h,i |
| 250.0 | 100.0 ± 0.0 a | 46.6 ± 0.2 a,b | 17.2 ± 4.1 a,b | 20.5 ± 0.5 a,b,c,d | 22.0 ± 1.2 a,b,c,d,e | 53.9 ± 2.5 a,b,c,d,e,f | 65.9 ± 1.5 a,b,c,d,e,f,g | 81.1 ± 2.8 a,b,c,d,e,f,h | 29.3 ± 0.1 a,b,c,d,e,f,h,i | 44.7 ± 0. 6 a,b,d,e,f,g,h,i |
| 500.0 | 100.0 ± 0.0 a | 50.2 ± 0.1 a,b | 38.4 ± 3.8 a,b | 35.3 ± 1.0 a,b,c,d | 33.6 ± 3.0 a,b,c,d,e | 81.9 ± 2.8 a,b,c,d,e,f | 97.0 ± 2.3 a,b,c,d,e,f,g | 85.0 ± 1.0 a,b,c,d,e,f,h | 80.5 ± 2.0 a,b,c,d,e,f,h,i | 48.7 ± 0.6 a,b,d,e,f,g,h,i |
| 1000.0 | 100.0 ± 0.0 a | 65.9 ± 0.9 a,b | 47.0 ± 0.5 a,b | 38.0 ± 2.0 a,b,c,d | 62.6 ± 1.0 a,b,c,d,e | 93.3 ± 0.5 a,b,c,d,e,f | 85.1 ± 0.6 a,b,c,d,e,f,g | 82.6 ± 0.6 a,b,c,d,e,f,h | 86.7 ± 1.5 a,b,c,d,e,f,h,i | 45.0 ± 1.5 a,b,d,e,f,g,h,i |
| µg/mL | Fraction | |||||||||
|---|---|---|---|---|---|---|---|---|---|---|
| C (+) | Extract | 1 | 2 | 3 | 4 | 5 | FM1 | FM2 | 11 | |
| 0.5 | 100.0 ± 0.0 a | 0.0 ± 0.0 a,b | 0.0 ± 0.0 a,b,c | 0.0 ± 0.0 a,b,d | 0.0 ± 0.0 a,d,e | 0.0 ± 0.0 a,c,d,e,f | 0.0 ± 0.0 a,b,c,d,e,f,g | 0.0 ± 0.0 a,b,d,e,f,g,h | 0.0 ± 0.0 a,b,c,d,e,f,h,i | 0.0 ± 0.0 a,b,c,e,f,g,h,i |
| 1.0 | 100.0 ± 0.0 a | 3.5 ± 1.4 a,b | 0.0 ± 0.0 a,b,c | 0.0 ± 0.0 a,b,d | 0.0 ± 0.0 a,d,e | 0.0 ± 0.0 a,c,d,e,f | 0.0 ± 0.0 a,b,c,d,e,f,g | 0.0 ± 0.0 a,b,d,e,f,g,h | 0.0 ± 0.0 a,b,c,d,e,f,h,i | 0.0 ± 0.0 a,b,c,e,f,g,h,i |
| 2.0 | 100.0 ± 0.0 a | 5.3 ± 0.4 a,b | 0.0 ± 0.0 a,b,c | 0.0 ± 0.0 a,b,d | 0.0 ± 0.0 a,d,e | 0.0 ± 0.0 a,c,d,e,f | 0.0 ± 0.0 a,b,c,e,f,g | 0.0 ± 0.0 a,b,d,e,f,g,h | 0.0 ± 0.0 a,b,c,d,e,f,h,i | 0.0 ± 0.0 a,b,c,e,f,g,h,i |
| 3.9 | 100.0 ± 0.0 a | 6.5 ± 0.9 a,b | 0.0 ± 0.0 a,b,c | 0.0 ± 0.0 a,b,d | 0.0 ± 0.0 a,d,e | 0.0 ± 0.0 a,c,d,e,f | 0.0 ± 0.0 a,b,c,d,e,f,g | 0.0 ± 0.0 a,b,d,e,f,g,h | 0.0 ± 0.0 a,b,c,d,e,f.h,i | 0.0 ± 0.0 a,b,c,e,f,g,h,i |
| 7.8 | 100.0 ± 0.0 a | 8.6 ± 0.4 a,b | 0.0 ± 0.0 a,b,c | 0.0 ± 0.0 a,b,d | 0.0 ± 0.0 a,d,e | 0.0 ± 0.0 a,c,d,e,f | 0.0 ± 0.0 a,b,c,d,e,f,g | 0.0 ± 0.0 a,b,d,e,f,g,h | 0.0 ± 0.0 a,b,c,d,e,f,h,i | 0.0 ± 0.0 a,b,c,e,f,g,h,i |
| 15.6 | 100.0 ± 0.0 a | 10.2 ± 0.4 a,b | 0.0 ± 0.0 a,b,c | 0.0 ± 0.0 a,b,d | 0.0 ± 0.0 a,d,e | 0.0 ± 0.0 a,c,d,e,f | 0.0 ± 0.0 a,b,c,d,e,f,g | 0.0 ± 0.0 a,b,d,e,f,g,h | 0.0 ± 0.0 a,b,c,d,e,f,h,i | 0.0 ± 0.0 a,b,c,e,f,g,h,i |
| 31.3 | 100.0 ± 0.0 a | 10.9 ± 0.7 a,b | 0.0 ± 0.0 a,b,c | 0.0 ± 0.0 a,b,d | 0.0 ± 0.0 a,d,e | 0.0 ± 0.0 a,c,d,e,f | 0.0 ± 0.0 a,b,c,d,e,f,g | 0.0 ± 0.0 a,b,d,e,f,g,h | 0.0 ± 0.0 a,b,c,d,e,f,h,i | 0.0 ± 0.0 a,b,c,e,f,g,h,i |
| 62.5 | 100.0 ± 0.0 a | 14.8 ± 0.6 a,b | 0.0 ± 0.0 a,b,c | 0.0 ± 0.0 a,b,d | 0.0 ± 0.0 a,d,e | 0.0 ± 0.0 a,c,d,e,f | 0.0 ± 0.0 a,b,c,d,e,f,g | 0.0 ± 0.0 a,b,d,e,f,g,h | 0.0 ± 0.0 a,b,c,d,e,f,h,i | 0.0 ± 0.0 a,b,c,e,f,g,h,i |
| 125.0 | 100.0 ± 0.0 a | 19.8 ± 0.7 a,b | 0.0 ± 0.0 a,b,c | 0.0 ± 0.0 a,b,d | 6.6 ± 1.7 a,d,e | 0.0 ± 0.0 a,c,d,e,f | 55.4 ± 1.5 a,b,c,d,e,f,g | 33.3 ± 0.5 a,b,d,e,f,g,h | 39.0 ± 0.5 a,b,c,d,e,f,h,i | 0.0 ± 0.0 a,b,c,e,f,g,h,i |
| 250.0 | 100.0 ± 0.0 a | 29.2 ± 0.8 a,b | 30.6 ± 0.7 a,b,c | 0.0 ± 0.0 a,b,d | 18.7 ± 1.8 a,d,e | 0.0 ± 0.0 a,c,d,e,f | 47.5 ± 1.5 a,b,c,d,e,f,g | 31.8 ± 0.7 a,b,d,e,f,g,h | 78.8 ± 0.8 a,b,c,d,e,f,h,i | 0.0 ± 0.0 a,b,c,e,f,g,h,i |
| 500.0 | 100.0 ± 0.0 a | 37.6 ± 0.2 a,b | 43.8 ± 2.7 a,b,c | 0.0 ± 0.0 a,b,d | 37.9 ± 3.0 a,d,e | 44.9 ± 2.4 a,c,d,e,f | 77.2 ± 2.0 a,b,c,d,e,f,g | 43.9 ± 1.4 a,b,d,e,f,g,h | 84.8 ± 1.0 a,b,c,d,e,f,h,i | 0.0 ± 0.0 a,b,c,e,f,g,h,i |
| 1000.0 | 100.0 ± 0.0 a | 61.0 ± 1.4 a,b | 49.9 ± 4.1 a,b,c | 0.0 ± 0.0 a,b,d | 56.6 ± 2.6 a,d,e | 66.1 ± 1.0 a,c,d,e,f | 86.5 ± 3.2 a,b,c,d,e,f,g | 46.5 ± 4.0 a,b,d,e,f,g,h | 87.9 ± 2.1 a,b,c,d,e,f,h,i | 0.0 ± 0.0 a,b,c,e,f,g,h,i |
| MIC90 (µg/mL) | ||||
|---|---|---|---|---|
| Extract or Fraction | Bacteria | |||
| S. aureus | S. choleraesuis | E. coli | P. aeruginosa | |
| Extract | 1215.4 ± 15.4 a | 1824.8 ± 41.0 a | 1146 ± 8.4 a | 1451.7 ± 23.9 a |
| F1 | 1070.0 ± 81.5 a | 1212.3 ± 12.4 a | 1812.1 ± 69.9 a | 1588.2 ± 139.0 a |
| F2 | 2534.5 ± 91.5 a | 1552.2 ± 28.7 a | 2354.4 ± 86.0 a | |
| F3 | 941.9 ± 47.0 a | 1508.6 ± 26.6 a | 1510.1 ± 30.8 a | 1480.6 ± 32.2 a |
| F4 | 862.6 ± 5.9 a | 899.8 ± 8.0 a | 801.8 ± 9.4 a | 1325.1 ± 9.9 a |
| F5 | 836.7 ± 18.7 a | 860.8 ± 28.0 a | 789.0 ± 2.0 a | 841.8 ± 27.9 a |
| FM1 | 741.7 ± 7.2 a | 1124.0 ± 73.7 a | 790.7 ± 7.1 a | 1587.2 ± 96.9 a |
| FM2 | 985.7 ± 20.9 a | 1010.6 ± 16.2 a | 890.9 ± 16.7 a | 804.5 ± 11.9 a |
| F11 | 2110.9 ± 63.9 | 1819.2 ± 51.8 | 1836.7 ± 33.9 | |
| Fractions | DPPH (mg ET/g) | ABTS (mg ET/g) | FRAP (µM FE(II)/g) |
|---|---|---|---|
| Extract | 508.5 ± 2.8 a | 223.5 ± 0.9 a | 1477.4 ± 3.9 a |
| 1 | 0.86 ± 0.13 a,b | 4.11 ± 0.14 a,b | 4.32 ± 0.48 a,b |
| 2 | 0.05 ± 0.25 a,b,c | 0.00 ± 0.00 a,b,c | 4.69 ± 0.40 a,b,c |
| 3 | 0.35 ± 0.12 a.b,d | 0.00 ± 0.00 a,b,d | 4.78 ± 0.31 a,b,d |
| 4 | 0.16 ± 0.14 a,c,d,e | 0.00 ± 0.00 a,c,d,e | 9.37 ± 0.31 a,c,d,e |
| 5 | 0.27 ± 0.09 a,c,f | 2.20 ± 0.12 a,c,f | 5.63 ± 0.30 a,c,f |
| FM1 | 0.00 ± 0.00 a,g | 1.74 ± 0.12 a,g | 5.01 ± 0.19 a,g |
| FM2 | 1.24 ± 0.92 a,b,c,d,e,f,g,h | 7.02 ± 0.15 a,b,c,d,e,f,g,h | 7.01 ± 0.58 a,b,c,d,e,f,g,h |
| 11 | 4.44 ± 0.02 a,b,c,d,e,f,g,h | 8.02 ± 0.03 a,b,c,d,e,f,g,h | 16.22 ± 0.28 a,bc,d,e,f,g,h |
| Fraction | tr (min) | m/z, [M − H]− | Compound Identified |
|---|---|---|---|
| F1 | 5.01 | 341.1 | Caffeic acid 4-O-glucoside |
| 4.54 | 387.1 | Medioresinol | |
| 40.47 | 451.4 | 3-Hydroxyphloretin 2′-O-glucoside | |
| F2 | 4.49 | 757.4 | Cyanidin 3-O-glucosyl-rutinoside |
| 53.22 | 371.3 | Sinensitin | |
| F3 | 39.63 | 371.3 | Sinensitin |
| F4 | 52.53 | 309.0 | Cinnamoyl glucose |
| 55.76 | 311.1 | Caffeoyl tartaric acid | |
| 58.0 | 694.8 | Cyanidin 3-O-(6′′-malonyl-3′′-glucosyl-glucoside) | |
| F5 | 55.87 | 339.1 | Esculin |
| 57.33 | 297.1 | Kaempferide | |
| F6 | 40.91 | 371.1 | Tangeretin |
| 52.88 | 329.1 | Jaceosidin | |
| 53.97 | 329.1 | 3,7-Dimethylquercetin | |
| 54.98 | 311.1 | Caffeoyl tartaric acid | |
| 56.79 | 297.1 | Kaempferide | |
| FM1 | 51.08 | 227.1 | Resveratrol |
| 55.47 | 739.3 | Kaempferol 3-O-(2′′-rhamnosyl-galactoside) 7-O-rhamnoside | |
| 56.76 | 311.1 | Caffeoyl tartaric acid | |
| FM2 | 3.02 | 377.1 | 3,4-DHPEA-EA |
| 35.35 | 385. | 5-5′-Dehydrodiferulic acid | |
| F11 | 37.34 | 487.4 | 6′′-O-Acetylglycitin |
| 52.98 | 327.2 | p-Coumaroyl tyrosine | |
| 53.87 | 325.1 | p-Coumaric acid 4-O-glucoside |
Publisher’s Note: MDPI stays neutral with regard to jurisdictional claims in published maps and institutional affiliations. |
© 2021 by the authors. Licensee MDPI, Basel, Switzerland. This article is an open access article distributed under the terms and conditions of the Creative Commons Attribution (CC BY) license (https://creativecommons.org/licenses/by/4.0/).
Share and Cite
Solís-Salas, L.M.; Sierra-Rivera, C.A.; Cobos-Puc, L.E.; Ascacio-Valdés, J.A.; Silva-Belmares, S.Y. Antibacterial Potential by Rupture Membrane and Antioxidant Capacity of Purified Phenolic Fractions of Persea americana Leaf Extract. Antibiotics 2021, 10, 508. https://0-doi-org.brum.beds.ac.uk/10.3390/antibiotics10050508
Solís-Salas LM, Sierra-Rivera CA, Cobos-Puc LE, Ascacio-Valdés JA, Silva-Belmares SY. Antibacterial Potential by Rupture Membrane and Antioxidant Capacity of Purified Phenolic Fractions of Persea americana Leaf Extract. Antibiotics. 2021; 10(5):508. https://0-doi-org.brum.beds.ac.uk/10.3390/antibiotics10050508
Chicago/Turabian StyleSolís-Salas, Laura María, Crystel Aleyvick Sierra-Rivera, Luis Enrique Cobos-Puc, Juan Alberto Ascacio-Valdés, and Sonia Yesenia Silva-Belmares. 2021. "Antibacterial Potential by Rupture Membrane and Antioxidant Capacity of Purified Phenolic Fractions of Persea americana Leaf Extract" Antibiotics 10, no. 5: 508. https://0-doi-org.brum.beds.ac.uk/10.3390/antibiotics10050508