Population Pharmacokinetics and Significant Under-Dosing of Anti-Tuberculosis Medications in People with HIV and Critical Illness

 , ,
, ,
Abstract
:1. Introduction
2. Results
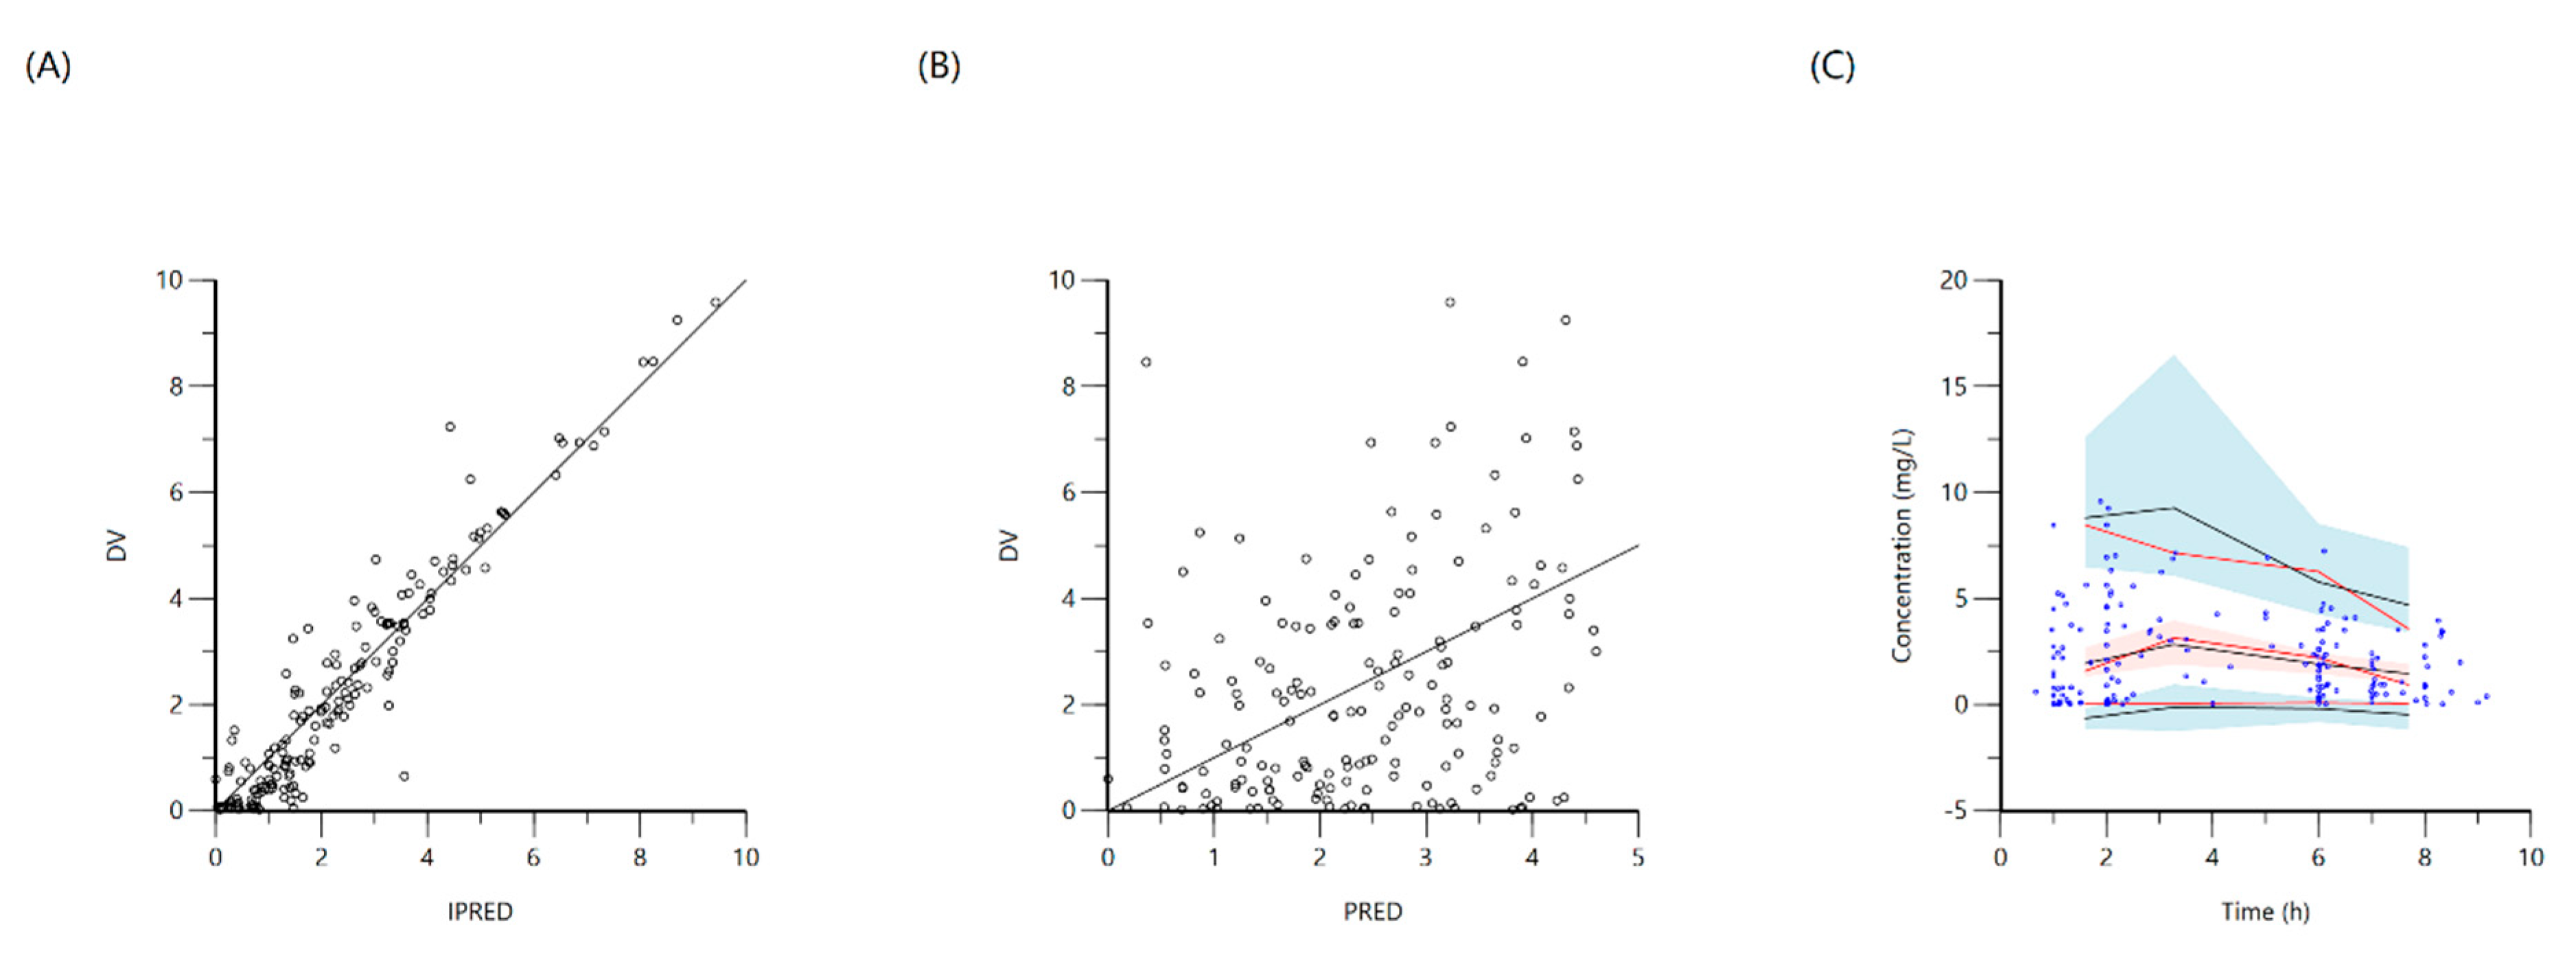
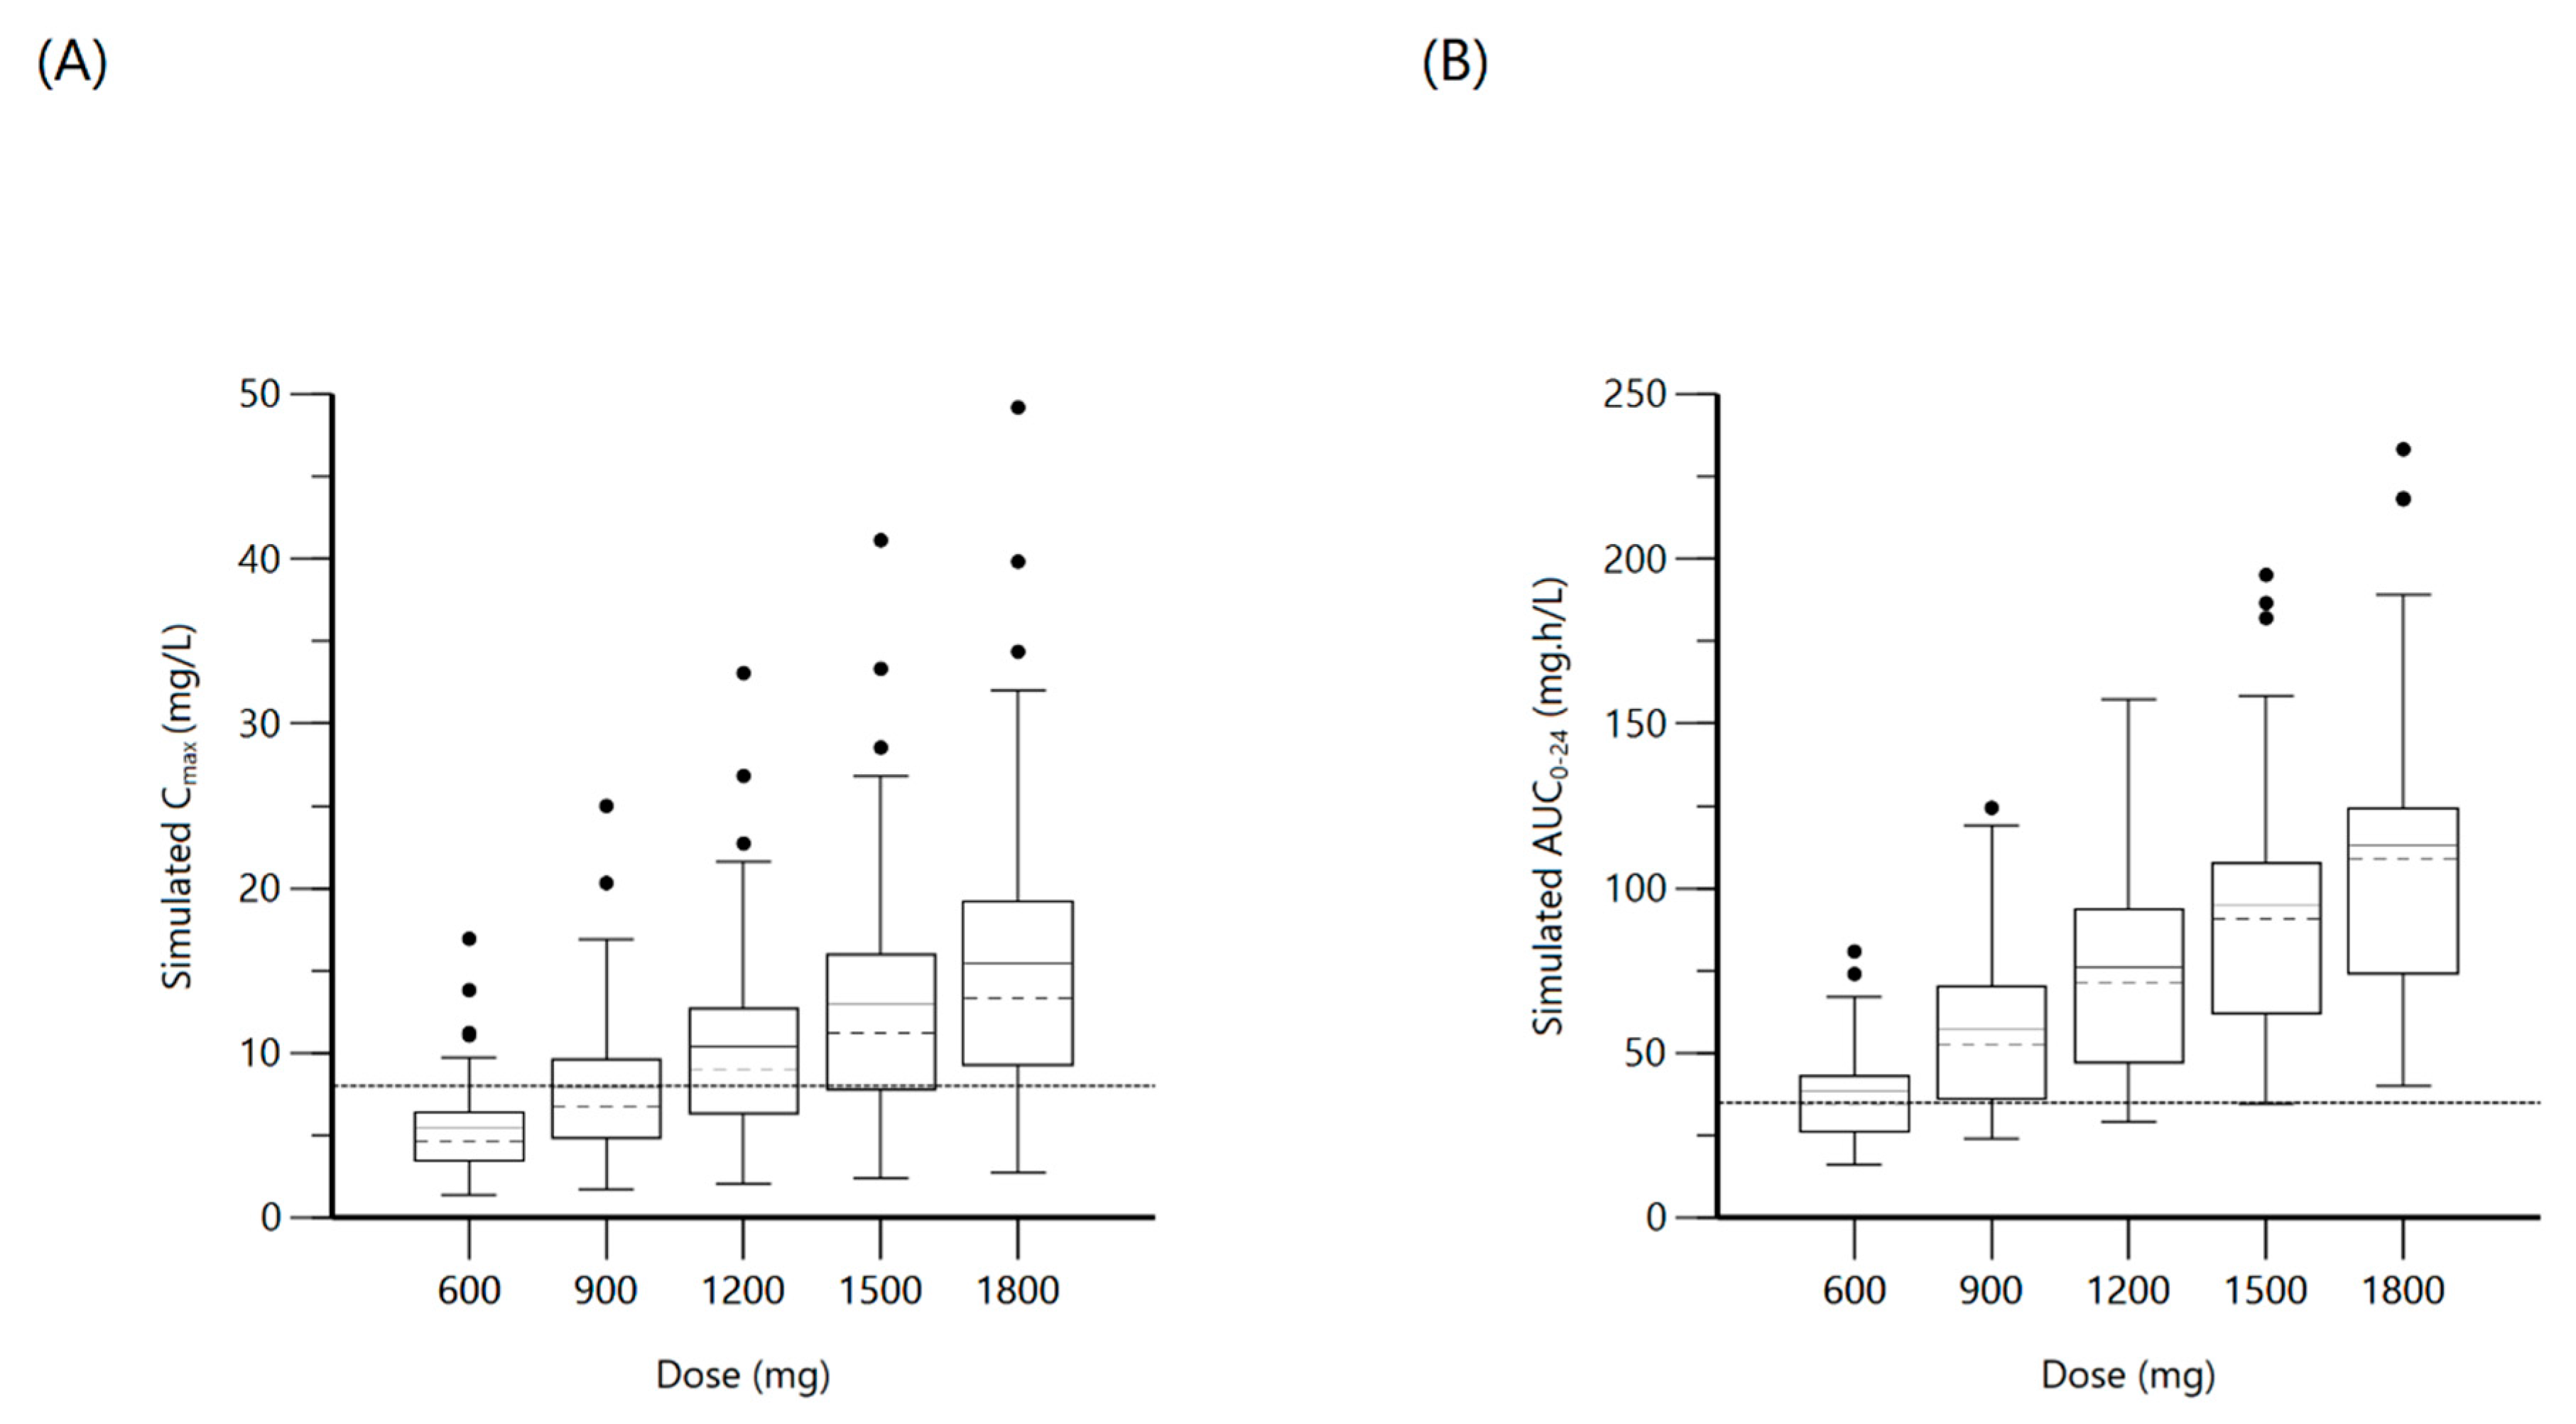
2.1. Rifampin
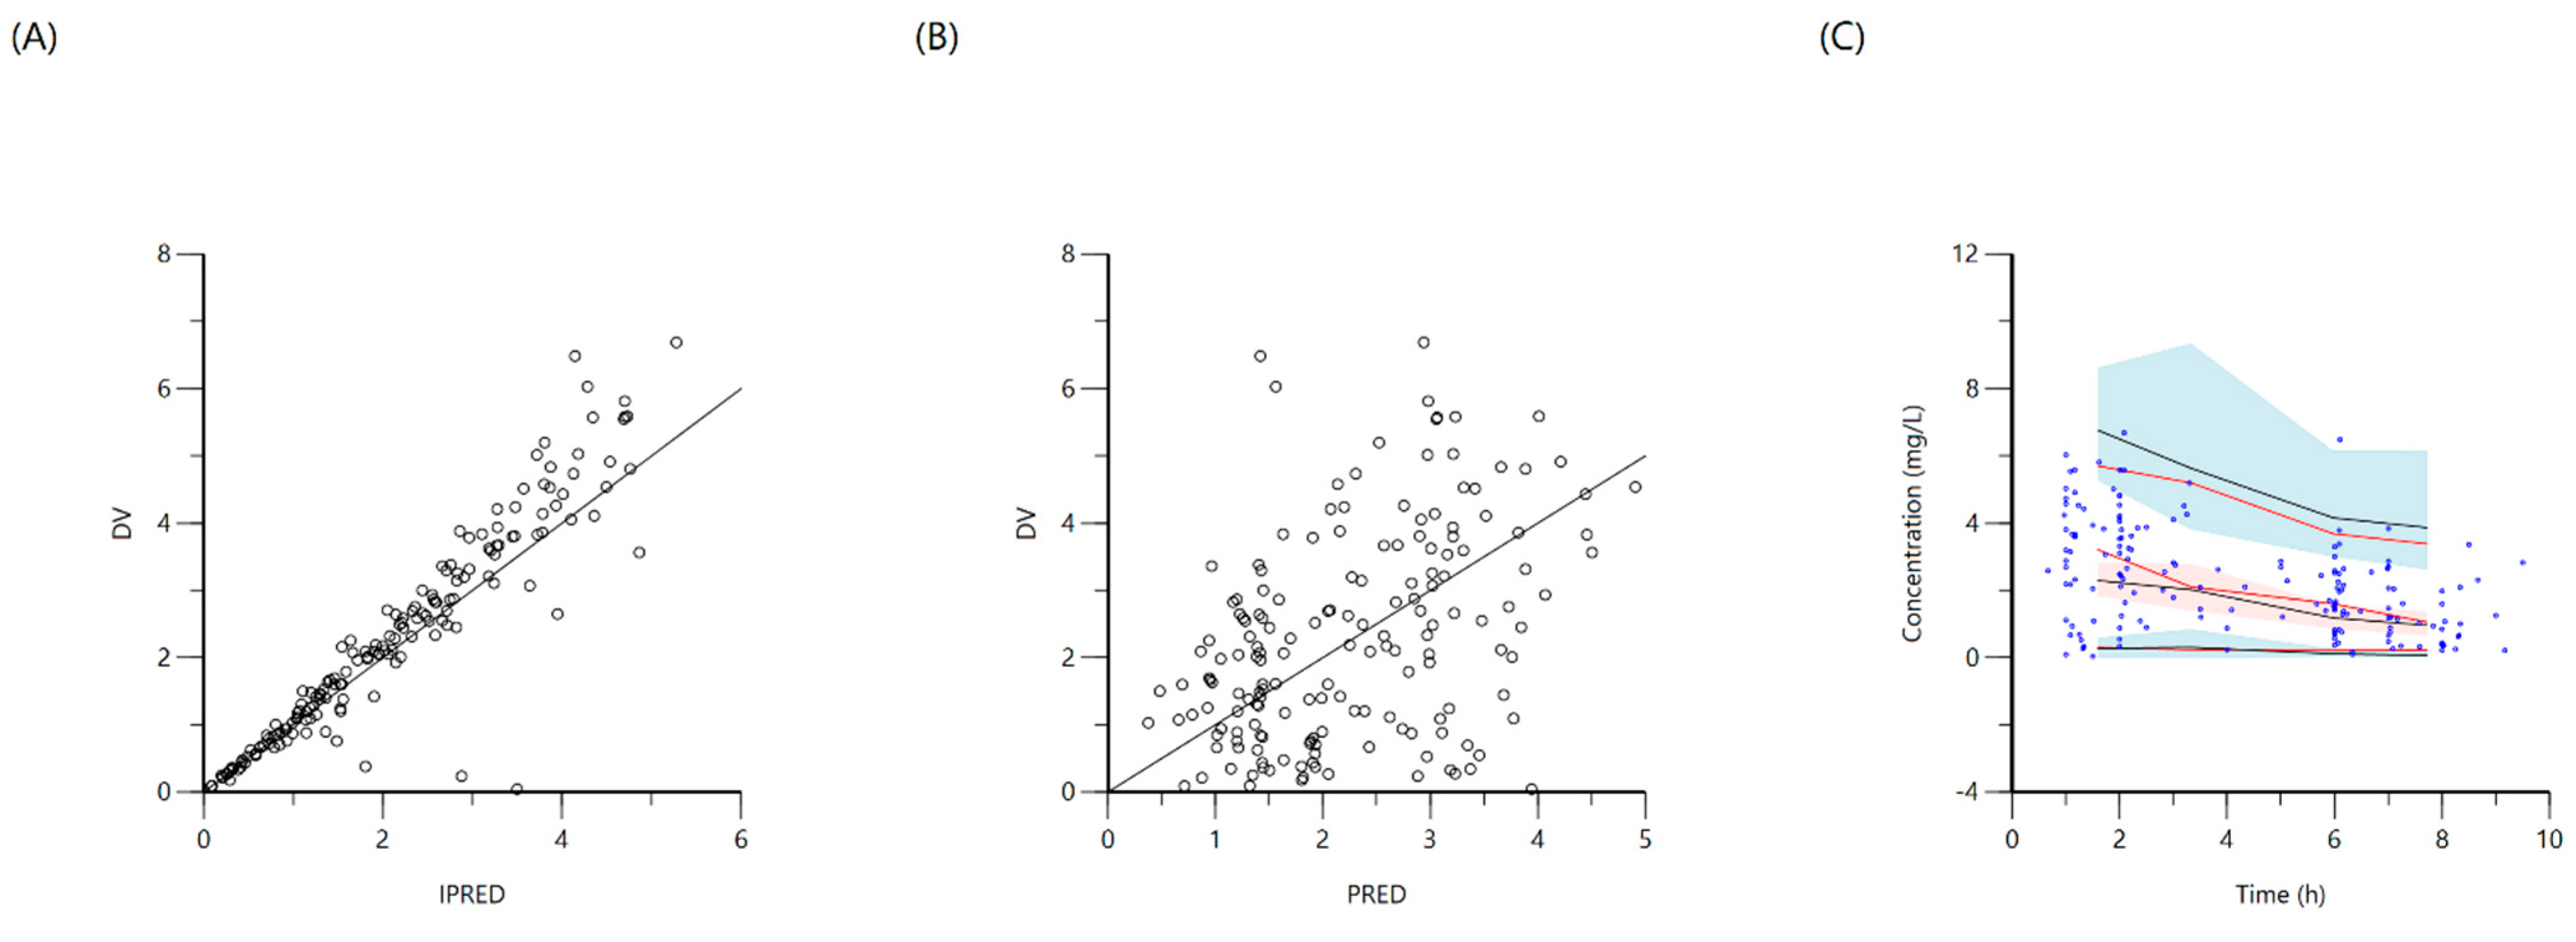
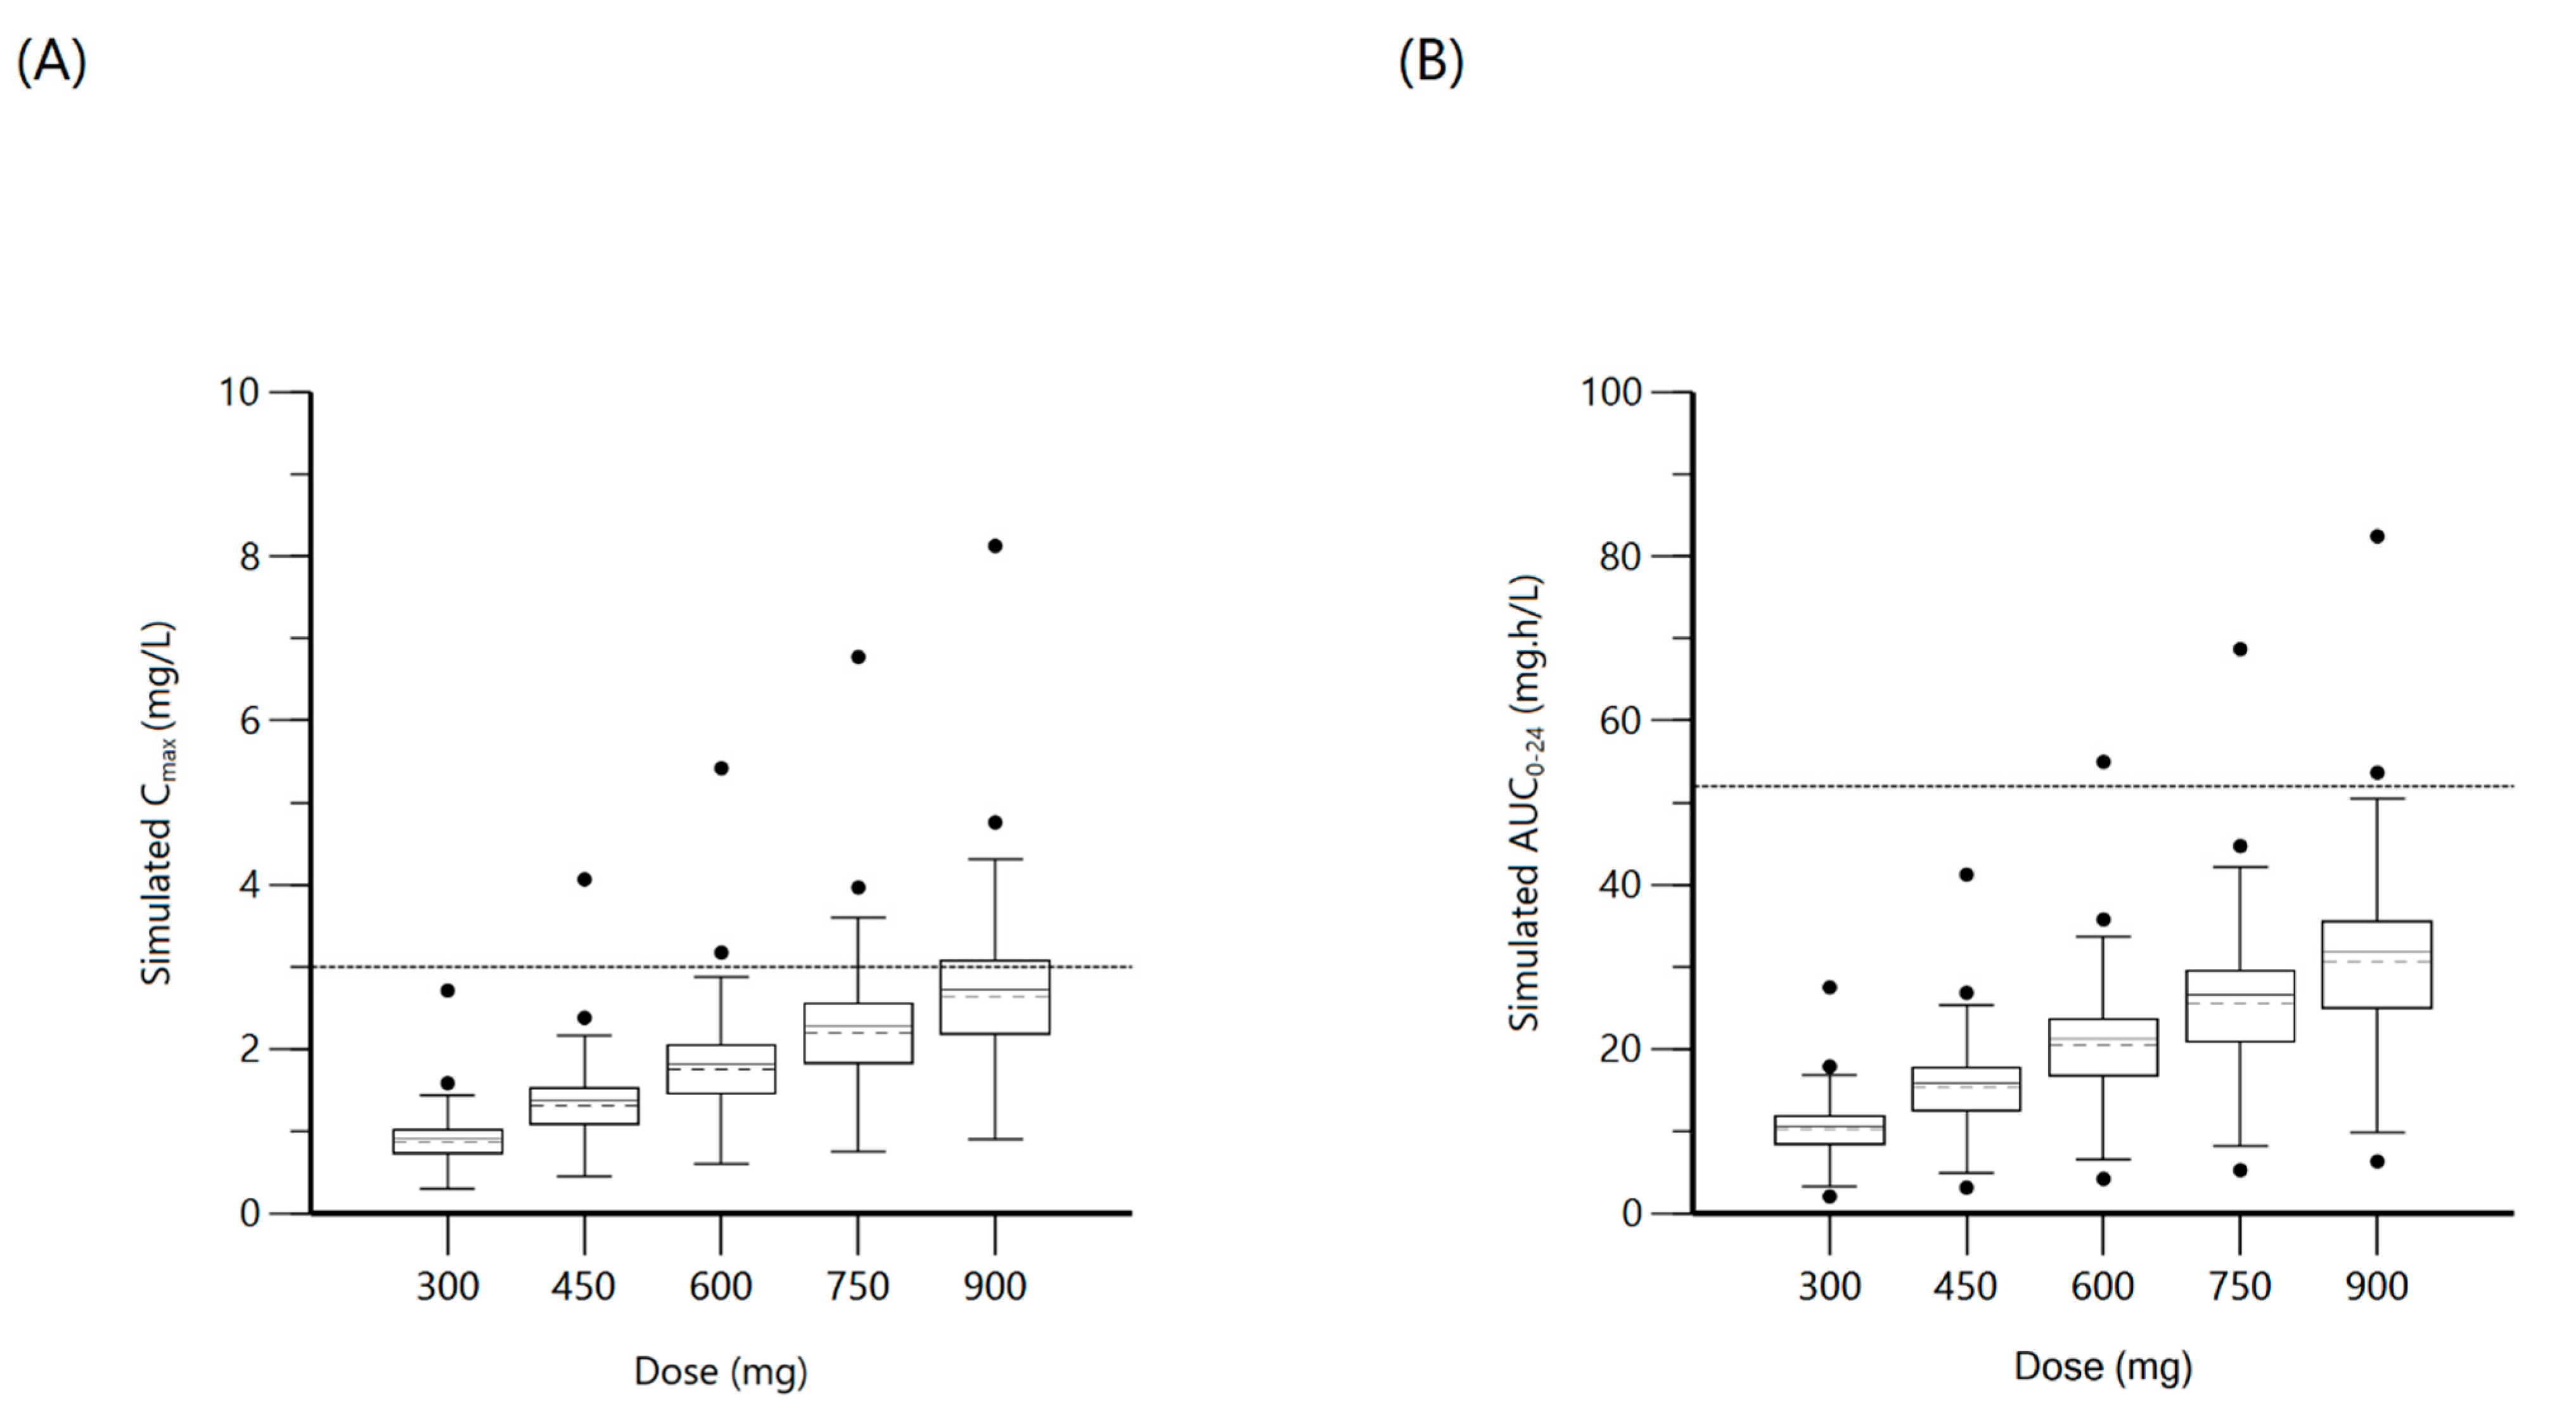
2.2. Isoniazid
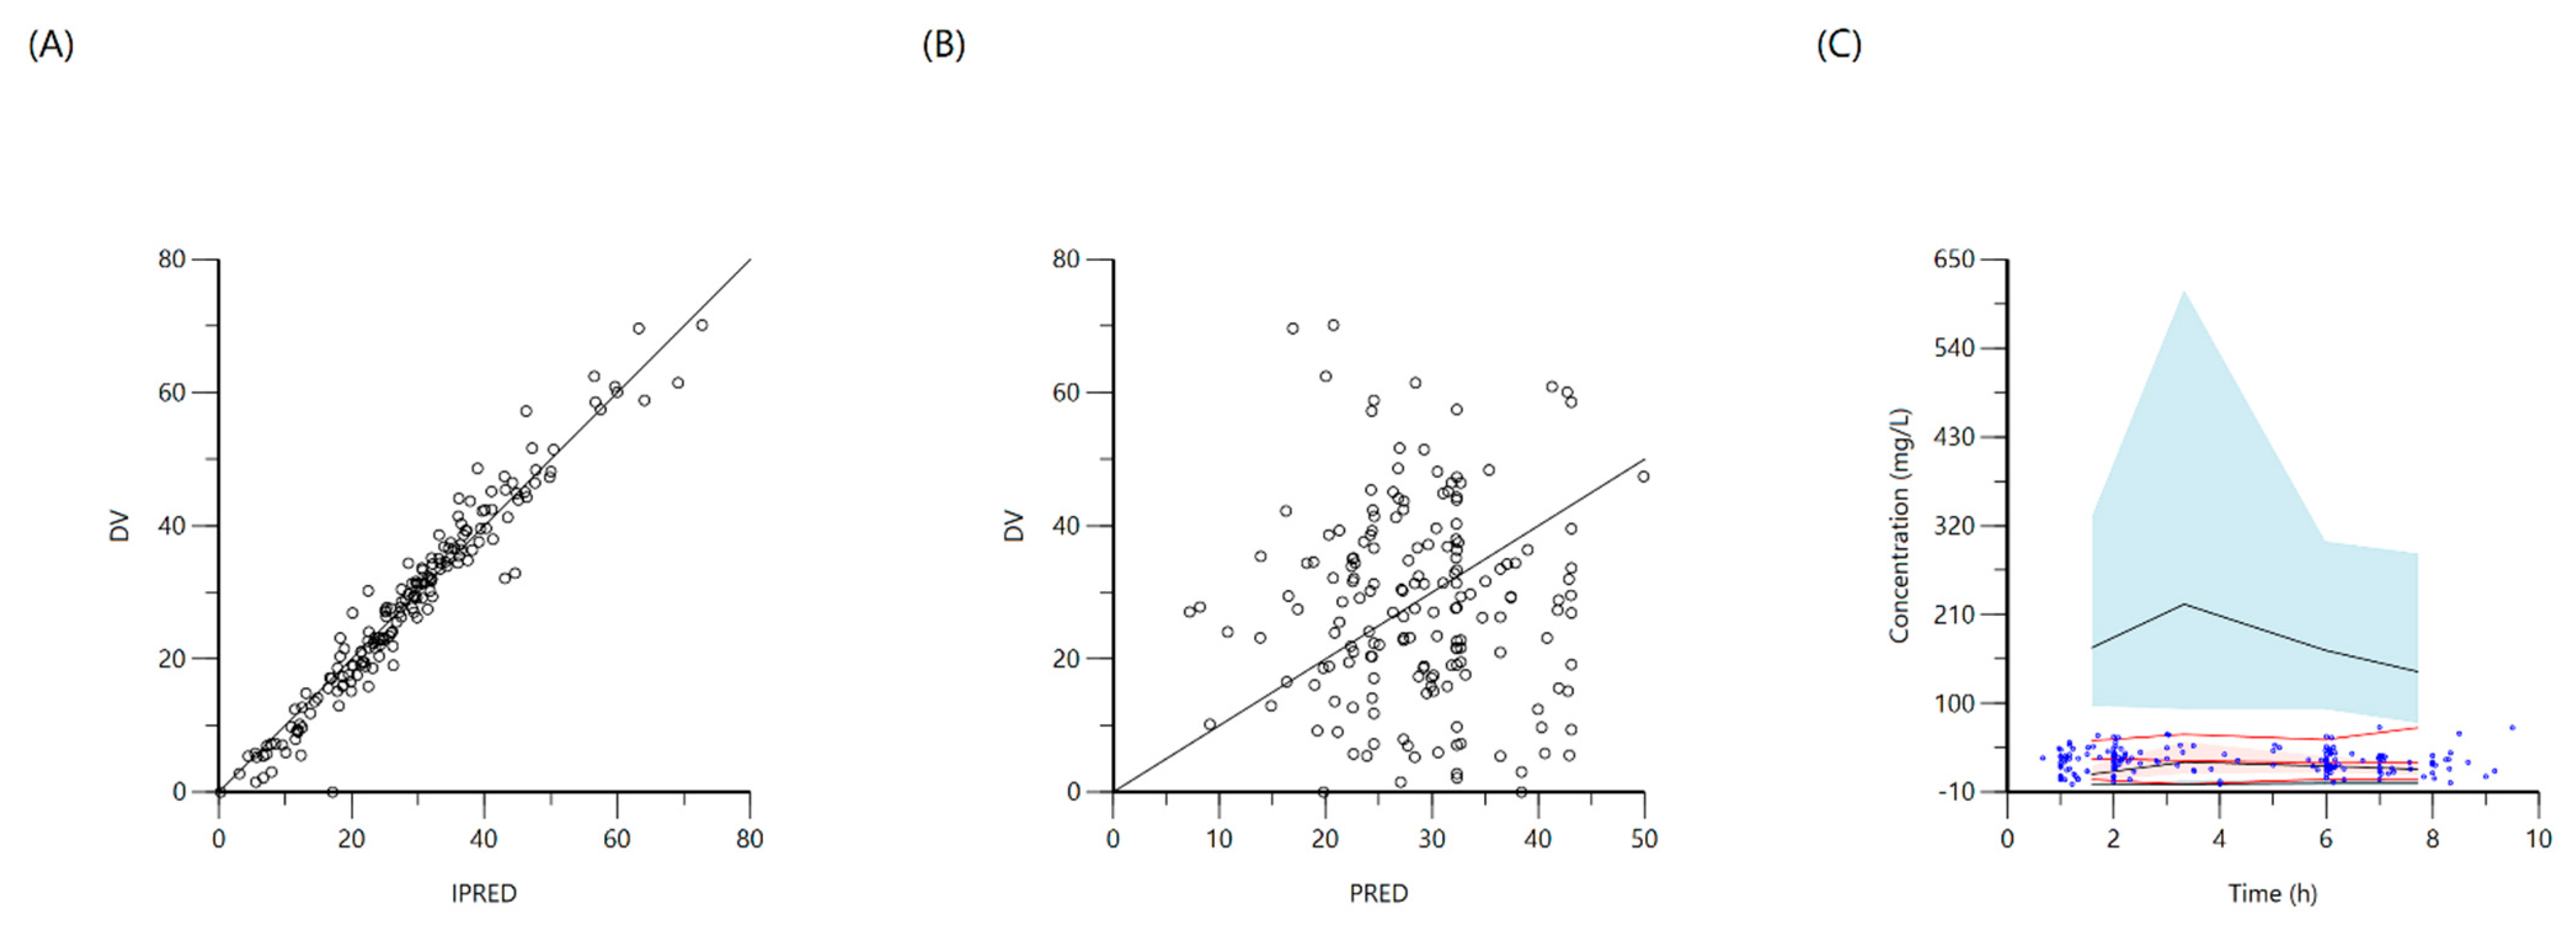
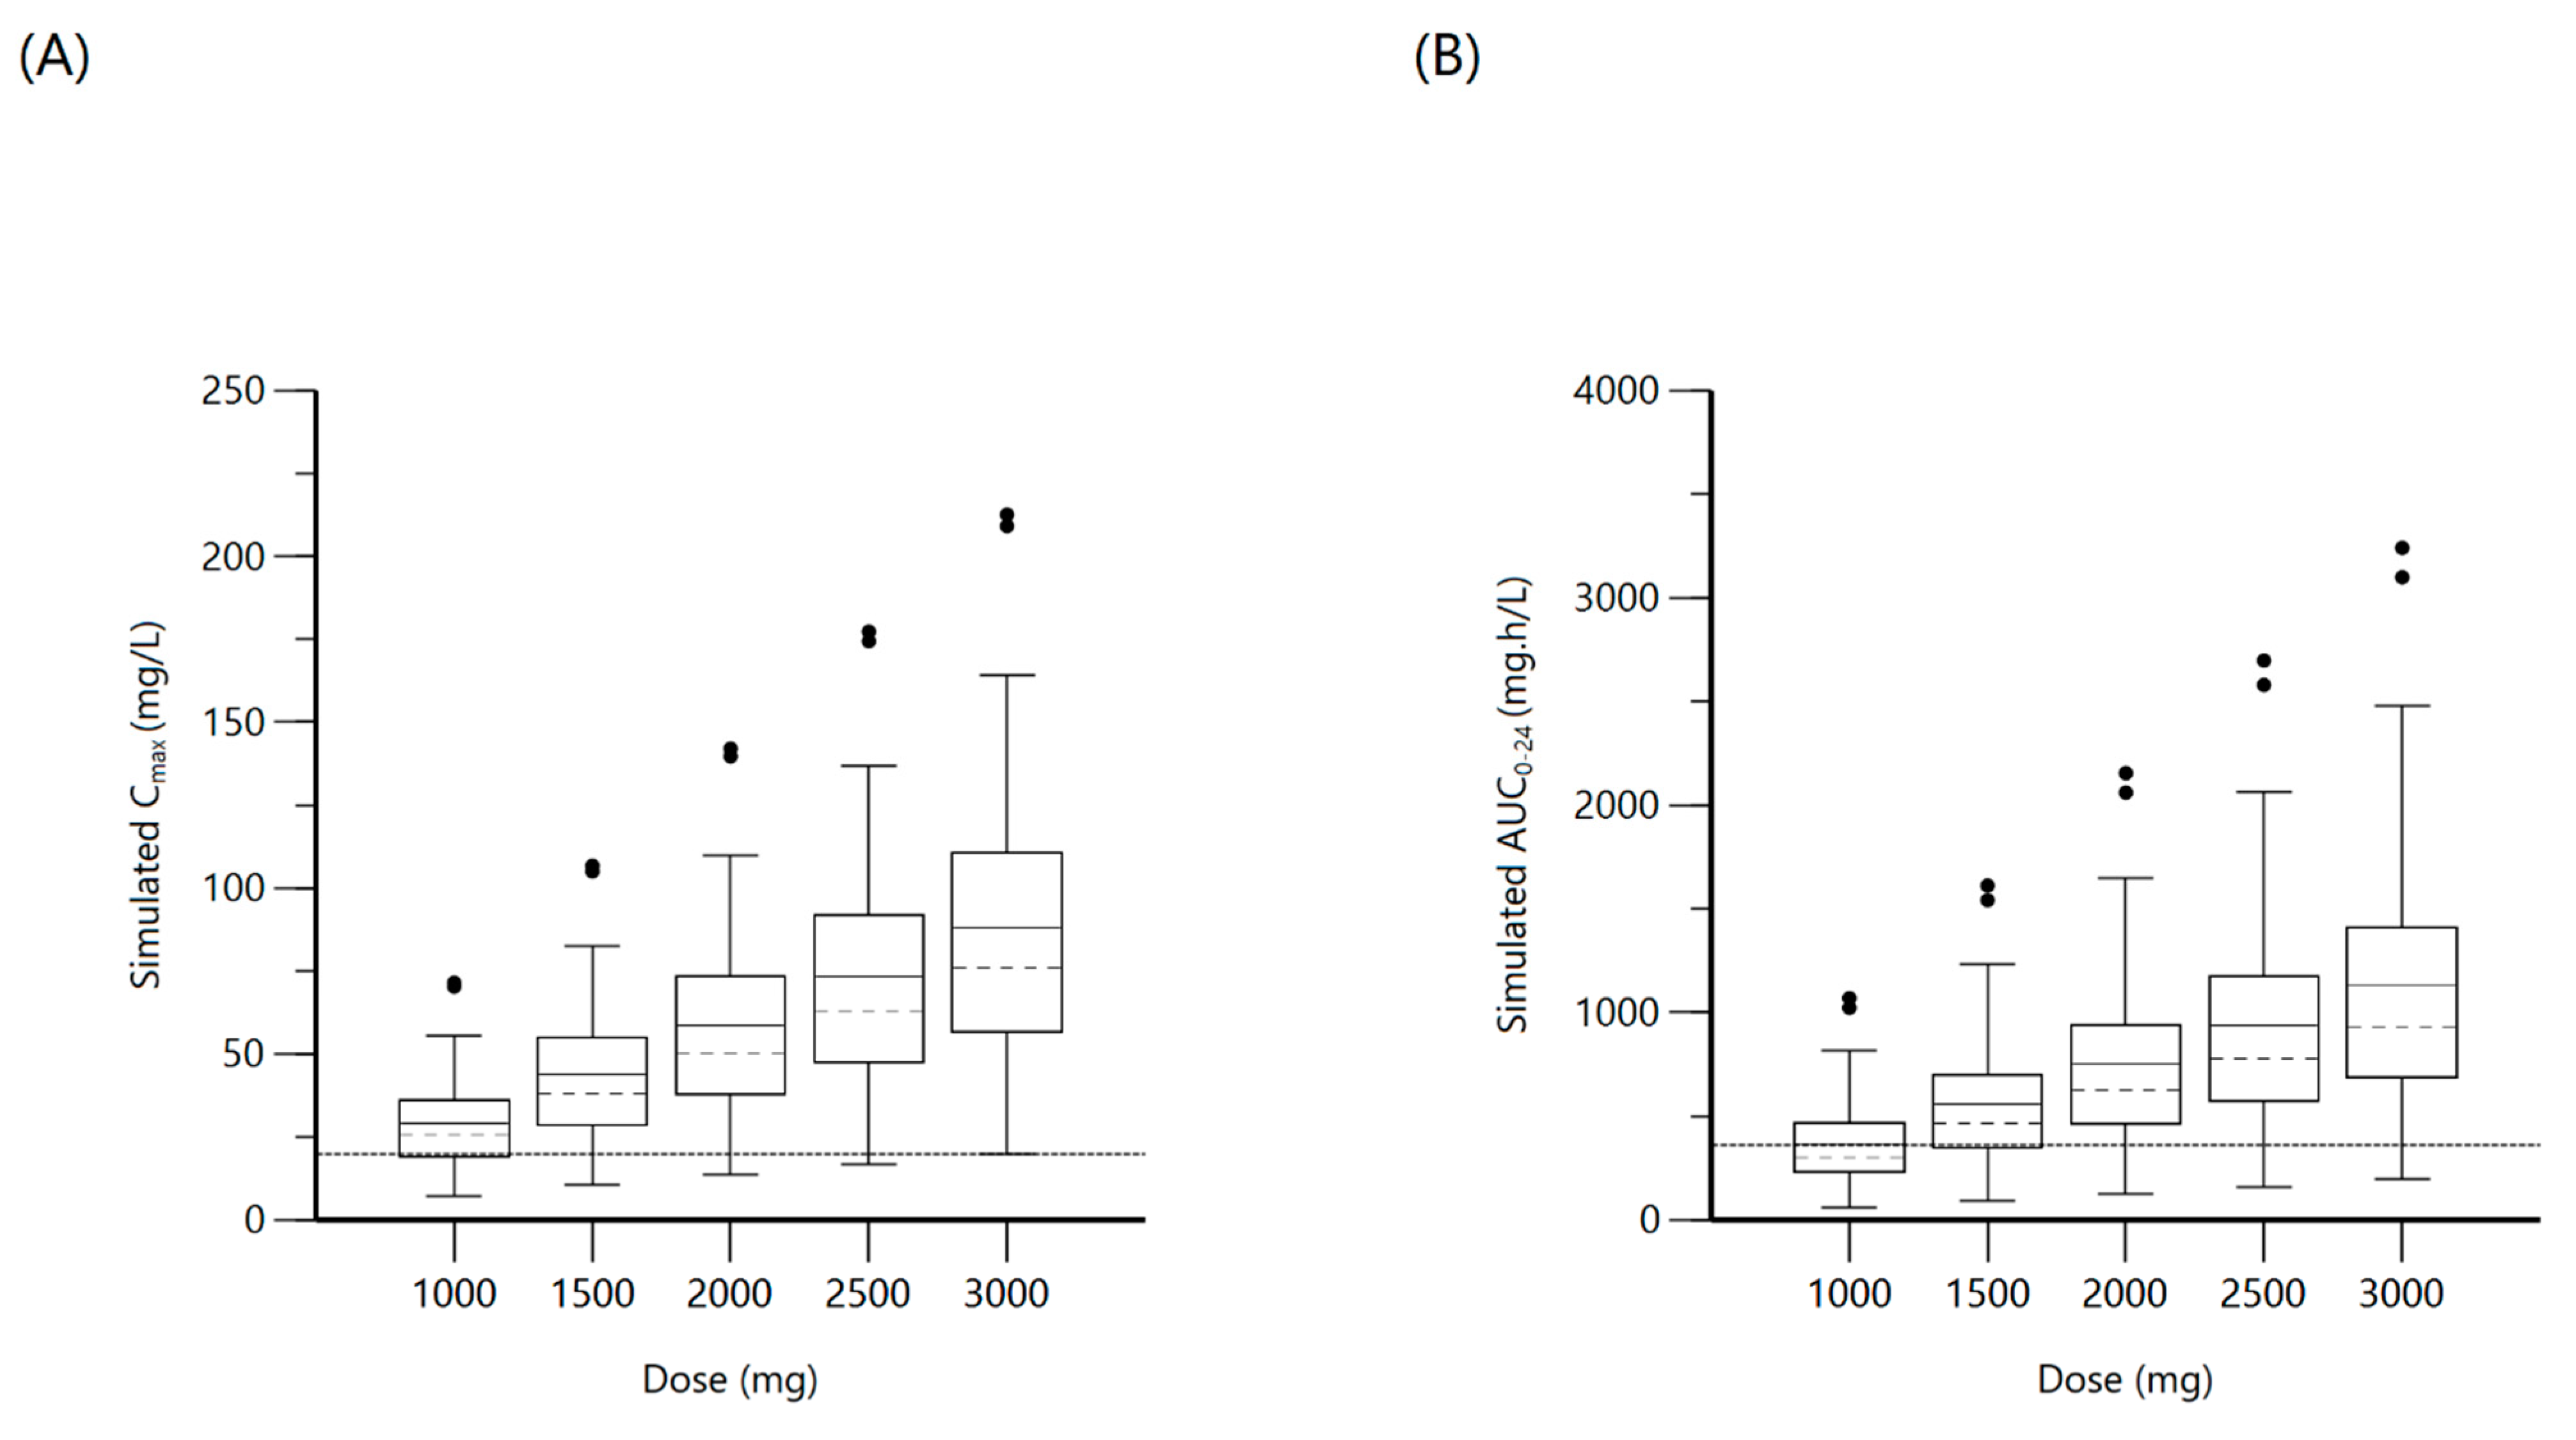
2.3. Pyrazinamide
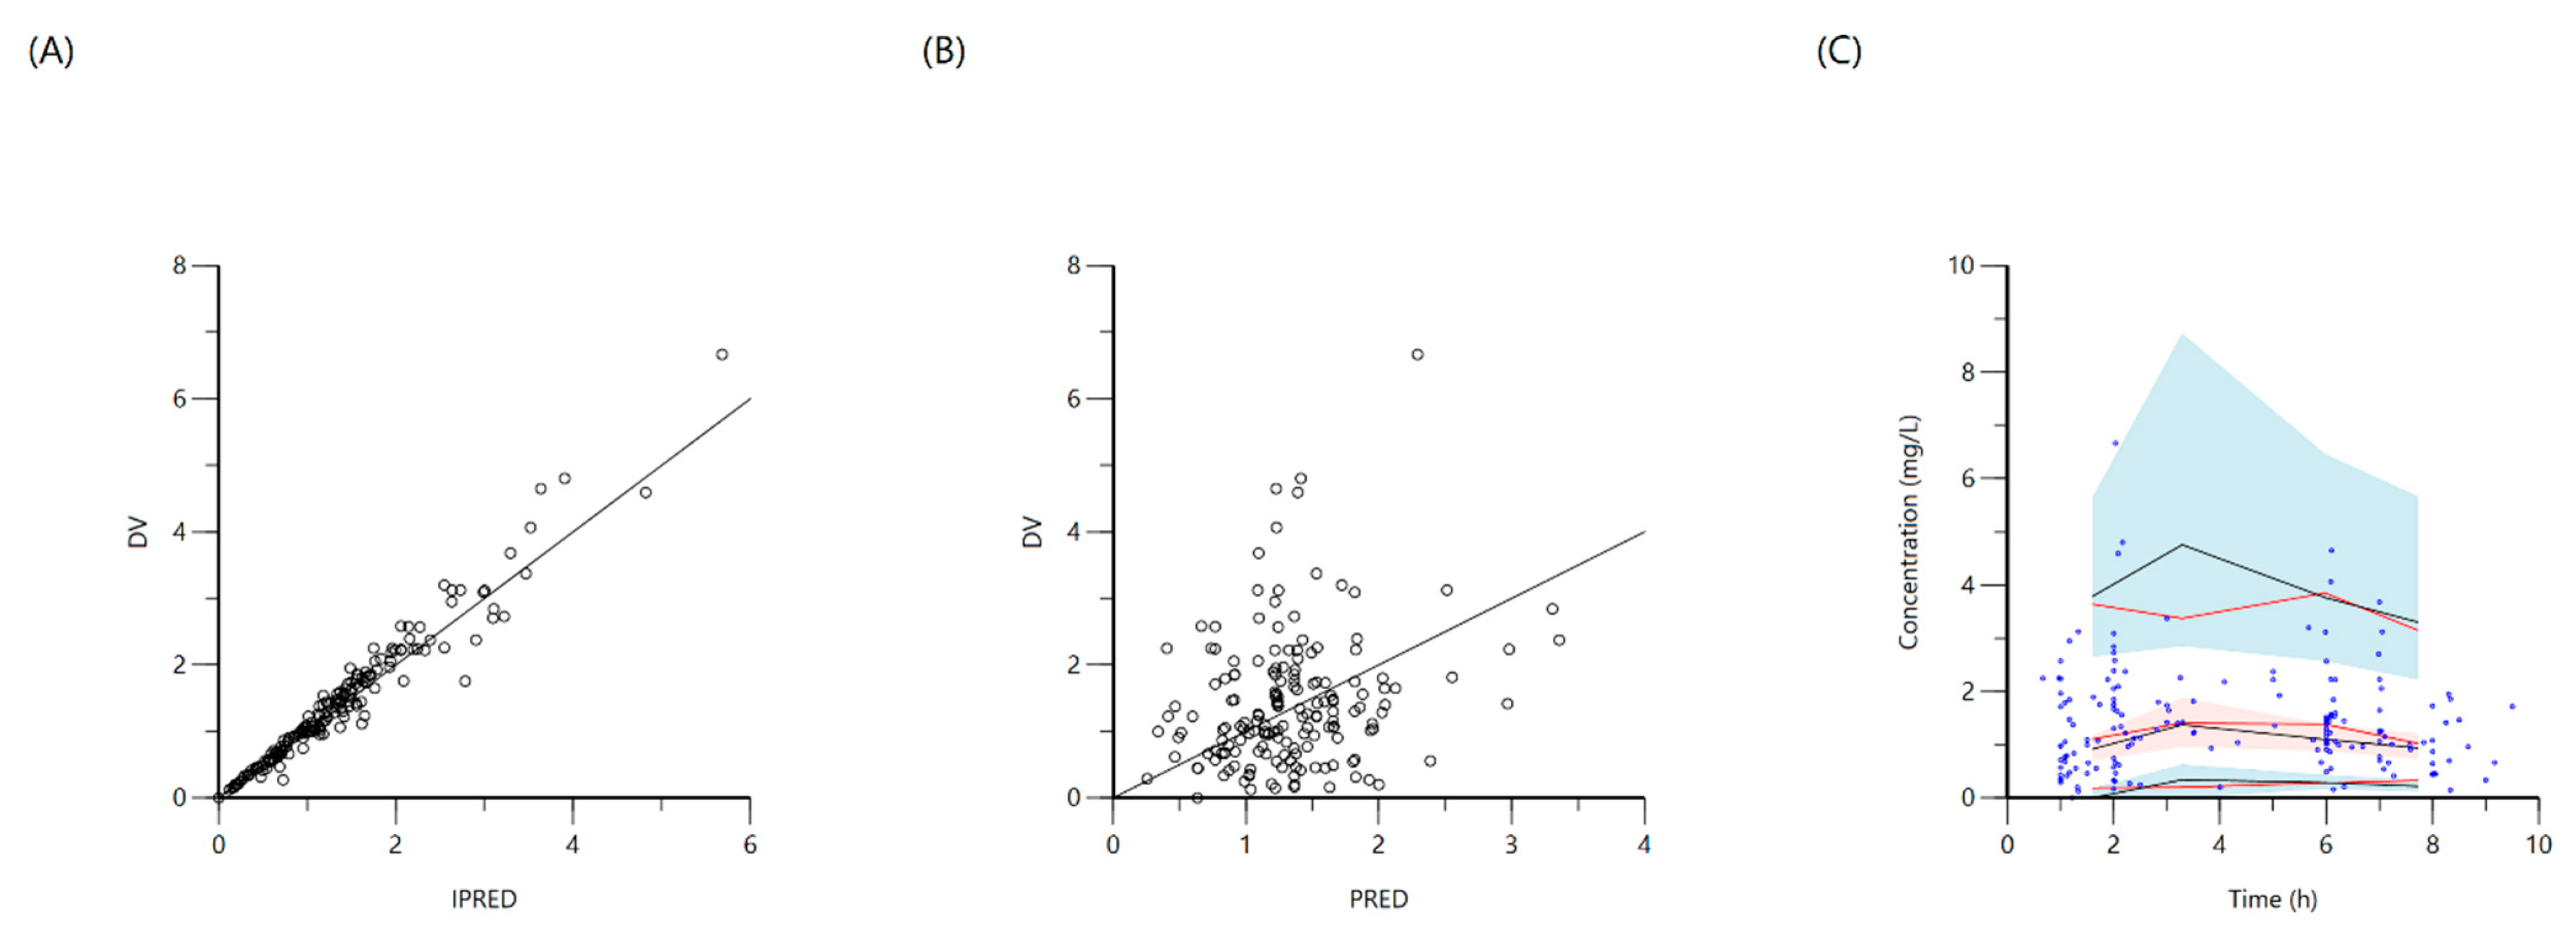
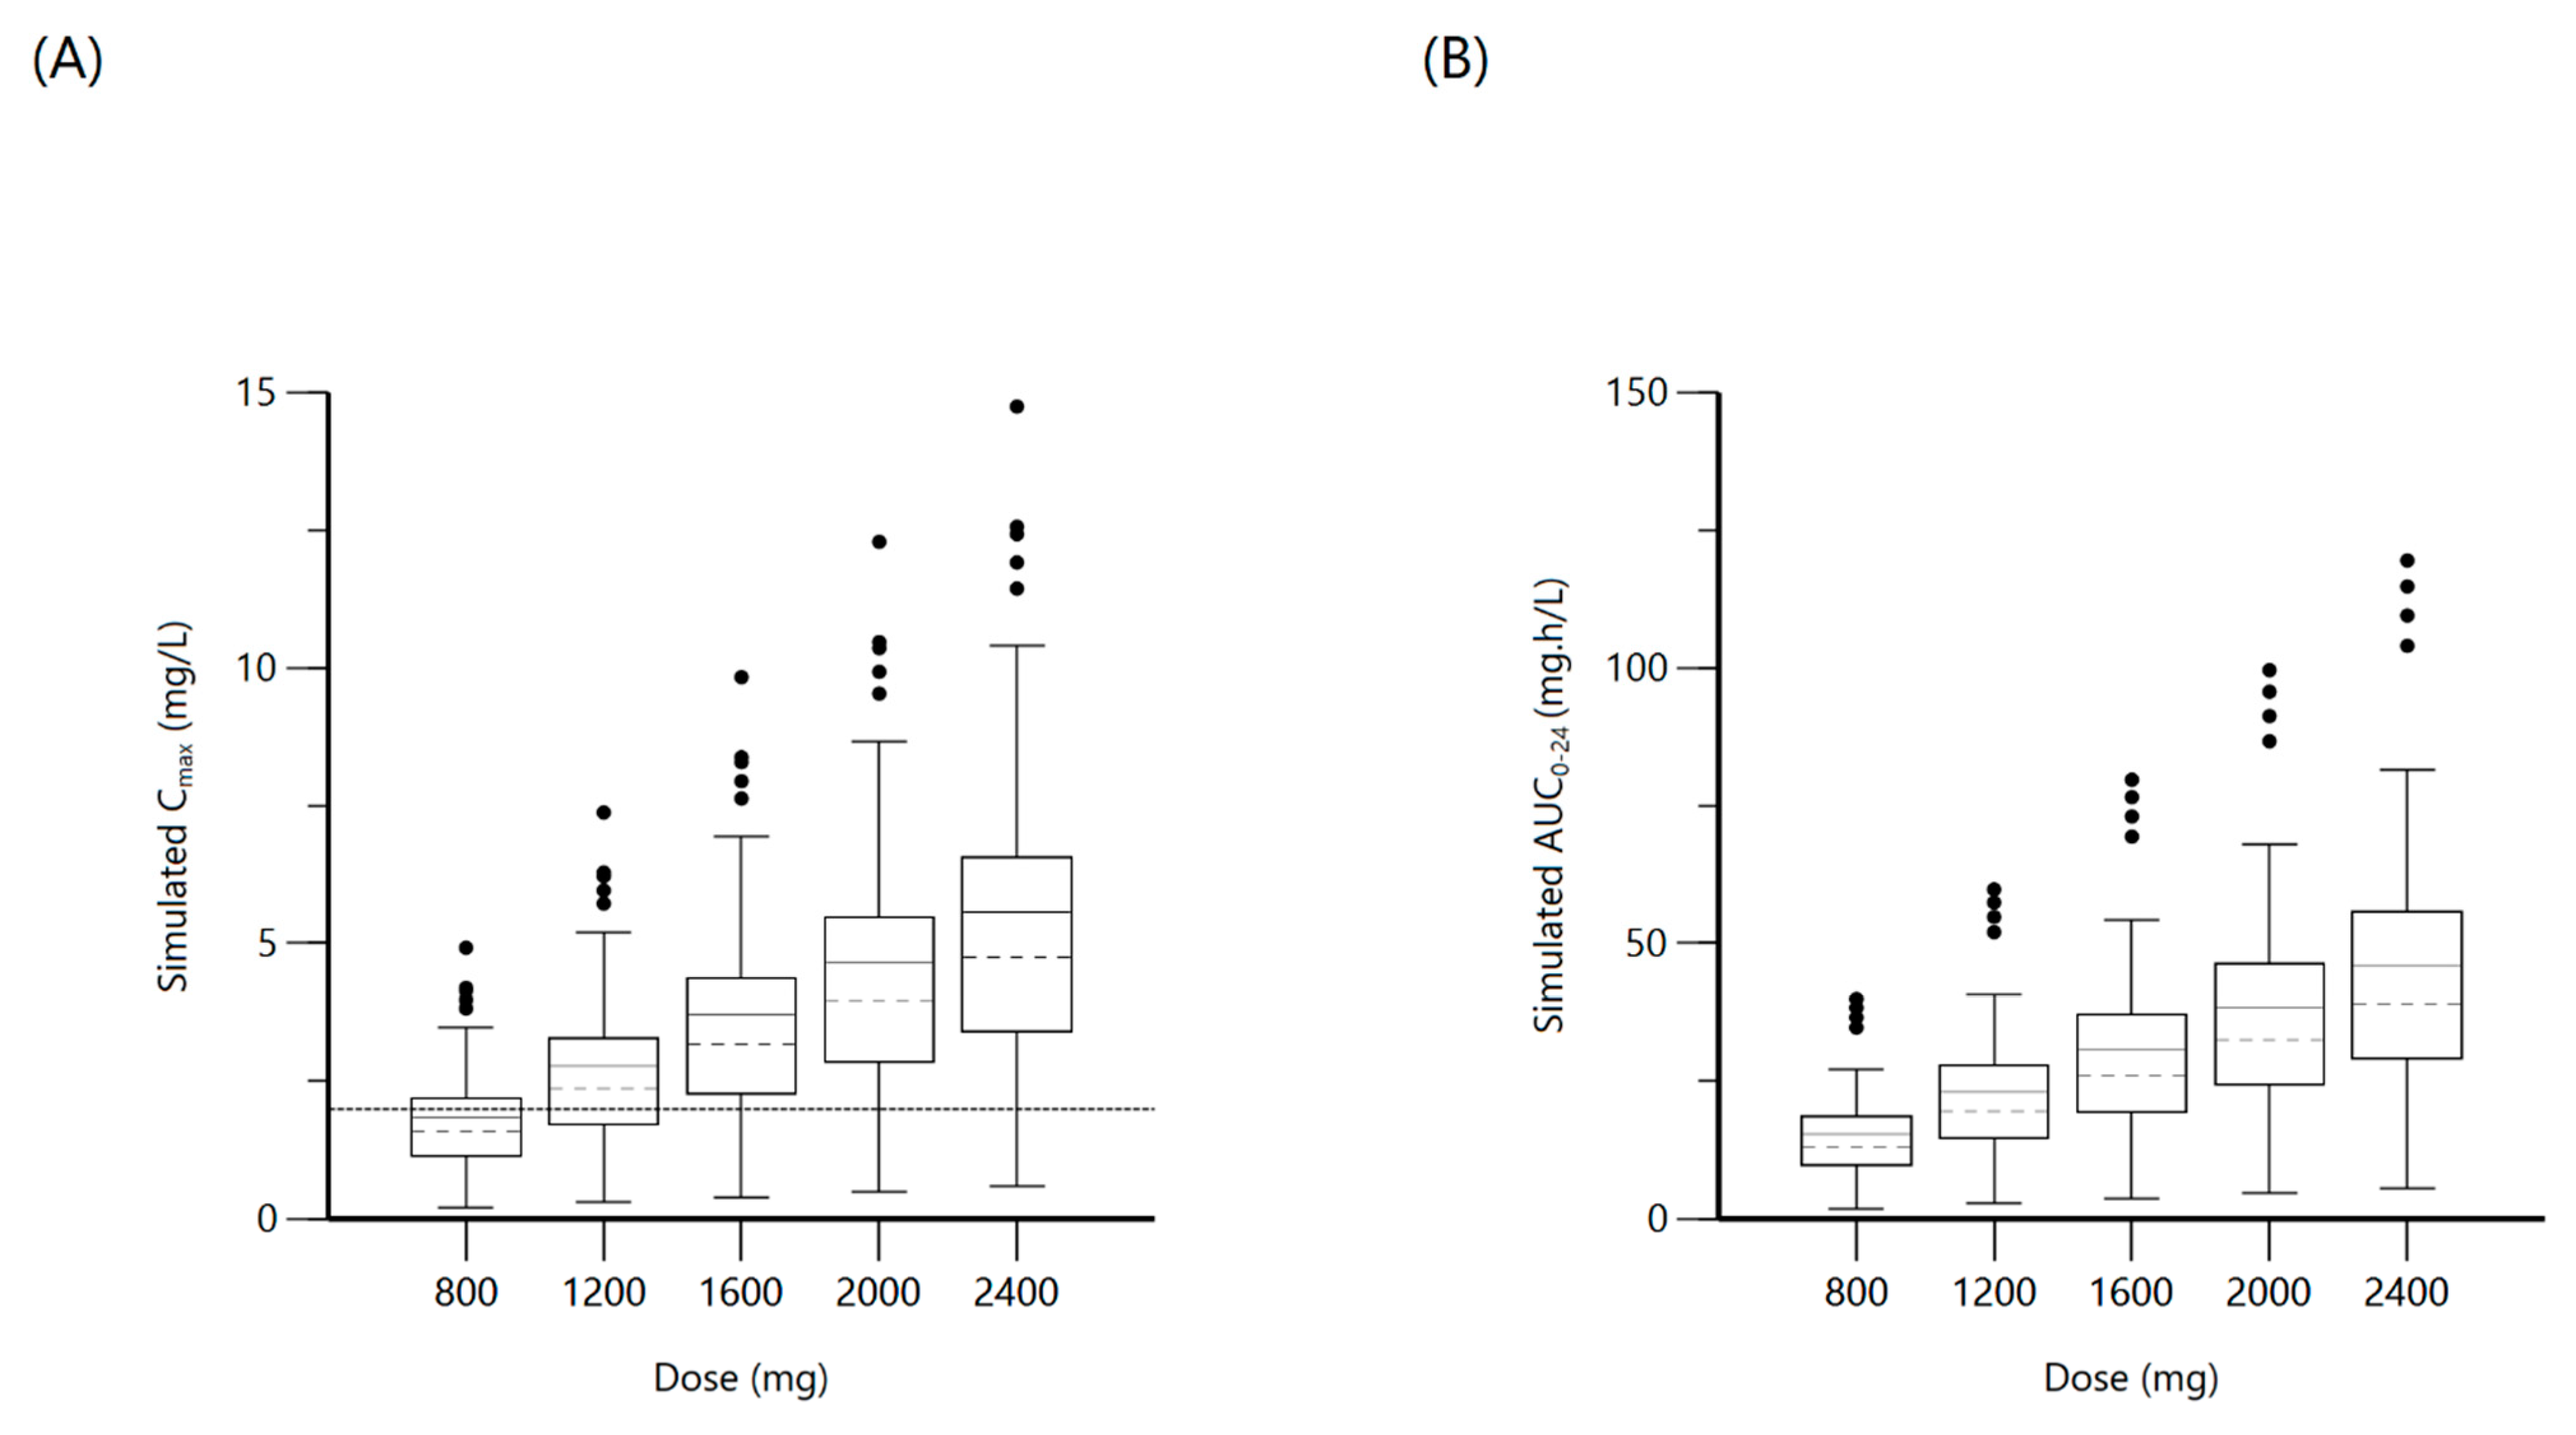
2.4. Ethambutol
3. Discussion
4. Materials and Methods
4.1. Patient Population
4.2. NAT2 Testing
4.3. Anti-TB Therapy and PK Study Methods
4.4. Population Pharmacokinetics, Model Development, and Simulation
Author Contributions
Funding
Institutional Review Board Statement
Informed Consent Statement
Data Availability Statement
Conflicts of Interest
Abbreviations
| ART | Anti-Retroviral Therapy |
| AUC | Area Under Curve |
| CD4 | Cluster of Differentiation 4 |
| CI | Confidence Interval |
| Cl | Systemic clearance |
| Cl2 | Intercompartmental clearance |
| Cmax | Maximum serum Concentration |
| CV | Coefficient of Variation |
| DV | Dependent Variable (observed concentrations) |
| HIV | Human Immunodeficiency Virus |
| IIV | Inter Individual Variability |
| IPRED | Individual Predicted Concentrations |
| IQR | Inter Quartile Range |
| Ka | Absorption rate constant |
| LAM | Lipoarabinomannan |
| LC-MS-MS | Liquid Chromatography-Mass Spectrometry-Mass Spectrometry |
| MUAC | Mid-Upper Arm Circumference |
| NAT2 | N-Acetyl Transferase 2 |
| NLME | Non-Linear Mixed Effects |
| PCR | Polymerase Chain Reaction |
| PD | Pharmacodynamic |
| PK | Pharmacokinetic |
| PLWH | People Living With HIV |
| PRED | Population Predicted Concentrations |
| TAC | Taqman Array Card |
| TB | Tuberculosis |
| V2 | Volume of distribution of the peripheral compartment |
| V | Volume of distribution in the central compartment |
| VPC | Visual Predictive Check |
References
- Adhikari, N.K.; Fowler, R.A.; Bhagwanjee, S.; Rubenfeld, G.D. Critical care and the global burden of critical illness in adults. Lancet 2010, 376, 1339–1346. [Google Scholar] [CrossRef]
- Rudd, K.E.; Johnson, S.C.; Agesa, K.M.; Shackelford, K.A.; Tsoi, D.; Kievlan, D.R.; Colombara, D.V.; Ikuta, K.S.; Kissoon, N.; Finfer, S.; et al. Global, regional, and national sepsis incidence and mortality, 1990–2017: Analysis for the Global Burden of Disease Study. Lancet 2020, 395, 200–211. [Google Scholar] [CrossRef] [Green Version]
- Barr, D.A.; Lewis, J.M.; Feasey, N.; Schutz, C.; Kerkhoff, A.D.; Jacob, S.T.; Andrews, B.; Kelly, P.; Lakhi, S.; Muchemwa, L.; et al. Mycobacterium tuberculosis bloodstream infection prevalence, diagnosis, and mortality risk in seriously ill adults with HIV: A systematic review and meta-analysis of individual patient data. Lancet Infect. Dis. 2020, 742–752. [Google Scholar] [CrossRef] [Green Version]
- Cummings, M.J.; O’Donnell, M.R. Inverting the pyramid: Increasing awareness of mycobacterial sepsis in sub-Saharan Af-rica. Int. J. Tuberc. Lung Dis. 2015, 1128–1134. [Google Scholar] [CrossRef] [PubMed] [Green Version]
- Moore, C.C.; Jacob, S.T.; Banura, P.; Zhang, J.; Stroup, S.; Boulware, D.R.; Scheld, W.M.; Houpt, E.R.; Liu, J. Etiology of Sepsis in Uganda using a Quantitative PCR-based TaqMan Array Card. Clin. Infect. Dis. 2019, 68, 266–272. [Google Scholar] [CrossRef] [PubMed]
- Lewis, J.M.; Feasey, N.A.; Rylance, J. Aetiology and outcomes of sepsis in adults in sub-Saharan Africa: A systematic review and meta-analysis. Crit. Care 2019, 23, 212. [Google Scholar] [CrossRef] [Green Version]
- Van den Broek, J.; Mfinanga, S.; Moshiro, C.; O’Brien, R.; Mugomela, A.; Lefi, M. Impact of human immunodeficiency virus infection on the outcome of treatment and survival of tuberculosis patients in Mwanza, Tanzania. Int. J. Tuberc. Lung Dis. 1998, 2, 547–552. [Google Scholar] [PubMed]
- Weiner, M.; Burman, W.; Vernon, A.; Benator, D.; Peloquin, C.A.; Khan, A.; Weis, S.; King, B.; Shah, N.; Hodge, T.; et al. Low isoniazid concentrations and outcome of tuberculosis treatment with once-weekly isoniazid and rifapentine. Am. J. Respir. Crit Care Med. 2003, 167, 1341–1347. [Google Scholar] [CrossRef] [Green Version]
- Weiner, M.; Benator, D.; Burman, W.; Peloquin, C.A.; Khan, A.; Vernon, A.; Jones, B.; Silva-Trigo, C.; Zhao, Z.; Hodge, T.; et al. Association between acquired rifamycin resistance and the pharmacokinetics of rifabutin and isoniazid among patients with HIV and tuberculosis. Clin. Infect. Dis. 2005, 40, 1481–1491. [Google Scholar] [CrossRef] [PubMed] [Green Version]
- Tappero, J.W.; Bradford, W.Z.; Agerton, T.B.; Hopewell, P.; Reingold, A.L.; Lockman, S.; Oyewo, A.; Talbot, E.A.; Kenyon, T.A.; Moeti, T.L.; et al. Serum concentrations of antimycobacterial drugs in patients with pulmonary tuberculosis in Bot-swana. Clin Infect. Dis. 2005, 41, 461–469. [Google Scholar] [CrossRef] [Green Version]
- Chideya, S.; Winston, C.A.; Peloquin, C.A.; Bradford, W.Z.; Hopewell, P.C.; Wells, C.D.; Reingold, A.L.; Kenyon, T.A.; Moeti, T.L.; Tappero, J.W. Isoniazid, rifampin, ethambutol, and pyrazinamide pharmacokinetics and treatment outcomes among a predominantly HIV-infected cohort of adults with tuberculosis from Botswana. Clin. Infect. Dis. 2009, 48, 1685–1694. [Google Scholar] [CrossRef]
- Pasipanodya, J.G.; McIlleron, H.; Burger, A.; Wash, P.A.; Smith, P.; Gumbo, T. Serum drug concentrations predictive of pul-monary tuberculosis outcomes. J. Infect. Dis. 2013, 208, 1464–1473. [Google Scholar] [CrossRef] [Green Version]
- Sekaggya-Wiltshire, C.; von Braun, A.; Lamorde, M.; Ledergerber, B.; Buzibye, A.; Henning, L.; Musaazi, J.; Gutteck, U.; Denti, P.; de Kock, M.; et al. Delayed Sputum Culture Conversion in Tuberculosis-Human Immunodeficiency Vi-rus-Coinfected Patients with Low Isoniazid and Rifampicin Concentrations. Clin. Infect. Dis. 2018, 67, 708–716. [Google Scholar] [CrossRef]
- Heysell, S.K.; Mtabho, C.; Mpagama, S.; Mwaigwisya, S.; Pholwat, S.; Ndusilo, N.; Gratz, J.; Aarnoutse, R.E.; Kibiki, G.S.; Houpt, E.R. Plasma drug activity assay for treatment optimization in tuberculosis patients. Antimicrob. Agents Chemother. 2011, 5819–5825. [Google Scholar] [CrossRef] [Green Version]
- Alffenaar, J.C.; Gumbo, T.; Dooley, K.E.; Peloquin, C.A.; Mcilleron, H.; Zagorski, A.; Cirillo, D.M.; Heysell, S.K.; Silva, D.R.; Migliori, G.B. Integrating Pharmacokinetics and Pharmacodynamics in Operational Research to End Tuberculosis. Clin. Infect. Dis. 2020, 70, 1774–1780. [Google Scholar] [CrossRef] [Green Version]
- Boeree, M.J.; Heinrich, N.; Aarnoutse, R.; Diacon, A.H.; Dawson, R.; Rehal, S.; Kibiki, G.S.; Churchyard, G.; Sanne, I.; Ntinginya, N.E.; et al. High-dose rifampicin, moxifloxacin, and SQ109 for treating tuberculosis: A multi-arm, multi-stage randomised controlled trial. Lancet Infect. Dis. 2017, 39–49. [Google Scholar] [CrossRef] [Green Version]
- Zuur, M.A.; Pasipanodya, J.G.; van, S.D.; van der Werf, T.S.; Gumbo, T.; Alffenaar, J.C. Intermediate Susceptibility Dose-Dependent Breakpoints for High-Dose Rifampin, Isoniazid, and Pyrazinamide Treatment in Multidrug-Resistant Tu-berculosis Programs. Clin. Infect. Dis. 2018, 67, 1743–1749. [Google Scholar] [CrossRef] [PubMed]
- De, P.P.; Belpaire, F.M.; Buylaert, W.A. Pharmacokinetic and pharmacodynamic considerations when treating patients with sepsis and septic shock. Clin. Pharmacokinet. 2002, 41, 1135–1151. [Google Scholar] [CrossRef]
- Hazard, R.H.; Kagina, P.; Kitayimbwa, R.; Male, K.; McShane, M.; Mubiru, D.; Welikhe, E.; Moore, C.C.; Abdallah, A. Effect of Empiric Anti-Mycobacterium tuberculosis Therapy on Survival Among Human Immunodeficiency Virus-Infected Adults Admitted With Sepsis to a Regional Referral Hospital in Uganda. Open Forum Infect. Dis. 2019, 6, ofz140. [Google Scholar] [CrossRef] [Green Version]
- Horita, Y.; Alsultan, A.; Kwara, A.; Antwi, S.; Enimil, A.; Ortsin, A.; Dompreh, A.; Yang, H.; Wiesner, L.; Peloquin, C.A. Evaluation of the Adequacy of WHO Revised Dosages of the First-Line Antituberculosis Drugs in Children with Tuberculo-sis Using Population Pharmacokinetic Modeling and Simulations. Antimicrob. Agents Chemother. 2018, 62, e00008-18. [Google Scholar] [CrossRef] [PubMed] [Green Version]
- Alsultan, A.; Peloquin, C.A. Therapeutic drug monitoring in the treatment of tuberculosis: An update. Drugs 2014, 839–854. [Google Scholar] [CrossRef]
- Patel, K.B.; Belmonte, R.; Crowe, H.M. Drug malabsorption and resistant tuberculosis in HIV-infected patients. N. Eng. J. Med. 1995, 332, 336–337. [Google Scholar] [CrossRef]
- Hemanth Kumar, A.K.; Kannan, T.; Chandrasekaran, V.; Sudha, V.; Vijayakumar, A.; Ramesh, K.; Lavanya, J.; Swaminathan, S.; Ramachandran, G. Pharmacokinetics of thrice-weekly rifampicin, isoniazid and pyrazinamide in adult tuberculosis pa-tients in India. Int. J. Tuberc. Lung Dis. 2016, 1236–1241. [Google Scholar] [CrossRef] [PubMed]
- McIlleron, H.; Rustomjee, R.; Vahedi, M.; Mthiyane, T.; Denti, P.; Connolly, C.; Rida, W.; Pym, A.; Smith, P.J.; Onyebujoh, P.C. Reduced antituberculosis drug concentrations in HIV-infected patients who are men or have low weight: Implications for international dosing guidelines. Antimicrob. Agents Chemother. 2012, 3232–3238. [Google Scholar] [CrossRef] [PubMed] [Green Version]
- Hong, B.L.; D’Cunha, R.; Li, P.; Al-Shaer, M.H.; Alghamdi, W.A.; An, G.; Peloquin, C. A Systematic Review and Me-ta-analysis of Isoniazid Pharmacokinetics in Healthy Volunteers and Patients with Tuberculosis. Clin. Ther. 2020, e220–e241. [Google Scholar] [CrossRef]
- Subbarao, S.; Wilkinson, K.A.; van Halsema, C.L.; Rao, S.S.; Boyles, T.; Utay, N.S.; Wilkinson, R.J.; Meintjes, G. Raised Ve-nous Lactate and Markers of Intestinal Translocation Are Associated With Mortality Among In-Patients With HIV-Associated TB in Rural South Africa. J. Acquir. Immune Defic. Syndr. 2015, 70, 406–413. [Google Scholar] [CrossRef] [PubMed] [Green Version]
- Schutz, C.; Barr, D.; Andrade, B.B.; Shey, M.; Ward, A.; Janssen, S.; Burton, R.; Wilkinson, K.A.; Sossen, B.; Fukutani, K.F.; et al. Clinical, microbiologic, and immunologic determinants of mortality in hospitalized patients with HIV-associated tu-berculosis: A prospective cohort study. PLoS Med. 2019, 16, e1002840. [Google Scholar] [CrossRef] [Green Version]
- Te Brake, L.H.M.; de Jager, V.; Narunsky, K.; Vanker, N.; Svensson, E.M.; Phillips, P.P.J.; Gillespie, S.H.; Heinrich, N.; Hoelscher, M.; Dawson, R.; et al. Increased bactericidal activity but dose-limiting intolerability at 50 mg·kg-1 rifampicin. Eur. Respir. J. 2021, 2000955. [Google Scholar] [CrossRef]
- Dooley, K.E. High-Dose Rifampin: Shall We Be Bolder? Am. J. Respir. Crit. Care Med. 2018, 198, 558–560. [Google Scholar] [CrossRef]
- Aarnoutse, R.E.; Kibiki, G.S.; Reither, K.; Semvua, H.H.; Haraka, F.; Mtabho, C.M.; Mpagama, S.G.; van den Boogaard, J.; Sumari-de Boer, I.M.; Magis-Escurra, C.; et al. Pharmacokinetics, Tolerability, and Bacteriological Response of Rifampin Administered at 600, 900, and 1200 Milligrams Daily in Patients with Pulmonary Tuberculosis. Antimicrob. Agents Chemother. 2017, 61, e01054-17. [Google Scholar] [CrossRef] [Green Version]
- Walsh, K.F.; Vilbrun, S.C.; Souroutzidis, A.; Delva, S.; Joissaint, G.; Mathurin, L.; Ocheretina, O.; Cremieux, P.; Pape, J.W.; Koenig, S.P. Improved Outcomes With High-dose Isoniazid in Multidrug-resistant Tuberculosis Treatment in Haiti. Clin. Infect. Dis. 2019, 69, 717–719. [Google Scholar] [CrossRef]
- Diacon, A.; Miyahara, S.; Dawson, R.; Sun, X.; Hogg, E.; Donahue, K.; Urbanowski, M.; De Jager, V.; Fletcher, C.V.; Hafner, R.; et al. Assessing whether isoniazid is essential during the first 14 days of tuberculosis therapy: A phase 2a, open-label, randomised controlled trial. Lancet Microbe 2020, e84–e92. [Google Scholar] [CrossRef]
- Pasipanodya, J.G.; Gumbo, T. Clinical and toxicodynamic evidence that high-dose pyrazinamide is not more hepatotoxic than the low doses currently used. Antimicrob. Agents Chemother. 2010, 2847–2854. [Google Scholar] [CrossRef] [Green Version]
- Levy, M.M.; Fink, M.P.; Marshall, J.C.; Abraham, E.; Angus, D.; Cook, D.; Cohen, J.; Opal, S.M.; Vincent, J.L.; Ramsay, G. SCCM/ESICM/ACCP/ATS/SIS. 2001 SCCM/ESICM/ACCP/ATS/SIS International Sepsis Definitions Conference. Crit. Care Med. 2003, 1250–1256. [Google Scholar] [CrossRef] [PubMed]
- Liu, J.; Ochieng, C.; Wiersma, S.; Ströher, U.; Towner, J.S.; Whitmer, S.; Nichol, S.T.; Moore, C.C.; Kersh, G.J.; Kato, C.; et al. Development of a TaqMan Array Card for Acute-Febrile-Illness Outbreak Investigation and Surveillance of Emerging Pathogens, Including Ebola Virus. J. Clin. Microbiol. 2016, 49–58. [Google Scholar] [CrossRef] [Green Version]
- Justine, M.; Yeconia, A.; Nicodemu, I.; Augustino, D.; Gratz, J.; Mduma, E.; Heysell, S.K.; Kivuyo, S.; Mfinanga, S.; Peloquin, C.A.; et al. Pharmacokinetics of First-Line Drugs Among Children With Tuberculosis in Rural Tanzania. J. Pediatric. Infect. Dis. Soc. 2020, 9, 14–20. [Google Scholar] [CrossRef] [PubMed]
- Heysell, S.K.; Moore, J.L.; Keller, S.J.; Houpt, E.R. Therapeutic drug monitoring for slow response to tuberculosis treatment in a state control program, Virginia, USA. Emerg. Infect. Dis. 2010, 16, 1546–1553. [Google Scholar] [CrossRef] [PubMed]


| Characteristic | N (%) or Median (IQR) N = 81 |
|---|---|
| Age (years) | 36 (30–43.5) |
| Female | 29 (36.3%) |
| Weight (kg) | 52.5 (45.3–58) |
| MUAC (cm) | 22 (20.4–24) |
| CD4 count (cells/mL3) | 169 |
| Prior TB | 7 (9%) |
| Concurrent meningitis | 27 (33%) |
| Duration of Illness (days) | 30 (14–90) |
| Cough >2 weeks | 63 (79%) |
| Fever >2 weeks | 75 (94%) |
| Night sweats >2 weeks | 67 (86%) |
| Loss of appetite >2 weeks | 78 (96.3%) |
| Loss of wt >2 weeks | 48 (58.3%) |
| Vital Status at Week 2 PK Testing | All N = 81 | Confirmed TB N = 36 | Clinical TB N = 45 |
|---|---|---|---|
| Survived (%N) | 49 (60%) | 26 (72%) | 23 (51%) |
| Sepsis | 32 | 21 | 11 |
| Meningitis | 17 | 5 | 12 |
| Died (%N) | 18 (23%) | 5 (14%) | 13 (29%) |
| Sepsis | 13 | 4 | 9 |
| Meningitis | 5 | 1 | 4 |
| Lost to follow-up, withdrew or incomplete PK testing (%N) | 14 (17%) | 5 (17%) | 9 (20%) |
| Sepsis | 9 | 5 | 4 |
| Meningitis | 5 | 0 | 5 |
| Drug | Parameter | Final Model | |
|---|---|---|---|
| Estimate (%CV) | IIV (Shrinkage) | ||
| Rifampin | Ka (1/h) | 0.3 (13.5) | 0.01 (0.9) |
| V (L) | 25.3 (33.3) | 3.2 (0.2) | |
| Cl (L/h) | 0.1 (49.6) | 0.2 (0.3) | |
| Tlag (h) | 0.9 (9.1) | 0.003 (0.8) | |
| Isoniazid | Ka (1/h) | 0.9 (0.9) | 0.9 (0.3) |
| V (L) | 2.9 (3) | 0.07 (0.6) | |
| V2 (L) | 32.5 (5.7) | 0.5 (0.7) | |
| Cl (L/h) | 9.2 (8.7) | 0.8 (0.1) | |
| Cl2 (L/h) | 9.6 (3) | 0.0001 (0.9) | |
| Tlag (h) | 0.4 (8.6) | 0.5 (0.5) | |
| Pyrazinamide | Ka (1/h) | 0.08 (13) | 0.1-0.11 |
| V (L) | 1.5 (16.3) | 0.9 (0.4) | |
| Cl (L/h) | 2.6 (14.5) | 0.4 (0.05) | |
| Tlag (h) | 0.2 (7.1) | 1.3 (0.4) | |
| Ethambutol | Ka (1/h) | 0.15 (21.8) | 0.6 (0.4) |
| V (L) | 75.17 (23.7) | 0.4 (0.1) | |
| Cl (L/h) | 51.6 (12.2) | 0.3 (0.3) | |
| Tlag (h) | 0.4 (12.3) | 0.6 (0.4) | |
| Drug | Simulated Dose (mg) | Target | Cmax (mg/L) | AUC0–24 (mg·h/L) | ||
|---|---|---|---|---|---|---|
| Median (IQR) | Attaining Target (%) | Median (IQR) | Attaining Target (%) | |||
| Rifampin | 600 | Cmax: 8 mg/L | 4.6 (3.4–6.4) | 16.30 | 34.5 (26.3–42.2) | 43.6 |
| 900 | 6.8 (4.8–9.6) | 34.7 | 52.3 (36.6–63.5) | 78 | ||
| 1200 | 9 (6.3–12.7) | 57.1 | 71.2 (48.1–84) | 92.7 | ||
| 1500 | AUC0–24: 35.4 mg·h/L | 11.2 (7.9–16) | 73.5 | 90.6 (66.7–105.6) | 97.7 | |
| 1800 | 13.3 (9.5–19.2) | 81.6 | 108.8 (79–123.9) | 100 | ||
| Isoniazid | 300 | Cmax: 3 mg/L | 0.9 (0.7–1) | 0 | 10.2 (8.7–11.8) | 0 |
| 450 | 1.3 (1.1–1.5) | 0 | 15.3 (13.1–17.7) | 0 | ||
| 600 | 1.7 (1.5–2) | 4.1 | 20.5 (17.4–23.6) | 2.3 | ||
| 750 | AUC0–24: 52 mg·h/L | 2.2 (1.8–2.5) | 8.2 | 25.6 (21.7–29-6) | 2.3 | |
| 900 | 2.6 (2.2–3.1) | 28.6 | 30.7 (26.1–35.5) | 4.5 | ||
| Pyrazinamide | 1000 | Cmax: 20 mg/L | 25.7 (19.1–36) | 69.4 | 303.8 (231.6–466.1) | 42.9 |
| 1500 | 38 (28.7–54.3) | 89.8 | 466 (351.1–702.1) | 71.4 | ||
| 2000 | 50.4 (38.1–72.6) | 91.8 | 624.7 (469.5–934.8) | 85.1 | ||
| 2500 | AUC0–24: 363 mg·h/L | 63.1 (47.4–90.8) | 96 | 778.5 (588–1167.8) | 89.6 | |
| 3000 | 75.8 (56.7–109.2) | 98 | 933 (706.6–1403.9) | 91.7 | ||
| Ethambutol | 800 | Cmax: 2 mg/L | 1.6 (1.2–2.2) | 32.6 | 13 (10–18.6) | |
| 1200 | 2.4 (1.7–3.3) | 63.2 | 19.5 (15–28) | |||
| 1600 | 3.2 (2.3–4.4) | 89.8 | 26 (20–37.1) | |||
| 2000 | 3.9 (2.9–5.5) | 93.8 | 32.5 (25–46.4) | |||
| 2400 | 4.7 (3.5–6.5) | 93.8 | 39 (30–55.7) | |||
Publisher’s Note: MDPI stays neutral with regard to jurisdictional claims in published maps and institutional affiliations. |
© 2021 by the authors. Licensee MDPI, Basel, Switzerland. This article is an open access article distributed under the terms and conditions of the Creative Commons Attribution (CC BY) license (https://creativecommons.org/licenses/by/4.0/).
Share and Cite
Rao, P.S.; Moore, C.C.; Mbonde, A.A.; Nuwagira, E.; Orikiriza, P.; Nyehangane, D.; Al-Shaer, M.H.; Peloquin, C.A.; Gratz, J.; Pholwat, S.; et al. Population Pharmacokinetics and Significant Under-Dosing of Anti-Tuberculosis Medications in People with HIV and Critical Illness. Antibiotics 2021, 10, 739. https://0-doi-org.brum.beds.ac.uk/10.3390/antibiotics10060739
Rao PS, Moore CC, Mbonde AA, Nuwagira E, Orikiriza P, Nyehangane D, Al-Shaer MH, Peloquin CA, Gratz J, Pholwat S, et al. Population Pharmacokinetics and Significant Under-Dosing of Anti-Tuberculosis Medications in People with HIV and Critical Illness. Antibiotics. 2021; 10(6):739. https://0-doi-org.brum.beds.ac.uk/10.3390/antibiotics10060739
Chicago/Turabian StyleRao, Prakruti S., Christopher C. Moore, Amir A. Mbonde, Edwin Nuwagira, Patrick Orikiriza, Dan Nyehangane, Mohammad H. Al-Shaer, Charles A. Peloquin, Jean Gratz, Suporn Pholwat, and et al. 2021. "Population Pharmacokinetics and Significant Under-Dosing of Anti-Tuberculosis Medications in People with HIV and Critical Illness" Antibiotics 10, no. 6: 739. https://0-doi-org.brum.beds.ac.uk/10.3390/antibiotics10060739