
Elucidation of Phytochemical Content of Cupressus macrocarpa Leaves: In Vitro and In Vivo Antibacterial Effect against Methicillin-Resistant Staphylococcus aureus Clinical Isolates


 ,
,  , , ,
, , ,
Abstract
:1. Introduction
2. Results
2.1. Results of LC-ESI-MS/MS Analysis of C. Macrocarpa Leaves Methanol Extract
2.1.1. Characterization of Flavonoids Aglycones
2.1.2. Characterization of Flavones Glycosides and a Biflavone
2.1.3. Characterization of Flavonol Glycosides
2.1.4. Characterization of Isoflavone
2.1.5. Characterization of Phenolic Compounds
2.1.6. Characterization of Other Compounds
2.2. Structure Elucidation of Compounds Isolated from C. Macrocarpa Leaves
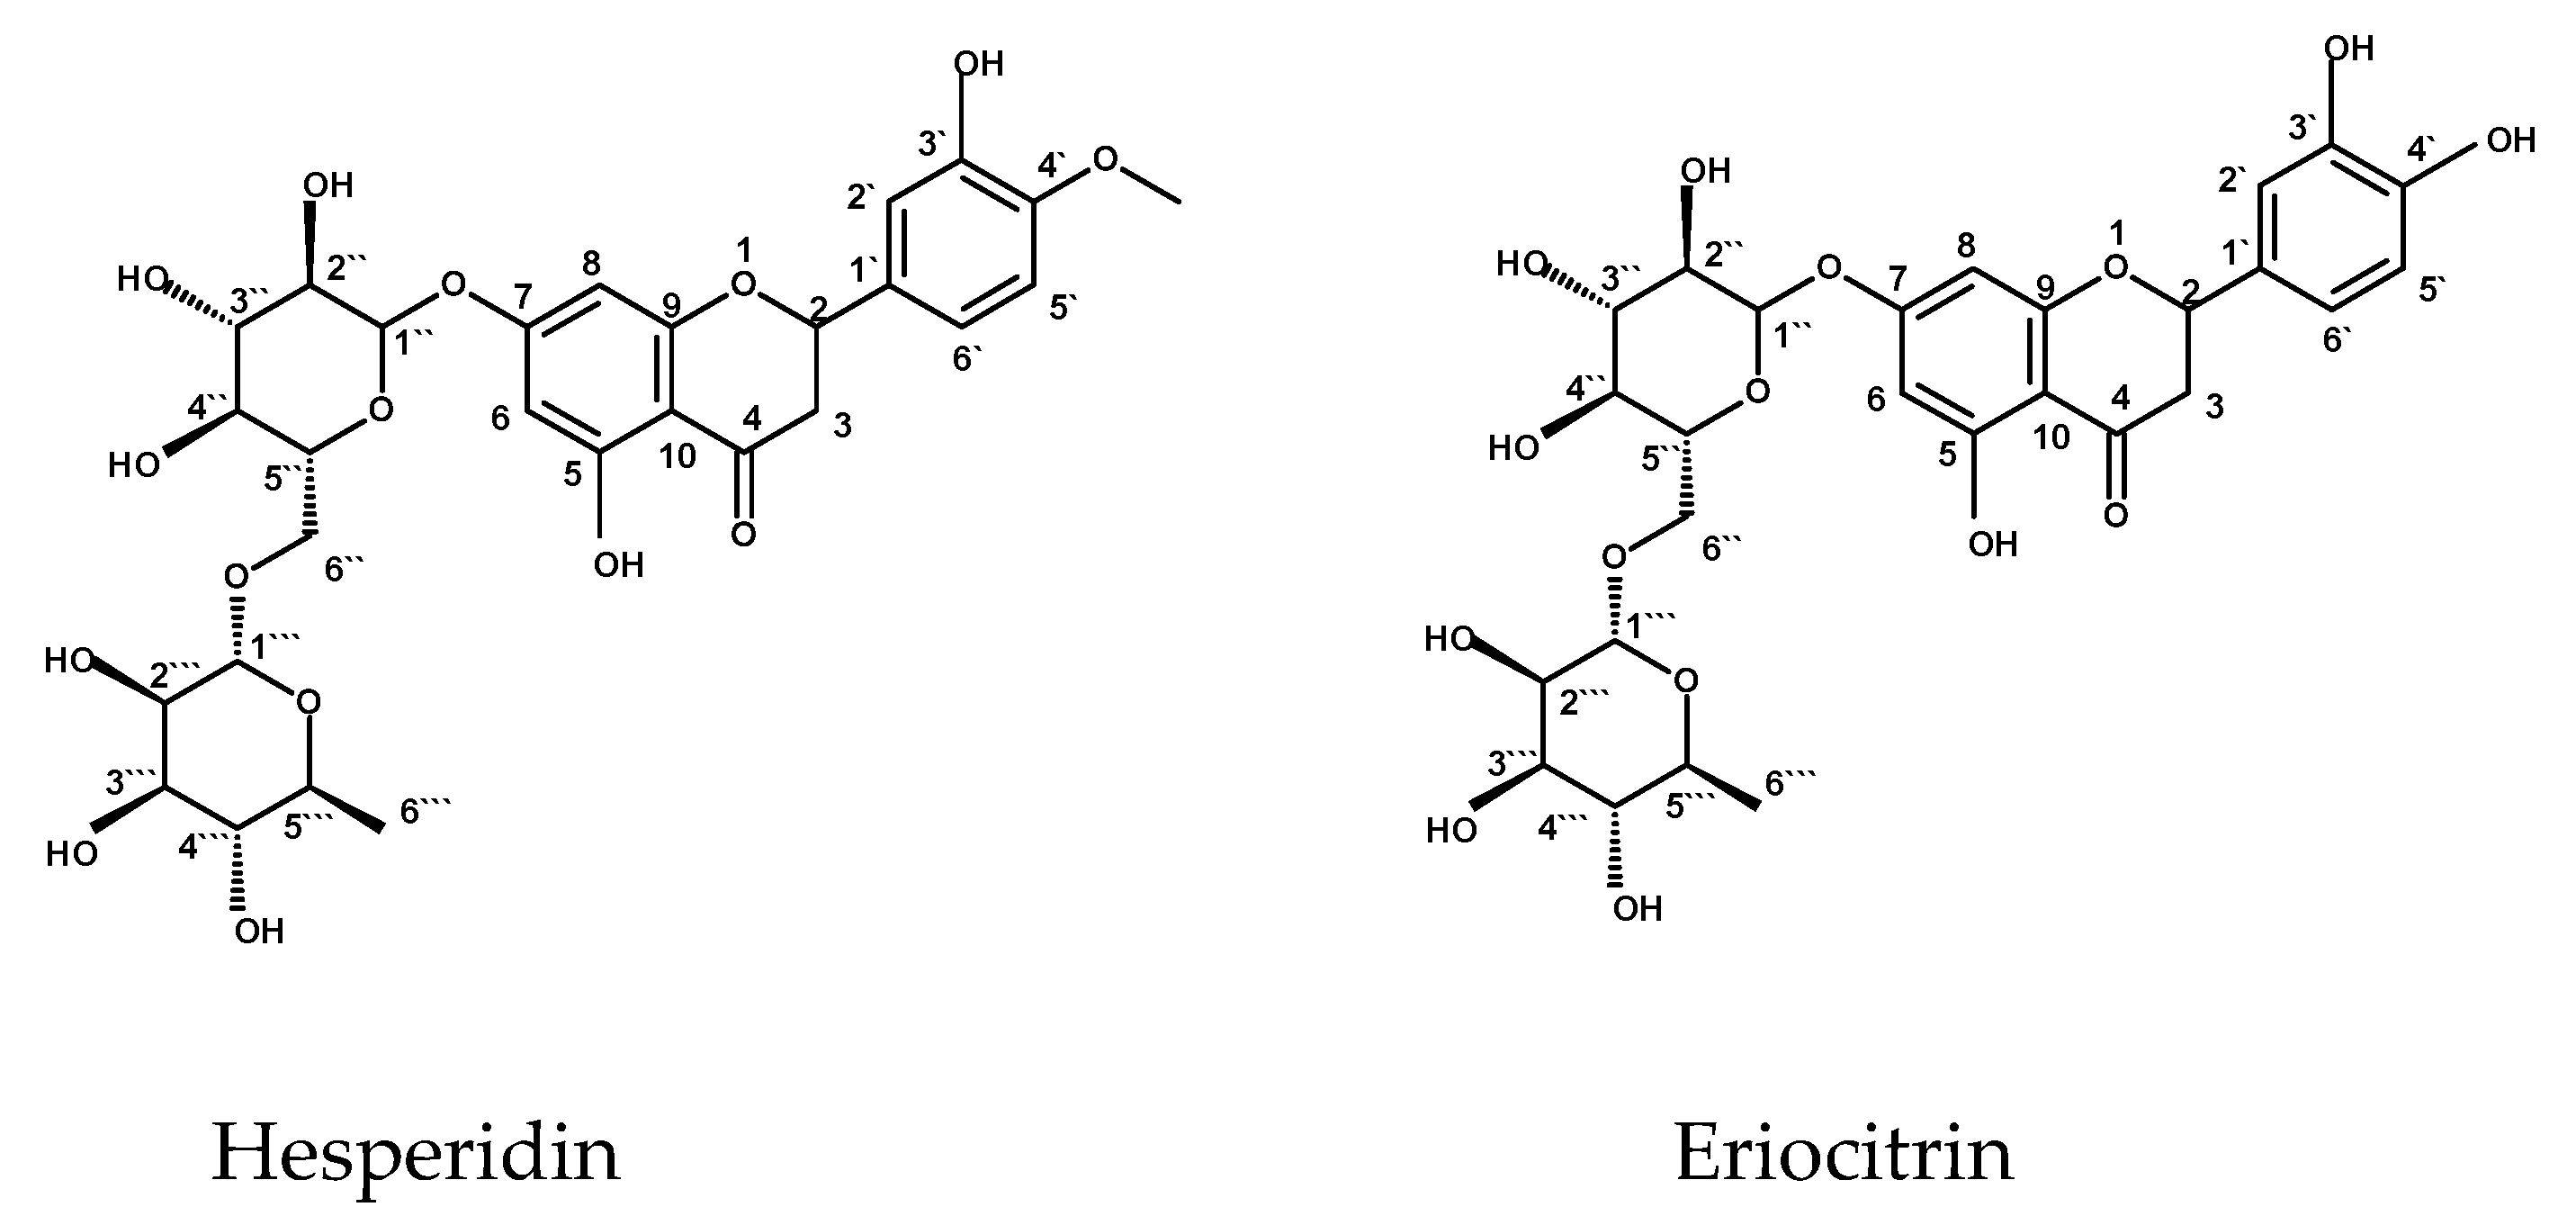
2.2.1. Structure Identification of Hesperidin
2.2.2. Structure Elucidation of Eriocitrin
2.3. Results of In Vitro Antibacterial Activity of C. Macrocarpa Leaves Extracts
2.3.1. Growth Curve Assay
2.3.2. Efflux Assay
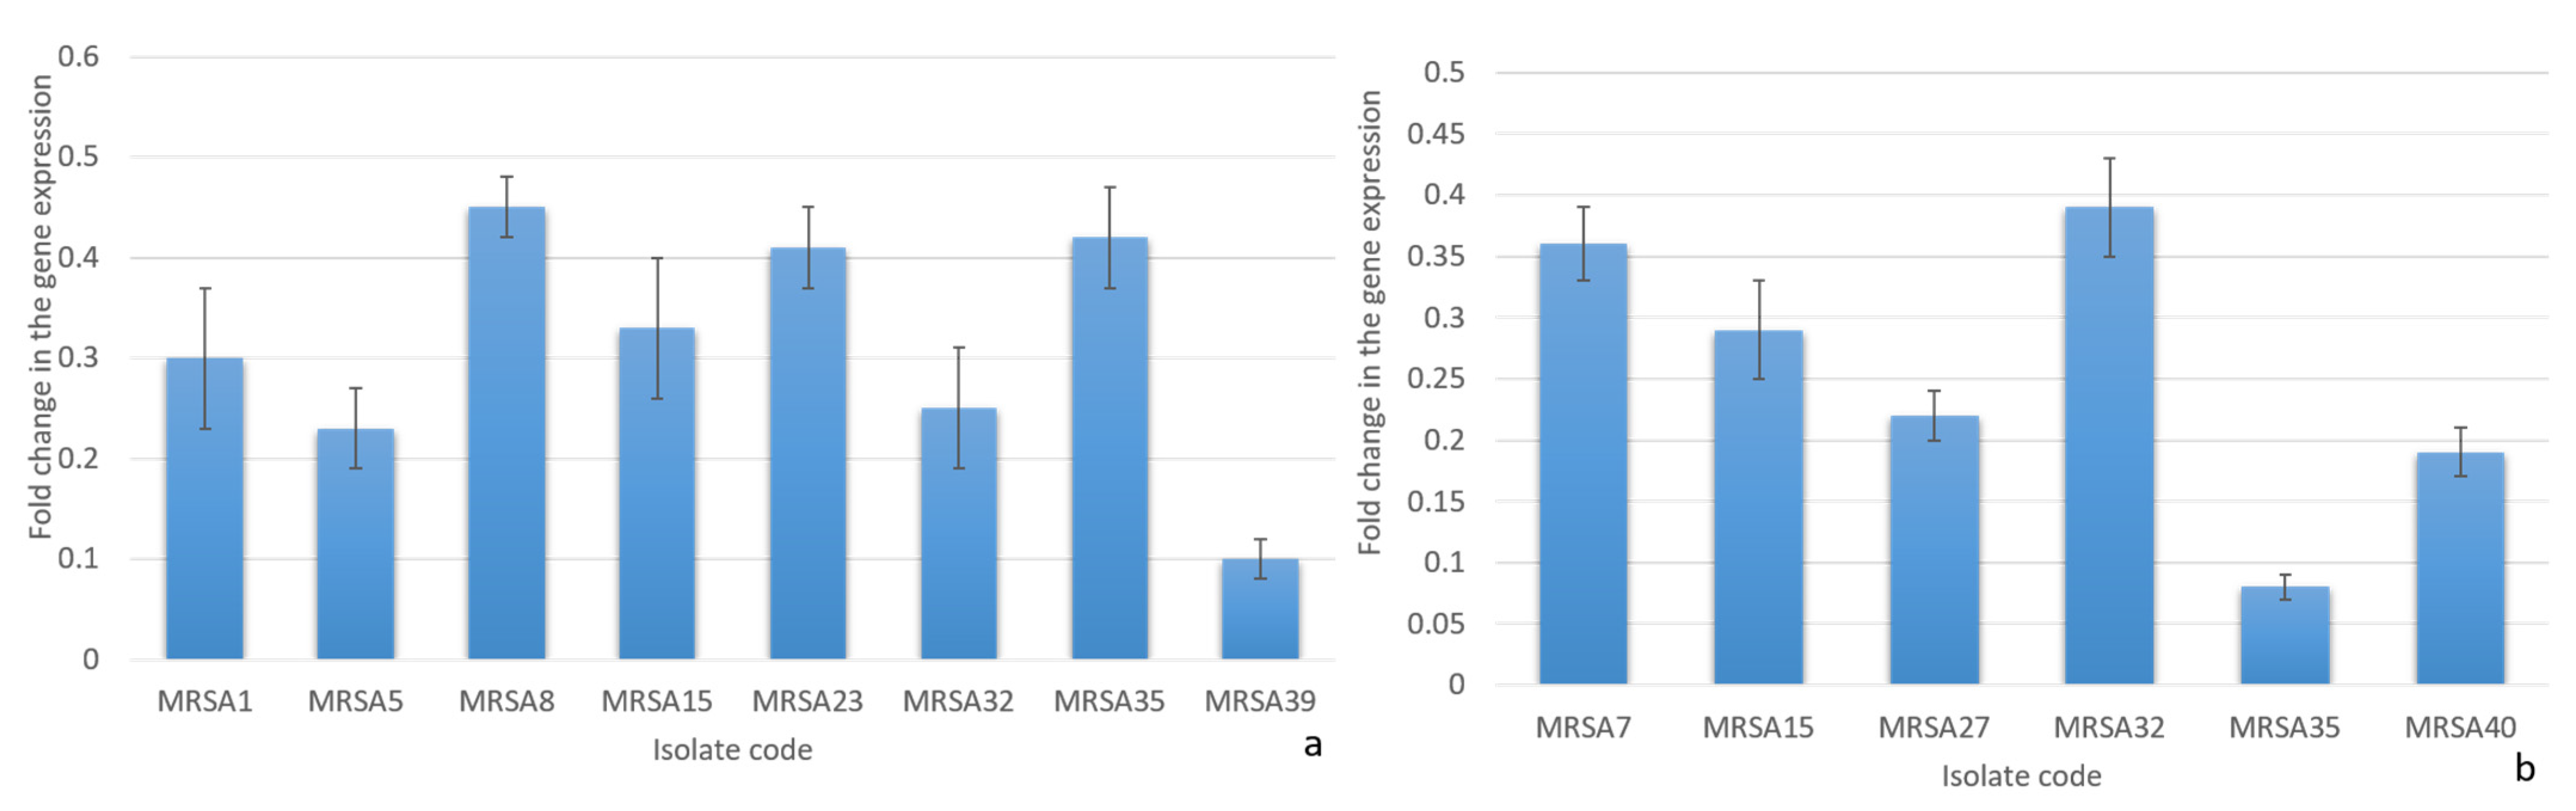
2.3.3. Quantitative RT-PCR
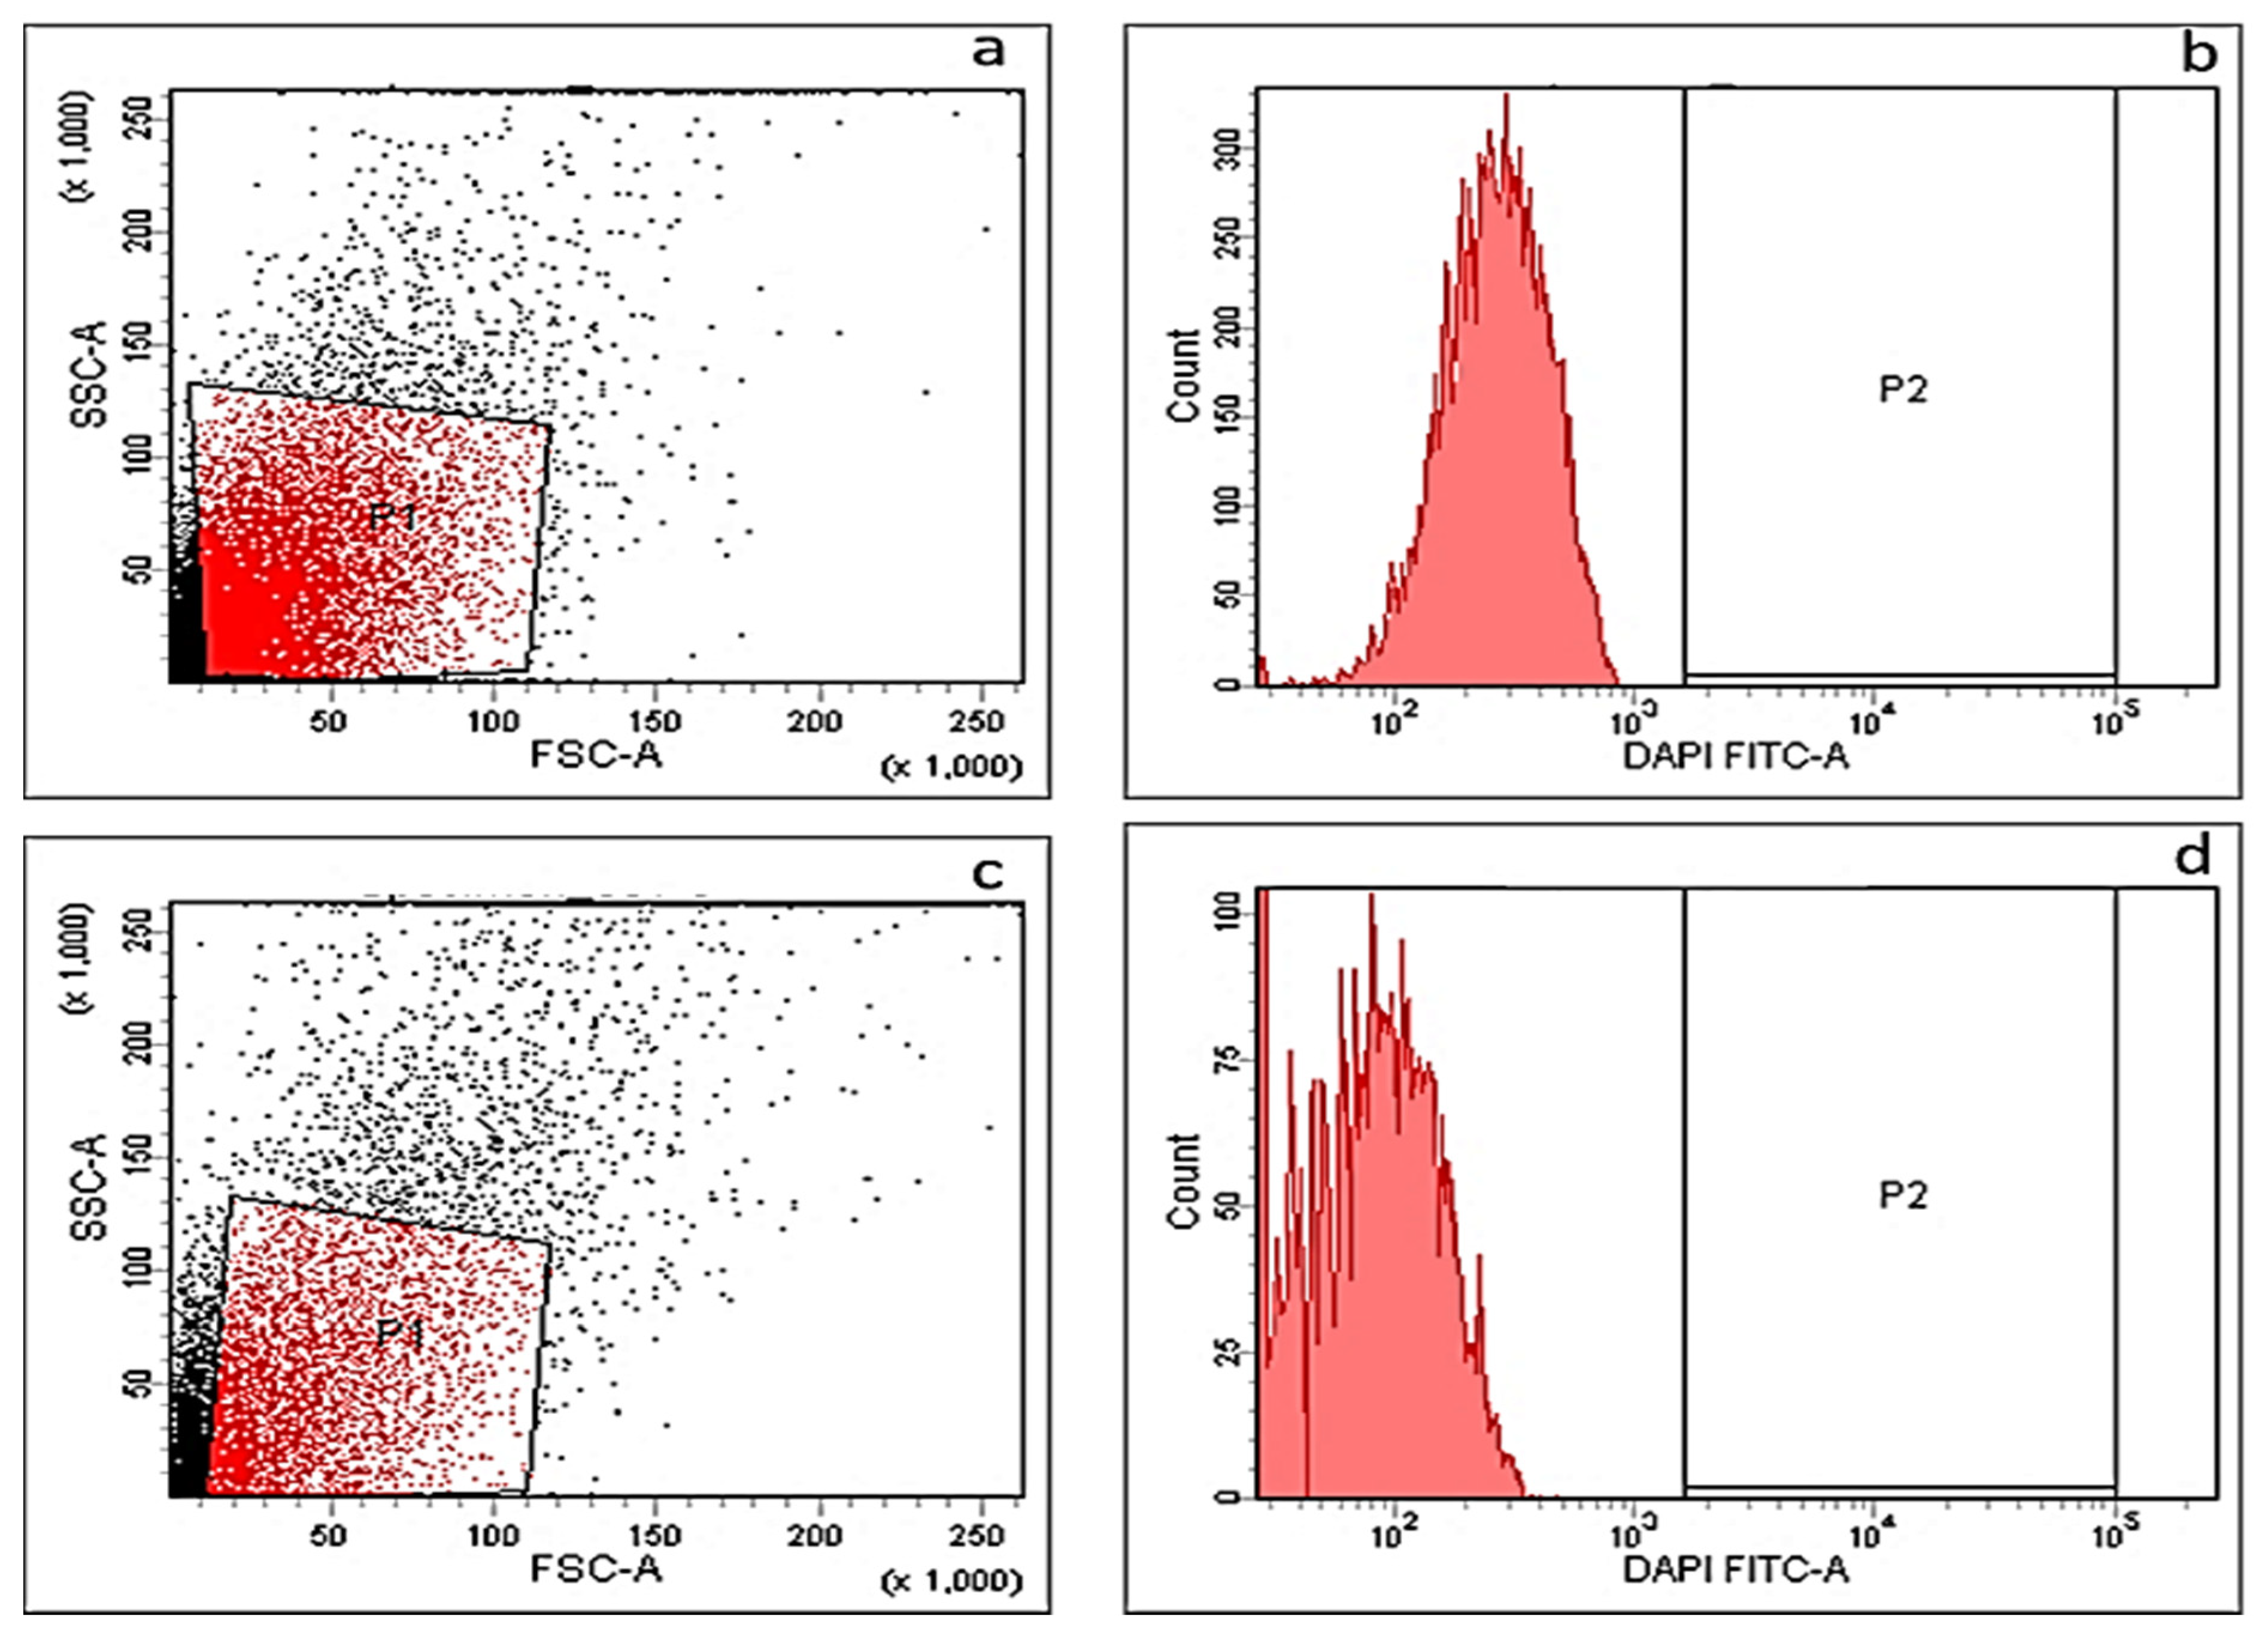
2.3.4. Membrane Depolarization Assay
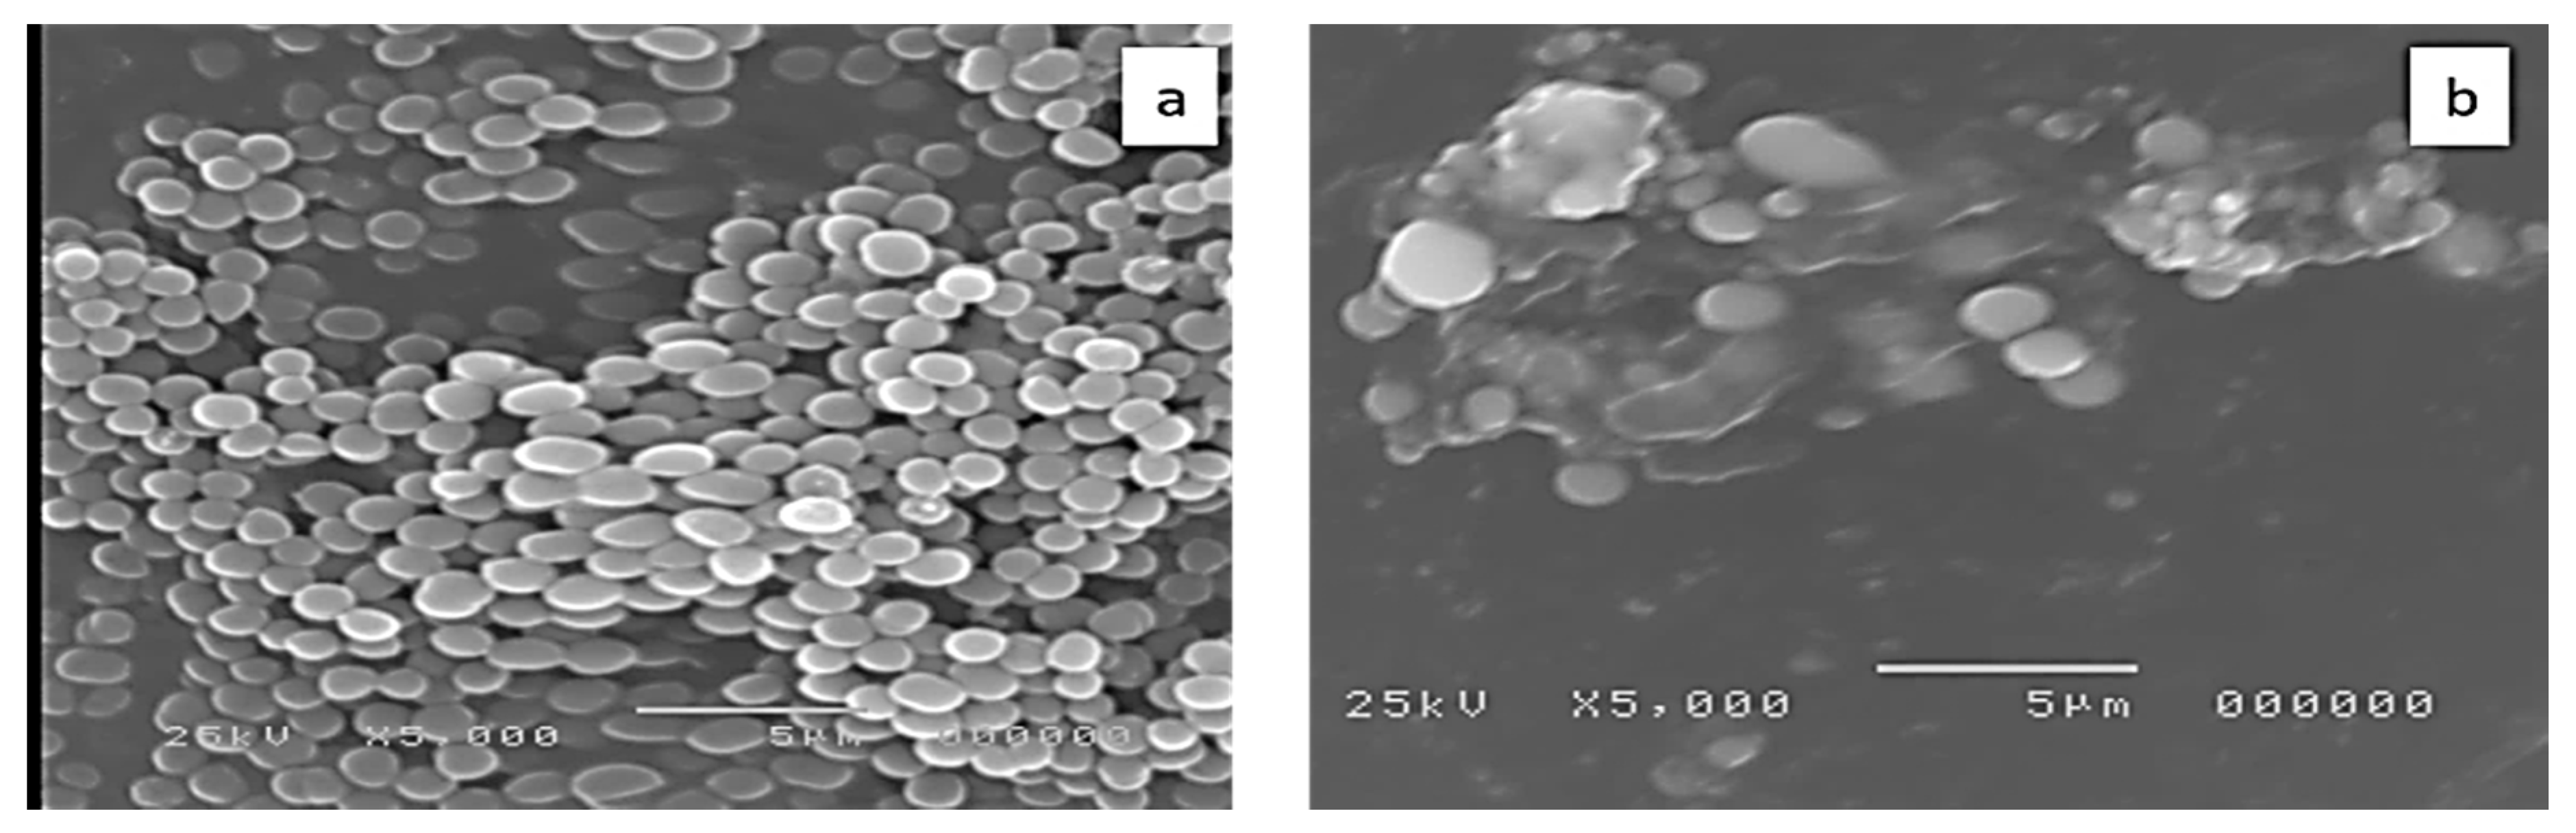
2.3.5. Examination of Bacterial Cell Morphology by Scanning Electron Microscope (SEM)
2.3.6. Cytotoxicity Assay
2.4. In Vivo Antibacterial Activity Testing
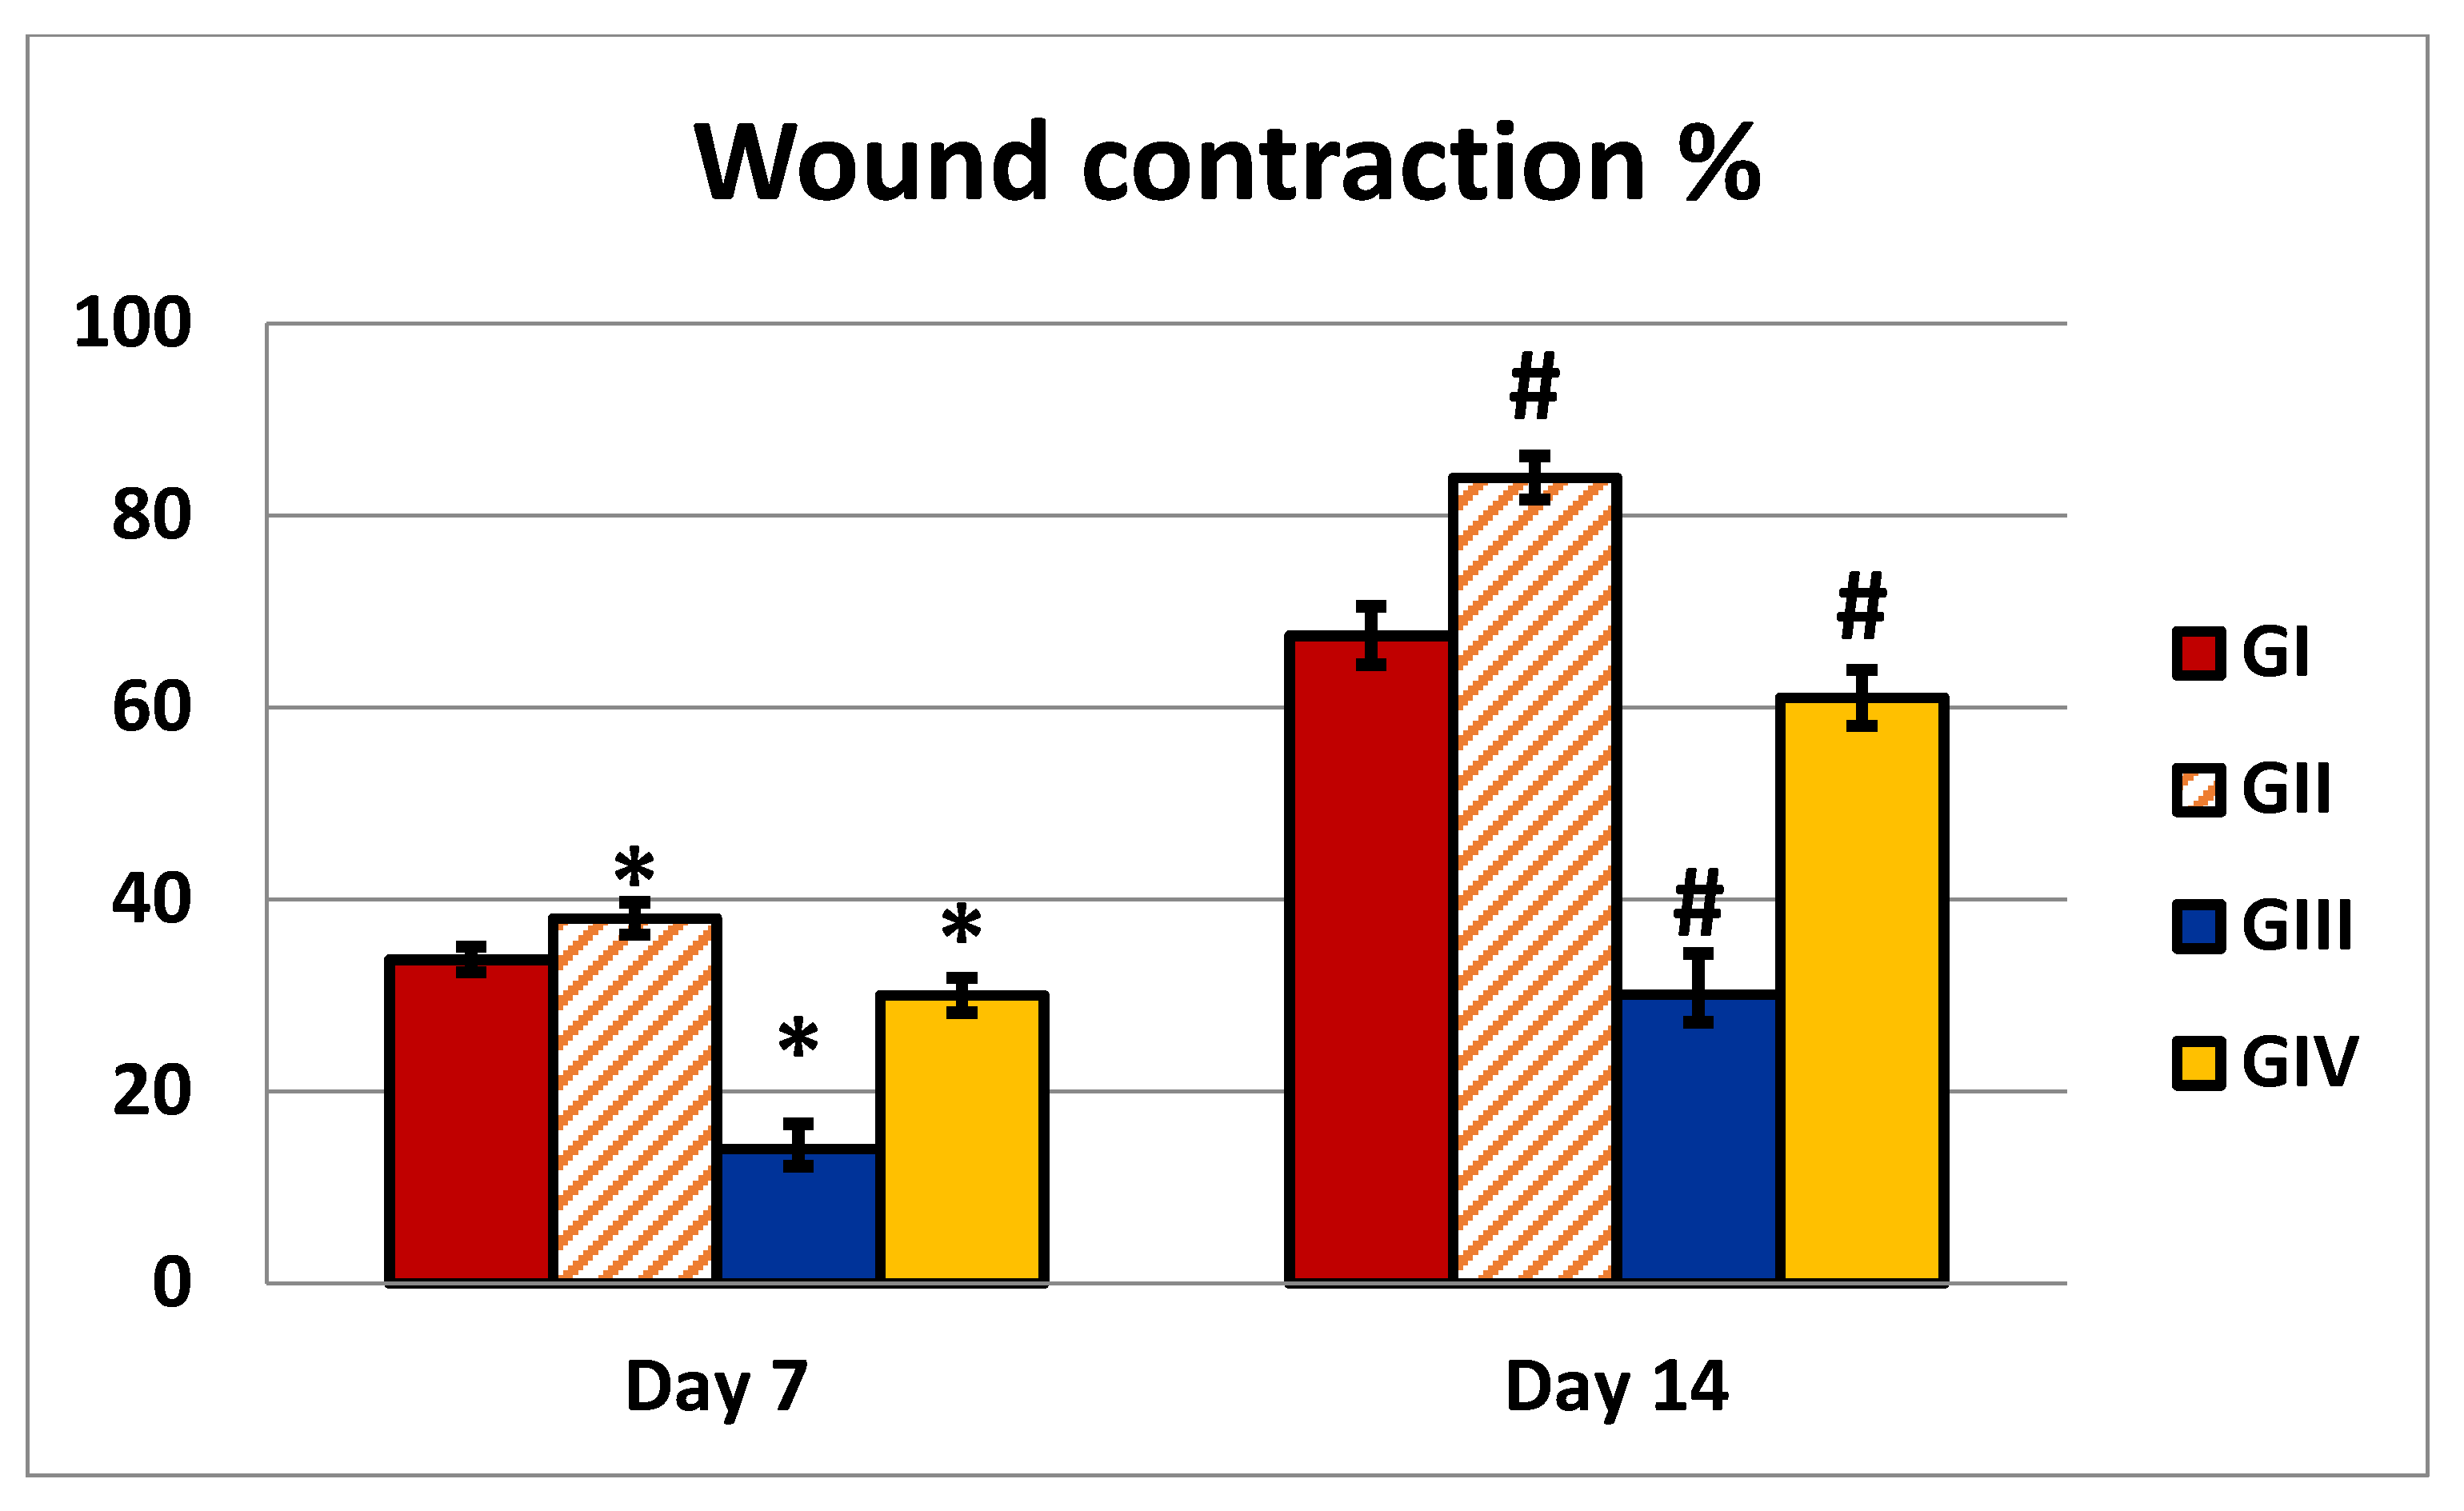
2.4.1. Wound Closure Percentage (%)
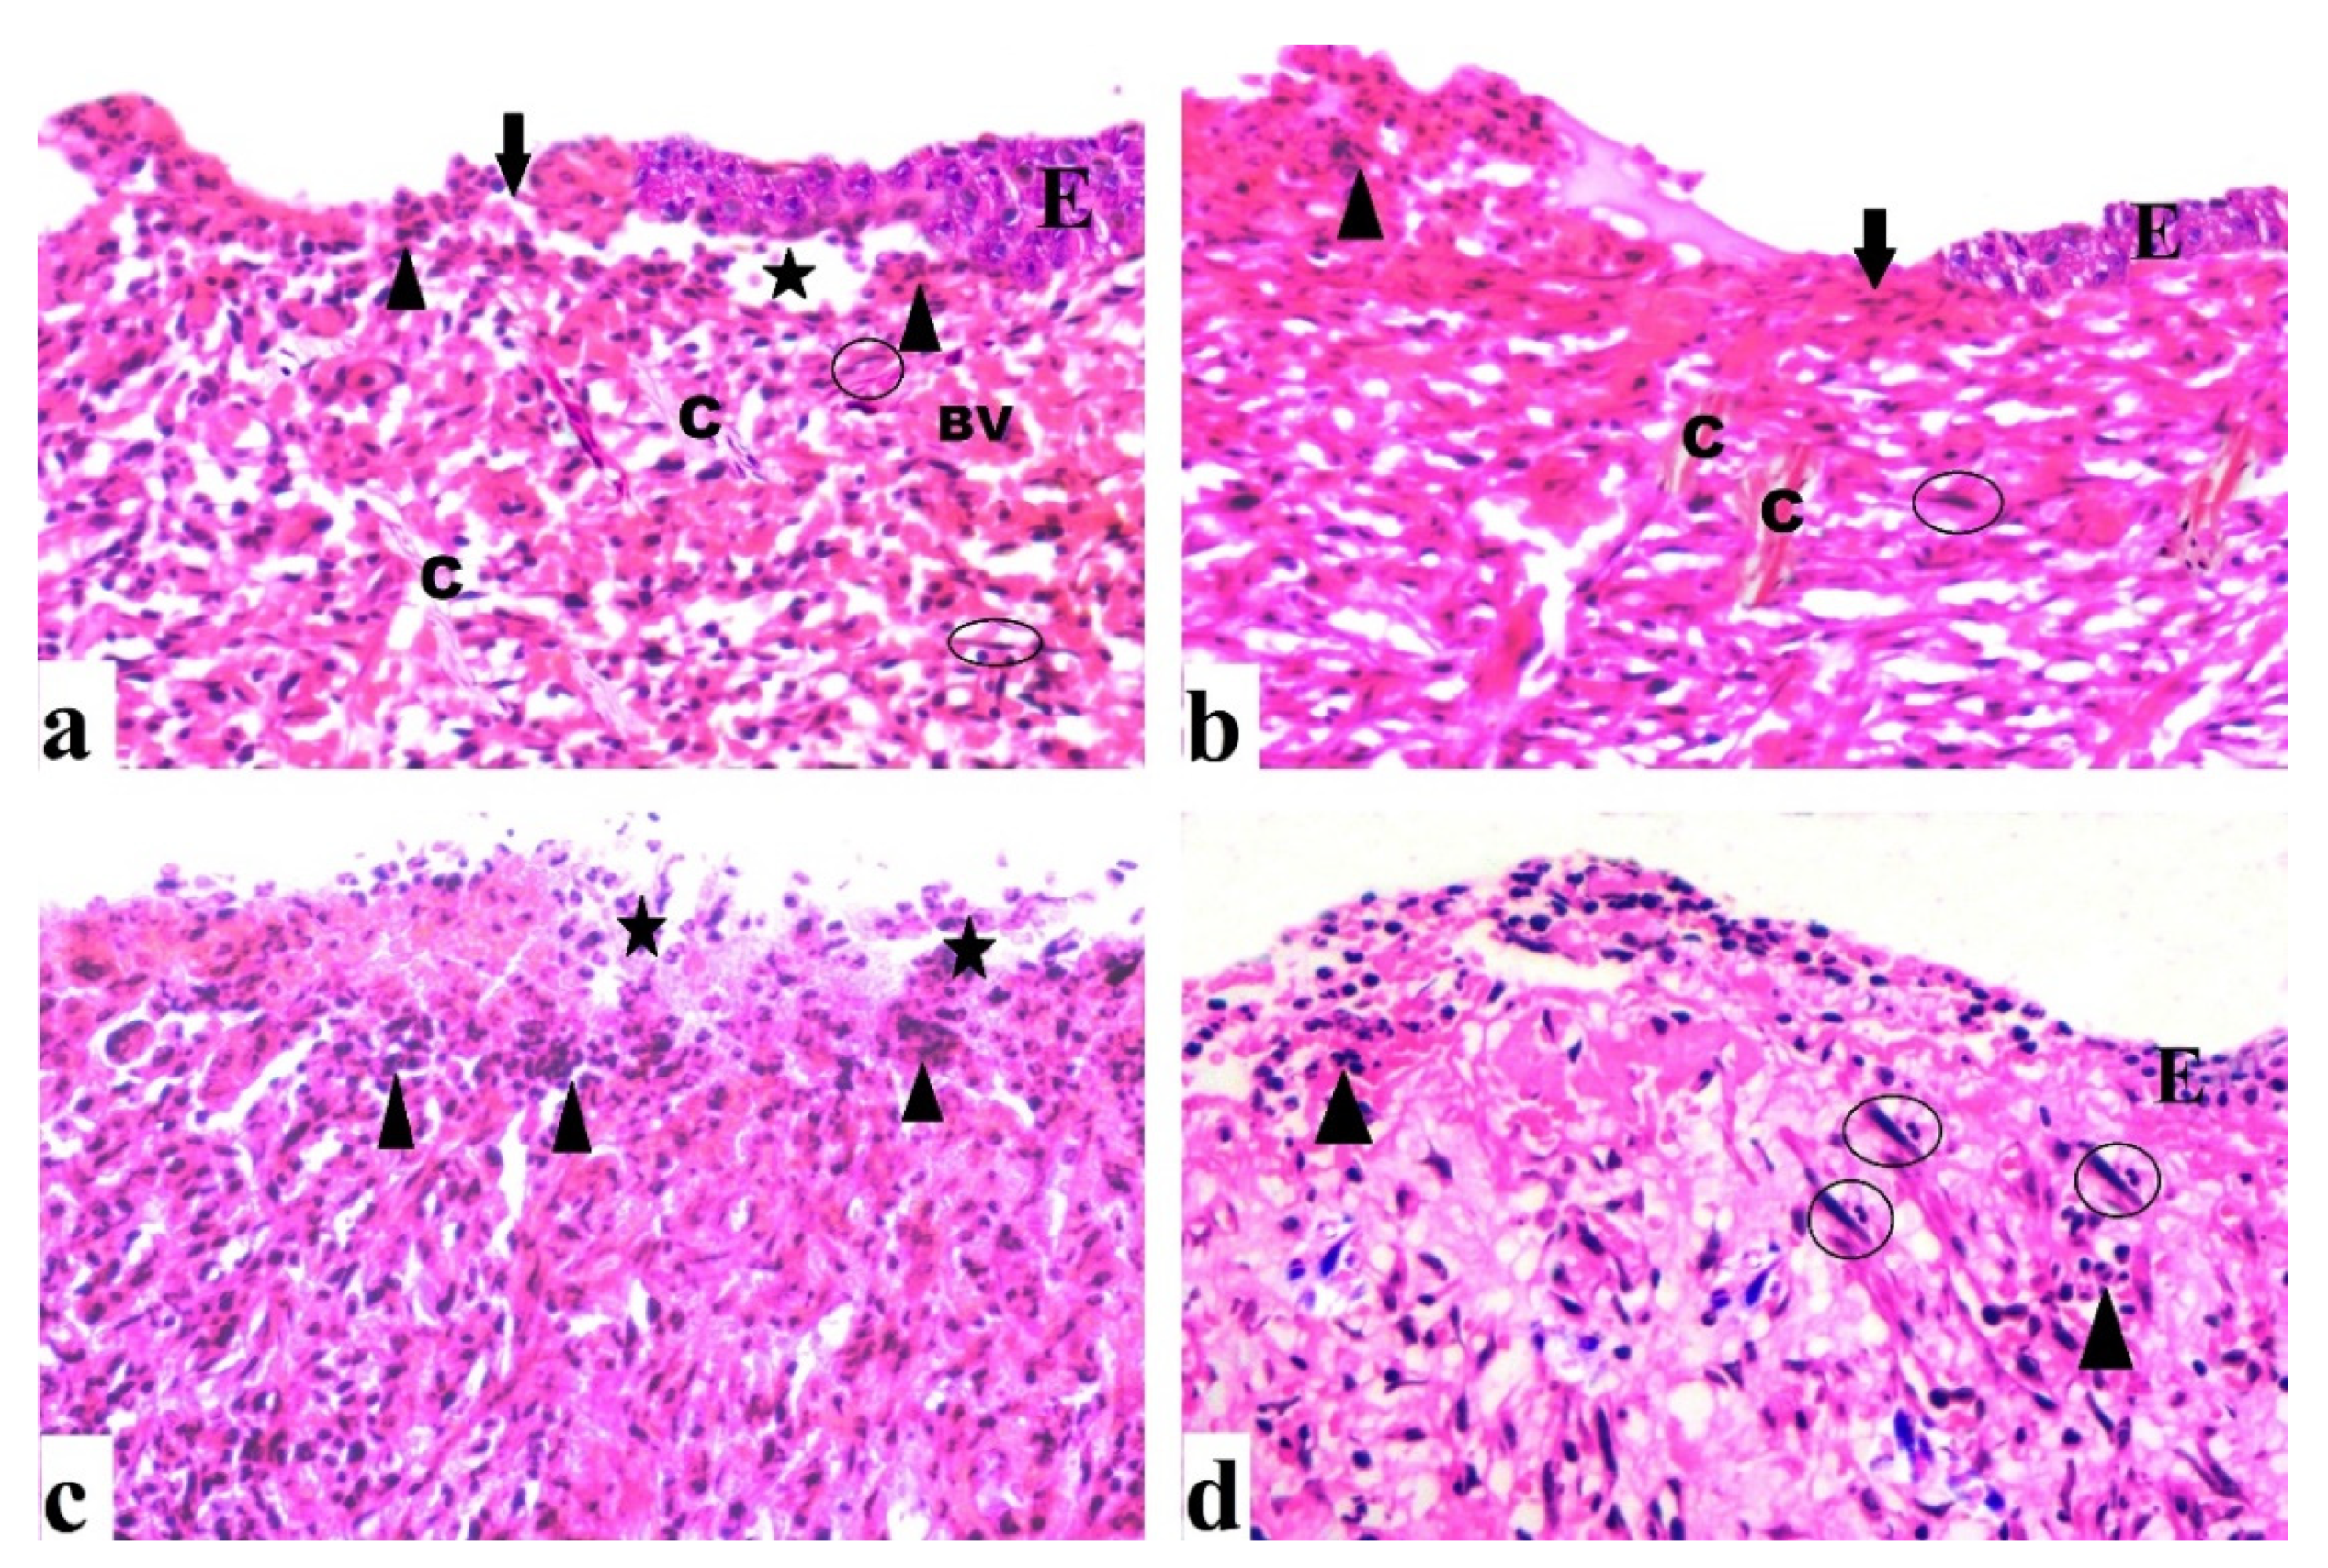
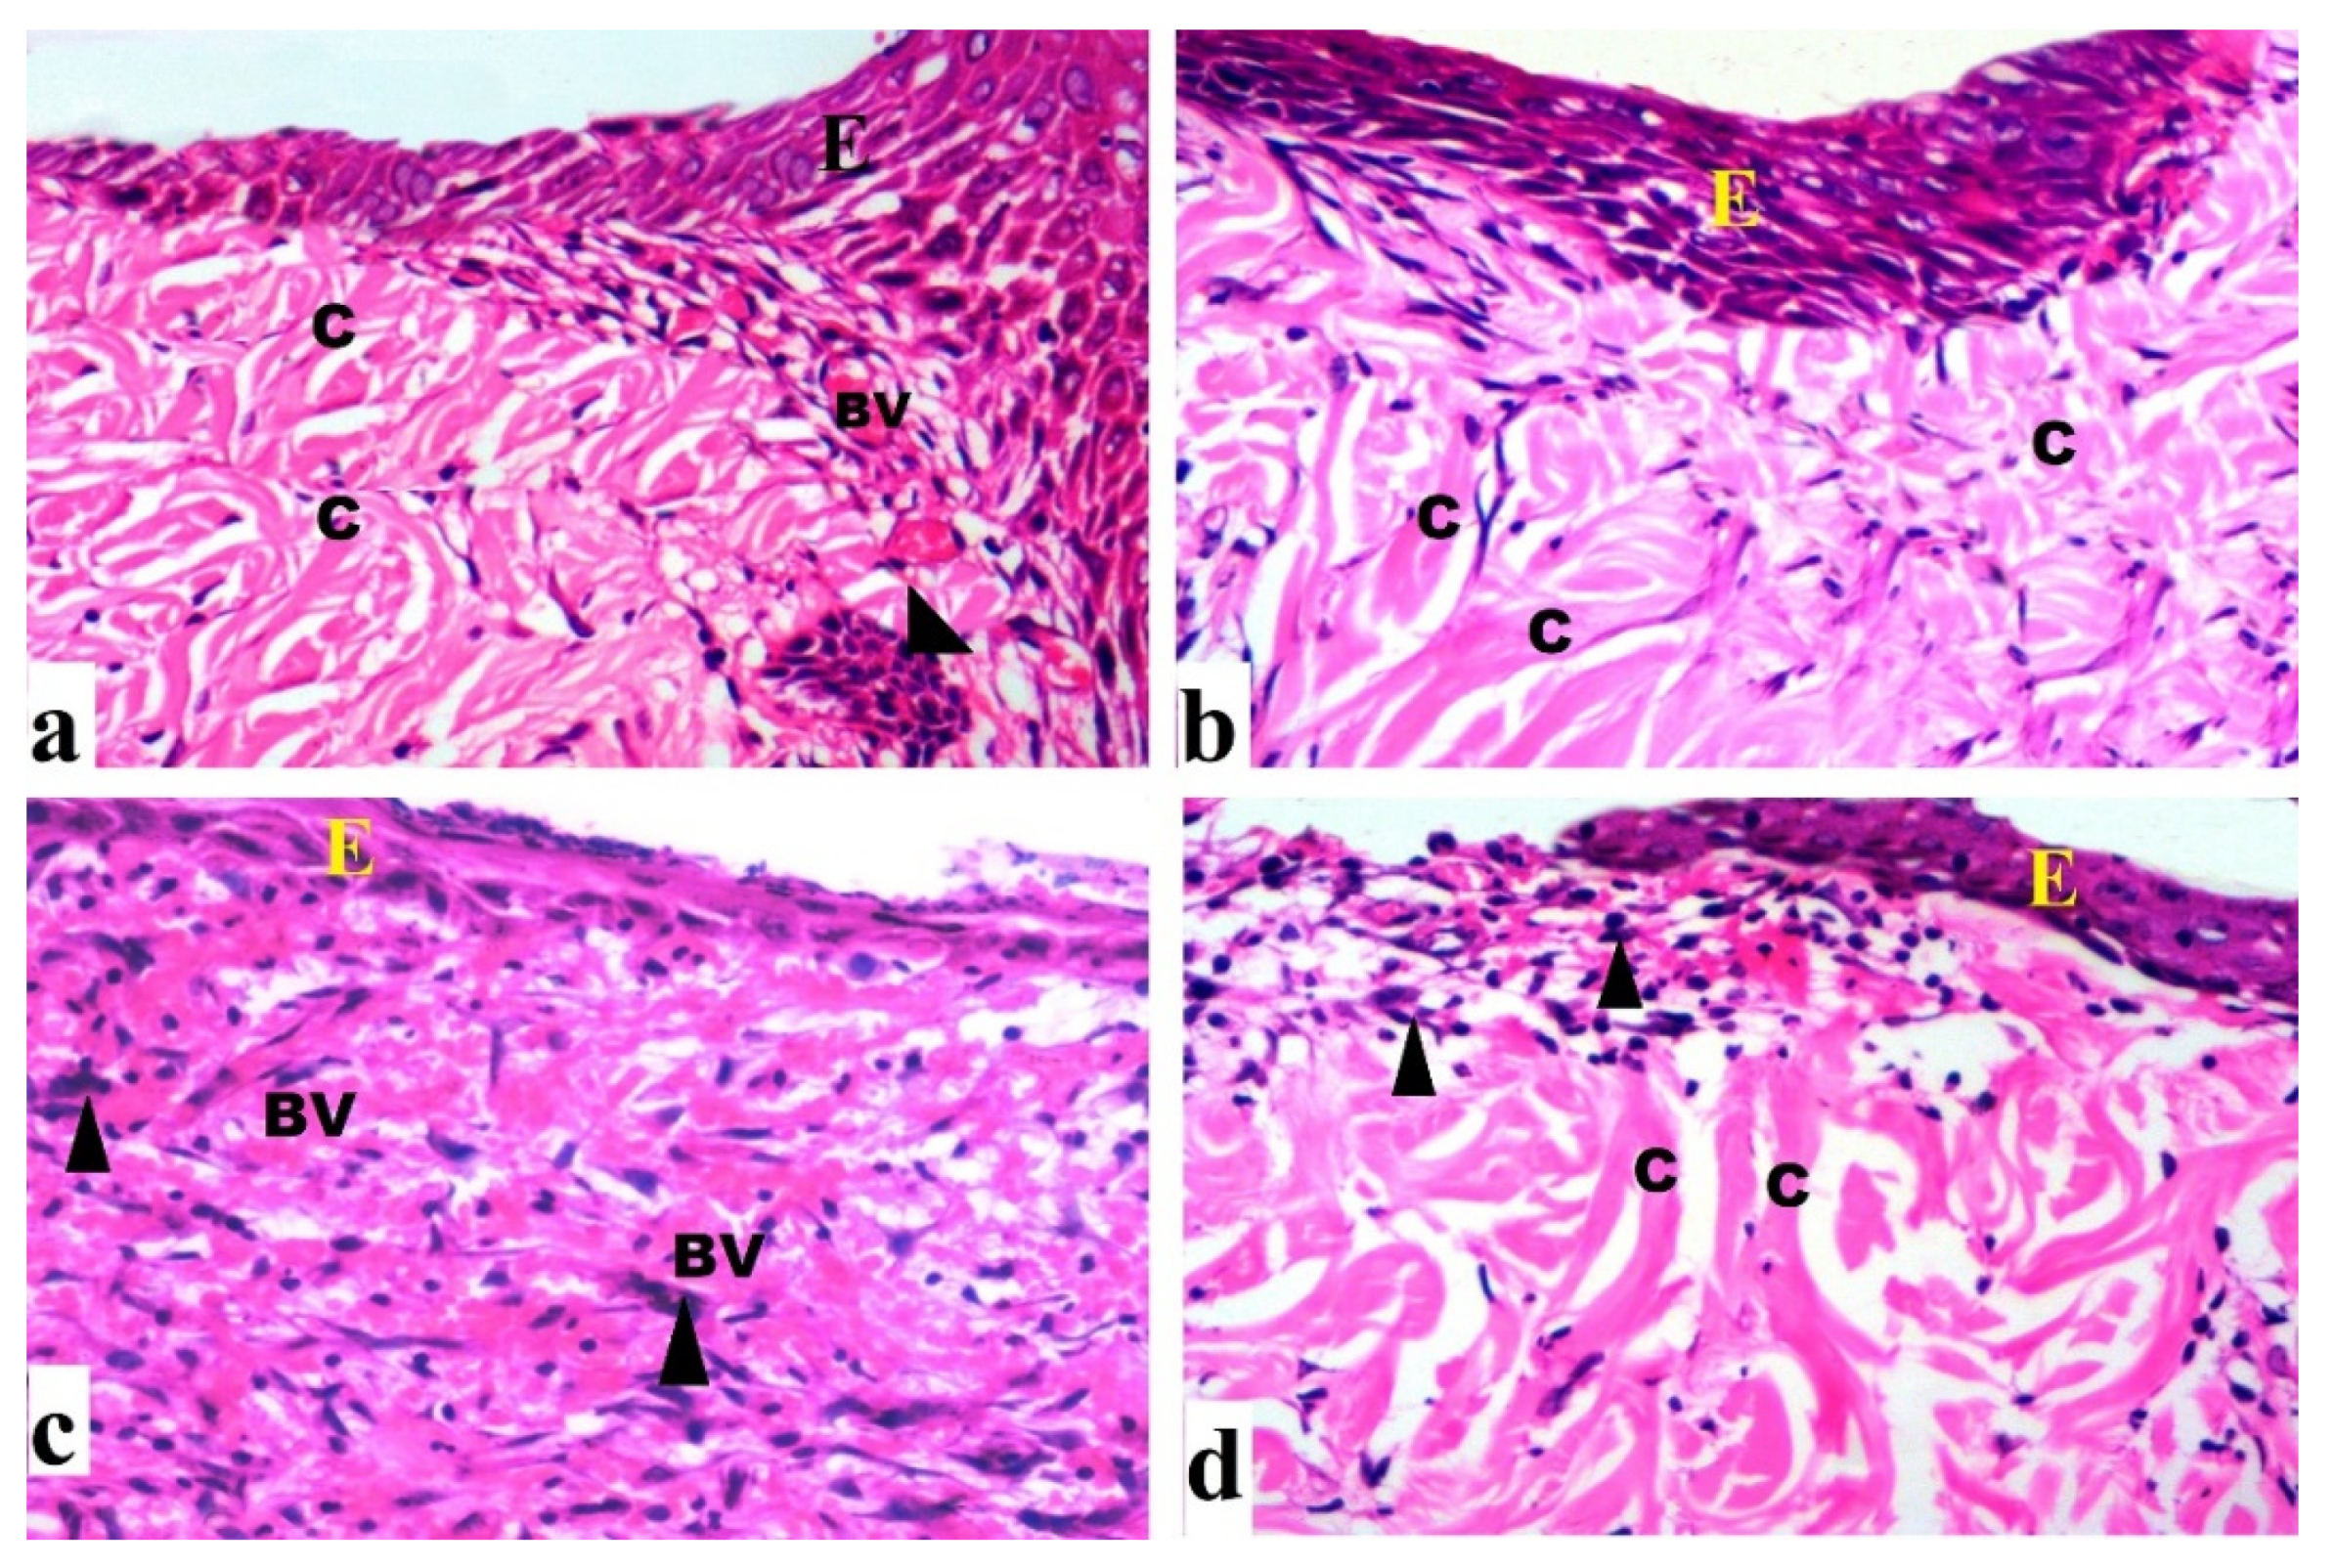
2.4.2. Histological Results (H&E)
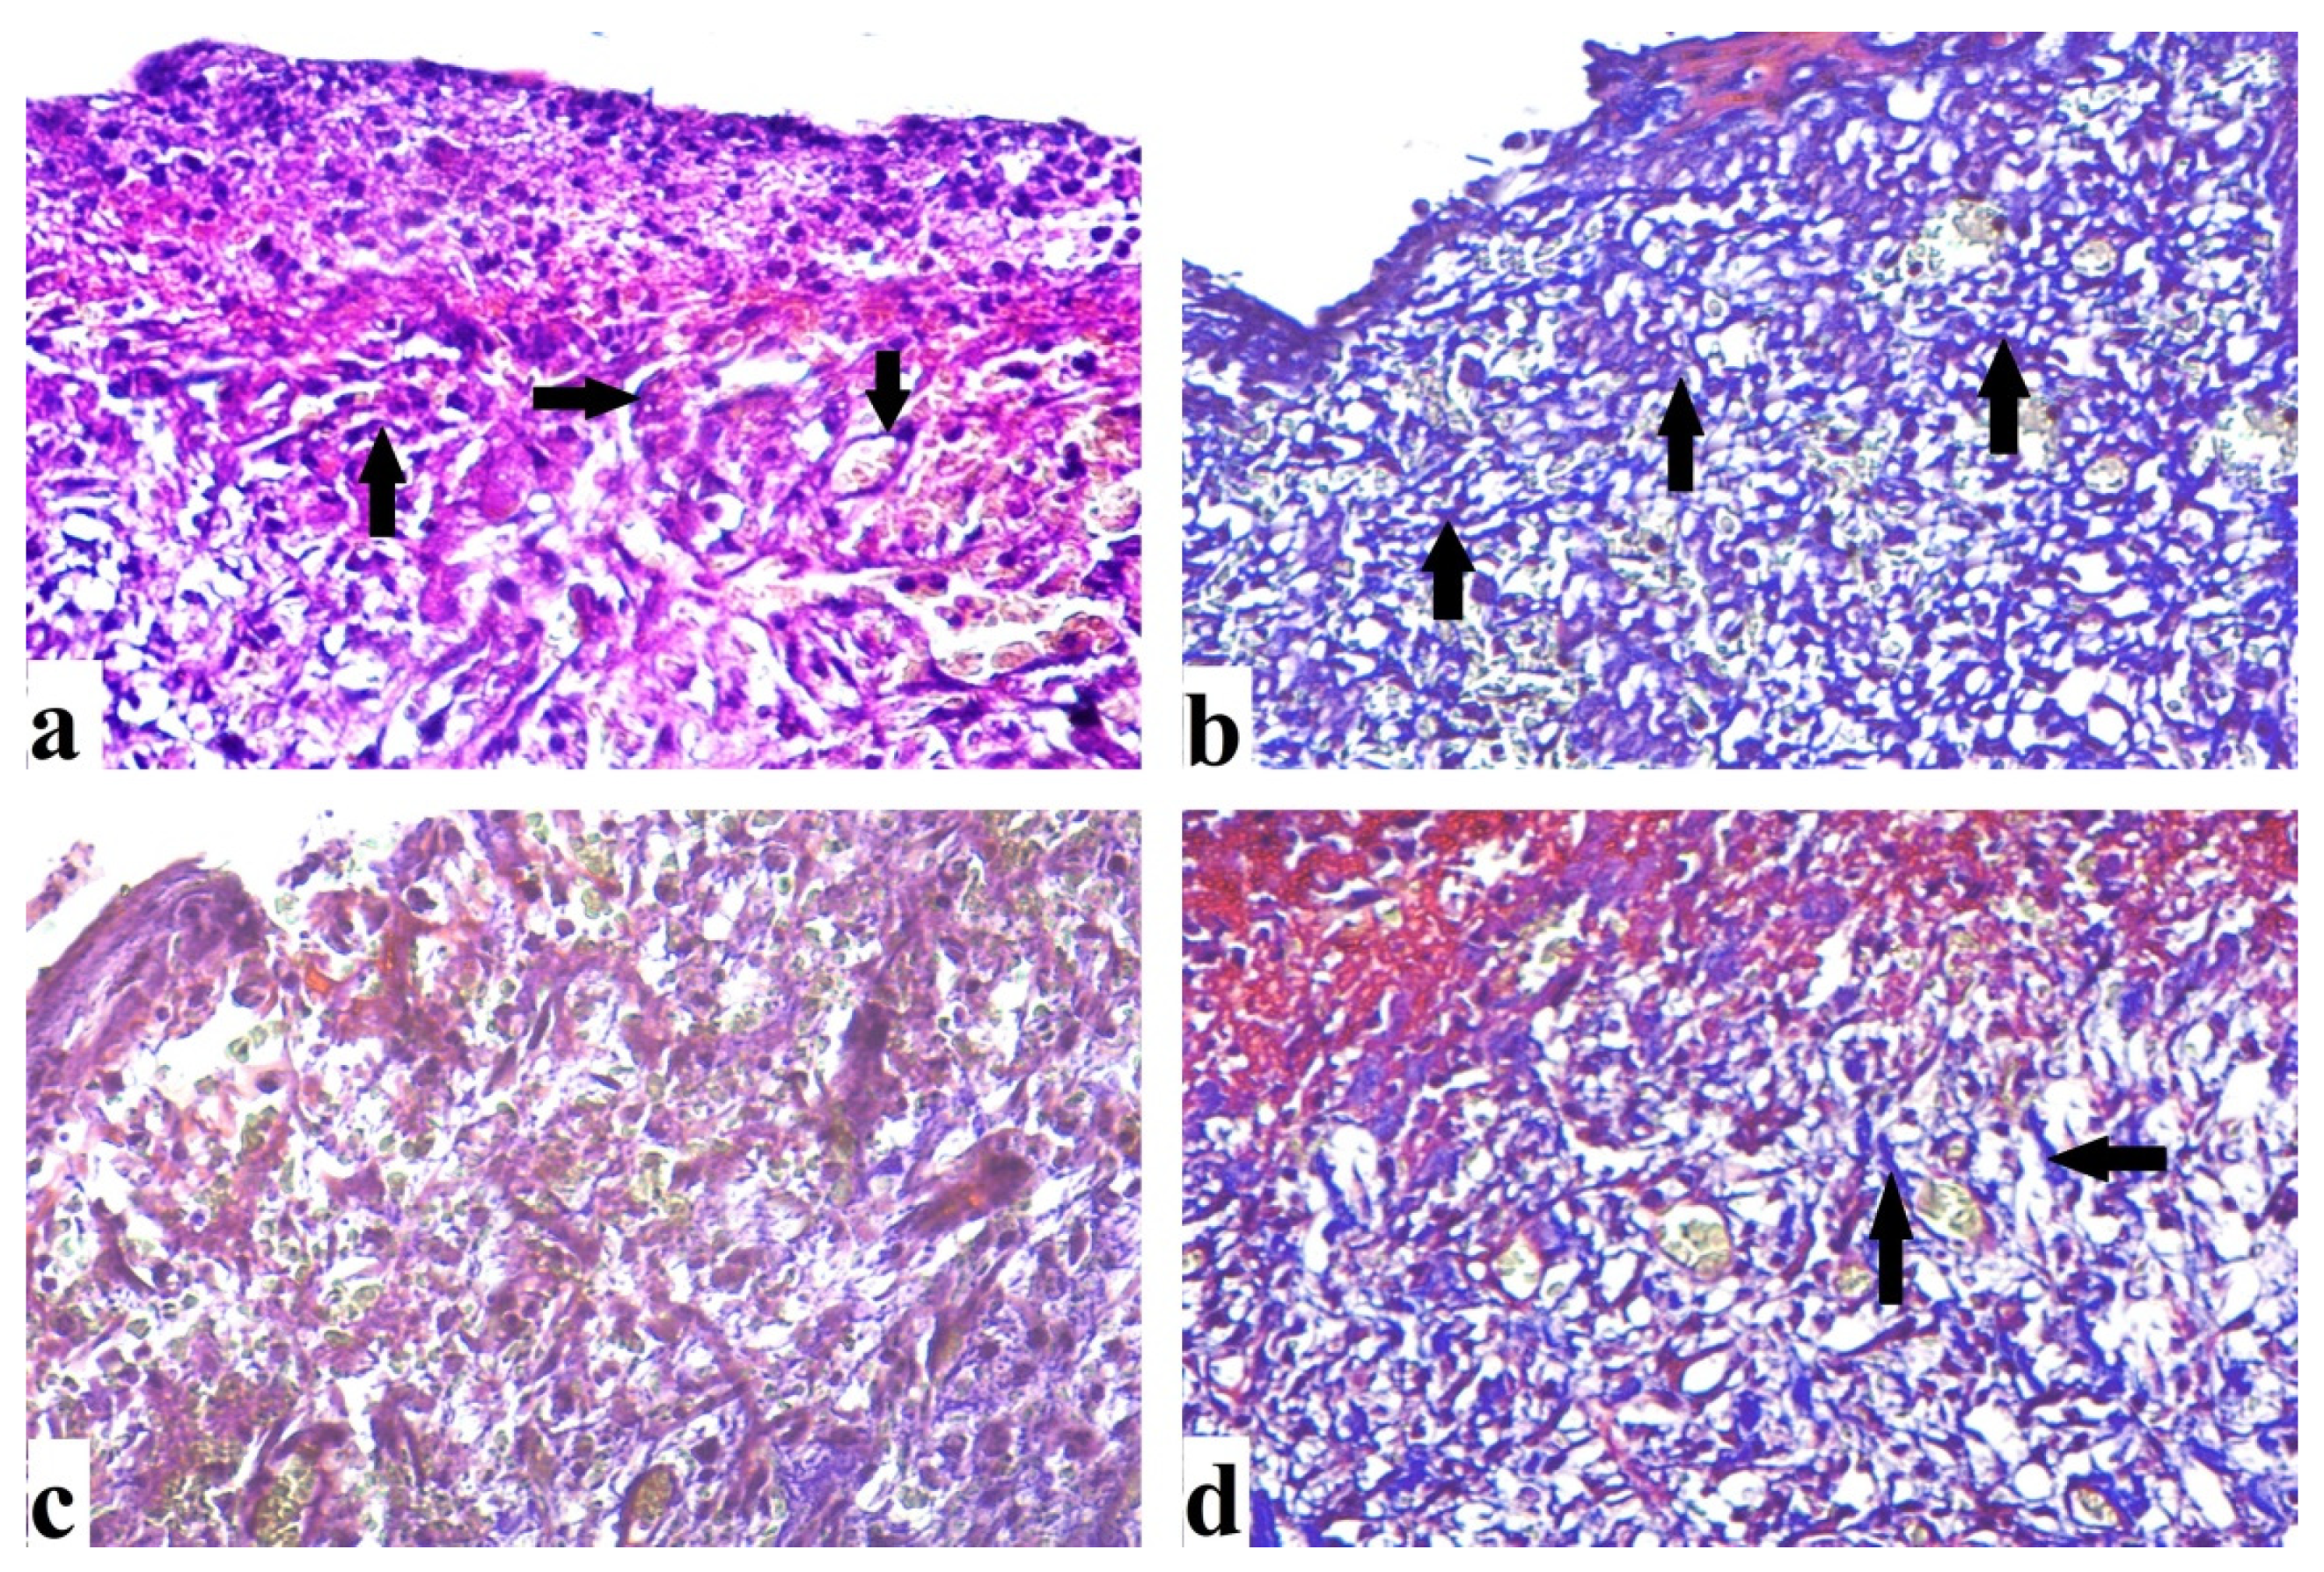
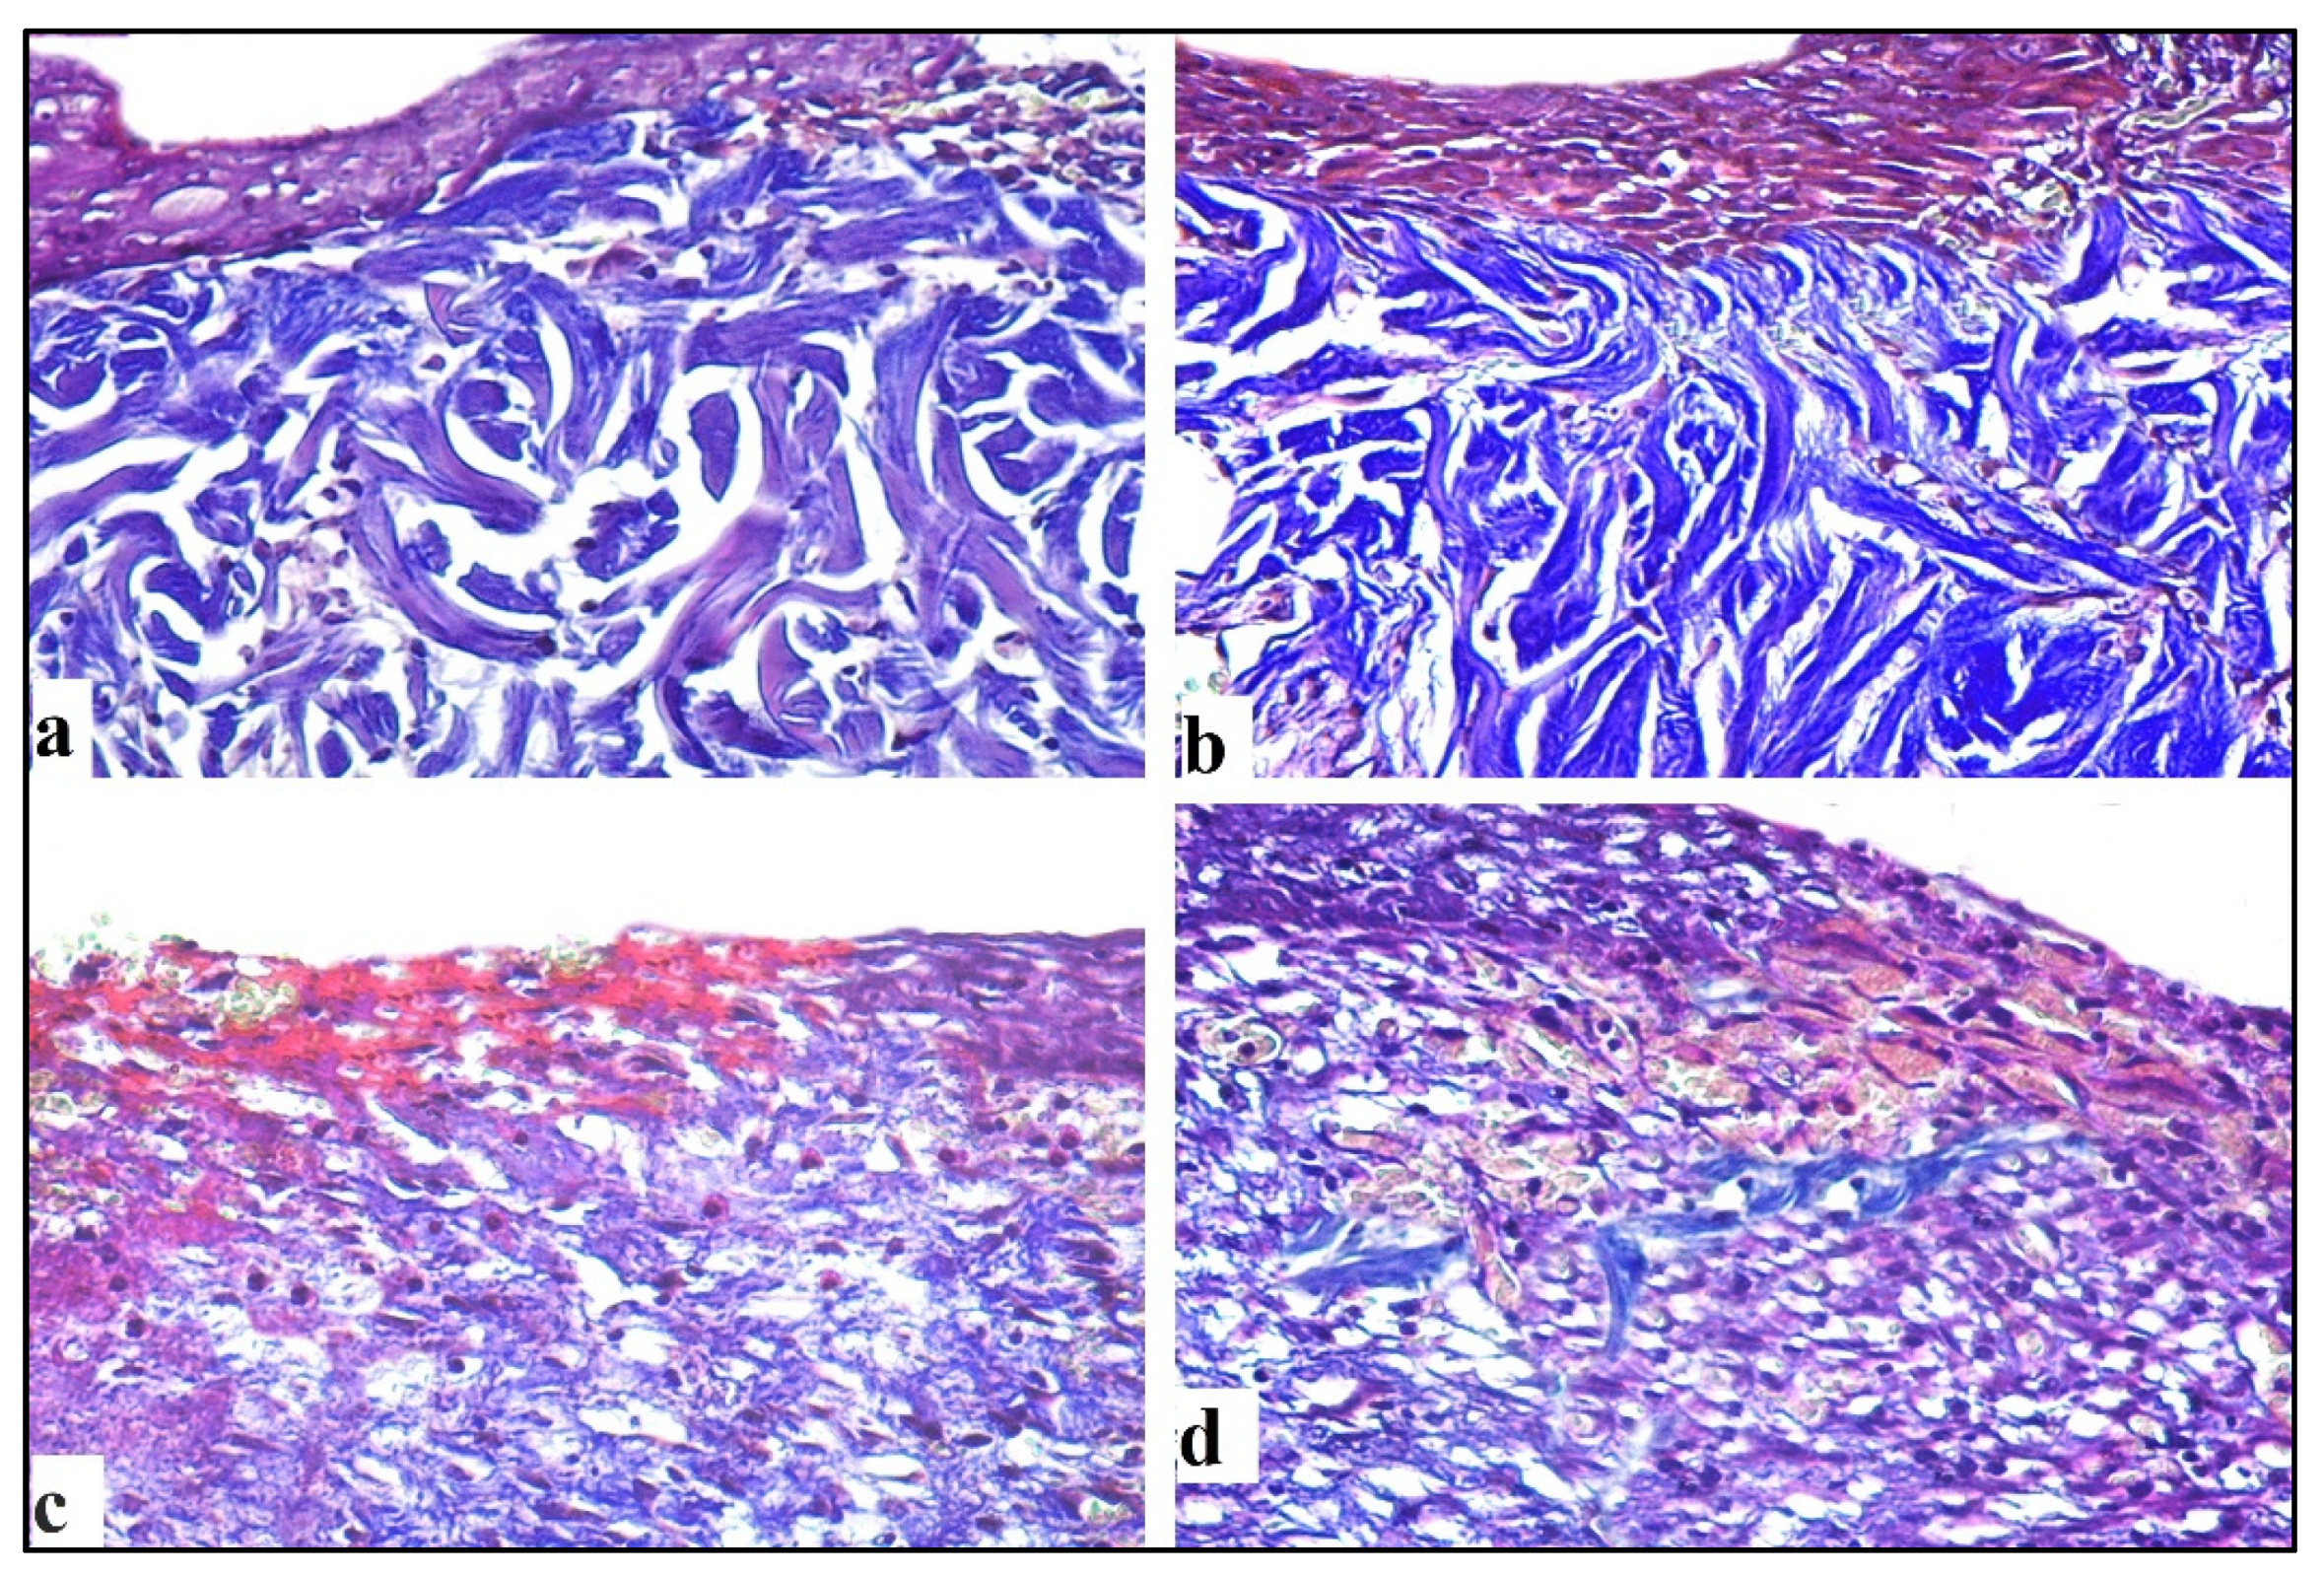
2.4.3. Mallory Trichrome Stain
3. Discussion
4. Materials and Methods
4.1. Plant Material
4.2. Method of Isolation of Flavonoids
4.3. LC-ESI-MS/MS Analysis of C. Macrocarpa Leaves Extract
4.3.1. Preparation of Plant Sample
4.3.2. LC-ESI-MS/MS Method
4.4. Materials and Methods of Antibacterial Study of C. Macrocarpa Leaves Extracts
4.4.1. Bacterial Isolates and Chemicals
4.4.2. In vitro Antibacterial Activity Testing
Determination of MICs
Growth Curve Assay
Efflux Assay
QRT-PCR
Membrane Depolarization Assay
Examination of Morphology by SEM
4.4.3. In Vivo Antibacterial Activity Testing
- Group I (control group): wounds were treated daily with 20% DMSO in normal saline (0.9% (w/v) NaCl freshly prepared).
- Group II (C. macrocarpa group): wounds were treated daily with a thin layer of DEEL in 20% DMSO in normal saline (1 mg/mL, 1 mm thickness).
- Group III (MRSA-infected group): MRSA was used to contaminate the wounds with 10 μL of the bacterial suspension (106 CFU).
- Group VI (MRSA+ C. macrocarpa treated group): wounds were infected with MRSA and treated daily with a thin coating of DEEL in 20% DMSO in normal saline (1 mg/mL, 1 mm thickness).
Histological Study
Morphometric Analysis
- Wound closure % = (initial wound size−wound at the time of taking the image)/initial wound size) × 100 [61] mean area percentage of collagen fibers with sections stained with Mallory’s Trichrome (×200).
4.5. Chemical Reagents and Cell Line
4.6. Cytotoxicity Assay
4.7. Statistical Analysis
5. Conclusions
Supplementary Materials
Author Contributions
Funding
Institutional Review Board Statement
Data Availability Statement
Acknowledgments
Conflicts of Interest
References
- Little, D.P. Evolution and circumscription of the true cypresses (Cupressaceae: Cupressus). Syst. Bot. 2006, 31, 461–480. [Google Scholar] [CrossRef]
- Cupressus macrocarpa|International Plant Names Index. Available online: https://www.ipni.org/n/60451557-2 (accessed on 6 May 2021).
- Cupressus macrocarpa (Monterey cypress) Description. Available online: https://www.conifers.org/cu/Cupressus_macrocarpa.php (accessed on 6 May 2021).
- Thukral, S.K.; Singh, S.; Sharma, S.K. Pharmacognostical standardization of leaves of Cupressus macrocarpa Hartweg. ex Gordon. J. Appl. Pharm. Sci. 2014, 4, 71–74. [Google Scholar] [CrossRef]
- Saad, A.M.; Mohammed, M.M.D.; Ghareeb, M.A.; Ahmed, W.S.; Farid, M.A. Chemical Composition and Antimicrobial Activity of the Essential Oil of the Leaves of Cupressus macrocarpa Hartweg. ex Gordon Article Info Abstract. J. Appl. Pharm. Sci. 2017, 7, 207–212. [Google Scholar] [CrossRef] [Green Version]
- Salem, M.Z.M.; Elansary, H.O.; Ali, H.M.; El-Settawy, A.A.; Elshikh, M.S.; Abdel-Salam, E.M.; Skalicka-Woźniak, K. Bioactivity of essential oils extracted from Cupressus macrocarpa branchlets and Corymbia citriodora leaves grown in Egypt. BMC Complement. Altern. Med. 2018, 18, 23. [Google Scholar] [CrossRef]
- Cool, L.G. Sesquiterpenes from Cupressus macrocarpa foliage. Phytochemistry 2005, 66, 249–260. [Google Scholar] [CrossRef] [PubMed] [Green Version]
- Al-Sayed, E.; Ke, T.Y.; Hwang, T.L.; Chen, S.R.; Korinek, M.; Chen, S.L.; Cheng, Y. Bin Cytotoxic and anti-inflammatory effects of lignans and diterpenes from Cupressus macrocarpa. Bioorg. Med. Chem. Lett. 2020, 30, 127127. [Google Scholar] [CrossRef] [PubMed]
- Al-Sayed, E.; Gad, H.A.; El-Shazly, M.; Abdel-Daim, M.M.; Nasser Singab, A. Anti-inflammatory and analgesic activities of cupressuflavone from Cupressus macrocarpa: Impact on pro-inflammatory mediators. Drug Dev. Res. 2018, 79, 22–28. [Google Scholar] [CrossRef] [PubMed]
- Al-Ashmawy, G.M.; El-Sherbeni, S.A. Protective effect of Cupressus macrocarpa and Dioon edule against gentamicin-induced nephrotoxicity in rats. J. Pharm. Pharmacogn. Res. 2020, 8, 434–448. [Google Scholar]
- Fahed, L.; Khoury, M.; Stien, D.; Ouaini, N.; Eparvier, V.; El Beyrouthy, M. Essential Oils Composition and Antimicrobial Activity of Six Conifers Harvested in Lebanon. Chem. Biodivers. 2017, 14, e1600235. [Google Scholar] [CrossRef]
- Maleki, S.J.; Crespo, J.F.; Cabanillas, B. Anti-inflammatory effects of flavonoids. Food Chem. 2019, 299, 125124. [Google Scholar] [CrossRef]
- Lv, D.; Cheng, X.; Tang, L.; Jiang, M. The cardioprotective effect of total flavonoids on myocardial ischemia/reperfusion in rats. Biomed. Pharmacother. 2017, 88, 277–284. [Google Scholar] [CrossRef]
- Sak, K. Cytotoxicity of dietary flavonoids on different human cancer types. Pharmacogn. Rev. 2014, 8, 122–146. [Google Scholar] [CrossRef] [Green Version]
- Cushnie, T.P.T.; Lamb, A.J. Antimicrobial activity of flavonoids. Int. J. Antimicrob. Agents 2005, 26, 343–356. [Google Scholar] [CrossRef]
- Kumar, S.; Pandey, A.K. Chemistry and biological activities of flavonoids: An overview. Sci. World J. 2013, 2013, 162750. [Google Scholar] [CrossRef] [Green Version]
- Techniques of Flavonoid Identification (1982 Edition)|Open Library. Available online: https://openlibrary.org/books/OL3790391M/Techniques_of_flavonoid_identification (accessed on 11 May 2021).
- Pollitt, E.J.G.; Szkuta, P.T.; Burns, N.; Foster, S.J. Staphylococcus aureus infection dynamics. PLoS Pathog. 2018, 14, e1007112. [Google Scholar] [CrossRef] [PubMed] [Green Version]
- Klein, E.Y.; Mojica, N.; Jiang, W.; Cosgrove, S.E.; Septimus, E.; Morgan, D.J.; Laxminarayan, R. Trends in Methicillin-Resistant Staphylococcus aureus Hospitalizations in the United States, 2010–2014. Clin. Infect. Dis. 2017, 65, 1921–1923. [Google Scholar] [CrossRef] [PubMed] [Green Version]
- El-Baz, A.M.; Yahya, G.; Mansour, B.; El-Sokkary, M.M.A.; Alshaman, R.; Alattar, A.; El-Ganiny, A.M. The Link between Occurrence of Class I Integron and Acquired Aminoglycoside Resistance in Clinical MRSA Isolates. Antibiotics 2021, 10, 488. [Google Scholar] [CrossRef]
- Chassagne, F.; Samarakoon, T.; Porras, G.; Lyles, J.T.; Dettweiler, M.; Marquez, L.; Salam, A.M.; Shabih, S.; Farrokhi, D.R.; Quave, C.L. A Systematic Review of Plants with Antibacterial Activities: A Taxonomic and Phylogenetic Perspective. Front. Pharmacol. 2021, 11, 2069. [Google Scholar] [CrossRef]
- Sani, A.A.; Alemika, T.E. Isolation and characterisation of cupressuflavone from the leaves of Lophira lanceolata. Artic. J. Pharm. Bioresour. 2011, 7, 14–18. [Google Scholar] [CrossRef]
- Aguiar, G.P.; Crevelin, E.J.; Dias, H.J.; Ambrósio, S.R.; Bastos, J.K.; Heleno, V.C.G.; Vessecchi, R.; Crotti, A.E.M. Electrospray ionization tandem mass spectrometry of labdane-type acid diterpenes. J. Mass Spectrom. 2018, 53, 1086–1096. [Google Scholar] [CrossRef]
- Skehan, P.; Storeng, R.; Scudiero, D.; Monks, A.; Mcmahon, J.; Vistica, D.; Warren, J.T.; Bokesch, H.; Kenney, S.; Boyd, M.R. New colorimetric cytotoxicity assay for anticancer-drug screening. J. Natl. Cancer Inst. 1990, 82, 1107–1112. [Google Scholar] [CrossRef]
- Maltese, F.; Erkelens, C.; Kooy, F.; van der Choi, Y.H.; Verpoorte, R. Identification of natural epimeric flavanone glycosides by NMR spectroscopy. Food Chem. 2009, 116, 575–579. [Google Scholar] [CrossRef]
- Jadeja, Y.S.; Kapadiya, K.M.; Jebaliya, H.J.; Shah, A.K.; Khunt, R.C. Dihedral angle study in Hesperidin using NMR Spectroscopy. Magn. Reson. Chem. 2017, 55, 589–594. [Google Scholar] [CrossRef]
- Miyake, Y.; Yamamoto, K.; Osawa, T. Isolation of Eriocitrin(Eriodictyol 7-Rutinoside) from Lemon Fruit(Citrus limon Burm. f.) and Its Antioxidative Activity. Food Sci. Technol. Int. Tokyo 1997, 3, 84–89. [Google Scholar] [CrossRef] [Green Version]
- Nogata, Y.; Ohta, H.; Ishii, T.; Sekiya, K. Isolation of eriocitrin (eriodictyol 7-O-rutinoside) as an arachidonate lipoxygenase inhibitor from Lumie fruit (Citrus lumia) and its distribution in Citrus species. J. Sci. Food Agric. 2007, 87, 82–89. [Google Scholar] [CrossRef]
- Aslam, B.; Wang, W.; Arshad, M.I.; Khurshid, M.; Muzammil, S.; Rasool, M.H.; Nisar, M.A.; Alvi, R.F.; Aslam, M.A.; Qamar, M.U.; et al. Antibiotic resistance: A rundown of a global crisis. Infect. Drug Resist. 2018, 11, 1645–1658. [Google Scholar] [CrossRef] [Green Version]
- Neto, Í.; Faustino, C.; Rijo, P. Antimicrobial abietane diterpenoids against resistant bacteria and biofilms. In The Battle against Microbial Pathogens: Basic Science, Technological Advances and Educational Programs; Méndez-Vilas, A., Ed.; Formatex Research Center: Badajoz, Spain, 2015. [Google Scholar]
- Muhammad, I.; Mossa, J.S.; El-Feraly, F.S. Antibacterial diterpenes from the leaves and seeds of Juniperus excelsa M. Bieb. Phyther. Res. 1992, 6, 261–264. [Google Scholar] [CrossRef]
- Giweli, A.; Džamic, A.M.; Sokovic, M.; Ristic, M.S.; Marin, P.D. Antimicrobial and antioxidant activities of essential oils of satureja thymbra growing wild in libya. Molecules 2012, 17, 4836. [Google Scholar] [CrossRef] [Green Version]
- Zhang, J.; Sun, H.; Chen, S.; Zeng, L.; Wang, T. Anti-fungal activity, mechanism studies on α-Phellandrene and Nonanal against Penicillium cyclopium. Bot. Stud. 2017, 58. [Google Scholar] [CrossRef] [PubMed] [Green Version]
- Li, L.; Shi, C.; Yin, Z.; Jia, R.; Peng, L.; Kang, S.; Li, Z. Antibacterial activity of α-terpineol may induce morphostructural alterations in Escherichia coli. Braz. J. Microbiol. 2014, 45, 1409–1413. [Google Scholar] [CrossRef] [PubMed] [Green Version]
- Han, Y.; Sun, Z.; Chen, W. Antimicrobial susceptibility and antibacterial mechanism of limonene against Listeria monocytogenes. Molecules 2020, 25, 33. [Google Scholar] [CrossRef] [PubMed] [Green Version]
- Foerster, S.; Unemo, M.; Hathaway, L.J.; Low, N.; Althaus, C.L. Time-kill curve analysis and pharmacodynamic modelling for in vitro evaluation of antimicrobials against Neisseria gonorrhoeae. BMC Microbiol. 2016, 16, 216. [Google Scholar] [CrossRef] [PubMed] [Green Version]
- Adnan, M.; Patel, M.; Deshpande, S.; Alreshidi, M.; Siddiqui, A.J.; Reddy, M.N.; Emira, N.; De Feo, V. Effect of Adiantum philippense Extract on Biofilm Formation, Adhesion with Its Antibacterial Activities Against Foodborne Pathogens, and Characterization of Bioactive Metabolites: An In Vitro–In Silico Approach. Front. Microbiol. 2020, 11, 823. [Google Scholar] [CrossRef] [PubMed]
- Brown, A.R.; Ettefagh, K.A.; Todd, D.A.; Cole, P.S.; Egan, J.M.; Foil, D.H.; Lacey, E.P.; Cech, N.B. Bacterial efflux inhibitors are widely distributed in land plants. J. Ethnopharmacol. 2021, 267, 113533. [Google Scholar] [CrossRef] [PubMed]
- Costa, S.S.; Junqueira, E.; Palma, C.; Viveiros, M.; Melo-Cristino, J.; Amaral, L.; Couto, I. Resistance to antimicrobials mediated by efflux pumps in Staphylococcus aureus. Antibiotics 2013, 2, 83. [Google Scholar] [CrossRef] [Green Version]
- Tariq, A.; Sana, M.; Shaheen, A.; Ismat, F.; Mahboob, S.; Rauf, W.; Mirza, O.; Iqbal, M.; Rahman, M. Restraining the multidrug efflux transporter STY4874 of Salmonella Typhi by reserpine and plant extracts. Lett. Appl. Microbiol. 2019, 69, 161–167. [Google Scholar] [CrossRef]
- Hemaiswarya, S.; Kruthiventi, A.K.; Doble, M. Synergism between natural products and antibiotics against infectious diseases. Phytomedicine 2008, 15, 639–652. [Google Scholar] [CrossRef]
- Simões, M.; Bennett, R.N.; Rosa, E.A.S. Understanding antimicrobial activities of phytochemicals against multidrug resistant bacteria and biofilms. Nat. Prod. Rep. 2009, 26, 746–757. [Google Scholar] [CrossRef]
- Te Winkel, J.D.; Gray, D.A.; Seistrup, K.H.; Hamoen, L.W.; Strahl, H. Analysis of antimicrobial-triggered membrane depolarization using voltage sensitive dyes. Front. Cell Dev. Biol. 2016, 4, 29. [Google Scholar] [CrossRef] [Green Version]
- Famuyide, I.M.; Fasina, F.O.; Eloff, J.N.; McGaw, L.J. The ultrastructural damage caused by Eugenia zeyheri and Syzygium legatii acetone leaf extracts on pathogenic Escherichia coli. BMC Vet. Res. 2020, 16, 1–9. [Google Scholar] [CrossRef]
- Wang, C.C.; Yang, P.W.; Yang, S.F.; Hsieh, K.P.; Tseng, S.P.; Lin, Y.C. Topical simvastatin promotes healing of Staphylococcus aureus-contaminated cutaneous wounds. Int. Wound J. 2016, 13, 1150–1157. [Google Scholar] [CrossRef]
- Amniattalab, A.; Mohammadi, R. Evaluation of antibiotic activity of methicillin in healing of fullthickness infected wounds with sensitized methicillin resistant Staphylococcus aureus in presence of HAMLET. Iran. J. Basic Med. Sci. 2018, 21, 1043–1049. [Google Scholar] [CrossRef]
- Gupta, A.; Kumar, P. Assessment of the histological state of the healing wound. Plast. Aesthetic Res. 2015, 2, 239. [Google Scholar] [CrossRef] [Green Version]
- Roy, S.; Santra, S.; Das, A.; Dixith, S.; Sinha, M.; Ghatak, S.; Ghosh, N.; Banerjee, P.; Khanna, S.; Mathew-Steiner, S.; et al. Staphylococcus aureus biofilm infection compromises wound healing by causing deficiencies in granulation tissue collagen. Ann. Surg. 2020, 271, 1174–1185. [Google Scholar] [CrossRef] [PubMed]
- Tsugawa, H.; Cajka, T.; Kind, T.; Ma, Y.; Higgins, B.; Ikeda, K.; Kanazawa, M.; Vandergheynst, J.; Fiehn, O.; Arita, M. MS-DIAL: Data-independent MS/MS deconvolution for comprehensive metabolome analysis. Nat. Methods 2015, 12, 523–526. [Google Scholar] [CrossRef]
- Weinstein, M.P.; Patel, J.B.; Bobenchik, A.M.; Campeau, S.; Cullen, S.K.; Galas, M.F.; Gold, H.; Humphries, R.M.; Kirn, T.J.; Lewis Ii, J.S.; et al. M100 Performance Standards for Antimicrobial Susceptibility Testing A CLSI Supplement for Global Application. Performance Standards for Antimicrobial Susceptibility Testing Performance Standards for Antimicrobial Susceptibility Testing; Clinical and Laboratory Standards Institute: Wayne, PA, USA, 2020; ISBN 9781684400324. [Google Scholar]
- Abd El-Hamid, M.I.; El-Naenaeey, E.S.Y.; Kandeel, T.M.; Hegazy, W.A.H.; Mosbah, R.A.; Nassar, M.S.; Bakhrebah, M.A.; Abdulaal, W.H.; Alhakamy, N.A.; Bendary, M.M. Promising antibiofilm agents: Recent breakthrough against biofilm producing methicillin-resistant Staphylococcus aureus. Antibiotics 2020, 9, 667. [Google Scholar] [CrossRef]
- Antibacterial Activity and Phytochemical Analysis of Cardanthera difformis Druce Leaf Extracts from West Bengal, India. Available online: https://www.researchgate.net/publication/287619737_Antibacterial_activity_and_phytochemical_analysis_of_Cardanthera_difformis_druce_leaf_extracts_from_West_Bengal_India (accessed on 18 May 2021).
- El-Banna, T.; El-Aziz, A.; Sonbol, F.; El-Ekhnawy, E. Adaptation of Pseudomonas aeruginosa clinical isolates to benzalkonium chloride retards its growth and enhances biofilm production. J. Agric. Food Chem. 2019, 46, 3437–3443. [Google Scholar] [CrossRef] [PubMed]
- Sonbol, F.I.; El-Banna, T.E.; Abd El-Aziz, A.A.; El-Ekhnawy, E. Impact of triclosan adaptation on membrane properties, efflux and antimicrobial resistance of Escherichia coli clinical isolates. J. Appl. Microbiol. 2019, 126, 730–739. [Google Scholar] [CrossRef]
- Kwak, Y.G.; Truong-Bolduc, Q.C.; Kim, H.B.; Song, K.H.; Kim, E.S.; Hooper, D.C. Association of norb overexpression and fluoroquinolone resistance in clinical isolates of Staphylococcus aureus from Korea. J. Antimicrob. Chemother. 2013, 68, 2766–2772. [Google Scholar] [CrossRef] [Green Version]
- Livak, K.J.; Schmittgen, T.D. Analysis of relative gene expression data using real-time quantitative PCR and the 2−ΔΔCT method. Methods 2001, 25, 402–408. [Google Scholar] [CrossRef]
- Zheng, J.; Tian, F.; Cui, S.; Song, J.; Zhao, S.; Brown, E.W.; Meng, J. Differential gene expression by ramA in ciprofloxacin-resistant Salmonella Typhimurium. PLoS ONE 2011, 6, 22161. [Google Scholar] [CrossRef]
- Elekhnawy, E.; Sonbol, F.; Abdelaziz, A.; Elbanna, T. An investigation of the impact of triclosan adaptation on Proteus mirabilis/clinical isolates from an Egyptian university hospital. Braz. J. Microbiol. 2021, 52, 927–937. [Google Scholar] [CrossRef] [PubMed]
- McDowell, E.M.; Trump, B.F. Histologic fixatives suitable for diagnostic light and electron microscopy—PubMed. Arch. Pathol. Lab. Med. 1976, 100, 405–414. [Google Scholar] [PubMed]
- Suvarna, K.; Layton, C.; Bancroft, J. Bancroft’s Theory and Practice of Histological Techniques—7th Edition, 7th ed.; Churchill Livingstone of Elsevier: Philadelphia, PA, USA, 2013. [Google Scholar]
- Adibhesami, M.; Ahmadi, M.; Farshid, A.A.; Sarrafzadeh-Rezaei, F.; Dalir-Naghadeh, B. Effects of silver nanoparticles on Staphylococcus aureus contaminated open wounds healing in mice: An experimental study—PubMed. Vet Res Forum. 2017, 8, 23–28. [Google Scholar] [PubMed]


| No. | Rt (min.) | [M − H]− m/z | MS2 m/z | Formula | Identification |
|---|---|---|---|---|---|
| 1 | 1.17 | 115.000 | 115.081, 71.017 | C4H4O4 | Maleic acid |
| 2 | 1.19 | 625.063 | 625.071, 429.022, 369.071, 346.077, 301.012 | C27H30O17 | Quercetin-3,4′-O-β-diglucopyranoside |
| 3 | 1.21 | 173.046 | 173.044, 155.060, 140.924, 118.587, 109.024, 93.033 | C7H10O5 | (-)-Shikimic acid |
| 4 | 1.22 | 191.056 | 191.054, 173.046, 133.013, 111.044, 109.024, 93.032 | C7H12O6 | D-(-)-Quinic acid |
| 5 | 1.23 | 317.053 | 317.055, 281.093, 279.106, 249.00, 191.056 | C15H10O8 | Myricetin |
| 6 | 1.59 | 163.038 | 163.039, 119.049, 91.014 | C9H8O3 | 3-(4-hydroxyphenyl)prop-2-enoic acid (p-coumaric acid) |
| 7 | 4.10 | 577.172 | 577.156, 532.902, 269.104 | C27H30O14 | Rhoifolin |
| 8 | 3.45 | 447.188 | 447.180, 401.180, 301.151, 239.127, 179.070, 151.046, 119.035 | C21H20O11 | Quercitrin |
| 9 | 4.60 | 417.139 | 417.134, 371.169, 285.92, 209.0788 | C20H18O10 | Kaempferol-3-O-alpha-L-arabinoside |
| 10 | 4.66 | 461.148 | 461.127, 392.912, 285.103 | C21H18O12 | Kaempferol-3-O-Glucuronide |
| 11 | 4.80 | 283.096 | 283.090, 179.100, 171.098, 146.956, 73.030 | C16H12O5 | Acacetin |
| 12 | 4.84 | 289.070 | 289.067, 245.084, 205.044, 187.040, 179.046, 151.044, 123.052 | C15H14O6 | Catechin |
| 13 | 5.10 | 183.025 | 183.034 | C8H8O5 | 3,4-Dihydroxymandelate |
| 14 | 5.65 | 431.191 | 431.192, 383.924, 285.213, 165.095, 159.034, 149.047, 125.023, 119.035 | C21H20O10 | Kaempferol-3-O-alpha-L-rhamnoside |
| 15 | 5.67 | 385.172 | 385.184, 248.947, 223.131, 205.121, 190.970, 179.053, 161.042, 149.052, 119.035, 71.016 | C17H22O10 | 1-O-β-D-glucopyranosyl sinapate |
| 16 | 5.89 | 463.169 | 463.171, 403.151, 317.103, 301.093, 208.087, 194.033, 150.056 | C21H20O12 | Myricitrin |
| 17 | 6.01 | 449.108 | 449.102, 403.165, 381.167, 287.03293, 269.042, 179.002, 151.00, 107.022 | C21H22O11 | Eriodictyol-7-O-glucoside |
| 18 | 6.260 | 609.143 | 609.146, 563.234, 496.863, 285.201, 315.043 300.03 | C27H30O16 | Luteolin-3′, 7-di-O-glucoside |
| 19 | 6.29 | 433.111 | 433.115, 271.053, 151.036, 119.043 | C21H22O10 | Naringenin-7-O-glucoside |
| 20 | 6.69 | 435.092 | 435.084, 417.083, 389.214, 309.053, 285.040, 178.993, 151.042, 125.023 | C21H24O10 | Phlorizin |
| 21 | 6.79 | 449.102 | 449.114, 431.080, 342.910, 303.049, 285.045, 276.910, 151.00 | C21H22O11 | Okanin-4′-O-glucoside |
| 22 | 6.97 | 595.169 | 595.286, 548.851, 480.844, 315.058, 287.030 | C27H32O15 | Eriodictyol-7-O-rutinoside |
| 23 | 6.99 | 445.171 | 445.169, 269.142, 112.989 | C21H18O11 | Baicalein-7-O-glucuronide |
| 24 | 6.98 | 623.063 | 623.208, 579.156, 532.918, 315.036 | C28H32O16 | Isorhamnetin-3-O-rutinoside |
| 25 | 7.15 | 609.521 | 609.144, 301.027 | C28H34O15 | Hesperidin |
| 26 | 7.24 | 433.076 | 433.077, 389.175, 385.201, 326.928, 301.037, 300.030, 287.049, 271.025 | C20H18O11 | Quercetin-3-O-Arabinoside |
| 27 | 7.48 | 477.099 | 477.098, 431.222, 364.927, 331.042, 315.041, 300.043 | C22H22O12 | Isorhamnetin-3-O-glucoside |
| 28 | 7.52 | 507.111 | 507.102, 489.186, 461.112, 345.057, 326.930, 315.061, 286.951, 269.121 | C23H24O13 | Syringetin-3-O-glucoside |
| 29 | 7.53 | 447.092 | 447.088, 401.248, 301.034, 300.020, 285.040, 271.026 | C21H20O11 | Quercetin-7-O-rhamnoside |
| 30 | 7.57 | 433.079 | 433.080, 349.103, 326.928, 301.036, 300.023, 269.047, 178.993, 152.010 | C20H18O11 | Quercetin-3-D-xyloside |
| 31 | 7.67 | 405.061 | 405.093, 369.248, 231.0, 209.066, 191.056, 137.020 | C20H22O9 | E-3,4,5′-Trihydroxy-3′-glucopyranosyl-stilbene |
| 32 | 7.70 | 463.088 | 463.119, 394.907, 354.924, 331.054, 316.021, 301.066, 286.934 | C21H20O12 | Quercetin-4′-glucoside |
| 33 | 7.87 | 431.097 | 431.092, 385.175, 341.181, 299.023, 269.035 | C21H20O10 | Apigenin-7-O-glucoside |
| 34 | 7.90 | 447.182 | 447.096, 401.202, 285.040, 112.989 | C21H20O11 | Luteolin-7-O-glucoside |
| 35 | 7.82 | 415.197 | 415.195, 369.212, 253.165, 179.063, 161.042, 113.020 | C21H20O9 | Daidzein-8-C-glucoside |
| 36 | 8.22 | 507.111 | 507.112, 462.907, 445.205, 430.890, 394.919, 371.207, 345.124, 329.041, 286.932 | C23H24O13 | Syringetin-3-O-galactoside |
| 37 | 8.39 | 301.123 | 301.118 | C16H14O6 | Hesperetin |
| 38 | 9.57 | 537.083 | 537.021, 518.951, 493.504, 468.105, 255.025, 248.956, 213.018, 197.059 | C30H18O10 | Cupressuflavone |
| 39 | 9.76 | 301.037 | 301.036, 255.221, 243.039, 178.997, 151.0094 | C15H10O7 | Quercetin |
| 40 | 10.08 | 299.056 | 299.055, 284.042 | C16H12O6 | 3,5,7-Trihydroxy-4′-methoxy-flavone |
| 41 | 10.12 | 359.169 | 359.176 | C18H16O8 | Rosmarinic acid |
| 42 | 10.23 | 181.047 | 181.049, 166.031, 138.030, 112.986 | C9H10O4 | Syringaldehyde |
| 43 | 10.29 | 271.060 | 271.064, 177.022, 151.004, 119.046, 107.020 | C15H12O5 | Naringenin |
| 44 | 10.85 | 611.113 | 611.117, 565.214, 504.961 | C28H36O15 | Neohesperidin dihydrochalcone |
| 45 | 10.96 | 285.039 | 285.038, 185.068 | C15H10O6 | Luteolin |
| 46 | 11.23 | 315.109 | 315.169, 300.028, 297.187, 283.022, 269.246, 246.898, 235.177, 141.018 | C16H12O7 | 3′-Methoxy-4′,5,7-trihydroxyflavonol |
| 47 | 15.14 | 319.227 | 319.226, 318.20, 255.209, 248.572, 164.252 | C20H32O3 | Isocupressic acid |
| 48 | 19.60 | 361.238 | 361.237, 319.231, 301.218, 283.165 | C22H34O4 | Acetylisocupressic acid |
| 49 | 23.33 | 305.248 | 305.249, 304.280, 166.095 | C20H34O2 | Agathadiol |
| Efflux Activity | No. of Isolates before Treatment | No. of Isolates after Treatment |
|---|---|---|
| Negative efflux activity | 8 | 21 |
| Intermediate efflux activity | 14 | 13 |
| Positive efflux activity | 19 | 7 |
| X− ± SD | |||||
|---|---|---|---|---|---|
| GI | GII | GIII | GIV | p-Value | |
| Wound contraction % (7 days) | 33.73 ± 1.32 | 38 ± 1.7 | 14 ± 2.58 | 30 ± 1.82 | P1 = 0.0001 P2 = 0.0001 P3 = 0.0001 P4 = 0.0001 |
| Wound contraction % (14 days) | 67.5 ± 3.03 | 83.9 ± 2.28 | 30.1 ± 4.28 | 61 ± 2.9 | P1 = 0.0001 P2 = 0.0001 P3 = 0.0001 P4 = 0.0001 |
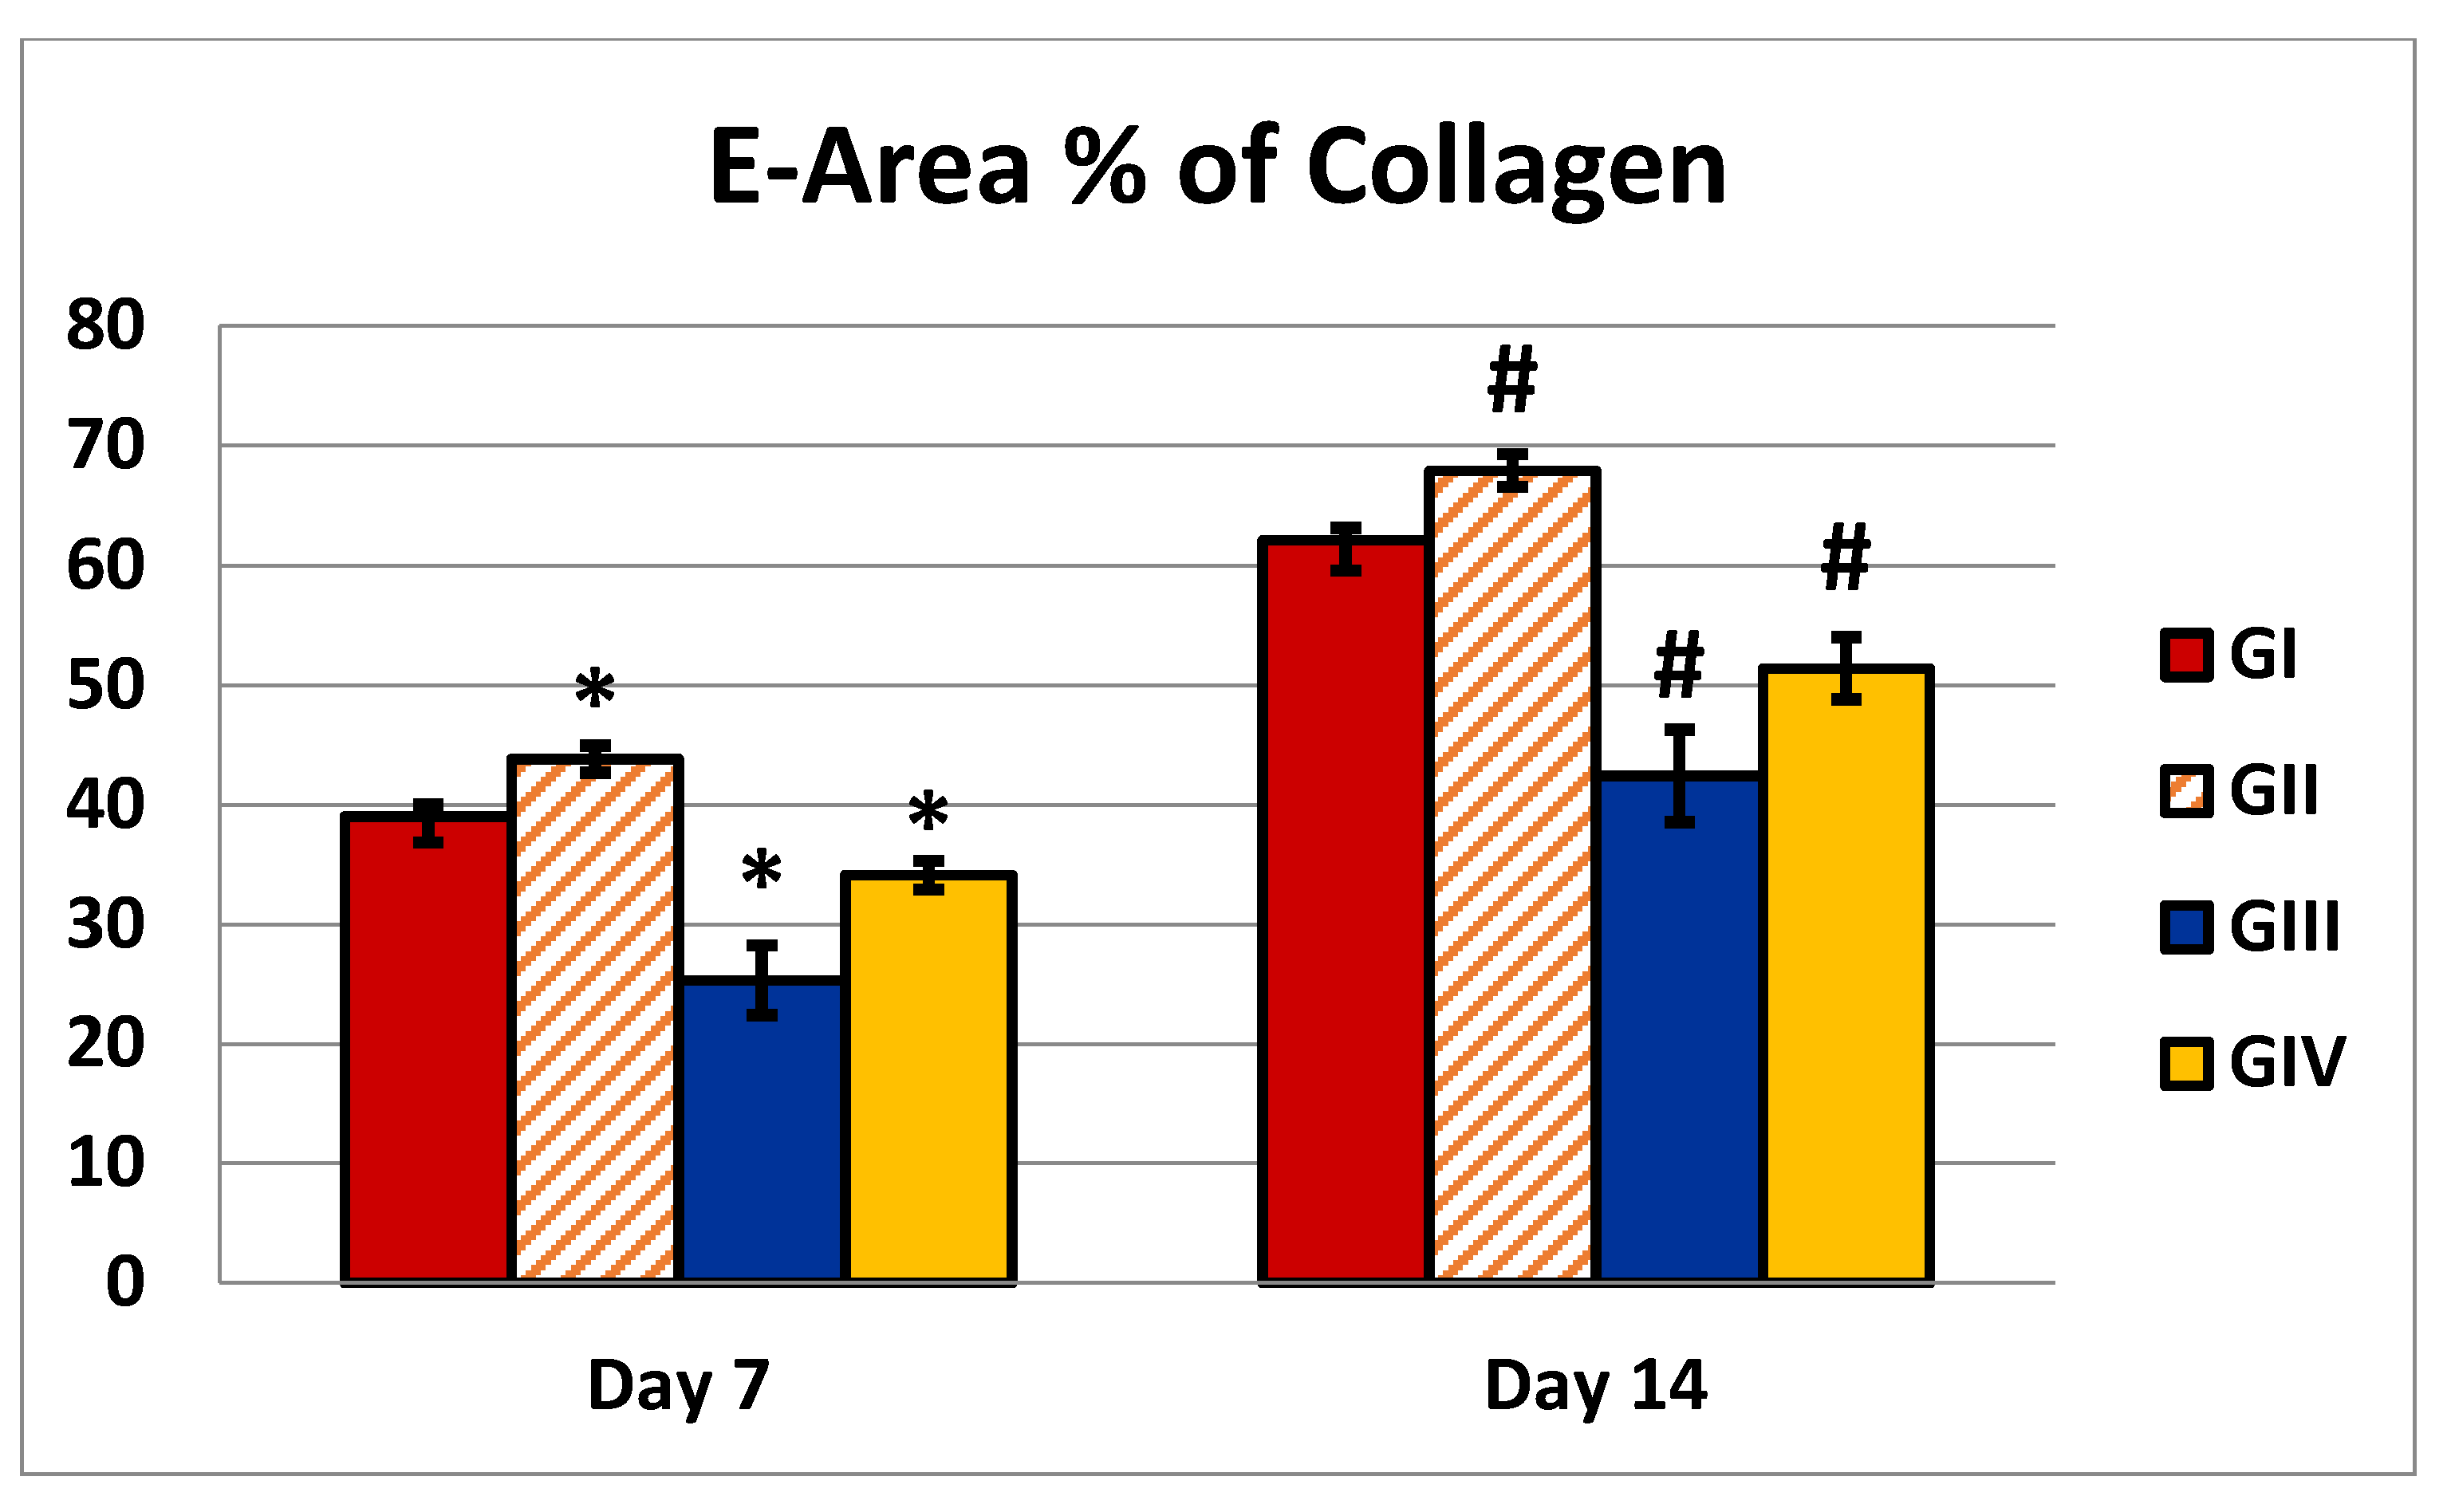
| Area % of collagen (7 days) | 39 ± 2.16 | 43.8 ± 1.13 | 25.3 ±2.9 | 34.1±1.19 | P1 = 0.0001 P2 = 0.0001 P3 = 0.0001 P4 = 0.0001 |
| Area % of collagen (14 days) | 62.1 ±2.51 | 67.9 ±1.37 | 42.4 ±3.86 | 51.4 ±2.59 | P1 = 0.0001 P2 = 0.0001 P3 = 0.0001 P4 = 0.0001 |
Publisher’s Note: MDPI stays neutral with regard to jurisdictional claims in published maps and institutional affiliations. |
© 2021 by the authors. Licensee MDPI, Basel, Switzerland. This article is an open access article distributed under the terms and conditions of the Creative Commons Attribution (CC BY) license (https://creativecommons.org/licenses/by/4.0/).
Share and Cite
Attallah, N.G.M.; Negm, W.A.; Elekhnawy, E.; Elmongy, E.I.; Altwaijry, N.; El-Haroun, H.; El-Masry, T.A.; El-Sherbeni, S.A. Elucidation of Phytochemical Content of Cupressus macrocarpa Leaves: In Vitro and In Vivo Antibacterial Effect against Methicillin-Resistant Staphylococcus aureus Clinical Isolates. Antibiotics 2021, 10, 890. https://0-doi-org.brum.beds.ac.uk/10.3390/antibiotics10080890
Attallah NGM, Negm WA, Elekhnawy E, Elmongy EI, Altwaijry N, El-Haroun H, El-Masry TA, El-Sherbeni SA. Elucidation of Phytochemical Content of Cupressus macrocarpa Leaves: In Vitro and In Vivo Antibacterial Effect against Methicillin-Resistant Staphylococcus aureus Clinical Isolates. Antibiotics. 2021; 10(8):890. https://0-doi-org.brum.beds.ac.uk/10.3390/antibiotics10080890
Chicago/Turabian StyleAttallah, Nashwah G. M., Walaa A. Negm, Engy Elekhnawy, Elshaymaa I. Elmongy, Najla Altwaijry, Hala El-Haroun, Thanaa A. El-Masry, and Suzy A. El-Sherbeni. 2021. "Elucidation of Phytochemical Content of Cupressus macrocarpa Leaves: In Vitro and In Vivo Antibacterial Effect against Methicillin-Resistant Staphylococcus aureus Clinical Isolates" Antibiotics 10, no. 8: 890. https://0-doi-org.brum.beds.ac.uk/10.3390/antibiotics10080890