Article

Conjugation of Penicillin-G with Silver(I) Ions Expands Its Antimicrobial Activity against Gram Negative Bacteria

by
Ioannis Ketikidis
1,
Christina N. Banti
1,*,
Nikolaos Kourkoumelis
2,
Constantinos G. Tsiafoulis
3,*,
Christina Papachristodoulou
4,
Angelos G. Kalampounias
5 and
Sotiris K. Hadjikakou
1,6,*
1
Inorganic Chemistry laboratory, Department of Chemistry, University of Ioannina, 45110 Ioannina, Greece
2
Medical Physics Laboratory, Medical School, University of Ioannina, 45110 Ioannina, Greece
3
Laboratory of Analytical Chemistry, Department of Chemistry, University of Ioannina, 45110 Ioannina, Greece
4
Department of Physics, University of Ioannina, 45110 Ioannina, Greece
5
Physical Chemistry Laboratory, Department of Chemistry, University of Ioannina, 45110 Ioannina, Greece
6
Institute of Materials Science and Computing, University Research Center of Ioannina (URCI), 45110 Ioannina, Greece
*
Authors to whom correspondence should be addressed.
Submission received: 25 December 2019 / Revised: 9 January 2020 / Accepted: 10 January 2020 / Published: 13 January 2020
(This article belongs to the Section Novel Antimicrobial Agents)

Abstract

:
Conjugation of penicillin G (PenH) with silver(I) ions forms a new CoMeD (conjugate of metal with a drug) with formula [Ag(pen)(CH3OH)]2 (PenAg). PenAg was characterized by a plethora of physical and spectroscopic techniques, which include in the solid state m.p.; elemental analysis; X-ray fluorescence (XRF) spectroscopy; scanning electron microscopy (SEM); energy-dispersive X-ray spectroscopy (EDX); FT-IR; and in solution: attenuated total reflection spectroscopy (FT-IR-ATR), UV–Vis, 1H NMR, and atomic absorption (AA). The structure of PenAg was determined by NMR spectroscopy. Silver(I) ions coordinate to the carboxylic group of PenH, while secondary intra-molecular interactions are developed through (i) the nitrogen atom of the amide group in MeOD-d4 or (ii) the sulfur atom in the thietane ring in deuterated dimethyl sulfoxide DMSO-d6. The antibacterial activities of PenAg and the sodium salt of penicillin (PenNa) (the formulation which is clinically used) against Gram positive (Staphylococcus epidermidis (S. epidermidis) and Staphylococcus aureus (S. aureus)) and Gram negative (Pseudomonas aeruginosa (P. aeuroginosa PAO1)) bacteria were evaluated by the means of minimum inhibitory concentration (MIC), minimum bactericidal concentration (MBC), and inhibition zone (IZ). PenAg inhibits the growth of the Gram negative bacterial strain P. aeuroginosa with a MIC value of 23.00 ± 2.29 μM, in contrast to PenNa, which shows no such activity (>2 mM). The corresponding antimicrobial activities of PenAg against the Gram positive bacteria S. epidermidis and S. aureus are even better than those of PenNa. Moreover, PenAg exhibits no in vivo toxicity against Artemia salina at concentration up to 300 μΜ. The wide therapeutic window and the low toxicity, make PenAg a possible candidate for the development of a new antibiotic.

Graphical Abstract

1. Introduction

Penicillins belong to the group of beta-lactam antibiotics, members of which each contain a high-energy, four-membered beta-lactam ring. This ring is required for exhibiting antibacterial activity. Beta-lactam antibiotics inhibit the synthesis of bacterial cell membranes, while they activate the autolytic enzymes which destroy cell membranes, simultaneously [1]. Nowadays, penicillins constitute about 50% of the antimicrobial agents currently in use (WHO 2018a, 2018b) [2] and they are first choice drugs in the treatment of nosocomial infections [2]. Benzyl-penicillin (penicillin G) is the gold standard penicillin, which is obtained biotechnologically using the fungus P. chrysogenum [1]. However, benzyl-penicillin has a narrow antimicrobial spectrum, considering that it is active only towards Gram-positive bacteria (e.g., Staphylococcus), and not Gram-negative ones [1]. Moreover, due to wide use of penicillins, infections caused by penicillin-resistant bacteria are hardly treated. Therefore, in order to overcome this problem, new β-lactam compounds with wider spectra of activity and less susceptibility to penicillinases should be developed [3].
Silver ions, on the other hand, have been used as antimicrobial agents for centuries for the prevention and treatment of bacterial infections. In 2009, the National Health Service spent around £25 million on silver-containing dressings and it has been estimated that 15 metric tonnes of silver were incorporated into medical products worldwide in 2010 alone [4]. Silver cations permeate the microbial membranes, bind to DNA, proteins, and free thiol groups of cysteine residues. They also interfere with electron transport, and/or the membrane ion-exchange systems. Due to poor bioavailability, on the other hand, silver cations exhibit low toxicity to mammalian cells, increasing their appeal for clinical use as antimicrobial agents (for chronic wounds and burn infections) [5]. Moreover, the bacterial resistance to silver remains low due to the nonspecific nature of silver’s toxicity [5].
The conjugation of metals with drugs (CoMeDs) is a new research area for the discovery of new synergistic therapeutic modalities. CoMeDs combines two different agents, such as silver(I) with penicillin to create new agents with new properties from the superimposition of those initially possessed by the constituents [6,7,8,9,10,11,12]. Although the term “conjugate” is more properly used for polymer-drugs or dendrimer-drug conjugates where nanoparticles are formed, recently, the term CoMeD has also been used to emphasize the synergistic effect of the coordination of a metal with drugs [13,14]. Furthermore, the solvent type affects the structure of the metal-drug complexes, leading to the formation of polymeric structures by the metal–drug–solvent conjugation.
Aiming to develop new antibacterial CoMeDs with little to no bacterial resistance, a new silver(I) conjugate with penicillin G (PenH (Scheme 1)) [Ag(pen)(CH3OH)]]2 (PenAg) was synthesized. PenAg was characterized by a plethora of physical and spectroscopic techniques; in solid state: m.p., e.a., FT-IR, SEM-EDX, XRF, and XPRD; and in solution: FT-IR, UV–Vis, 1H NMR, and HRMS. The antibacterial agent PenAg was tested against Gram-positive Staphylococcus epidermidis and S. aureus and Gram-negative Pseudomonas aeruginosa (PAO1) bacteria by the means of minimum inhibitory concentration (MIC), minimum bactericidal concentration (MBC), and inhibition zone (IZ). The in vivo toxicity of PenAg was tested against Artemia salina.

2. Results

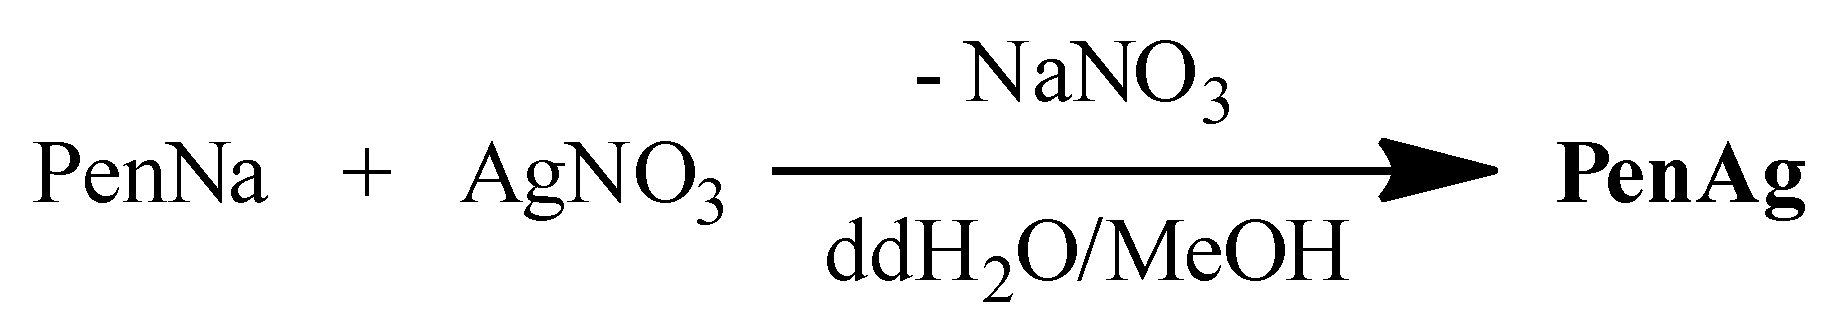
2.1. General Aspects

PenAg was obtained by reacting equimolar amounts of silver nitrate with PenNa in methanol/water solution (Scheme 2). The elemental analysis reveals that the content of PenAg in silver is (21.35 ± 2.33)%, while the calculated one for [Ag(pen)(CH3OH)]2 is 22.79%. Many attempts to growth crystals of PenAg from a variety of solvents and techniques were performed unsuccessfully. The complex is soluble in methanol, acetonitrile, acetone, dichloromethane, dimethylformamide, and dimethylsulfoxide.

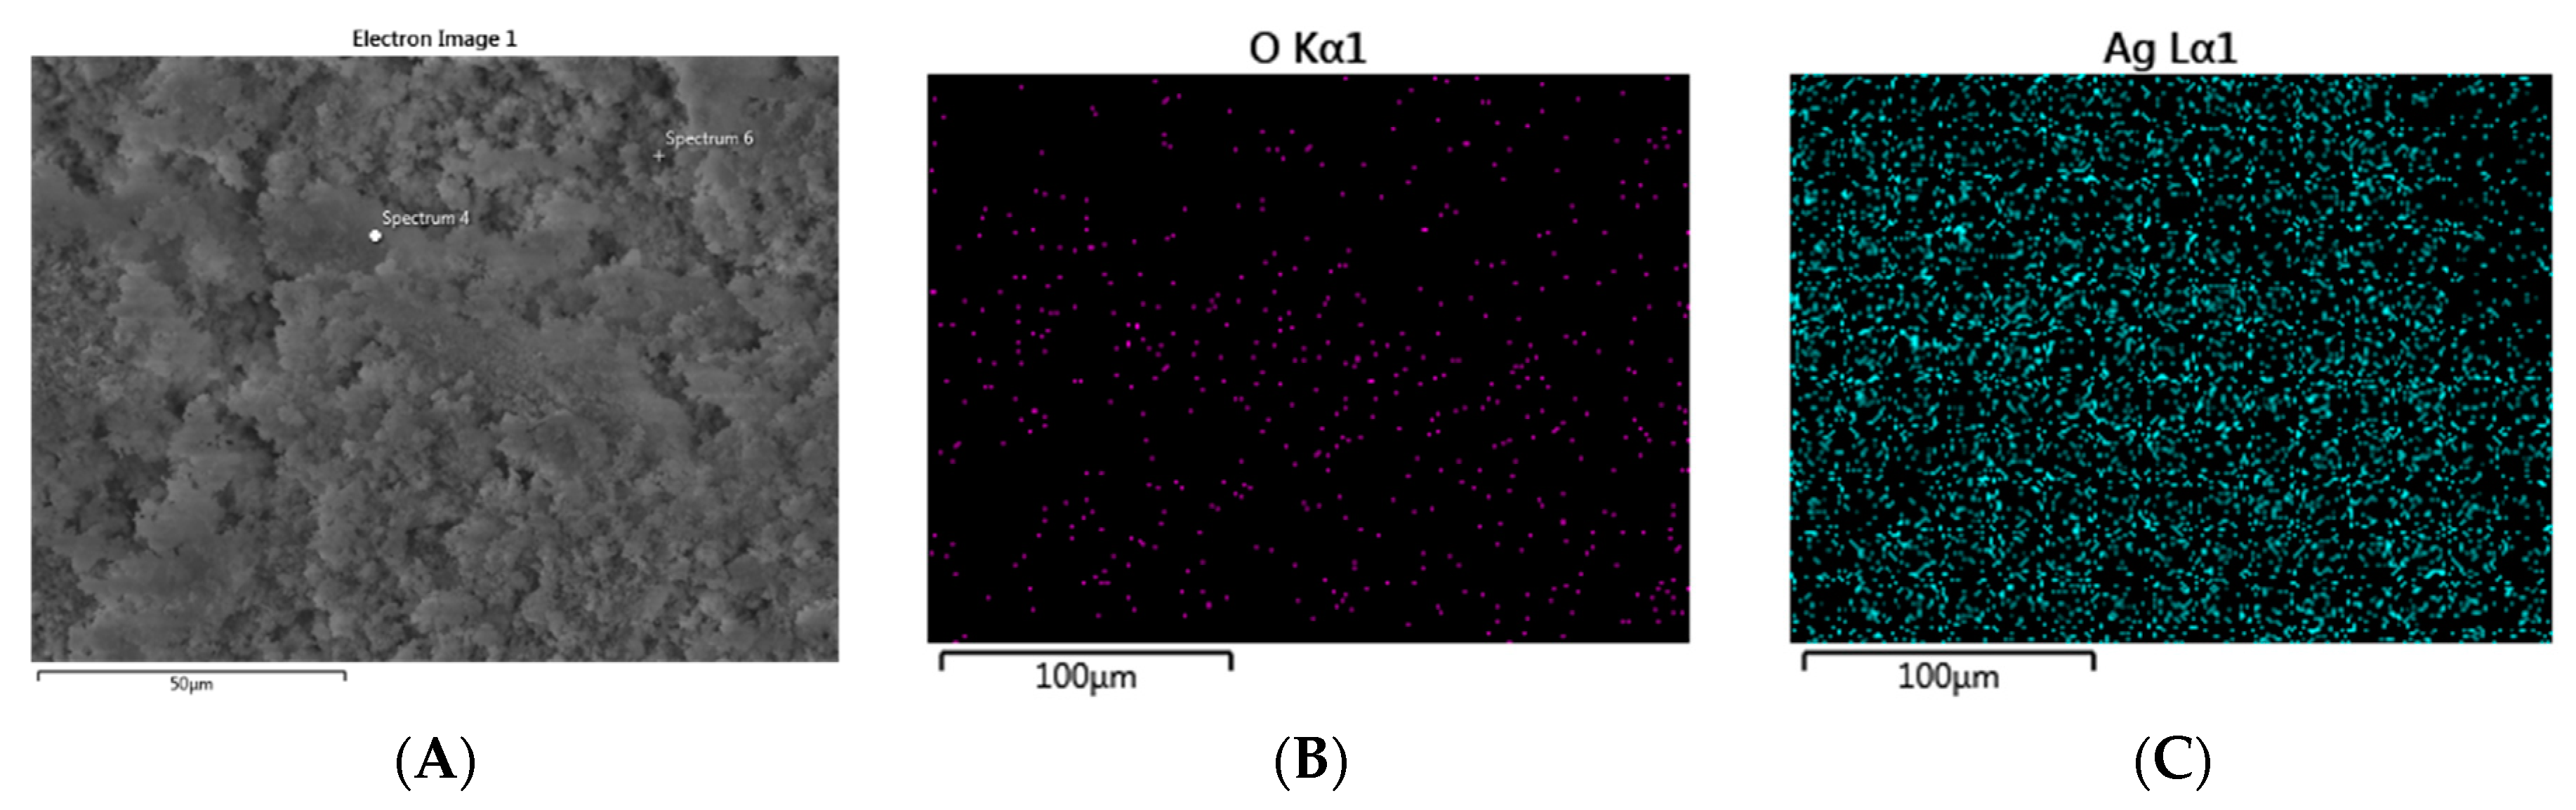
2.2. Characterization of PenAg in Solid State Studies

X-ray fluorescence spectroscopy: The XRF spectrum of PenAg powder confirms the presence of Ag, while the content of silver found was determined to be 19.0% ± 3.0% w/w. This is in accordance with the calculated one for the formula [Ag(pen)(CH3OH)]2 (22.79% w/w). The seeming discrepancy between the experimentally obtained Ag content and the calculated one is in the frame of the accuracy of the method. Moreover, the standard deviation in the silver analysis with XRF spectroscopy (±3.0% w/w), is within the calculated content in silver.
Scanning electron microscopy (SEM) and Energy-dispersive X-ray spectroscopy (EDX): The elemental analysis (% wt) of silver in PenAg was also confirmed by EDX measurements. EDX chemical map (Figure 1) shows that the relative contents of O and Ag in PenAg are 43.53% and 56.47% w/w. This corresponds to O/Ag molar ratio of 5/1, which is in agreement with the corresponding one of PenAg ([Ag(C16H17N2O4S)(CH3OH)]2).
Vibrational spectroscopy: The IR spectrum of PenNa shows vibration bands at 1621 and at 1418 cm−1, which are assigned at vas(-COO-) and vs(-COO-) of the carboxylic group (Figure S1) [15,16]. These bands are shifted in the case of PenAg, at 1611 and 1414 cm−1, respectively (Figure S1). Thus the Δv values of PenNa and PenAg are 204 cm−1 and 197 cm−1. Monodentate coordination of the carboxylic group results in a significantly higher difference values Δv than those observed for the ionic compounds of the ligand [17], while when the ligand chelates, the Δv is considerably smaller than that observed for its ionic compounds. For asymmetric bidentate coordination, the values are in the range of monodentate one [17]. When the -COO- group bridges metal ions, the Δv values are higher than that of the chelating mode and nearly the same as that observed for ionic compounds [17]. Since the Δv value of PenAg is nearly the same with the corresponding one of PenNa, a bridging coordination mode of the carboxylic group towards the Ag(I) is concluded [17]. The vibration band of 3370 cm−1 in the IR spectrum of PenAg corresponds to N–H, which was observed at 3354 cm−1 in the case of PenNa [15,16]. The vibration band of v(C=O) of the b-lactam at 1777 cm−1 is not shifted in the case of PenAg. However, the vibration band of the amide carboxyl group is shifted in PenAg at 1670 cm−1, from 1700 cm−1, where it is observed in the case of PenNa [15,16]. The IR spectrum of PenAg confirms the coordination of PenNa to silver(I) ion with a chelating mode.

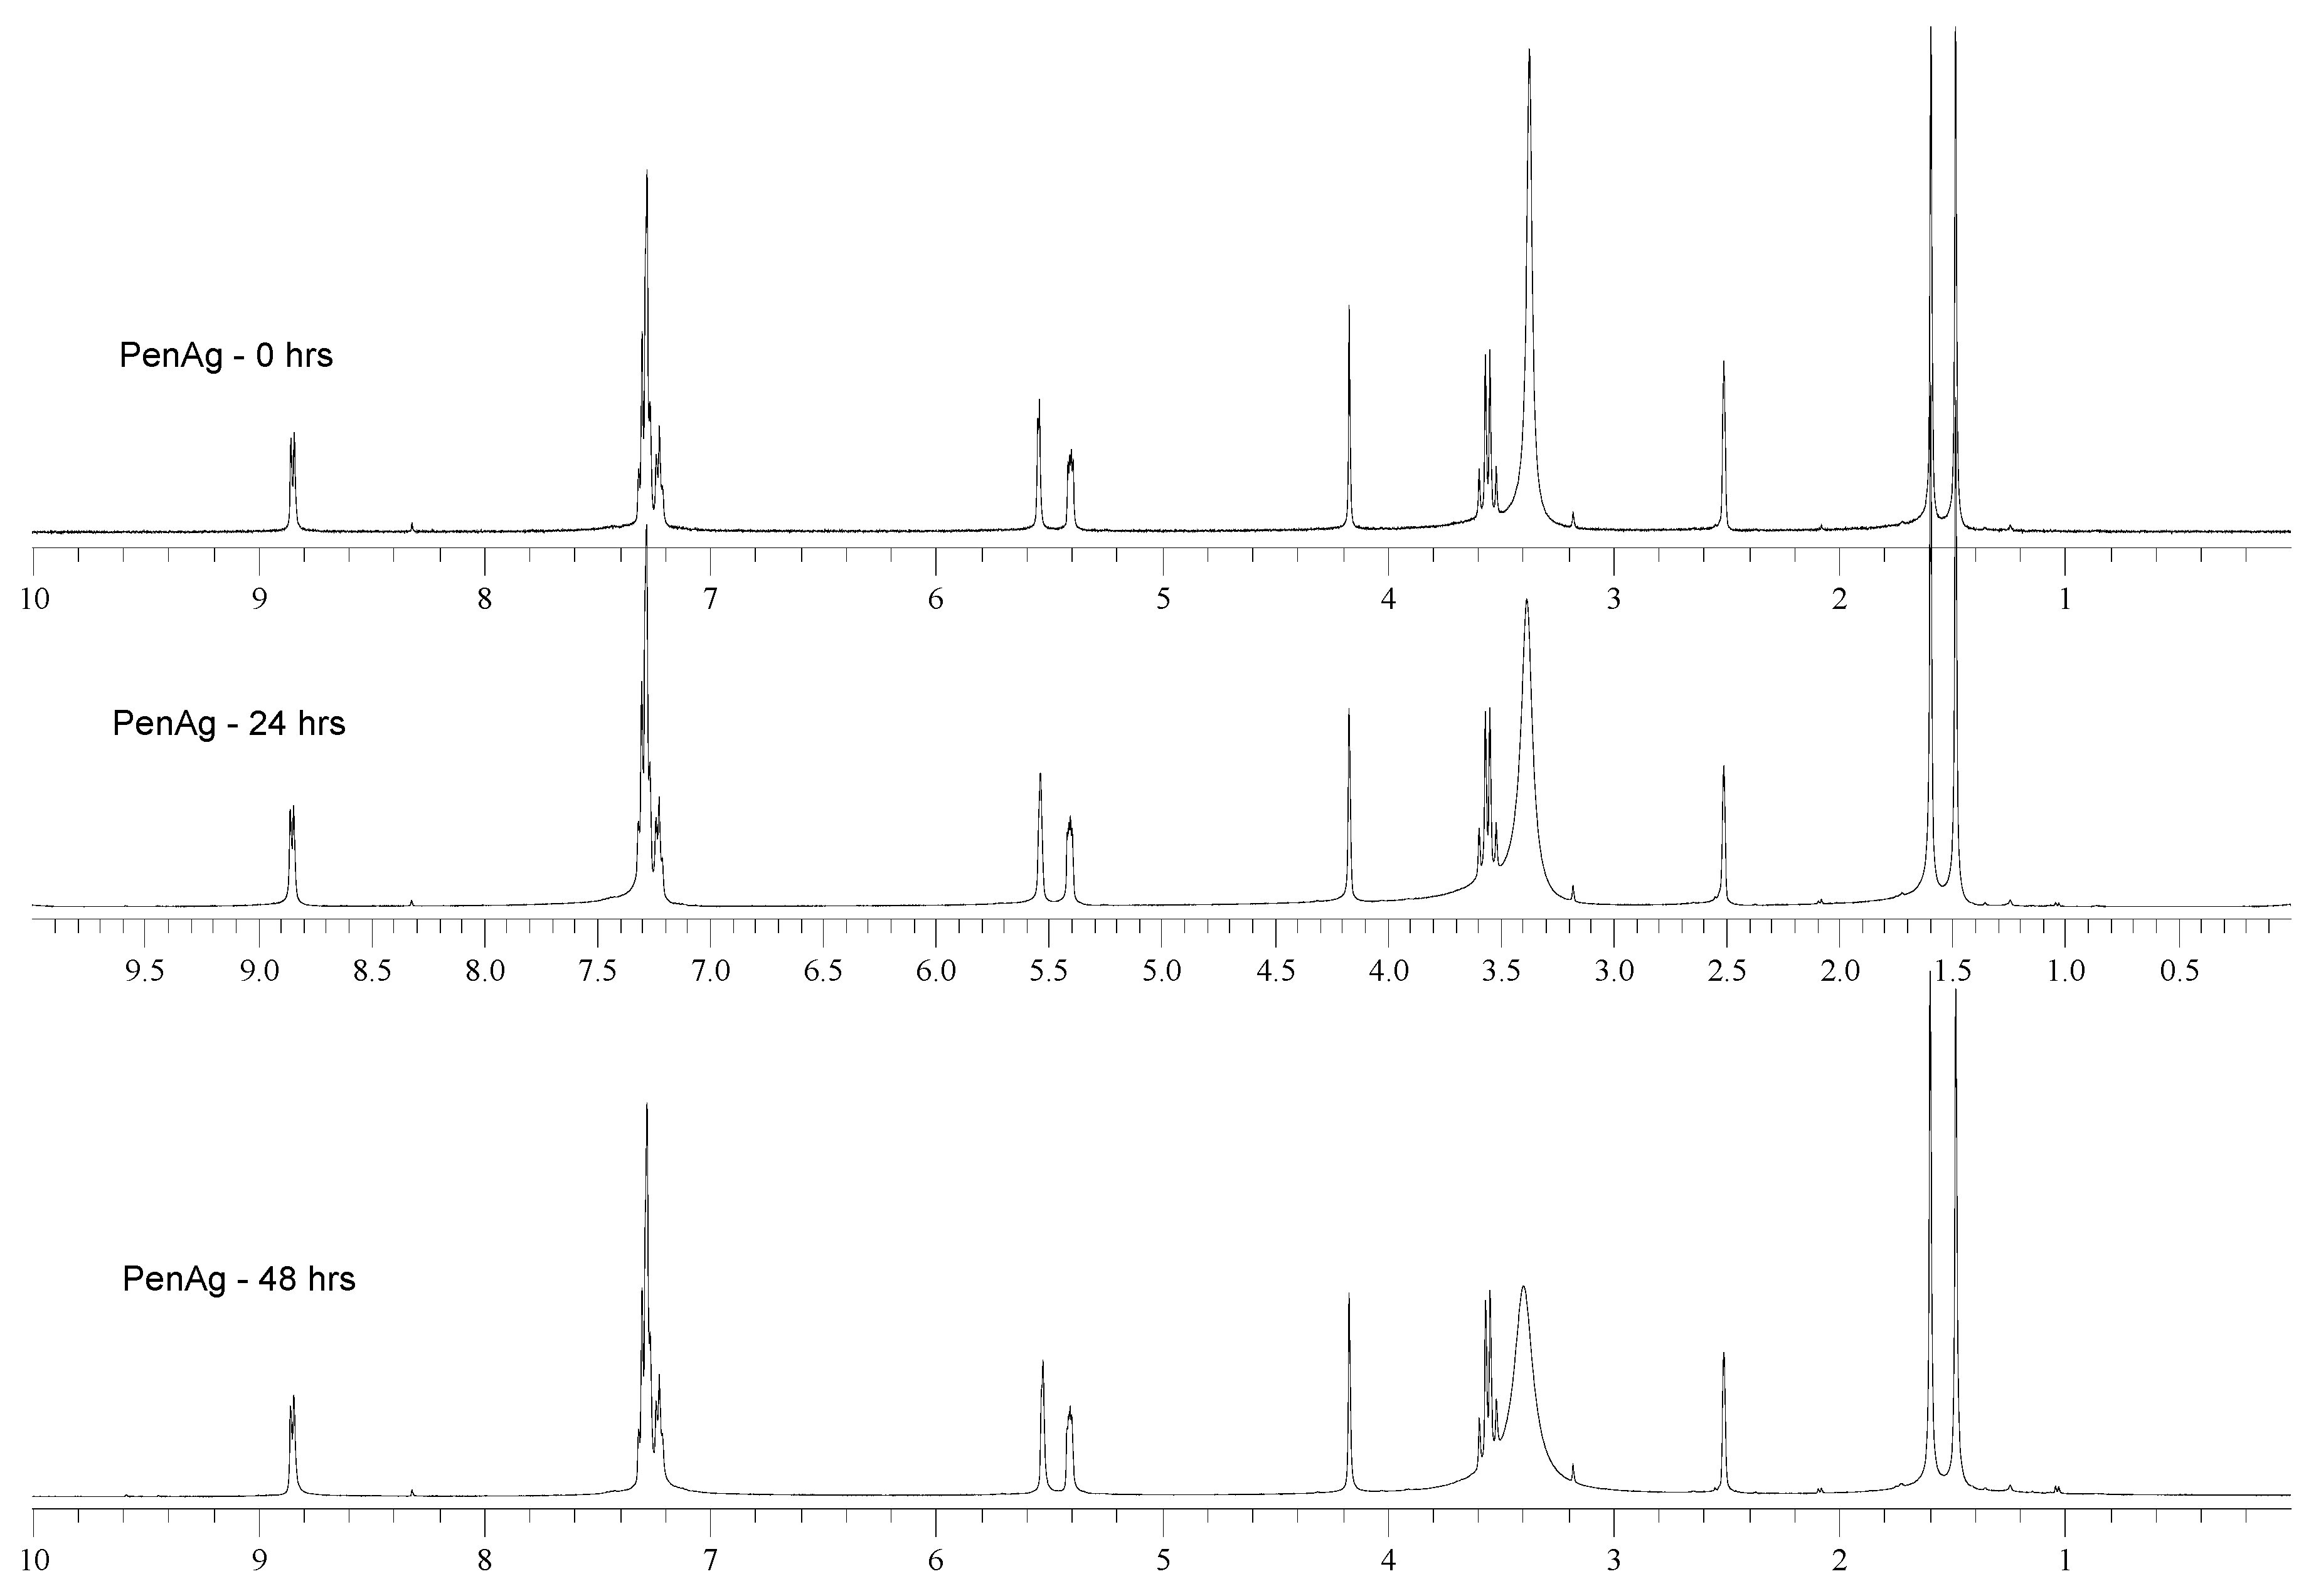
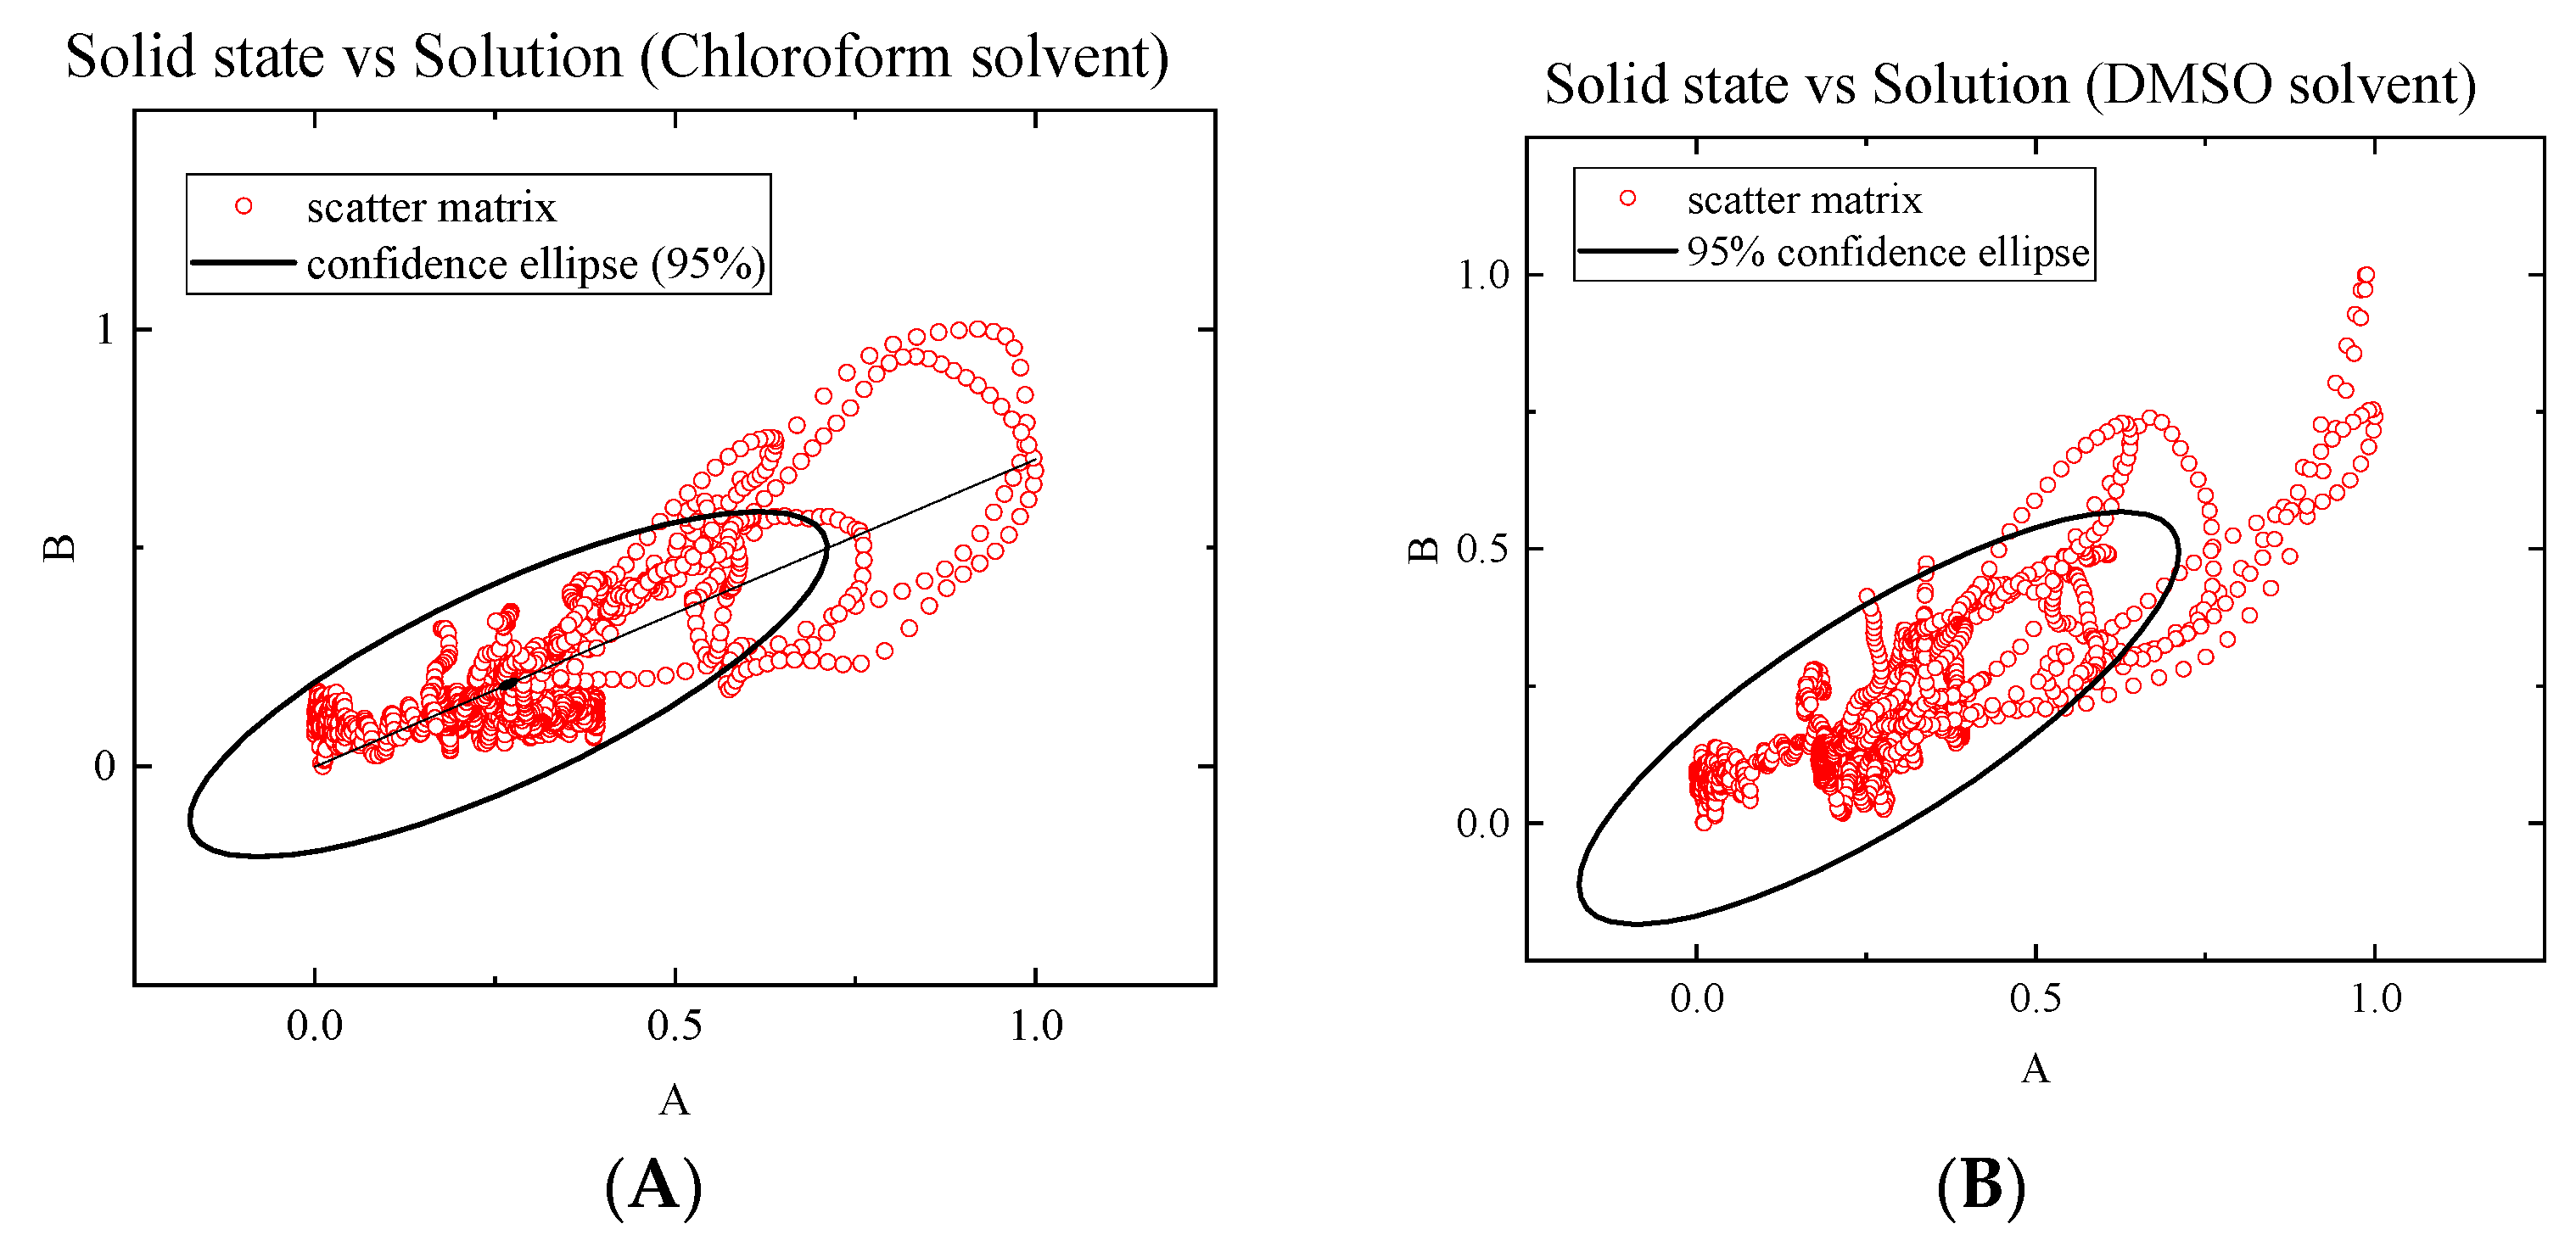
2.3. Solution Studies

Stability studies: The stability of PenAg was tested in DMSO-d6 solution, by 1H-NMR spectroscopy, for periods of 0, 24 and 48 h (Figure 2). No any variations were observed between the initial NMR spectrum and the corresponding ones after 24 and 48 h, suggesting the stability of PenAg in solution for 48 h, at least (Figure 2). The period of at least 48 h for the stability of the compound was chosen because the biological experiments require a maximum of 48 h of incubation of the microbes with the compound; DMSO was used for the dilution of PenAg in the stock solution (0.01 M) for the biological experiments.
Moreover, the UV–Vis spectrum PenAg in dd water is similar to the corresponding one recorded after 24 h, suggesting its stability (Figure S2).
Attenuated total reflection spectroscopy (FT-IR-ATR): in order to confirm the retention of the formula of PenAg in solutions, FT-IR-ATR spectra were recorded. This is an important tool to find out whether the activity is attributed to synergistic effect of the antibiotic and silver(I) or to the superimposition of the properties, of the ingredients of a mixture. Figure 3 shows the spectrum of the solid PenAg obtained with a KBr disc in transmittance mode. The spectra of pure DMSO and CHCl3 solvents have been measured and subtracted from the experimental spectra of solutions in order to estimate the excess spectral intensities attributed to the solute. The resulting spectra of the solutions for both solvents are also shown in Figure 3 for comparison. The spectra of the liquid and solid phases reveal characteristic resemblance in the fingerprint region, implying structural similarities. The high-frequency, broad spectral envelope observed in the spectrum of the solid corresponds to water traces originating from KBr. The missing spectral regions correspond to solvent interference regions/residuals after the subtraction procedure.
The Pearson product-moment correlation coefficients (PPMCC) have been utilized to quantitatively follow the linear correlation between the spectra corresponding to the solid and liquid sample presented in Figure 3. The results are presented in Table 1 revealing ≈79% and ≈81% correlations between solid/CHCl3-solution and solid/DMSO-solution, respectively.
The confidence ellipses for both sets, which include points of the scatter matrix with correlations higher than 95%, are shown in Figure 4. Every point of the scatter matrix corresponds to a specific point of the IR spectrum. Most of the points are inside confidence ellipses, indicating spectral similarities. Possible small frequency shifts and bandwidth increases observed in the spectra are due to strong interactions between solvent and solute molecules in solutions.
Generalized two-dimensional correlation spectroscopy: In general, the 2D correlation spectroscopy extents the spectral peaks over a second dimension obtaining a 2D correlation map, thereby permitting correlation analysis of the bands in order to investigate the intra and inter-molecular interactions [18]. In order to calculate the dynamic spectra, the first step is to subtract from the from the spectral intensity y(ν,t), the step-averaged reference spectrum y(ν). The second step is the calculation of the Y1(ω) and the conjugate transform Y2(ω) of the dynamic spectra, where ω corresponds to the Fourier frequency component of the step-dependent signal variation. Thus, the 2D correlation between the y(ν1,t) and y(ν2,t) is estimated from:
X ( ν 1 , ν 2 ) = Φ ( ν 1 , ν 2 ) + i · Ψ ( ν 1 , ν 2 ) .
In the last equation, Χ(ν12) and Φ(ν12) are the real and imaginary components of Χ(ν12) known as synchronous and asynchronous correlation spectra, respectively. The correlation between simultaneous varying spectral intensities is reflected in the synchronous representation. In asynchronous representation, the correlation maximizes when the intensity variations at two wavenumbers are orthogonal, indicating non-comparability of the spectral changes. All calculations described above are relatively complex and were performed by means of a home-made code written in GNU Octave [19]. We will restrict our analysis only in the synchronous 2-D correlation spectra, since no complementary information is obtained from the corresponding asynchronous spectra.
The purpose of this analysis is to establish the structural similarity between solid phase and solutions utilizing the 2-D correlation methodology. The synchronous correlation maps constructed from the vibrational spectra of solid and CHCl3/solution, of solid and DMSO/solution, and for the complete set of spectra, are presented in Figure 5. In all cases, the synchronous 2-D correlation color map reveals simultaneous or coincidental changes. The spectra are fully symmetrical with respect to the diagonal line, indicating almost complete spectral similarity, and thus, structural resemblance. The peaks observed in the diagonal line are called auto-peaks, and are positive, as expected. The observed off-diagonal peaks, known as cross-peaks, represent the synchronicity of the spectral variations between the two spectral coordinates, and their intensities are positive or negative. The cross-peak intensity becomes negative in case where one of the spectral intensities is increasing, while the other one is decreasing. The peak resolution of 2-D infrared correlation spectra is substantially enhanced by spreading the strongly overlapping peaks along the second dimension, allowing a deeper understanding of the structure.
1H NMR studies in DMSO-d6 using 400 MHz NMR apparatus: The 1H-NMR spectrum of PenNa in DMSO-d6 shows a distinct resonance signal for the H[N] (Scheme 1) at 8.73 (br) ppm which is shifted at 8.84 (br) ppm upon coordination of Pen to Ag(I) in PenAg (Figure S3) [20,21]. The resonance signals in the spectrum of PenNa at 7.30 and 7.22 (m) ppm, were assigned to the aromatic protons of the benzyl group of penicillin G and they were observed without shift in the case of the spectrum of PenAg (7.32 and 7.22 (m) ppm). The signals at 5.35 and 5.34 (m) are attributable to H[C9] and H[C8] respectively (Scheme 1) and they shifted to 5.54 (s) and 5.40 (s) ppm respectively [20,21]. The signal at 3.89 (s) ppm in the spectrum of PenNa was assigned to the H[C13], (Scheme 1) but was observed at 4.17 (s) ppm in the corresponding one of PenAg [20,21]. The strong downfield shift of this proton confirms the coordination of penicillin on silver(I) ion. The resonance signals in the spectrum of PenNa at 3.58 and 3.49 (q) ppm were attributed to the H[C5] protons (Scheme 1), which undergo no shift in PenAg (3.59 and 3.52 (q) ppm). This suggests that there is no involvement of the amide carbonyl group in the coordination of PenNa towards silver(I). The resonance signal at 3.18 ppm which was observed only in the spectrum of PenAg, was attributed to coordinated methanol, suggesting the presences of methanol in the coordination sphere of Ag(I) (Figure S3). The two singlet signals at 1.59 and 1.46 (s) ppm in the spectrum of PenNa were assigned to the H[C11,12], but they undergo no shift in PenAg (1.59 and 1.48 (s) ppm respectively) (Figure S3).
Structure of PenAg by NMR spectroscopy with 500MHz LC-NMR instrumentation: An NMR study of PenNa has been previously reported [22,23]. Herein the binding mode of PenNa at PenAg is reported. Two deuterated solvents, DMSO-d6 and MeOD-d4 were used for the study of both PenNa and PenAg. In order to study hydrogen bonding of the amide proton in PenNa, the temperature coefficient was determined in DMSO-d6 solvent. For a range of 293–313 K, the temperature coefficient of the amide proton (H7) was determined to be −8.9 ppb/K. It is generally accepted that temperature coefficients with values higher than −4.5 ppm/K are strongly indicative of intramolecular H-bonds, whereas lower values suggest strong interactions with solvent [23,24,25]. Moreover, Δδ/ΔT values in at about −7.5 ppb/K indicate weakly hydrogen bonded amide protons [26]. Moreover, as recently reported for hydrogen bond motif “C5” geometry [27], the amide proton might participate in such a “C5” geometry favoring intramolecular hydrogen bonding. Nevertheless, the strong interaction of the amide proton with DMSO-d6, stronger than in MeOD-d4, seems to be the dominating interaction. The amide proton of PenNa in DMSO-d6 resonates at 8.709 ppm, indicating a hydrogen bonded state, in contrast to MeOD-d4, for which the signal is observed at 8.141 ppm (Δδ(DMSO-d6−MeOD-d4) = 0.57 ppm). The reported possible intramolecular hydrogen bond behavior could explain the partial and not full deuterium exchange of the amide proton in MeOD-d4 solvent (the integral of H7 is 0.3 in MeOD-d4 instead of 1.0 in DMSO-d6).
Assignment of the PenAg NMR spectrum: Figure 6 shows the Δδ between PenNa and PenAg in DMSO-d6 and in MeOD-d4. Since the chemical shifts of the PenNa are concentration dependent, similar concentration levels were studied.
The protons that mostly are affected are H13, H9 and H8, with the H13 (Scheme 1) being strongly deshielded, and H9 and H8 (Scheme 1) being less deshielded. In DMSO-d6 the deshielding of the above protons is observed and the Δδ values of PenAg compared to PenNa for the H13, H9 and H8 protons (Scheme 1) are 0.25, 0.12 and 0.08 ppm, respectively. In MeOD-d4, the Δδ values of PenAg compared to PenNa resonances are 0.16, 0.02 and 0.07 ppm, respectively. As shown, H13 proton is strongly deshielded either in MeOD-d4 or in DMSO-d6, followed by strong deshielding of H9 and H8 protons in DMSO-d6, whereas the opposite is true in MeOD-d4. The H12 and H11 protons are less deshielded and the H5 protons are also affected, whereas the protons of the aromatic ring are not. Following these data, a stronger deshielding is observed when DMSO-d6 is used, probably due to the type of complexation. As shown in Figure 6, methanol molecules also coordinate to Ag(I), upon its coordination resulting the less intense deshielding effect.
An important difference when the two solvents are used for the current study, is that the H7 amide proton is strongly deshielded (Δδ[(PenNa-PenAg] = 0.12 ppm) in DMSO-d6, whereas in MeOD-d4 the H7 amide proton is not observed for the PenAg. Therefore, there is a crucial difference for the PenAg when it is studied in two different solvents.
In a hydrogen bonding accepting solvent, such as dimethylsulfoxide, a strong interaction of the solvent with the amide proton exists, and hydrogen bonds are present in the structure of the molecule. The coordination of Ag(I) to the carboxyl moiety of penicillin results in the deshielding the H13 proton. Moreover, it seems that Ag(I) also interacts with sulfur in the thietane ring, thereby affecting (deshielding) H9 and H8 protons. Since a stronger hydrogen amide bond is observed on the PenAg complex, the intramolecular ‘C5′ type hydrogen bond could be more favored, probably due to conformational/structural changes, most likely on an angle between the N–H proton and C=O group upon the coordination of Ag(I) in the molecule.
On the contrary, when MeOD-d4 was used for the study of the PenAg, a similar behavior for H13 is observed, indicating the coordination of the Ag(I) to the carboxylic moiety. Furthermore, H7 amide proton was not observed due to deuterium exchange of the amide proton in MeOD-d4 solvent. Following the above, a shifting (deshielding) of the H8 (Δδ = 0.07) and H9 protons (Δδ = 0.02 ppm) is observed. It should be noted that broad peaks are observed for the H8 and H9 protons (Δv1/2 ≈ 15 and 10 Hz, respectively), due to the rapidly isomerizing of the structure. Moreover, after the exchange of the H7 amide proton by deuterium in MeOD-d4, the H8 proton is more deshielded compared to the H9 proton. Additionally, since the Δδ of the H9 proton is 0.02 ppm, no coordination of Ag(I) to sulfur atom at the thietane ring could be concluded. The absence of the H7 proton amide proton due the deuterium exchange is confirmed, since in PenNa, ≈0.7 presentence of the molecule does not exchange with the deuterium present in MeOD-d4.
Assignment of the PenNa NMR spectrum: It should be noted that a specific geometry appearing on the DMSO-d6 solvent is observable. More specificly, H8 proton resonates at 5.331 ppm and its multiplicity is dd with J values of 9.8 and 4.0 Hz. This is due to the anti-coupling to H7 (it is in the range of 8 to 10 Hz) and to the gauss-coupling to H9 (expected less than 5 Hz). On the contrary, in the MeOD-d4 solvent, one broad peak for the H8 and H9 protons is seen due to the fast time scale of the phenomenon. 1H-13C HSQC experimentation reveals the two resonances for the H9 and H8 protons. Moreover, upon the NMR study of the PenAg in DMSO-d6, the H12 proton is more affected, possibly due to its proximity to the carboxylic carbon, which is in close proximity to the metal coordination.
The concentration dependence of the PenNa chemical shifts using DMSO-d6 solvent: The concentration dependence of the geminal proton resonances in D2O has been previously reported [22]. Herein we report our study for the dimethylsulfoxide solvent. For the PenNa concentration levels of 1.0, 2.0, and 4.0 mg mL−1 in DMSO-d6, a linear dependence of the chemical shifts for the H8, H9, H11, H12, and H7 protons was observed, whereas a plateau was reached for H13. The Δδ values for 4.0 and 2.0 mg mL−1 were shifted downfield: 0.022 for H7, 0.015 for H9, 0.014 for H8, and 0.007 for H11 and H12 protons. On the contrary, no concentration dependence was observed for the aromatic and the H5 protons. Earlier reports [28] have shown that changes in chemical shift upon concentration variation occur due to aromatic solvent induced shifts, or due to simple dimerization or conventional π–π stacking of solute molecules or molecular aggregation, leading to differently packed supramolecular assemblies or due to formation of intermolecular associations [29].
In order to study the phenomenon, DOSY spectroscopy was used. Diffusion values were measured for the above concentration levels—3.27 × 10⁻¹⁰, 2.96 × 10⁻¹⁰, and 2.26 × 10⁻¹⁰ m2 s−1, respectively. Thus, upon increase of the PenNa concentration, bigger clusters are created, leading to smaller diffusion values. Since the diffusion value depends on the hydrodynamic radius of the molecule (1/r6), the increase of the concentration results in the formation of (micellar) solutions, probably through intermolecular associations.
In conclusion, based the NMR study of the PenNa and PenAg in two selected solvents, between a hydrogen bonding accepting solvent (DMSO-d6) and a hydrogen bond solvent (MeOD-d4), crucial differences are revealed. Firstly, Ag(I) coordinates with PenNa through the carboxylic group. There is a crucial difference for the PenAg when studied in the two selected solvents. In the hydrogen bonding accepting solvent, a strong interaction of solvent to amide proton exists and hydrogen bonds are present in the structure of the molecule. On the contrary, when MeOD-d4 is used, the H7 amide proton is not observed, probably due to its exchange by deuterium. Secondly, there is a concentration dependence of the chemical shift to the concentration level due to several reasons, such as molecular aggregation or formation of intermolecular associations. The results were also supported by the DOSY spectroscopy of the bigger cluster being present upon increase of the PenNa concentration.
Atomic absorption (AA): In order to confirm the formula of PenAg, graphite furnace atomic absorption spectroscopy (GFAAS) was employed. The mass of the silver is 22.67% w/w, which is in agreement with the calculated one of [Ag(pen)(CH3OH)]2 (22.79% w/w).
Proposed structure of PenAg: The following structure of PenAg (Figure 7) is proposed based on the elemental analysis, XRF, SEM-EDX, FT-IR, 1H NMR spectroscopy, HRMS, and AA. The strength of the hydrogen bond H[N]· ··O[solvent] with a hydrogen bonding accepting solvent (DMSO) and a hydrogen bond solvent (MeOD-d4) affect the stability of the supramolecular architecture.

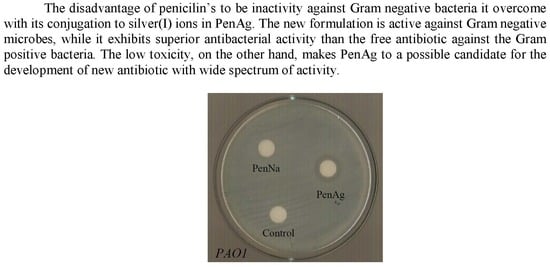
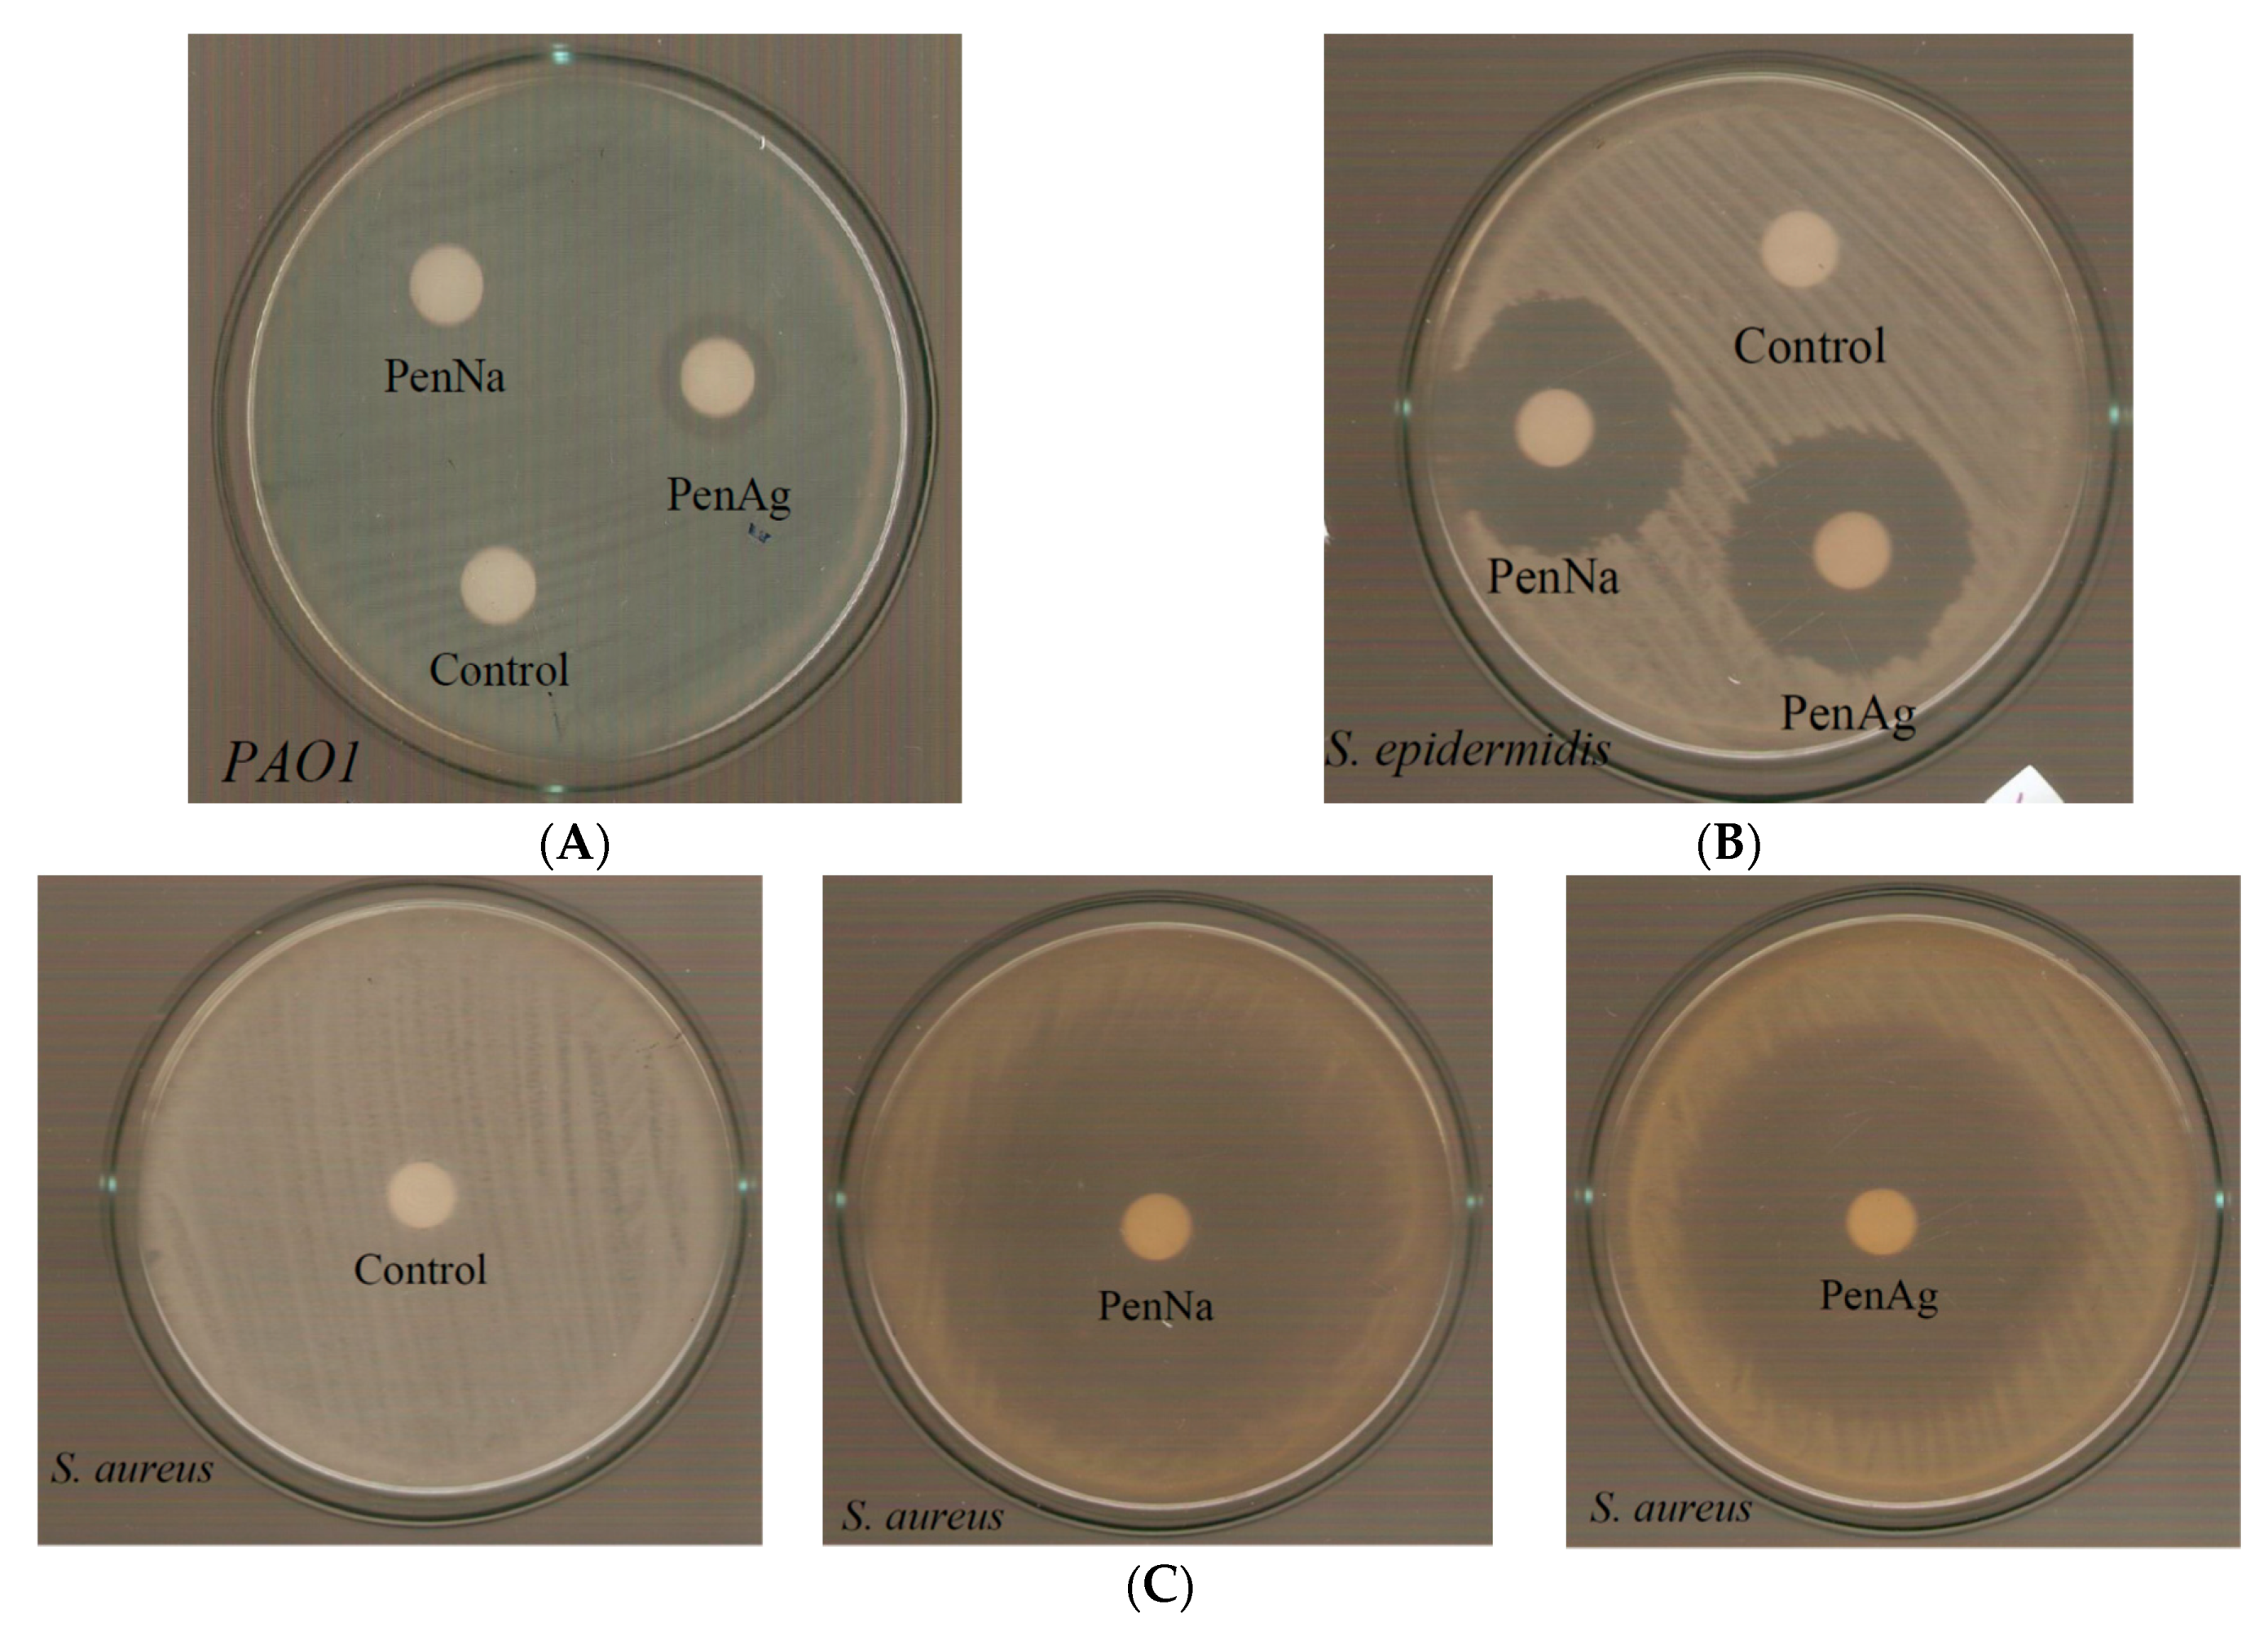
2.4. Antibacterial Studies

Table 2 compares the MIC, MBC, and IZ of PenAg, PenNa with the corresponding ones of other CoMeD’s derived from silver(I) or zinc(II) ions with ciprofloxacin (an antibiotic), salicylic acid or citric acid (natural products), and 2-mercapto-nicotinic acid (an antimetabolite) against P. aeruginosa, S. epidermidis and S. aureus.
The effects of PenAg and PenNa on the growth of microbial strains: The antimicrobial potencies of PenAg and PenNa were tested against Gram negative (P. aeruginosa) and Gram positive (S. epidermidis and S. aureus) bacterial strains by the means of MIC. MIC is defined as the lowest concentration needed for the inhibition of the bacterial growth [30]. The MIC value of PenAg towards the Gram negative, P. aeruginosa bacteria is 23.00 ± 2.29 μΜ, in contrast to the corresponding one of PenNa, which is higher than 2000 μΜ (Table 2). The MIC values of PenAg and PenNa, on the other hand, against S. epidermidis, are 2.41 ± 0.88 and 3.76 ± 1.14 μΜ, respectively, and against S. aureus are 0.08 ± 0.02 and 0.14 ± 0.02 μΜ, respectively (Table 2). Thus, PenAg shows superior antibacterial effects over PenNa towards the Gram positive bacteria (S. epidermidis and S. aureus) and expanded activity into Gram negative microbes, such as P. aeruginosa, where PenNa is inactive.
Evaluation of the minimum bactericidal concentration (MBC): The MBC is defined as the lowest concentration of an antibacterial agent that can eliminate the 99.9% of the bacterial inoculum [31]. The MBC value of PenAg towards P. aeruginosa is 46.6 μΜ, (Figure S4). On the contrary, no MBC value against P. aeruginosa could be determined for PenNa when it was tested at concentrations up to 2000 μΜ, following the general inactivity of penicillins against Gram negative microbes.
Determination of the inhibition zone (IZ) through the agar disk-diffusion method: The agar disk-diffusion method was used in order to survey the sensitivity of the microorganism to PenAg [32]. The diameter of inhibition zones of bacterial growth which were caused by PenAg or PenNa at the dose of 1 mg/mL against P. aeruginosa, S. epidermidis, and S. aureus, were measured after 20 h (Table 2, Figure 8). Although both PenAg and PenNa inhibit the growth of the Gram positive bacteria equally (S. epidermidis and S. aureus, Table 2), this is not the case with the Gram negative one (P. aeruginosa), for which the activity of PenAg is superior to that of PenNa. This confirms the conclusion withdrawn above (see MIC) that the conjugation of silver ions with penicillin expands the activity of PenNa to Gram negative microbes such as P. aeruginosa, against which the free penicillin is inactive. Moreover this conjugation of silver with penicillin enhances its activity against Gram negative microbes, such as S. epidermidis and S. aureus.
Among CoMeD’s derived from the conjugation of silver(I) or zinc(II) ions with biologically active molecules, such as ciprofloxacin (an antibiotic), salicylic acid, or citric acid (natural products), CIPAG exhibits the highest activity against both positive and negative bacteria, with a range of MIC values between 0.46 and 0.61 μΜ (Table 2) and IZ values of 28–34 mm. However, PenAg shows the highest antibacterial activity against S. aureus, an MIC value of 0.08 ± 0.02 μΜ, and a IZ of 57 mm. Therefore, it is concluded that the conjugation of metal ions with drugs make bacteria more susceptible to antibiotic or agents, while it creates new chemotherapeutics for drug-resistant infections.

2.5. In Vivo Toxicity Evaluation, by Brine Shrimp Artemia Salina

The in vivo toxicity of the PenAg has been performed using brine shrimp Artemia salina assay. The brine shrimp Artemia salina lethality test is a preliminary toxicity test, useful for predicting biological activities such as cytotoxic, phototoxic, and pesticidal activities [33]. Thus, pharmacological activities of bioactive compounds can be evaluated with a brine shrimp lethality bioassay [34]. This is due to its widespread distribution, short life cycle, non-selective grazing, and sensitivity to toxic substances [35,36].
The survival (%) of Artemia salina larvae in increasing concentrations of solutions with or without PenAg after 24 h are summarized in Table S1. The lethality was noted in terms of deaths of larvae. No mortality rate of brine shrimp larvae was found upon their incubation with PenAg in concentrations up to 220 μM (Table S1). This lethal concentration of PenAg is 10, 100 and 2750-fold higher than its MIC values against P. aeruginosa, S. epidermidis, or S. aureus respectively, suggesting a wide therapeutic window and thereby low toxicity.

3. Conclusions

Penicillins, especially penicillin G, are among the first line of antimicrobial agents currently in use for the treatment of intra-hospital infections [2]. However penicillins suffer from inactivity against Gram negative bacteria [1]. In order to overcome this disadvantage, the conjugation of penicillin with silver(I) ions was performed. State of the art, analytical, and spectroscopic techniques revealed the CoMeD formula [Ag(pen)(CH3OH)]n (PenAg). NMR studies reveal that silver(I) coordinates with PenH through the carboxylic group.
The antibacterial studies show that PenAg is active against Gram negative (P. aeruginosa), contrary to penicillin itself, which is inactive. Silver(I) ions, on the other hand, show bacteriocidal activity against Gram negative (P. aeruginosa) [8,9]. Moreover, PenAg exhibits superior antibacterial activity to the free antibiotic against the Gram positive bacteria (S. epidermidis and S. aureus). Thus, a synergy in silver(I) and penicillin G properties is achieved by their conjugation within PenAg. This is in agreement with the observation of Morones-Ramirez et.al [37] that silver(I) ions exhibit an antimicrobial synergistic effect against Gram negative bacteria, when used in combination with beta-lactams, aminoglycosides, and quinolones [37]. This effect is attributed to the permeabilization of the outer membranes of Gram negative bacteria by silver(I) ions, suspending the existing drugs neutralization. The lethal concentration which is exhibited by PenAg, on the other hand, is multiple times its MIC values (up to 2750-fold higher) against all microbial strains used, making PenAg a possible candidate towards the development of a new antibiotic with a wide spectrum of activity, giving a new life to penicillin.

4. Materials and Methods

Materials and instruments: All solvents used were of reagent grade. Tryptone and soy peptone were purchased from Biolife. Agar was purchased from Sigma-Aldrich. Sodium chloride, D(+)-glucose, and di-potassium hydrogen phosphate trihydrate were purchased from Merck. Melting points were measured in open tubes with a Stuart Scientific apparatus and are uncorrected. FT-IR spectra in the region of 4000–370 cm−1 were obtained from KBr discs, with a Perkin–Elmer Spectrum GX FT-IR spectrophotometer. The 1H-NMR spectra were recorded on a Bruker AC 400 MHz FT-NMR instrument in DMSO-d6 solution. A UV-1600 PC series spectrophotometer of VWR was used to obtain electronic absorption spectra. XRF measurements were carried out using an Am-241 radio isotopic source (exciting radiation 59.5 keV). Brine shrimp eggs (Artemia salina) were purchased from Ocean Nutrition.
Synthesis of [Ag(Pen)(CH3OH)]nPenAg: A dd water solution of silver nitrate (0.5 mmol, 0.085 g) was added to a methanolic solution of benzyl-penicillin sodium (PenNa) (0.5 mmol, 0.178 g) and the resulting suspension was stirred for 5 min. The white precipitation was filtered off and it was successively washed with 4 mL of cold methanol/water solution (1:1) and 2 mL of acetone.
PenAg: Yield 67%; melting point: 124–127 °C. Elemental analysis found: C: 43.64%; H: 4.26%; N: 5.70%; S: 6.93%; Ag: (21.35 ± 2.33)% Calculated for C34H42Ag2O10N4S2, C: 43.15%; H: 4.47%; N: 5.92%; S: 6.77%; Ag: 22.79%;. IR (cm−1), (KBr): 2964 m, 1774 vs, 1752 m, 1670 s, 1612 vs, 1492 s, 1396 s, 1384 s, 1335 s, 1316 m, 1249 m, 1211 w, 1098 w, 760 w, 719 m, 698 w, 664 w; 1H NMR (ppm) in DMSO-d6: 8.84 (br, H[N]), 7.32–7.22 (m, protons of the benzyl group of penicillin G), 5.54 (s, H[C4a]), 5.40 (s, H[C5]), 3.89 (s H[C3]), 3.59–3.52 (q, H[PhC]), 1.59–1.48 (s, H[Mea,b]), UV–Vis (MeOH): λ = 213 nm (logε = 4.02)
Elemental analysis of silver: The content of PenAg in silver was determined as silver chloride. A known quantity of PenAg was dissolved in 1 mL of extra pure nitric acid. The resulting solution was heated to 150 °C in oil bath for 2 h. The clear solution was then diluted to 15 mL using dd water, followed by addition of 5 mL saturated solution of NaCl. The white precipitation of AgCl was filtered off and dried in an oven overnight. The dry solid was weighted to give the silver content of PenAg.
NMR analysis: The solution was transferred into a 5 mm NMR tube. NMR experiments were performed on a Bruker AV500 spectrometer (Bruker Biospin, Rheinstetten, Germany) at 298 K using the Topsin 2.1 suite. All 1D 1H NMR spectra were collected using a 30° flip angle, a spectral width of 14 ppm with the same receiver gain value, a relaxation delay of 5 s, a number of transients of 512, and an acquisition time of 4.3 s. Sixty-four thousand data points were collected and the free induction decay (FIDs) were treated using a line broadening exponential function of 0.3 Hz. Phase adjustment and baseline correction was carried out using Topspin 2.1 suite. Signal integration was manually performed.
2D 1H-1H TOCSY, 1H-13C HSQC, and 1H-13C HMBC NMR experiments were recorded using standard Bruker software. DOSY experiments were performed using the bipolar pulse longitudinal eddy current delay (BPPLED). For a specific diffusion time (∆) the magnetic field pulse gradient (δ) was optimized in order to obtain a 1%–5% residual signal with the maximum gradient strength. Typically, 100 and 3.0 ms were used for ∆ and δ, respectively. 16 BPPLED spectra on 16 K data points were collected and the eddy current delay (Te) was set to 5 ms. The pulse gradient was increased from 2% to 95% of the maximum gradient strength using a linear ramp. The temperature was set to 298 K with an air flow of 615 L h−1 in order to minimize convection effects and to maintain temperature stability due to sample heating during the magnetic field gradient. After Fourier transformation and baseline correction, the diffusion dimension was treated with the Topspin 2.1 suite.
NMR assignment:
PenNa:1H-NMR (in DMSO-d6, 500.13 MHz)
δ = 1.469 (s, 3H, H11), 1.593 (s, 3H, H12), 3.590 (d, 2J = 13.95 Hz, 1H, H5a), 3.541 (d, 2J = 13.95 Hz, 1H, H5b), 3.872 (s, 1H, H13), 5.331 (dd, J = 7.1, 3.9 Hz, 1H, H8), 5.339 (d, 3J = 3.9 Hz, 1H, H9), 8.709 (d, 3J = 7.1 Hz, 1H, H7), 7.250 (t, J = 7.0 Hz, 1H, H1), 7.293 (d, J = 7.0 Hz, 2H, H3&H3′), 7.327 (t, J = 7.0 Hz, 2H, H2, and H2′).
PenNa:1H-NMR (in MeOD-d4, 500.13 MHz)
δ = 1.577 (s, 3H, H11), 1.658 (s, 3H, H12) 3.597 (d, 2J = 14.50 Hz, 1H, H5a), 3.646 (d, 2J = 14.50 Hz, 1H, H5b), 4.208 (s, 1H, H13), 5.498 (b, 1H, H8), 5.492 (b, 1H, H9), 8.141 (s, 0.2H, H7), 7.272 (m, 1H, H1), 7.327 (m, 2H, H3 and H3′), 7.334 (m, 2H, H2 and H2′).
PenNa:1H-13C NMR (in MeOD-d4, 500.13 MHz)
Δ = 27.88 (C11), 31.89 (C12), 43.41 (C5), 75.07 (C13), 69.24 (C8), 58.55 (C9), 128.00 (C1), 130.51 (C3), 131.38 (C2).
PenAg:1H-NMR (in DMSO-d6, 500.13 MHz)
δ = 1.500 (s, 3H, H11), 1.629 (s, 3H, H12) 3.599 (d, 2J = 13.95 Hz, 1H, H5a), 3.549 (d, 2J = 13.95 Hz, 1H, H5b), 4.122 (s, 1H, H13), 5.415 (dd, J = 7.6, 3.9 Hz, 1H, H8), 5.460 (d, 3J = 3.9 Hz, 1H, H9), 8.831 (d, 3J = 7.6 Hz, 1H, H7), 7.253 (t, J = 7.1 Hz, 1H, H1), 7.295 (d, J = 6.7 Hz, 2H, H3 and H3′), 7.330 (t, J = 7.2 Hz, 2H, H2 and H2′).
PenAg:1H-NMR (in MeOD-d4, 500.13 MHz)
δ = 1.574 (s, 3H, H11), 1.666 (s, 3H, H12), 3.607 (d, 2J = 14.50 Hz, 1H, H5a), 3.655 (d, 2J= 14.50 Hz, 1H, H5b), 4.364 (s, 1H, H13), 5.520 (dd, J= 7.1, 3.9 Hz, 1H, H8), 5.558 (d, 3J= 3.9 Hz, 1H, H9), 7.274 (m, 1H, H1), 7.330 (m, 2H, H3 and H3′), 7.338 (m, 2H, H2 and H2′).
Atomic absorption: Solutions of known amounts of PenAg were dissolved in 500 μL ultra pure nitric acid. The detection of silver mass in the sample was performed with a graphite furnace atomic absorption spectrophotometer (GFAAS).
ATR-FTIR: A mid-IR FTIR spectrometer by Bruker (Alpha model) equipped with an ATR accessory (ZnSe crystal, single reflection, incident angle 45°) was used to collect the absorption spectra of liquids at room temperature and pressure bearing a DTGS detector. In order to obtain a sufficient signal-to-noise, 32 scans with a nominal resolution of 2 cm−1 were averaged. After each measurement, the crystal surface was carefully cleaned with spectroscopic grade isopropanol. The Fourier-transform infrared (FTIR) spectra of solids were measured in KBr pellets in transmittance mode under same spectral conditions. A background spectrum was recorded prior to any FTIR and ATR measurement using the atmospheric vapor correction. All spectra have been vector normalized for comparison reasons.
Bacterial strains: For the antibacterial experiments the strain of Staphylococcus epidermidis (ATCC® 14990™), S. aureus subsp. aureus (ATCC® 25923™), and P. aeruginosa PAO1 were used.
Solvents used: The biological experiments were performed in DMSO/broth medium (up to 0.0089% v/v DMSO in broth). A stock solution of PenAg (0.01 M) in DMSO was freshly prepared and diluted with microbe’s culture medium to the desired concentration.
The effects of PenAg or PenNa on the growth of microbial strains: This study was performed according standard procedure, which is also described elsewhere [8,9,10,11,12,30]. Briefly, the bacterial strains were streaked onto in trypticase soy agar. The plates were incubated for 18–24 h at 37 °C. Three to five isolated colonies were selected of the same morphological appearance from the fresh agar plate using a sterile loop and transfer into a tube containing 2 mL of sterile saline solution. The optical density at 620 nm is 0.1, which corresponds in to 108 cfu/mL. The final inoculum size for broth dilution is 5 × 10⁵ cfu/mL. The total volume of the culture solution treated by PenAg or PenNa, and the total volumes of the positive and negative controls, were all 2 mL. The range of concentrations of PenAg or PenNa was 0.004–2000 μΜ. The growth was assessed after incubation for 20 h. The minimal inhibitory concentration (MIC) was determined as the concentration of the compound which inhibits the visible growth of the bacterium being investigated. The optical density of the solution at 620 nm compared to the concentrations graph led to the MIC determination [8,9,10,11,12,30].
Minimum bactericidal concentration testing: This study was performed according standard procedure which is also described elsewhere [8,9,10,11,12,31]. Bacteria were initially cultivated in the presence of PenAg in broth culture for 20 h. The MBC values were determined in duplicate, by subculturing 4 μL of the broth an agar plate [8,9,10,11,12,31]. Colony growth suggests non bactericidal activity of a metallodrug. Thus, minimum bactericidal concentration was then defined as the lowest concentration at which a tested compound inhibited the microbe’s growth completely [8,9,10,11,12,31].
Determination of the inhibition zone (IZ) through the agar disk-diffusion method: This study was performed according to standard procedure, which is also described elsewhere [8,9,10,11,12,32]. Thus, agar plates were inoculated with a standardized inoculum (108 cfu/mL) of the tested microorganism. Filter paper disks (9 mm in diameter), which had been previously soaked by PenAg or PenNa (1 mg/mL), were placed on the agar surface. The Petri dishes were incubated for 20 h, and then the diameters of the inhibition zones were measured [8,9,10,11,12,32].
Evaluation of toxicity with brine shrimp assay: Brine shrimp assay was performed by a method previously described [38]. One gram cysts were initially hydrated in freshwater for one hour in a separating funnel or cone shaped container. Seawater was prepared by dissolving 17 g of sea salt in 500 mL of distilled water [38,39]. The cone was facilitated with good aeration for 48 h at room temperature and under continuous illumination. After hatching, nauplii released from the egg shells were collected at the bright side of the cone (near the light source) by using micropipette. The larvae were isolated from the eggs by aliquoting them in small beaker containing NaCl 0.9% [40]. An aliquot (0.1 mL) containing about 48 to 58 nauplii was introduced to each well of 24-well plate, and PenAg were added in each well. The final volume of each well was 1 mL with NaCl 0.9%. The brine shrimps were observed after 24 h, using a stereoscope. Larvae were considered dead if they did not exhibit any internal or external movement in 10 s of observation. Each experiment was repeated three times.

Supplementary Materials

The following are available online at https://0-www-mdpi-com.brum.beds.ac.uk/2079-6382/9/1/25/s1. Table S1: % Survival of Artemia salina larvae in increasing concentrations of solutions with or without PenAg or PenNa after 24 h. Figure S1: FT-IR spectra of PenAg and PenNa. Figure S2: UV–Vis spectra of PenAg at 0 and 24 h. Figure S3: 1H-NMR spectra of PenAg (upper) and PenNa (down) in DMSO-d6. Figure S4: Minimum bactericidal concentration of PenAg against P. aeruginosa (PAO1).

Author Contributions

Conceptualization, S.K.H.; investigation, I.K., C.N.B., N.K., C.P., C.G.T., and A.G.K.; methodology, C.N.B., C.G.T., and S.K.H.; supervision, S.K.H.; validation, S.K.H.; writing—original draft, C.N.B., C.G.T., A.G.K., and S.K.H.; writing—review and editing, C.N.B. and S.K.H. All authors have read and agreed to the published version of the manuscript.

Funding

This research was co-financial supported by the European Union and Greek national funds through the Operational Program Competitiveness, Entrepreneurship and Innovation, under the call RESEARCH–CREATE–INNOVATE (project code: T1EDK-02990).

Acknowledgments

(i) This work was carried out in fulfillment of the requirements for the Master’s thesis of I.K. according to the curriculum of the Department of Chemistry of the University of Ioannina under the supervision of S.K.H. (ii) The International Graduate Program in “Biological Inorganic Chemistry,” which operates at the University of Ioannina within the collaboration of the Departments of Chemistry of the Universities of Ioannina, Athens, Thessaloniki, Patras, and Crete, and the Department of Chemistry of the University of Cyprus (http://bic.chem.uoi.gr/BIC-En/index-en.html). (iii) Benzyl-penicillin sodium was kindly provided from COOPER S.A, which is acknowledged. (iv) This research has been co-financed by the European Union and Greek national funds through the Operational Program Competitiveness, Entrepreneurship, and Innovation, under the call RESEARCH–CREATE–INNOVATE (project code:T1EDK-02990). (v) The COST Action CA15114 “Anti-Microbial Coating Innovations to prevent infectious diseases (AMICI)” is acknowledged for the stimulating discussions.

Conflicts of Interest

The authors declare no conflict of interest.

References

  1. Vardanyan, R.S.; Hruby, V.J. Synthesis of Essential Drugs; Elsevier: Amsterdam, The Netherlands, 2006. [Google Scholar]
  2. Morán-Díaz, J.R.; Jiménez-Vázquez, H.A.; Gómez-Pliego, R.; Arellano-Mendoza, M.G.; Quintana-Zavala, D.; Guevara-Salazar, J.A. Correlation study of antibacterial activity and spectrum of Penicillins through a structure-activity relationship analysis. Med. Chem. Res. 2019, 28, 1529–1546. [Google Scholar] [CrossRef]
  3. Munita, J.M.; Arias, C.A. Mechanisms of Antibiotic Resistance. Microbiol. Spectr. 2016, 4. [Google Scholar] [CrossRef] [Green Version]
  4. Randall, C.P.; Oyama, L.B.; Bostock, J.M.; Chopra, I.; O’Neill, A.J. The silver cation (Ag+): Antistaphylococcal activity, mode of action and resistance studies. J. Antimicrob. Chemother. 2013, 68, 131–138. [Google Scholar] [CrossRef]
  5. Muller, M. Bacterial Silver Resistance Gained by Cooperative Interspecies Redox Behavior. Antimicrob. Agents Chemother. 2018, 62, e00672-18. [Google Scholar] [CrossRef] [PubMed] [Green Version]
  6. Sainis, I.; Banti, C.N.; Owczarzak, A.M.; Kyros, L.; Kourkoumelis, N.; Kubicki, M.; Hadjikakou, S.K. New antibacterial, non-genotoxic materials, derived from the functionalization of the anti-thyroid drug methimazole with silver ions. J. Inorg. Biochem. 2016, 160, 114–124. [Google Scholar] [CrossRef] [PubMed]
  7. Papadimitriou, A.; Ketikidis, I.; Stathopoulou, M.K.; Banti, C.N.; Papachristodoulou, C.; Zoumpoulakis, L.; Agathopoulos, S.; Vagenas, G.V.; Hadjikakou, S.K. Innovative material containing the natural product curcumin, with enhanced antimicrobial properties for active packaging. Mater. Sci. Eng. C 2018, 84, 118–122. [Google Scholar] [CrossRef] [PubMed]
  8. Milionis, I.; Banti, C.N.; Sainis, I.; Raptopoulou, C.P.; Psycharis, V.; Kourkoumelis, N.; Hadjikakou, S.K. Silver ciprofloxacin (CIPAG): A successful combination of antibiotics in inorganic-organic hybrid for the development of novel formulations based on chemically modified commercially available antibiotics. J. Biol. Inorg. Chem. 2018, 23, 705–723. [Google Scholar] [CrossRef] [PubMed]
  9. Stathopoulou, M.-E.K.; Banti, C.N.; Kourkoumelis, N.; Hatzidimitriou, A.G.; Kalampounias, A.G.; Hadjikakou, S.K. Silver complex of salicylic acid and its hydrogel-cream in wound healing chemotherapy. J. Inorg. Biochem. 2018, 181, 41–45. [Google Scholar] [CrossRef] [PubMed]
  10. Chrysouli, M.P.; Banti, C.N.; Milionis, Ι.; Koumasi, D.; Raptopoulou, C.P.; Psycharis, V.; Sainis, I.; Hadjikakou, S.K. A water-soluble silver (I) formulation as an effective disinfectant of contact lenses cases. Mater. Sci. Eng. C 2018, 93, 902–910. [Google Scholar] [CrossRef]
  11. Banti, C.N.; Poyraz, M.; Sainis, I.; Sari, M.; Rossos, G.; Kourkoumelis, N.; Hadjikakou, S.K. The periodic table of urea derivative: Small molecules of zinc (II) and nickel (II) of diverse antimicrobial and antiproliferative applications. Mol. Divers. 2019. [Google Scholar] [CrossRef]
  12. Karetsi, V.A.; Banti, C.N.; Kourkoumelis, N.; Papachristodoulou, C.; Stalikas, C.D.; Raptopoulou, C.P.; Psycharis, V.; Zoumpoulakis, P.; Mavromoustakos, T.; Sainis, I.; et al. An Efficient Disinfectant, Composite Material {SLS@ [Zn3 (CitH)2]} as Ingredient for Development of Sterilized and Non Infectious Contact Lens. Antibiotics 2019, 8, 213. [Google Scholar] [CrossRef] [Green Version]
  13. Renfrew, A.K. Transition metal complexes with bioactive ligands: Mechanisms for selective ligand release and applications for drug delivery. Metallomics 2014, 6, 1324. [Google Scholar] [CrossRef] [Green Version]
  14. Ma, D.-L.; Wu, C.; Cheng, S.-S.; Lee, F.-W.; Han, Q.-B.; Leung, C.-H. Development of Natural Product-Conjugated Metal Complexes as Cancer Therapies. Int. J. Mol. Sci. 2019, 20, 341. [Google Scholar] [CrossRef] [Green Version]
  15. Anacona, J.R.; Figueroa, E.M. Synthesis and Characterization of Metal Complexes with Penicillin. J. Coord. Chem. 1999, 48, 181–189. [Google Scholar] [CrossRef]
  16. Anacona, J.R. Synthesis and Antibacterial Activity of Some Metal Complexes of Beta-Lactamic Antibiotics. J. Coord. Chem. 2001, 54, 355–365. [Google Scholar] [CrossRef]
  17. Abdellah, M.A.; Hadjikakou, S.K.; Hadjiliadis, N.; Kubicki, M.; Bakas, T.; Kourkoumelis, N.; Simos, Y.V.; Karkabounas, S.; Barsan, M.; Butler, I.S. Synthesis, characterization and biological studies of organotin(IV) derivatives with o- or p-hydroxy-benzoic acids. Bioinorg. Chem. Appl. 2009, 2009, 12. [Google Scholar] [CrossRef] [PubMed]
  18. Noda, I.; Osaki, Y. Two-Dimensional Correlation Spectroscopy–Applications in Vibrational and Optical Spectroscopy; John Wiley & Sons Ltd.: West Sussex, UK, 2004. [Google Scholar]
  19. Kalampounias, A.G. Correlating changes in structure and dynamical properties in LnX3 (Ln = Y, Ho, Dy, Gd, Nd, La and X = Cl, Br) ionic melts. Chem. Pap. 2017, 71, 1529–1539. [Google Scholar] [CrossRef]
  20. Imafuku, Y.; Takeuchi, Y. Synthesis and characterization of some penicillins modified with germanium-containing moieties. Appl. Organometal. Chem. 2004, 18, 384–393. [Google Scholar] [CrossRef]
  21. Branch, S.K.; Casy, A.F.; Ominde, E.M.A. Application of 1H nuclear magnetic resonance spectroscopy to the analysis of 13-lactam antibiotics and their common degradation Products. J. Pharm. Biomed. Anal. 1987, 5, 73–103. [Google Scholar] [CrossRef]
  22. Möhler, J.S.; Kolmar, T.; Synnatschke, K.; Hergert, M.; Wilson, L.A.; Ramu, S.; Elliott, A.G.; Blaskovich, M.A.T.; Sidjabat, H.E.; Paterson, D.L.; et al. Enhancement of antibiotic-activity through complexation with metal ions-Combined ITC, NMR, enzymatic and biological studies. J. Inorg. Biochem. 2017, 167, 134–141. [Google Scholar] [CrossRef] [Green Version]
  23. Kupka, T.; Dziegielewski, J.O.; Pasterna, G. NMR studies on penicillins: Hydro-gen bonding, self-association and micellar solutions of cloxacillin Na-salt in D2O. J. Pharm. Biomed. Anal. 1993, 11, 103–116. [Google Scholar] [CrossRef]
  24. Baxter, N.J.; Williamson, M.P. Temperature dependence of 1H chemical shifts in proteins. J. Biomol. NMR 1997, 9, 359–369. [Google Scholar] [CrossRef] [PubMed]
  25. Petrova, M.; Muhamadejev, R.; Vigante, B.; Duburs, G.; Liepinsh, E. Intramolecular hydrogen bonds in 1,4-dihydropyridine derivatives. R. Soc. Open Sci. 2018, 5, 180088. [Google Scholar] [CrossRef] [PubMed] [Green Version]
  26. Sośnicki, J.G.; Hansen, P.E. Temperature coefficient of NH chemical shifts of thioamides and amides in relation to structure. J. Mol. Struct. 2004, 700, 91–103. [Google Scholar] [CrossRef]
  27. Newberry, R.W.; Raines, R.T. A prevalent intraresidue hydrogen bond stabilizes proteins. Nat. Chem. Biol. 2006, 12, 1084–1088. [Google Scholar] [CrossRef]
  28. Mitra, A.; Seaton, P.J.; Assarpour, R.A.; Williamson, T. Unprecedented concen-tration dependent chemical shift variation in 1H-NMR studies: A caveat in the investigations of molecular recognition and structure elucidation. Tetrahedron 1998, 54, 15489–15498. [Google Scholar] [CrossRef]
  29. Tagawa, A.; Shikata, T. Anti-parallel dimer and tetramer formation of cyclic and open structure tertiary amides, N-methyl-2-pyrrolidone and N, N-dimethylacetamide, in so-lution of a non-polar solvent, benzene. Phys. Chem. Chem. Phys. 2019, 21, 22081–22091. [Google Scholar] [CrossRef]
  30. Wiegand, I.; Hilpert, K.; Hancock, R.E.W. Agar and broth dilution methods to determine the minimal inhibitory concentration (MIC) of antimicrobial substances. Nat. Protoc. 2008, 3, 163–175. [Google Scholar] [CrossRef]
  31. Kostenko, V.; Ceri, H.; Martinuzzi, R.J. Increased tolerance of Staphylococcus aureus to vancomycin in Viscous media. FEMS Immunol. Med. Microbiol. 2007, 51, 277–288. [Google Scholar]
  32. Matuschek, E.; Brown, D.F.J.; Kahlmeter, G. Development of the EUCAST disk di_usion antimicrobial susceptibility testing method and its implementation in routine microbiology laboratories. Clin. Microbiol. Infect. 2014, 20, o255–o266. [Google Scholar] [CrossRef] [Green Version]
  33. Lee, S.M.; Min, B.S.; Kho, Y.H. Brine Shrimp Lethality of the Compounds from Phryma leptostachya L. Arch. Pharm. Res. 2002, 25, 652. [Google Scholar] [CrossRef] [PubMed]
  34. Gajera, S.B.; Mehta, J.V.; Patel, M.N. Design of Multifunctional IridiumIII Compounds as a Potential Therapeutic Agents from Basic Molecular Scaffolds. ChemistrySelect 2016, 1, 3966. [Google Scholar] [CrossRef]
  35. Neves, R.A.F.; Fernandes, T.; dos Santos, L.N.; Nascimento, S.M. Toxicity of benthic dinoflagellates on grazing, behavior and survival of the brine shrimp Artemia salina. PLoS ONE 2017, 12, e0175168. [Google Scholar] [CrossRef] [PubMed] [Green Version]
  36. Faimali, M.; Giussani, V.; Piazza, V.; Garaventa, F.; Corrà, C.; Asnaghi, V.; Privitera, D.; Gallus, L.; Cattaneo-Vietti, R.; Mangialajo, L.; et al. Toxic effects of harmful benthic dinoflagellate Ostreopsis ovata on invertebrate and vertebrate marine organisms. Mar. Environ. Res. 2012, 76, 97. [Google Scholar] [CrossRef] [PubMed]
  37. Morones-Ramirez, J.R.; Winkler, J.A.; Spina, C.S.; Collins, J.J. Silver Enhances Antibiotic Activity Against Gram-negative Bacteria. Sci. Transl. Med. 2013, 5, 190ra81. [Google Scholar] [CrossRef] [PubMed] [Green Version]
  38. Rahman, K.; Ullah Khan, S.; Fahad, S.; Khan Shinwari, Z.; Khan, D.; Kamal, S.; Ullah, I.; Ishtiaq Anjum, S.; Man, S.; Jamil Khan, A.; et al. In vitro biological screening of a critically endangered medicinal plant, Atropa acuminata Royle Ex Lindl of north western Himalaya. Sci. Rep. 2018, 8, 11028. [Google Scholar] [CrossRef]
  39. Arun, V.V.; Saharan, N.; Ramasubramanian, V.; Babitha Rani, A.M.; Salin, K.R.; Sontakke, R.; Haridas, H.; George Pazhayamadom, D. Multi-response optimization of Artemia hatching process using split-split-plot design based response surface methodology. Sci. Rep. 2017, 7, 40394. [Google Scholar] [CrossRef]
  40. Rani Muhamad Syahmi, A.; Vijayaratna, S.; Sasidharan, S.; Yoga Latha, L.; Ping Kwan, Y.; Ling Lau, Y.; Ngit Shin, L.; Chen, Y. Acute Oral Toxicity and Brine Shrimp Lethality of Elaeis guineensis Jacq., (Oil Palm Leaf) Methanol Extract. Molecules 2010, 15, 8111. [Google Scholar] [CrossRef] [Green Version]
Scheme 1. Molecular structure of Penicillin G.
Antibiotics 09 00025 sch001
Scheme 2. PenAg synthetic route.
Antibiotics 09 00025 sch002
Figure 1. SEM image accompanied by EDX qualitative analysis. The dot marks the location of EDX (A). EDX chemical maps (BC).
Antibiotics 09 00025 g001
Figure 2. 1H-NMR spectrum in DMSO-d6 of PenAg and the corresponding ones after 0, 24 and 48 h.
Antibiotics 09 00025 g002
Figure 3. ATR-FTIR spectra of solutions with DMSO and CHCl3 as solvents and of the solid phase. The spectra exhibit characteristic similarities in both liquid and solid phases.
Antibiotics 09 00025 g003
Figure 4. Confidence ellipses calculated from Pearson-type correlations for the solid and the solution with CHCl3 (A) or DMSO (B) used as solvent. See text for details.
Antibiotics 09 00025 g004
Figure 5. Synchronous 2-D correlation spectra constructed from the vibrational spectra of the solid and CHCl3 (A) or DMSO (B) solution presented in Figure 3.
Antibiotics 09 00025 g005
Figure 6. The Δδ for the PenNa and the PenAg in DMSO-d6 (a) and in MeOD-d4 (b).
Antibiotics 09 00025 g006
Figure 7. Structure of PenAg refined by the analytical and spectroscopic data.
Antibiotics 09 00025 g007
Figure 8. Inhibition zones which are grown in Pseudomonas aeruginosa (A), Staphylococcus epidermidis (B), and Staphylococcus aureus (C) for PenAg and PenNa.
Antibiotics 09 00025 g008
Table 1. Pearson correlation coefficients for solid and solution with CHCl3 or DMSO used as solvents.
Solid/KBrCHCl3 Solid/KBrDMSO
Solid/KBr10.78715 Solid/KBr10.80955
CH3Cl0.787151 DMSO0.809551
Table 2. Minimum inhibitory concentration (MIC), minimum bactericidal concentration (MBC), and inhibition zones (IZ) of PenAg and PenNa in comparison with the corresponding ones of other silver and zinc complexes tested against P. aeruginosa, S. epidermidis, and S. aureus.
CompoundMIC values (μΜ)Ref.
P. aeruginosaS. epidermidisS. aureus
PenAg23.00 ± 2.292.41 ± 0.880.08 ± 0.02[*]
PenNa>20003.76 ± 1.140.14 ± 0.02[*]
CIPAG0.61 ± 0.140.46 ± 0.080.54 ± 0.07[8]
([CIPH2+]·Cl)1.17 ± 0.221.08 ± 0.121.45 ± 0.12[8]
AGSAL-1285042[9]
salH2>1250>1250>1250[9]
AGMNA25.7 ± 2.4-42.0 ± 0.3[10]
MNAH2>300->300[10]
[Zn3(CitH)2]>250119.2 ± 18.1183.3 ± 31.4[12]
CitH4>250>250>250[12]
MBC values (μΜ)
PenAg46.6--[*]
PenNa2000--[*]
CIPAG0.70.81.0[8]
([CIPH2+]·Cl)1.601.602.00[8]
AGSAL-133.090.050.0[9]
salH2NDNDND[9]
AGMNA61.1-85.7[10]
MNAH2153.3-135.0[10]
[Zn3(CitH)2]>250201.7>250[12]
CitH4>250>250>250[12]
Inhibition zone (mm)
Control/DMSO101010
PenAg173457[*]
PenNa103460[*]
CIPAG323428[8]
([CIPH2+]·Cl)303624[8]
AGSAL-1131312[9]
salH2101010[9]
AGMNA21.8-22.1[10]
MNAH2101010[10]
[Zn3(CitH)2]101010[12]
CitH4101010[12]
[*] this work, ND = not determined, CIPAG= {[Ag(CIPH)2]NO3∙0.75MeOH∙1.2H2O}, CIPH = ciprofloxacin, [CIPH2+]·Cl = hydrochloric salt of ciprofloxacin, AGSAL-1 = [Ag(salH)]2, salH2 = salicylic acid, AGMNA = {[Ag63-Hmna)43-mna)2]2·[(Et3NH)+]2·(DMSO)2·(H2O)}, MNAH2 = 2-mercapto-nicotinic acid, CitH4 = citric acid.

