A Risk Prediction Flowchart of Vancomycin-Induced Acute Kidney Injury to Use When Starting Vancomycin Administration: A Multicenter Retrospective Study

 , , and
Abstract
:1. Introduction
2. Results
2.1. Characteristics of Patients
2.2. Logistic Regression Analysis
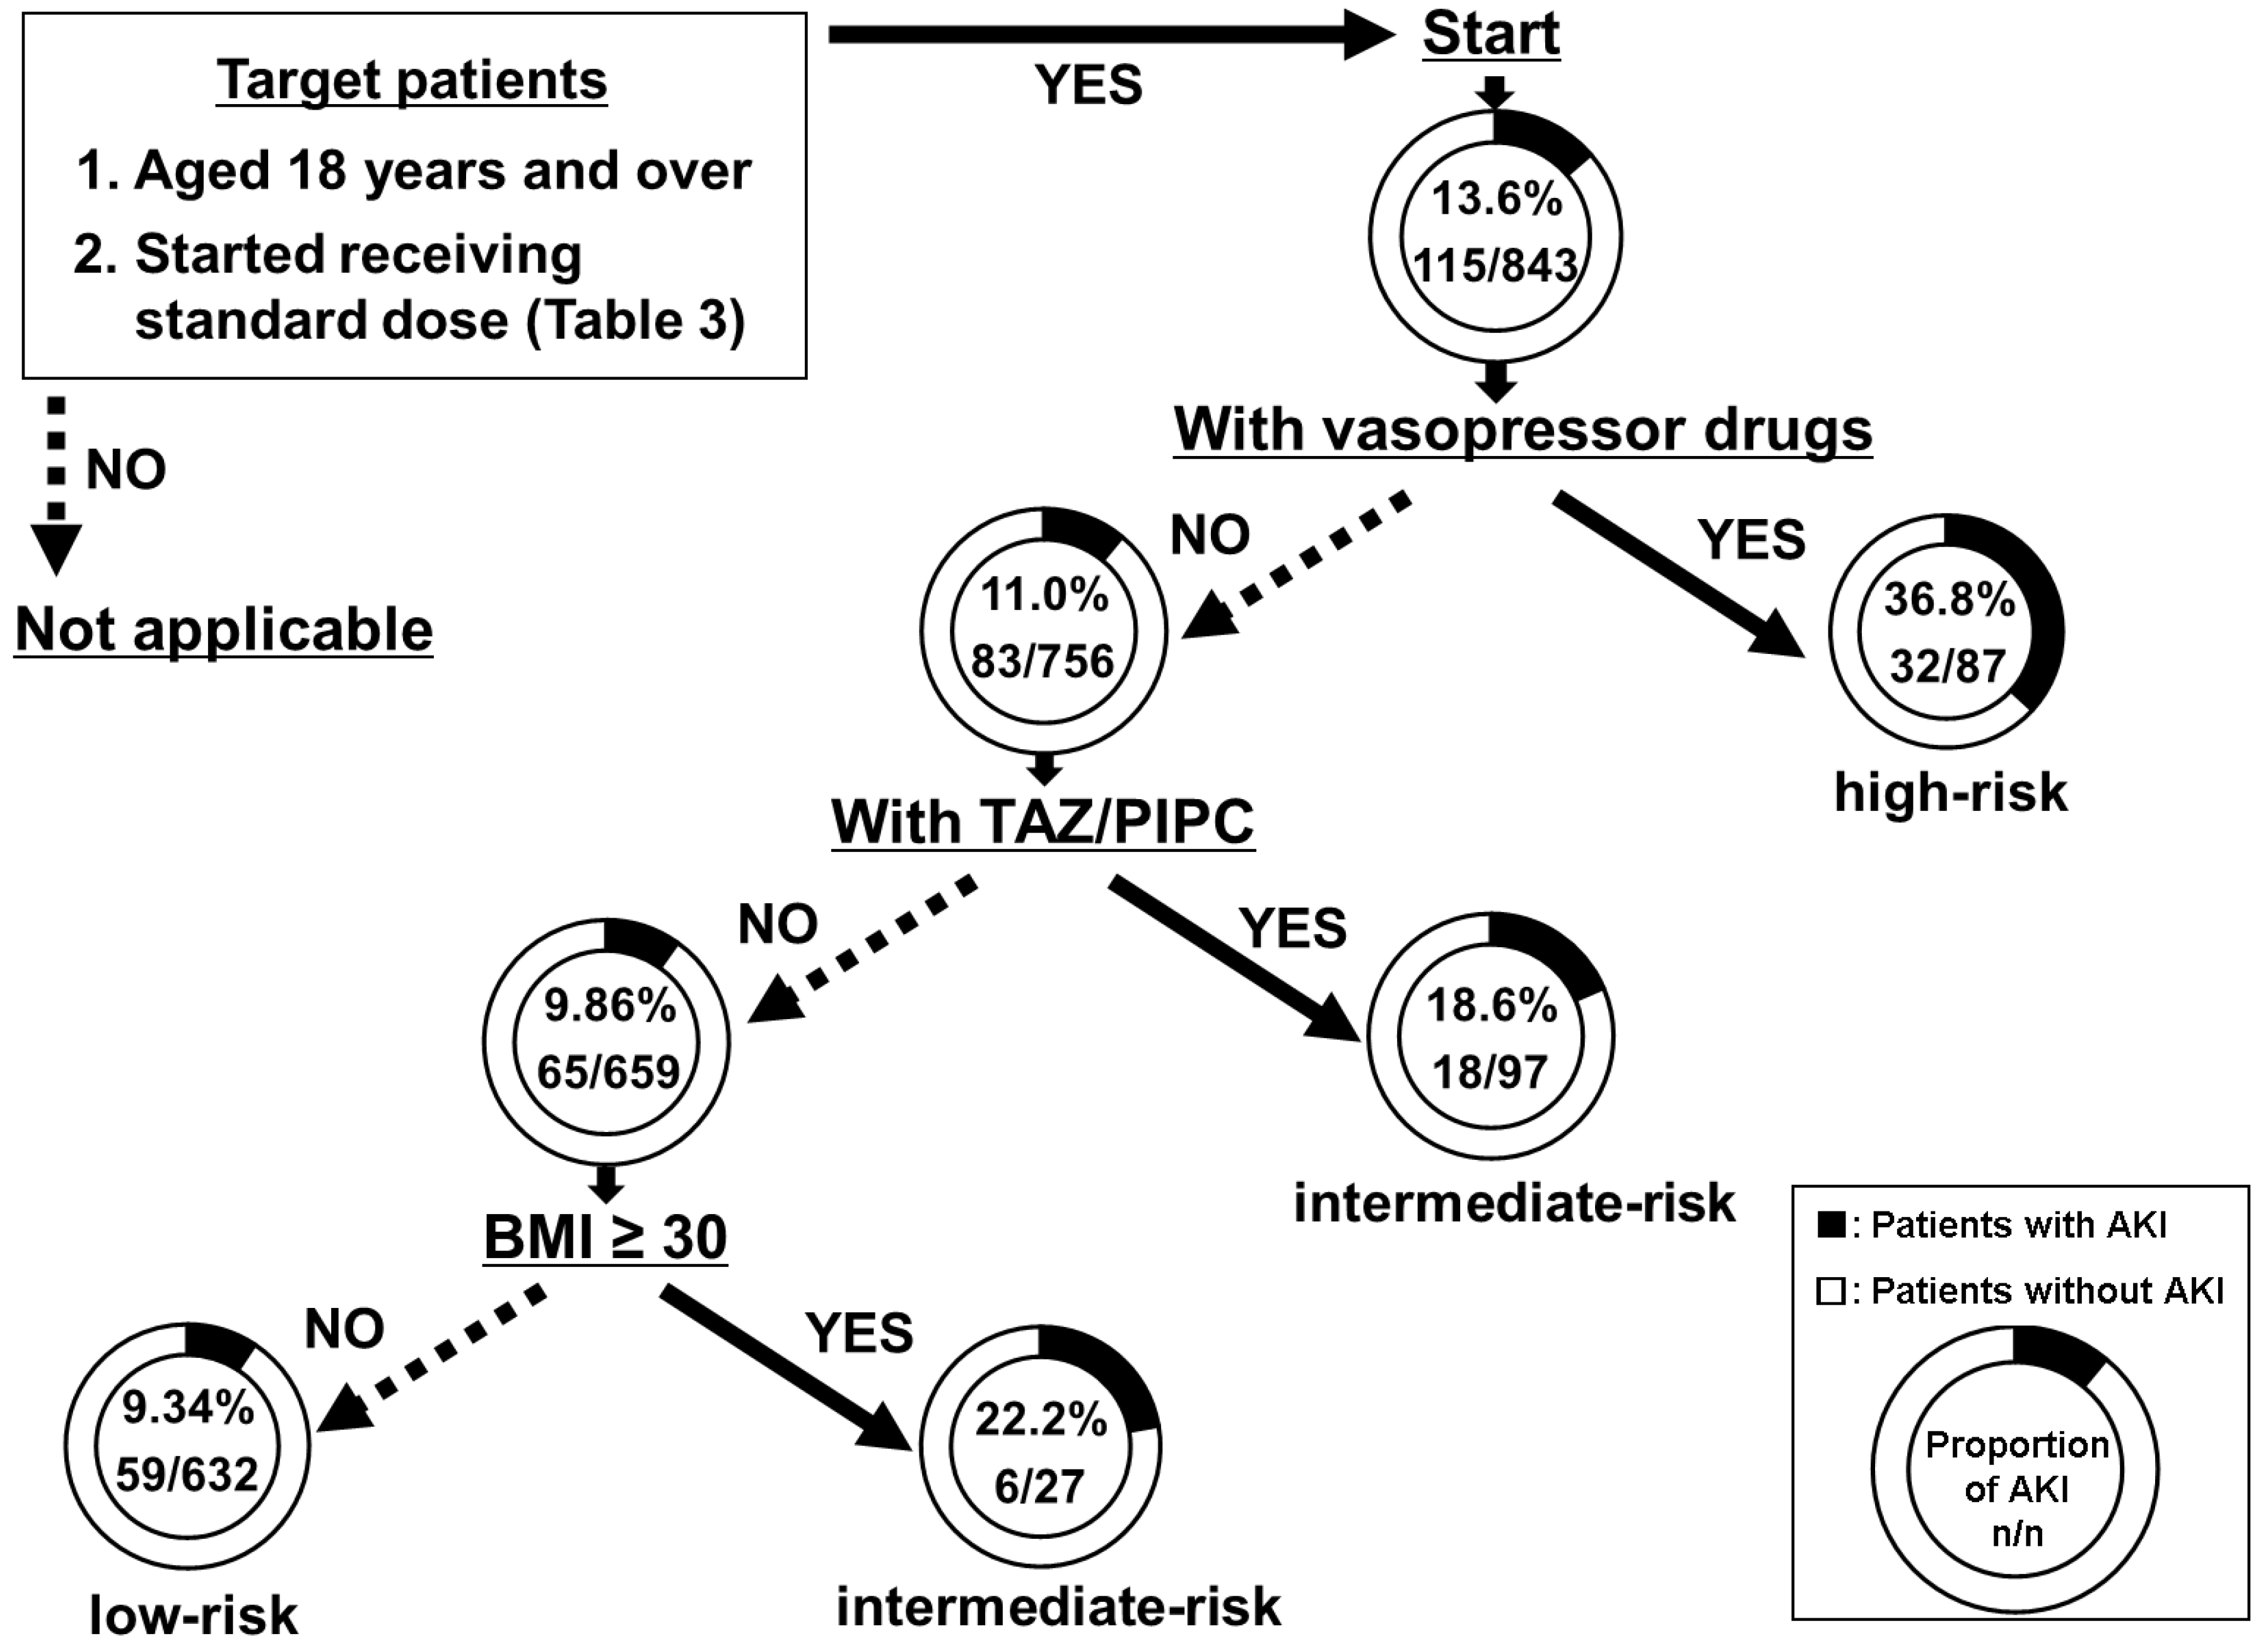
2.3. DT Analysis
2.4. Validation of the Model
3. Discussion
4. Materials and Methods
4.1. Study Design
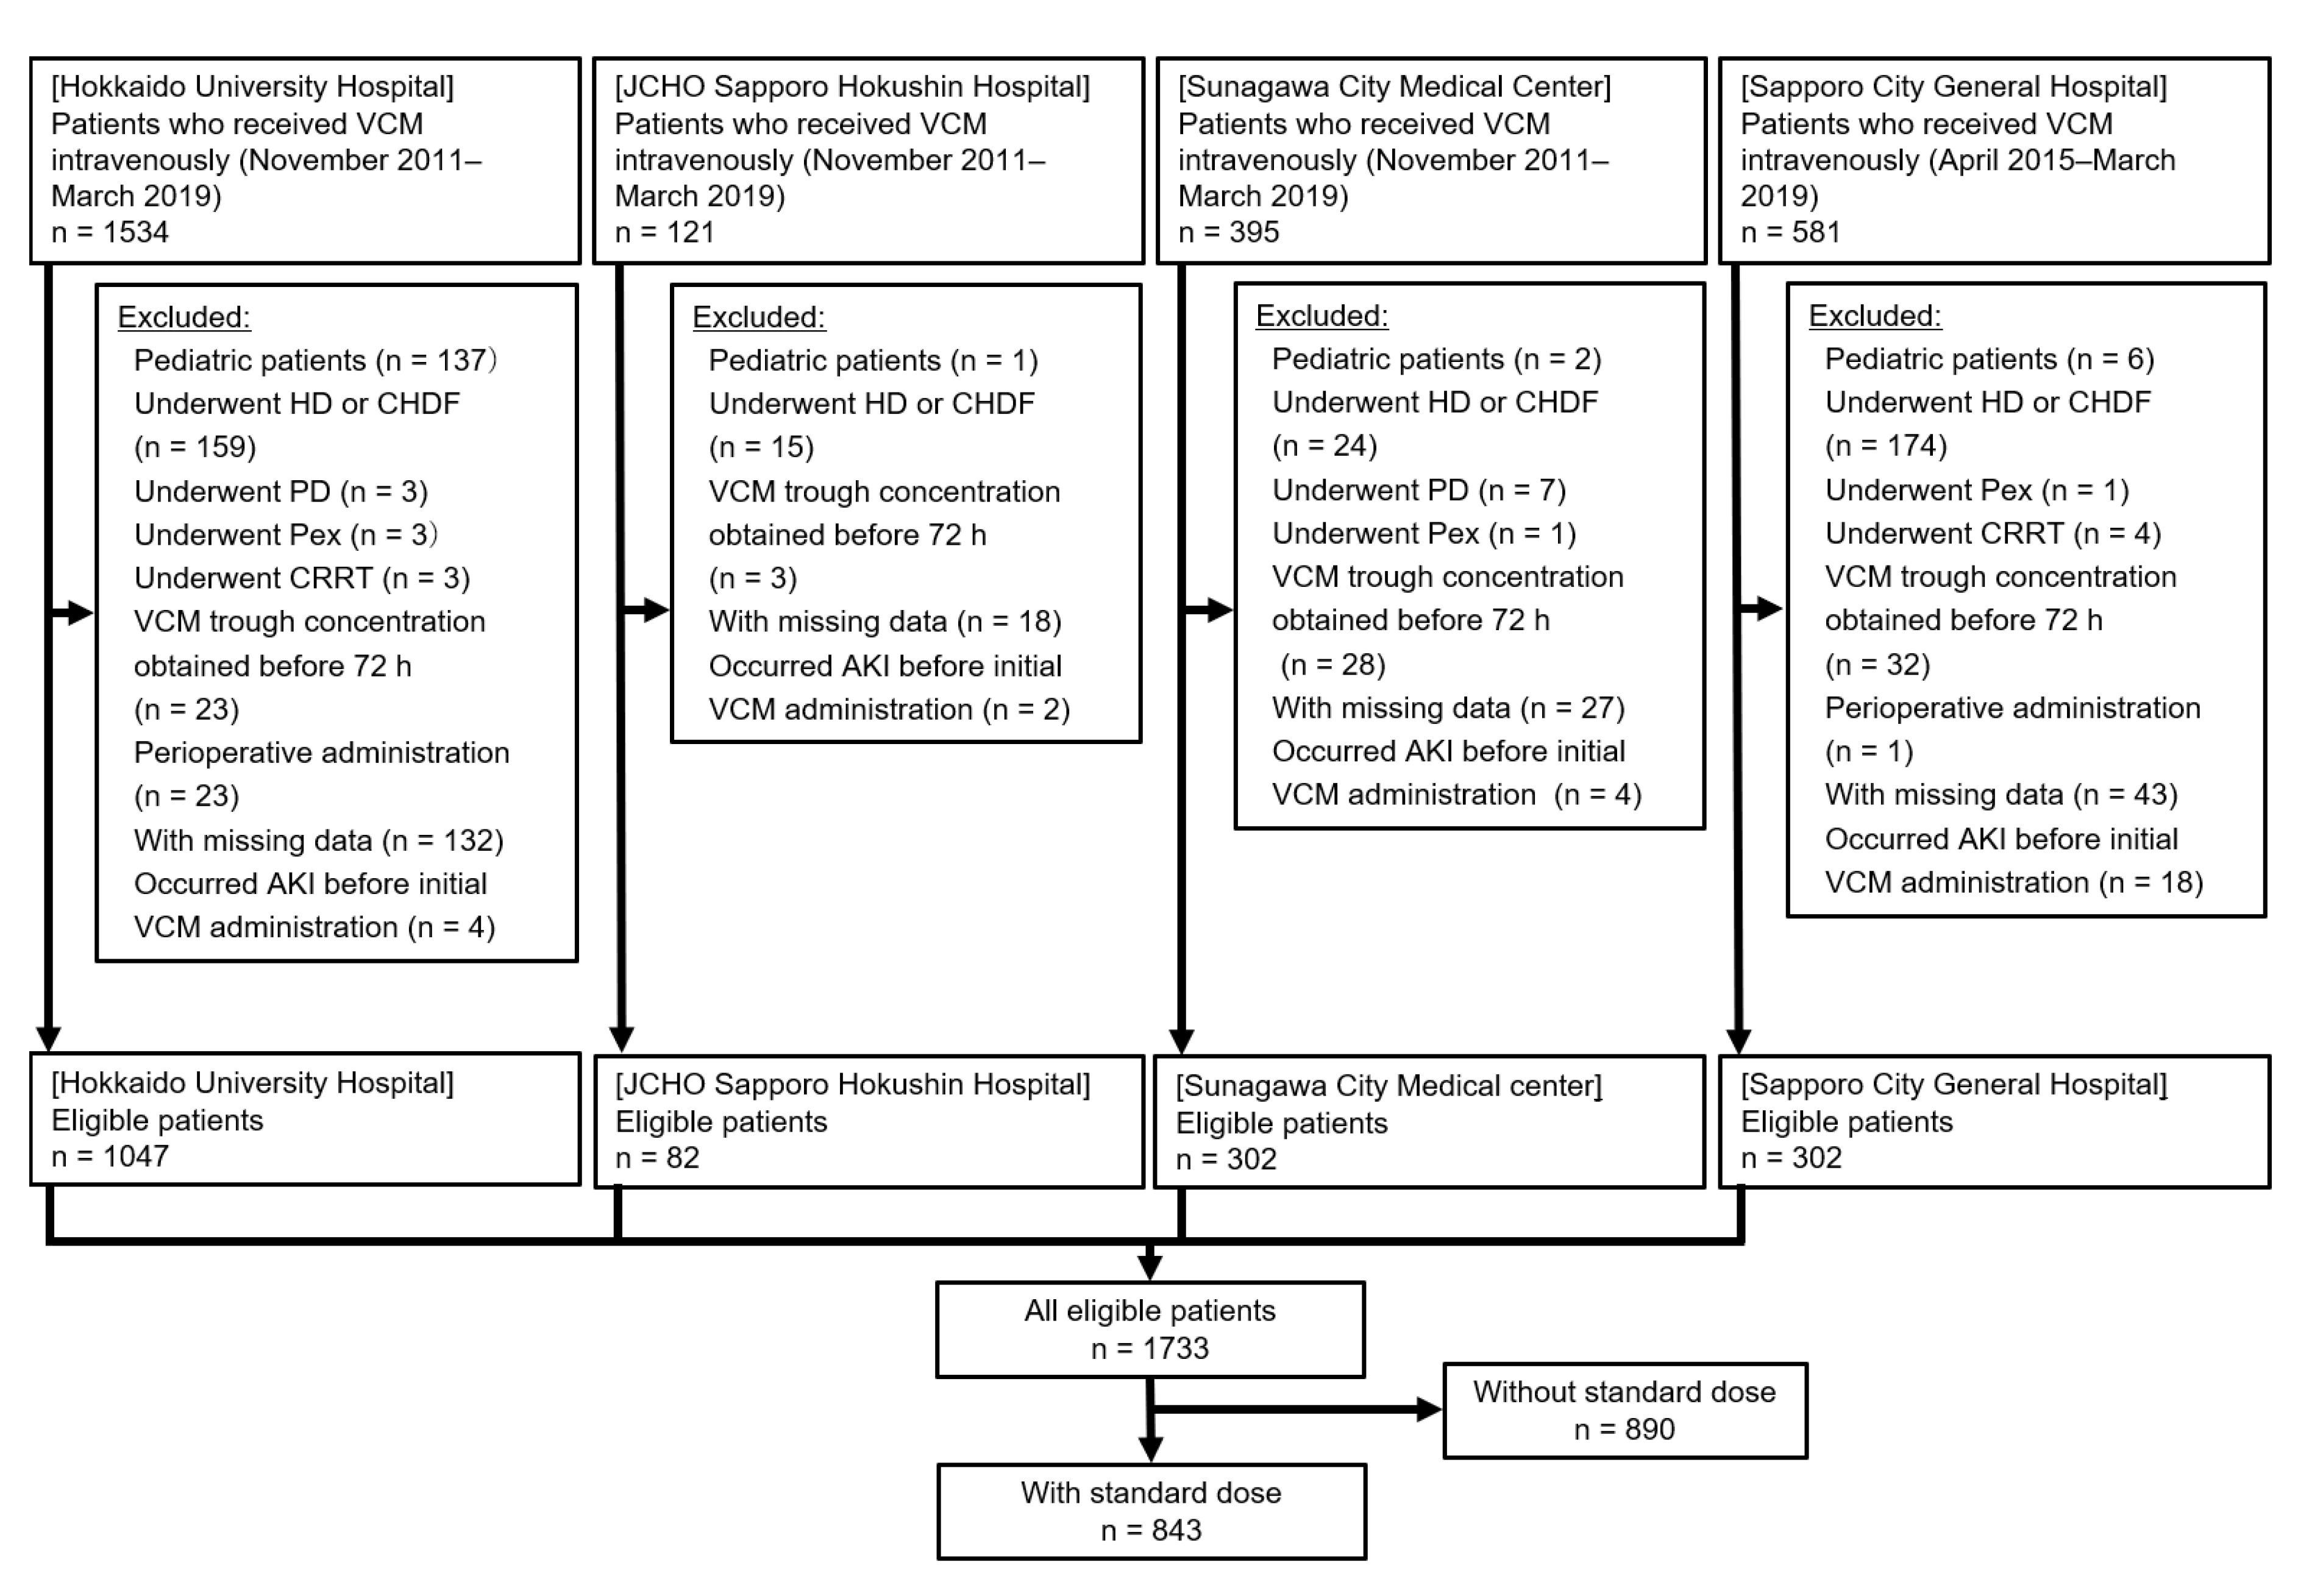
4.2. Subjects
4.3. Data Collection
4.4. Definition of VCM-Induced AKI
4.5. Statistical Analysis and Construction of a Flowchart
4.6. Validation of the Model
4.7. Ethics
5. Conclusions
Author Contributions
Funding
Conflicts of Interest
References
- Levey, A.S.; James, M.T. Acute kidney injury. Ann. Intern. Med. 2017, 167, 66–80. [Google Scholar] [CrossRef] [PubMed]
- Kellum, J.A.; Lameire, N.; Aspelin, P.; Barsoum, R.S.; Burdmann, E.A.; Goldstein, S.L.; Herzog, C.A.; Joannidis, M.; Kribben, A.; Levey, A.S.; et al. Kidney disease: Improving global outcomes (KDIGO). KDIGO clinical practice guideline for acute kidney injury. Kidney Int. Suppl. 2012, 2, 1–138. [Google Scholar] [CrossRef] [Green Version]
- Wang, H.E.; Muntner, P.; Chertow, G.M.; Warnock, D.G. Acute kidney injury and mortality in hospitalized patients. Am. J. Nephrol. 2012, 35, 349–355. [Google Scholar] [CrossRef] [PubMed] [Green Version]
- Chertow, G.M.; Burdick, E.; Honour, M.; Bonventre, J.V.; Bates, D.W. Acute kidney injury, mortality, length of stay, and costs in hospitalized patients. J. Am. Soc. Nephrol. 2005, 16, 3365–3370. [Google Scholar] [CrossRef] [PubMed] [Green Version]
- Rybak, M.J.; Le, J.; Lodise, T.P.; Levine, D.P.; Bradley, J.S.; Liu, C.; Mueller, B.A.; Pai, M.P.; Wong-Beringer, A.; Rotschafer, J.C.; et al. Therapeutic monitoring of vancomycin for serious methicillin-resistant Staphylococcus aureus infections: A revised consensus guideline and review by the American Society of Health-System Pharmacists, the Infectious Diseases Society of America, the Pediatric Infectious Diseases Society, and the Society of Infectious Diseases Pharmacists. Am. J. Health Syst. Pharm. 2020, 77, 835–864. [Google Scholar] [CrossRef] [Green Version]
- Van Hal, S.J.; Paterson, D.L.; Lodise, T.P. Systematic review and meta-analysis of vancomycin-induced nephrotoxicity associated with dosing schedules that maintain troughs between 15 and 20 milligrams per liter. Antimicrob. Agents Chemother. 2013, 57, 734–744. [Google Scholar] [CrossRef] [Green Version]
- Pais, G.M.; Liu, J.; Zepcan, S.; Avedissian, S.N.; Rhodes, N.J.; Downes, K.J.; Moorthy, G.S.; Scheetz, M.H. Vancomycin-induced kidney injury: Animal models of toxicodynamics, mechanisms of injury, human translation, and potential strategies for prevention. Pharmacotherapy 2020, 40, 438–454. [Google Scholar] [CrossRef]
- Barberán, J.; Mensa, J.; Artero, A.; Epelde, F.; Rodriguez, J.C.; Ruiz-Morales, J.; Calleja, J.L.; Guerra, J.M.; Martínez-Gil, I.; Giménez, M.J.; et al. Factors associated with development of nephrotoxicity in patients treated with vancomycin versus daptomycin for severe Gram-positive infections: A practice-based study. Rev. Esp. Quimioter. 2019, 32, 22–30. [Google Scholar]
- Huang, M.; Wu, H.; Zhou, J.; Xu, M.; Zhou, S. Efficacy of vancomycin on gram-positive bacterial infection in elderly critical patients and risk factors associated with nephrotoxicity. Arch. Iran. Med. 2018, 21, 349–355. [Google Scholar] [PubMed]
- Park, S.J.; Lim, N.R.; Park, H.J.; Yang, J.W.; Kim, M.J.; Kim, K.; In, Y.W.; Lee, Y.M. Evaluation of risk factors for vancomycin-induced nephrotoxicity. Int. J. Clin. Pharm. 2018, 40, 1328–1334. [Google Scholar] [CrossRef]
- Pan, K.; Ma, L.; Xiang, Q.; Li, X.; Li, H.; Zhou, Y.; Yang, L.; Cui, Y. Vancomycin-associated acute kidney injury: A cross-sectional study from a single center in China. PLoS ONE 2017, 12, 0175688. [Google Scholar] [CrossRef] [PubMed]
- Rutter, W.C.; Cox, J.N.; Martin, C.A.; Burgess, D.R.; Burgess, D.S. Nephrotoxicity during vancomycin therapy in combination with piperacillin-tazobactam or cefepime. Antimicrob. Agents Chemother. 2017, 61, 02089–02116. [Google Scholar] [CrossRef] [PubMed] [Green Version]
- Hall, R.G., 2nd; Hazlewood, K.A.; Brouse, S.D.; Giuliano, C.A.; Haase, K.K.; Frei, C.R.; Forcade, N.A.; Bell, T.; Bedimo, R.J.; Alvarez, C.A. Empiric guideline-recommended weight-based vancomycin dosing and nephrotoxicity rates in patients with methicillin-resistant Staphylococcus aureus bacteremia: A retrospective cohort study. BMC Pharmacol. Toxicol. 2013, 14, 12. [Google Scholar] [CrossRef] [PubMed] [Green Version]
- Cano, E.L.; Haque, N.Z.; Welch, V.L.; Cely, C.M.; Peyrani, P.; Scerpella, E.G.; Ford, K.D.; Zervos, M.J.; Ramirez, J.A.; Kett, D.H. Improving Medicine through Pathway Assessment of Critical Therapy of Hospital-Acquired Pneumonia (IMPACT-HAP) Study Group. Incidence of nephrotoxicity and association with vancomycin use in intensive care unit patients with pneumonia: Retrospective analysis of the IMPACT-HAP database. Clin. Ther. 2012, 34, 149–157. [Google Scholar] [CrossRef]
- Minejima, E.; Choi, J.; Beringer, P.; Lou, M.; Tse, E.; Wong-Beringer, A. Applying new diagnostic criteria for acute kidney injury to facilitate early identification of nephrotoxicity in vancomycin-treated patients. Antimicrob. Agents Chemother. 2011, 55, 3278–3283. [Google Scholar] [CrossRef] [Green Version]
- Lodise, T.P.; Lomaestro, B.; Graves, J.; Drusano, G.L. Larger vancomycin doses (at least four grams per day) are associated with an increased incidence of nephrotoxicity. Antimicrob. Agents Chemother. 2008, 52, 1330–1336. [Google Scholar] [CrossRef] [Green Version]
- Imai, S.; Yamada, T.; Kasashi, K.; Kobayashi, M.; Iseki, K. Usefulness of a decision tree model for the analysis of adverse drug reactions: Evaluation of a risk prediction model of vancomycin-associated nephrotoxicity constructed using a data mining procedure. J. Eval. Clin. Pract. 2017, 23, 1240–1246. [Google Scholar] [CrossRef]
- Song, Y.Y.; Lu, Y. Decision tree methods: Applications for classification and prediction. Shanghai Arch. Psychiatry 2015, 27, 130–135. [Google Scholar] [CrossRef]
- Imai, S.; Yamada, T.; Kasashi, K.; Niinuma, Y.; Kobayashi, M.; Iseki, K. Construction of a risk prediction model of vancomycin-associated nephrotoxicity to be used at the time of initial therapeutic drug monitoring: A data mining analysis using a decision tree model. J. Eval. Clin. Pract. 2019, 25, 163–170. [Google Scholar] [CrossRef] [Green Version]
- Japanese Society of Chemotherapy; The Japanese Society of Therapeutic Drug Monitoring. Koukinyaku TDM Guideline Kaiteiban; Japanese Society of Chemotherapy: Tokyo, Japan, 2016; pp. 40–49. [Google Scholar]
- Thomson, A.H.; Staatz, C.E.; Tobin, C.M.; Gall, M.; Lovering, A.M. Development and evaluation of vancomycin dosage guidelines designed to achieve new target concentrations. J. Antimicrob. Chemother. 2009, 63, 1050–1057. [Google Scholar] [CrossRef]
- Jeffres, M.N.; Isakow, W.; Doherty, J.A.; Micek, S.T.; Kollef, M.H. A retrospective analysis of possible renal toxicity associated with vancomycin in patients with health care-associated methicillin-resistant Staphylococcus aureus pneumonia. Clin. Ther. 2007, 29, 1107–1115. [Google Scholar] [CrossRef] [PubMed]
- Luther, M.K.; Timbrook, T.T.; Caffrey, A.R.; Dosa, D.; Lodise, T.P.; LaPlante, K.L. Vancomycin plus piperacillin-tazobactam and acute kidney injury in adults: A systematic review and meta-analysis. Crit. Care Med. 2018, 46, 12–20. [Google Scholar] [CrossRef] [PubMed]
- Gomes, D.M.; Smotherman, C.; Birch, A.; Dupree, L.; Della Vecchia, B.J.; Kraemer, D.F.; Jankowski, C.A. Comparison of acute kidney injury during treatment with vancomycin in combination with piperacillin-tazobactam or cefepime. Pharmacotherapy 2014, 34, 662–669. [Google Scholar] [CrossRef]
- Burgess, L.D.; Drew, R.H. Comparison of the incidence of vancomycin-induced nephrotoxicity in hospitalized patients with and without concomitant piperacillin-tazobactam. Pharmacotherapy 2014, 34, 670–676. [Google Scholar] [CrossRef] [PubMed]
- World Health Organization. ‘Obesity and Overweight’. Who.int. 2020/4/1. Available online: https://www.who.int/news-room/fact-sheets/detail/obesity-and-overweight (accessed on 13 July 2020).
- Cockcroft, D.W.; Gault, M.H. Prediction of creatinine clearance from serum creatinine. Nephron 1976, 16, 31–41. [Google Scholar] [CrossRef] [PubMed]
- Kass, G.V. An exploratory technique for investigating large quantities of categorical data. J. R. Stat. Soc. Ser. C Appl. Stat. 1980, 29, 119–127. [Google Scholar] [CrossRef]
- Hosmer, D.W.; Lemeshow, S. Applied Logistic Regression, 2nd ed.; John Wiley & Sons, Inc.: New York, NY, USA, 2005; pp. 32–46. [Google Scholar]
- Bellazzi, R.; Zupan, B. Predictive data mining in clinical medicine: Current issues and guideline. Int. J. Med. Inform. 2008, 77, 81–97. [Google Scholar] [CrossRef] [Green Version]
- Momenyan, S.; Baghestani, A.R.; Momenyan, N.; Naseri, P.; Akbari, M.E. Survival Prediction of Patients with Breast Cancer: Comparisons of Decision Tree and Logistic Regression Analysis. Int. J. Cancer Manag. 2018, 11, 9176. [Google Scholar] [CrossRef]


| Characteristics | With AKI | Without AKI | p-Value |
|---|---|---|---|
| (n = 115) | (n = 728) | ||
| Age (years), median (Q1–Q3) | 69.2 (62.8–77.0) | 69.6 (62.0–77.4) | 0.796 c |
| Male/female, n/n (%/%) | 72/43 (62.6/37.4) | 472/256 (64.8/35.2) | 0.643 a |
| Height (cm), median (Q1–Q3) | 161.6 | 161 | 0.533 c |
| (153.8–168.0) | (153.0–167.0) | ||
| Body weight (kg), median (Q1–Q3) | 58.7 (50.6–67.8) | 55.1 (47.7–64.0) | 0.016 c,* |
| BMI (kg/m2), median (Q1–Q3) | 22.5 (20.1–25.1) | 21.7 (19.1–24.4) | 0.015 c,* |
| ≥ 30, n (%) | 9 (7.83) | 29 (3.98) | 0.065 a |
| BUN (mg/dL), median (Q1–Q3) | |||
| Initial administration | 26.0 (15.0–36.0) | 18.0 (13.0–25.0) | <0.001 c,* |
| Initial TDM | 32.0 (19.7–49.2) | 16.0 (11.0–22.4) | <0.001 c,* |
| Maximum | 38.9 (23.3–54.3) | 18.0 (13.0–26.0) | <0.001 c,* |
| Scr (mg/dL), median (Q1–Q3) | |||
| Initial administration | 0.78 (0.65–1.17) | 0.76 (0.60–0.97) | 0.024 c,* |
| Initial TDM | 1.21 (0.82–1.66) | 0.70 (0.56–0.87) | <0.001 c,* |
| Maximum | 1.54 (1.20–1.99) | 0.80 (0.64–1.01) | <0.001 c,* |
| Adjusted CCr (mL/min), median (Q1–Q3) | 63.7 (42.3–82.3) | 66.6 (47.8–84.0) | 0.342 c |
| < 86.6, n (%) | 92 (80.0) | 577 (79.3) | 0.855 a |
| VCM daily dose (mg), median (Q1–Q3) Initial administration After initial TDM | 1500 (1000–2000) 1225 (750–2000) | 1500 (1000–2000) 1500 (1000–2000) | 0.416 c <0.001 c,* |
| Duration of therapy (days), median (Q1–Q3) | 7 (4–11) | 7 (5–11) | 0.038 c,* |
| Days to initial TDM (days), median (Q1–Q3) | 3 (3–4) | 4 (3–4) | 0.683 c |
| Initial VCM trough concentration (mg/L), median (Q1-Q3) | 15.5 (10.8–21.3) | 10.9 (8.14–14.3) | <0.001 c,* |
| With loading dose, n (%) | 24 (20.9) | 149 (20.5) | 0.921 a |
| Loading dose (mg), median (Q1–Q3) | 1000 (1000–1000) | 1000 (1000–1000) | 0.342 c |
| Residence in ICU, n (%) | 34 (29.6) | 113 (15.5) | <0.001 a,* |
| Type of infection of infective endocarditis, n (%) | 2 (1.74) | 9 (1.24) | 0.659 a |
| Underlying disease | |||
| Heart disease, n (%) | 14 (12.2) | 43 (5.91) | 0.013 a,* |
| Diabetes, n (%) | 31 (27.0) | 162 (22.3) | 0.265 a |
| Hypertension, n (%) | 55 (47.8) | 204 (28.0) | 0.594 a |
| Cancer, n (%) | 47 (40.9) | 327 (44.9) | 0.417 a |
| Concomitant medications, n (%) | |||
| NSAIDs | 36 (31.3) | 222 (30.5) | 0.861 a |
| Furosemide | 37 (32.2) | 128 (17.6) | <0.001 a,* |
| Aminoglycosides | 2 (1.74) | 8 (1.10) | 0.634 b |
| AMPH-B | 5 (4.35) | 3 (0.41) | 0.002 b,* |
| Vasopressor drugs | 32 (27.8) | 55 (7.55) | <0.001 a,* |
| TAZ/PIPC | 26 (22.6) | 93 (12.8) | 0.005 a,* |
| Nitric acid-based medicine | 8 (6.96) | 40 (5.49) | 0.530 a |
| Tacrolimus | 6 (5.22) | 29 (3.98) | 0.461 a |
| Univariate Analysis | Multiple Analysis | |||||
|---|---|---|---|---|---|---|
| Independent Variable | OR | OR (95% CI) | p-Value | OR | OR (95% CI) | p-Value |
| Type of infection of infective endocarditis | 1.41 | 0.30–6.63 | 0.660 | - | - | - |
| Underlying disease | ||||||
| Heart disease | 2.21 | 1.17–4.18 | 0.015 ☨ | 1.54 | 0.77–3.07 | 0.227 |
| Diabetes | 1.29 | 0.82–2.02 | 0.265 | - | - | - |
| Hypertension | 1.12 | 0.73–1.73 | 0.594 | - | - | - |
| Cancer | 0.85 | 0.57–1.26 | 0.417 | - | - | - |
| Concomitant medications | ||||||
| NSAIDs | 1.04 | 0.68–1.59 | 0.861 | - | - | - |
| Furosemide | 2.22 | 1.44–3.44 | 0.001 ☨ | 1.74 | 1.09–2.76 | 0.021 * |
| Aminoglycosides | 1.59 | 0.33–7.60 | 0.559 | - | - | - |
| AMPH-B | 10.99 | 2.59–46.61 | 0.001 ☨ | 9.32 | 2.07–41.71 | 0.004 * |
| Vasopressor drugs | 4.78 | 2.89–7.72 | <0.001 ☨ | 3.68 | 2.20–6.18 | <0.001 * |
| TAZ/PIPC | 2.00 | 1.22–3.25 | 0.006 ☨ | 1.73 | 1.03–2.91 | 0.038 * |
| Nitric acid-based medicine | 1.29 | 0.59–2.82 | 0.531 | - | - | - |
| Tacrolimus | 1.33 | 0.54–3.27 | 0.539 | - | - | - |
| BMI ≥ 30 | 2.05 | 0.94–4.44 | 0.070 ☨ | 1.95 | 0.87–4.39 | 0.105 |
| CCr < 86.6 mL/min | 1.05 | 0.64–1.71 | 0.855 | - | - | - |
| Thomson et al. [21] | Present Study | ||
|---|---|---|---|
| CCr (mL/min) | Single Dose (mg) | Dosing Interval (h) | Standard Dose |
| <20 | 500 | 48 | 250–750 mg/48 h |
| 20–29 | 500 | 24 | 250–750 mg/day |
| 30–39 | 750 | 24 | 500–1000 mg/day |
| 40–54 | 500 | 12 | 500–1500 mg/day |
| 55–74 | 750 | 12 | 1000–2000 mg/day |
| 75–89 | 1000 | 12 | 1500–2500 mg/day |
| 90–110 | 1250 | 12 | 2000–3000 mg/day |
| >110 | 1500 | 12 | 2500–3500 mg/day |
Publisher’s Note: MDPI stays neutral with regard to jurisdictional claims in published maps and institutional affiliations. |
© 2020 by the authors. Licensee MDPI, Basel, Switzerland. This article is an open access article distributed under the terms and conditions of the Creative Commons Attribution (CC BY) license (http://creativecommons.org/licenses/by/4.0/).
Share and Cite
Miyai, T.; Imai, S.; Kashiwagi, H.; Sato, Y.; Kadomura, S.; Yoshida, K.; Yoshimura, E.; Teraya, T.; Tsujimoto, T.; Kawamoto, Y.; et al. A Risk Prediction Flowchart of Vancomycin-Induced Acute Kidney Injury to Use When Starting Vancomycin Administration: A Multicenter Retrospective Study. Antibiotics 2020, 9, 920. https://0-doi-org.brum.beds.ac.uk/10.3390/antibiotics9120920
Miyai T, Imai S, Kashiwagi H, Sato Y, Kadomura S, Yoshida K, Yoshimura E, Teraya T, Tsujimoto T, Kawamoto Y, et al. A Risk Prediction Flowchart of Vancomycin-Induced Acute Kidney Injury to Use When Starting Vancomycin Administration: A Multicenter Retrospective Study. Antibiotics. 2020; 9(12):920. https://0-doi-org.brum.beds.ac.uk/10.3390/antibiotics9120920
Chicago/Turabian StyleMiyai, Takayuki, Shungo Imai, Hitoshi Kashiwagi, Yuki Sato, Shota Kadomura, Kenji Yoshida, Eri Yoshimura, Toshiaki Teraya, Takashi Tsujimoto, Yukari Kawamoto, and et al. 2020. "A Risk Prediction Flowchart of Vancomycin-Induced Acute Kidney Injury to Use When Starting Vancomycin Administration: A Multicenter Retrospective Study" Antibiotics 9, no. 12: 920. https://0-doi-org.brum.beds.ac.uk/10.3390/antibiotics9120920