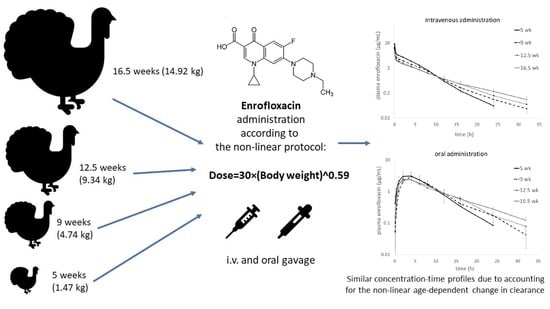
Allometric Optimization of Enrofloxacin Dosage in Growing Male Turkeys: Empirical Evidence for Improved Internal Exposure

 , ,
, ,
Abstract
:
1. Introduction
2. Results
3. Discussion
4. Materials and Methods
4.1. Animals
4.2. Pharmacokinetic Study
4.3. Determination of Enrofloxacin and Ciprofloxacin in Plasma
4.4. Pharmacokinetic Analysis
4.5. Statistical Analysis of Pharmacokinetic Parameters
5. Conclusions
Supplementary Materials
Author Contributions
Funding
Acknowledgments
Conflicts of Interest
References
- Lhermie, G.; Gröhn, Y.T.; Raboisson, D. Addressing antimicrobial resistance: an overview of priority actions to prevent suboptimal antimicrobial use in food-animal production. Front. Microbiol. 2017, 7, 2114. [Google Scholar] [CrossRef] [Green Version]
- Poźniak, B.; Tikhomirov, M.; Motykiewicz-Pers, K.; Bobrek, K.; Świtała, M. The influence of age and body weight gain on enrofloxacin pharmacokinetics in turkeys—Allometric approach to dose optimization. J. Vet. Pharmacol. Ther. 2020, 43, 67–78. [Google Scholar] [CrossRef] [PubMed]
- Fairchild, A.S.; Grimes, J.L.; Wineland, M.J.; Jones, F.T. The effect of hen age on antibiotic resistance of Escherichia coli isolates from Turkey poults. J. Appl. Poult. Res. 2000, 9, 487–495. [Google Scholar] [CrossRef]
- Romvári, R.; Petrási, Z.; Süto, Z.; Szabó, A.; Andrássy, G.; Garamvölgyi, R.; Horn, P. Noninvasive characterization of the turkey heart performance and its relationship to skeletal muscle volume. Poult. Sci. 2004, 83, 696–700. [Google Scholar] [CrossRef] [PubMed] [Green Version]
- Świtała, M.; Poźniak, B.; Pasławska, U.; Grabowski, T.; Motykiewicz-Pers, K.; Bobrek, K. Metronidazole pharmacokinetics during rapid growth in turkeys—Relation to changes in haemodynamics and drug metabolism. J. Vet. Pharmacol. Ther. 2016, 39, 373–380. [Google Scholar] [CrossRef] [PubMed]
- Poźniak, B.; Pawłowski, P.; Pasławska, U.; Grabowski, T.; Suszko, A.; Lis, M.; Świtała, M. The influence of rapid growth in broilers on florfenicol pharmacokinetics–allometric modelling of the pharmacokinetic and haemodynamic parameters. Br. Poult. Sci. 2017, 58, 184–191. [Google Scholar] [CrossRef]
- Poźniak, B.; Pasławska, U.; Motykiewicz-Pers, K.; Świtała, M. The influence of growth and E. coli endotoxaemia on amoxicillin pharmacokinetics in turkeys. Br. Poult. Sci. 2017, 58, 462–468. [Google Scholar] [CrossRef]
- Poźniak, B.; Tikhomirov, M.; Motykiewicz-Pers, K.; Bobrek, K.; Świtala, M. Allometric analysis of tylosin tartrate pharmacokinetics in growing male turkeys. J. Vet. Sci. 2020, 21, 1–11. [Google Scholar] [CrossRef]
- Santos, M.D.F.; Vermeersch, H.; Remon, J.P.; Schelkens, M.; De Backer, P.; Van Bree, H.J.J.; Ducatelle, R.; Haesebrouck, F. Pharmacokinetics and bioavailability of doxycycline in turkeys. J. Vet. Pharmacol. Ther. 1996, 19, 274–280. [Google Scholar] [CrossRef]
- Poźniak, B.; Motykiewicz-Pers, K.; Grabowski, T.; Świtała, M. The influence of rapid growth on sodium salicylate pharmacokinetics in male turkeys. J. Vet. Pharmacol. Ther. 2018, 41, 163–165. [Google Scholar] [CrossRef]
- Mahmood, I. Dosing in children: A critical review of the pharmacokinetic allometric scaling and modelling approaches in paediatric drug development and clinical settings. Clin. Pharmacokinet. 2014, 53, 327–346. [Google Scholar] [CrossRef] [PubMed]
- Hunter, R.P.; Isaza, R. Concepts and issues with interspecies scaling in zoological pharmacology. J. Zoo Wildl. Med. 2008, 39, 517–526. [Google Scholar] [CrossRef] [PubMed]
- Haritova, A.M.; Lashev, L.D. Comparison of the pharmacokinetics of seven fluoroquinolones in mammalian and bird species using allometric analysis. Bulg. J. Vet. Med. 2009, 12, 3–24. [Google Scholar]
- Huang, Q.; Riviere, J.E. The application of allometric scaling principles to predict pharmacokinetic parameters across species. Expert Opin. Drug Metab. Toxicol. 2014, 10, 1241–1253. [Google Scholar] [CrossRef] [PubMed]
- Boxenbaum, H. Interspecies scaling, allometry, physiological time, and the ground plan of pharmacokinetics. J. Pharmacokinet. Biopharm. 1982, 10, 201–227. [Google Scholar] [CrossRef]
- Riviere, J.E.; Martin-Jimenez, T.; Sundlof, S.F.; Craigmill, A.L. Interspecies allometric analysis of the comparative pharmacokinetics of 44 drugs across veterinary and laboratory animal species. J. Vet. Pharmacol. Ther. 1997, 20, 453–463. [Google Scholar] [CrossRef] [PubMed]
- Toutain, P.L.; Ferran, A.; Bousquet-Mélou, A. Species differences in pharmacokinetics and pharmacodynamics. In Handbook of Experimental Pharmacology; Springer: Berlin/Heidelberg, Germany, 2010; Volume 199, pp. 19–48. [Google Scholar]
- Aneliya, H.; Lashev, L. Bridging pharmacokinetics between herbivorous mammal species by allometric analysis: A case study of ceftiofur. Acta Vet. Brno 2012, 62, 207–211. [Google Scholar] [CrossRef] [Green Version]
- Sartini, I.; Łebkowska-Wieruszewska, B.; Lisowski, A.; Poapolathep, A.; Owen, H.; Giorgi, M. Concentrations in plasma and selected tissues of marbofloxacin after oral and intravenous administration in Bilgorajska geese (Anser anser domesticus). N. Z. Vet. J. 2020, 68, 31–37. [Google Scholar] [CrossRef]
- Martinez, M.; Mahmood, I.; Hunter, R.P. Allometric scaling of clearance in dogs. J. Vet. Pharmacol. Ther. 2009, 32, 411–416. [Google Scholar] [CrossRef]
- Hunter, R.P. Interspecies allometric scaling. In Handbook of Experimental Pharmacology; Springer: Berlin/Heidelberg, Germany, 2010; Volume 199, pp. 139–157. [Google Scholar]
- Toutain, P.L.; Bousquet-Mélou, A. Plasma clearance. J. Vet. Pharmacol. Ther. 2004, 27, 415–425. [Google Scholar] [CrossRef]
- McKellar, Q.A.; Sanchez Bruni, S.F.; Jones, D.G. Pharmacokinetic/pharmacodynamic relationships of antimicrobial drugs used in veterinary medicine. J. Vet. Pharmacol. Ther. 2004, 27, 503–514. [Google Scholar] [CrossRef] [PubMed]
- Toutain, P.L.; Del Castillo, J.R.E.; Bousquet-Mélou, A. The pharmacokinetic-pharmacodynamic approach to a rational dosage regimen for antibiotics. Res. Vet. Sci. 2002, 73, 105–114. [Google Scholar] [CrossRef]
- Ambrose, P.G.; Grasela, D.M. The use of Monte Carlo simulation to examine pharmacodynamic variance of drugs: Fluoroquinolone pharmacodynamics against Streptococcus pneumoniae. Diagn. Microbiol. Infect. Dis. 2000, 38, 151–157. [Google Scholar] [CrossRef]
- Vanni, M.; Meucci, V.; Tognetti, R.; Cagnardi, P.; Montesissa, C.; Piccirillo, A.; Rossi, A.M.; Di Bello, D.; Intorre, L. Fluoroquinolone resistance and molecular characterization of gyrA and parC quinolone resistance-determining regions in Escherichia coli isolated from poultry. Poult. Sci. 2014, 93, 856–863. [Google Scholar] [CrossRef]
- Toutain, P.-L.; Bousquet-Mélou, A.; Damborg, P.; Ferran, A.A.; Mevius, D.; Pelligand, L.; Veldman, K.T.; Lees, P. En route towards European clinical breakpoints for veterinary antimicrobial susceptibility testing: A position paper explaining the VetCAST approach. Front. Microbiol. 2017, 8, 2344. [Google Scholar] [CrossRef] [Green Version]
- Mahmood, I. Application of fixed exponent 0.75 to the prediction of human drug clearance: An inaccurate and misleading concept. Drug Metabol. Drug Interact. 2009, 24, 57–81. [Google Scholar] [CrossRef]
- Vermeulen, B.; Remon, J.P. The oral bioavailability of ibuprofen enantiomers in broiler chickens. J. Vet. Pharmacol. Ther. 2001, 24, 105–109. [Google Scholar] [CrossRef]
- Guo, M.; Bughio, S.; Sun, Y.; Zhang, Y.; Dong, L.; Dai, X.; Wang, L. Age-related P-glycoprotein expression in the intestine and affecting the pharmacokinetics of orally administered enrofloxacin in broilers. PLoS ONE 2013, 8, 1–10. [Google Scholar] [CrossRef]
- Gutierrez, L.; Miranda-Calderon, J.E.; Garcia-Gutierrez, P.; Sumano, H. Physicochemical characterization and pharmacokinetics in broiler chickens of a new recrystallized enrofloxacin hydrochloride dihydrate. J. Vet. Pharmacol. Ther. 2015, 38, 183–189. [Google Scholar] [CrossRef]
- Randall, L.; Ridley, A.; Lemma, F.; Hale, C.; Davies, R. In vitro investigations into the use of antimicrobials in combination to maintain efficacy of fluoroquinolones in poultry. Res. Vet. Sci. 2016, 108, 47–53. [Google Scholar] [CrossRef]
- García Ovando, H.; Gorla, N.; Luders, C.; Poloni, G.; Errecalde, C.; Prieto, G.; Puelles, I. Comparative pharmacokinetics of enrofloxacin and ciprofloxacin in chickens. J. Vet. Pharmacol. Ther. 1999, 22, 209–212. [Google Scholar] [CrossRef] [PubMed]
- Cox, S.K.; Cottrell, M.B.; Smith, L.; Papich, M.G.; Frazier, D.L.; Bartges, J. Allometric analysis of ciprofloxacin and enrofloxacin pharmacokinetics across species. J. Vet. Pharmacol. Ther. 2004, 27, 139–146. [Google Scholar] [CrossRef] [PubMed]
- Griffioen, J.A.; Lewbart, G.A.; Papich, M.G. Population pharmacokinetics of enrofloxacin and its metabolite ciprofloxacin in clinically diseased or injured Eastern box turtles (Terrapene carolina carolina), yellow-bellied sliders (Trachemys scripta scripta), and river cooters (Pseudemys concinna). J. Vet. Pharmacol. Ther. 2020, 43, 222–230. [Google Scholar] [CrossRef] [PubMed]
- Roberts, J.A.; Kruger, P.; Paterson, D.L.; Lipman, J. Antibiotic resistance—What’s dosing got to do with it? Crit. Care Med. 2008, 36, 2433–2440. [Google Scholar] [CrossRef] [PubMed]
- Directive 2010/63/EU. Directive 2010/63/EU of the European Parliament and of the Council of 22 September 2010 on the protection of animals used for scientific purposes (Text with EEA relevance). Off. J. Eur. Union 2010, 276, 33–79. [Google Scholar]
- Woodward, A.; Whittem, T. The lower limit of quantification in pharmacokinetic analyses. J. Vet. Pharmacol. Ther. 2019, 42, 585–587. [Google Scholar] [CrossRef]


| Parameter | Unit | Age Groups (Body Weight ± SD), n = 10 Each | ||||
|---|---|---|---|---|---|---|
| 5 Weeks (1.55 ± 0.07 kg) | 9 Weeks (4.74 ± 0.46 kg) | 12.5 Weeks (9.34 ± 1.05 kg) | 16.5 Weeks (15.11 ± 1.61 kg) | |||
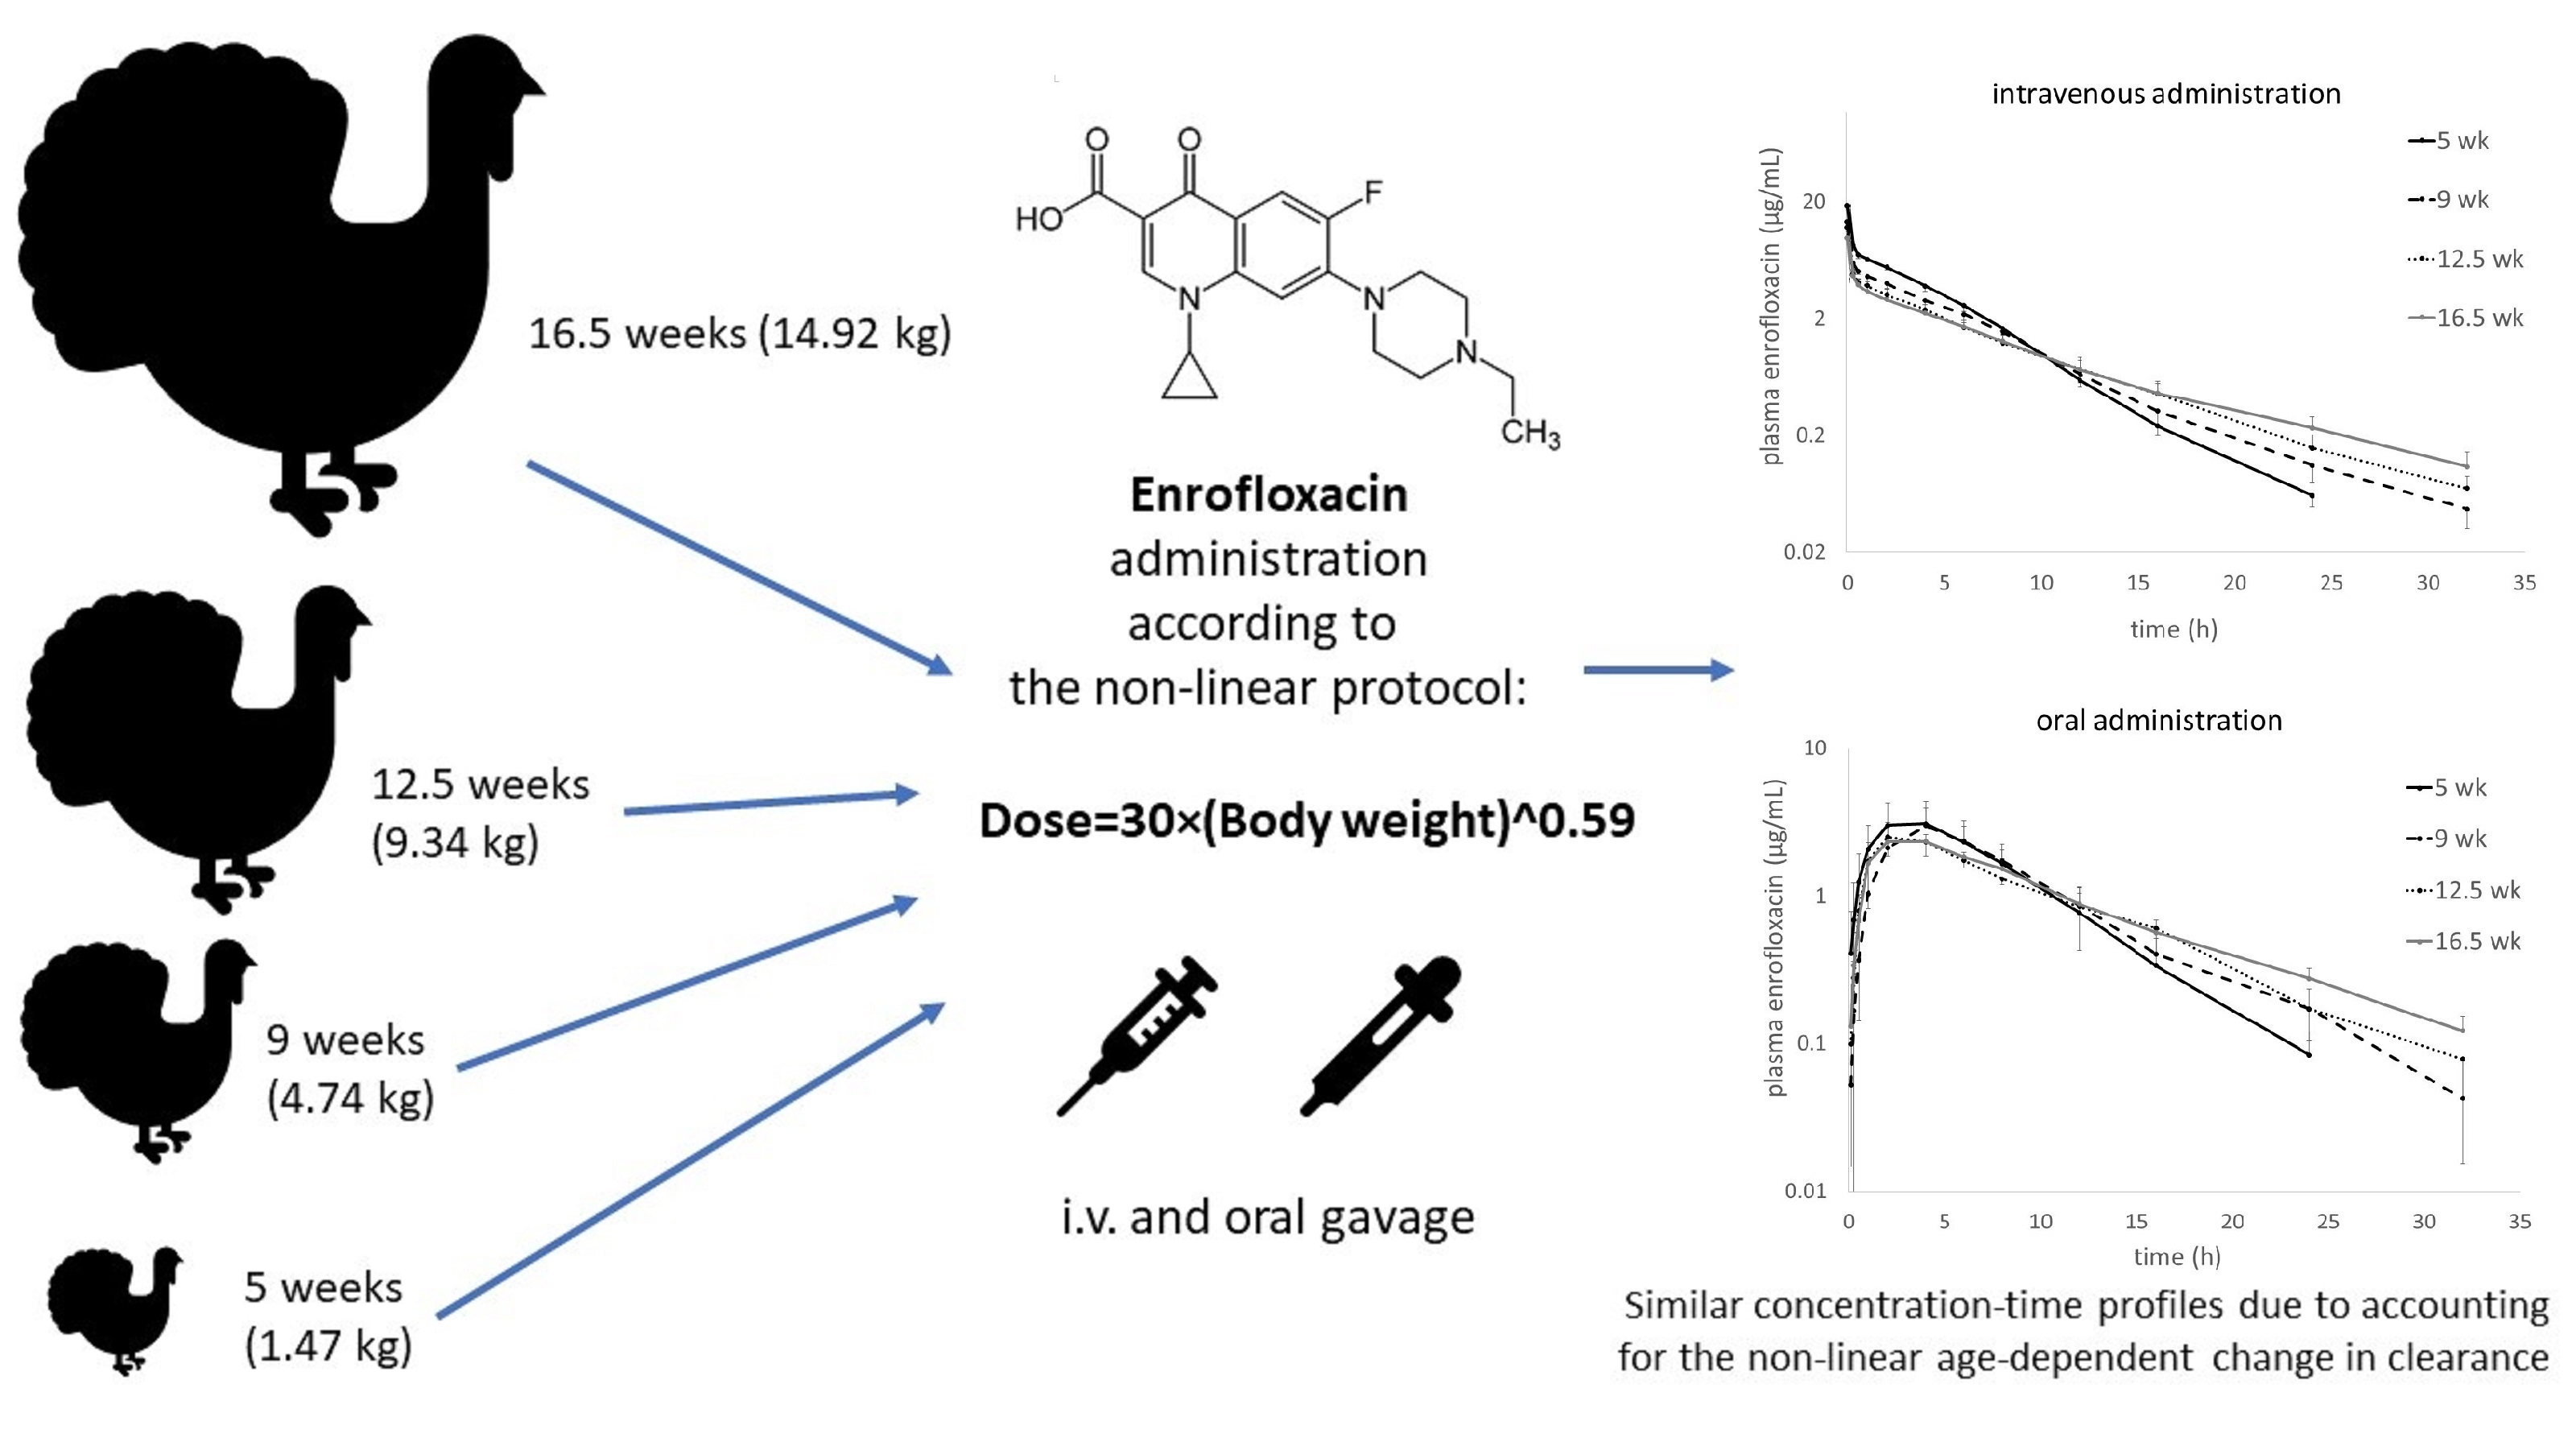
| ENR | AUCinf | mg × h/L | 42.58 ± 2.30 a | 35.49 ± 2.73 b | 31.71 ± 4.34 b | 31.67 ± 3.48 b |
| CVgroup | % | 5.4 | 7.7 | 13.7 | 11.0 | |
| CVpooled | % | 15.7 | ||||
| AUClast | mg × h/L | 42.32 ± 2.29 a | 35.24 ± 2.69 b | 31.20 ± 4.29 b,c | 30.74 ± 3.14 c | |
| AUMCinf | mg × h2/L | 191.0 ± 14.4 a | 204.4 ± 27.6 a | 222.7 ± 42.2 a,b | 259.8 ± 51.3 b | |
| MRTinf | h | 4.48 ± 0.17 a | 5.74 ± 0.43 b | 6.99 ± 0.56 c | 8.14 ± 0.75 d | |
| CL(rel) | L/h/kg | 0.59 ± 0.03 a | 0.45 ± 0.05 b | 0.39 ± 0.05 c | 0.33 ± 0.04 d | |
| Vdss(rel) | L/kg | 2.53 ± 0.13 a | 2.47 ± 0.17 b | 2.51 ± 0.27 b,c | 2.32 ± 0.18 c | |
| T1/2el | h | 3.29 ± 0.16 a | 4.52 ± 0.30 b | 5.50 ± 0.46 c | 6.38 ± 0.58 d | |
| Cmax | µg/mL | 18.56 ± 1.29 a | 13.90 ± 2.13 b | 12.48 ± 1.78 b,c | 10.43 ± 2.02 c | |
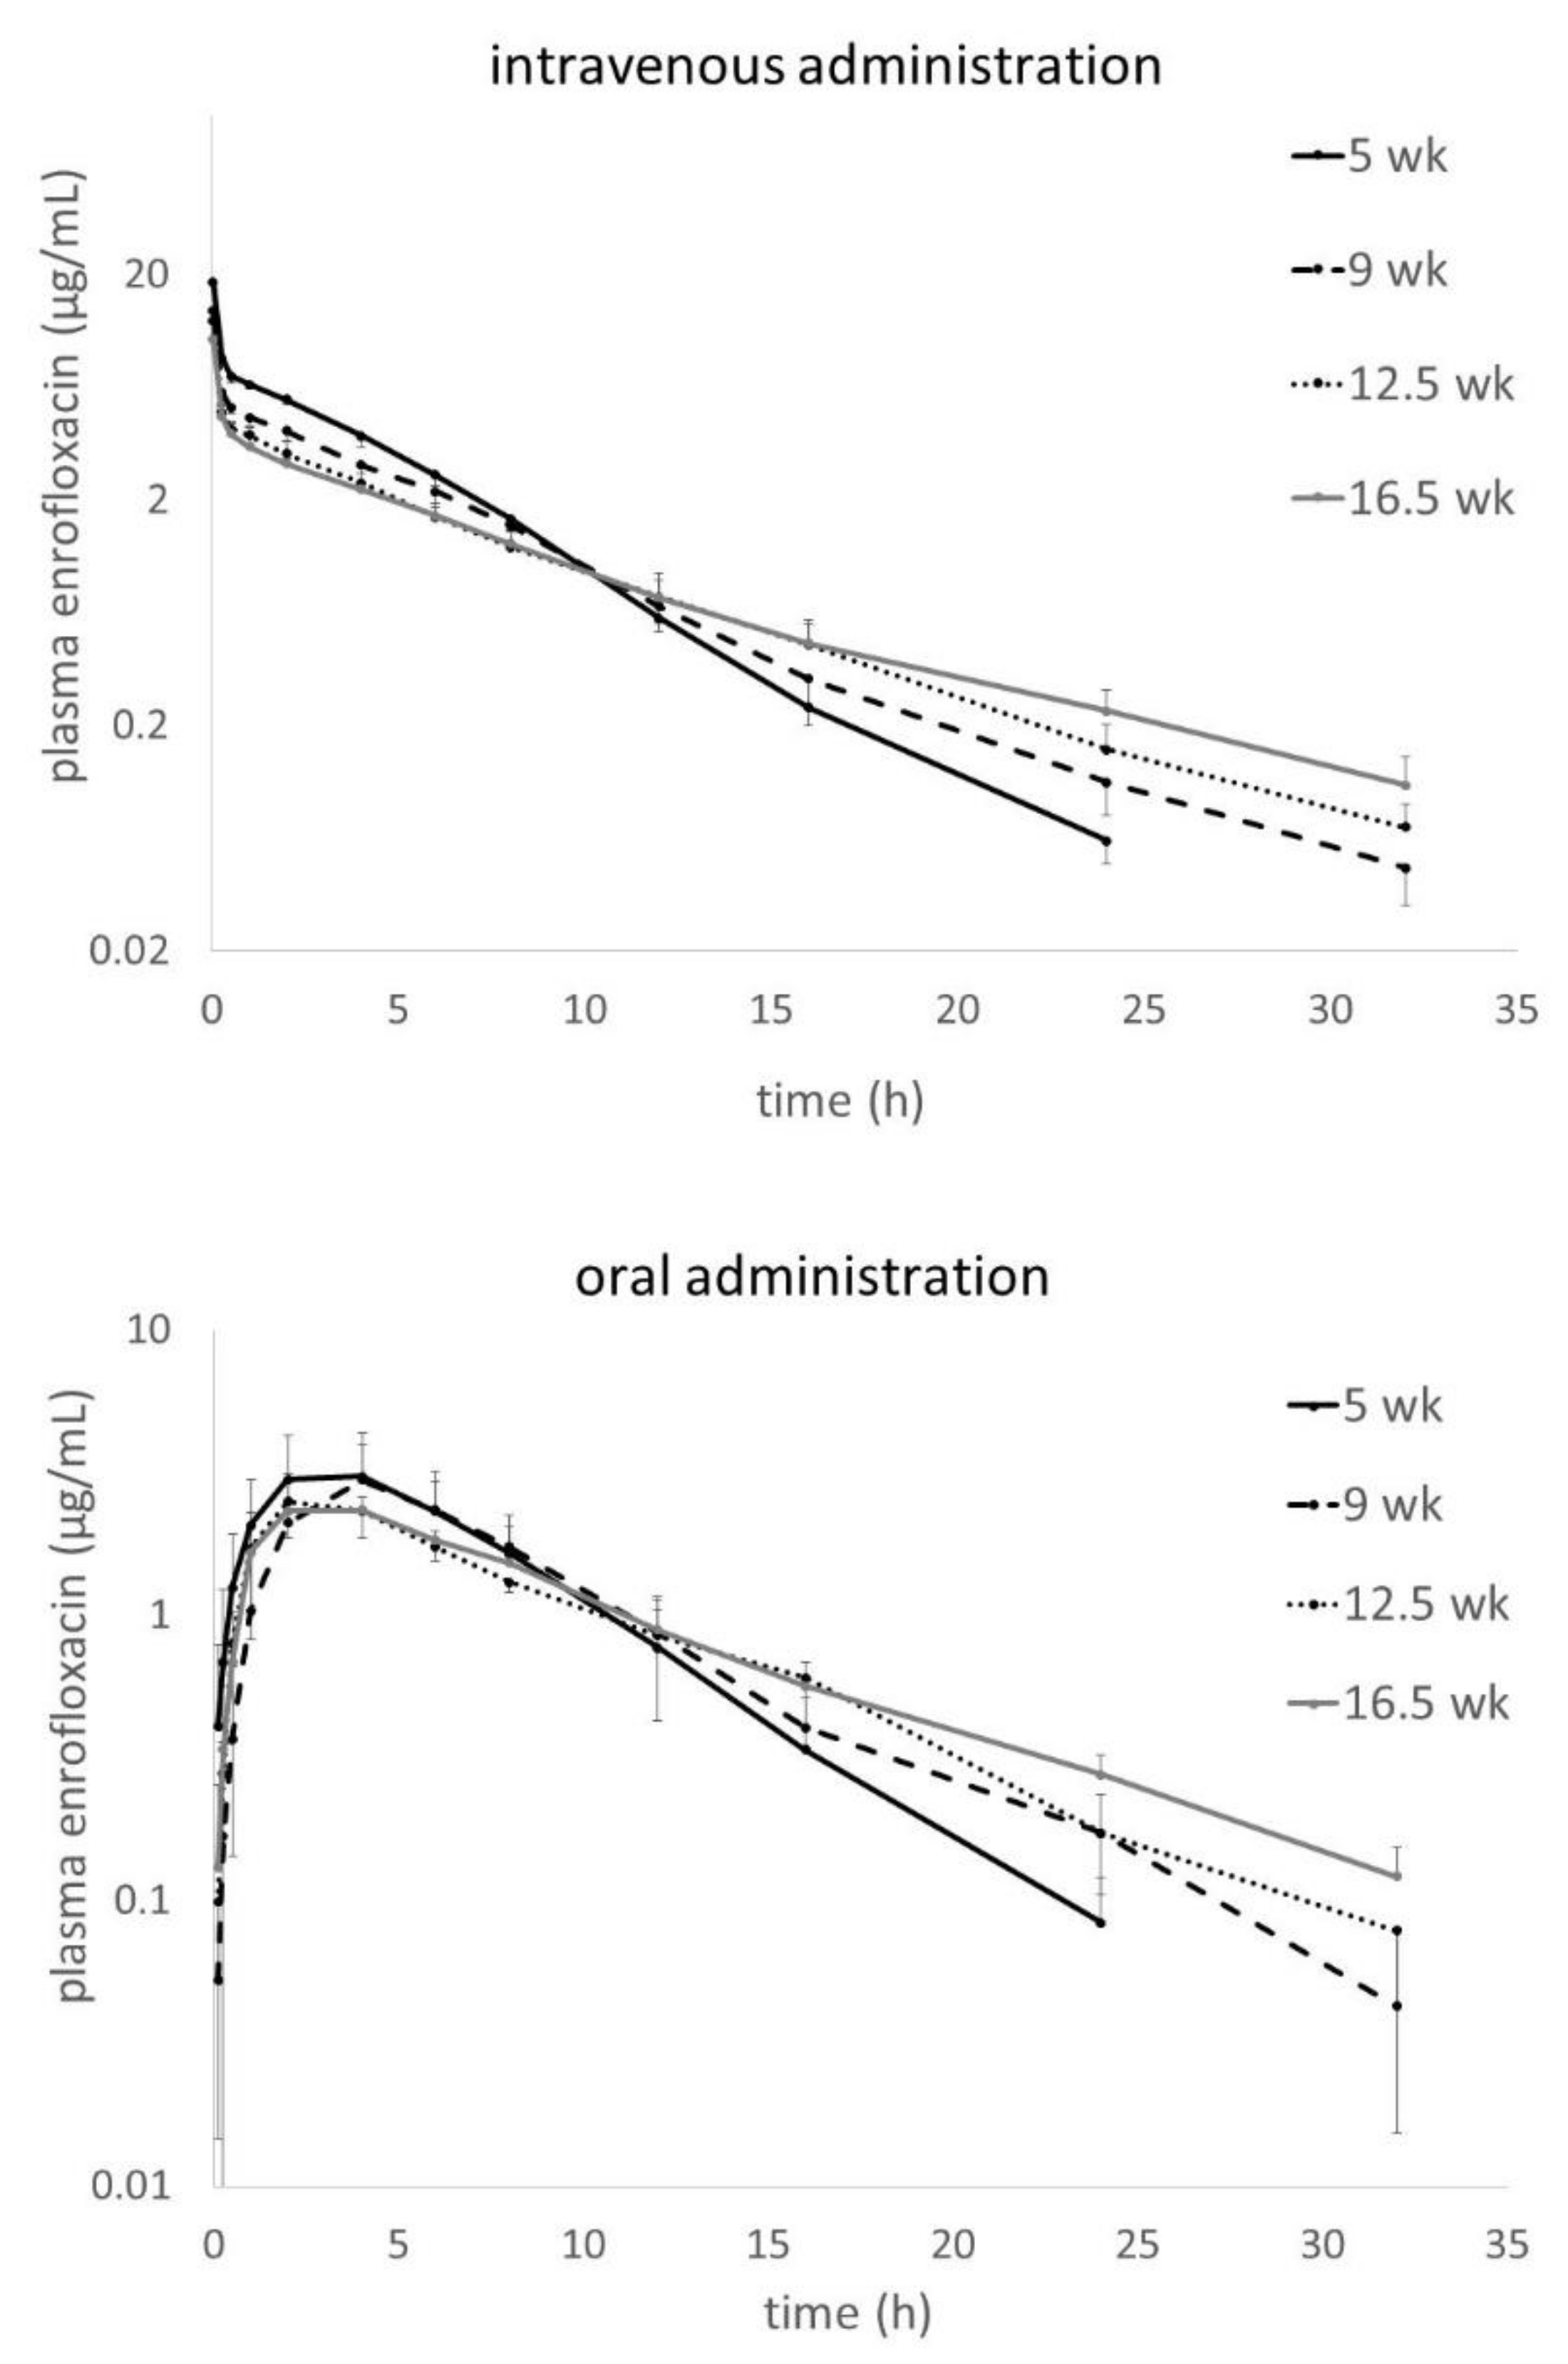
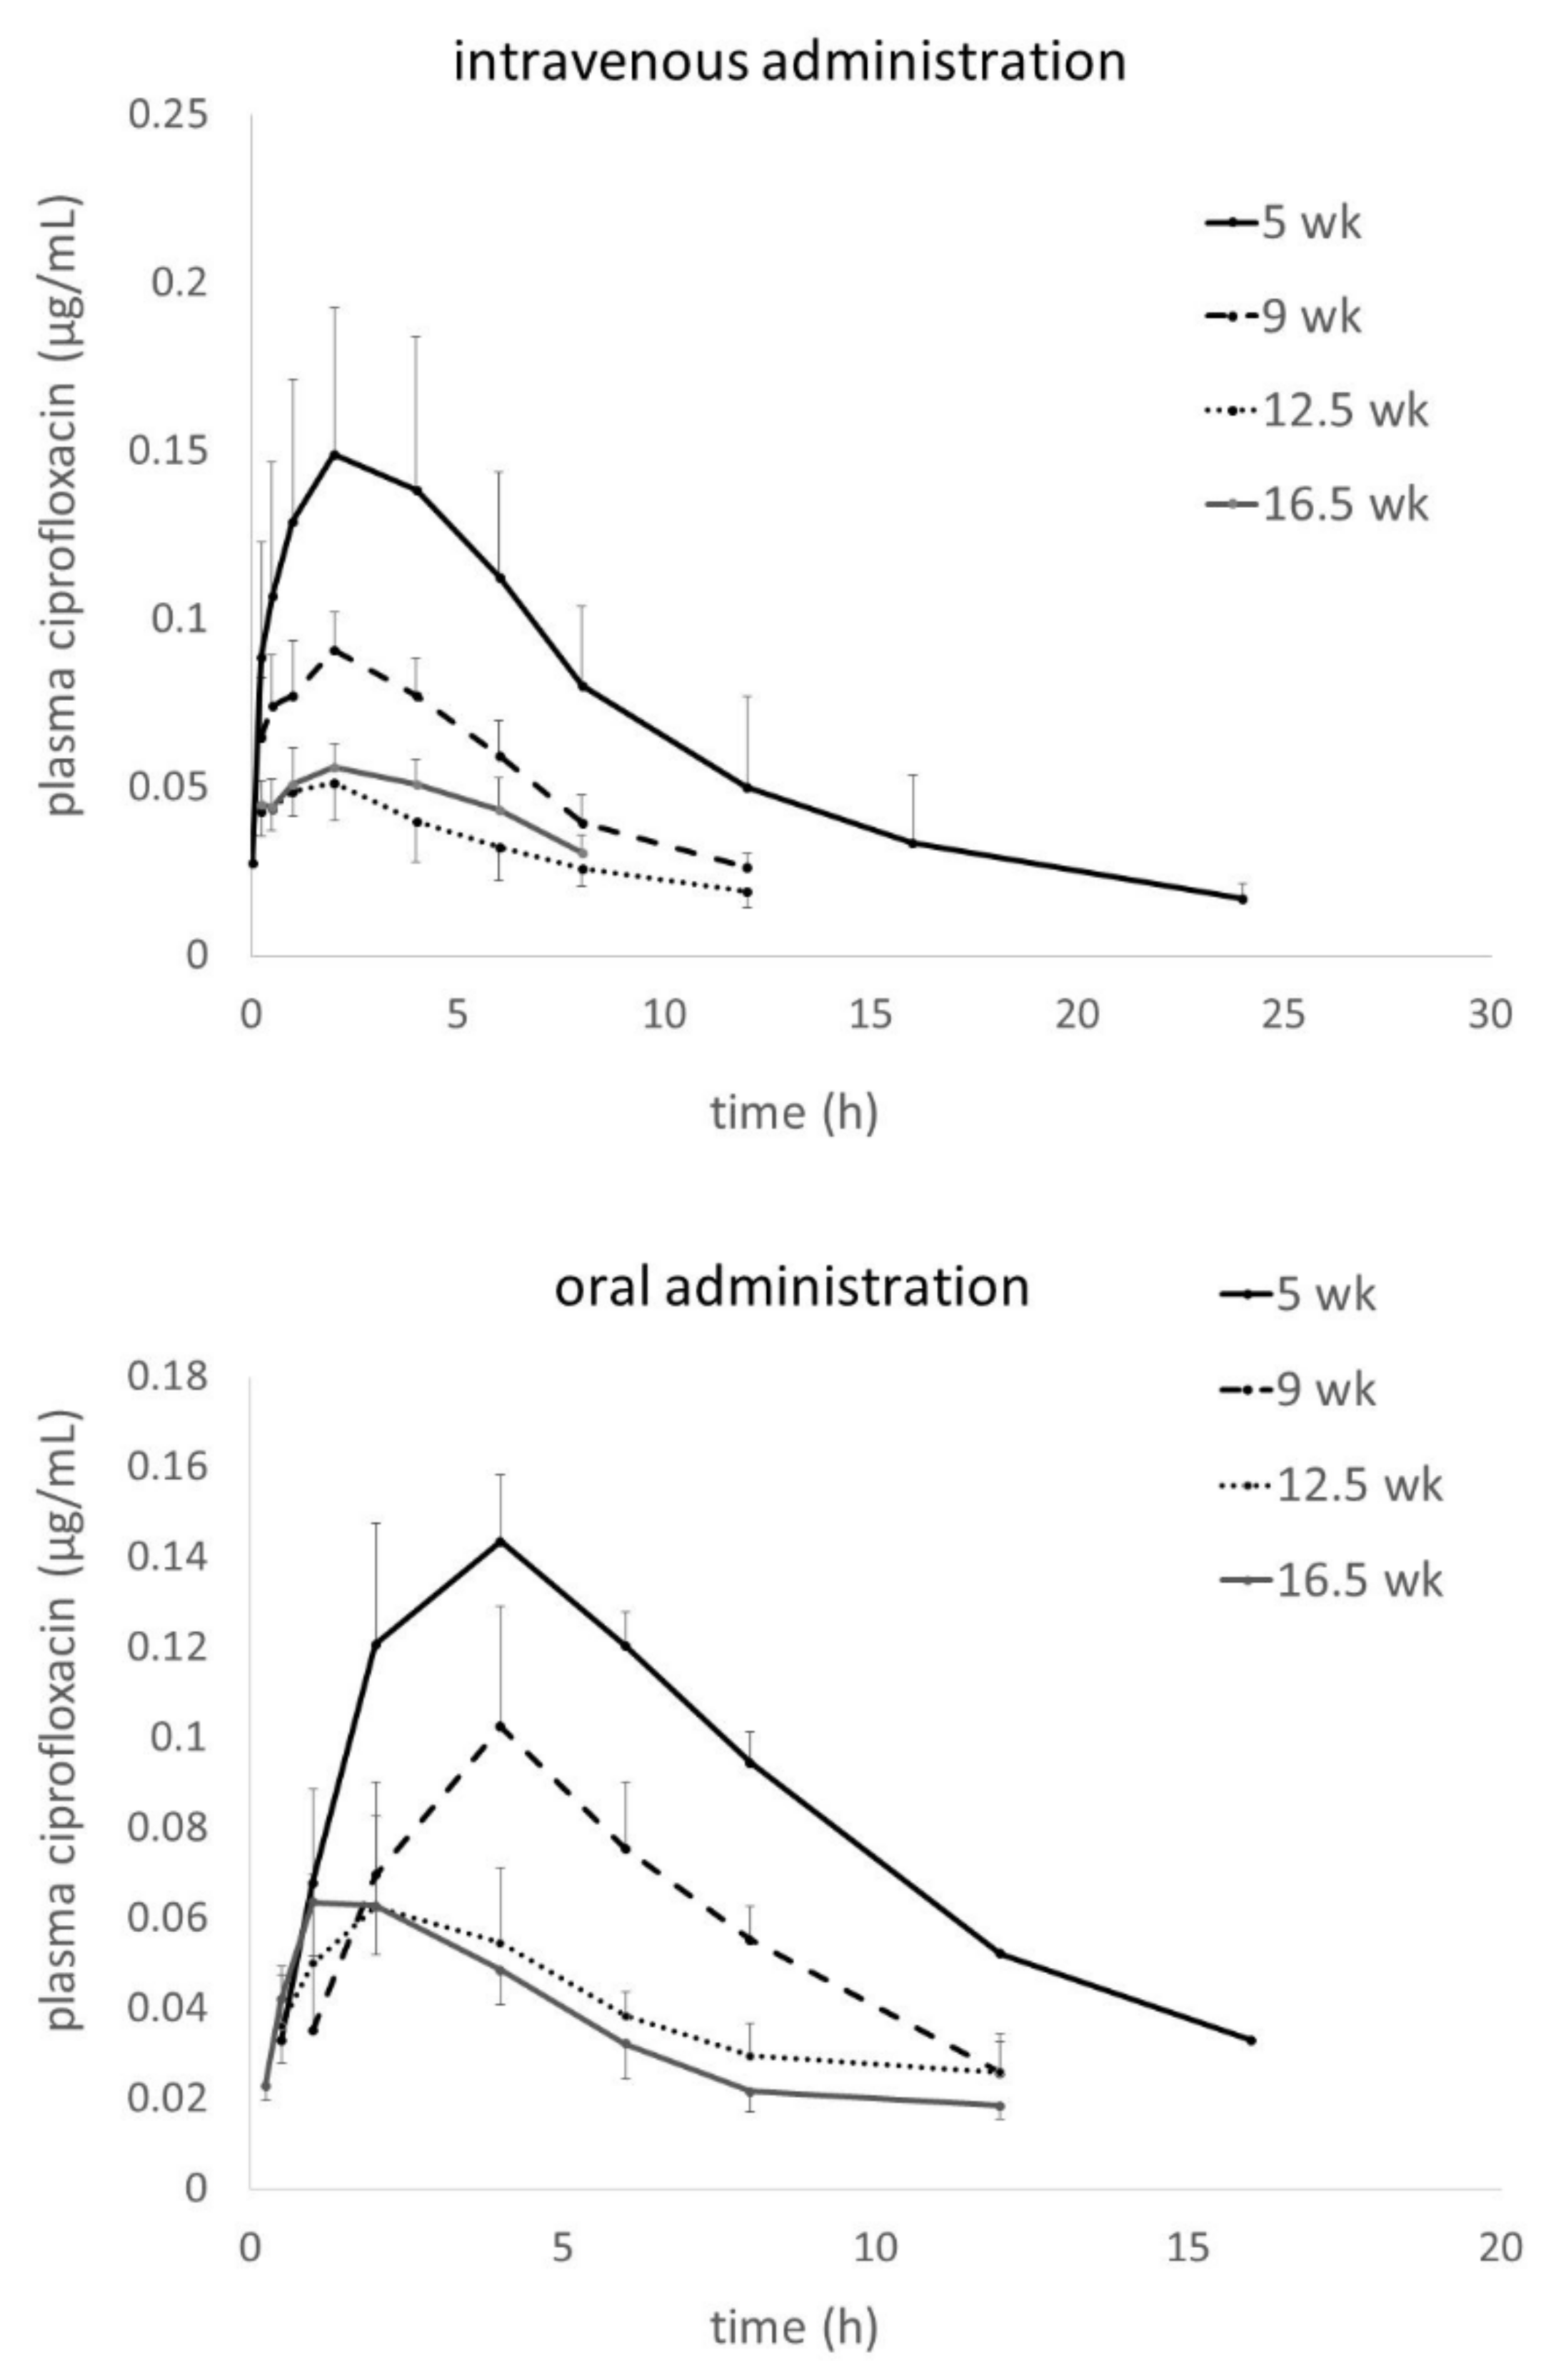
| CIP | AUClast | mg × h/L | 1.49 ± 0.44 a | 0.64 ± 0.11 b | 0.36 ± 0.11 b | 0.36 ± 0.04 b |
| Cmax | µg/mL | 0.15 ± 0.04 a | 0.09 ± 0.01 b | 0.05 ± 0.01 c | 0.06 ± 0.01 c | |
| Tmax | h | 2 (1–6) | 2 (0.5–2) | 2 (0.25–4) | 2 (0.25–4) | |
| AUCCIP/AUCENR | % | 3.51 ± 1.03 a | 1.84 ± 0.37 b | 1.15 ± 0.28 b | 1.18 ± 0.15 b | |
| Parameter | Unit | Age Groups (Body Weight ± SD), n = 10 Each | ||||
|---|---|---|---|---|---|---|
| 5 Weeks (1.45 ± 0.07 kg) | 9 Weeks (4.53 ± 0.30 kg) | 12.5 Weeks (8.98 ± 0.48 kg) | 16.5 Weeks (14.53 ± 1.61 kg) | |||
| ENR | AUCinf | mg × h/L | 28.38 ± 9.15 | 27.07 ± 5.12 | 27.82 ± 5.93 | 28.92 ± 2.52 |
| CVgroup | % | 32.2 | 21.3 | 18.9 | 8.7 | |
| CVpooled | % | 22.1 | ||||
| AUClast | mg × h/L | 27.90 ± 9.09 | 26.31 ± 5.57 | 27.52 ± 5.93 | 27.77 ± 2.36 | |
| AUMCinf | mg × h2/L | 194.7 ± 66.2 a | 256.6 ± 95.1 a,b | 232.7 ± 51.4 a,b | 300.5 ± 48.0 b | |
| MRTinf | h | 6.86 ± 1.27 a | 9.48 ± 3.14 b | 8.48 ± 1.45 a,b | 10.36 ± 1.23 b | |
| MAT * | h | 2.38 | 3.74 | 1.50 | 2.22 | |
| T1/2el | h | 3.76 ± 0.55 a | 5.76 ± 2.26 b,c | 4.49 ± 0.69 a,b | 6.61 ± 0.56 c | |
| Cmax | µg/mL | 3.19 ± 1.18 | 2.62 ± 0.45 | 3.13 ± 0.72 | 2.55 ± 0.39 | |
| Tmax | h | 3 (1–6) | 2 (2–16) | 4 (4–6) | 2 (2–4) | |
| F * | % | 66.7 | 76.3 | 87.8 | 91.29 | |
| CIP | AUClast | mg × h/L | 1.36 ± 0.22 a | 0.67 ± 0.14 b | 0.44 ± 0.12 c | 0.38 ± 0.08 c |
| Cmax | µg/mL | 0.15 ± 0.04 a | 0.11 ± 0.02 b | 0.06 ± 0.02 c | 0.07 ± 0.01 c | |
| Tmax | h | 4 (2–8) a | 4 (4–6) a | 2 (0.5–16) a,b | 1.5 (0.5–2) b | |
| AUCCIP/AUCENR | % | 6.01 ± 3.63 a | 2.64 ± 0.60 b | 1.76 ± 0.94 b | 1.37 ± 0.27 b | |
Publisher’s Note: MDPI stays neutral with regard to jurisdictional claims in published maps and institutional affiliations. |
© 2020 by the authors. Licensee MDPI, Basel, Switzerland. This article is an open access article distributed under the terms and conditions of the Creative Commons Attribution (CC BY) license (http://creativecommons.org/licenses/by/4.0/).
Share and Cite
Poźniak, B.; Tikhomirov, M.; Motykiewicz-Pers, K.; Bobrek, K.; Świtała, M. Allometric Optimization of Enrofloxacin Dosage in Growing Male Turkeys: Empirical Evidence for Improved Internal Exposure. Antibiotics 2020, 9, 925. https://0-doi-org.brum.beds.ac.uk/10.3390/antibiotics9120925
Poźniak B, Tikhomirov M, Motykiewicz-Pers K, Bobrek K, Świtała M. Allometric Optimization of Enrofloxacin Dosage in Growing Male Turkeys: Empirical Evidence for Improved Internal Exposure. Antibiotics. 2020; 9(12):925. https://0-doi-org.brum.beds.ac.uk/10.3390/antibiotics9120925
Chicago/Turabian StylePoźniak, Błażej, Marta Tikhomirov, Karolina Motykiewicz-Pers, Kamila Bobrek, and Marcin Świtała. 2020. "Allometric Optimization of Enrofloxacin Dosage in Growing Male Turkeys: Empirical Evidence for Improved Internal Exposure" Antibiotics 9, no. 12: 925. https://0-doi-org.brum.beds.ac.uk/10.3390/antibiotics9120925