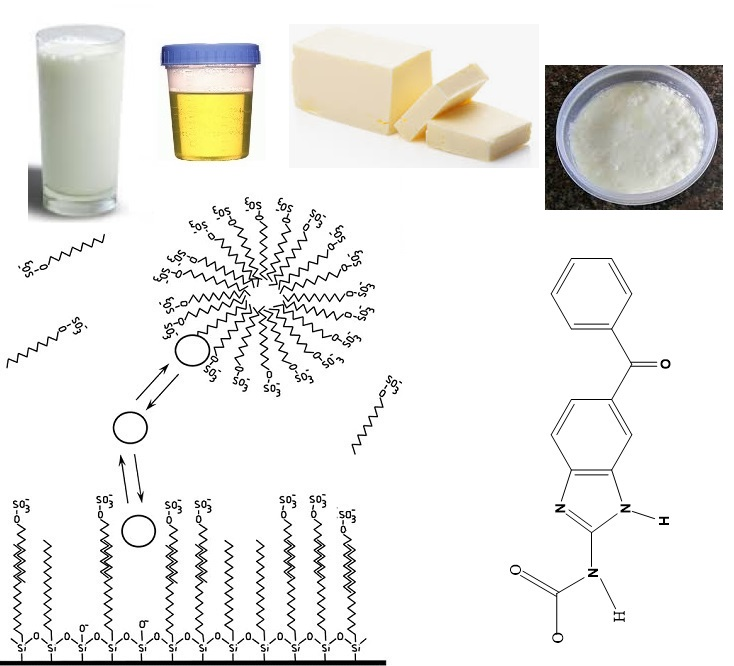
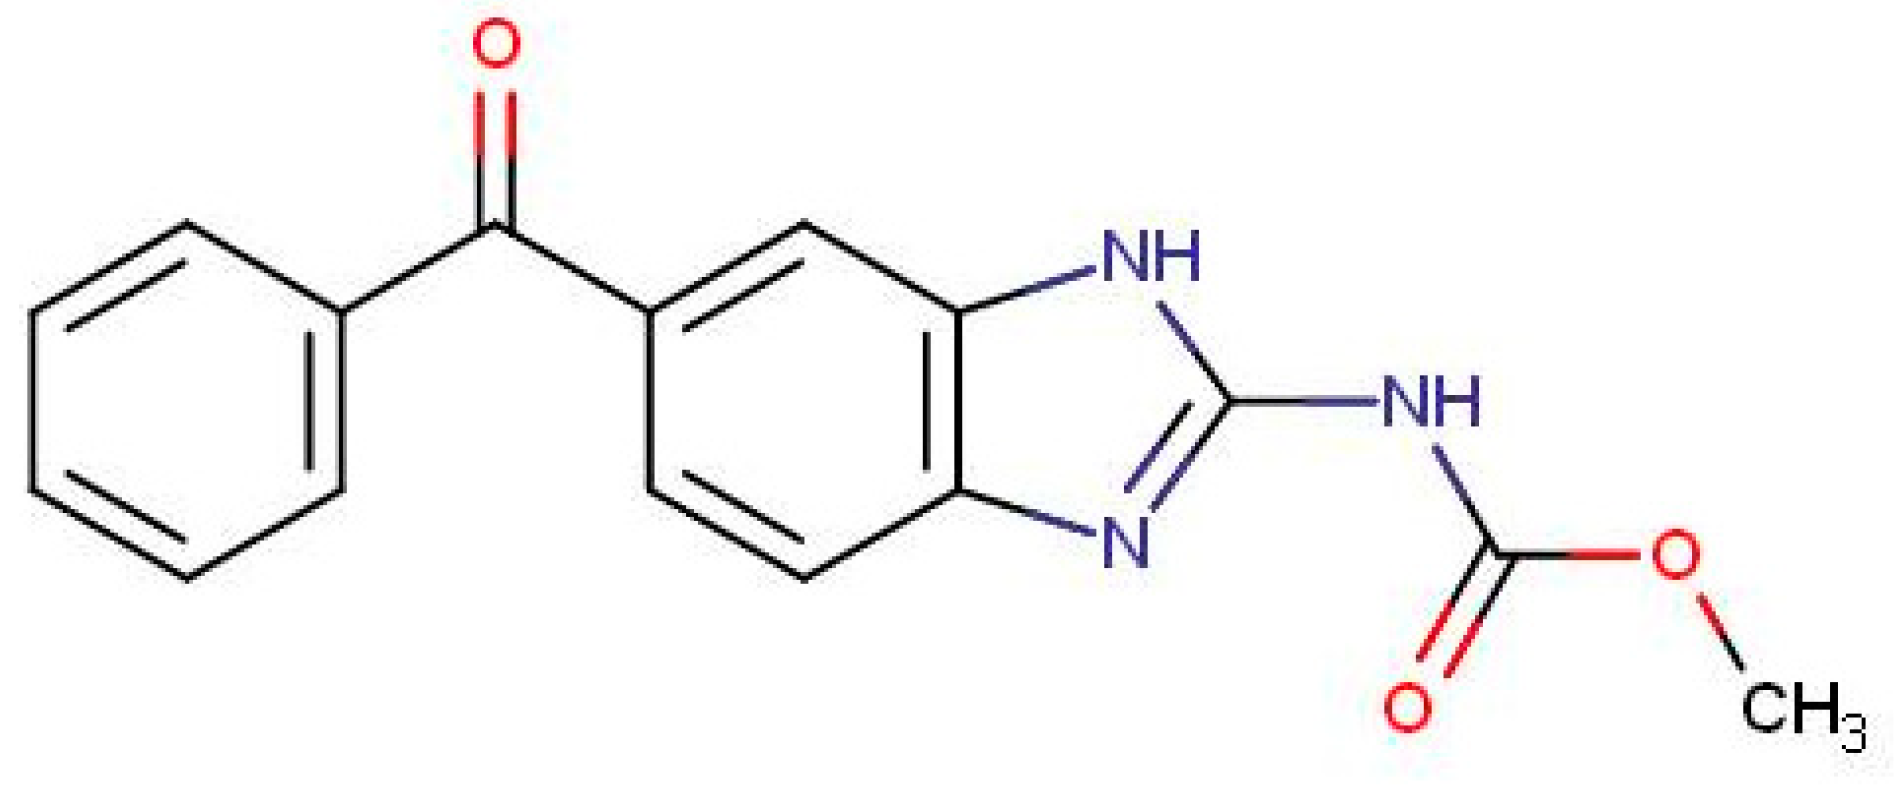
Use of Micellar Liquid Chromatography to Determine Mebendazole in Dairy Products and Breeding Waste from Bovine Animals


Abstract
:
1. Introduction
2. Materials and Methods
2.1. Chemical and Reagents
2.2. Preparation of Solutions
2.3. Chromatographic Conditions
2.4. Sample Collection and Processing
2.5. Statistical Calculations for Calibration Evaluation
3. Results and Discussion
3.1. Optimization of the Chromatographic Conditions
3.1.1. Optimization of the Detection Conditions
3.1.2. Optimization of Surfactant Concentration
3.1.3. Optimization of pH
3.1.4. Optimization of the Organic Solvent
3.2. Method Validation
3.2.1. Instrumental Calibration Range and Sensitivity
3.2.2. Ruggedness
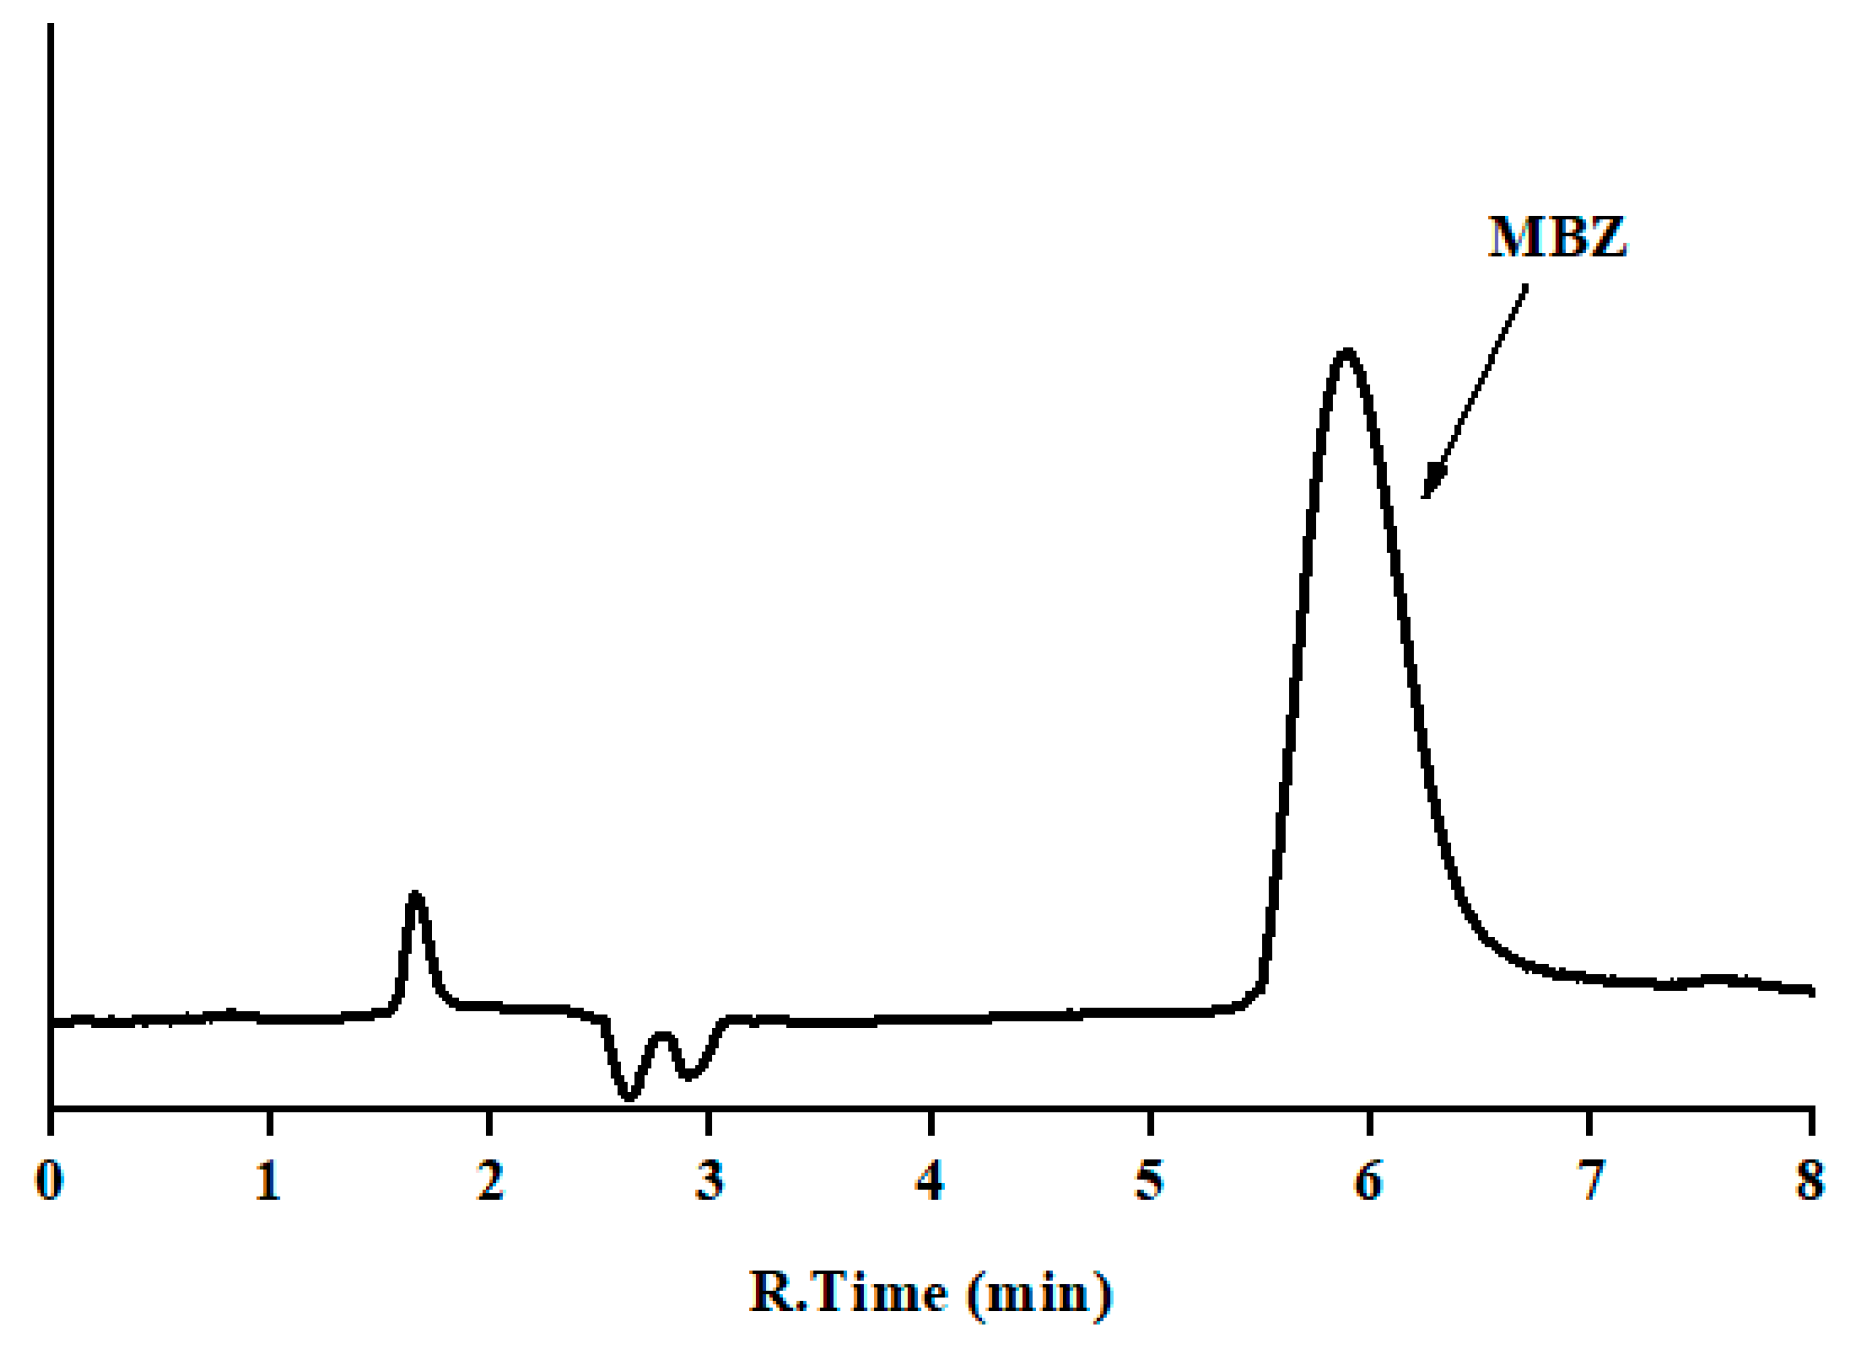
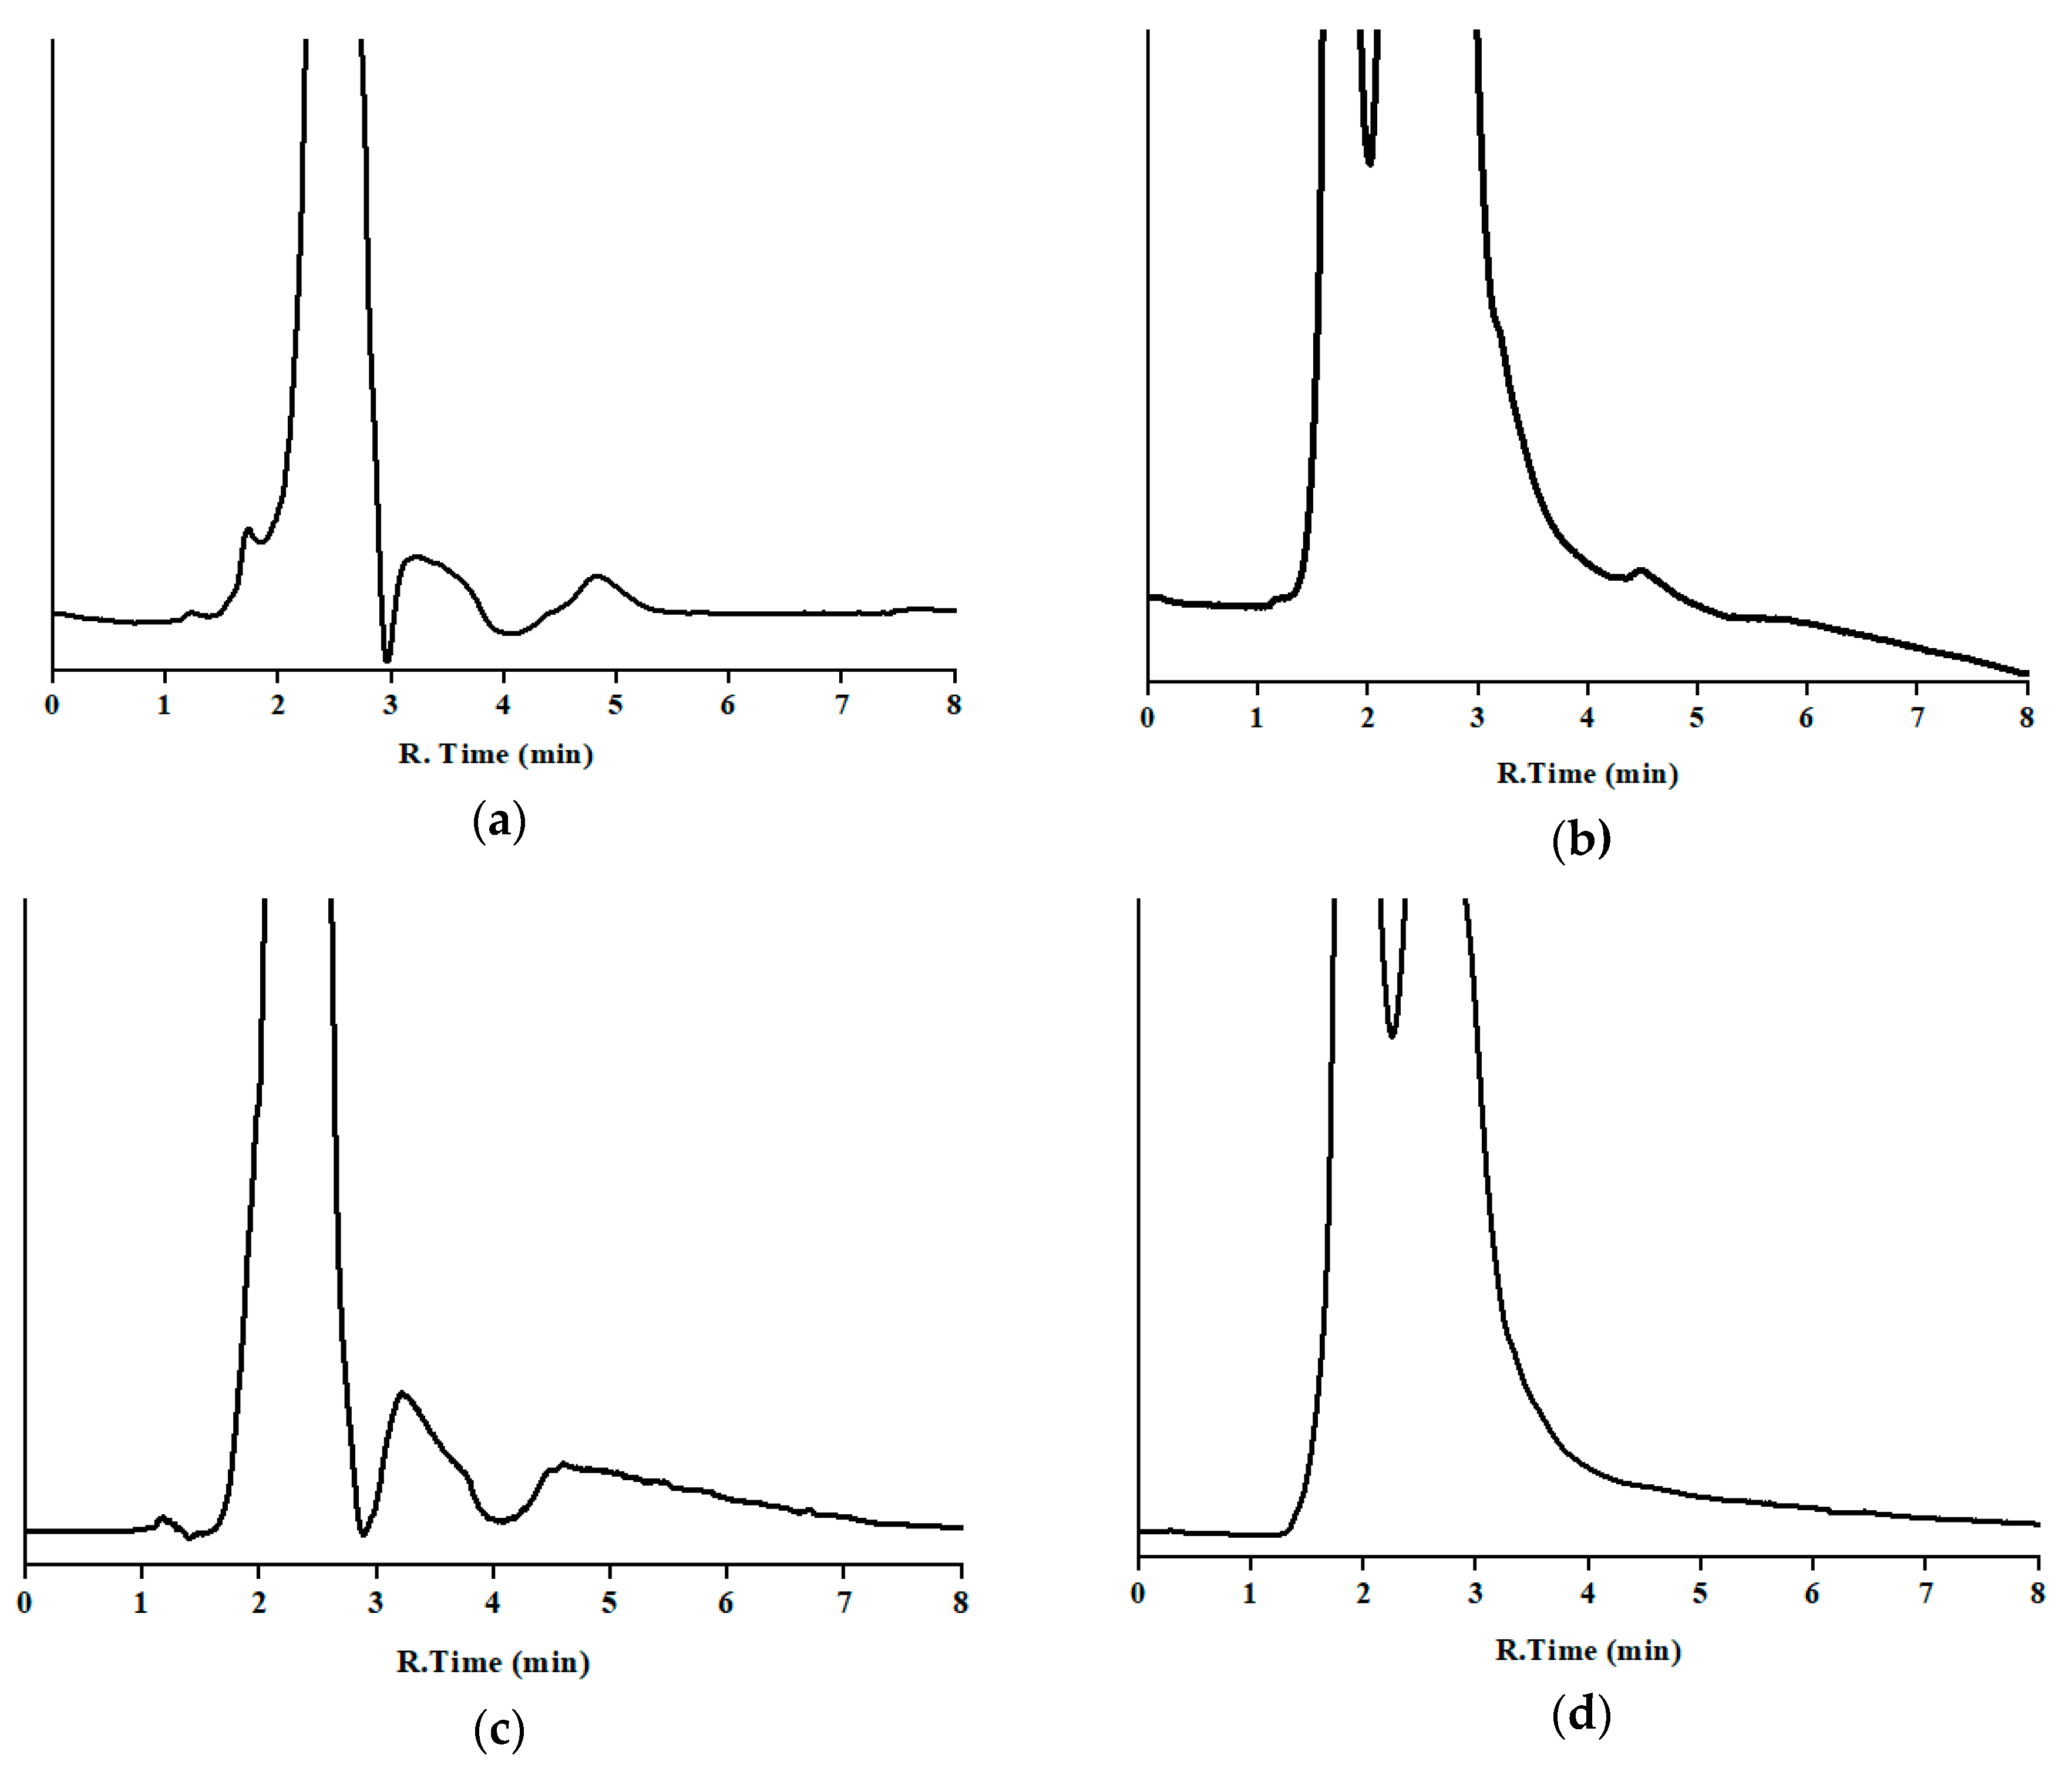
3.2.3. Specificity
3.2.4. Method Calibration Range
3.2.5. Trueness and Precision
3.2.6. Stability
- (a)
- Standard solution: A working standard solution of 0.5 mg/L was analyzed (Day 0) and kept in amber vial in the fridge at 4 °C. Everything three days for one month, the solution was thawed, an aliquot taken and analyzed, and then returned to the fridge. Consequently, working standard solution can be used at the laboratory for analysis purposes without introducing a bias in the measures during this period.
- (b)
- In samples (this protocol was applied for each studied matrix): Twenty-one fresh blank samples were spiked with the required amount to obtain an injected solution of 0.5 mg/L. One of them was immediately analyzed, and the others were kept in a freezer at −20 °C. These were analyzed weekly. Therefore, samples can be analyzed until this period after reception, without affecting the trustworthiness of the result.
3.3. Analysis of Incurred Samples
4. Conclusions
Author Contributions
Funding
Acknowledgments
Conflicts of Interest
References
- Food and Agriculture Organization of the United Nations (FAO). Livestock Sector Brief. 2005. Available online: http://www.fao.org/ag/againfo/resources/en/publications/sector_briefs/lsb_GIN.pdf (accessed on 26 November 2019).
- Van Dijk, J.; Sargison, N.; Kenyon, F.; Skuce, P. Climate change and infectious disease: Helminthological challenges to farmed ruminants in temperate regions. Animal 2009, 4, 377–392. [Google Scholar] [CrossRef] [PubMed] [Green Version]
- Edmonds, M.; Vatta, A.; Marchiondo, A.; Vanimisetti, H.; Edmonds, J. Concurrent treatment with a macrocyclic lactone and benzimidazole provides season long performance advantages in grazing cattle harboring macrocyclic lactone resistant nematodes. Vet. Parasitol. 2018, 252, 157–162. [Google Scholar] [CrossRef]
- Souza, R.; Pareja, L.; Cesio, M.; Heinzen, H. Development of a straight forward and cheap ethyl acetate based method for the simultaneous determination of pesticides and veterinary drugs residues in bovine liver and muscle. Chromatographia 2016, 79, 1101–1112. [Google Scholar] [CrossRef]
- Geerts, S.; Gryseels, B. Drug resistance in human helminths: Current situation and lessons from livestock. Clin. Microbiol. Rev. 2000, 13, 207–222. [Google Scholar] [CrossRef] [PubMed]
- Kinsella, B.; Lehotay, S.; Mastovska, K.; Lightfield, A.; Furey, A.; Danaher, M. New method for the analysis of flukicide and other anthelmintic residues in bovine milk and liver using liquid chromatography–tandem mass spectrometry. Anal. Chim. Acta 2019, 637, 196–207. [Google Scholar] [CrossRef] [PubMed]
- Desmarchelier, A.; Fan, K.; Minh Tien, M.; Savoy, M.; Tarres, A.; Fuger, D.; Goyon, A.; Bessaire, T.; Mottier, P. Determination of 105 antibiotic, anti-inflammatory, antiparasitic agents and tranquilizers by LC-MS/MS based on an acidic QuEChERS-like extraction. Food Addit. Contam. Part. A Chem. Anal. Control. Expo. Risk Assess. 2018, 35, 647–661. [Google Scholar] [CrossRef]
- National Center for Biotechnology Information. PubChem Database. Mebendazole, CID = 4030. 2019. Available online: https://pubchem.ncbi.nlm.nih.gov/compound/Mebendazole (accessed on 14 November 2019).
- European Commission. Commission regulation (EU) No 37/2010 of 22 December 2009 on pharmacologically active substances and their classification regarding maximum residue limits in foodstuffs of animal origin. OJEC 2010, L15, 1–72. Available online: https://ec.europa.eu/health/sites/health/files/files/eudralex/vol-5/reg_2010_37/reg_2010_37_en.pdf (accessed on 26 November 2019).
- Tsiboukis, D.; Sazakli, E.; Jelastopulu, E.; Leotsinidis, M. Anthelmintics residues in raw milk. Assessing intake by a children population. Pol. J. Vet. Sci. 2013, 16, 85–91. [Google Scholar] [CrossRef] [Green Version]
- De Ruyck, H.; Daeseleire, E.; De Ridder, H. Development and validation of a liquid chromatography-electrospray tandem mass spectrometry method for mebendazole and its metabolites hydroxymebendazole and aminomebendazole in sheep liver. Analyst 2001, 126, 2144–2148. [Google Scholar] [CrossRef]
- Al-Kurdi, Z. High performance liquid chromatography method for determination of methyl-5-benzoyl-2-benzimidazole carbamate (mebendazole) and its main degradation product in pharmaceutical dosage forms. Talanta 1999, 50, 1089–1097. [Google Scholar] [CrossRef]
- Parakh, R.; Madagul, J.; Mene, H.; Patil, M.; Kshirsagar, S. RP-HPLC method development and validation for quantification of mebendazole in API and pharmaceutical formulations. PharmaTutor 2016, 4, 46–51. [Google Scholar]
- Santaladchaiyakit, Y.; Srijaranai, S. Surfactant-solvent-based quaternary component emulsification microextraction followed by high-performance liquid chromatography for the simultaneous analysis of benzimidazole anthelmintics in milk samples. Food Anal. Methods 2013, 7, 1238–1246. [Google Scholar] [CrossRef]
- Arias, J.; Schneider, A.; Batista-Andrade, J.; Vieira, A.; Caldas, S.; Primel, E. Chitosan from shrimp shells: A renewable sorbent applied to the clean-up step of the QuEChERS method in order to determine multi-residues of veterinary drugs in different types of milk. Food Chem. 2018, 240, 1243–1253. [Google Scholar] [CrossRef]
- Cao, G.; Zhan, J.; Shi, X.; Deng, X.; Zhu, J.; Wu, W.; Chen, X. Analysis of 140 veterinary drugs and other contaminants in poultry muscle by ultrahigh-performance liquid chromatography–tandem mass spectrometry. Chromatographia 2018, 81, 707–718. [Google Scholar] [CrossRef]
- Delatour, T.; Racault, L.; Bessaire, T.; Desmarchelier, A. Screening of veterinary drug residues in food by LC-MS/MS. background and challenges. Food Addit. Contam. Part. A Chem. Anal. Control. Expo. Risk Assess. 2018, 35, 633–646. [Google Scholar] [CrossRef] [PubMed]
- Valese, A.; Molognoni, L.; de Souza, N.; de Sá Ploêncio, L.; Costa, A.; Barreto, F.; Daguer, H. Development, validation and different approaches for the measurement uncertainty of a multi-class veterinary drugs residues LC–MS method for feeds. J. Chromatogr. B 2017, 1053, 48–59. [Google Scholar] [CrossRef]
- Pérez, M.; Romero-González, R.; Vidal, J.; Frenich, A. Analysis of veterinary drug residues in cheese by ultra-high-performance LC coupled to triple quadrupole MS/MS. J. Sep. Sci. 2013, 36, 1223–1230. [Google Scholar] [CrossRef]
- Bose, D.; Durgbanshi, A.; Capella-Peiró, M.; Gil-Agustí, M.; Esteve-Romero, J.; Carda-Broch, S. Micellar liquid chromatography determination of some biogenic amines with electrochemical detection. J. Pharm. Biomed. Anal. 2004, 36, 357–363. [Google Scholar] [CrossRef]
- Sun, L.; Jia, L.; Xie, X.; Xie, K.; Wang, J.; Liu, J.; Cui, L.; Zhang, G.; Dai, G.; Guojun, D.; et al. Quantitative analysis of amoxicillin, its major metabolites and ampicillin in eggs by liquid chromatography combined with electrospray ionization tandem mass spectrometry. Food Chem. 2016, 192, 313–318. [Google Scholar] [CrossRef]
- Esteve-Romero, J.; Albiol-Chiva, J.; Peris-Vicente, J. A review on development of analytical methods to determine monitorable drugs in serum and urine by micellar liquid chromatography using direct injection. Anal. Chim. Acta 2016, 926, 1–16. [Google Scholar] [CrossRef]
- Peris-Vicente, J.; Iborra-Millet, J.; Albiol-Chiva, J.; Carda-Broch, S.; Esteve-Romero, J. A rapid and reliable assay to determine flumequine, marbofloxacin, difloxacin, and sarafloxacin in commonly consumed meat by micellar liquid chromatography. J. Sci. Food Agric. 2018, 99, 1375–1383. [Google Scholar] [CrossRef]
- European Commission. Commission Decision of 12 August 2002 Implementing Council Directive 96/23/EC Concerning the Performance of Analytical Methods and the Interpretation of Results (2002/657/EC). OJEC 2002, L221, 8–36. Available online: https://eur-lex.europa.eu/legal-content/EN/TXT/PDF/?uri=CELEX:32002D0657&from=EN (accessed on 26 November 2019).
- Mishra, P.; Pawar, R.P.; Bose, D.; Durgbanshi, A.; Albiol-Chiva, J.; Peris-Vicente, J.; Esteve-Romero, J.; Jain, A. Stability studies of rifampicin in plasma and urine of tuberculosis patients according to the European Medicines Agency Guidelines. Bioanalysis 2019, 11, 713–726. [Google Scholar] [CrossRef] [PubMed]
- Ermer, J.; Miller, J.H.M. Method Validation in Pharmaceutical Analysis. A Guide to Best Practice; WILEY-VCH Verlag GmbH & Co. KGaA: Weinheim, Germany, 2005; pp. 1–332. [Google Scholar]
- Peris-Vicente, J.; Albiol-Chiva, J.; Roca-Genovés, P.; Esteve-Romero, J. Advances on melamine determination by micellar liquid chromatography: A review. J. Liq. Chromatogr. Relat. Technol. 2016, 39, 325–338. [Google Scholar] [CrossRef]
- Peris-Vicente, J.; García-Ferrer, D.; Mishra, P.; Albiol-Chiva, J.; Durgbanshi, A.; Carda-Broch, S.; Bose, D.; Esteve-Romero, J. Procedure for the Screening of Eggs and Egg Products to Detect Oxolinic Acid, Ciprofloxacin, Enrofloxacin, and Sarafloxacin Using Micellar Liquid Chromatography. Antibiot. Basel 2019, 8, 226. [Google Scholar] [CrossRef] [Green Version]
- Beltrán-Martinavarro, B.; Peris-Vicente, J.; Carda-Broch, S.; Esteve-Romero, J. Development and validation of a micellar liquid chromatography-based method to quantify melamine in swine kidney. Food Control. 2014, 46, 168–173. [Google Scholar] [CrossRef]
- Miller, J.N.; Miller, J.C. Statistics and Chemometrics for Analytical Chemistry, 6th ed.; Pearson Education Limited: London, UK, 2010; pp. 110–157. [Google Scholar]
- Peris-Vicente, J.; Esteve-Romero, J.; Carda-Broch, S. Validation of analytical methods based on chromatographic techniques: An overview. Anal. Sep. Sci. 2015, 5, 1757–1808. [Google Scholar] [CrossRef]
- Kang, Y.P.; Yu, J.; Huh, Y.; Oh, J.H.; Kwon, C.H.; Lee, S.J.; Ee, J.W.; Kim, G.T.; Lee, J.G.; Lee, J.; et al. Development of high performance liquid chromatography-ultraviolet detection method for screening mebendazole, clorsulon, diaveridine, and tolfenamic acid in animal-based food samples. Drug Test. Anal. 2014, 6, 246–256. [Google Scholar] [CrossRef]
- Wang, Y.; Zhang, J.; Huang, X.; Yuan, D. Preparation of stir cake sorptive extraction based on polymeric ionic liquid for the enrichment of benzimidazole anthelmintics in water, honey and milk samples. Anal. Chim. Acta 2014, 840, 33–41. [Google Scholar] [CrossRef]


| Parameter | Level | RSD of Retention Time (%) | RSD of Peak Area (%) |
|---|---|---|---|
| SDS Concentration (M) | 0.14–0.16 | 3.1 | 2.5 |
| 1-pentanol (%, v/v) | 5.75–6.25 | 2.3 | 1.5 |
| pH | 6.9–7.1 | 1.2 | 2.6 |
| Flow rate (mL/min) | 0.9–1.1 | 9.8 | 2.0 |
| Matrix | Repeatability a (RSD, %) | Intermediate Precision b (RSD, %) | Trueness a (%) |
|---|---|---|---|
| Milk | (3.4; 2.3; 2.7) | (3.7; 4.8; 2.2) | (98.5; 99.1; 99.8) |
| Cheese | (3.2; 3.5; 2.9) | (5.1; 4.3; 3.9) | (97.3; 99.3;99.8) |
| Butter | (4.0; 5.2; 3.7) | (4.8; 4.0; 3.5) | (92.5; 94.3; 96.1) |
| Curd | (4.6; 3.9; 2.6) | (5.4; 4.3; 3.5) | (97.7; 101.6; 97.8) |
| Urine | (2.9; 2.7; 3.5) | (3.2; 3.1; 2.8) | (96.8; 99.4; 102.3) |
| Dung | (5.2; 4.6; 4.0) | (7.5; 6.7; 5.1) | (96.7; 97.3; 99.7) |
| Kind of Sample | Set 1 | Set 2 | Set 3 | Set 4 | Set 5 |
|---|---|---|---|---|---|
| Milk | 4.94 | 2.1 | 1.5 | 7.4 | 1.0 |
| Curd | 0.30 | n.d. | n.d. | 1.8 | n.d. |
| Cheese | 6.70 | 4.2 | 2.7 | 9.5 | 1.2 |
| Butter | 1.23 | 0.9 | 0.5 | 4.1 | n.d. |
| Dung | 3.14 | 1.5 | 0.9 | 5.9 | 0.7 |
| Urine | 2.96 | 2.3 | 0.6 | 4.1 | 1.2 |
© 2020 by the authors. Licensee MDPI, Basel, Switzerland. This article is an open access article distributed under the terms and conditions of the Creative Commons Attribution (CC BY) license (http://creativecommons.org/licenses/by/4.0/).
Share and Cite
Prasad Pawar, R.; Mishra, P.; Durgbanshi, A.; Bose, D.; Albiol-Chiva, J.; Peris-Vicente, J.; García-Ferrer, D.; Esteve-Romero, J. Use of Micellar Liquid Chromatography to Determine Mebendazole in Dairy Products and Breeding Waste from Bovine Animals. Antibiotics 2020, 9, 86. https://0-doi-org.brum.beds.ac.uk/10.3390/antibiotics9020086
Prasad Pawar R, Mishra P, Durgbanshi A, Bose D, Albiol-Chiva J, Peris-Vicente J, García-Ferrer D, Esteve-Romero J. Use of Micellar Liquid Chromatography to Determine Mebendazole in Dairy Products and Breeding Waste from Bovine Animals. Antibiotics. 2020; 9(2):86. https://0-doi-org.brum.beds.ac.uk/10.3390/antibiotics9020086
Chicago/Turabian StylePrasad Pawar, Rajendra, Pooja Mishra, Abhilasha Durgbanshi, Devasish Bose, Jaume Albiol-Chiva, Juan Peris-Vicente, Daniel García-Ferrer, and Josep Esteve-Romero. 2020. "Use of Micellar Liquid Chromatography to Determine Mebendazole in Dairy Products and Breeding Waste from Bovine Animals" Antibiotics 9, no. 2: 86. https://0-doi-org.brum.beds.ac.uk/10.3390/antibiotics9020086