Antimicrobial Isoflavones and Derivatives from Erythrina (Fabaceae): Structure Activity Perspective (Sar & Qsar) on Experimental and Mined Values Against Staphylococcus aureus

 , , and
Abstract
:
1. Introduction
2. Results and Discussion
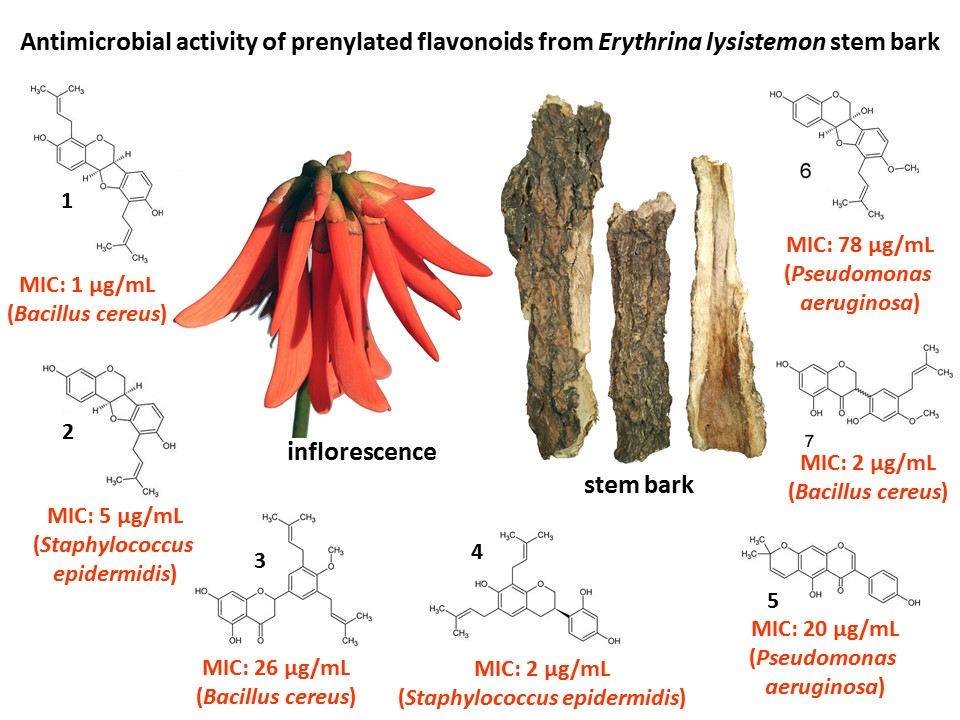
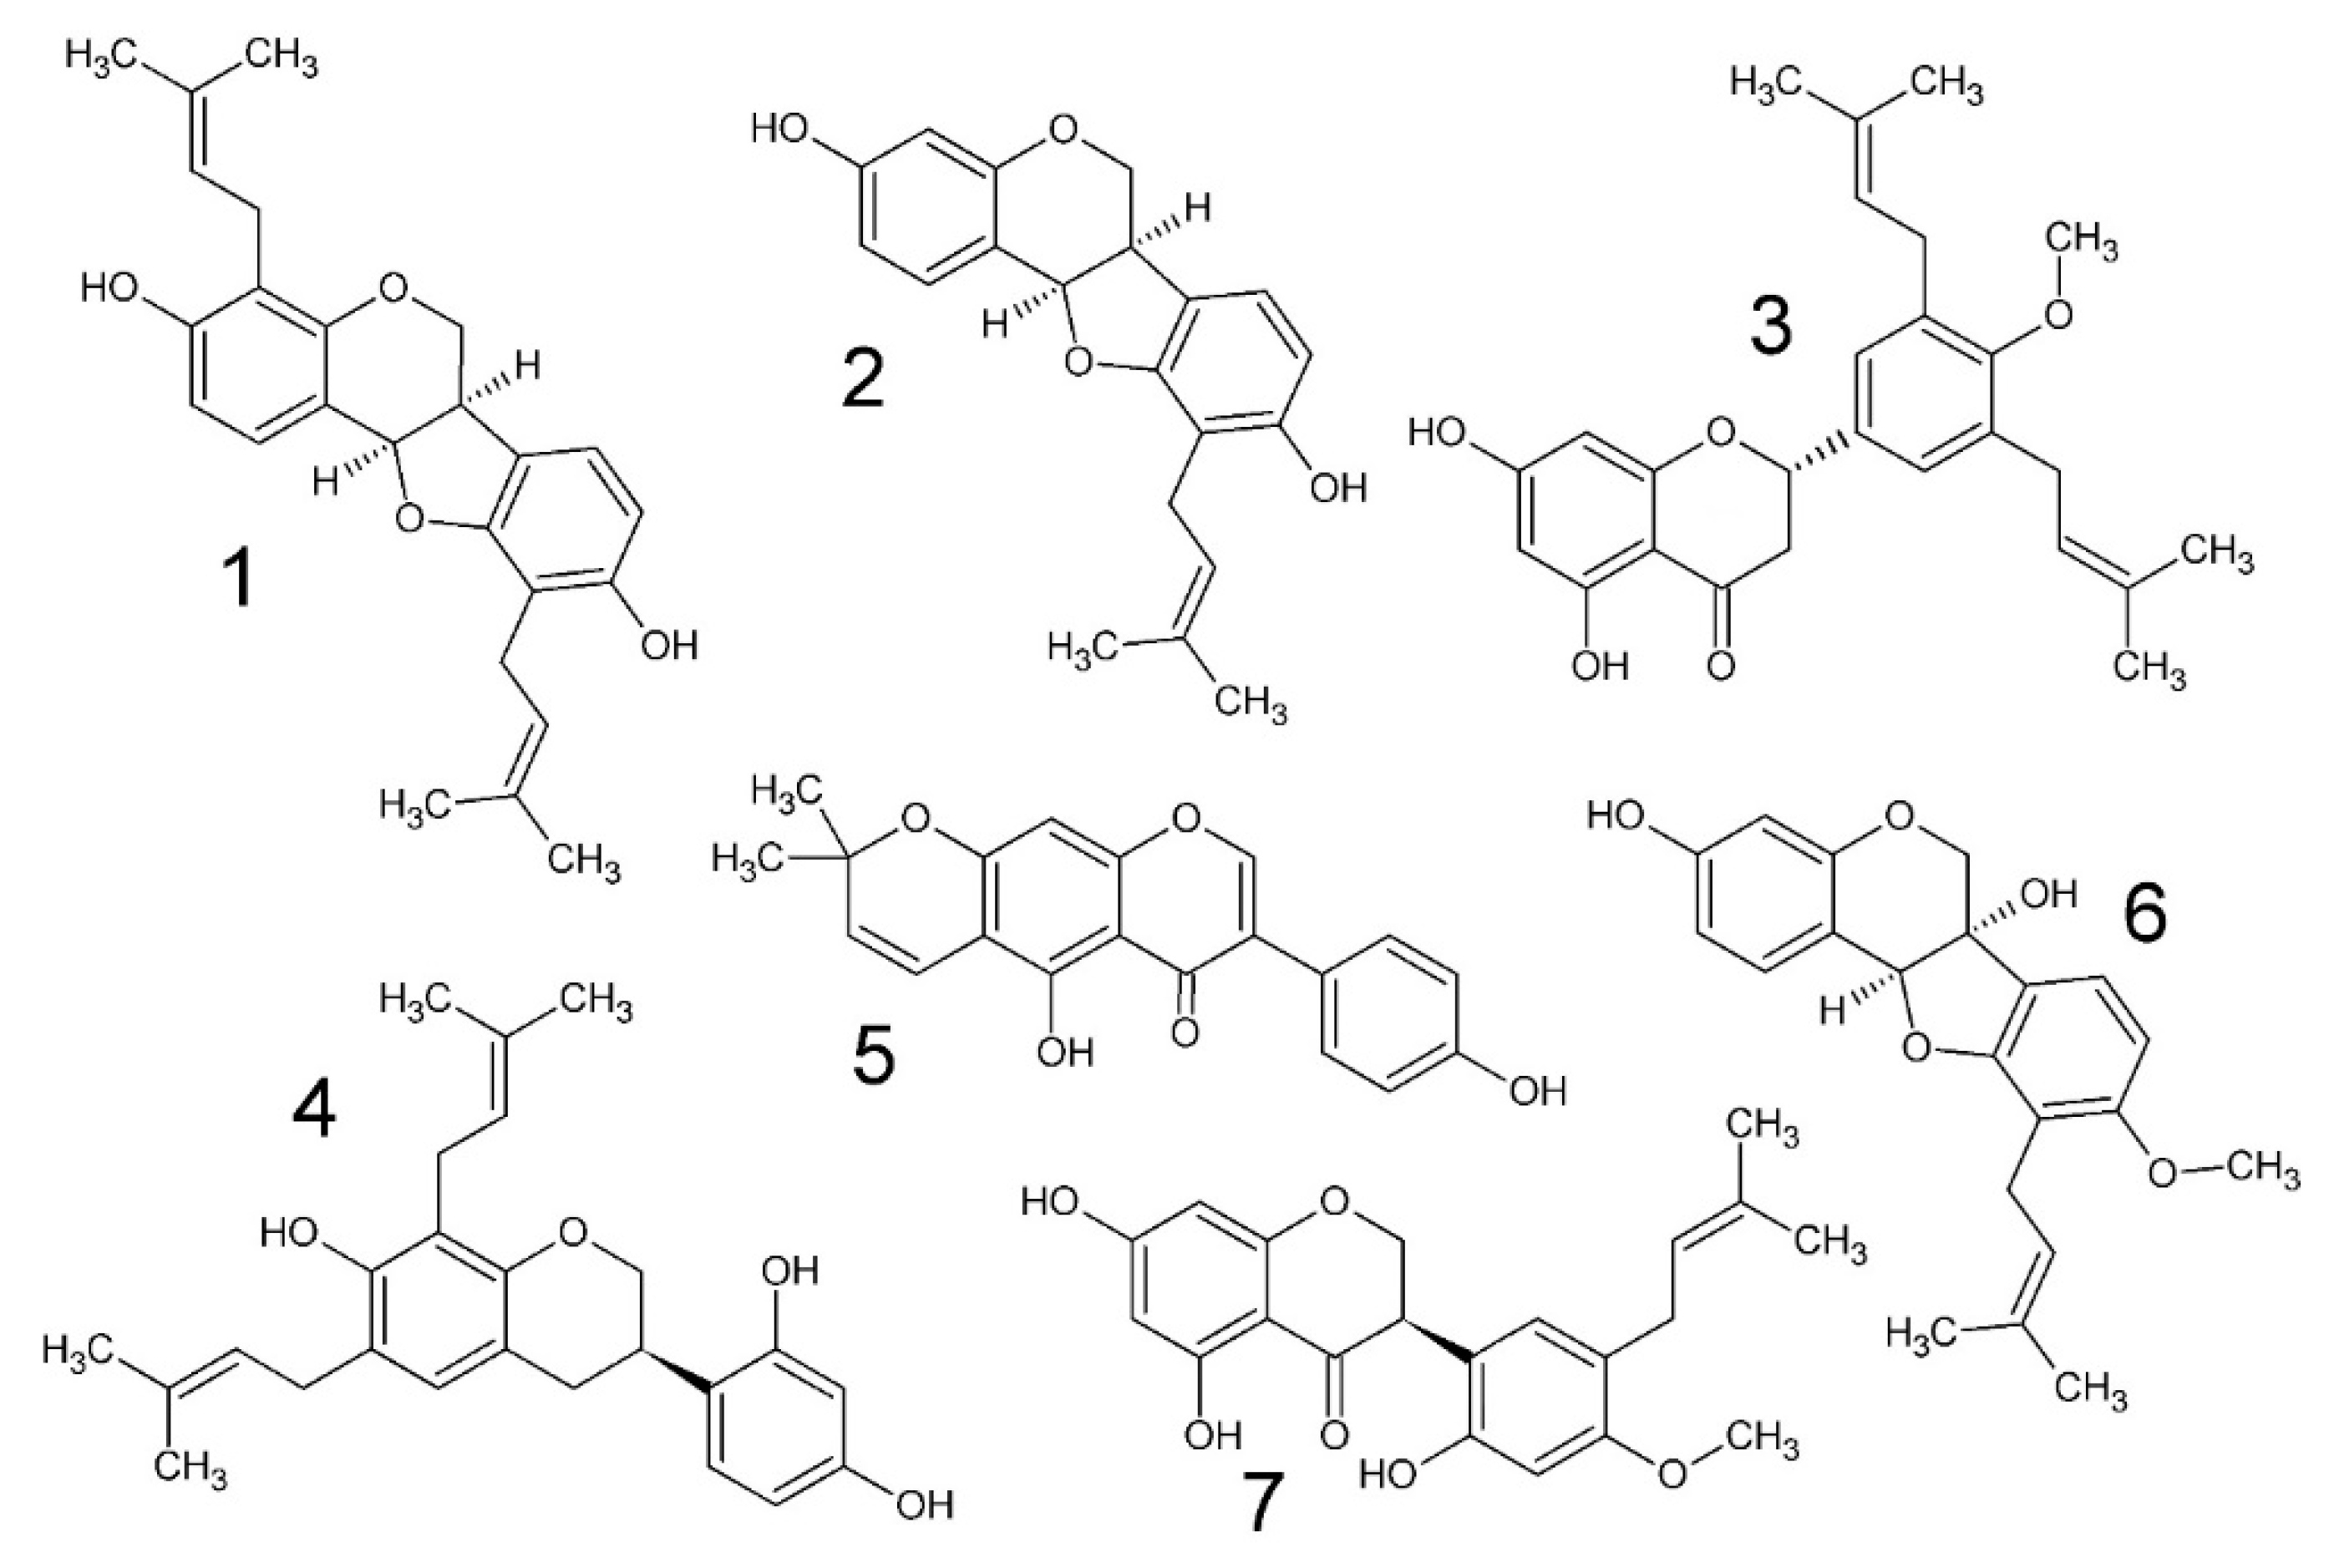
2.1. Chemistry and MIC of South African Erythrina lysistemon
2.2. Brine Shrimp Lethality
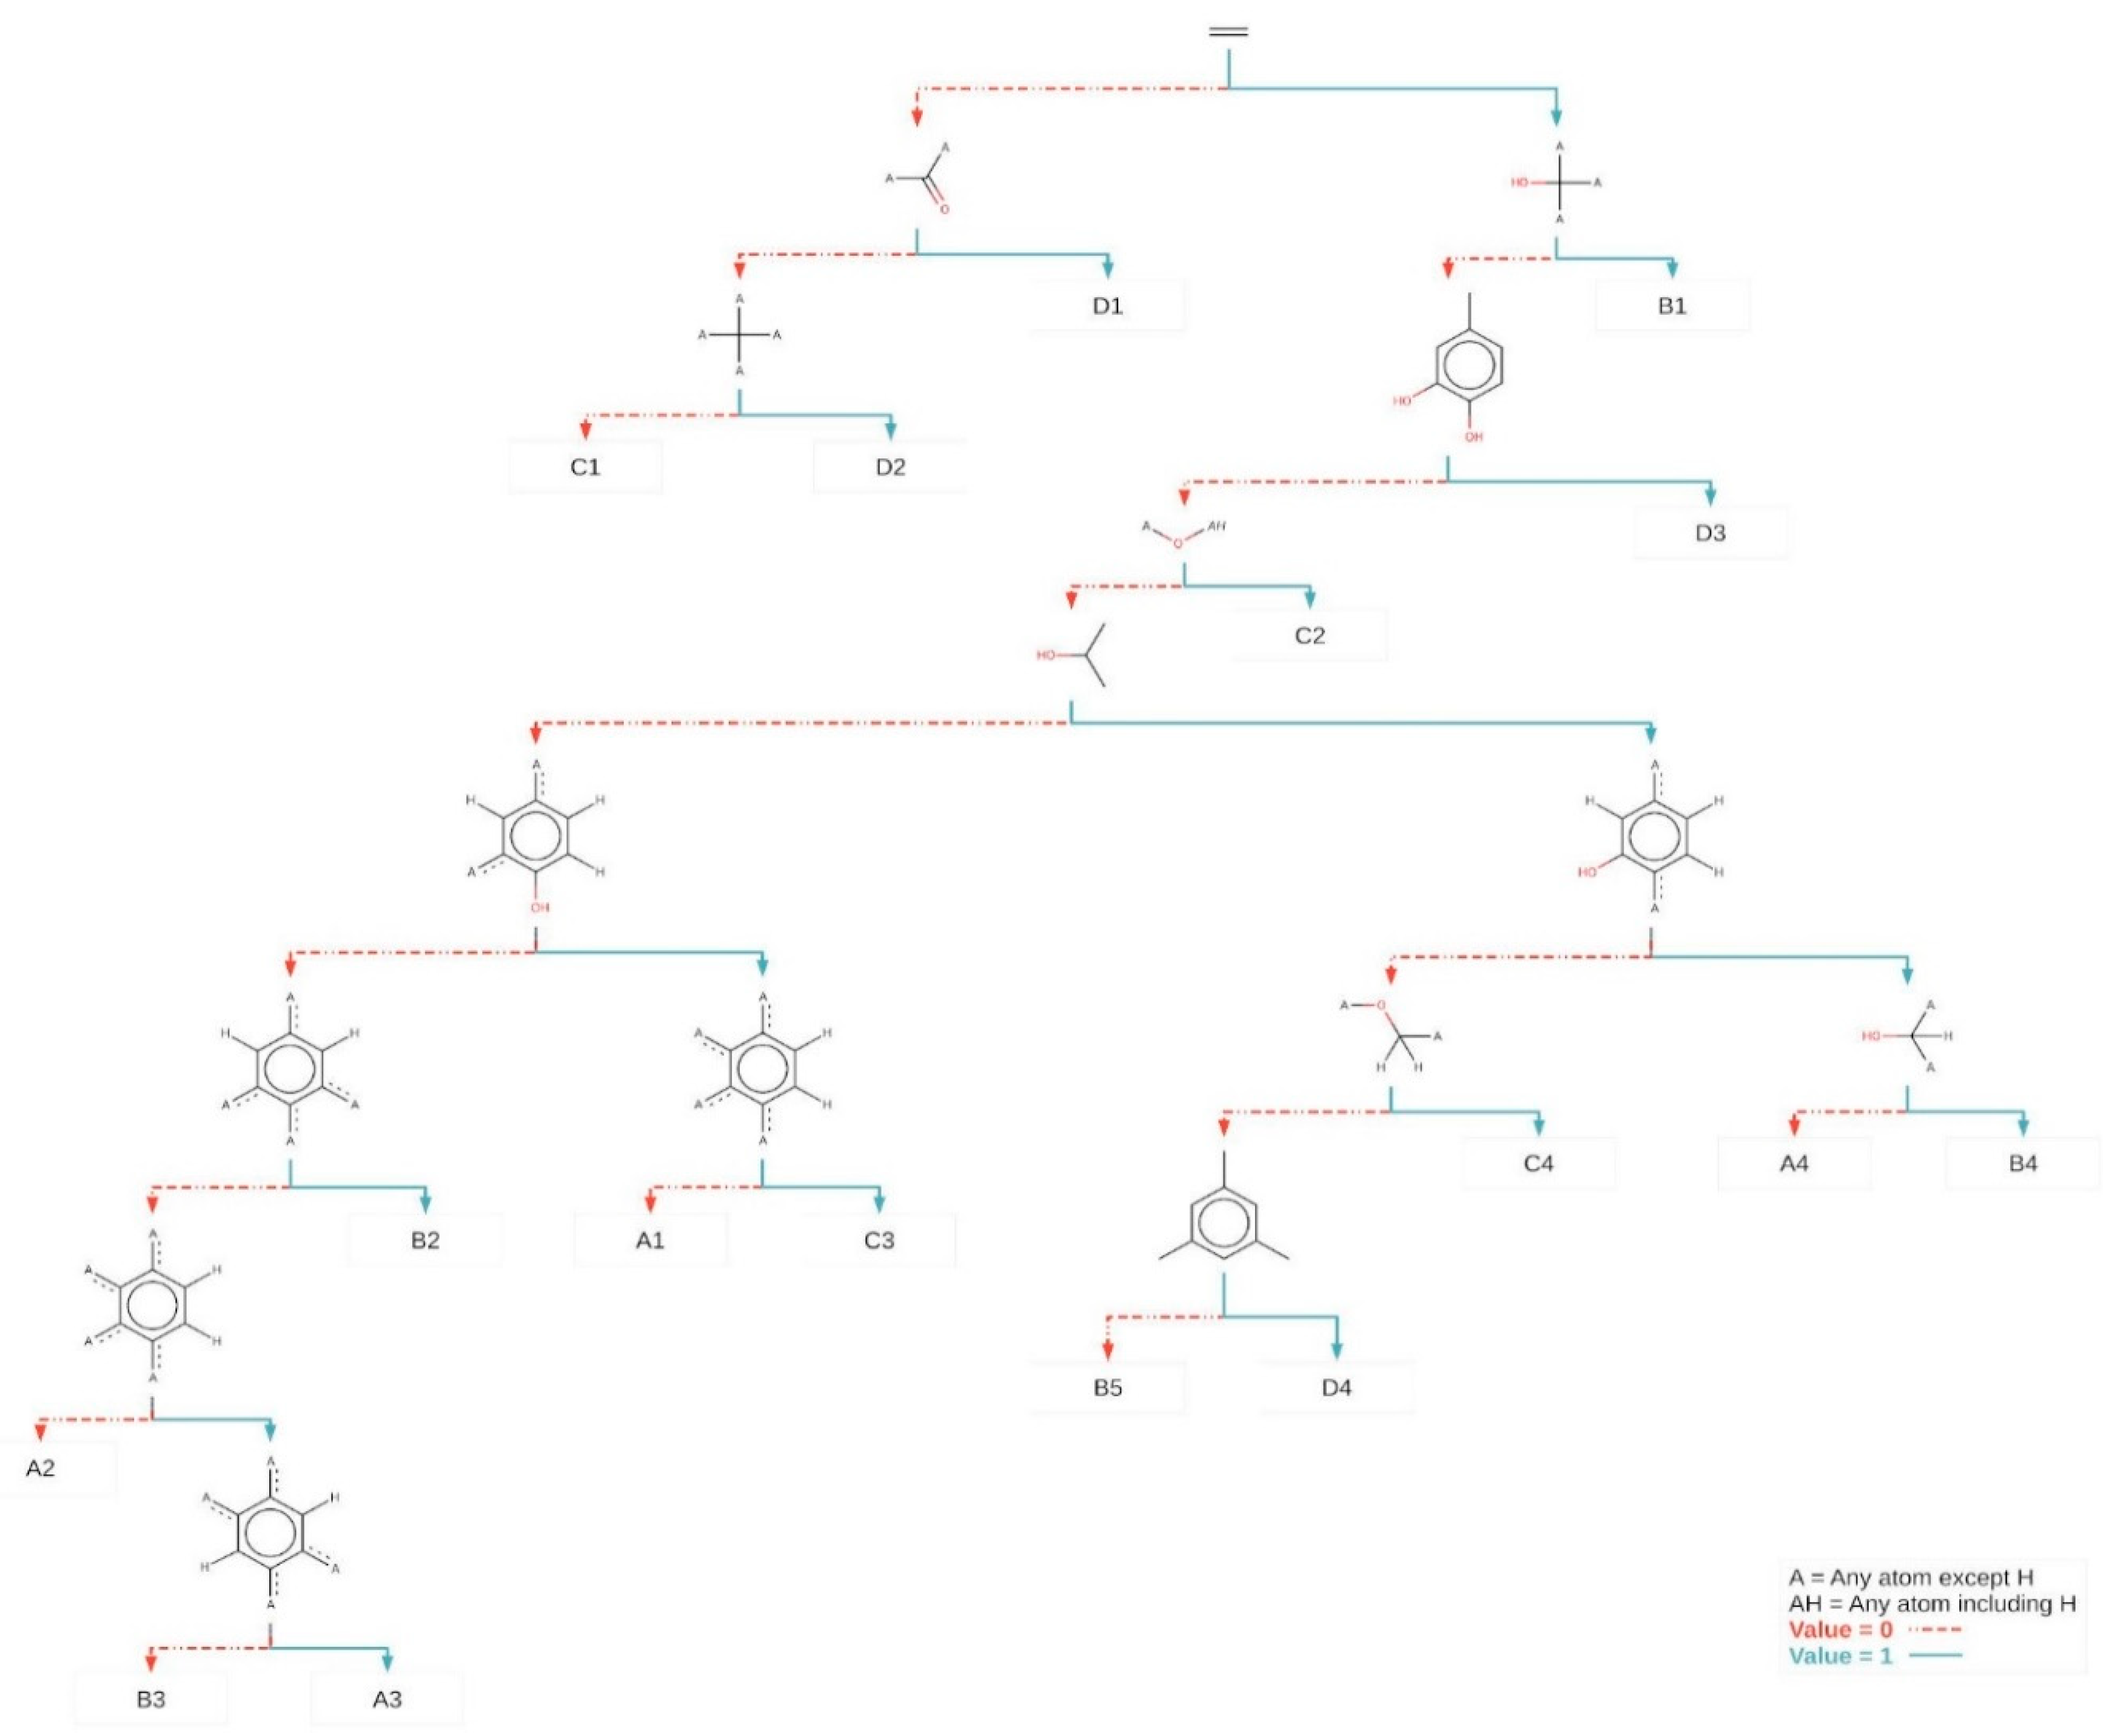
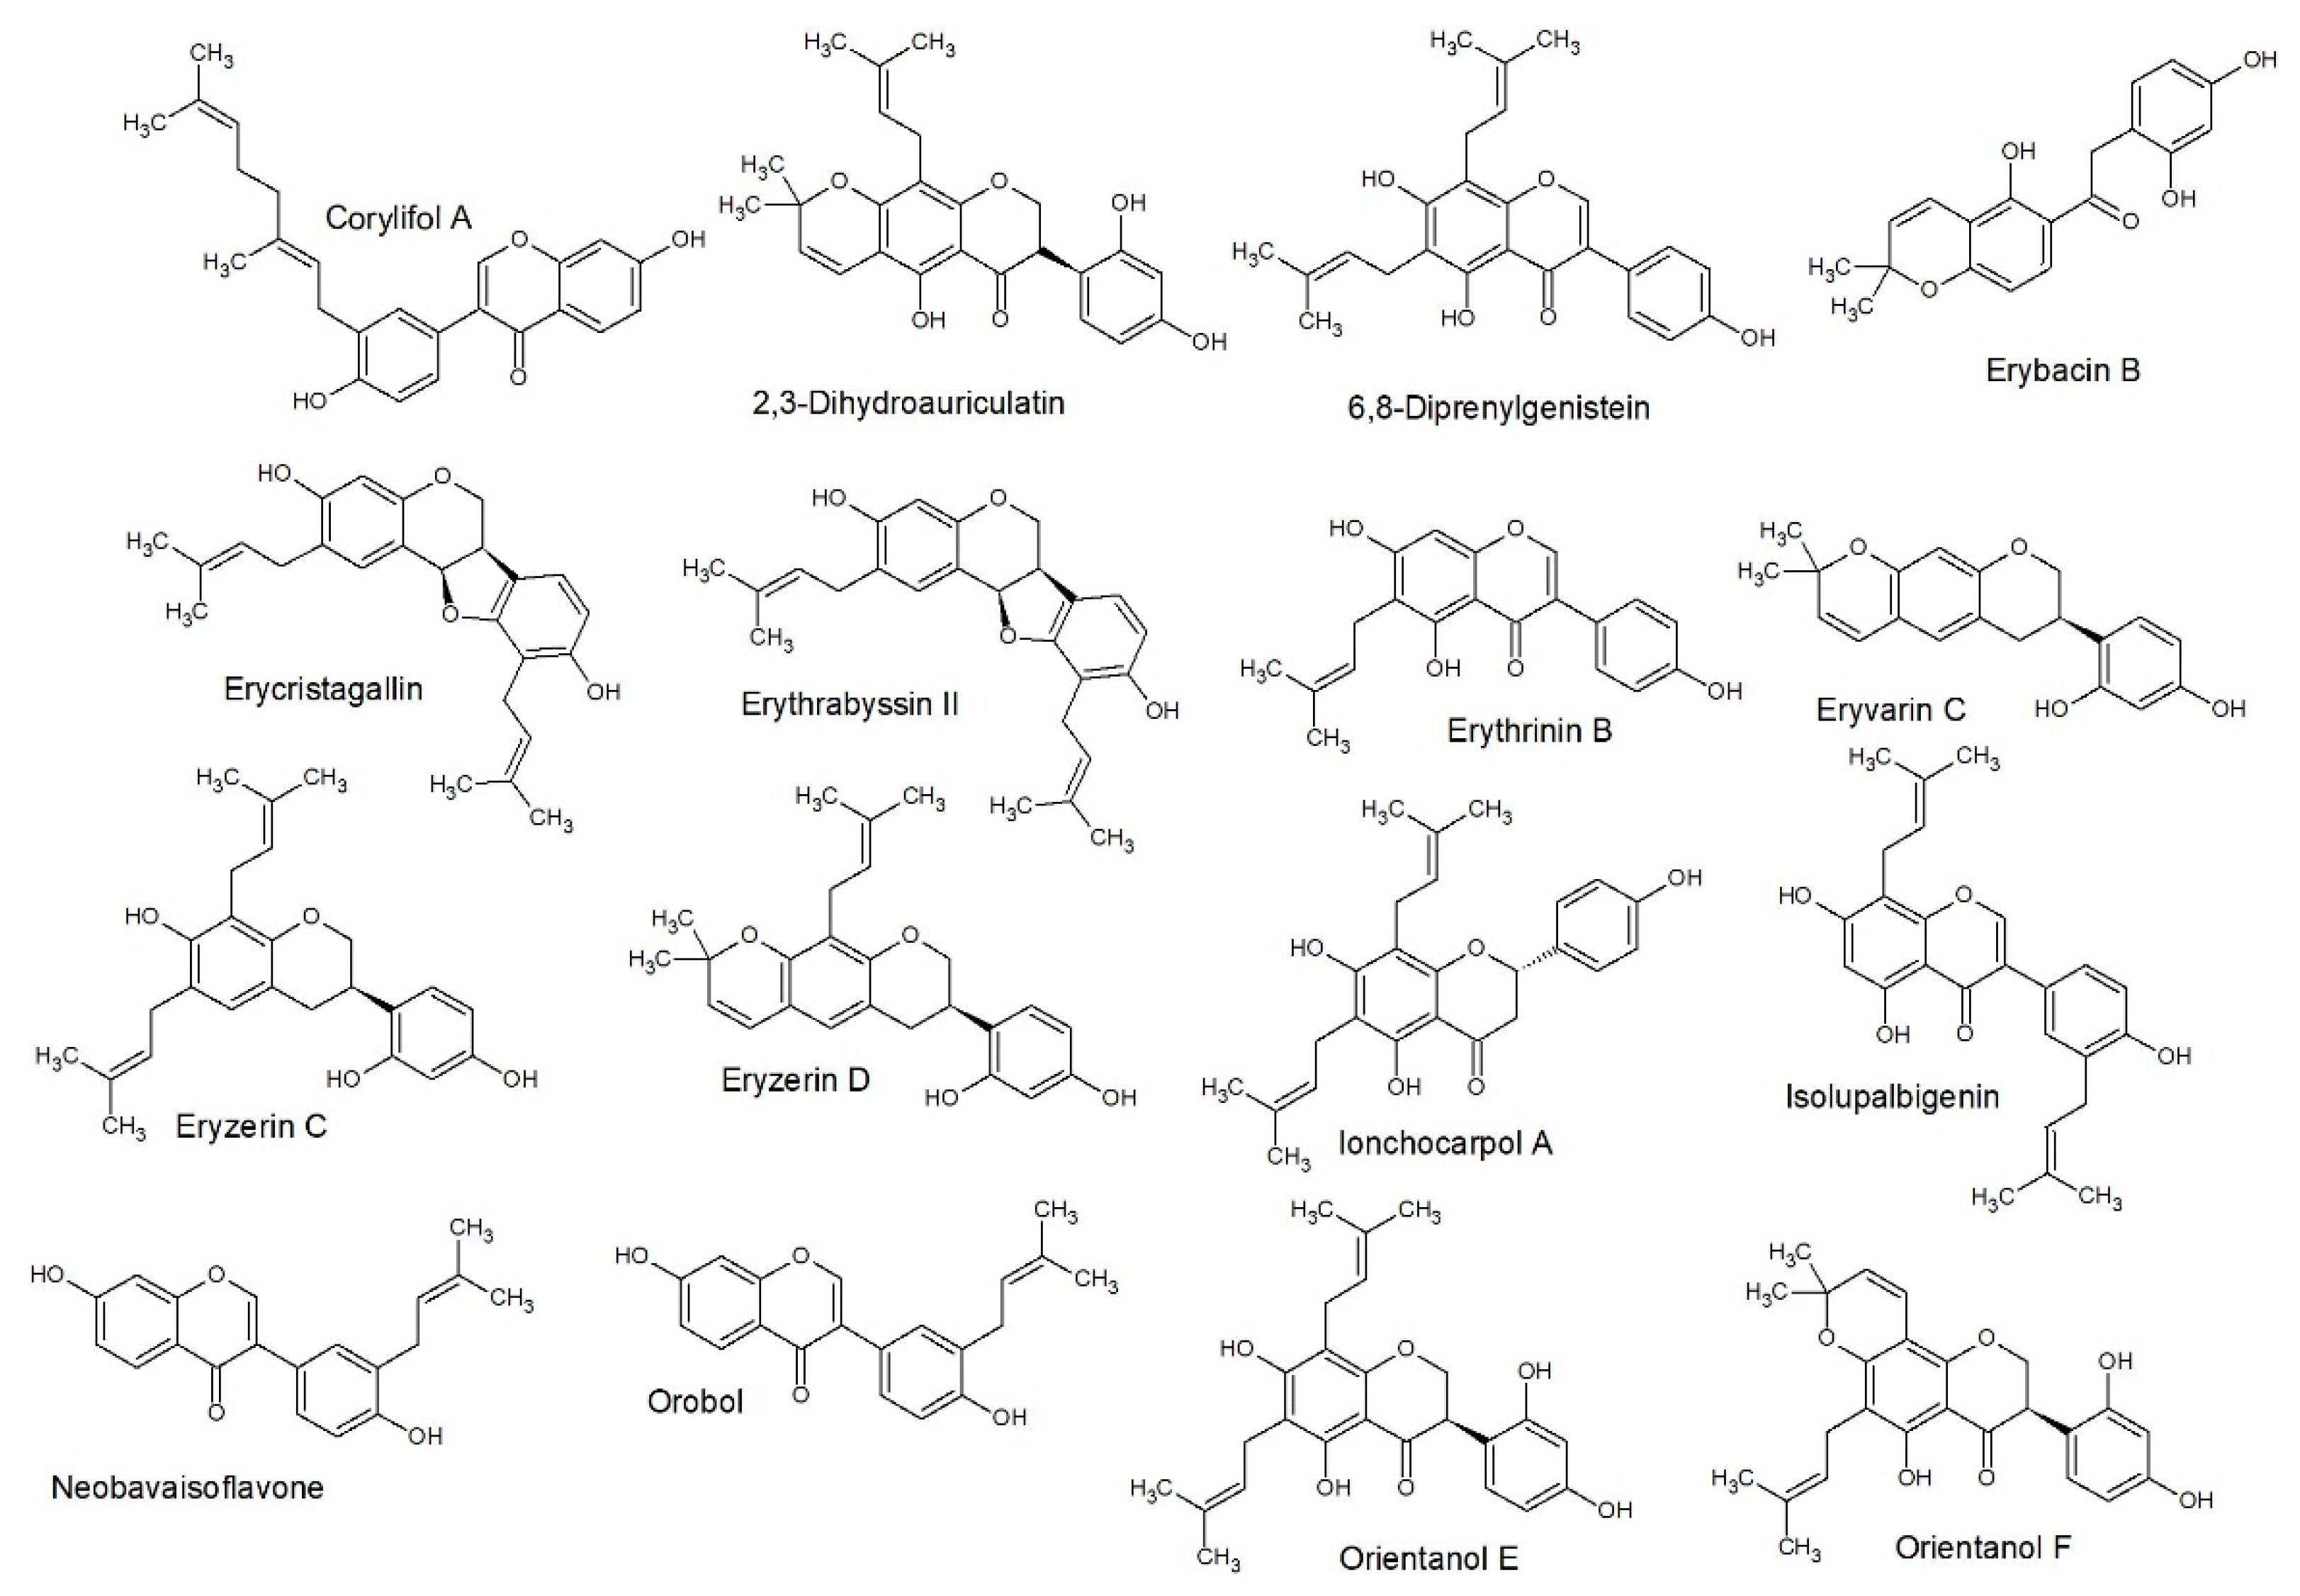
2.3. Structure Activity Relationships
2.4. Quantitative Structure Activity Relationships
3. Materials and Methods
3.1. Materials
3.2. Extraction
3.3. Compound Isolation and Structural Elucidation
3.4. Antimicrobial Studies
3.4.1. Culture Preparation
3.4.2. Determination of Minimum Inhibitory Concentrations (MIC)
3.5. SAR and QSAR Analysis
3.5.1. Structure Optimization
3.5.2. Descriptors Calculation
3.5.3. SAR Studies
3.5.4. QSAR Studies
4. Conclusions
Author Contributions
Funding
Acknowledgments
Conflicts of Interest
References
- Lewis, G.; Schrire, B.; Mackinder, B.; Lock, M. Legumes of the World; The Royal Botanic Gardens: Kew, UK, 2005. [Google Scholar]
- Telikepalli, H.; Gollapudi, S.R.; Keshavarz-Shokri, A.; Velazquez, L.; Sandmann, R.A.; Veliz, E.A.; Rao, K.J.; Madhavi, A.S.; Mitscher, L.A. Isoflavonoids and a cinnamyl phenol from root extracts of Erythrina variegata. Phytochemistry 1990, 29, 2005–2007. [Google Scholar] [CrossRef]
- Mitscher, L.A.; Okwute, S.K.; Gollapudi, S.R.; Drake, S.; Avona, E. Antimicrobial pterocarpans of Nigerian Erythrina mildbraedii. Phytochemistry 1988, 27, 3449–3452. [Google Scholar] [CrossRef]
- Rukachaisirikul, T.; Innok, P.; Aroonrerk, N.; Boonamnuaylap, W.; Limrangsun, S.; Boonyon, C.; Woonjina, U.; Suksamrarn, A. Antibacterial pterocarpans from Erythrina subumbrans. J. Ethnopharmacol. 2007, 110, 171–175. [Google Scholar] [CrossRef] [PubMed]
- Rukachaisirikul, T.; Saekee, A.; Tharibun, C.; Watkuolham, S.; Suksamrarn, A. Biological Activities of the Chemical Constituents of Erythrina stricta and Erythrina subumbrans. Arch. Pharmacal Res. 2007, 30, 1398–1403. [Google Scholar] [CrossRef]
- Van Wyk, B.-E.; Oudtshoorn, B.; Gericke, N. Medicinal Plants of South Africa, 2nd ed.; Briza Publications: Pretoria, South Africa, 2009. [Google Scholar]
- Pillay, C.C.; Jäger, A.K.; Mulholland, D.A.; Van Staden, J. Cyclooxygenase inhibiting and anti-bacterial activities of South African Erythrina species. J. Ethnopharmacol. 2001, 74, 231–237. [Google Scholar] [CrossRef]
- Mvondo, M.A.; Njamen, D.; Kretzschmar, G.; Imma Bader, M.; Tanee Fomum, S.; Wandji, J.; Vollmer, G. Alpinumisoflavone and abyssinone V 4′-methylether derived from Erythrina lysistemon (Fabaceae) promote HDL-cholesterol synthesis and prevent cholesterol gallstone formation in ovariectomized rats. J. Pharm. Pharmacol. 2015, 67, 990–996. [Google Scholar] [CrossRef]
- Nde, C.B.M.; Njamen, D.; Fomum, S.T.; Wandji, J.; Simpson, E.; Clyne, C.; Vollmer, G. In vitro estrogenic activity of two major compounds from the stem bark of Erythrina lysistemon (Fabaceae). Eur. J. Pharmacol. 2012, 674, 87–94. [Google Scholar]
- Dao, T.T.; Nguyen, P.H.; Thuong, P.T.; Kang, K.W.; Na, M.; Ndinteh, D.T.; Mbafor, J.T.; Oh, W.K. Pterocarpans with inhibitory effects on protein tyrosine phosphatase 1B from Erythrina lysistemon Hutch. Phytochemistry 2009, 70, 2053–2057. [Google Scholar] [CrossRef]
- Fouché, G.; Cragg, G.M.; Pillay, P.; Kolesnikova, N.; Maharaj, V.J.; Senabe, J. In vitro anticancer screening of South African plants. J. Ethnopharmacol. 2008, 119, 455–461. [Google Scholar] [CrossRef]
- Iranshahi, M.; Vu, H.; Pham, N.; Zencak, D.; Forster, P.; Quinn, R.J. Cytotoxic evaluation of alkaloids and isoflavonoids from the Australian tree Erythrina vespertilio. Planta Med. 2012, 78, 730–736. [Google Scholar] [CrossRef]
- De Araújo-Júnior, J.X.; de Oliveira, M.S.G.; Aquino, P.G.V.; Alexandre-Moreira, M.S.; Sant’Ana, A.E.G. A phytochemical and ethnopharmacological review of the genus Erythrina. In Phytochemicals-a Global Perspective of Their Role in Nutrition and Health; Rao, V., Ed.; InTech: London, UK, 2012; pp. 327–352. [Google Scholar]
- Yenesew, A.; Midiwo, J.O.; Miessner, M.; Heydenreich, M.; Peter, M.G. Two prenylated flavanones from stem bark of Erythrina burttii. Phytochemistry 1998, 48, 1439–1443. [Google Scholar] [CrossRef]
- Dagne, E.; Gunatilaka, A.L.; Kingston, D.G.; Alemu, M.; Hofmann, G.; Johnson, R.K. Two bioactive pterocarpans from Erythrina burana. J. Nat. Prod. 1993, 56, 1831–1834. [Google Scholar] [CrossRef] [PubMed]
- El-Masry, S.; Amer, M.E.; Abdel-Kader, M.S.; Zaatout, H.H. Prenylated flavonoids of Erythrina lysistemon grown in Egypt. Phytochemistry 2002, 60, 783–787. [Google Scholar] [CrossRef]
- Juma, B.F.; Majinda, R.R. Constituents of Erythrina lysistemon: Their brine shrimp lethality, antimicrobial and radical scavenging activities. Nat. Prod. Commun. 2006, 1, 101–107. [Google Scholar] [CrossRef]
- Tanaka, H.; Oh-Uchi, T.; Etoh, H.; Sako, M.; Asai, F.; Fukai, T.; Sato, M.; Murata, J.; Tateishi, Y. Isoflavonoids from roots of Erythrina zeyheri. Phytochemistry 2003, 64, 753–758. [Google Scholar] [CrossRef]
- Cushnie, T.T.; Lamb, A.J. Recent advances in understanding the antibacterial properties of flavonoids. Int. J. Antimicrob. Agents 2011, 38, 99–107. [Google Scholar] [CrossRef] [PubMed]
- CLSI. Performance standards for antimicrobial susceptibility testing; 23rd informational supplement. In CLSI Document M100-S27; Clinical and Laboratory Standards Institute: Wayne, PA, USA, 2017. [Google Scholar]
- Sadgrove, N.J.; Jones, G.L. From Petri Dish to Patient: Bioavailability Estimation and Mechanism of Action for Antimicrobial and Immunomodulatory Natural Products. Front. Microbiol. 2019, 10, 1–26. [Google Scholar] [CrossRef] [PubMed]
- Araya-Cloutier, C.; Vincent, W.J.; van de Schans, M.G.M.; Hageman, J.; Schaftenaar, G.; den Besten, H.M.W.; Gruppen, H. QSAR-based molecular signatures of prenylated (iso)flavonoids underlying antimicrobial potency against and membrane-disruption in Gram positive and Gram negative bacteria. Sci. Rep. 2018, 8, 1–14. [Google Scholar] [CrossRef]
- Vanhaecke, P.; Persoone, G.; Claus, C.; Sorgeloss, P. Proposal for a short-term toxicity test with Artemia nauplii. Ecotoxicol. Environ. Saf. 1981, 5, 382–387. [Google Scholar] [CrossRef]
- Sato, M.; Tanaka, H.; Tani, N.; Nagayama, M.; Yamaguchi, R. Different antibacterial actions of isoflavones isolated from Erythrina poeppigiana against methicillin-resistant Staphylococcus aureus. Lett. Appl. Microbiol. 2006, 43, 243–248. [Google Scholar] [CrossRef]
- Zhou, B.; Wan, C.-X. Phenolic constituents from the aerial parts of Glycyrrhiza inflata and their antibacterial activities. J. Asian Nat. Prod. Res. 2015, 17, 256–261. [Google Scholar] [CrossRef] [PubMed]
- Tsuchiya, H.; Sato, M.; Miyazzaki, T.; Fujiwara, S.; Tanigaki, S.; Ohyama, M.; Tanaka, T.; Iinuma, M. Comparative study on the antibacterial activity of phytochemical flavanones against methicillin-resistant Staphylococcus aureus. J. Ethnopharmacol. 1996, 50, 27–34. [Google Scholar] [CrossRef]
- Van Wyk, B.; Van Wyk, P.; Van Wyk, B.-E. Photographic Guide to Trees of Southern Africa; Briza Publications: Pretoria, South Africa, 2011. [Google Scholar]
- Chukwujekwu, J.C.; Van Heerden, F.R.; Van Staden, J. Antibacterial activity of flavonoids from the stem bark of Erythrina caffra Thunb. Phytother. Res. 2011, 25, 46–48. [Google Scholar] [CrossRef] [PubMed]
- Tanaka, H.; Sato, M.; Fujiwara, S.; Hirata, M.; Etoh, H.; Takeuchi, H. Antibacterial activity of isoflavonoids isolated from Erythrina variegata against methicillin-resistant Staphylococcus aureus. LLett. Appl. Microbiol. 2002, 35, 494–498. [Google Scholar] [CrossRef] [Green Version]
- Tanaka, H.; Sato, M.; Oh-Uchi, T.; Yamaguchi, R.; Etoh, H.; Shimizu, H.; Sako, M.; Takeuchi, H. Antibacterial properties of a new isoflavone from Erythrina poeppigiana against methicillin-resistant Staphylococcus aureus. Phytomedicine 2004, 11, 311–337. [Google Scholar] [CrossRef] [Green Version]
- Eloff, J.N. A sensitive and quick microplate method to determine the minimal inhibitory concentration of plant extracts for bacteria. Planta Med. 1998, 64, 711–713. [Google Scholar] [CrossRef] [Green Version]
- Van Vuuren, S.F.; Holl, D. Antimicrobial natural product research: A review from a South African perspective for the years 2009–2016. J. Ethnopharmacol. 2017, 208, 236–252. [Google Scholar] [CrossRef]
- Wanjala, C.C.; Juma, B.F.; Bojase, G.; Gashe, B.A.; Majinda, R.R. Erythrinaline alkaloids and antimicrobial flavonoids from Erythrina latissima. Planta Med. 2002, 68, 640–642. [Google Scholar] [CrossRef]
- Araya-Cloutier, C.; den Besten, H.M.; Aisyah, S.; Gruppen, H.; Vincken, J.P. The position of prenylation of isoflavonoids and stilbenoids from legumes (Fabaceae) modulates the antimicrobial activity against Gram-positive pathogens. Food Chem. 2017, 226, 193–201. [Google Scholar] [CrossRef]
- Kotsiantis, S.B. Supervised machine learning: A review of classification techniques. Informatica 2007, 31, 249–268. [Google Scholar]
- Quinlan, J.R. Improved use of continuous attributes in C4.5. J. Artif. Intell. Res. 2006, 4, 77–90. [Google Scholar] [CrossRef] [Green Version]
- Chagas-Paula, D.; Oliveira, T.B.; Zhang, T.; Edrada-Ebel, R.; Da Costa, F.B. Prediction of anti-inflammatory plants and discovery of their biomarkers in machine learning algorithms and metabolic studies. Planta Med. 2015, 81, 450–458. [Google Scholar]
- Hendrich, A.B. Flavonoid-membrane interactions: Possible consequences for biological effects of some polyphenolic compounds. Acta Pharmacol. Sin. 2006, 27, 27–40. [Google Scholar] [CrossRef] [PubMed] [Green Version]
- Bojase, G.; Majinda, R.R.T.; Gashe, B.A.; Winjala, C.C.W. Antimicrobial flavonoids from Bolusanthus speciosus. Planta Med. 2002, 68, 615–620. [Google Scholar] [CrossRef] [PubMed]
- Echeverría, J.; Opazo, J.; Mendoza, L.; Urzúa, A.; Wilkens, M. Structure-activity and lipophilicity relationships of selected antibacterial natural flavones and flavanones of Chilean flora. Molecules 2017, 22, 608. [Google Scholar] [CrossRef] [PubMed]
- Tanaka, H.; Hattori, H.; Oh-Uchi, T.; Sato, M.; Sako, M.; Tateishi, Y.; Riswani, G.H. Three new isoflavanones from Erythrina costaricensis. Nat. Prod. Res. 2009, 23, 1089–1094. [Google Scholar] [CrossRef] [PubMed]
- Sencan, A. Modeling of thermodynamic properties of refrigerant/absorbent couples using data mining process. Energy Convers. Manag. 2007, 48, 470–480. [Google Scholar] [CrossRef]
- Frank, E.; Hall, M.A.; Witten, I.H. Appendix B: The WEKA workbench. In Data Mining: Practical Machine Learning Tools and Techniques, 4th ed.; Morgan Kaufmann: Elsevier: Cambridge, MA, USA, 2016. [Google Scholar]
- Hall, M.; Frank, E.; Holmes, G.; Pfahringer, B.; Reutemann, P.; Witten, I.H. The WEKA data mining software: An update. ACM SIGKDD Explor. Newsl. 2009, 11, 10–18. [Google Scholar] [CrossRef]
- Basak, S.C.; Vracko, M.G. Parsimony principle and its proper use/application in computer-assisted drug design and QSAR. Curr. Comput. Drug Des. 2020, 16, 1–5. [Google Scholar] [CrossRef]
- Sun, M.; Zheng, Y.; Wei, H.; Chen, J.; Ji, M. QSAR studies on 4-anilino-3-quinolinecarbonitriles as Src kinase inhibitors using robust PCA and both linear and nonlinear models. J. Enzym. Inhib. Med. Chem. 2009, 24, 1109–1116. [Google Scholar] [CrossRef]
- Wildman, S.A.; Crippen, G.M. Prediction of physicochemical parameters by atomic contributions. J. Chem. Inf. Comput. Sci. 1999, 39, 868–873. [Google Scholar] [CrossRef]
- Hall, L.H.; Kier, L.B. Electrotopological state indices for atom types: A novel combination of electronic, topological, and valence state information. J. Chem. Inf. Model. 1995, 35, 1039–1045. [Google Scholar] [CrossRef]
- Liu, S.; Cao, C.; Li, Z. Approach to estimation and prediction for normal boiling point (NBP) of alkanes based on a novel molecular distance-edge (MDE) vector, λ. J. Chem. Inf. Comput. Sci. 1998, 38, 387–394. [Google Scholar] [CrossRef]
- Baldim, J.L.; Alcântara, B.G.V.d.; Domingos, O.d.S.; Soares, M.G.; Caldas, I.S.; Novaes, R.D.; Oliveira, T.B.; Lago, J.H.G.; Chagas-Paula, D.A. The correlation between chemical structures and antioxidant, prooxidant, and antitrypanosomatid properties of flavonoids. Oxidative Med. Cell. Longev. 2017, 2017, 1–12. [Google Scholar] [CrossRef]
- Hemmer, M.C.; Steinhauer, V.; Gasteiger, J. Deriving the 3D structure of organic molecules from their infrared spectra. Vib. Spectrosc. 1999, 19, 151–164. [Google Scholar] [CrossRef]
- Pogliani, L. Modeling with molecular pseudoconnectivity descriptors. A useful extension of the intrinsic I-state concept. J. Phys. Chem. A 2000, 104, 9029–9045. [Google Scholar] [CrossRef]
- Afantitis, A.; Melagraki, G.; Sarimveis, H.; Koutentis, P.A.; Markopoulos, J.; Igglessi-Markopoulou, O. Development and evaluation of a QSPR model for the prediction of diamagnetic susceptibility. QSAR Comb. Sci. 2008, 27, 432–436. [Google Scholar] [CrossRef] [Green Version]
- Melagraki, G.; Afantitis, A.; Sarimveis, H.; Koutentis, P.A.; Kolias, G.; Igglessi-Markopoulou, O. Predictive QSAR workflow for the in silico identification and screening of novel HDAC inhibitors. Mol. Divers. 2009, 13, 301–311. [Google Scholar] [CrossRef]
- Pereira, F.; Xiao, K.; Latino, D.A.R.S.; Wu, C.; Zhang, Q.; Aires-de-Sousa, J. Machine learning methods to predict density functional theory B3LYP energies and HOMO and LUMO orbitals. J. Chem. Inf. Model. 2017, 57, 11–21. [Google Scholar] [CrossRef]
- Sato, M.; Tanaka, H.; Oh-Uchi, T.; Fukai, T.; Etoh, H.; Yamaguchi, R. Antibacterial activity of phytochemicals isolated from Erythrina zeyheri against vancomycin-resistant enterococci and their combinations with vancomycin. Phytother. Res. 2004, 18, 906–910. [Google Scholar] [CrossRef]
- Akter, K.; Barnes, E.C.; Loa-Kum-Cheung, W.L.; Yin, P.; Kichu, M.; Brophy, J.J.; Barrow, R.A.; Imchen, I.; Vemulpad, S.R.; Jamie, J.F. Antimicrobial and antioxidant activity and chemical characterisation of Erythrina stricta Roxb. (Fabaceae). J. Ethnopharmacol. 2016, 185, 171–181. [Google Scholar] [CrossRef] [PubMed]
- Redko, F.; Clavin, M.L.; Weber, D.; Ranea, F.; Anke, T.; Martino, V. Antimicrobial isoflavonoids from Erythrina crista galli infected with Phomopsis sp. Zeitzchrift fur Naturforschung. C J. Biosci. 2006, 62, 164–168. [Google Scholar] [CrossRef] [PubMed]
- Mitscher, L.A.; Gollapudi, S.R.; Gerlach, D.C.; Drake, S.D.; Veliz, E.A.; Ward, J.A. Erycristin, a new antimicrobial pterocarpan from Erythrina crista-galli. Phytochemistry 1988, 27, 381–385. [Google Scholar] [CrossRef]
- Tanaka, H.; Atsumi, I.; Shirota, O.; Sekita, S.; Sakai, E.; Sato, M.; Murata, J.; Murata, H.; Darnaedi, D.; Chen, I.S. Three new constituents from the roots of Erythrina variegata and their antibacterial activity against methicillin-resistant Staphylococcus aureus. Chem. Biodivers. 2011, 8, 476–482. [Google Scholar] [CrossRef] [PubMed]
- Khaomek, P.; Ruangrungsi, N.; Saifah, E.; Sriubolmas, N.; Ichino, C.; Kiyohara, H.; Yamada, H. A new pterocarpan from Erythrina fusca. Heterocycles 2004, 63, 879–884. [Google Scholar]
- Tanaka, H.; Sudo, M.; Tomoko, K.; Sato, M.; Yamaguchi, R.; Fukai, T.; Sakai, E.; Tanaka, N. Antibacterial constituents from the roots of Erythrina herbacea against methicillin-resistant Staphylococcus aureus. Planta Med. 2010, 76, 916–919. [Google Scholar] [CrossRef] [Green Version]
- ChemAxon. MarvinSketch. Available online: https://chemaxon.com/products/marvin (accessed on 30 December 2019).
- Stewart, J.J.P. MOPAC2016, Stewart Computational Chemistry. Available online: http://OpenMOPAC.net/ (accessed on 30 December 2016).
- O’Boyle, N.M.; Banck, M.; James, C.A.; Morley, C.; Vandermeersch, T.; Hutchinson, G.R. Open Babel: An open chemical toolbox. J. Cheminfor. 2011, 3, 1–14. [Google Scholar] [CrossRef] [Green Version]
- OpenBabel. The Open Babel Package. Available online: http:/openbabel.org (accessed on 30 December 2019).
- Klekota, J.; Roth, F.P. Chemical substructures that enrich for biological activity. Bioinformatics 2008, 24, 2518–2525. [Google Scholar] [CrossRef]
- Yap, C.W. PaDEL-descriptor: An open source software to calculate molecular descriptors and fingerprints. J. Comput. Chem. 2011, 32, 1466–1474. [Google Scholar] [CrossRef]


| Pathogens | Extracts | Pure Compounds | ||||||||
|---|---|---|---|---|---|---|---|---|---|---|
| DCM | MeOH | 1 | 2 | 3 | 4 | 5 | 6 | 7 | +Cont | |
| Bacillus cereus ATCC 11175 | 250 | 210 | 1 | 10 | 26 | 10 | 31 | 156 | 2 | 0.020 |
| Staphylococcus aureus ATCC 25923 | 104 | 125 | 2 | 10 | 59 | 5 | 31 | 156 | 62 | 0.078 |
| S. epidermidis ATCC 12228 | 5 | 125 | 2 | 5 | 117 | 2 | 125 | 412 | 26 | 0.078 |
| Escherichia coli ATCC 8739 | 667 | 1000 | 2 | 20 | 260 | 5 | 125 | 625 | 6 | 0.078 |
| Pseudomonas aeruginosa ATCC 27853 | 500 | 830 | 20 | 20 | 260 | 5 | 20 | 78 | 31 | 0.078 |
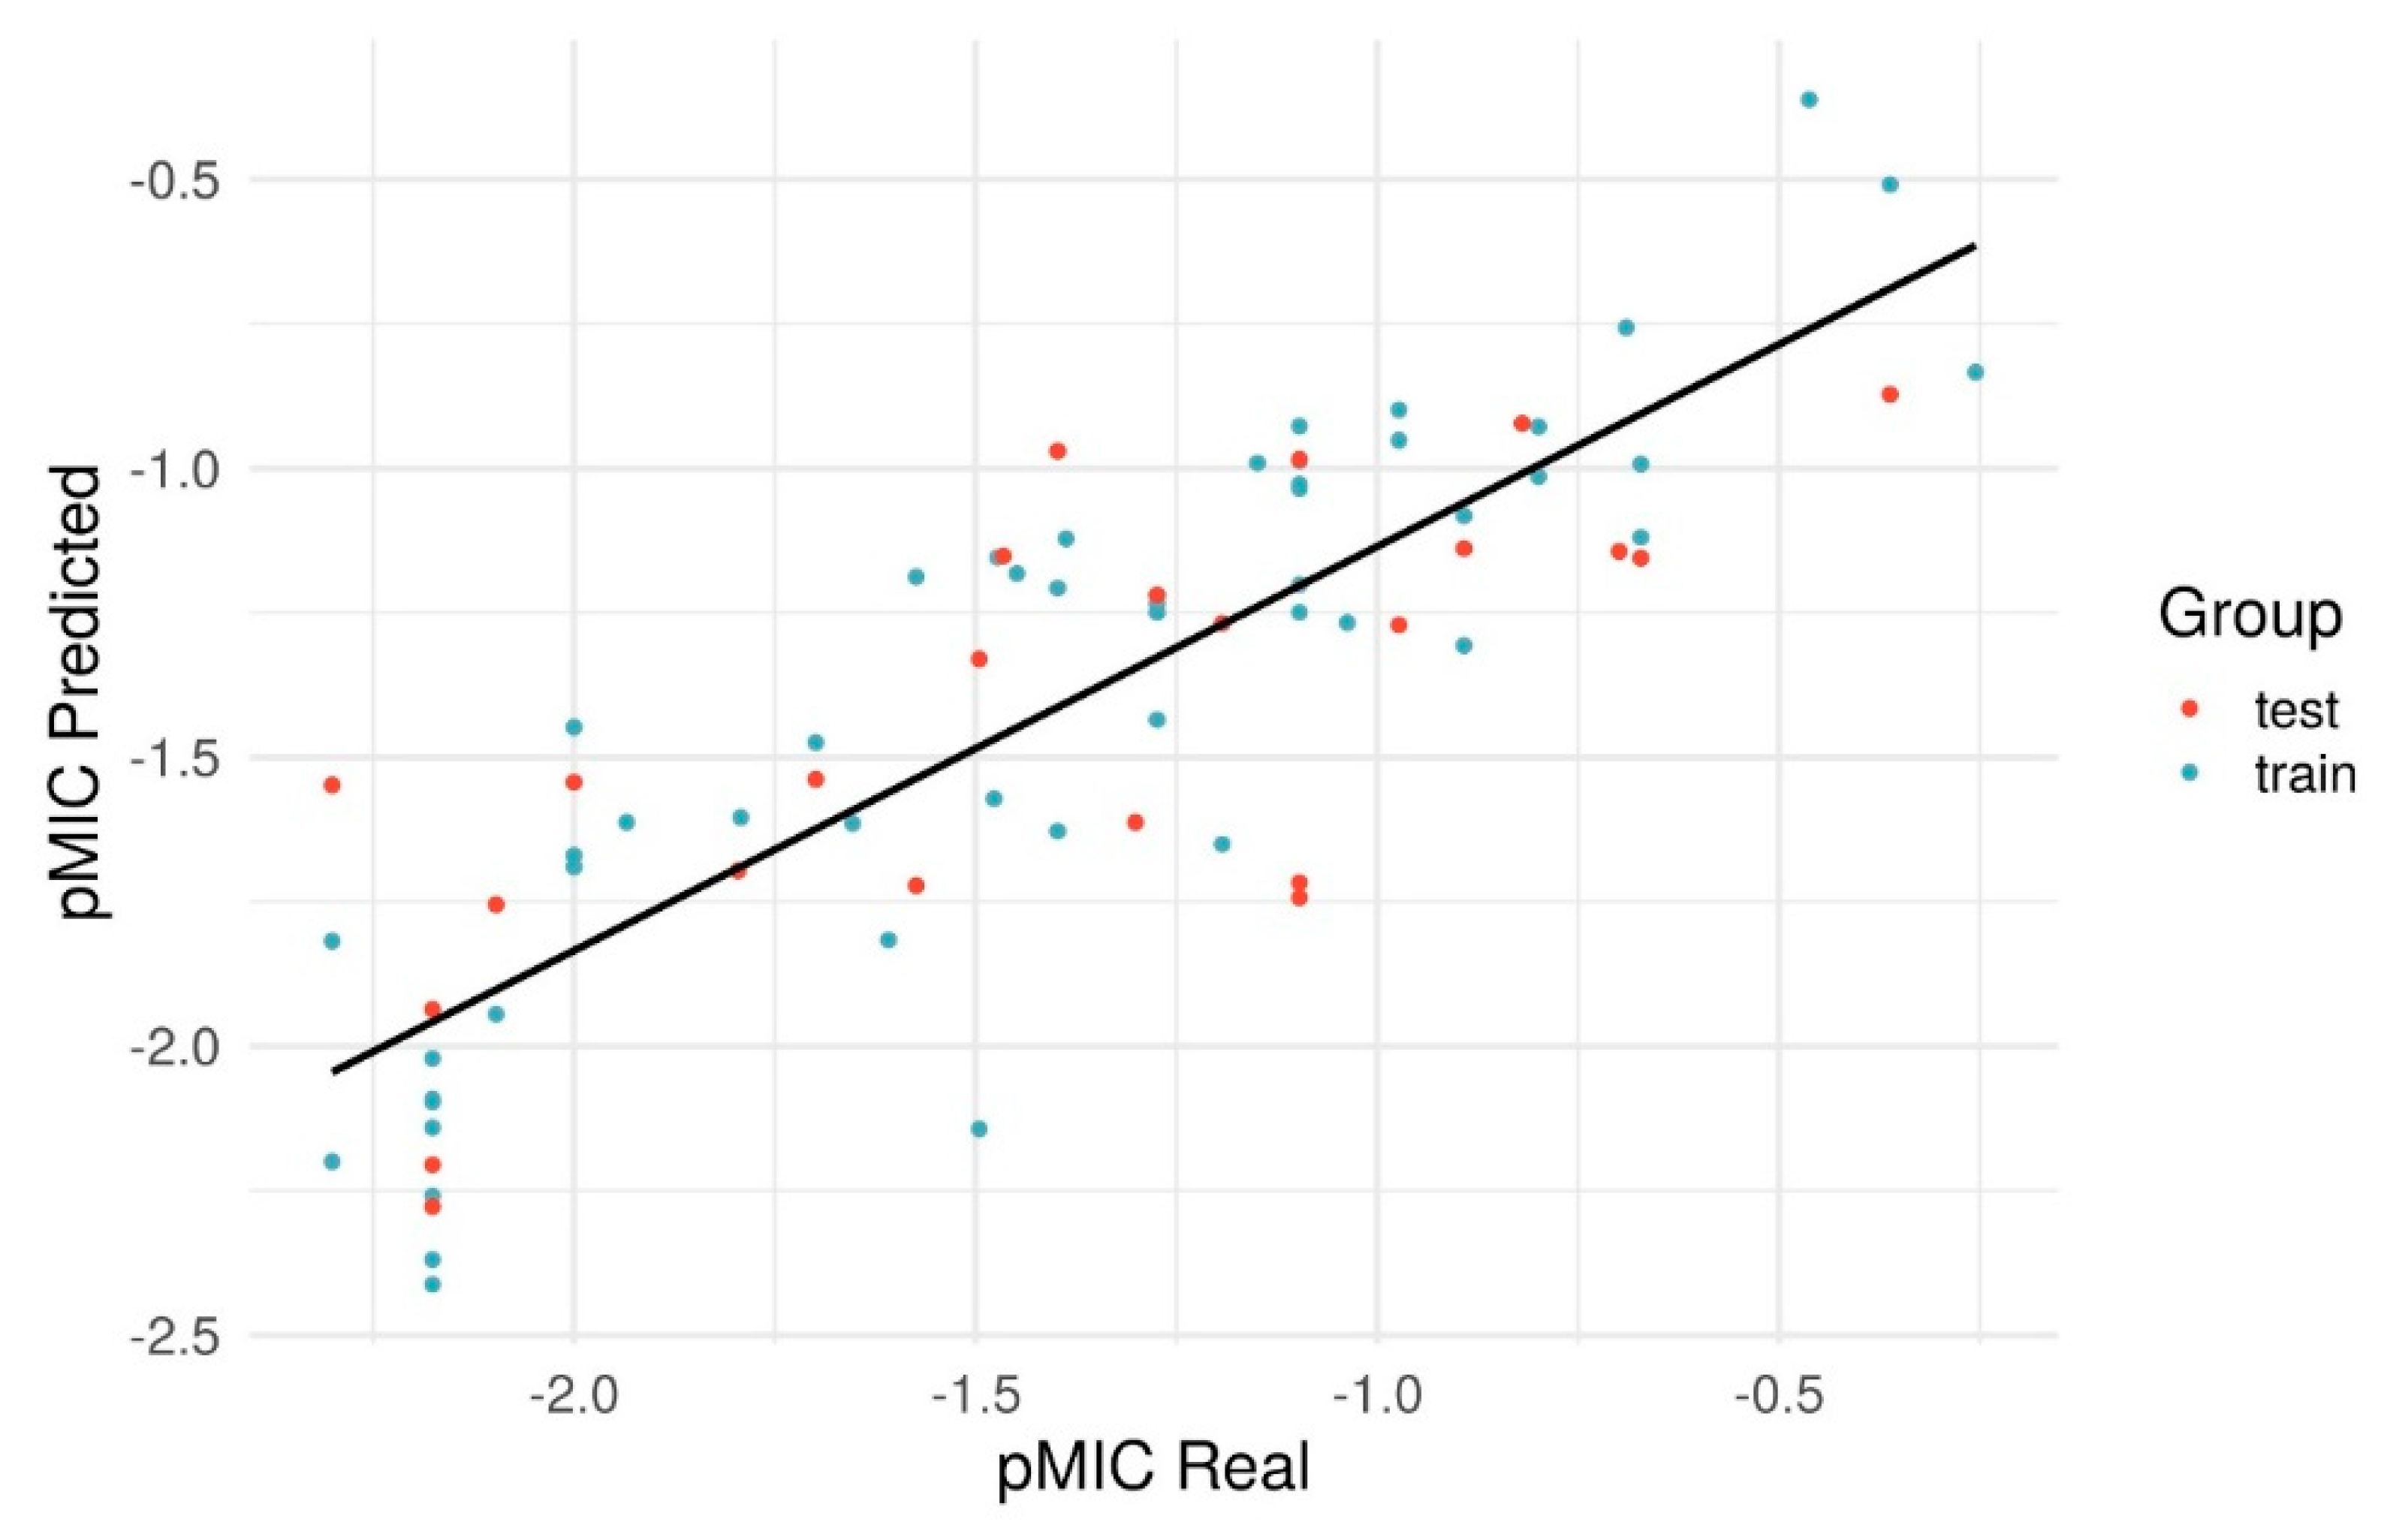
| Step | Coefficient of Determination | MAE | RMSD | R² Scramble | MAE Scramble | RMSD Scramble |
|---|---|---|---|---|---|---|
| Train | 0.778 | 0.212 | 0.261 | 0.037 | 0.451 | 0.544 |
| LOO-CV | 0.727 | 0.238 | 0.290 | −0.154 | 0.500 | 0.595 |
| Test | 0.555 | 0.298 | 0.359 | −0.045 | 0.460 | 0.551 |
| Compounds | Class | Class Predicted SAR | pMIC | pMIC Predicted | Experimental MIC | QSAR Predicted MIC | Class Predicted QSAR |
|---|---|---|---|---|---|---|---|
| Isolupalbigenin | A | A1 | −0.36 | -0.87 | 2.3 | 7.4 | A |
| Corylifol A | A | A1 | −0.7 | −1.14 | 5.0 | 13.8 | B |
| Eryzerin C | A | A2 | −0.67 | −1.16 | 4.7 | 14.5 | B |
| lonchocarpol A | A | A2 | −0.8 | −0.93 | 6.3 | 8.5 | A |
| Orientenol E | A | A2 | −0.82 | −0.92 | 6.6 | 8.3 | A |
| Diprenylgenistein | A | A2 | −0.89 | −1.08 | 7.8 | 12.0 | B |
| Erythrinin B | A | A2 | −0.89 | −1.31 | 7.8 | 20.4 | B |
| Erythrabyssin−II | A | A3 | −0.26 | −0.83 | 1.8 | 6.8 | A |
| Erycristagallin | A | A3 | −0.46 | −0.36 | 2.9 | 2.3 | A |
| Orientanol F | A | A4 | −0.89 | −1.14 | 7.8 | 13.8 | B |
| Erybacin B | A | A4 | −0.97 | −0.9 | 9.3 | 7.9 | A |
| Eryzerin D | A | A4 | −0.97 | −1.27 | 9.3 | 18.6 | B |
| Eryvarin W | A | B3 | −0.36 | −0.51 | 2.3 | 3.2 | A |
| Erybraedin A | A | B3 | −0.69 | −0.76 | 4.9 | 5.8 | A |
| Orientanol B | A | C2 | −0.67 | −0.99 | 4.7 | 9.8 | A |
| Erycristin | A | C2 | −0.8 | −1.01 | 6.3 | 10.2 | A |
| Bidwillol A | A | C2 | −0.97 | −0.95 | 9.3 | 8.9 | A |
| Diprenyl costarone | A | D3 | −0.67 | −1.12 | 4.7 | 13.2 | B |
| Compounds | Class | Class Predicted SAR | pMIC | pMIC Predicted | Experimental MIC | QSAR Predicted MIC | Class Predicted QSAR |
|---|---|---|---|---|---|---|---|
| Neobavaisoflavone | B | A1 | −1.3 | −1.61 | 20.0 | 40.7 | C |
| Dihydroauriculatin | B | A4 | −1.15 | −0.99 | 14.1 | 9.8 | A |
| Eryvarin C | B | A4 | −1.27 | −1.44 | 18.6 | 27.5 | C |
| Erystagallin A | B | B1 | −1.04 | −1.27 | 11.0 | 18.6 | B |
| Eryzerin E | B | B1 | −1.19 | −1.27 | 15.5 | 18.6 | B |
| Orientanol C | B | B1 | −1.19 | −1.65 | 15.5 | 44.7 | C |
| Eryvarin V | B | B1 | −1.27 | −1.22 | 18.6 | 16.6 | B |
| 5−Hydroxysophoranone | B | B2 | −1.1 | −0.93 | 12.6 | 8.5 | A |
| Abyssinone IV | B | B2 | −1.1 | −1.25 | 12.6 | 17.8 | B |
| Erybraedin C | B | B3 | −1.1 | −1.03 | 12.6 | 10.7 | A |
| Eryvarin D | B | B3 | −1.1 | −0.98 | 12.6 | 9.5 | A |
| Ptorepterocarpan | B | B3 | −1.1 | −0.99 | 12.6 | 9.8 | A |
| Eryzerin A | B | B3 | −1.27 | −1.25 | 18.6 | 17.8 | B |
| Phaseollidin | B | B3 | −1.39 | −1.12 | 24.5 | 13.2 | B |
| Eryvarin Y | B | B4 | −1.27 | −1.23 | 18.6 | 17.0 | B |
| Citflavanone | B | B5 | −1.1 | −1.74 | 12.6 | 55.0 | C |
| Glabrocoumarone A | B | B5 | −1.1 | −1.2 | 12.6 | 15.8 | B |
| Erybraedin B | B | C4 | −1.1 | −1.04 | 12.6 | 11.0 | B |
| Lupinifolin | B | D4 | −1.1 | −1.72 | 12.6 | 52.5 | C |
| Compounds | Class | Class Predicted SAR | pMIC | pMIC Predicted | Experimental MIC | QSAR Predicted MIC | Class Predicted QSAR |
|---|---|---|---|---|---|---|---|
| Orobol | C | A1 | −1.93 | −1.61 | 85.1 | 40.7 | C |
| Eryvarin Z | C | B4 | −1.57 | −1.19 | 37.2 | 15.5 | B |
| Eryravin L | C | C1 | −1.4 | −1.63 | 25.1 | 42.7 | C |
| Demethylmedicarpin | C | C1 | −1.7 | −1.54 | 50.1 | 34.7 | C |
| Erypoegin A | C | C2 | −1.4 | −1.21 | 25.1 | 16.2 | B |
| Eryvarin E | C | C2 | −1.4 | −0.97 | 25.1 | 9.3 | A |
| Sandwicensin | C | C2 | −1.47 | −1.15 | 29.5 | 14.1 | B |
| Abyssinone−V 4−O−methyl ether | C | C2 | −1.65 | −1.61 | 44.7 | 40.7 | C |
| Lysisteisoflavone | C | C2 | −1.79 | −1.6 | 61.7 | 39.8 | C |
| Eryzerin B | C | C2 | −1.8 | −1.7 | 63.1 | 50.1 | C |
| Glabrol | C | C3 | −1.47 | −1.15 | 29.5 | 14.1 | B |
| Erysubin F | C | C3 | −1.7 | −1.47 | 50.1 | 29.5 | C |
| Folitenol | C | C4 | −1.45 | −1.18 | 28.2 | 15.1 | B |
| Alpinumisoflavone | C | C4 | −1.48 | −1.57 | 30.2 | 37.2 | C |
| Erythbidin A | C | C4 | −1.5 | −1.33 | 31.6 | 21.4 | B |
| Glyasperin F | C | C4 | −1.5 | −2.14 | 31.6 | 138.0 | D |
| Phaseolin | C | C4 | −1.57 | −1.72 | 37.2 | 52.5 | C |
| Prenyl costarone | C | D3 | −1.61 | −1.82 | 40.7 | 66.1 | C |
| Compounds | Class | Class Predicted SAR | pMIC | pMIC Predicted | Experimental MIC | QSAR Predicted MIC | Class Predicted QSAR |
|---|---|---|---|---|---|---|---|
| Burttinone | D | B1 | −2.1 | −1.76 | 125.9 | 57.5 | C |
| Cristacarpin | D | B1 | −2.1 | −1.94 | 125.9 | 87.1 | D |
| Isoneorautenol | D | C4 | −2 | −1.45 | 100.0 | 28.2 | C |
| Apigenin | D | D1 | −2.18 | −2.1 | 151.4 | 125.9 | D |
| Biochanin A | D | D1 | −2.18 | −2.21 | 151.4 | 162.2 | D |
| Calycosin | D | D1 | −2.18 | −2.41 | 151.4 | 257.0 | D |
| Chrysin | D | D1 | −2.18 | −2.14 | 151.4 | 138.0 | D |
| Daidzein | D | D1 | −2.18 | −2.28 | 151.4 | 190.5 | D |
| Genistein | D | D1 | −2.18 | −2.02 | 151.4 | 104.7 | D |
| Glycitein | D | D1 | −2.18 | −2.37 | 151.4 | 234.4 | D |
| Irigenin | D | D1 | −2.18 | −1.94 | 151.4 | 87.1 | D |
| Irisflorentin | D | D1 | −2.18 | −2.26 | 151.4 | 182.0 | D |
| Tectorigenin | D | D1 | −2.18 | −2.09 | 151.4 | 123.0 | D |
| Eryvarin A | D | D2 | −2.3 | −2.2 | 199.5 | 158.5 | D |
| Fuscapterocarpan | D | D2 | −2.3 | −1.82 | 199.5 | 66.1 | C |
| Costarone | D | D3 | −2 | −1.69 | 100.0 | 49.0 | C |
| Eryvarin H | D | D3 | −2 | −1.54 | 100.0 | 34.7 | C |
| Eryvarin X | D | D4 | −2 | −1.67 | 100.0 | 46.8 | C |
| Erythrisenegalone | D | D4 | −2.3 | −1.55 | 199.5 | 35.5 | C |
© 2020 by the authors. Licensee MDPI, Basel, Switzerland. This article is an open access article distributed under the terms and conditions of the Creative Commons Attribution (CC BY) license (http://creativecommons.org/licenses/by/4.0/).
Share and Cite
Sadgrove, N.J.; Oliveira, T.B.; Khumalo, G.P.; van Vuuren, S.F.; van Wyk, B.-E. Antimicrobial Isoflavones and Derivatives from Erythrina (Fabaceae): Structure Activity Perspective (Sar & Qsar) on Experimental and Mined Values Against Staphylococcus aureus. Antibiotics 2020, 9, 223. https://0-doi-org.brum.beds.ac.uk/10.3390/antibiotics9050223
Sadgrove NJ, Oliveira TB, Khumalo GP, van Vuuren SF, van Wyk B-E. Antimicrobial Isoflavones and Derivatives from Erythrina (Fabaceae): Structure Activity Perspective (Sar & Qsar) on Experimental and Mined Values Against Staphylococcus aureus. Antibiotics. 2020; 9(5):223. https://0-doi-org.brum.beds.ac.uk/10.3390/antibiotics9050223
Chicago/Turabian StyleSadgrove, Nicholas J., Tiago B. Oliveira, Gugulethu P. Khumalo, Sandy F. van Vuuren, and Ben-Erik van Wyk. 2020. "Antimicrobial Isoflavones and Derivatives from Erythrina (Fabaceae): Structure Activity Perspective (Sar & Qsar) on Experimental and Mined Values Against Staphylococcus aureus" Antibiotics 9, no. 5: 223. https://0-doi-org.brum.beds.ac.uk/10.3390/antibiotics9050223