Electrodeposition and Characterization of Lanthanide Elements on Carbon Sheets
by

Min Hee Joo
1,2, 
So Jeong Park
1,
Sung-Min Hong
1,2,
Choong Kyun Rhee
1,
Dongsoo Kim
3,4,* and
Youngku Sohn
1,2,*
1
Department of Chemistry, Chungnam National University, Daejeon 34134, Korea
2
Department of Chemical Engineering and Applied Chemistry, Chungnam National University, Daejeon 34134, Korea
3
Convergence Research Center for Development of Mineral Resources, Korea Institute of Geoscience and Mineral Resources, 124, Gwahakro, Daejeon 34132, Korea
4
Powder and Ceramics Division, Korea Institute of Materials Science, 797, Changwondaero, Seongsangu, Changwon, Gyeongnam 51508, Korea
*
Authors to whom correspondence should be addressed.
Coatings 2021, 11(1), 100; https://0-doi-org.brum.beds.ac.uk/10.3390/coatings11010100
Submission received: 27 December 2020
/
Revised: 11 January 2021
/
Accepted: 13 January 2021
/
Published: 18 January 2021
(This article belongs to the Special Issue Electrodeposition of Thin Films for Energy Applications)
Abstract
:Electrochemical coating and recovery by electrodeposition have been invaluably employed for facial thin film fabrication and the recycling of used materials. Herein, we have established a full data set of lanthanide (Ln: La, Ce, Pr, Nd, Sm, Eu, Gd, Tb, Dy, Ho, Er, Tm, and Yb) elements electrodeposited on carbon sheets. Cyclic voltammetry was performed for 10 mM Ln(III) ions in a 0.1 M NaClO4 electrolyte over a carbon sheet between +0.5 V and −1.7 V (vs. Ag/AgCl). Amperometry was performed at a given potential to electrodeposit the Ln element on the carbon sheet. Their physicochemical properties were fully investigated by scanning electron microscopy, Fourier-transform infrared spectroscopy, energy-dispersive X-ray spectroscopy, and X-ray photoelectron spectroscopy. The newly established full data set for Ln(III) ions over carbon electrodes provides useful fundamental information for the development of coating and recovery methods of Ln elements.
1. Introduction
Lanthanide (Ln) elements have been studied extensively in diverse industrial applications of magnets, high-k gate dielectrics, display materials, catalysts, and batteries [1,2,3,4,5,6]. For recycling used Ln materials, various recovery methods for Ln elements have also been demonstrated [7,8,9,10,11,12,13]. In nuclear oxide fuels, Ln elements and actinide (An) elements are commonly co-present, and their redox behaviors are very similar. For this reason, the electrochemical redox behaviors of Ln ions have been studied extensively for the development of reprocessing technology (e.g., pyroprocessing technology) of used nuclear fuels [14,15]. For their studies of electrochemical behaviors and electrodeposition, Thomas et al. successfully demonstrated that silicon–terbium nanowires could be prepared using a one-step electrodeposition method in an electrolyte containing an ionic liquid of 1-butyl-1-methylpyrrolidinium bis(trifluoromethanesulfonyl)imide, 10 mM SiCl4, and 10 mM TbCl3 [2]. Song et al. demonstrated Ni–P–ZrO2–CeO2 composite coatings on #45 steel using the jet-electrodeposition technique and achieved an optimal coating condition (e.g., potential and current density) for improving surface properties, hardness, and wear resistance [16]. Bourbos et al. studied the recovery of neodymium (Nd) by galvanostatic electrolysis at −0.8 μA and potentiostatic electrolysis at −2 V in dimethyl sulfoxide with dissolved 0.1 M NdCl3, where the best result was obtained by pulsed electrolysis at low temperatures under stirring [17]. Li et al. prepared a Ni–Mo–La composite using electro-codeposition in a weak alkaline solution of Ni and Mo ions mixed with La3+ ion [18]. They observed that the OH− ions were reduced during the electrodeposition, and the reduction potential of Ni ions was negatively shifted upon addition of La and Mo ions, accompanying a peak broadening and reducing the current efficiency. Park et al. demonstrated that Eu elements could be efficiently recovered on indium–tin–oxide electrodes from a 10 mM Eu(III)/0.1 M NaClO4 electrolyte using the amperometry method [19]. They showed that the as-recovered material was EuSO4, which was phase-transformed to red-luminescent Eu oxysulfate (Eu2O2SO4) upon thermal annealing at 700 °C. Joo et al. demonstrated that Ln elements could be efficiently coated on Ni sheets using the amperometry method in a 10 mM Ln(III)/0.1 M NaClO4 electrolyte [20]. They tentatively concluded that the recovered materials were of a Ln2(OH)x(CO3)y−z(ClO4)z·nH2O complex. Metal oxides and hydroxides with diverse morphologies including nanowires and nanotubes have been synthesized extensively by electrochemical methods [21,22,23]. As discussed, many studies on recovery and coating by electrodeposition have been focused on obtaining optimal experimental conditions.
Although there have been many studies for the preparation of Ln-containing materials and their application demonstration tests, few literatures have been systematically studied in view of electrodeposition and recovery of all of the Ln elements over carbon electrodes. In the present study, we employed all of the Ln(III) metal ions in an electrolyte and electrodeposited on carbon sheet electrodes. The novelty of this work is that we first established a full data set for Ln elements on electrochemical behaviors in an NaClO4 electrolyte and the fundamental physicochemical properties of the electrodeposited Ln materials (with presumably Ln(CO3)x(ClO4)y(OH)z·nH2O complex form) on carbon sheets, examined by scanning electron microscopy, Fourier-transform infrared spectroscopy (FT-IR), energy-dispersive X-ray spectroscopy (EDXS), and X-ray photoelectron spectroscopy (XPS). This new data set for Ln elements could be very useful for predicting redox behaviors of Ln (or An) elements in solutions, improving electrochemical coating technology for Ln elements, and developing treatment (or recycling) technology dealing with Ln elements with similar redox behaviors.
2. Materials and Methods
Ln(III) ion chemicals were all nitrates of La(III) nitrate hexahydrate (99.999%, Sigma-Aldrich, Saint Louis, MO, USA), Ce (III) nitrate hexahydrate (99%, Sigma-Aldrich), Pr(III) nitrate pentahydrate (99.9%, Alfa Aesar, Ward Hill, MA, USA), Nd(III) nitrate hexahydrate (99.9%, Alfa Aesar), Sm(III) nitrate hexahydrate (99.9%, Alfa Aesar), Eu(III) nitrate hexahydrate (99.9%, Alfa Aesar), Gd(III) nitrate hexahydrate (99.9%, Sigma-Aldrich), Tb(III) nitrate hydrate (99.9%, Alfa Aesar), Dy(III) nitrate pentahydrate (99.9%, Sigma-Aldrich), Ho(III) nitrate pentahydrate (99.99%, Alfa Aesar), Er(III) nitrate hydrate (99.9%, Sigma-Aldrich), Tm(III) nitrate hydrate (99.9%, Alfa Aesar), and Yb(III) nitrate hydrate (99.9%, Sigma Aldrich), used as received. Carbon sheets (1 mm thick) were used, with a size of 5 mm × 20 mm. Sodium perchlorate (NaClO4, ≥98.0%, Sigma-Aldrich) was used as a supporting electrolyte material and made to an aqueous 0.1 M solution. A 10 mM concentration of Ln(III) ion in the 0.1 M supporting electrolyte was prepared for electrodeposition. A conventional three-electrode system was used to perform cyclic voltammetry (CV) tests in a blank 0.1 M NaClO4 electrolyte with and without 10 mM Ln(III) ions using a WPG100 potentiostat/galvanostat (WonATech Co., Ltd., Seoul, Korea) electrochemical workstation. An Ag/AgCl (3.5 M KCl) electrode, a Pt wire (0.5 mm), and a carbon sheet (5 mm × 20 mm) were used as reference, counter, and working electrodes, respectively. For electrodeposition of the Ln elements on a carbon sheet, the amperometry was conducted at a fixed potential for 5 h based on the CV data. After electrodeposition, the electrode was gently removed from the electrolyte, washed with deionized water, and dried under an infrared lamp before further characterization. The surface morphologies of the Ln-electrodeposited samples were examined using a field-emission Hitachi S-4800 scanning electron microscope (FE-SEM, Hitachi Ltd., Tokyo, Japan). For the analysis of elements, energy-dispersive X-ray spectroscopy (EDXS) data were obtained using a JSM 7000 F scanning electron microscope (JEOL Ltd., Tokyo, Japan) at 20 kV. To examine functional groups of the electrodeposited materials, FT-IR spectra were obtained using a Nicolet iS 10 FT-IR spectrometer (Thermo Scientific Korea, Seoul, Korea) with an attenuated total reflection mode. For Eu-electrodeposited samples, photoluminescence (PL) emission and excitation spectra were obtained using a Sinco FS-2 fluorescence spectrometer (Sinco, Seoul, Korea). The 2D/3D PL contour profiles were plotted with the emission profiles at various excitation wavelengths. X-ray photoelectron spectra were obtained using a Thermo-VG Scientific K-alpha+ spectrometer (Thermo VG Scientific, Waltham, MA, USA) equipped with a hemispherical energy analyzer (CAE mode, pass energy = 50.0 eV, and step size = 0.100 eV) and an Al Kα X-ray source.
3. Results and Discussion
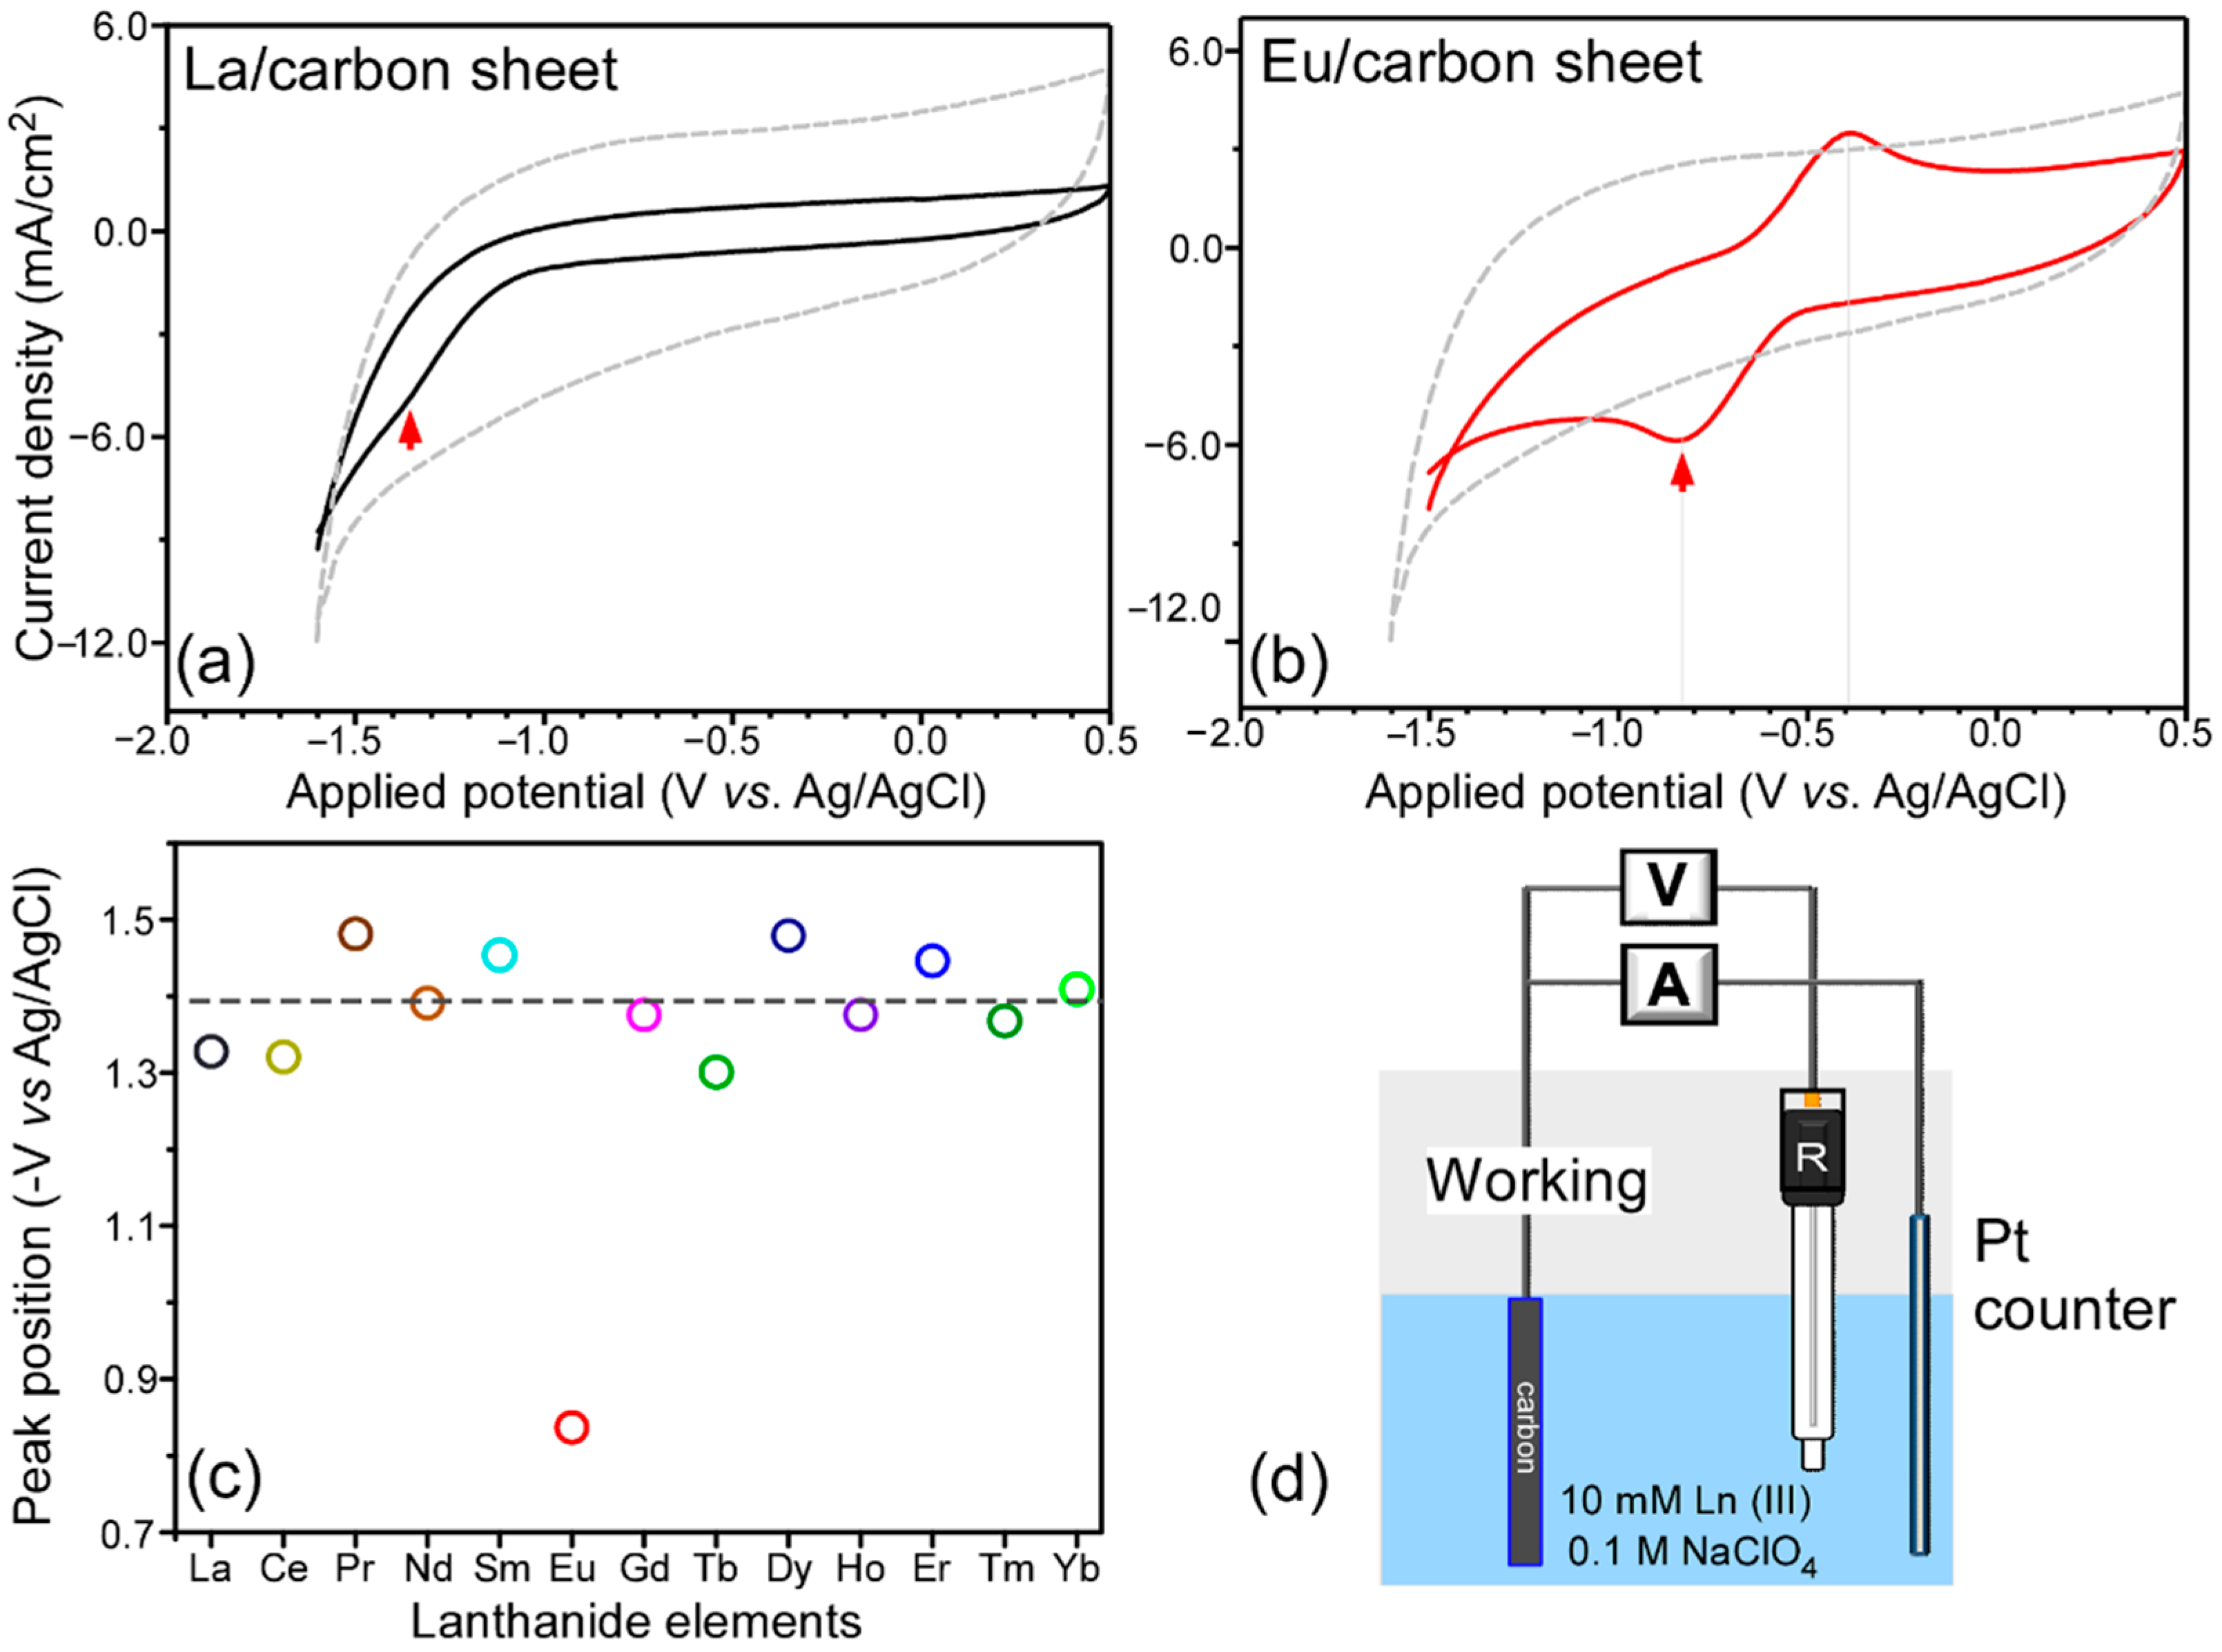
Before the electrodeposition of Ln elements on carbon sheets, cyclic voltammetry (CV) data were obtained for Ln(III) (La, Ce, Pr, Nd, Sm, Eu, Gd, Tb, Dy, Ho, Er, Tm, and Yb) ions in a blank and 10 mM Ln(III) ion containing 0.1 M NaClO4 electrolytes. Figure 1 shows the selected CV cycles for La and Eu ions, and others are provided in the Supplemental Information (Figure S1). For the cyclic voltammetry curve in a blank electrolyte, no critical redox peaks appeared between −1.7 and +0.5 V (vs. Ag/AgCl). The current increase in the negative-going scan was attributed to the current of hydrogen evolution reaction [24]. In addition, the CV profile showed high non-faradaic capacitive current, commonly observed in carbon-based materials [25]. For the CV profiles in 10 mM Ln(III)/0.1 M NaClO4 electrolytes, a critical difference in CV was observed in the high negative potential region, compared with the CV obtained in a blank 0.1 M NaClO4 electrolyte. A curvature generally appeared between −1.3 and −1.5 V (vs. Ag/AgCl), which was attributed to a reduction potential forming a complex [20], discussed further below. The observed potentials for the Ln(III) ions appeared at similar potentials. There was no corresponding oxidation peak in the opposite potential scan. This could be because the curvature in the high potential region was due to an irreversible process [19]. Once a complex was formed in the negative-going scan, the insoluble element was not returned into an electrolyte during the opposite positive-going scan. Interestingly, the CV profile in 10 mM Eu(III)/0.1 M NaClO4 electrolyte was critically different from those of other Ln ions. Two redox peaks were observed at −0.82 V and +0.40 V, tentatively attributed to Eu(III) + e− → Eu(II) and Eu(II) → Eu(III) + e− reactions, respectively [19].
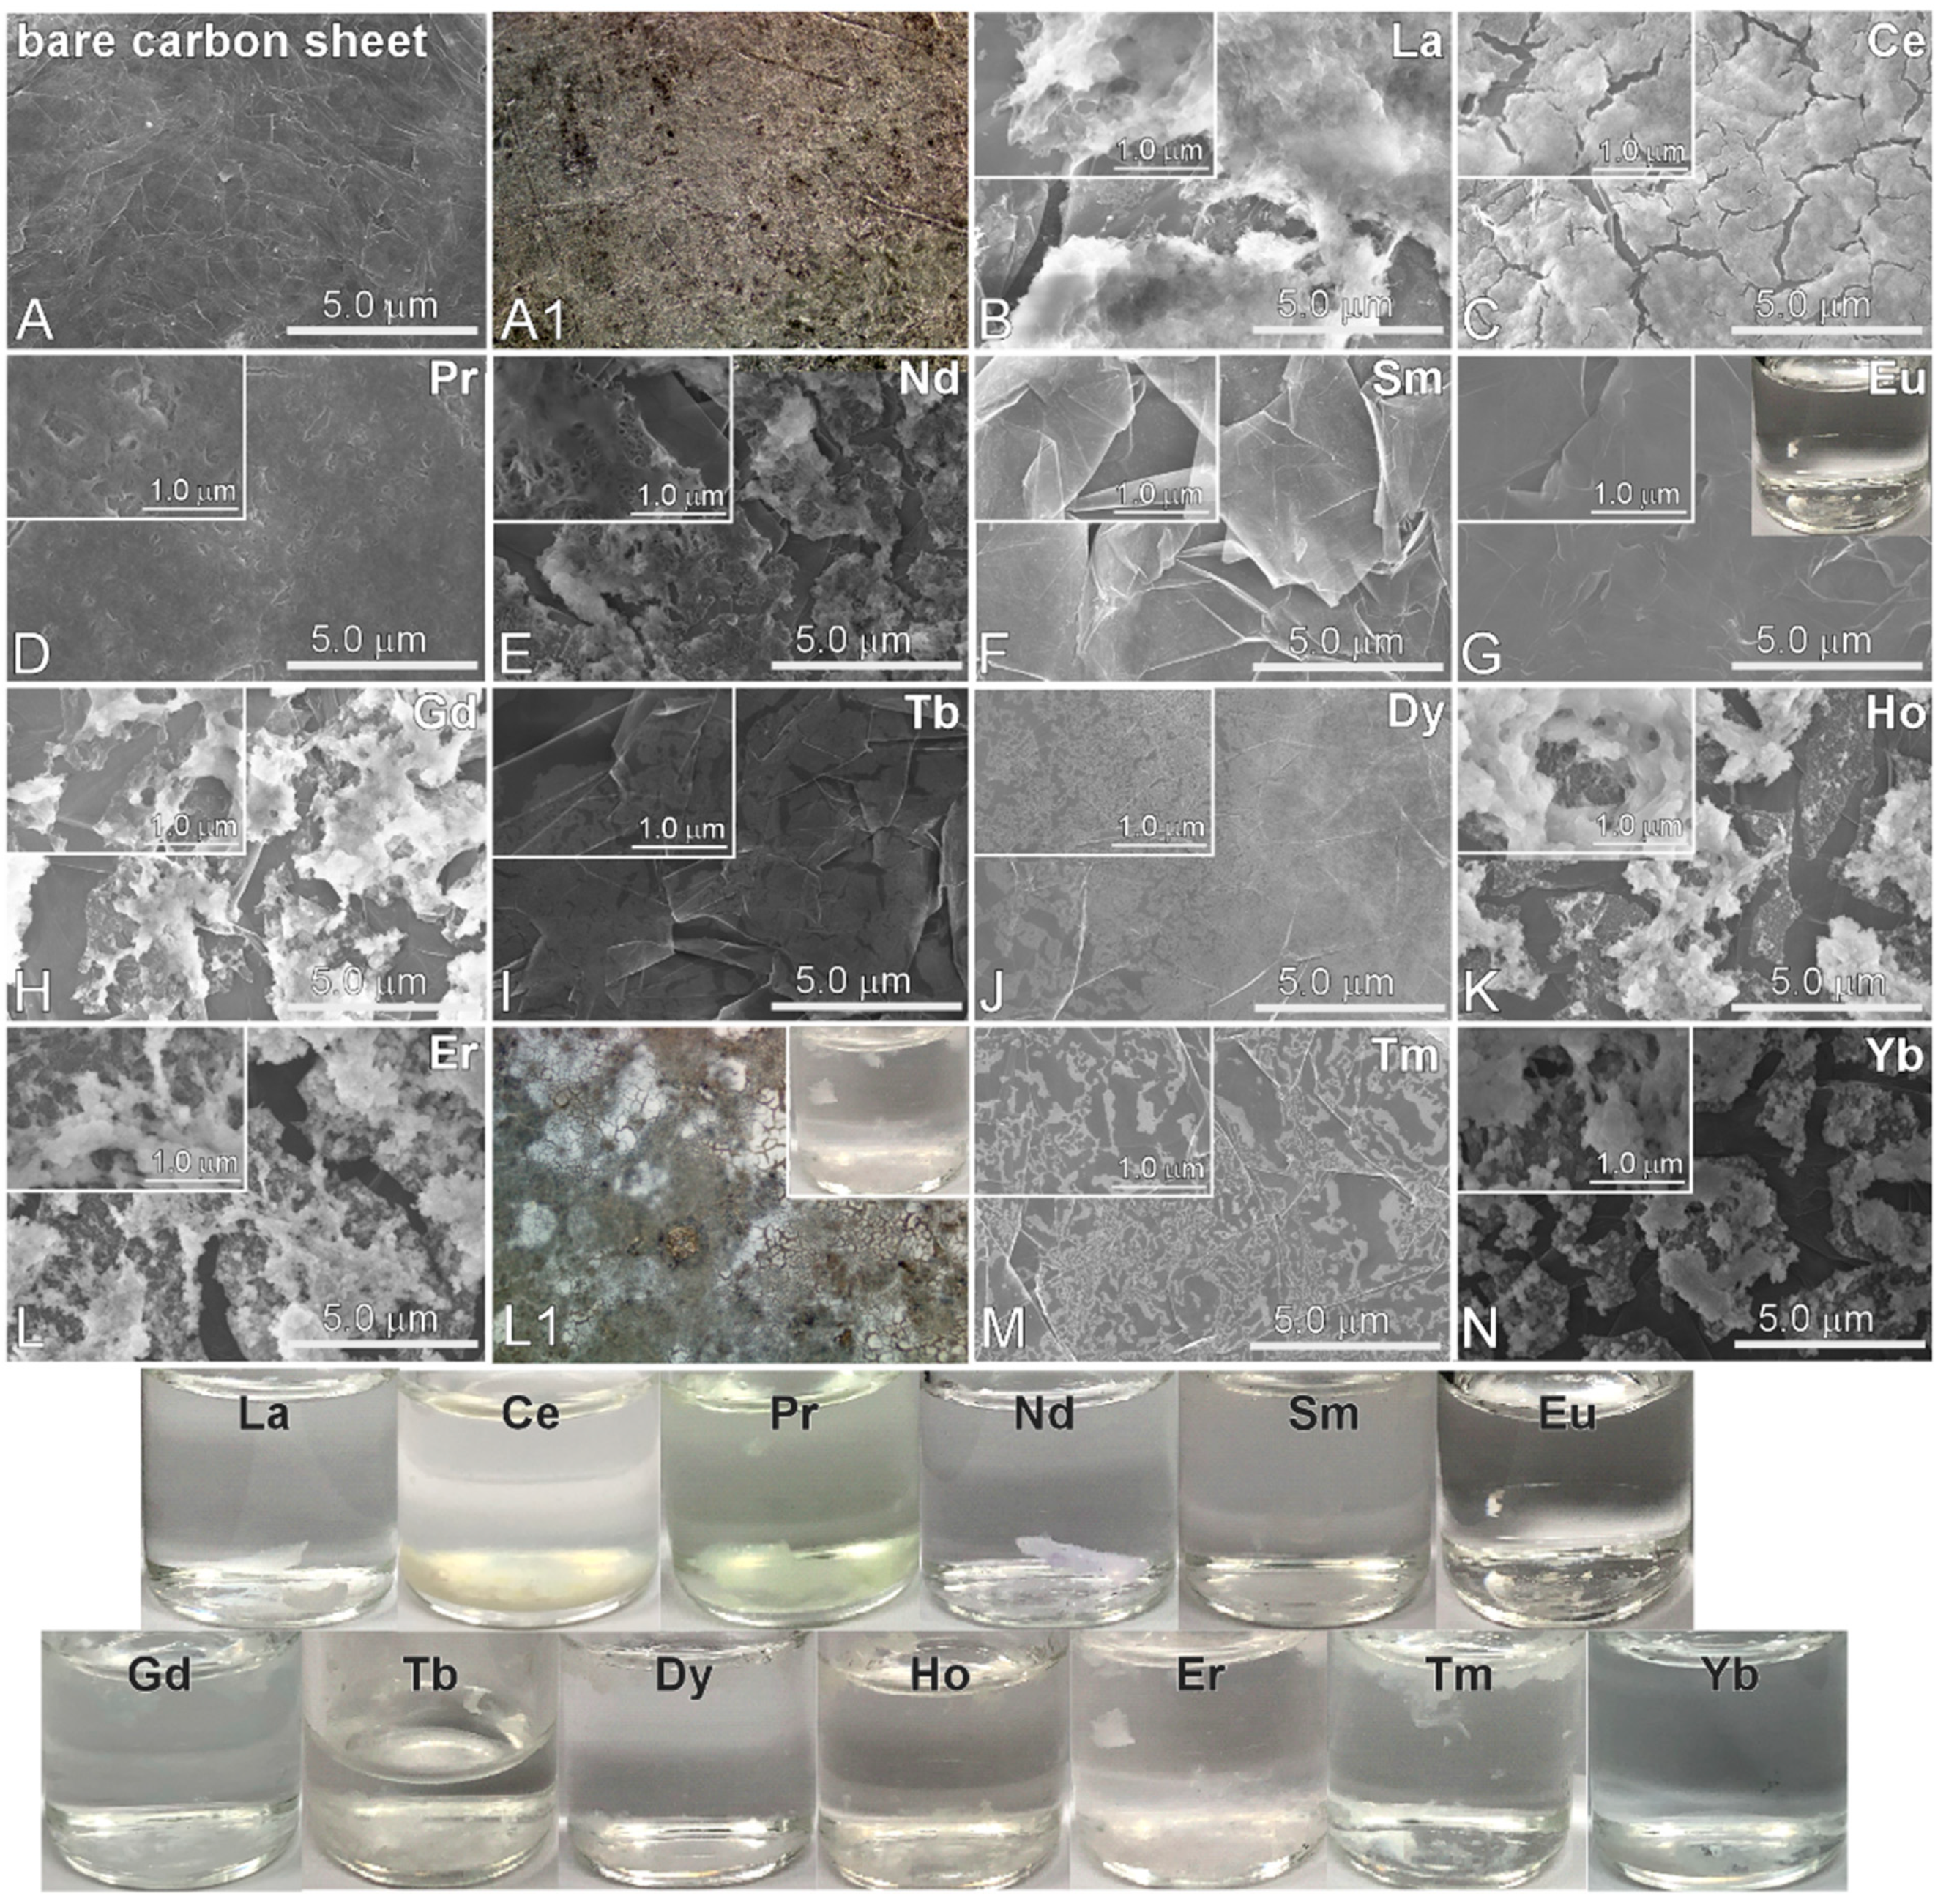
Amperometry was performed at a fixed potential in 10 mM Ln(III)/0.1 M NaClO4 electrolytes for 5 h to electrodeposit the Ln elements on carbon sheets. The surface morphologies of the electrodeposited Ln materials were fully examined by SEM, displayed in Figure 2. The SEM images (Figure 2B–N) of all of the Ln-deposited samples were observed to be critically different from that of a bare carbon sheet (Figure 2A). This indicates that Ln materials were recovered (or electrodeposited) on the carbon sheets. The optical microscope images also showed a clear distinction between bare (in Figure 2A1) and electrodeposited (in Figure 2L1) samples. We also observed precipitates in the electrolyte after electrodeposition (bottom panel in Figure 2) due to fall by gravity during electrodeposition. The morphologies in the SEM images showed aggregated particles, smooth thin films, or cluster-like thin-film states. The thicknesses of the electrodeposited samples and the amounts of precipitates in the electrolyte were found to be dependent on the Ln element. For the SEM image of Pr-electrodeposited samples, the surface morphology showed a very continuous uniform film state. As the atomic number increased from La (#57) to Yb (#70), the morphology changed from a film state to a nanoparticle-cluster state. For Ho, Er, and Yb samples, the morphologies appeared as clusters aggregated with small nanoparticles.
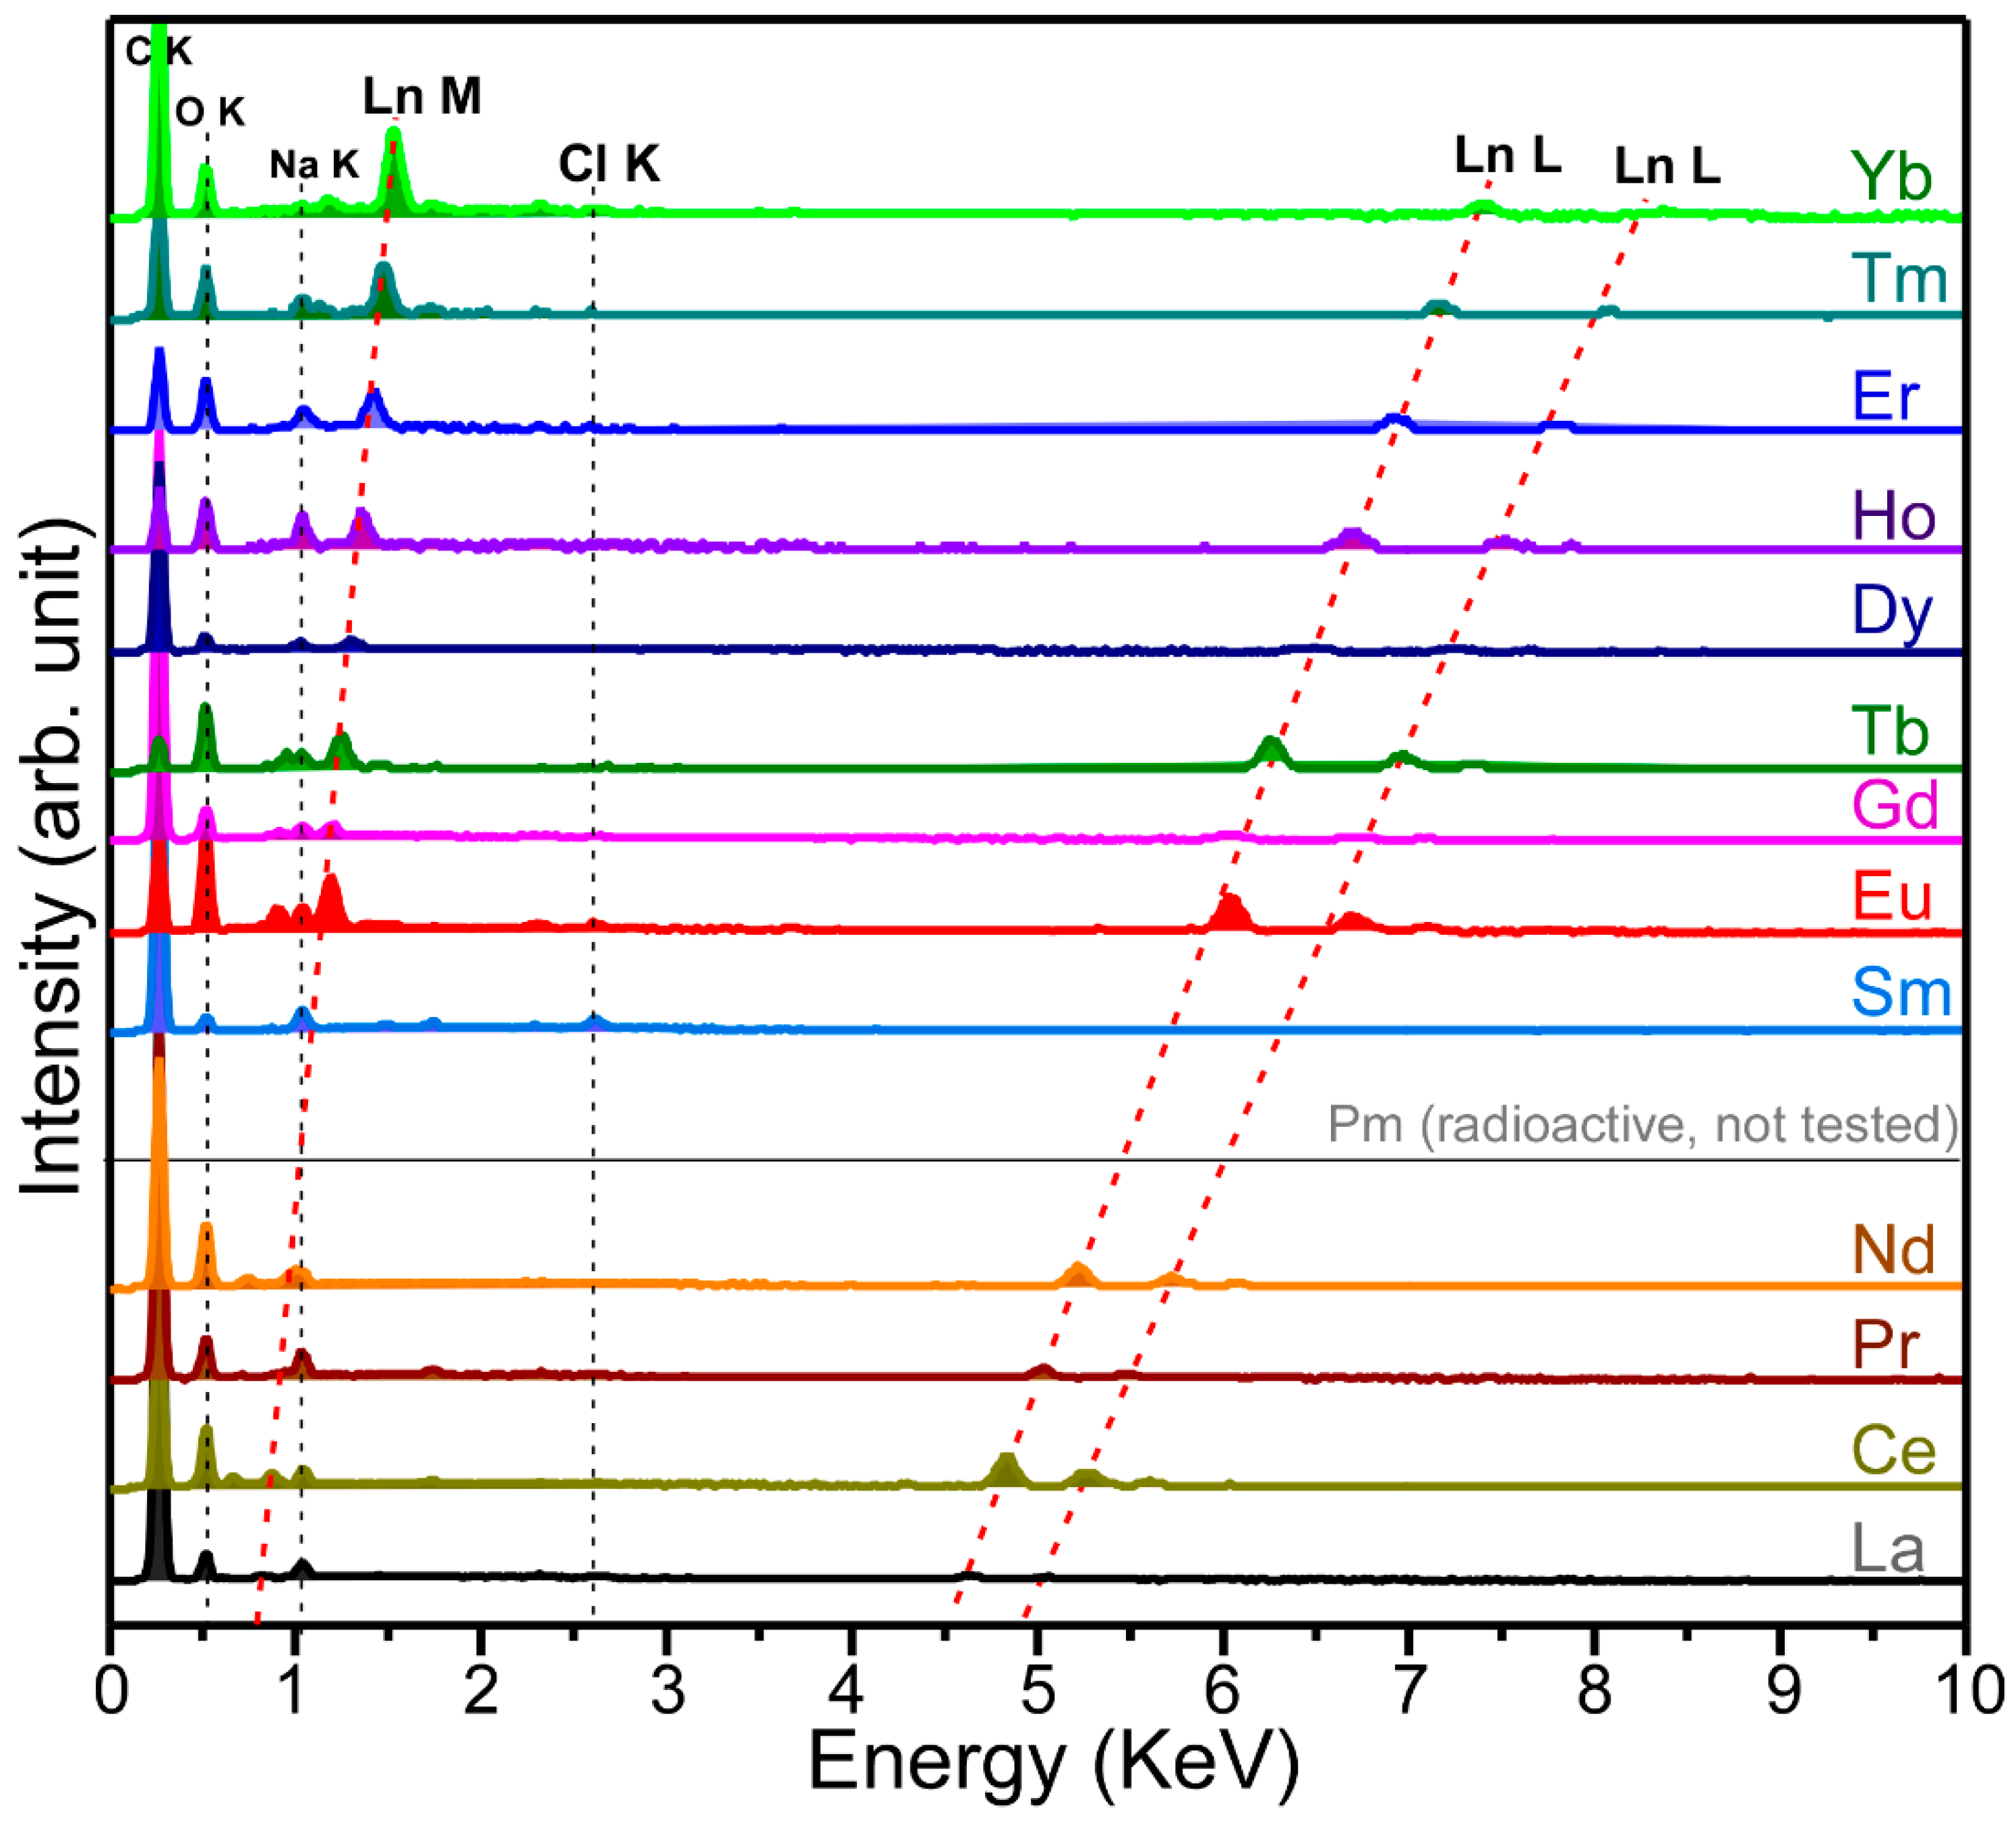
Energy-dispersive X-ray spectroscopy (EDXS) data were obtained to examine the elements of electrodeposited Ln materials on carbon sheets in Figure 3. In the EDX spectra, four common elements of C, O, Na, and Cl were observed at 0.26 KeV (C K) and 0.52 KeV (O K), 1.04 KeV (Na K), and 2.63 KeV (Cl K), respectively [26]. The Na K signal was due to trapped Na ions from the NaClO4 electrolyte. The Cl K signal was attributed to ClO4 species. The strongest C K signal at 0.26 KeV was mainly due to the carbon support electrode and partly due to carbon-based complex species. Upon electrodeposition of Ln elements, several peaks (Ln M and Ln L) newly appeared. The Ln M and Ln L peak positions were observed to be shifted to higher energy positions as the atomic number was increased. For the EDXS of La-electrodeposited samples, the Ln M peak was observed at 0.83 KeV. Two La L signals were observed at 4.64 KeV and 5.04 KeV. For the EDXS of Yb-electrodeposited samples, the Yb M peak was observed at 1.53 KeV. Two Yb L signals were observed at 7.40 KeV and 8.39 KeV. The peak separation of the La M and the Yb M signals was estimated to be 0.7 KeV. We could not measure a EDXS for radioactive promethium (Pm), but the Pm M and Pm L signals could be expected from the plots in Figure 3.
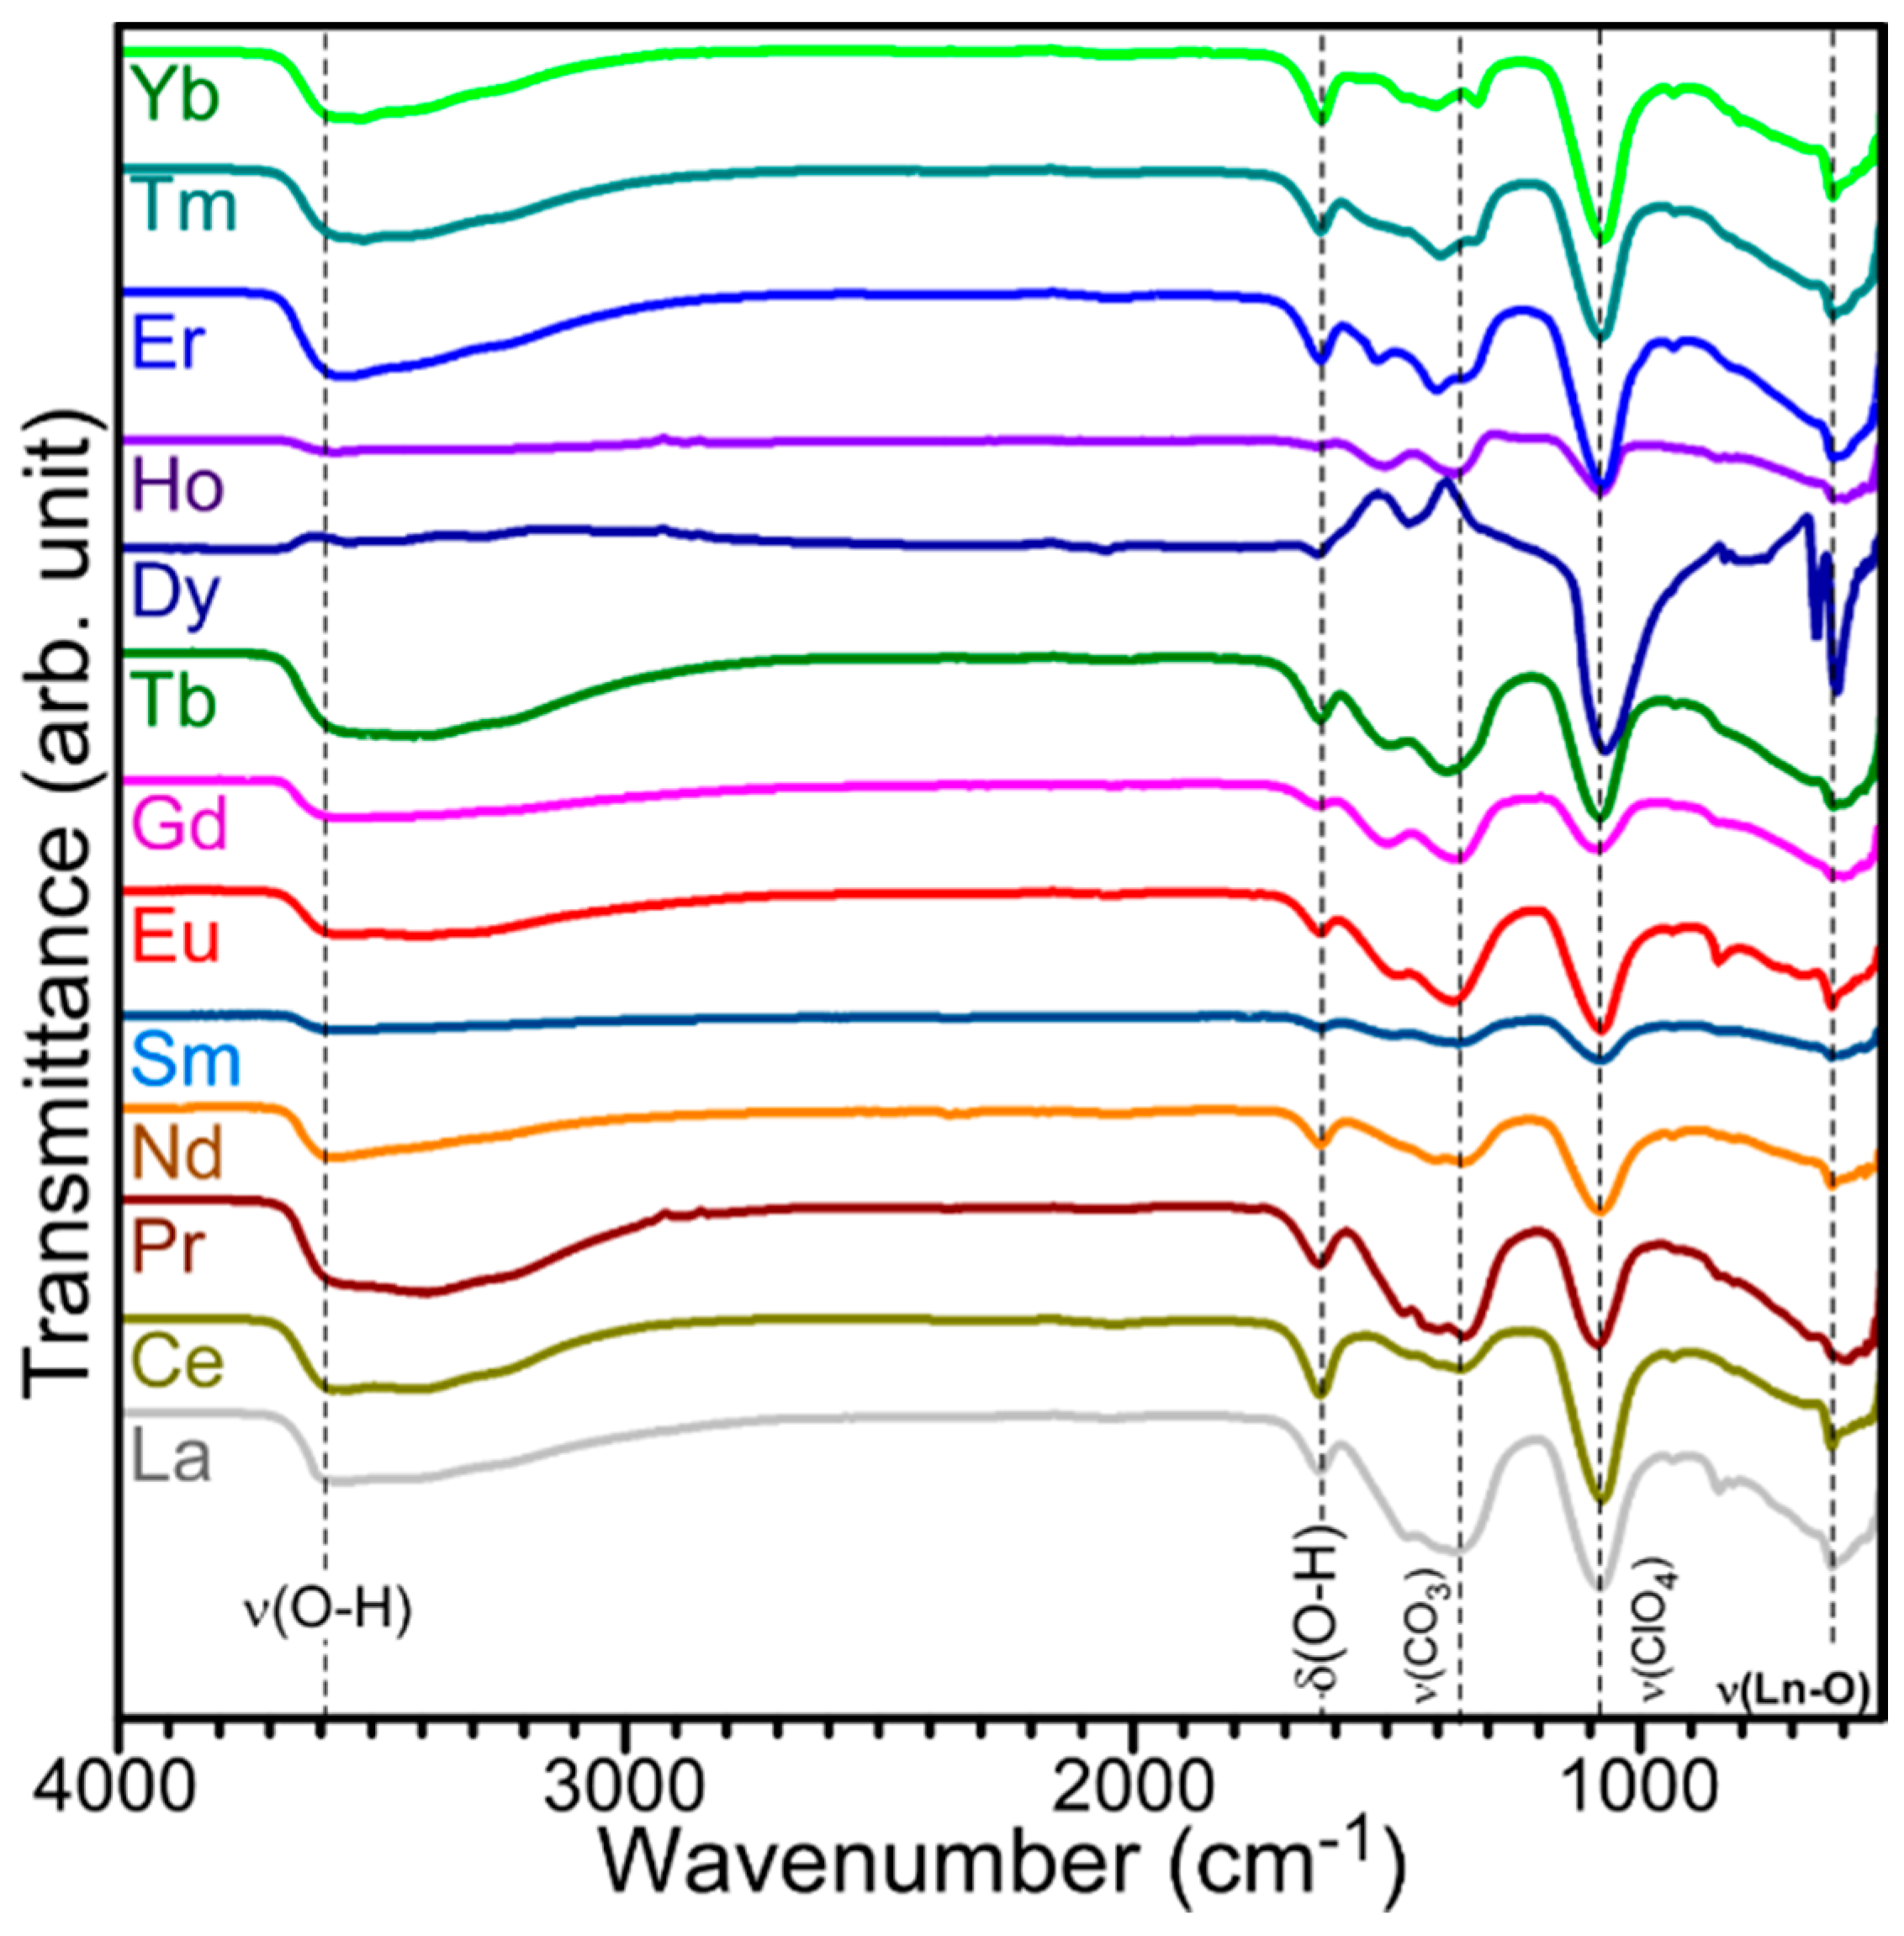
FT-IR spectra (Figure 4) were obtained to examine main functional groups consisting of the electrodeposited materials. Interestingly, all the FT-IR profiles were found to be very similar, indicating that all of the complexes were of a similar-type material. A broad peak was commonly observed around 3600 cm−1, which was attributed to the Ln–OH stretching and H2O (hydrated) vibrations [27,28]. The O–H bending vibrational mode appeared around 1620 cm−1. For the origin of the OH group, a nitrate reduction process (NO3 + H2O + 2e− → NO2 + 2OH) was possibly involved in the complexation with OH [29,30]. The Ln-O vibrational modes were commonly observed around 610 cm−1 [28]. Two more FT-IR peaks appeared strongly around 1080 and 1350 cm−1. The former peak around 1080 cm−1 was attributed to the vibration of the ClO4− group [31]. A strong region around 1350 cm−1 appeared to be vibration modes of CO32− species [27,28]. Based on the FT-IR data, the electrodeposited samples consisted of OH (and/or H2O), CO32− and ClO4− species that complexed with central Ln ions. Joo et al. reported similar FT-IR profiles for electrodeposition Ln materials on Ni sheets [20]. They concluded that the electrodeposited materials had a RE2(OH)x(CO3)y−z(ClO4)z·nH2O complex. For the complex form in the present study, meaningful X-ray diffraction signals could not be obtained, plausibly due to poor crystallinity. Based on the literature [20] and the corresponding FT-IR data, we tentatively concluded that the electrodeposits were a Ln(CO3)x(ClO4)y(OH)z·nH2O complex form.
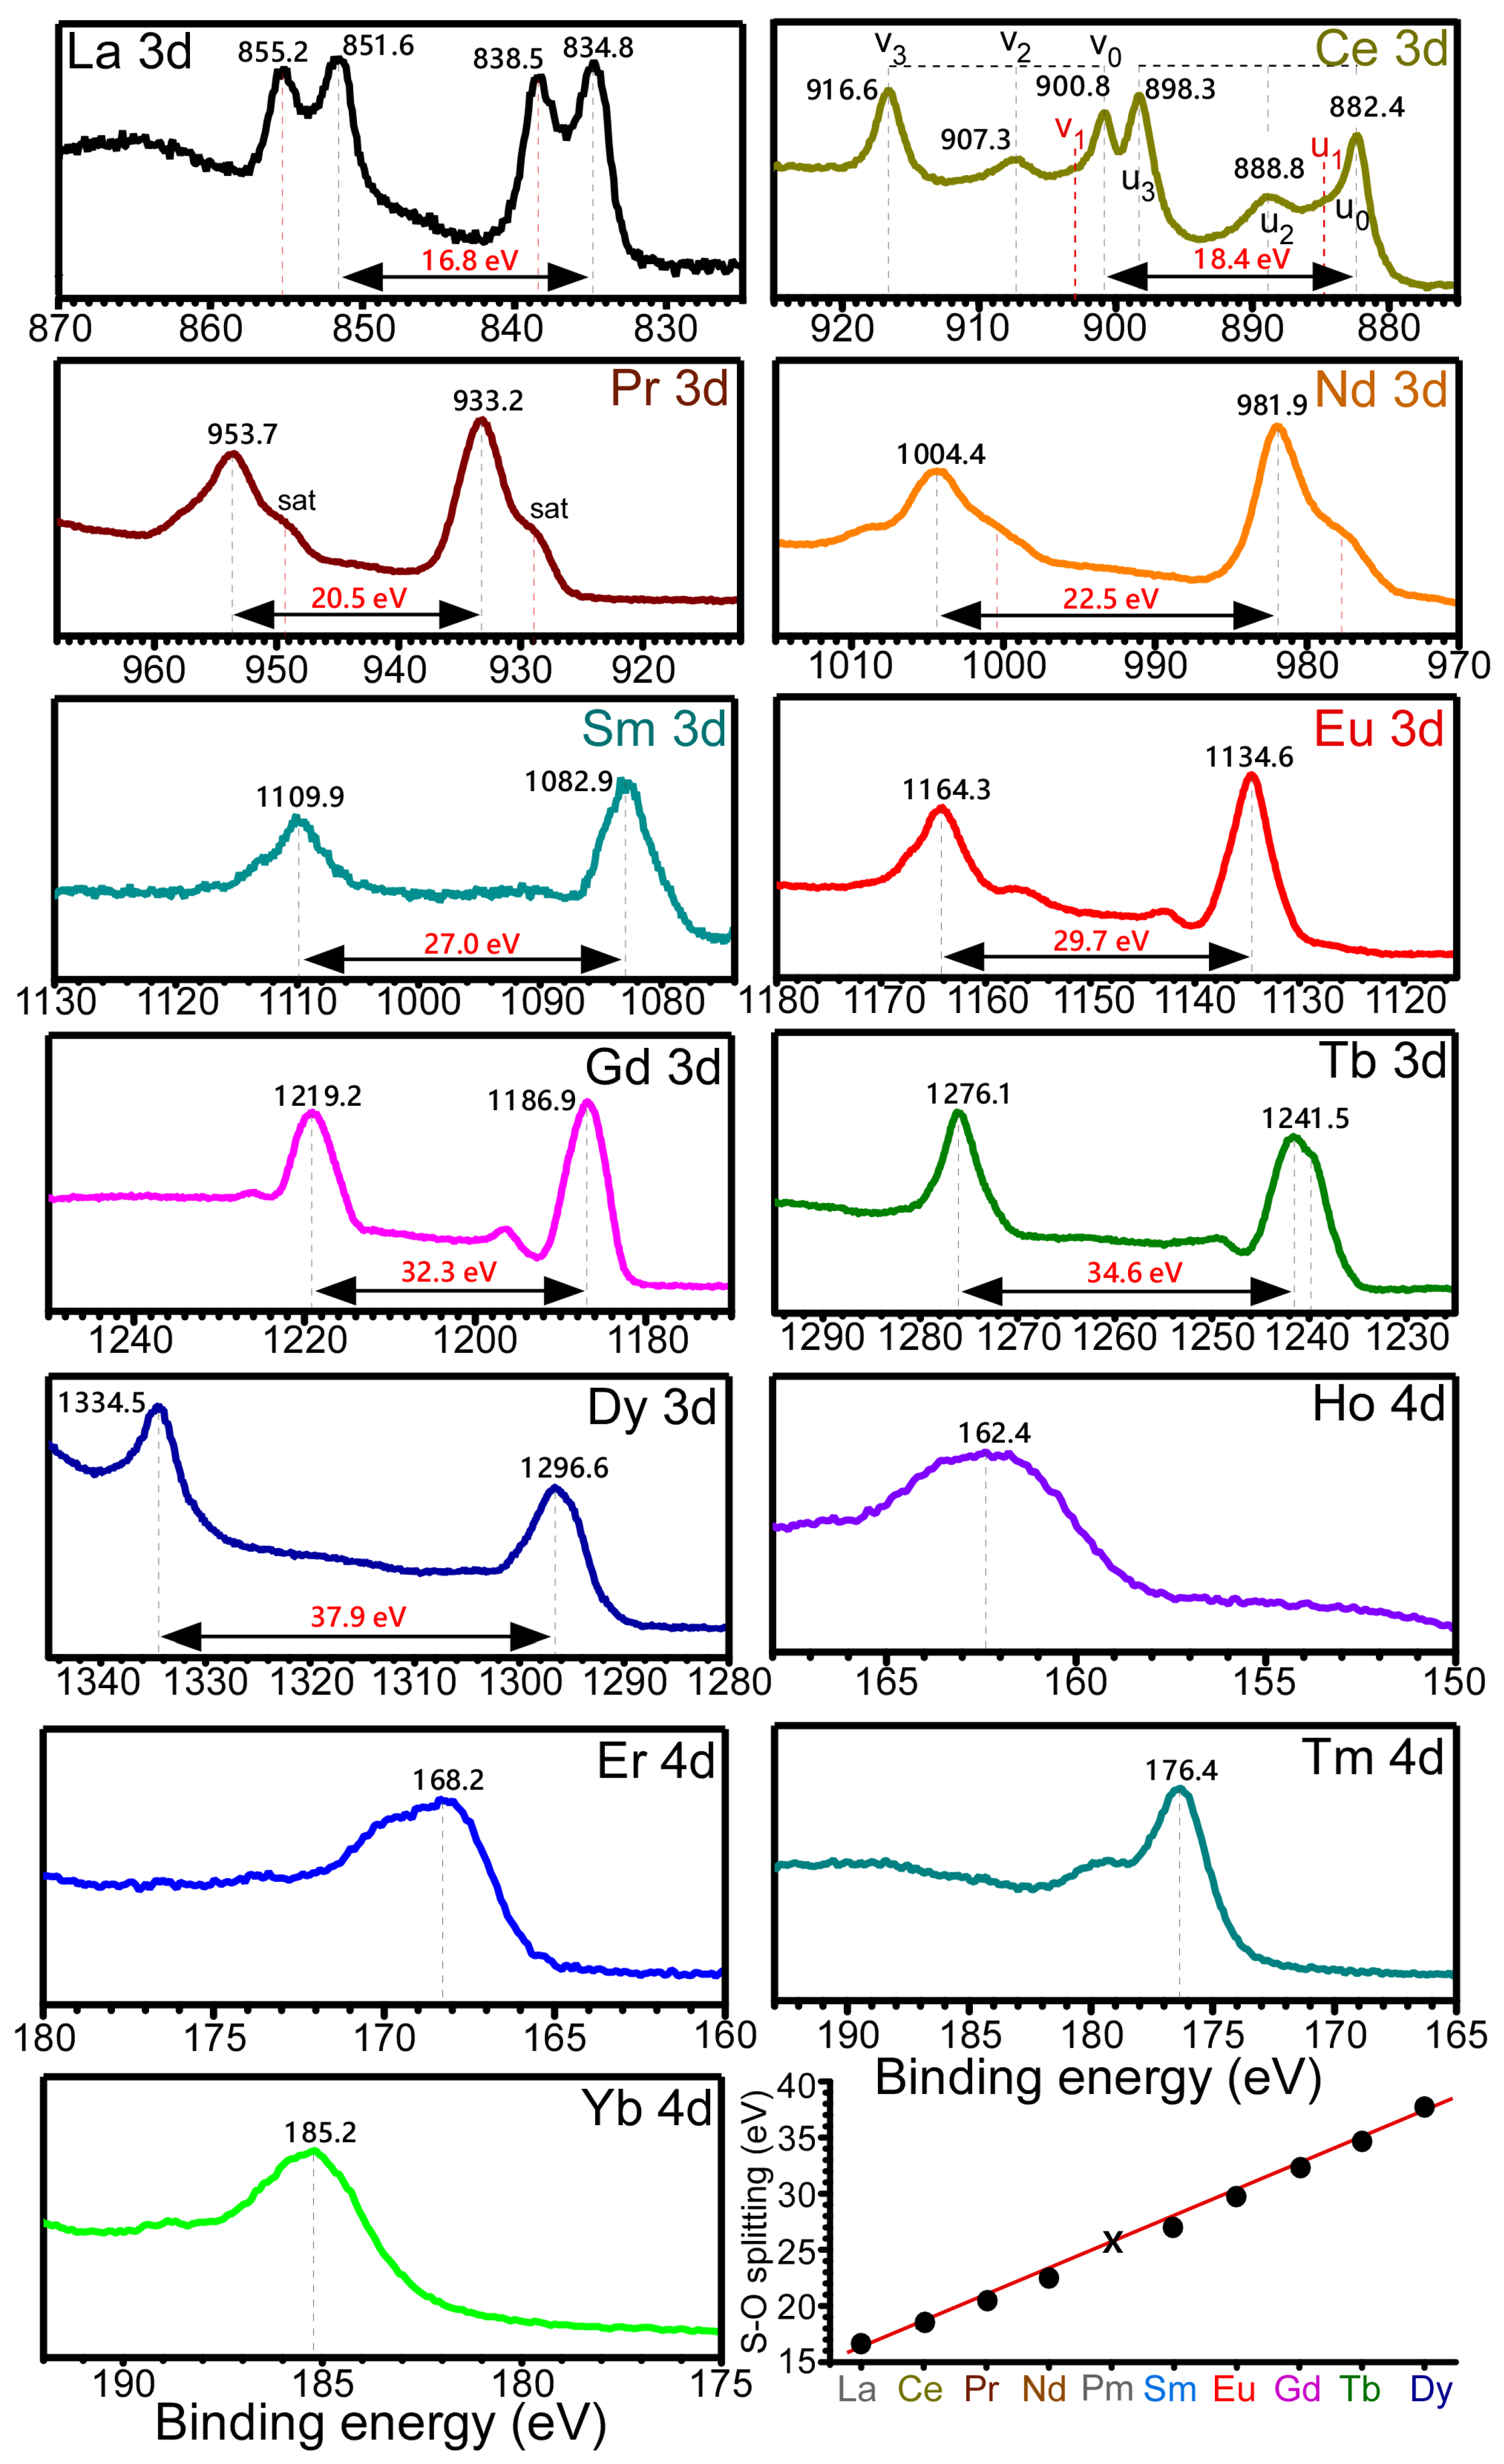
XPS data (Figure 5) were obtained to examine surface chemical states of the electrodeposited Ln elements and confirm the Ln recovery on carbon sheets. For the La 3d XPS profile, four peaks were observed, and the La 3d5/2 and La 3d3/2 peaks were observed at 834.8 eV and 851.6 eV, respectively, with a spin-orbit splitting energy of 16.8 eV. The binding energy position is in good agreement with the La(III) oxidation state. Two additional peaks at 838.5 eV and 855.2 eV were commonly attributed to the final state peak [32]. For Ce 3d XPS profile, the Ce 3d5/2 and Ce 3d3/2 peaks were observed at 882.4 eV and 900.8 eV, respectively, with a spin-orbit splitting energy of 18.4 eV, in good agreement with the Ce(IV) oxidation state. The characteristic of Ce(IV) XPS peaks was also observed at 888.8 eV (u2), 898.3 eV (u3), 907.3 eV (v2), and 916.6 eV (v3) [33]. The XPS peaks (u1 and v1) of the Ce(III) oxidation state were hardly detectable. For the Pr 3d XPS profile, the Pr 3d5/2 and Pr 3d3/2 peaks were observed at 933.2 eV and 953.7 eV, respectively, with a spin-orbit splitting energy of 20.5 eV, due to the Pr(III) oxidation state [34]. The corresponding shoulder peaks around 929.0 eV and 949.2 eV were attributed satellite peaks [34]. For the Nd 3d XPS profile, the Nd 3d5/2 and Nd 3d3/2 peaks were observed at 981.9 eV and 1004.4 eV, respectively, with a spin-orbit splitting energy of 22.5 eV, due to the Nd(III) oxidation state [35]. The asymmetric shoulder peaks were attributed to multiplet splitting of Nd(III), as observed in the Pr 3d XPS profile [34,35]. For the Sm 3d XPS profile, the Sm 3d5/2 and Sm 3d3/2 peaks were observed at 1082.9 eV and 1109.9 eV, respectively, with a spin-orbit splitting energy of 27.0 eV, attributed to the Sm(III) oxidation state [36]. For the Eu 3d XPS profile, the Eu 3d5/2 and Eu 3d3/2 peaks were observed at 1134.6 eV and 1164.3 eV, respectively, with a spin-orbit splitting energy of 29.7 eV, due to the Eu(III) oxidation state [37]. An Eu(II) oxidation state was not significantly observed. For the Gd 3d XPS profile, the Gd 3d5/2 and Gd 3d3/2 peaks were positioned at 1186.9 eV and 1219.2 eV, respectively, with a spin-orbit splitting energy of 32.3 eV, due to the Gd(III) oxidation state [28]. For the Tb 3d XPS profile, the Tb 3d5/2 and Tb 3d3/2 peaks were positioned at 1241.5 eV and 1276.1 eV, respectively, with a spin-orbit splitting energy of 34.6 eV, due to the Tb(III) oxidation state [38]. For the Dy 3d XPS profile, the Dy 3d5/2 and Dy 3d3/2 peaks were positioned at 1296.6 eV and 1334.5 eV, respectively, with a spin-orbit splitting energy of 37.9 eV, due to the Dy(III) oxidation state [39]. Broad Ho 4d, Er 4d, Tm 4d, and Yb 4d XPS peaks were observed at BEs of 162.4 eV, 168.2 eV, 176.4 eV, and 158.2 eV, respectively [40,41,42,43]. The plot for the 3d5/2,3/2 spin-orbit splitting energies showed a linear relationship with atomic number from La (# 57) to Dy (#66).
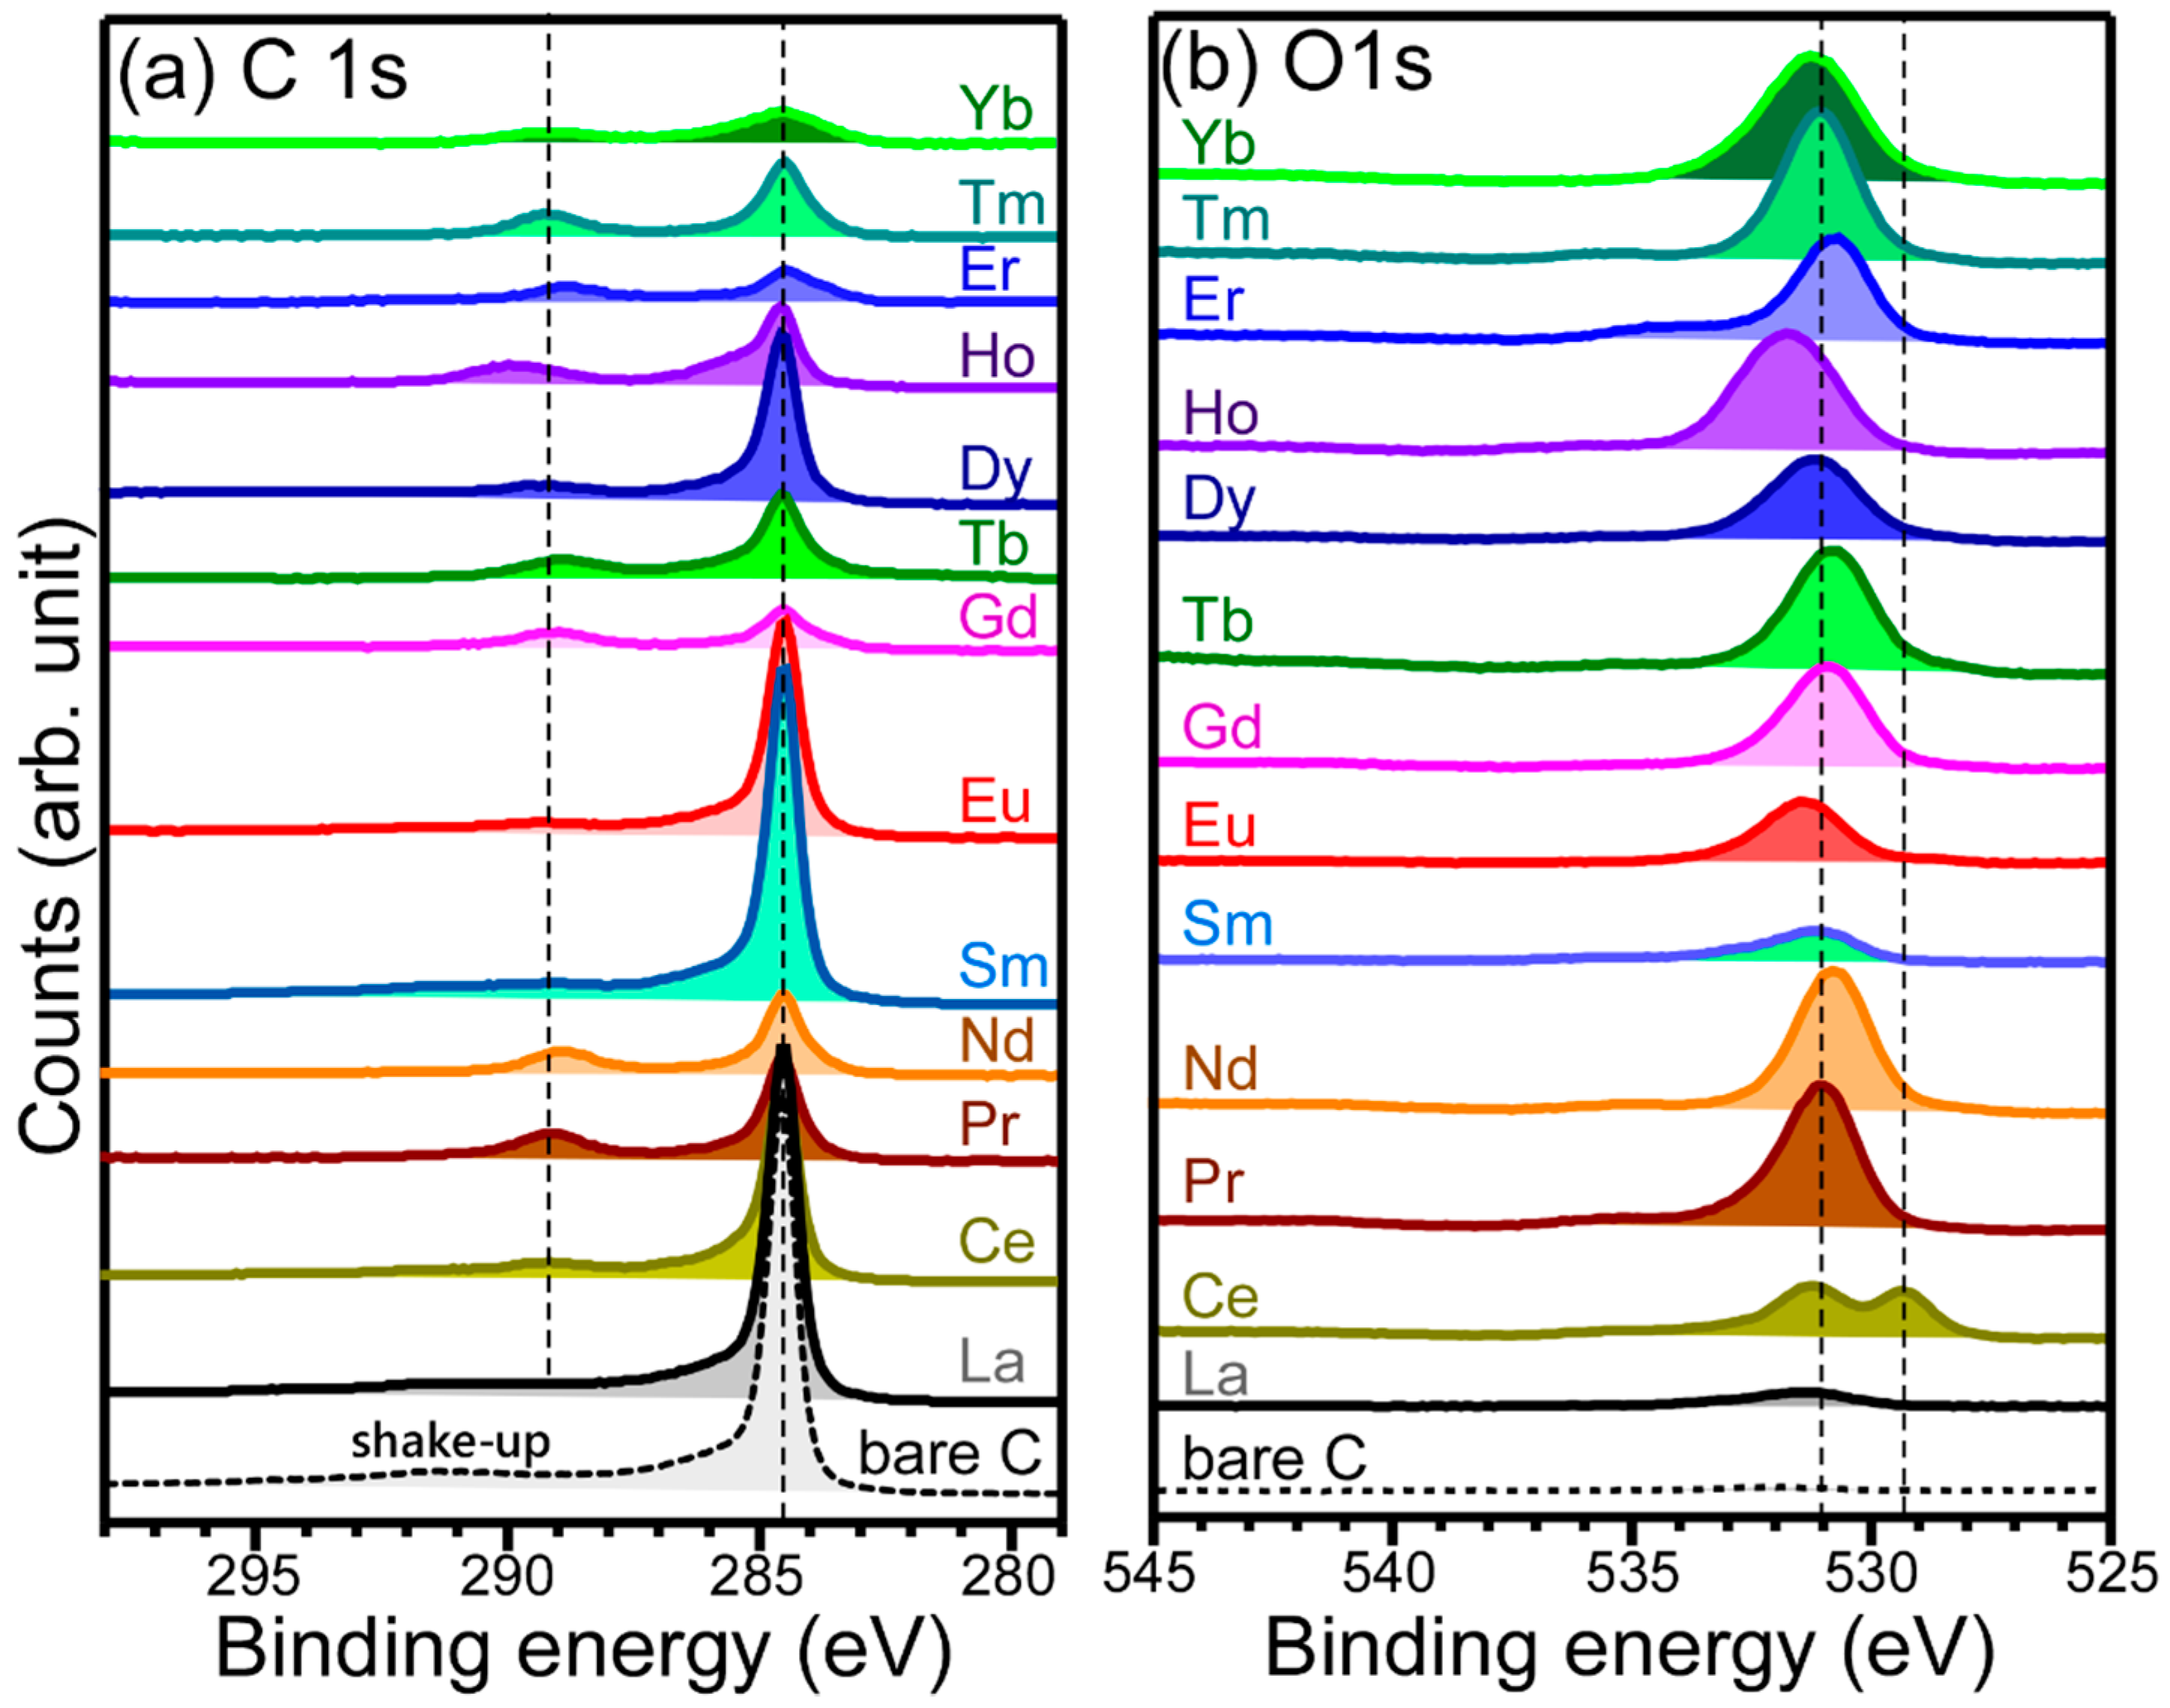
Carbon and oxygen were also analyzed using XPS (Figure 6). For the C 1s XPS profiles, a strong C 1s XPS signal was observed at a BE of 284.5 eV, attributed to carbon support material. For a bare carbon sheet, a broad peak around 291 eV was attributed to the shake-up of carbon [44]. For electrodeposited samples, a newly appeared peak was observed around 289 eV. This could be attributed to O–C=O and C=O species of carbonates [20,38], whose FT-IR signal was observed in Figure 4. For the O 1s XPS spectra, a broad peak was commonly observed around 531 eV. For the O 1s XPS of the bare carbon sheet, the signal was extremely weak compared to others. The major broad peak could be due to O of carbonates, complexed (or surface) OH, and hydrated (or surface) H2O [20,38]. For the O 1s of the Ce-electrodeposited material, an extra peak was observed at 529.4 eV, attributed to lattice oxygen of Ce oxide species [33,38].
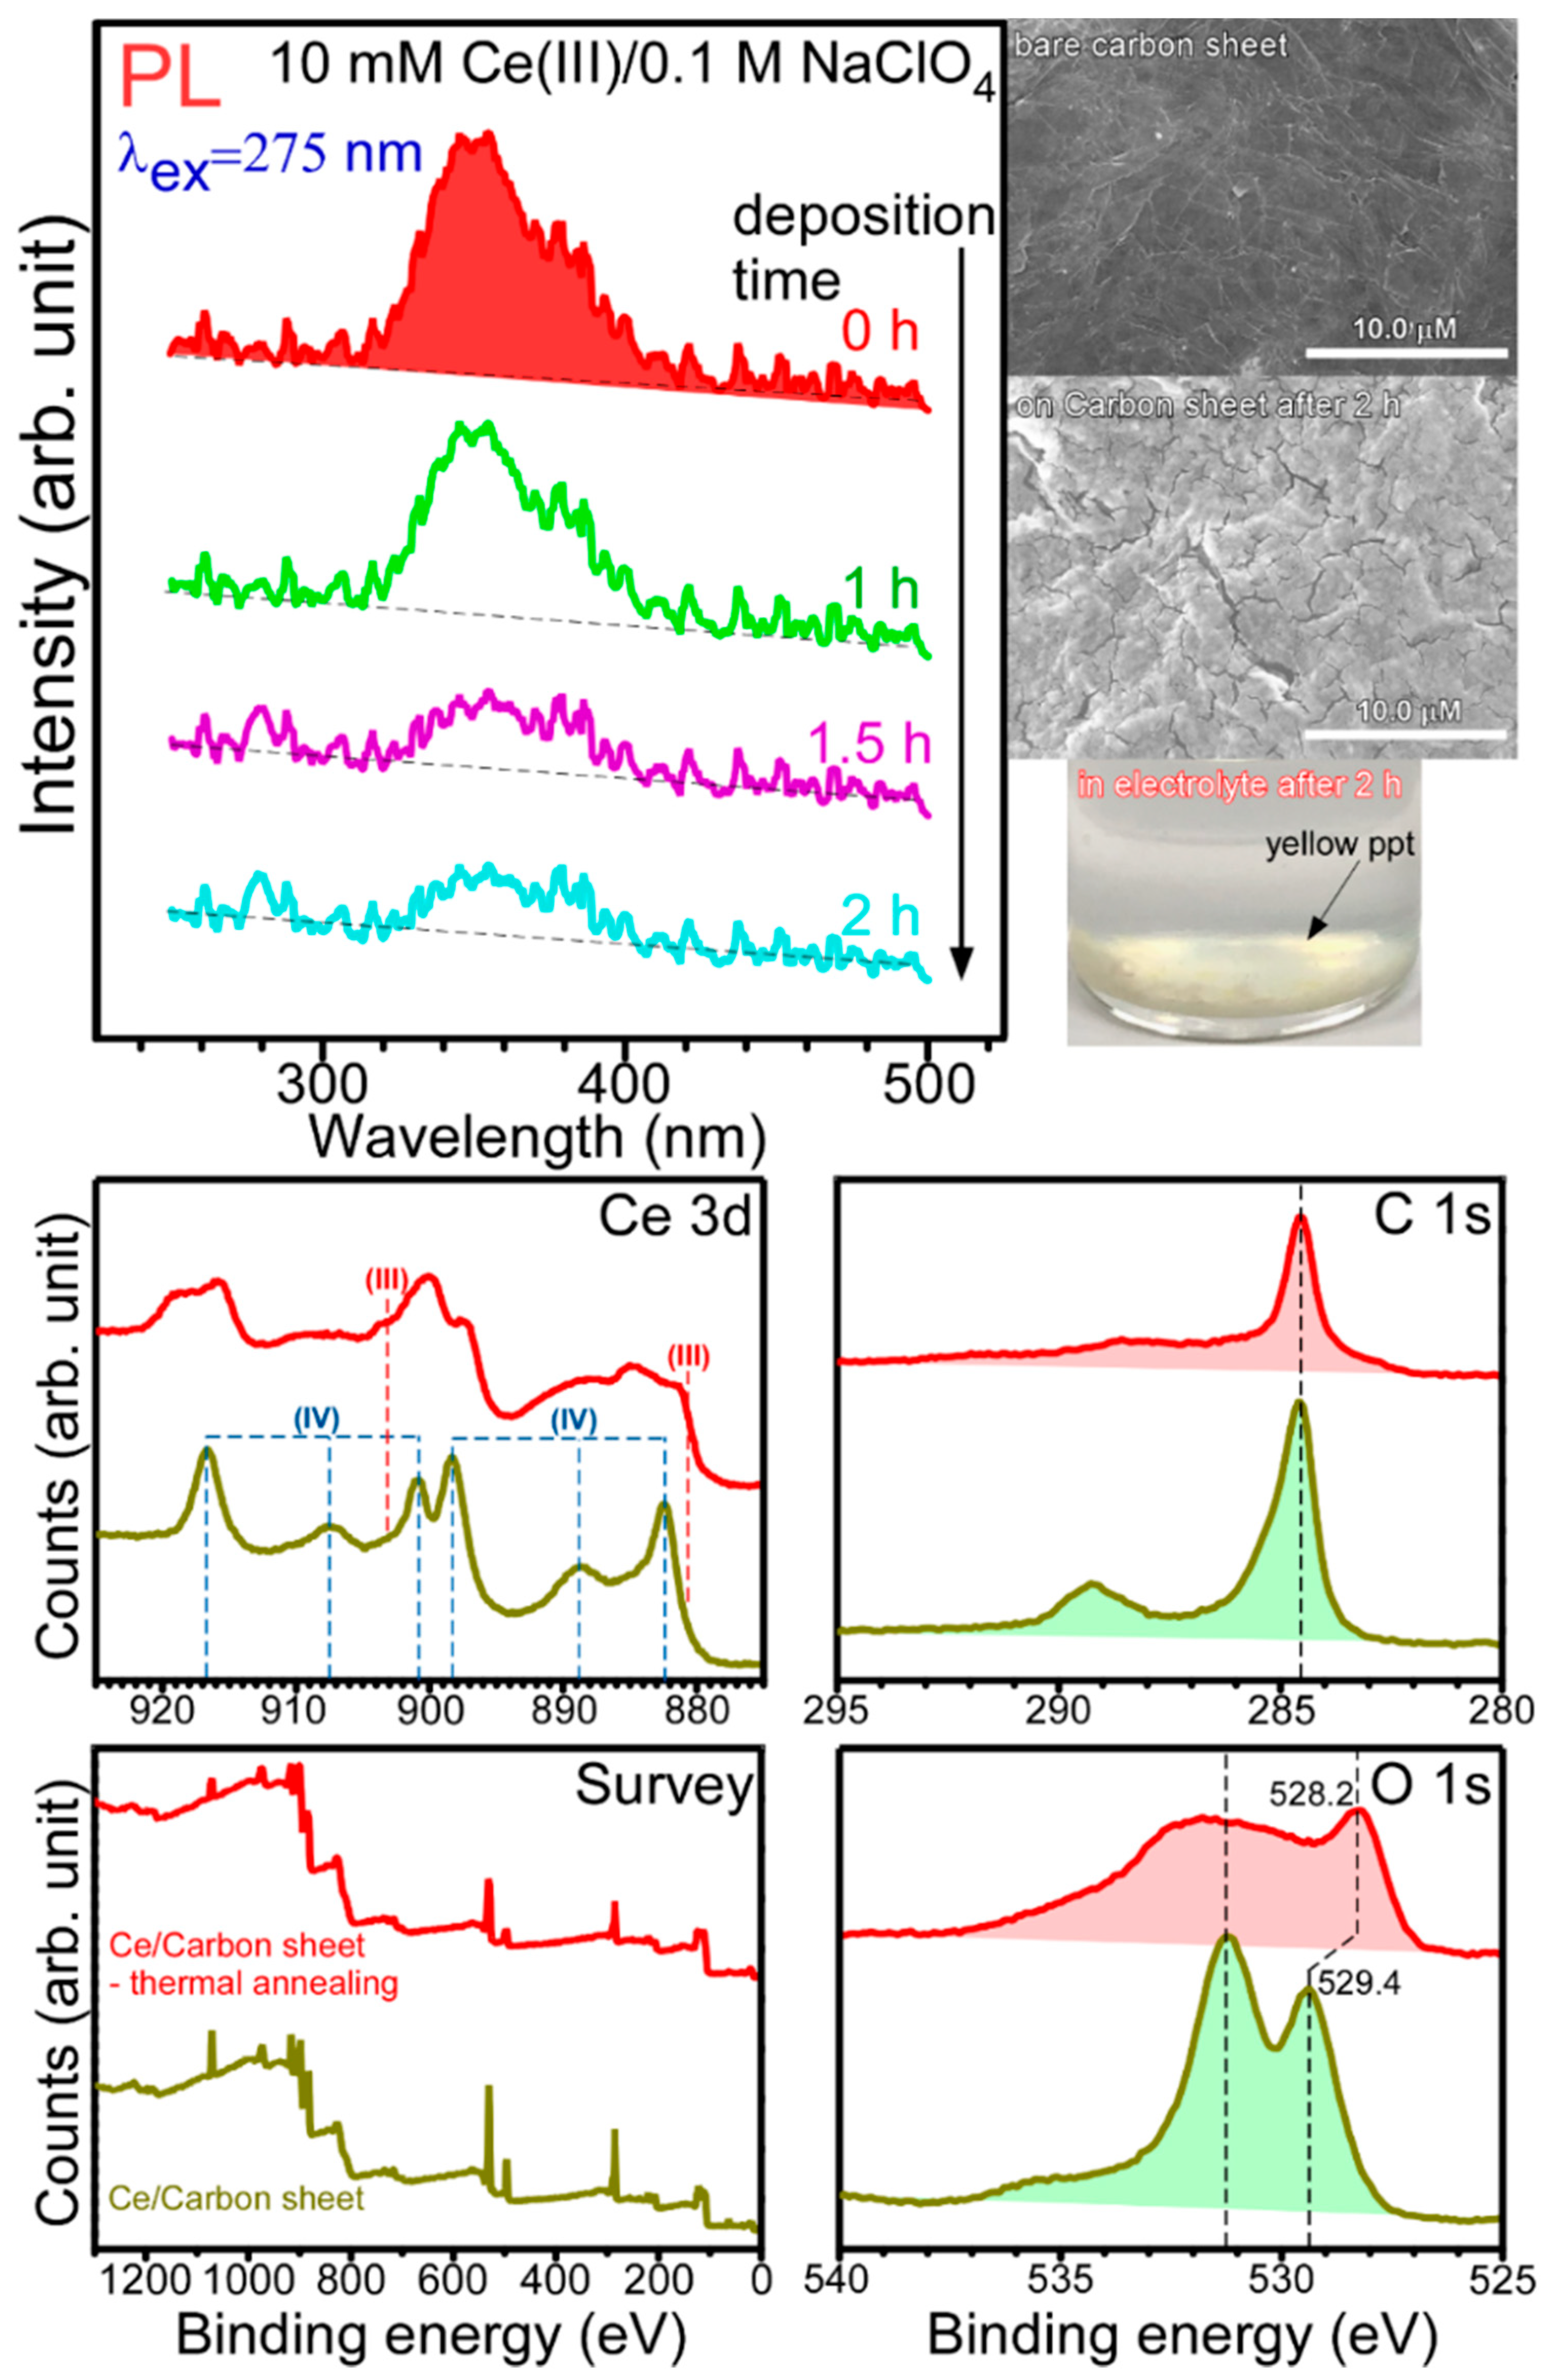
For electrodeposition, the amount of material on the carbon sheet increases, while the metal ion decreases in the electrolyte, as electrodeposition time increases. As a brief demonstration test, the 10 mM Ce(III)/0.1 M NaClO4 electrolyte was selected, because Ce(III) electrolyte shows a broad photoluminescence at an excitation wavelength of 275 nm. As shown in Figure 7, the PL intensity was decreased after electrodeposition. This indicates that Ce ion in the electrolyte was transformed to a complex as thin film (on carbon sheet) or yellow precipitates in the electrolyte (top right panel in Figure 7).
An extra demonstration test was the XPS data obtained for the thermal-annealed Ce-electrodeposited sample. It was clearly observed that the oxidation state was mainly Ce(IV) for as-electrodeposited samples while the oxidation states were both Ce(III) and Ce(IV) [33]. The O 1s peak of lattice oxygen was shifted from 529.4 to 528.2 eV after thermal annealing. These require further investigation to obtain detailed fundamental information.
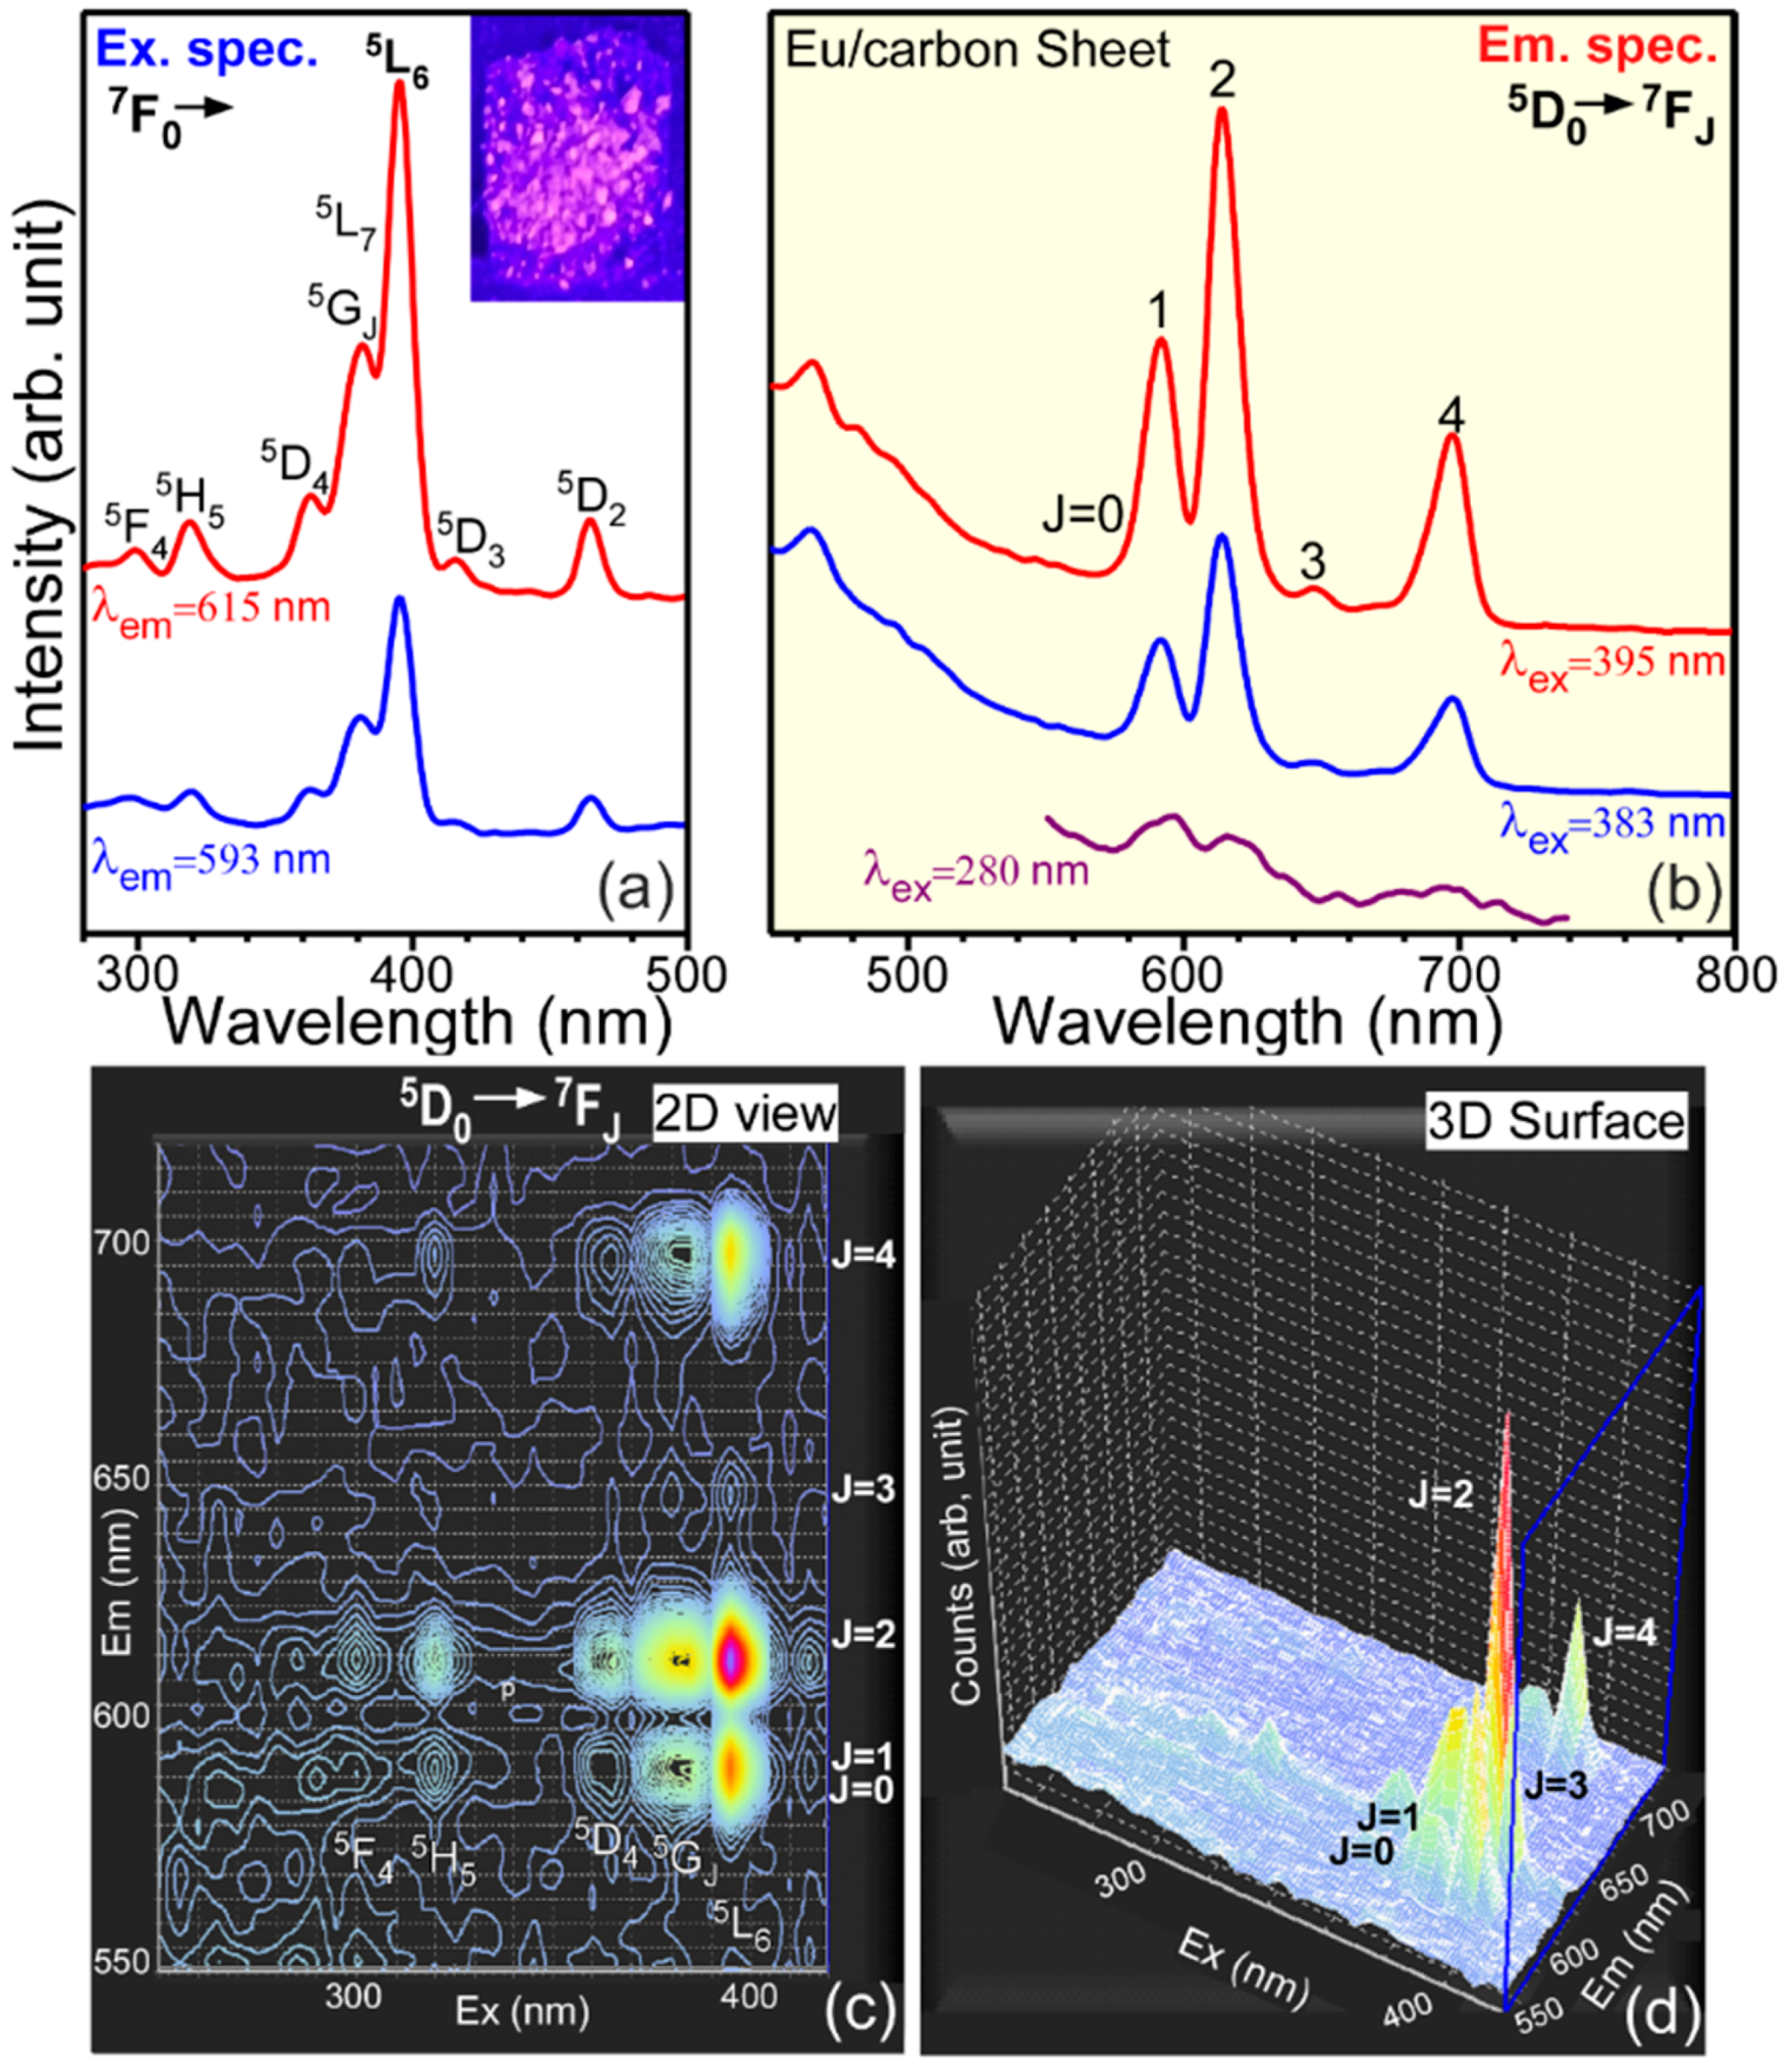
We employed photoluminescence spectroscopy to further confirm the oxidation state of Ln elements initially probed by XPS above in Figure 5. Eu element with two oxidation states of 2+ and 3+ was selected because Eu(III) ion only exhibits unique 5D0 → 7F0,1,2,3,4 transitions between 550 and 750 nm. In addition, when the 5D0 → 7F2 transition is strong, the material with Eu(III) ion exhibits a red color [20,37,45]. On the other hand, Eu(II) ion exhibits a blue color around 400 nm under UV light excitation [20,37]. Figure 8 displays excitation (setting at λem = 613 nm and 590 nm) and emission (setting at λex = 280 nm, 383 nm, and 395 nm) spectra for an Eu-electrodeposited sample. For the excitation spectra (Figure 8a), the profiles were very similar, and several sharp peaks were observed around 300 nm, 320 nm, 365 nm, 383 nm, 395 nm, 415 nm, and 465 nm, attributed to the transitions from the ground 7F0 state of Eu(III) to the upper 5F4, 5H5, 5D4, 5GJ/5L7, 5L6, 5D3, and 5D2 electronic energy levels, respectively [20,37,45]. It was observed that the signal intensities setting at an emission wavelength of 613 nm were stronger than those at 590 nm. On the basis of the excitation spectra, three excitation wavelengths (λex) of 395 nm, 383 nm, and 280 nm were selected to obtain emission spectra. Two wavelengths of 395 nm and 383 nm correspond to direct transitions of Eu(III): 383 nm (the 5GJ/5L7 ← 7F0 direct excitation) and 395 nm (the 5L6 ← 7F0 direct excitation), respectively. As a consequence, the two emission spectra at λex = 383 nm and 395 nm were very similar in Figure 8b, but the intensities were different, as expected from the corresponding excitation spectrum. The other excitation wavelength of 280 nm corresponds to an indirect excitation, not direct transition to an electronic energy level of Eu(III). Consequently, the emission profile at λex = 280 nm was dissimilar to the other two at λex = 383 nm and 395 nm. The emission signal was also weaker than those of the other two. The emission signals were commonly observed around 580 nm, 590 nm, 613 nm, 645 nm, and 700 nm, assigned to the transitions from the excited 5D0 electronic energy level to the lower 7F0, 7F1, 7F2, 7F3, and 7F4 energy states, respectively [37,45]. The emission signal at 613 nm (5D0 → 7F2 transition) was much stronger than others. As a consequence, the Eu-electrodeposited sample was expected to have appeared red, as shown in the inset photo of Figure 8a. The 5D0 → 7F2 transition of Eu(III) has commonly been used to probe Eu(III) local environment because of the electric dipole transition hypersensitive to local environment [20,37]. When the local symmetry of Eu(III) ion is high, the 5D0 → 7F2 transition signal becomes weaker. On the other hand, the signal becomes stronger than other transition signals when Eu(III) ion is positioned at a low symmetric site. On the basis of the emission signals (Figure 8b), it could be concluded that the Eu(III) ion has a low symmetry. It is known that the 5D0 → 7F1 transition is not sensitive to the Eu(III) local environment. The (5D0 → 7F2)/(5D0 → 7F1) intensity ratio is known as an asymmetric ratio reflecting the symmetry of the Eu(III) local site [20,37]. For direct and indirect excitations, the ratios were estimated to be 1.9 and 0.9, respectively. The corresponding 2D and 3D-mapping profiles (Figure 8c,d) show the emission signal distributions at all the excitation wavelengths, where the densely spaced regions exhibit strong emission signals. As discussed above, the densely spaced regions correspond to 5D0 → 7F0,1,2,3,4 emission transitions and the upper energy levels (5F4, 5H5, 5D4, 5GJ/5L7, 5L6, 5D3, and 5D2) ← 7F0 excitation transitions.
4. Conclusions
All of the Ln elements were electrodeposited on carbon sheets using the amperometry method in a 10 mM Ln(III)/0.1 M NaClO4 electrolyte. For the CV profiles, a anodic peak generally appeared between −1.3 and −1.5 V (vs. Ag/AgCl), which was attributed to a reduction potential forming a complex. No corresponding cathodic peak was observed, an indication of an irreversible process. All of the electrodeposited materials on carbon sheets showed uniform film or clusters aggregated with nanoparticles, depending on the Ln elements. FT-IR spectra showed major functional species of OH/H2O, CO32−, and ClO4− groups that may form complexes with a central Ln metal ion, presumably Ln(CO3)x(ClO4)y(OH)z·nH2O complex. EDXS data confirmed Ln, C, O, and Cl elements expected from the FT-IR data. The oxidation states of Ln were fully examined using the XPS data set of all the Ln-electrodeposited materials. Excitation/emission spectra and their 2D/3D contour mapping profiles were obtained for Eu-electrodeposited samples to further confirm the oxidation state. The several emission signals between 570 and 720 nm were assigned to the 5D0 → 7F0,1,2,3,4 transitions of the Eu(III) ion. The high (5D0 → 7F2)/(5D0 → 7F1) intensity ratio reflects that the Eu(III) ion was positioned at a low local symmetry. For future application study, the electrodeposition method can also be applied to fabricate Ln and carbon-based electrode materials for fuel cells, supercapacitors, hydrogen production, and CO2 reduction, with many advantages over other methods, including facial thin film fabrication and uniform coatings. Overall, the present study provides fundamental and technical information on the development of thin-film coating and recovery of Ln-based materials by electrodeposition.
Supplementary Materials
The following are available online at https://0-www-mdpi-com.brum.beds.ac.uk/2079-6412/11/1/100/s1, Figure S1: Cyclic voltammetry profiles for 10 mM Ln(III) ions in 0.1 M NaClO4 electrolyte on carbon sheets at a scan rate of 200 mV·s−1 and a schematic of a three-electrode system. Newly appeared curvatures are indicated by a red arrow.
Author Contributions
M.H.J., S.J.P., S.-M.H., Y.S., C.K.R. and D.K.; methodology, M.H.J., S.J.P., S.-M.H., Y.S., C.K.R. and D.K.; validation, M.H.J., S.J.P. and S.-M.H.; formal analysis, M.H.J. and S.J.P.; investigation, Y.S.; resources, M.H.J.; data curation, Y.S.; writing—original draft preparation, Y.S., C.K.R. and D.K.; writing—review and editing, S.-M.H. and Y.S.; visualization, Y.S., D.K. and C.K.R.; supervision, Y.S. and C.K.R.; project administration, Y.S. All authors have read and agreed to the published version of the manuscript.
Funding
This research was funded by a National Research Foundation of Korea (NRF) grant funded by the Ministry of Education, Science, and Technology, Korea (2018M2B2A9065523). The APC was funded by the NRF grant.
Institutional Review Board Statement
Not applicable.
Informed Consent Statement
Not applicable.
Data Availability Statement
The data presented in this study are available in article and supplementary material here.
Conflicts of Interest
The authors declare no conflict of interest.
References
- Ricci, P.C. Assessment of crystalline materials for solid state lighting applications: Beyond the rare earth elements. Crystals 2020, 10, 559. [Google Scholar] [CrossRef]
- Thomas, S.; Mallet, J.; Bahuleyan, B.K.; Molinari, M. Growth of homogeneous luminescent silicon–terbium nanowires by one-step electrodeposition in ionic liquids. Nanomaterials 2020, 10, 2390. [Google Scholar] [CrossRef] [PubMed]
- Dai, J.; Yang, Z.; Liu, Q. Rare earth cerium increases the corrosion resistance of NdFeB magnets. Materials 2020, 13, 4360. [Google Scholar] [CrossRef] [PubMed]
- Ahn, N.-K.; Swain, B.; Shim, H.-W.; Kim, D.-W. Recovery of rare earth oxide from waste NiMH batteries by simple wet chemical valorization process. Metals 2019, 9, 1151. [Google Scholar] [CrossRef] [Green Version]
- Caputo, D.; Casiello, M.; Milella, A.; Oberhauser, W.; Maffezzoli, A.; Nacci, A.; Fusco, C.; D’Accolti, L. Deep control of linear oligomerization of glycerol using lanthanum catalyst on mesoporous silica gel. Catalysts 2020, 10, 1170. [Google Scholar] [CrossRef]
- Ushakov, S.V.; Hayun, S.; Gong, W.; Navrotsky, A. Thermal analysis of high entropy rare earth oxides. Materials 2020, 13, 3141. [Google Scholar] [CrossRef] [PubMed]
- Cardoso, C.E.D.; Almeida, J.C.; Lopes, C.B.; Trindade, T.; Vale, C.; Pereira, E. Recovery of rare earth elements by carbon−based nanomaterials—A review. Nanomaterials 2019, 9, 814. [Google Scholar] [CrossRef] [Green Version]
- Wojcik, G. Sorption behaviors of light lanthanides(III) (La(III), Ce(III), Pr(III), Nd(III)) and Cr(III) using natrolite. Materials 2020, 13, 2256. [Google Scholar] [CrossRef] [PubMed]
- Dev, S.; Sachan, A.; Dehghani, F.; Ghosh, T.; Briggs, B.R.; Aggarwal, S. Mechanisms of biological recovery of rare-earth elements from industrial and electronic wastes: A review. Chem. Eng. J. 2020, 397, 124596. [Google Scholar] [CrossRef]
- Binnemans, K.; Jones, P.T.; Blanpain, B.; Gerven, T.V.; Yang, Y.; Walton, A.; Buchert, M. Recycling of rare earths: A critical review. J. Cleaner. Prod. 2013, 51, 1–22. [Google Scholar] [CrossRef]
- Jha, M.K.; Kumari, A.; Panda, R.; Kumar, K.R.; Yoo, K.; Lee, J.Y. Review on hydrometallurgical recovery of rare earth metals. Hydrometallurgy 2016, 165, 2–26. [Google Scholar] [CrossRef]
- Binnemans, K.; Jones, P.T. Perspectives for the recovery of rare earths from end−of−life fluorescent lamps. J. Rare Earths 2014, 32, 195–200. [Google Scholar] [CrossRef] [Green Version]
- Yurramendi, L.; Gijsemans, L.; Forte, F.; Aldana, J.L.; Río, C.d.; Binnemans, K. Enhancing rare-earth recovery from lamp phosphor waste. Hydrometallurgy 2019, 187, 38–44. [Google Scholar] [CrossRef]
- Choi, E.-Y.; Jeong, S.M. Electrochemical processing of spent nuclear fuels: An overview of oxide reduction in pyroprocessing technology. Prog. Nat. Sci. 2015, 25, 572–582. [Google Scholar] [CrossRef] [Green Version]
- Yang, D.-W.; Liu, Y.-L.; Yin, T.-Q.; Jiang, S.-L.; Zhong, Y.-K.; Wang, L.; Li, M.; Chai, Z.-F.; Shi, W.-Q. Application of binary Ga–Al alloy cathode in U separation from Ce: The possibility in pyroprocessing of spent nuclear fuel. Electrochim. Acta 2020, 353, 136449. [Google Scholar] [CrossRef]
- Song, Z.; Zhang, H.; Fu, X.; Lin, J.; Shen, M.; Wang, Q.; Duan, S. Effect of current density on the performance of Ni–P–ZrO2–CeO2 composite coatings prepared by jet−electrodeposition. Coatings 2020, 10, 616. [Google Scholar] [CrossRef]
- Bourbos, E.; Karantonis, A.; Sygellou, L.; Paspaliaris, I.; Panias, D. Study of Nd electrodeposition from the aprotic organic solvent dimethyl sulfoxide. Metals 2018, 8, 803. [Google Scholar] [CrossRef] [Green Version]
- Li, N.; Chen, W.; Lu, L.; Gao, C. Electrodeposition behavior of polycrystalline Ni–Mo–La composite in alkaline solution. Coatings 2018, 8, 299. [Google Scholar] [CrossRef] [Green Version]
- Park, S.J.; Joo, M.H.; Hong, S.-M.; Kang, J.-G.; Rhee, C.K.; Lee, S.W.; Sohn, Y. Electrochemical Eu(III) behaviors and Eu oxysulfate recovery over terpyridine−functionalized indium tin oxide electrode. Inorg. Chem. Front. 2020. [Google Scholar] [CrossRef]
- Joo, M.H.; Park, S.J.; Hong, S.M.; Rhee, C.K.; Sohn, Y. Electrochemical recovery and behaviors of rare earth (La, Ce, Pr, Nd, Sm, Eu, Gd, Tb, Dy, Ho, Er, Tm, and Yb) ions on Ni sheets. Materials 2020, 13, 5314. [Google Scholar] [CrossRef]
- Therese, G.H.A.; Kamath, P.V. Electrochemical synthesis of metal oxides and hydroxides. Chem. Mater. 2000, 12, 1195–1204. [Google Scholar] [CrossRef]
- Bocchetta, P.; Santamaria, M.; Di Quarto, F. From ceria nanotubes to nanowires through electrogeneration of base. J. Appl. Electrochem. 2009, 39, 2073–2081. [Google Scholar] [CrossRef] [Green Version]
- Santamaria, M.; Asaro, L.; Bocchetta, P.; Megna, B.; Di Quarto, F. Electrodeposition of CeO2 and Co−doped CeO2 nanotubes by cyclic anodization in porous alumina membranes. ECS Electrochem. Lett. 2013, 2, D29. [Google Scholar] [CrossRef]
- Gu, J.I.; Lee, J.; Rhee, C.K.; Sohn, Y. Enhanced electrochemical hydrogen evolution over defect−induced hybrid MoO3/Mo3O9·H2O microrods. Appl. Surf. Sci. 2019, 469, 348–356. [Google Scholar] [CrossRef]
- Bai, L.; Ge, Y.; Bai, L. Boron and nitrogen Co-doped porous carbons synthesized from polybenzoxazines for high-performance supercapacitors. Coatings 2019, 9, 657. [Google Scholar] [CrossRef] [Green Version]
- NIST DTSA-II Software. Available online: https://cstl.nist.gov/div837/837.02/epq/dtsa2/ (accessed on 10 December 2020).
- Wu, X.; Li, J.-G.; Zhu, Q.; Liu, W.; Li, J.; Li, X.; Sun, X.; Sakka, Y. One-step freezing temperature crystallization of layered rare-earth hydroxide (Ln2(OH)5NO3∙nH2O) nanosheets for a wide spectrum of Ln (Ln = Pr–Er, and Y), anion exchange with fluorine and sulfate, and microscopic coordination probed via photoluminescence. J. Mater. Chem. C 2015, 3, 3428–3437. [Google Scholar] [CrossRef]
- Kang, J.-G.; Min, B.-K.; Sohn, Y. Synthesis and characterization of Gd(OH)3 and Gd2O3 nanorods. Ceram. Int. 2015, 41, 1243–1248. [Google Scholar] [CrossRef]
- Rutten, O.W.J.S.; Van Sandwijk, A.; Van Weert, G. The electrochemical reduction of nitrate in acidic nitrate solutions. J. Appl. Electrochem. 1999, 29, 87–92. [Google Scholar] [CrossRef]
- Pous, N.; Koch, C.; Colprim, J.; Puig, S.; Harnisch, F. Extracellular electron transfer of biocathodes: Revealing the potentials for nitrate and nitrite reduction of denitrifying microbiomes dominated by Thiobacillus sp. Electrochem. Commun. 2004, 49, 93–97. [Google Scholar] [CrossRef] [Green Version]
- Chen, Y.; Zhang, Y.-H.; Zhao, L.-Z. ATR-FTIR spectroscopic studies on aqueous LiClO4, NaClO4, and Mg(ClO4)2 solutions. Phys. Chem. Chem. Phys. 2004, 6, 537–542. [Google Scholar] [CrossRef]
- Kang, J.-G.; Kim, Y.-I.; Cho, D.W.; Sohn, Y. Synthesis and physicochemical properties of La(OH)3 and La2O3 nanostructures. Mater. Sci. Semicond. Process. 2015, 40, 737–743. [Google Scholar] [CrossRef]
- Khan, M.M.; Ansari, S.A.; Pradhan, D.; Han, D.H.; Lee, J.; Cho, M.H. Defect-induced band gap narrowed CeO2 nanostructures for visible light activities. Ind. Eng. Chem. Res. 2014, 53, 9754–9763. [Google Scholar] [CrossRef]
- Kang, J.-G.; Min, B.-K.; Sohn, Y. Physicochemical properties of praseodymium hydroxide and oxide nanorods. J. Alloys Compd. 2015, 619, 165–171. [Google Scholar] [CrossRef]
- Jeon, S.H.; Nam, K.; Yoon, H.J.; Kim, Y.-I.; Cho, D.W.; Sohn, Y. Hydrothermal synthesis of Nd2O3 nanorods. Ceram. Int. 2017, 43, 1193–1199. [Google Scholar] [CrossRef]
- Kang, J.-G.; Min, B.-K.; Sohn, Y. Synthesis and characterization of Sm(OH)3 and Sm2O3 nanoroll sticks. J. Mater. Sci. 2015, 50, 1958–1964. [Google Scholar] [CrossRef]
- Kang, J.-G.; Jung, Y.; Min, B.-K.; Sohn, Y. Full characterization of Eu(OH)3 and Eu2O3 nanorods. Appl. Surf. Sci. 2014, 314, 158–165. [Google Scholar] [CrossRef]
- Sohn, Y. Structural and spectroscopic characteristics of terbium hydroxide/oxide nanorods and plates. Ceram. Int. 2014, 40, 13803–13811. [Google Scholar] [CrossRef]
- Kang, J.-G.; Gwag, J.S.; Sohn, Y. Synthesis and characterization of Dy(OH)3 and Dy2O3 nanorods and nanosheets. Ceram. Int. 2015, 41, 3999–4006. [Google Scholar] [CrossRef]
- Lee, H.I.; Lee, S.W.; Rhee, C.K.; Sohn, Y. Paramagnetic Ho2O3 nanowires, nano−square sheets, and nanoplates. Ceram. Int. 2018, 44, 17919–17924. [Google Scholar] [CrossRef]
- Yoon, H.J.; Lee, J.; Kim, Y.-I.; Cho, D.W.; Sohn, Y. Synthesis and characterization of Er2O3 nanorods and nanosheets. Ceram. Int. 2017, 43, 2069–2075. [Google Scholar] [CrossRef]
- Lee, S.W.; Park, S.K.; Min, B.-K.; Kang, J.-G.; Sohn, Y. Structural/spectroscopic analyses and H2/O2/CO responses of thulium(III) oxide nanosquare sheets. Appl. Surf. Sci. 2014, 307, 736–743. [Google Scholar] [CrossRef]
- Sohn, Y. Yb2O3 nanowires, nanorods and nano-square plates. Ceram. Int. 2018, 44, 3341–3347. [Google Scholar] [CrossRef]
- NIST X-ray Photoelectron Spectroscopy Database, Version 4.1 (National Institute of Standards and Technology, Gaithersburg, 2012). Available online: http://srdata.nist.gov/xps/ (accessed on 1 December 2020).
- Pawlik, N.; Szpikowska-Sroka, B.; Pisarski, W.A. Energy transfer study on Tb3+/Eu3+ co-activated sol-gel glass-ceramic materials containing MF3 (M = Y, La) nanocrystals for NUV optoelectronic devices. Materials 2020, 13, 2522. [Google Scholar] [CrossRef] [PubMed]
Figure 1.
Cyclic voltammetry profiles for (a) 10 mM La(III) and (b) Eu(III) ions in 0.1 M NaClO4 electrolyte on carbon sheets at a scan rate of 200 mV·s−1, (c) reduction peak positions with Ln elements, and (d) a schematic of a three-electrode system. Newly appeared curvature is indicated by a red arrow.

Figure 2.
Scanning electron microscope images (A–N) for a bare carbon sheet (A) and electrodeposited Ln elements on carbon sheet electrodes (B–N), optical microscope (300×) images (A1,L1), and the corresponding photos (bottom panel) of electrolytes (with precipitates) after electrodeposition.
Figure 2.
Scanning electron microscope images (A–N) for a bare carbon sheet (A) and electrodeposited Ln elements on carbon sheet electrodes (B–N), optical microscope (300×) images (A1,L1), and the corresponding photos (bottom panel) of electrolytes (with precipitates) after electrodeposition.

Figure 3.
EDXS profiles for electrodeposited Ln elements on carbon sheets.

Figure 4.
Transmittance FT-IR profiles for electrodeposited Ln elements on carbon sheets.

Figure 5.
La 3d, Ce 3d, Pr 3d, Nd 3d, Sm 3d, Eu 3d, Gd 3d, Tb 3d, Dy 3d, Ho 4d, Er 4d, Tm 4d, and Yb 4d XPS profiles, and the 3d5/2,3/2 spin-orbit splitting energies.
Figure 5.
La 3d, Ce 3d, Pr 3d, Nd 3d, Sm 3d, Eu 3d, Gd 3d, Tb 3d, Dy 3d, Ho 4d, Er 4d, Tm 4d, and Yb 4d XPS profiles, and the 3d5/2,3/2 spin-orbit splitting energies.

Figure 6.
C 1s (a) and O 1s (b) XPS profiles for a bare carbon sheet and electrodeposited Ln elements on carbon sheets.
Figure 6.
C 1s (a) and O 1s (b) XPS profiles for a bare carbon sheet and electrodeposited Ln elements on carbon sheets.

Figure 7.
Photoluminescence spectra (top left) of 10 mM Ce(III)/0.1 M NaClO4 electrolyte with electrodeposition time; SEM images (top right) of the carbon sheet before and after electrodeposition, and a photo of the electrolyte after electrodeposition; and Ce 3d, C 1s, survey, and O 1s XPS profiles before and after thermal annealing at 550 °C.

Figure 8.
Excitation (a) and emission (b) spectral profiles for electrodeposited Eu on a carbon sheet, and the corresponding 2D and 3D-photoluminescence contour profiles (c,d).
Figure 8.
Excitation (a) and emission (b) spectral profiles for electrodeposited Eu on a carbon sheet, and the corresponding 2D and 3D-photoluminescence contour profiles (c,d).

Publisher’s Note: MDPI stays neutral with regard to jurisdictional claims in published maps and institutional affiliations. |
© 2021 by the authors. Licensee MDPI, Basel, Switzerland. This article is an open access article distributed under the terms and conditions of the Creative Commons Attribution (CC BY) license (http://creativecommons.org/licenses/by/4.0/).
Share and Cite
MDPI and ACS Style
Joo, M.H.; Park, S.J.; Hong, S.-M.; Rhee, C.K.; Kim, D.; Sohn, Y. Electrodeposition and Characterization of Lanthanide Elements on Carbon Sheets. Coatings 2021, 11, 100. https://0-doi-org.brum.beds.ac.uk/10.3390/coatings11010100
AMA Style
Joo MH, Park SJ, Hong S-M, Rhee CK, Kim D, Sohn Y. Electrodeposition and Characterization of Lanthanide Elements on Carbon Sheets. Coatings. 2021; 11(1):100. https://0-doi-org.brum.beds.ac.uk/10.3390/coatings11010100
Chicago/Turabian StyleJoo, Min Hee, So Jeong Park, Sung-Min Hong, Choong Kyun Rhee, Dongsoo Kim, and Youngku Sohn. 2021. "Electrodeposition and Characterization of Lanthanide Elements on Carbon Sheets" Coatings 11, no. 1: 100. https://0-doi-org.brum.beds.ac.uk/10.3390/coatings11010100
Note that from the first issue of 2016, this journal uses article numbers instead of page numbers. See further details here.