Article

Surface and Interface Treatments on Wooden Artefacts: Potentialities and Limits of a Non-Invasive Multi-Technique Study

1
Arvedi Laboratory of Non-Invasive Diagnostics, CISRiC, University of Pavia, Via Bell’Aspa 3, 26100 Cremona, Italy
2
Department of Mathematical, Physical and Computer Sciences, University of Parma, Parco Area delle Scienze 7/A, 43124 Parma, Italy
3
Department of Chemistry, University of Torino, Via Pietro Giuria 5, 10125 Torino, Italy
4
Faculty of Fine Arts, Nicolaus Copernicus University in Toruń, Sienkiewicza 30/32, 87-100 Toruń, Poland
5
Institute of Physics, Faculty of Physics, Astronomy and Informatics, Nicolaus Copernicus University in Toruń, Grudziądzka 5, 87-100 Toruń, Poland
6
Conservation and Restoration Center “La Venaria Reale”, Via XX Settembre 18, 10078 Venaria Reale, Italy
7
Associazione Laboratorio di Diagnostica per i Beni Culturali, Piazza Campello 2, 06049 Spoleto, Italy
8
Department of Chemistry, University of Pavia, Via Taramelli 12, 27100 Pavia, Italy
9
Department of Musicology and Cultural Heritage, University of Pavia, Corso Garibaldi 178, 26100 Cremona, Italy
*
Author to whom correspondence should be addressed.
Submission received: 28 November 2020 / Revised: 24 December 2020 / Accepted: 24 December 2020 / Published: 29 December 2020
(This article belongs to the Special Issue Surface and Interface Analysis of Cultural Heritage)

Abstract

:
Wooden artefacts embrace wide-ranging types of objects, like paintings on panel, sculptures, musical instruments, and furniture. Generally, in the manufacturing process of an artwork, wood is firstly treated with organic and inorganic materials to make it nonporous and morphologically homogeneous, and, at last, the surface treatment consists of varnishes or coatings applied with the aims of conferring aesthetic properties and protecting wood from biological growth and external degradation agents, as well as mechanical damage. In this work, different wooden mock-ups were prepared by varying some parameters: concentration of filler and pigment, respectively, in the ground and paint layers, thickness of the protective varnish coat, and sequence of the layers. The mock-ups were subsequently exposed to time-varying artificial aging processes. The multi-analytical non-invasive approach involved spectroscopic (reflection FT-IR, Raman, and X-ray fluorescence), tomographic (optical coherence tomography) and colorimetric techniques. Data were interpreted using both univariate and multivariate methods. The aim was to evaluate potential and limits of each non-invasive technique into the study of different stratigraphies of wooden artworks. This approach was supported by microscopic observations of cross-sections obtained from selected mock-ups. The methodological approach proposed here would add valuable technical know-how and information about the non-invasive techniques applied to the study of wooden artworks.

1. Introduction

Wood is a multifaceted material that has been employed to realize several classes of artworks since prehistory, such as paintings on panel, sculptures, musical instruments, or furniture, and, today, these artefacts can be considered one of the most important classes of our common heritage [1]. The woodworking and the construction of wooden objects belong to those ancient arts and crafts which have endured for centuries, mainly because of the widespread availability of wood but also for its natural aesthetic qualities, as color, grain and texture [2]. Historically, wood has undergone a large variety of treatments according to its manufacturing and its purpose (e.g., aesthetical, functional, or acoustic). Different studies have been carried out by international research groups, with the aim of better clarifying treatments of wood, procedures to increase its performance, as well as materials used in the diverse coats (paints, varnishes, grounds, etc.) [3,4,5,6,7]. These scientific results have been generally compared to the historic literature, where recipes and construction processes are described [8,9].
Considering the large differences existing within the wooden artefact classes and the thousands of ancient recipes, it was possible to define some recurring actions in the manufacturing practice extending from the wood treatments up to the surface coatings. A preliminary step involves the physical or chemical pre-treatment of the wood: physical treatments mainly consisted in the exposure of the wood to solar radiation or to high temperature for long time [8,10], while the chemical ones were generally performed using alkaline ammonia- and lye-based solutions, as well documented in the history of art and studied by scientific community [11,12,13,14,15,16,17,18,19]. These preliminary procedures were probably intended to age the wood and make it more permeable to subsequent treatments; in fact, especially alkaline solutions can modify the structure of the wood fibers, hydrolyzing the hemicellulose and the crystalline cellulose, as well as promoting the bleaching and the detergency of the wood. Subsequently, wood is isolated to prevent that materials applied afterwards can penetrate inside it. This size treatment was mostly realized using animal or casein glues [8,9,20,21] or oils [22,23,24], deeply penetrating in the wood and filling up its pores. The impregnation should also have a considerable preservative value, mainly protecting the wood from biological degradation and giving the artefact a higher durability [23,25]. In the following phase, an inorganic ground layer (generally made of sulphates or silicates) was applied on the wood mixed with an organic medium, such as hide glue or siccative oils [26,27,28,29,30]. In this regard, the application of the ground can significantly vary depending on the wooden objects: polychrome works are generally characterized by high-thickness and opaque ground above which the pictorial film would then be laid [6,31,32], whereas in furniture and musical instruments this layer is usually much thinner and transparent [4,33,34,35]. Finally, the application of surface coatings concerns a colored film (paint) in the case of polychrome artefacts [5,8,32,36] and a transparent and translucent coat (varnish) in the furniture and musical instrument fields [34,37,38,39]. This treatment also includes the external organic coats, aimed at protecting the artwork from the environmental degradation agents. Commonly, the protective coatings were composed of natural products, like proteins, lipids, polysaccharides, or terpenoids [40]. It is worth reporting that, in violins and other instruments in the family of the modern string quartet, the finishing treatments have a significant impact on the tone qualities [41].
Aim of the present work was to assess potential and limits of the considered portable non-invasive instrumentation in the stratigraphic study of wooden artefacts and define an analytical methodology when approaching these complex systems.
Different wooden stratigraphies were analyzed using a multi-analytical non-invasive approach including spectroscopic (reflection FT-IR, Raman, and X-ray fluorescence), tomographic (optical coherence tomography) and colorimetric techniques. The mock-ups under investigation were prepared by varying different parameters, such as concentration of filler and pigment, respectively, in the ground and paint layers, thickness of the protective varnish coat, and sequence of the layers. Moreover, the mock-ups were exposed to time-varying artificial aging processes: material degradation, in fact, may be particularly relevant for wooden artefacts, and changes in their structure can allow for planning proper maintenance activities. The acquired data were interpreted using both univariate and multivariate methods. This approach was supported by microscopic observations of cross-sections obtained from selected mock-ups.
Today, scientific investigation of historical wooden artefacts can help conservators and curators better understand technical skills of the past, providing information on the wood treatments, as well as on the conservation state and on the historical period during which the artworks were realized [42,43]. Increasing the knowledge on the ancient practices is becoming progressively necessary for the preservation of our cultural heritage, in order to develop innovative analytical methods, possibly non-invasive, which are able to identify the different materials and to characterize the artwork stratigraphy from wood pre-treatments to surface treatments.

2. Materials and Methods

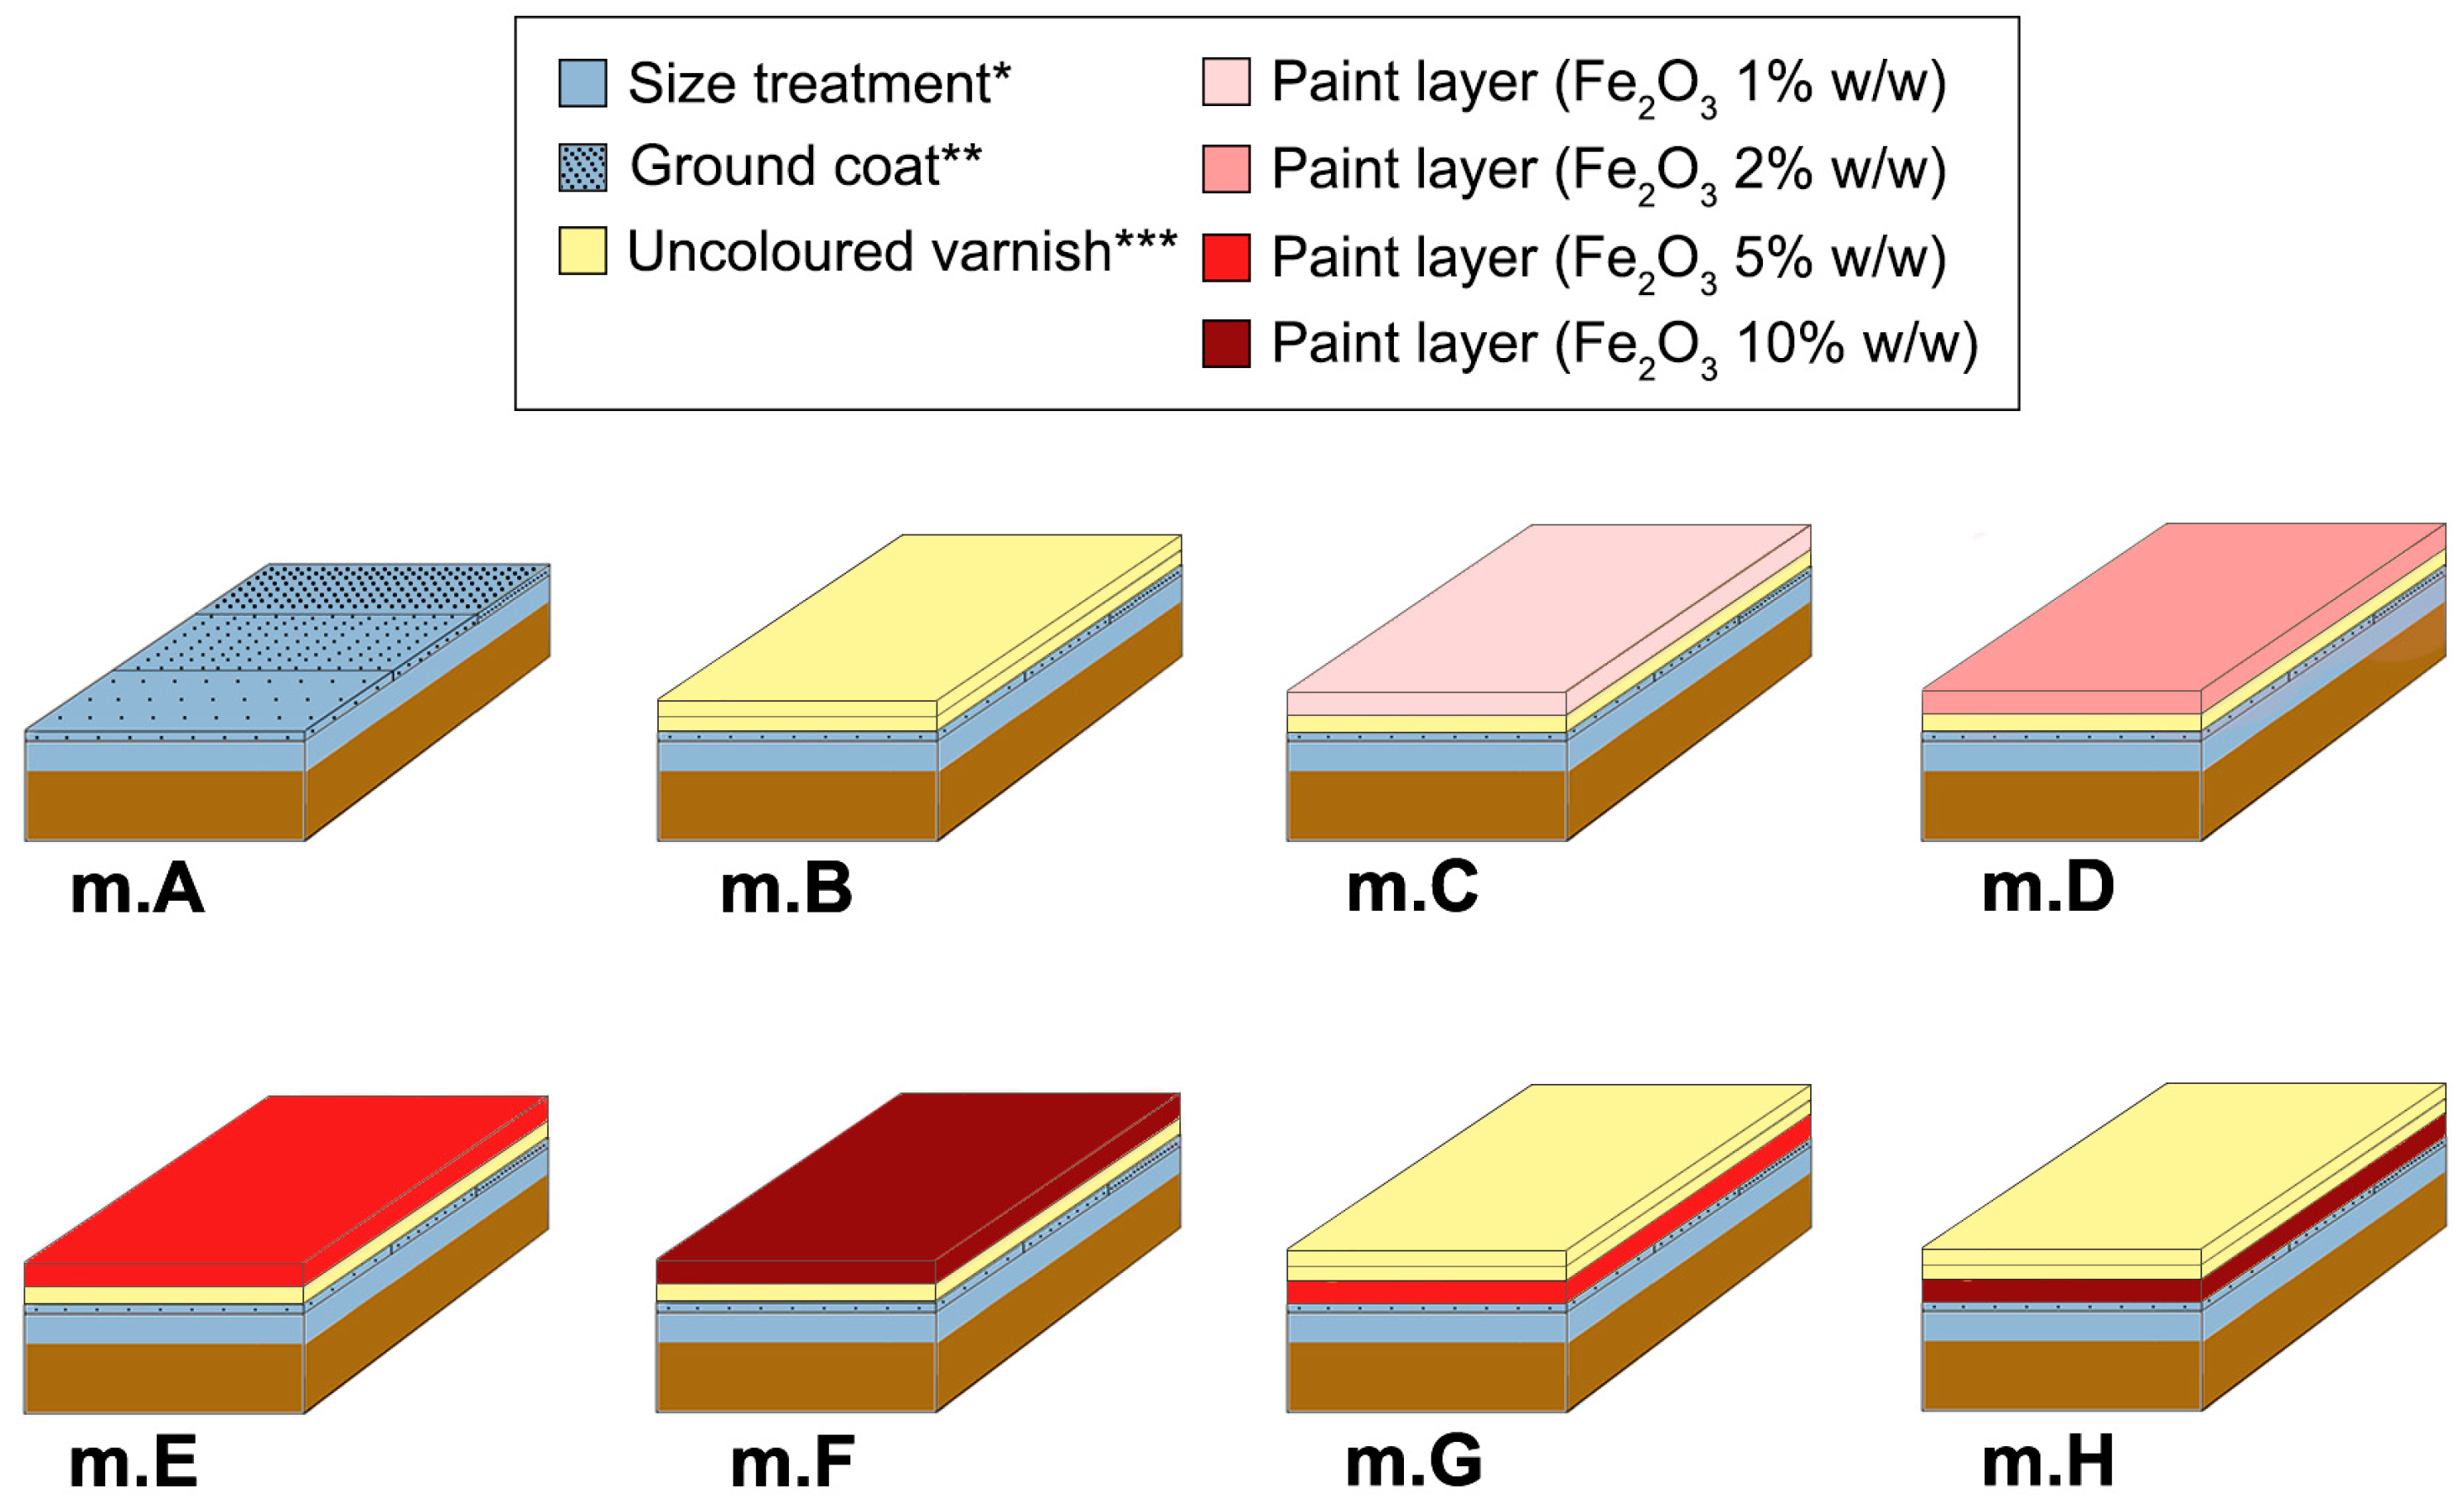
2.1. Preparation of the Mock-Ups

A total of eight mock-ups (m.A–m.H) were prepared by varying the following parameters at different stratigraphic levels: (i) concentration of the filler in the ground coat, (ii) concentration of the pigment in the paint layer, (iii) presence or absence of uncolored varnish between the ground coat and the paint layer, and (iv) thickness of the protective coat. A schematic representation of the mock-ups under investigation, with their different multi-layered coating systems, is shown in (Figure 1).
Wood boards of maple (Acer pseudoplatanus) were obtained by cutting the log along the radial-longitudinal direction. The dimensions of the maple boards are 15 cm (longitudinal direction) × 5 cm (radial direction) × 0.3 cm (tangential direction) each and, to prevent warping, a 0.9-cm-thick piece of multi-layered birch plywood was glued on one radial longitudinally cut face of the boards. The opposite radial longitudinally cut face was smoothed with Abranet sandpapers (P400, P1000) and its residual powder removed by brush and akapad gum before being treated. A potassium-caseinate-based size (S) treatment was applied by brush, completely penetrating the wood. After the smoothing with Abranet P1000 sandpaper (Jepua, Finland), the surface of each sized board was subdivided into three areas and coated, by brush, with a ground (G) layer composed of a dispersion of mineral talc in potassium caseinate in different concentrations (respectively, 1%, 5%, and 10% w/w). The ground coat measures ca. 5 µm of thickness. The surface was smoothed again with Abranet P1000 sandpaper and then covered with multiple layers using a bar film applicator (K Hand Coatermodel, Erichsen GmbH, Hemer, Germany). In detail, a first layer of uncolored linseed oil-colophony varnish (V) was laid on the mock-ups from m.B to m.F (thickness of about 10 µm), while a first layer composed of a dispersion of Fe2O3 pigment in linseed oil-colophony varnish (P) (thickness of about 20 µm) was laid on the mock-ups m.G and m.H in concentrations, respectively, of 5% and 10% w/w. In the four mock-ups m.C–m.F, the second layer is made of a dispersion of Fe2O3 pigment in linseed oil-colophony varnish (P) (thickness of about 20 µm) in concentrations of 1%, 2%, 5%, and 10% w/w, respectively, whilst in the mock-ups m.B, m.G and m.H it is composed of ca. 10 µm thick uncolored linseed oil-colophony varnish (V). Just in m.B, m.G, and mH, a third layer of uncolored linseed oil-colophony varnish (ca. 10 µm thick) was added to the stratigraphy. The pigmented varnish represents the paint layer and it is always characterized by an approximate thickness of 20 µm, whereas the external uncolored one acts as a protective coating in the mock-ups m.B, m.G, and m.H (totally measuring ca. 20 µm thick). In the other mock-ups (i.e., m.C–m.F), the uncolored varnish, underneath the paint layer, is motivated by its documented use in the bowed string musical instrument field [21] and measures around 10 µm of thickness. After every varnish application, the mock-ups were dried under UV lamps (Philips TL60 W/10-R 1SL/25 Attiniche UVA/10, Amsterdam, The Netherlands) for 18 h (t0). The mock-up named m.A, instead, was not varnished. Thickness measurements of the layers above described were performed by Optical Coherence Tomography (OCT) directly on the mock-ups and by optical microscopy on the cross-sectional samples, and they are summarized in Table 1.
The solution of potassium caseinate was obtained by adding casein to distilled water (10% w/w), subsequently dissolved in KOH solution 0.5 M. The procedure used to prepare the linseed oil-colophony varnish (ratio 65/35 or 2:1) is described as follows: linseed oil was first heated up to 250 °C, and it was maintained at this temperature for 30 min; then, milled colophony was added under magnetic stirring until complete dissolution, and the resulting mixture was maintained at 250 °C for 30 min.
The compounds under study were purchased from Kremer Pigmente GmbH & Co., Aichstetten, Germany (talc cat. No. 58420, casein cat. No. 63200, linseed oil cat. No. 73054, iron oxide Fe2O3 120M cat. No. 48120), and Cremona Tools SAS, Cremona, Italy (colophony cat. No. 504434). For this study, it is important to report the composition of the mineral talc as stated by Kremer in the technical specifications: SiO2 47%, MgO 31%, Al2O3 10%, Fe2O3 1.5%, and CaO 1%.

2.2. Exposure to Artificial Solar Radiation

Dried mock-ups (t0 = 18 h under UV lamps after varnishing) were symmetrically halved along the longitudinal direction (dimensions 7.5 cm × 5 cm × 0.3 cm each). The portion, i.e., of one half of each mock-up, characterized by a ground coat with 1% w/w of talc concentration in K-caseinate, was exposed to artificial daylight in the aging chamber Heraeus Suntest CPS (Hanau, Germany) equipped with a filtered Xenon lamp (non-aging coated quartz glass simulating a 3-mm thick window glass, cutting wavelengths <300 nm). The average irradiation was 750 W/m2, and the air-venting system of the chamber kept the internal temperature at about 50 °C. The mock-ups were aged in two steps (t1 = 25 h and t2 = 425 h under simulated solar irradiation) in order to evaluate the response of the coating systems over time. The portion of each mock-up which underwent artificial solar aging is highlighted in Figure S1.

2.3. Analytical Methods

Optical Coherence Tomography (OCT) examination was conducted in the Arvedi Laboratory of Non-Invasive Diagnostics hosted in the Museo del Violino (Cremona, Italy), within the MOLAB Transnational Access-EU H2020 Project IPERION CH. The analysis was carried out with a laboratory-built high-resolution portable Spectral domain OCT (SdOCT) instrument [44,45,46]. The tomograph is equipped with a broad-band light source made up of coupled super-luminescent LEDs emitting in the band of 750–930 nm and providing 0.8 mW power at the object. To obtain a cross-sectional image (tomogram), the probing light was scanned over the object, focusing at any given spot for 45 μs only. The fluence was not higher than 20 mJ/cm2, far below the damage threshold for any materials constituting objects of art. The distance to the object from the most protruding element of the device was 43 mm. The lateral imaging resolution was about 12 μm, while the axial one was ca. 3.3 μm in air and ca. 2.2 μm in a material with refractive index nR = 1.5. Therefore, a structure could be identified as a layer (i.e., with both interfaces seen separately) if its thickness was at least 5 μm. In raw OCT data, axial distances (depths) are expressed as optical ones. Therefore, to correctly represent axial distances within the object, the images were corrected for the refractive index of the medium, thus, all distances shown in figures are geometrical ones. In this case, the value nR = 1.5 was adopted as an average. In case of thin layers examined herein, possible deviations from this number for various media, in fact, would lead to differences which should be considered negligible because possible deviations would be less than measurement uncertainty caused by the axial resolution of the instrument. Data for OCT images presented herein were collected by scanning the mock-ups m.A, m.B, m.C, m.D, and m.H over an area of (10 × 6) mm2 in ca. 8.1 s as a series of 60 parallel, adjacent linear scans and the mock-up m.F over an area of (7 × 7) mm2 in ca. 4.5 s as a series of 100 parallel scans. The most representative tomograms, or B-scans, were then chosen for this article and presented in a false-color scale with colors codified automatically by the software. Black areas in the tomograms are those for which no scattering of the probing radiation is detected, either due to the intrinsic properties of the material (as for air, for instance) or because these areas are not reached by the radiation. Areas with detectable, albeit low, scattering properties were colored from blue to green. Centers of medium-to-high scattering properties are colored from yellow to red, respectively. It is important to note that the gradual fading of the OCT signal (“fading tails”) visible below the lowest imagined layer are artefacts which originate from photons impeded in the structure due to multi scattering events [47]. For better readability of the coating systems, the tomograms were vertically stretched 6-fold, and scale bars represent 200 μm in both directions. Therefore, the OCT images in this work represent areas (2.5 × 0.43) mm2. A limited number of dried and aged (t1) mock-ups (i.e., m.A-m.D, m.F, and m.H) were analyzed by selecting a unique spot for each area characterized by different concentrations of talc in K-caseinate at the ground level.
Reflection FT-IR spectroscopy was carried out using the Alpha portable spectrometer (Bruker Optics, Billerica, MA, USA) equipped with the R-Alpha external reflectance module that is composed of an optical layout of 23°/23°. The compact optical bench is made up of a SiC Globar source, a RockSolid interferometer (with gold mirrors), and an uncooled DLaTGS detector. Areas of about 5 mm in diameter were measured at a working distance of 15 mm. Reflectance spectra were collected between 7500 and 375 cm−1, at a resolution of 4 cm−1 and with an acquisition time of 1 min. Spectra from a gold flat mirror were used as background. Three shifted measurements (10 mm step) were performed on each portion of the mock-ups characterized by different concentration of talc in K-caseinate (1%, 5%, and 10% w/w) at the ground level, yielding a total of 9 × 8 = 72 spectra at t0 and 3 × 8 = 24 spectra for each stage of aging (t1 and t2). For the study of bands produced by organic compounds, reflection infrared spectra were transformed to absorbance spectra by applying the Kramers-Kronig (KK) algorithm (included in the OPUS 7.2 software package) [48] and a portion of the mid-IR spectral range is exhibited in figures.
Raman spectroscopy was performed by the BRAVO portable spectrometer (Bruker Optics, Billerica, MA, USA), which employs the SSE™ (Sequentially Shifted Excitation, patent number US8570507B1 [49]) patented technology to reduce fluorescence [50,51]. The instrument is equipped with two different lasers (Duo Laser™, Bruker, Billerica, MA, USA) ranging from 700 to 1100 nm and with power less than 100 mW. During the acquisition, the laser is slightly wavelength shifted for three times and three raw Raman spectra are collected. An algorithm identifies the peaks that shift at different laser wavelengths as good Raman signals, while the non-shifting peaks are recognized as fluorescence (or absorbance) signals and removed. The spectra were acquired in the range 3200 to 300 cm−1, with acquisition time from 500 ms to 2 s and accumulation from 5 to 100 scans. OPUS™ software (Version 7.7) was used to set the acquisition parameters and to smooth the spectra.
X-ray Fluorescence (XRF) spectroscopy was carried out using the EDXRF spectrometer ELIO (Bruker Optics, Billerica, MA, USA). The system is composed of a large-area Silicon Drift Detector (SSD) (25 mm2) with its read-out based on a Complementary Metal-Oxide Semiconductor (CMOS) preamplifier (CUBE). The device is equipped with a low-power X-ray tube with Rh anode and 1.2 mm of analytical spot diameter. The selected working conditions were measuring time 480 s, fixed tube voltage 40 kV, tube current 40 μA, and acquisition channels 2048. Nine spectra were collected from each dried mock-up at t0, namely three for each area characterized by different concentrations of talc in potassium caseinate at the ground level. The whole XRF dataset is, therefore, composed of 9 × 8 = 72 spectra. For each element taken into consideration, the displayed value corresponds to the net area counts of the peak (Kα) normalized to the average of net area counts of the coherent scattering Rh-Kα peak of the entire dataset. The detection limit below which the values are considered approaching zero is 0.05. The integration of the peaks was calculated using both the background component determined with a fitting on the whole spectrum (global parameter) and the Gaussian fitting of the specific section of the spectrum (local parameter) where the peak was located. The concentration of light elements, such as Si and S, could be underrated, since their low-energy secondary emission is attenuated by air and by the matrix [52,53]. Data were processed using the ELIO 1.6.0.29 software.
Statistical multivariate analysis of the reflectance IR and XRF data was performed by chemometric tools. Principal Component Analysis (PCA) was applied to the spectra collected on dried mock-ups (t0) in order to extract the dominant patterns in the data matrix in terms of a complementary set of score and loading plots. The multivariate approach considered a m × n matrix composed of as many rows (m) as the number of spectra and as many columns (n) as the number of variables, respectively, wavenumbers and chemical elements for the IR and XRF sets. The optimal number of Principal Components (PCs) to be retained was selected by evaluating the scree plot [54]. As for the IR dataset, a matrix of 72 × 490 was considered. Reflectance spectra are considered in the restricted interval 1400–400 cm−1 [55,56] in order to investigate the impact of the varnish film on the diagnostic bands produced by the mineral talc. First derivative (Savitzky-Golay) and mean centering spectral pre-treatments were applied. As for the XRF data, a matrix of 72 × 4 was examined. In detail, the row number is the result of the spectra acquired on dried mock-ups (72), and the column number (4) is defined by the elements considered as diagnostic for the stratigraphic study (i.e., Si, S, K, Fe). The XRF variable value corresponds to the net area counts of the peak (Kα) of each element normalized to the average of net area counts of the coherent scattering Rh-Kα peak of the entire dataset. Mean centering and scaling pre-treatments were combined. PCA data analysis was performed using the Nonlinear Iterative Partial Least Squares (NIPALS) algorithm with the R-based software CAT (Chemometric Agile Tool), freely available on the site of the Italian Group of Chemometrics [57].
Chromatic variations at different aging stages were measured using the portable Konica Minolta CM-2600d spectrophotometer (Chiyoda, Tokyo, Japan). Data were collected in the wavelength range 400–740 nm (spectral resolution of 10 nm) using a round target mask of 11 mm diameter. L*, a* and b* coordinates were calculated in SCE mode (specular component excluded) with a 10° standard observer and illuminant D65 according to CIELAB 1976 color space. The magnitude of the overall color variation is given by ΔE* = [(ΔL*)2 + (Δa*)2 + (Δb*)2]½. Three shifted measurements (10 mm step) were performed on each portion of the mock-ups characterized by different concentration of talc in K-caseinate (1%, 5%, and 10% w/w) at the ground level, yielding a total of 9 × 8 = 72 data at t0 and 3 × 8 = 24 spectra for each stage of aging (t1 and t2). The average value of the three measurements carried out on each differently ground coated portion was considered.
Sub-millimetric samples were collected with a scalpel in different areas of the mock-ups and embedded into epoxy resin (Epofix Struers and Epofix Hardener with ratio 15:2). Embedded samples were then cut to obtain cross-sections and polished with silicon carbide fine sandpapers (1200–8000 mesh). The exposed surfaces were observed at high magnifications using the Olympus BX51TF (Tokyo, Japan) Polarized light Optical Microscope (MOP), equipped with visible (Olympus TH4–200) and Ultraviolet (Olympus U-RFL-T) illuminants, and the Scanning Electron Microscope (SEM) FE-SEM Tescan Mira 3XMU-series (Brno, Czech Republic) located at Pavia Arvedi Laboratory, CISRiC, University of Pavia, set with an accelerating voltage of 15–20 kV in low vacuum (lvac).

3. Results and Discussion

Results obtained on dried mock-ups (t0) from the different non-invasive techniques are discussed in this section, and a summary of their potential and limitations is reported in Table 2. The effects of artificial light exposure as recorded by colorimetric and reflection FT-IR spectroscopy are subsequently described.

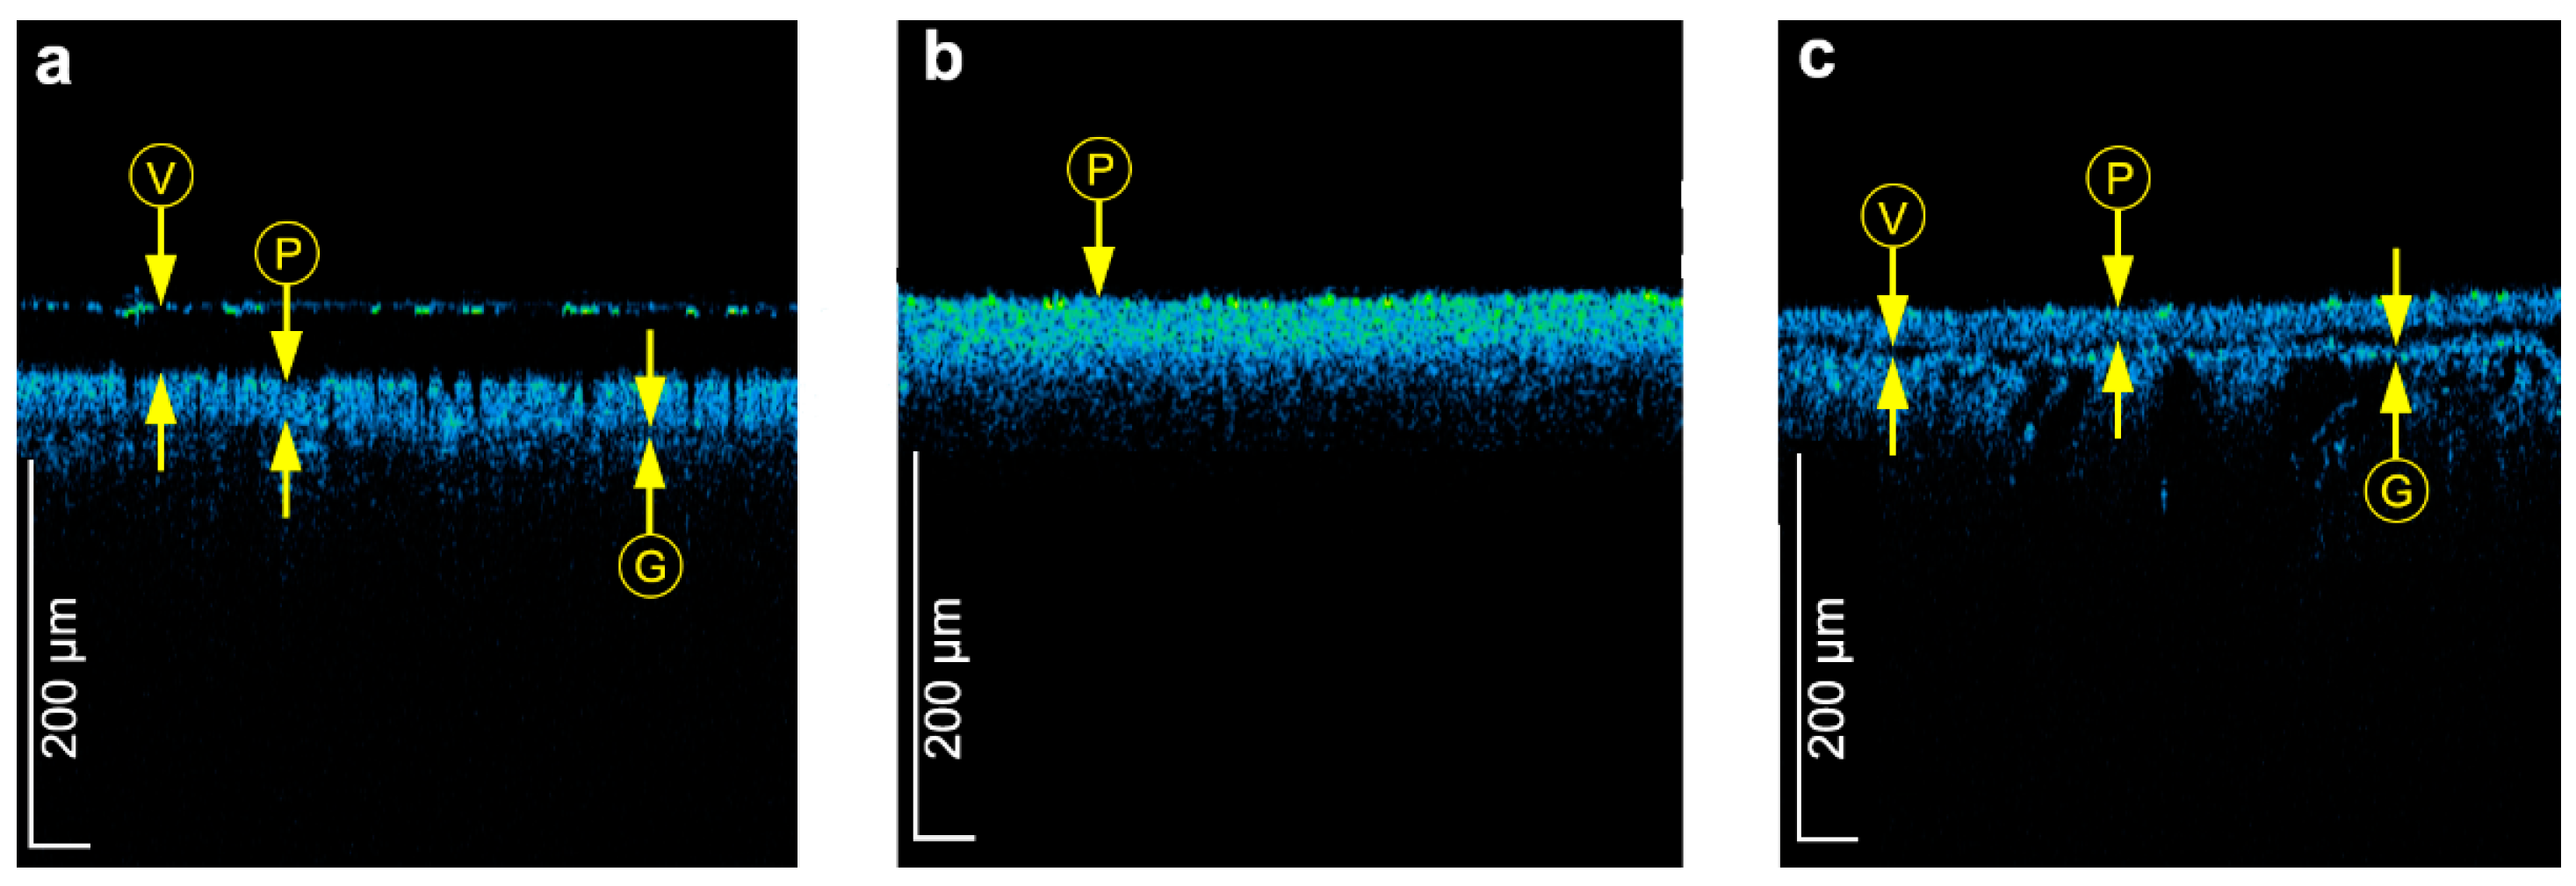
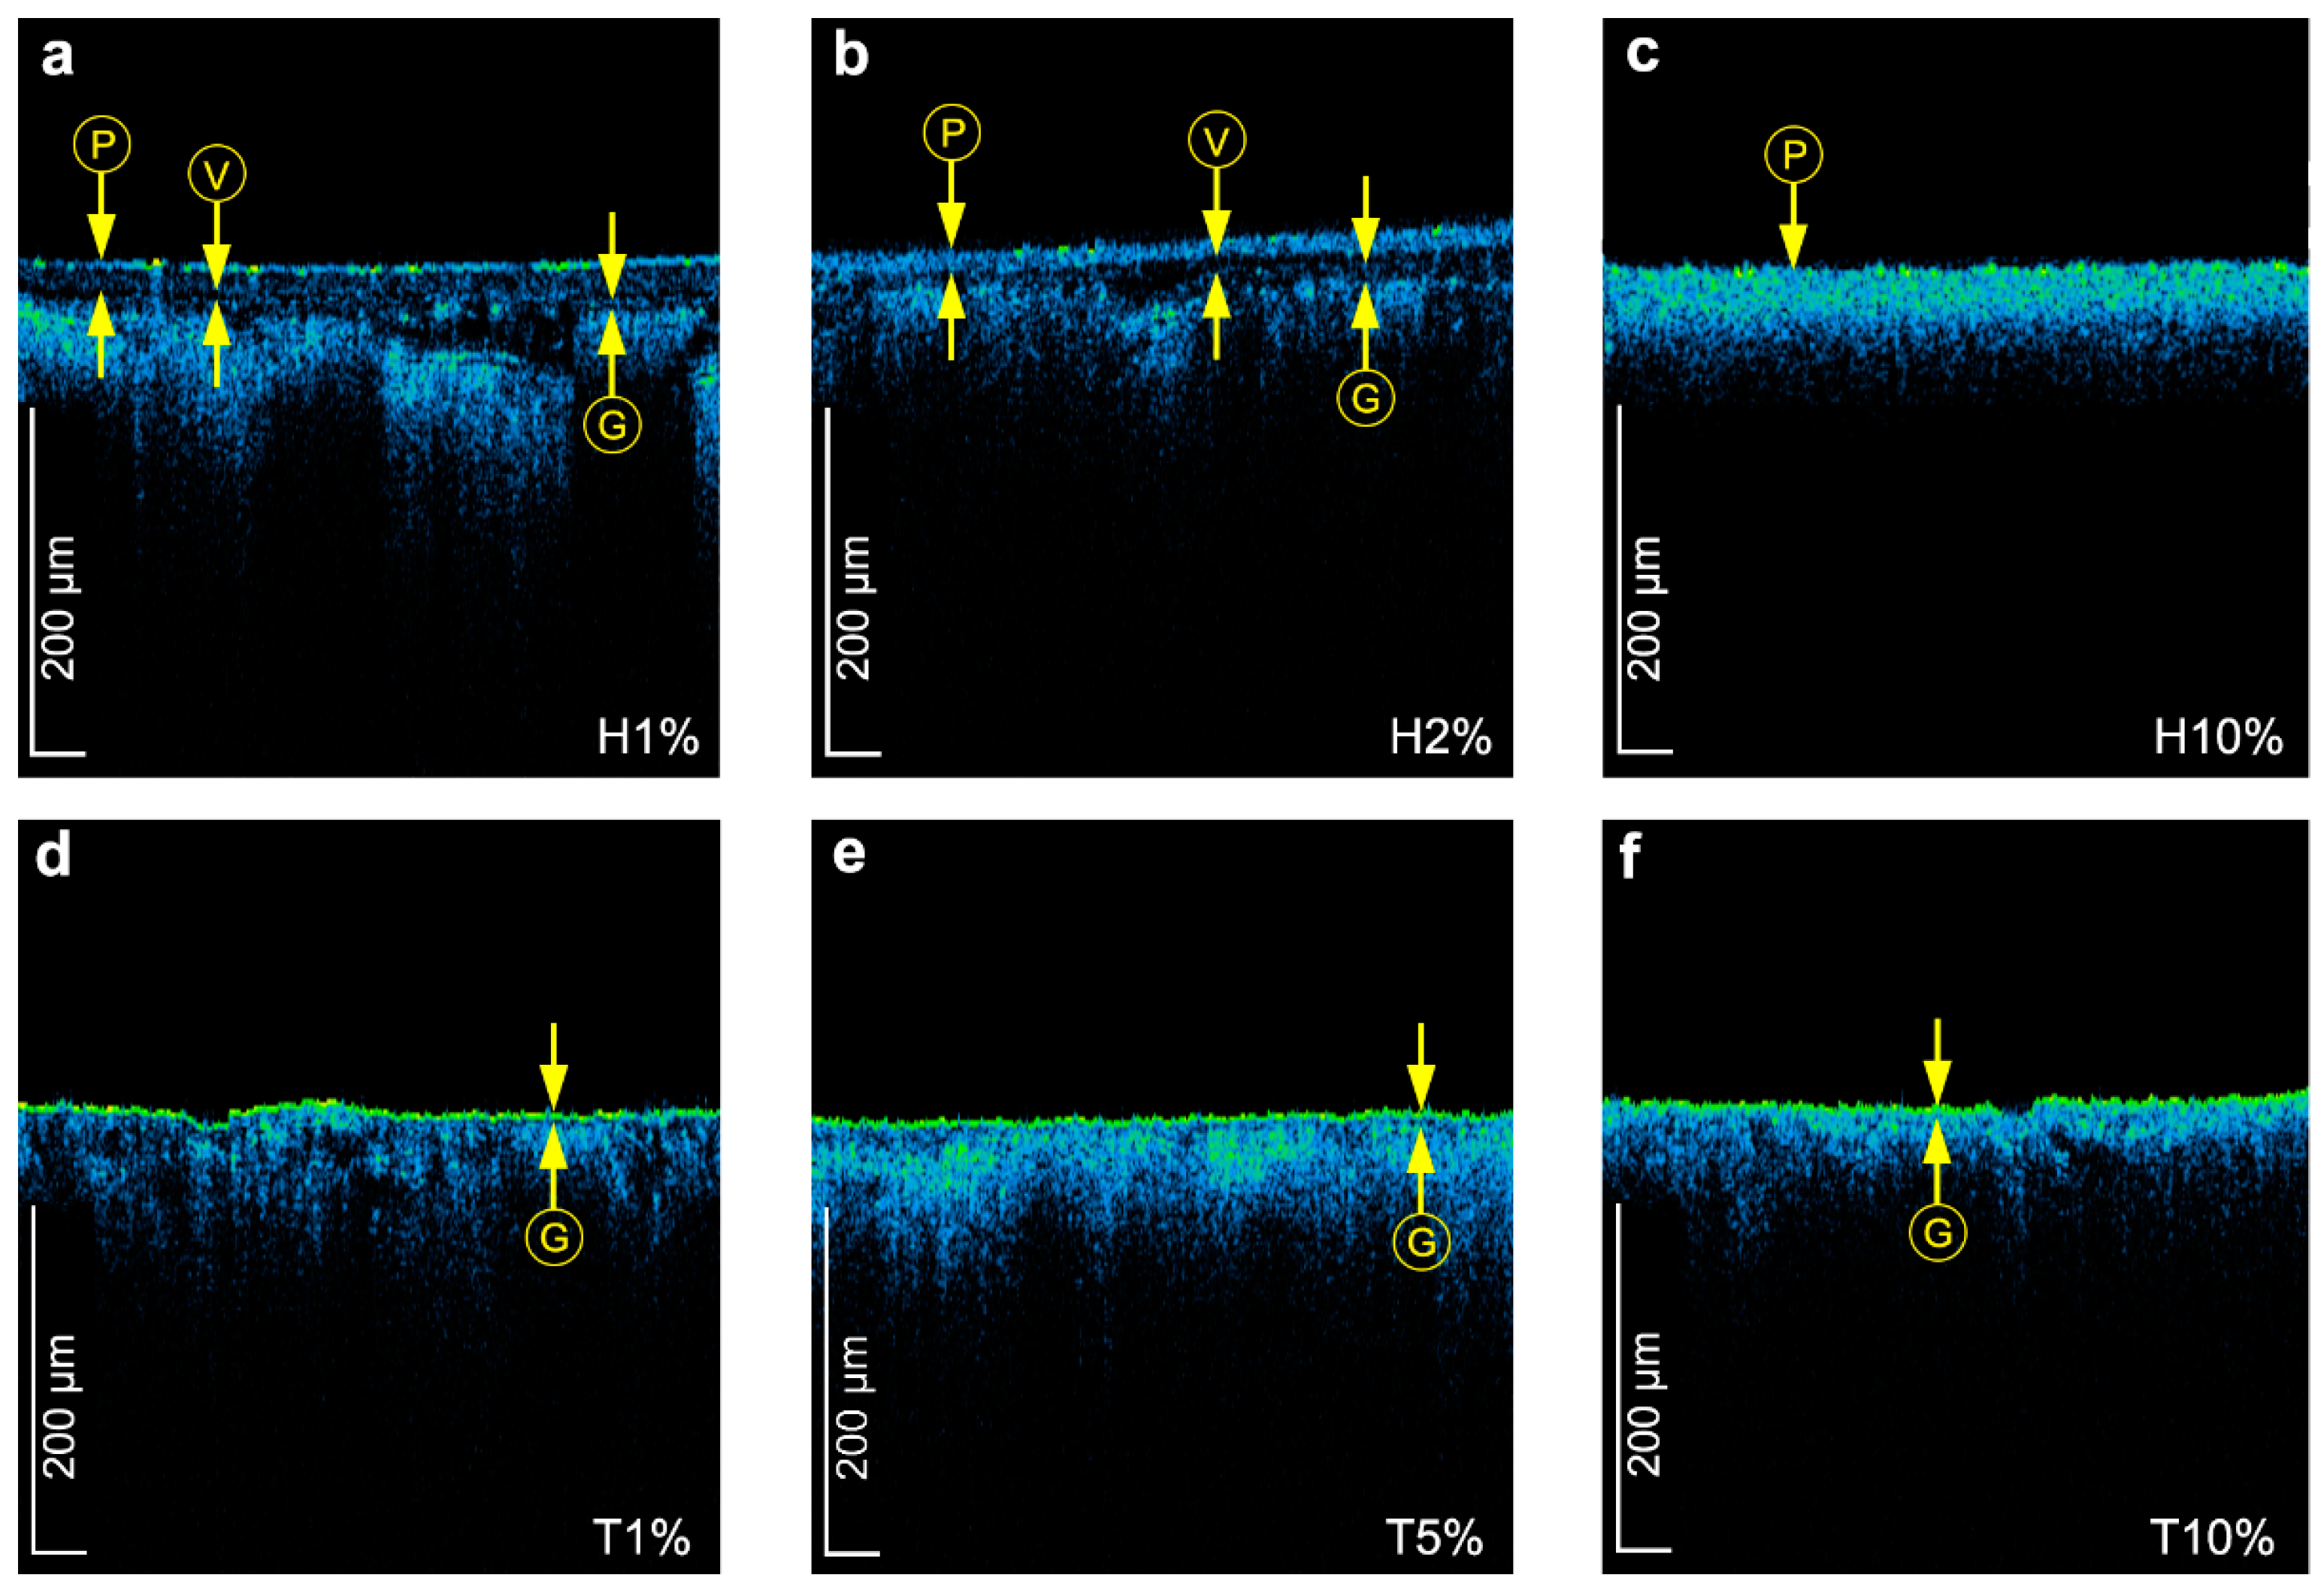
3.1. Optical Coherence Tomography

OCT examinations allowed us to non-invasively measure the thickness of the coats lying above the wood support in the stratigraphies. Although no layer of K-caseinate, used to size the wood, was detected, it is probable that the sizing had enhanced the translucency of the wooden support since the near IR radiation penetrated the wood down to a depth of ca. 100 μm, which would not be the case for untreated wood. The OCT thickness measurements of surface coatings, supported by the observations of cross-sectional samples under optical microscopy, are reported in Table 1. Interestingly, it was possible to identify three cases, in the mock-up series, where the technique was not able to discriminate adjacent layers, and consequently measure their thicknesses accurately: (i) comparable intensity of light scattering at particles dispersed in different layers, as observed for the ground and paint films in m.H (Figure 2a), (ii) close in time applications of transparent layers characterized by the same refractive index, as occurred for the two protective uncolored varnish layers of m.H (Figure 2a), and (iii) layer with very high concentration of particles concealing visibility of a thin transparent undercoat, as the case of m.F where the paint layer containing hematite in concentration of 10% is laid over ca. 10 µm of uncolored varnish (Figure 2b). In the last case, the high scattering and absorbing of near IR radiation in the pigmented layer (P in Figure 2b) totally obscured the underlying thin transparent film and the interface between them, which was not the case with pigment concentrations of 1% and 2%.
In case of examination of historical bowed string musical instruments by OCT, it was possible to detect the presence of large particles and their distribution in the stratigraphies, especially when embedded in transparent varnishes [7,58]. However, it needs to be taken into consideration that, in case of semi-scattering and scattering layers, the “grains” in the structures visible in OCT tomograms should not be always interpreted as realistic imaging of the particles. For instance, in the mock-up series, the ground and paint layers appeared as grainy structures, which could be discriminated from each other only due to the presence of an interlayer of transparent varnish lying between them. Within each layer, however, the individual scattering centers could not be distinguished from each other (Figure 2c). This evidence was found for both hematite and talc, acting as pigment and filler, respectively, and it can be likely ascribed to jointly contributing factors related to the particles: (i) size and average distance among the particles (also at a minimum concentration of 1%) lower than the lateral resolution of the instrument and (ii) uniformity of dispersion. It is important to point out, moreover, that every layer scattering light weakly or moderately is seen in OCT imaging as composed of small dots (speckles) in which size depends on coherence properties of probing light and instrument’s optics rather than the actual size of scattering centers. To investigate the real size and distribution of both hematite and talc grains, SEM observations of a representative mock-up stratigraphy were performed (Figure 3).
Another consideration concerns the OCT sensitivity in discriminating different concentrations of filler or pigment. As the particle concentration increases, the tomograms generally show a slight increment in the scattering intensity, with the color varying from blue to green, as well as in the local concentration of dots, and vice versa. In particular, these variations resulted more evident for the paint layer (Figure 4a–c) than for the ground one (Figure 4d–f), this last being laid in direct contact with the wood support.
Finally, an interesting phenomenon strictly involved the paint layer of some stratigraphies under investigation. The paint layer in m.H (P in Figure 2a), in fact, appeared to be more transparent to the near IR radiation, or less scattering, than that of the mock-up m.F (P in Figure 2b). It must be underlined that the hematite concentration, as well as the paint layer thickness, are identical in both the mock-ups. The observed difference in light scattering intensity can be likely ascribed to the transparent uncolored varnish covering the paint layer in m.H. On the contrary, no protective layer is present in m.F, where the uncolored varnish is instead positioned underneath the paint layer.

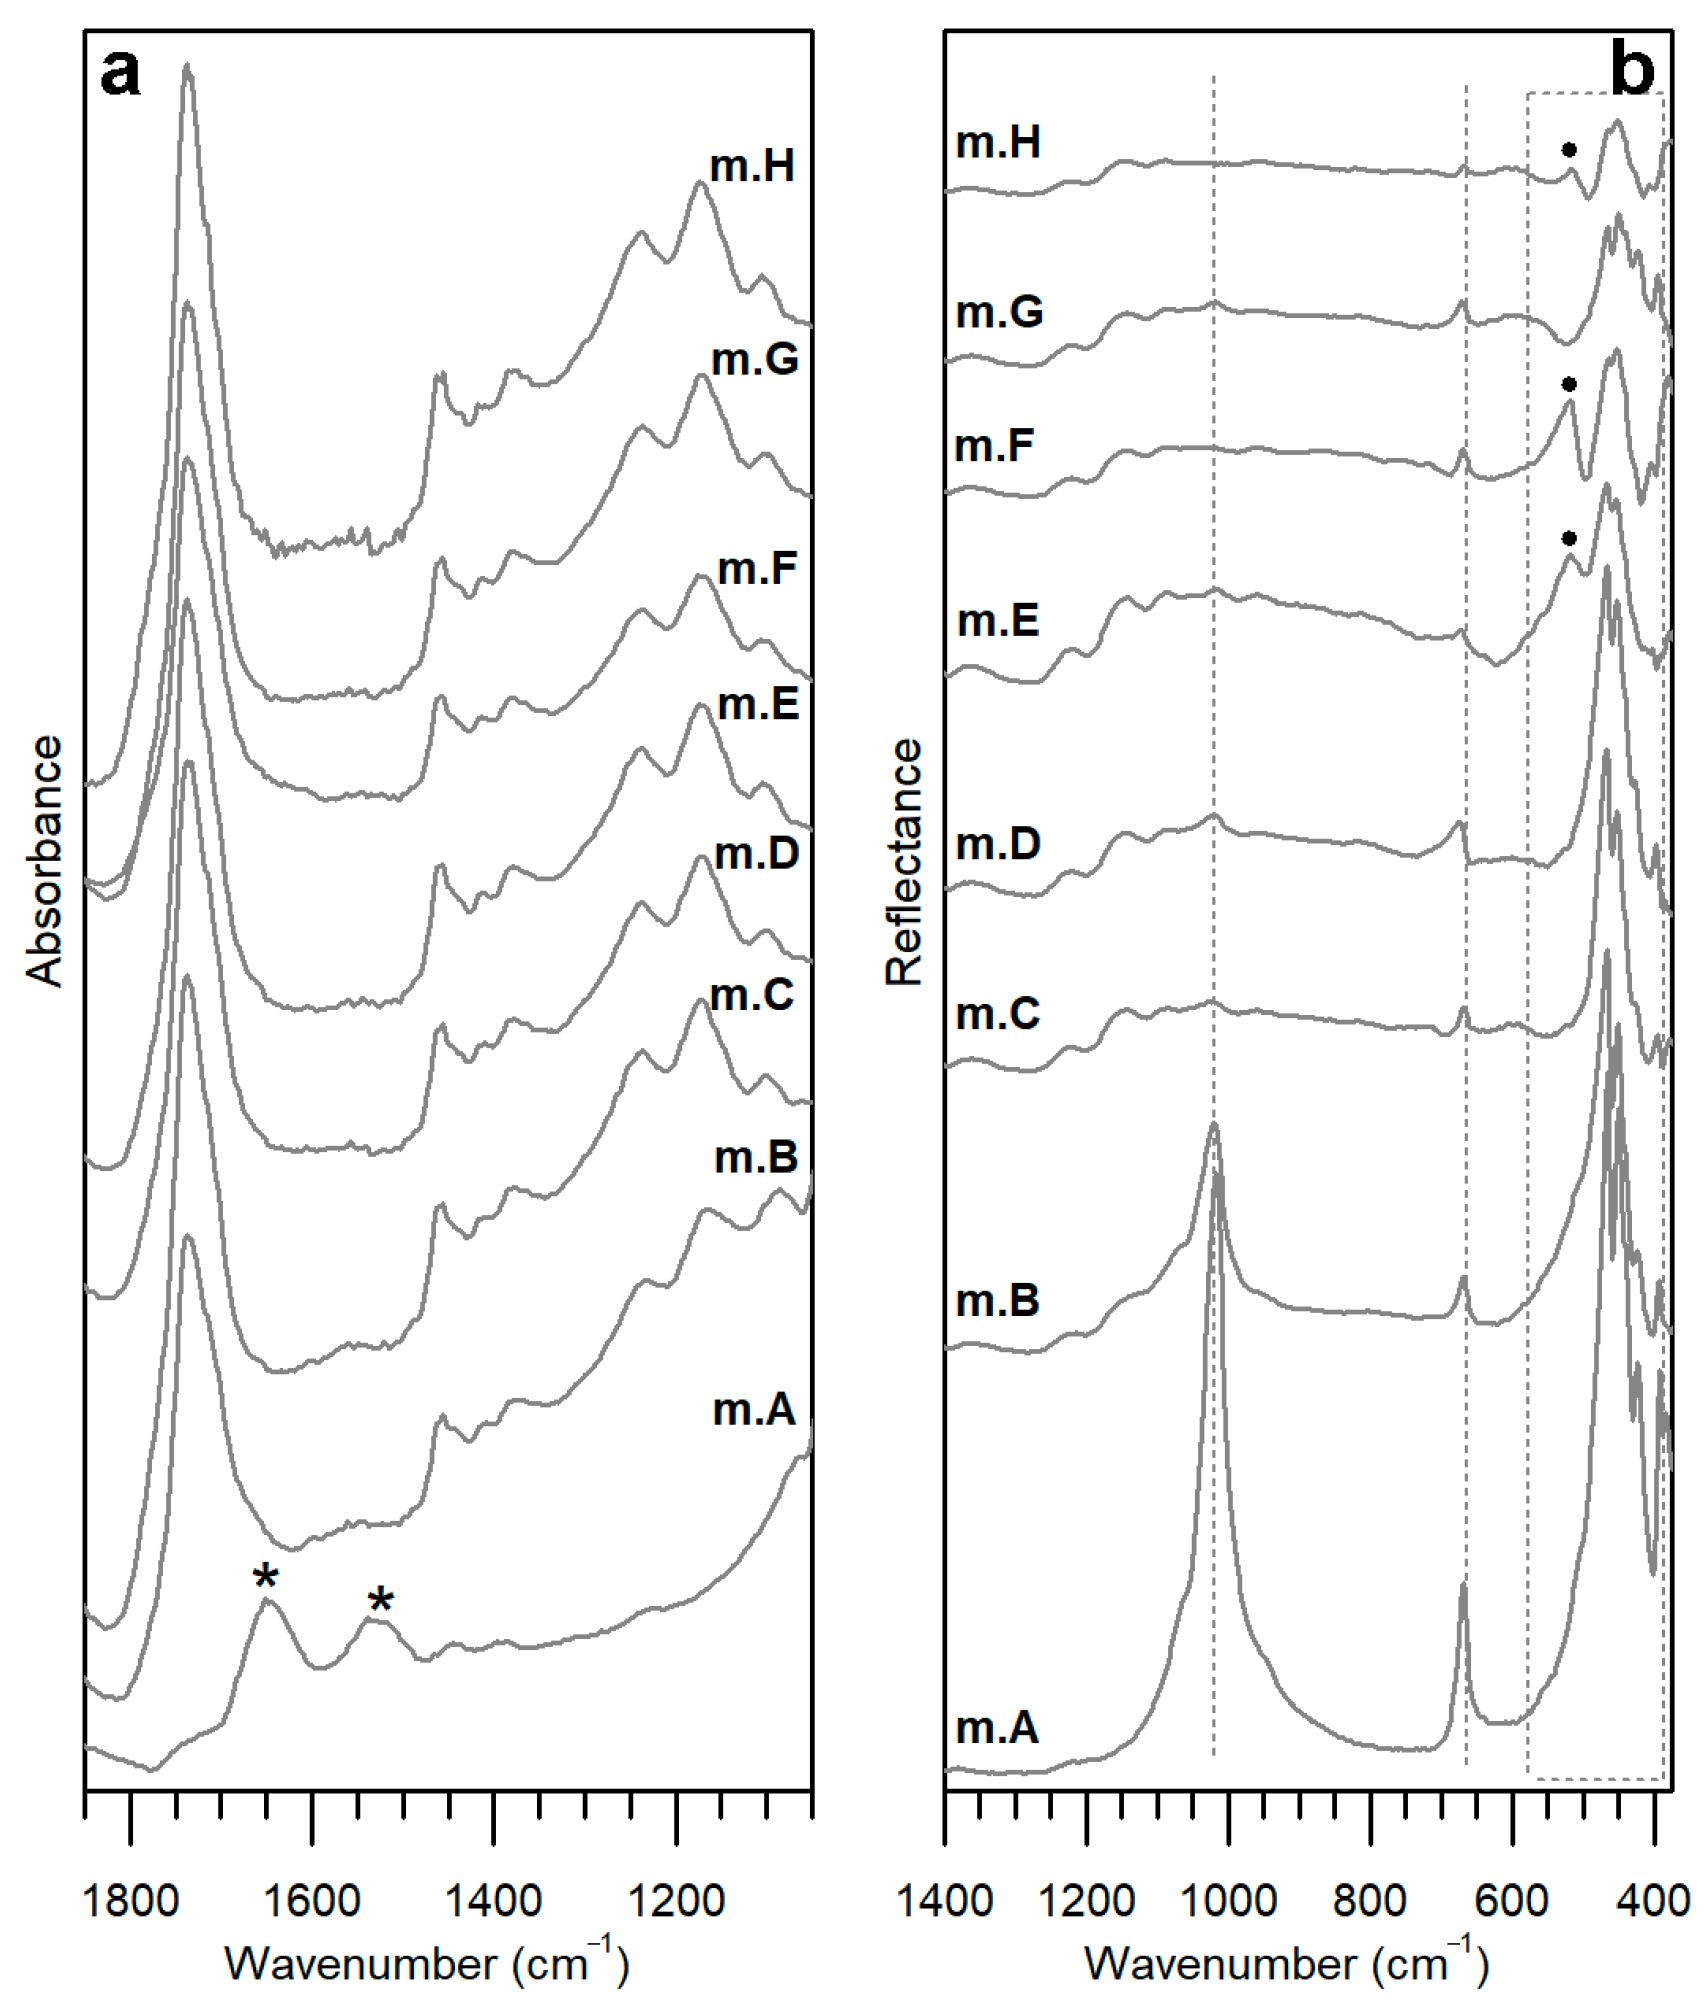
3.2. Reflection FT-IR Spectroscopy

Focus of the reflection FT-IR study was to assess to what extent the different varnish-based coatings affected the detection of spectral bands produced by the organic and inorganic components of the underlying ground coat, respectively, K-caseinate and talc.
As for the K-caseinate, its diagnostic bands (v(N–H) at 3300 cm−1, v(C=O) or amide I at 1650 cm−1, combination of v(C–N) and δN-H or amide II at 1540 cm−1) [48,59] were merely identified in the Kramers-Kronig transformed (KKT) spectra acquired on the mock-up m.A, where the ground surface is directly exposed. Therefore, any overlying varnish coating here considered included the ca. 20 µm of protective varnish in m.B, made the proteinaceous bands undetectable (Figure 5a). This result is consistent with the previous studies conducted by the authors [4,60].
As for the talc, the picture appeared rather more complicated from a spectral point of view because its bands behaved differently from each other. Three groups of Reststrahlen bands were firstly identified as diagnostic of the talc in the reflectance spectra of these stratigraphies, namely (i) vas(Si–O) (v3) at 1015 cm−1, (ii) v + δSi–O (v4) at 670 cm−1 and the third one (iii) comprising in-plane δMg–O (v7) at 465 and 450 cm−1, δSi–O (v5) at 425 cm−1, and δSi–O at 395 and 385 cm−1 [60,61,62,63] (Figure 5b, spectrum of m.A). A general trend was then recognized by observing the spectra collected on the mock-up areas characterized by the same talc concentration in the ground (Figure 5b): the intensity of the talc marker bands diminished with the increase in the varnish coating thickness and in the hematite concentration. Interestingly, the signals at 670 and around 400–300 cm−1, albeit reduced in intensity, are always detectable in the mock-ups differently from the signal at 1015 cm−1 (Figure 5b), in which intensity dramatically decreased up to completely disappearing. This suggests that, in presence of multi-layered structures with thicknesses from 30 µm on, the silicate mineral can be identified merely by its lower-wavenumber bands.
The band intensity variation was confirmed by the PCA analysis of the dataset in the restricted range 1400–400 cm−1. The PC1 versus PC2 scatter score plot (accounting for 81.4% of the total variance) showed a clear separation between the spectra acquired on m.A and m.B, with negative PC1 score values, and the spectra from all the other mock-ups, with positive, or null, PC1 scores (Figure 6a). As visible in Figure 5b, the band intensities of talc in m.A and m.B are, in fact, the most pronounced of the entire dataset.
From the spectra, moreover, it is evident how the presence of varnish-based layers led to a marked change in the relative intensities of the three groups of talc marker bands (Figure 5b).
As concerns the hematite pigment, the presence of its derivative marker band at around 530 cm−1 (maximum point) was detected in the spectra collected on m.E, m.F, and, more weakly, on m.H [64] (Figure 5b). The other characteristic band of Fe2O3, falling at about 480 cm−1, was not considered because of its overlapping with the third group of talc signals above identified as (iii). When the paint layer is exposed (m.E, m.F), hence, the iron oxide can be revealed if its concentration is at least of 5%; when it is covered by ca. 20 µm of the protective varnish layer, instead, the minimum concentration to be detected is 10%. Interestingly, spectra of these mock-ups group in the area of the PC1 versus PC2 score plot mostly characterized by positive PC1 and negative PC2 score values (Figure 6a,b).
While the PC1 direction mainly described the intensity variation of the bands, the second PC seemed to be affected by the variation in their shape. As shown in the loading plot of PC1 and PC2 (Figure 7), the highest variations, for both the PCs, occurred in the lowest-wavenumber region (i.e., original variables between 400 and 500).
Finally, it is worth reporting that the reflection FT-IR spectroscopy was not able to discriminate different concentrations of talc in the ground layer: band intensities related to that mineral, in fact, did not significantly change in the three areas of each mock-up corresponding to concentrations of 1%, 5%, and 10%.

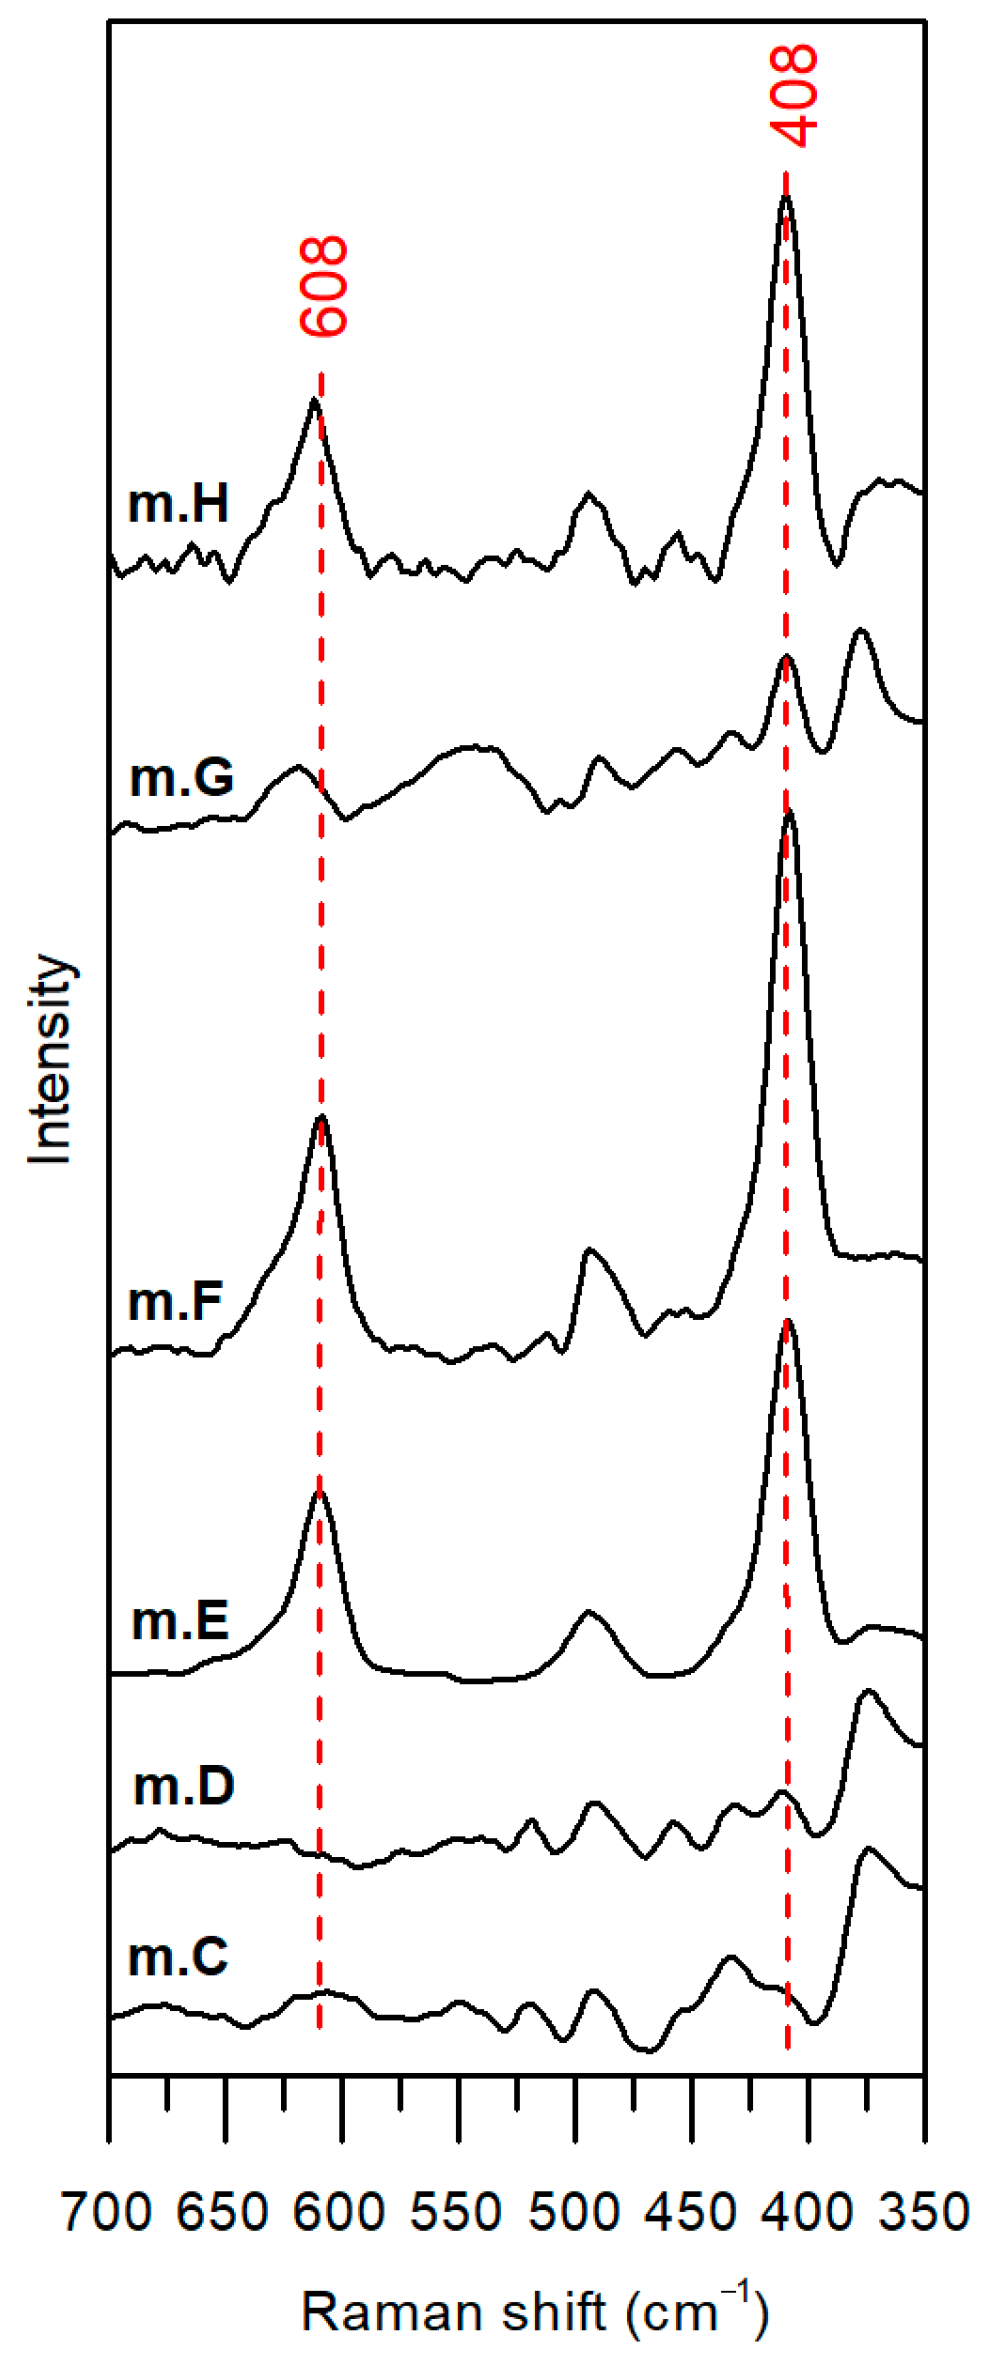
3.3. Raman Spectroscopy

In the range from 3200 to 300 cm−1, Raman spectra collected on the mock-ups are all characterized by the predominant profile of the wood. Signals produced by linseed oil-colophony mixture and K-caseinate were not revealed in any of the stratigraphies, suggesting that the thicknesses of ground and varnish-based layers are too low to be investigated by this technique. As evident from this result, the incident lasers directly arrived at the wooden support without being scattered by the organic components of the overlying coating system. In addition, the bands of the mineral talc were never detected, not even in m.A, where the ground is exposed.
The hematite bands occurring in the investigated spectral region are positioned at 608, 495, and 408 cm−1. These signals, assigned to the Fe–O stretching vibrations [65], are well visible in the spectra of m.E, m.F, and m.H, with their characteristic relative Raman intensities (Figure 8). However, since the weaker and broader band centered at 495 cm−1 overlaps with a wood signal at the same frequency, we could not consider this band as diagnostic of the pigment in these stratigraphies, and, consequently, it was not highlighted in Figure 8. By the analysis of the spectra collected on the mock-ups with the paint layer exposed, the intensity of the marker band at 408 cm-1 was found to gradually increase from m.C to m.D, m.E, and m.F, according to the increment in the hematite concentration (Figure 8). With the intensity increase, the shape of this band also becomes better resolved and sharper. In the mock-up series above mentioned, the signal at 608 cm−1 is instead evident only with paint layers characterized by Fe2O3 concentrations of 5% (m.E) and 10% (m.F).
Interestingly, the presence of a protective layer turned out to affect the intensity of the hematite bands. In particular, the spectrum acquired on m.G merely shows the band at 408 cm−1, with a far lower intensity compared to the mock-up with the same pigment concentration of 5% (m.E). Furthermore, a broad band centered at 620 cm−1 was also detected in this spectrum, but both the shape and the wavenumber shift allowed us to attribute it to the wood. As for the spectrum from m.H, the diagnostic bands of the hematite are well visible but appear less intense than those of the corresponding, in terms of Fe2O3 concentration, mock-up m.F.

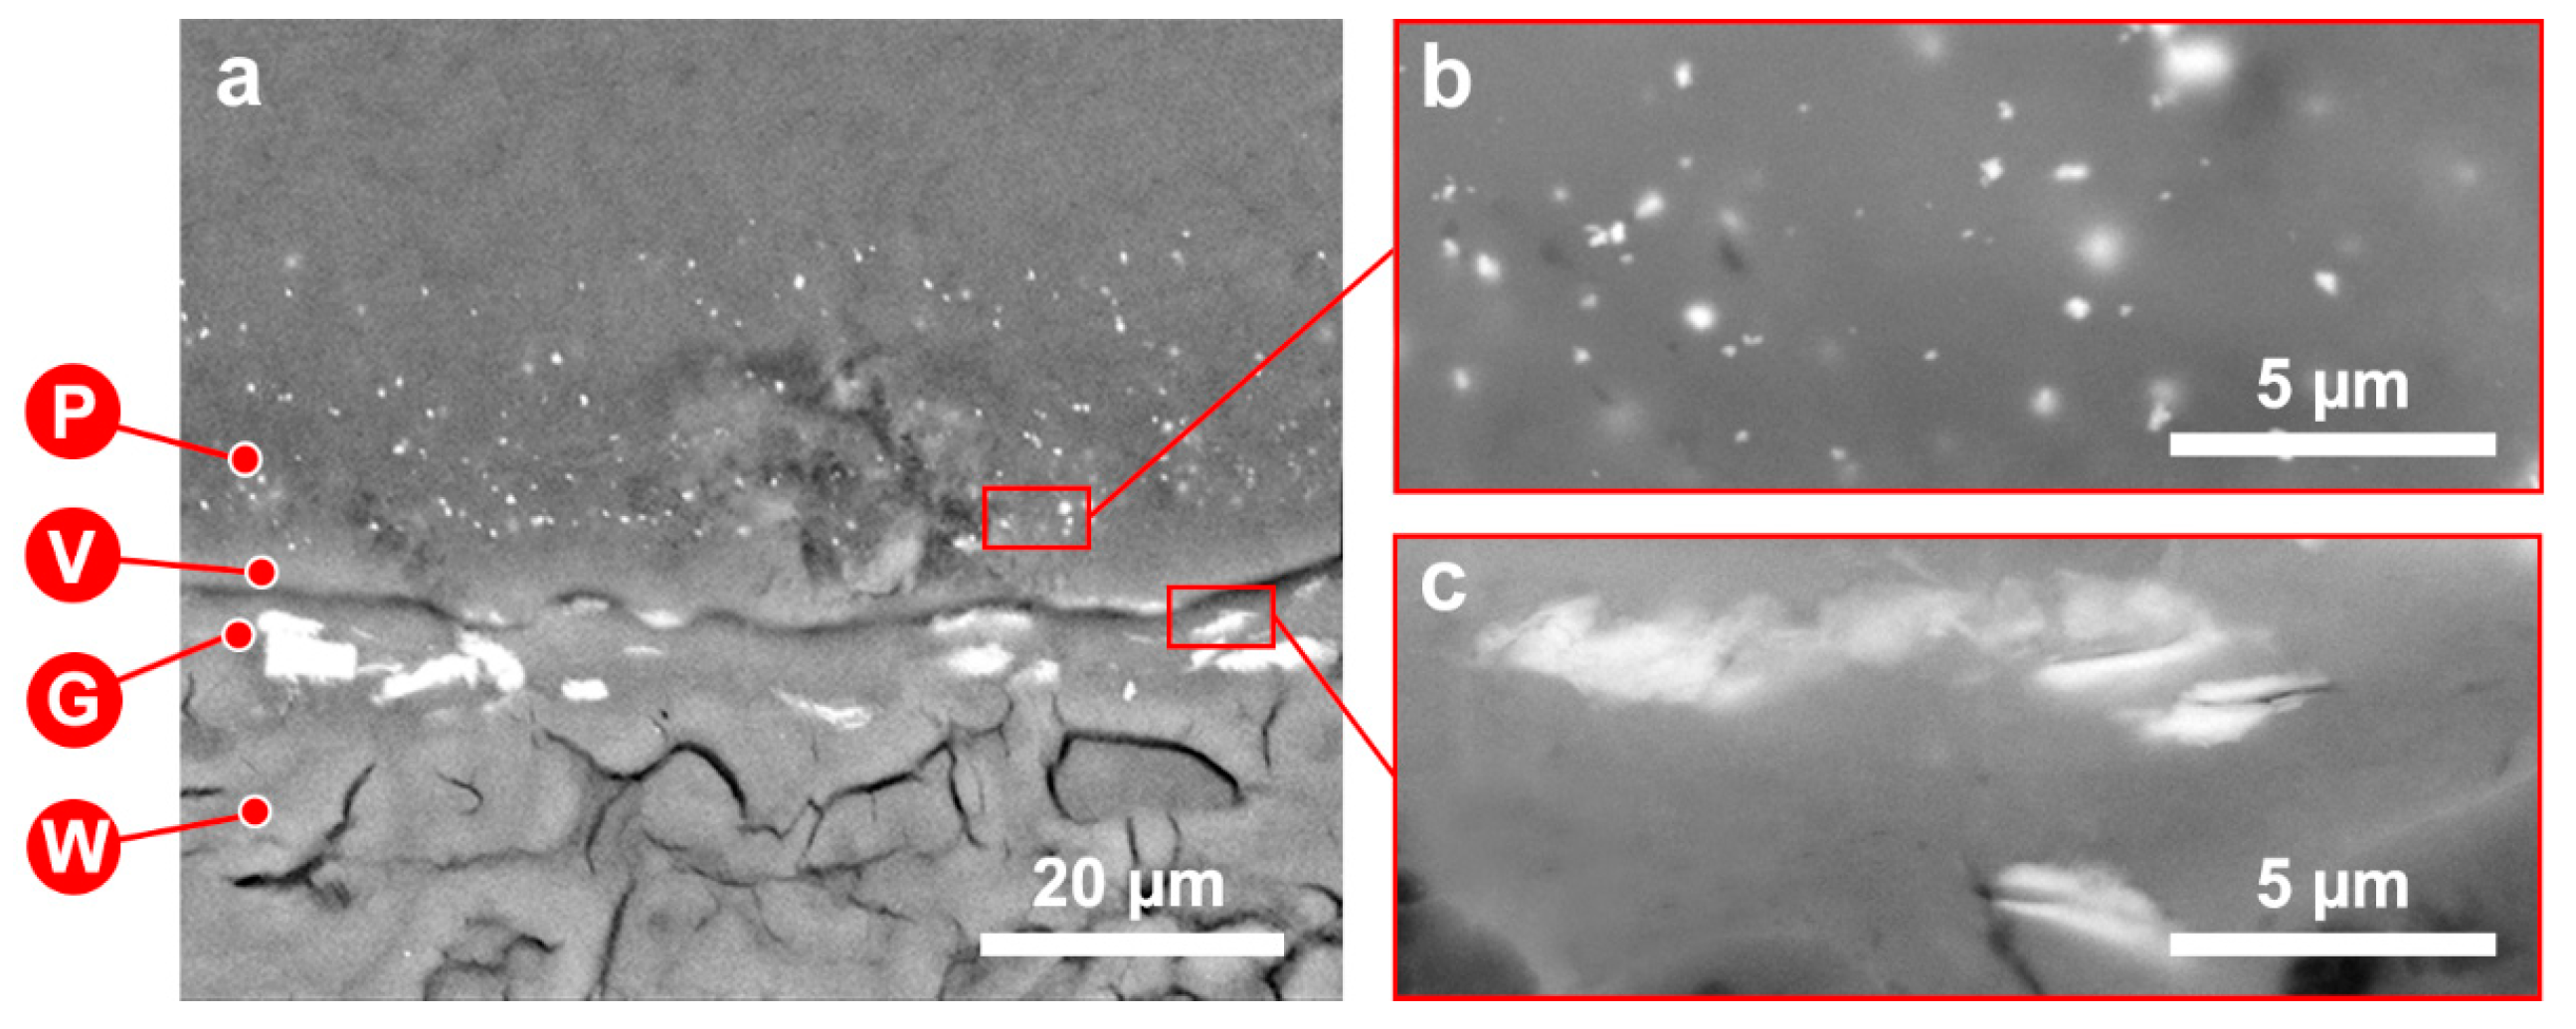
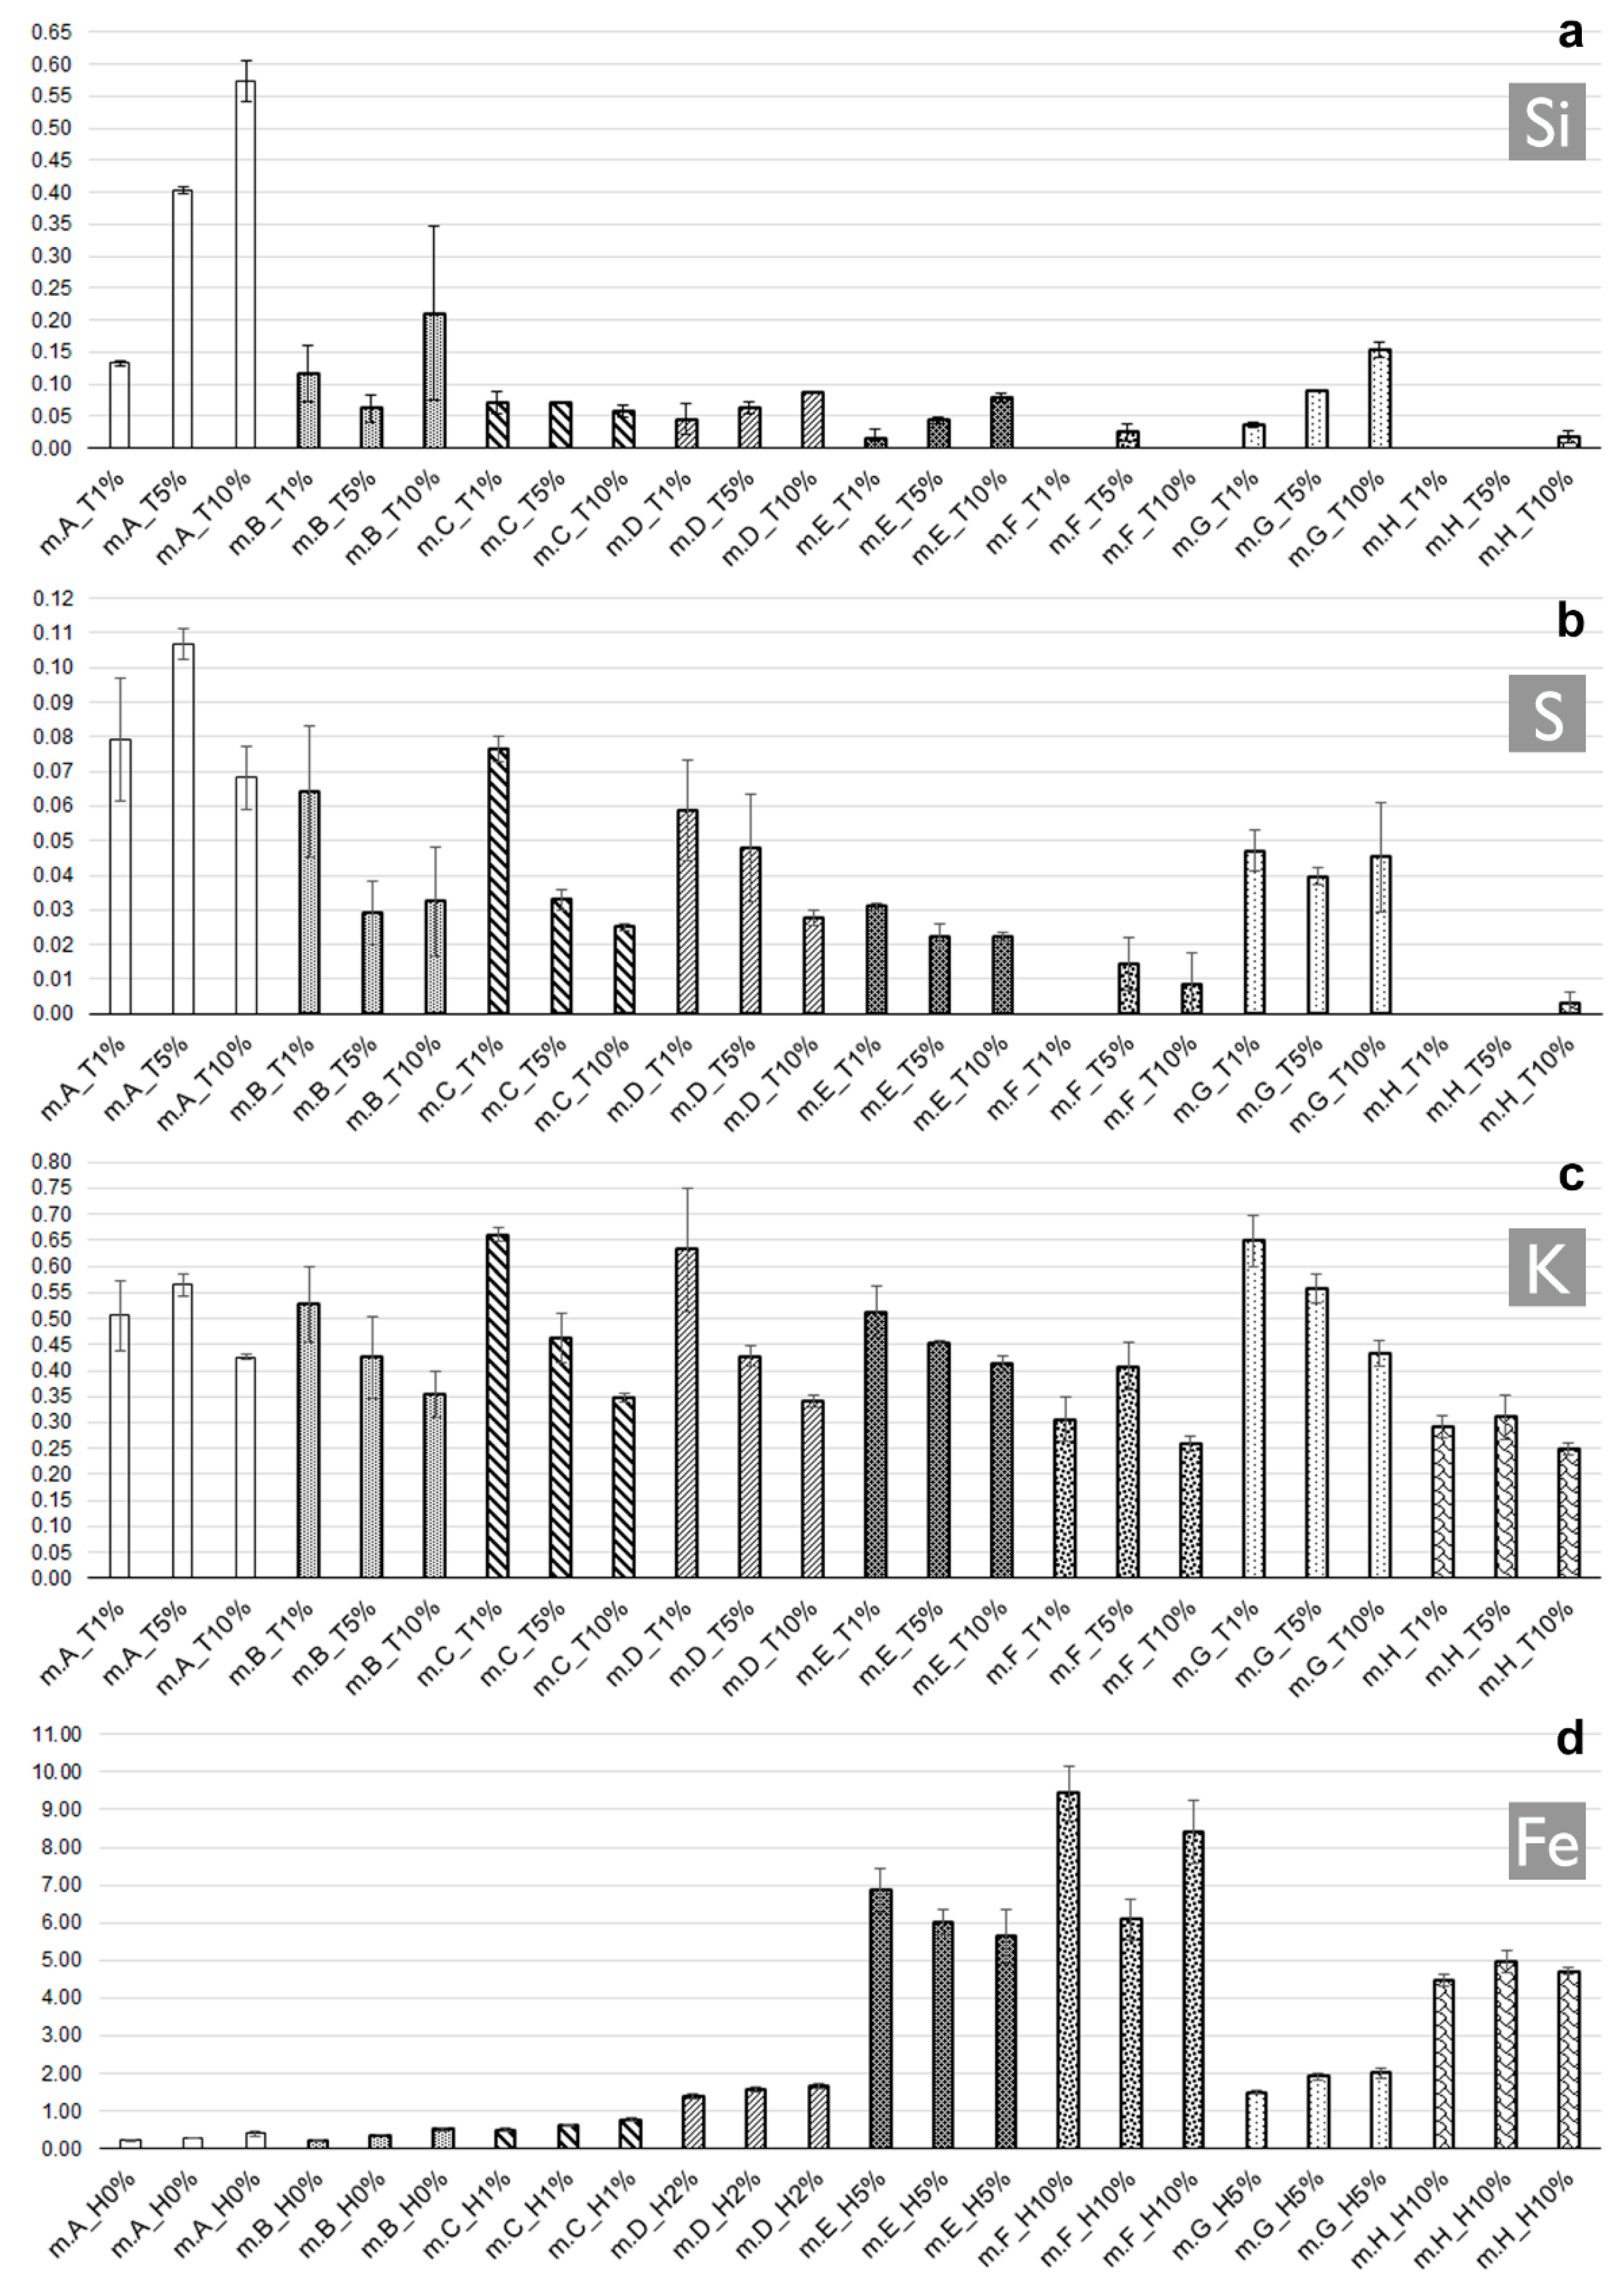
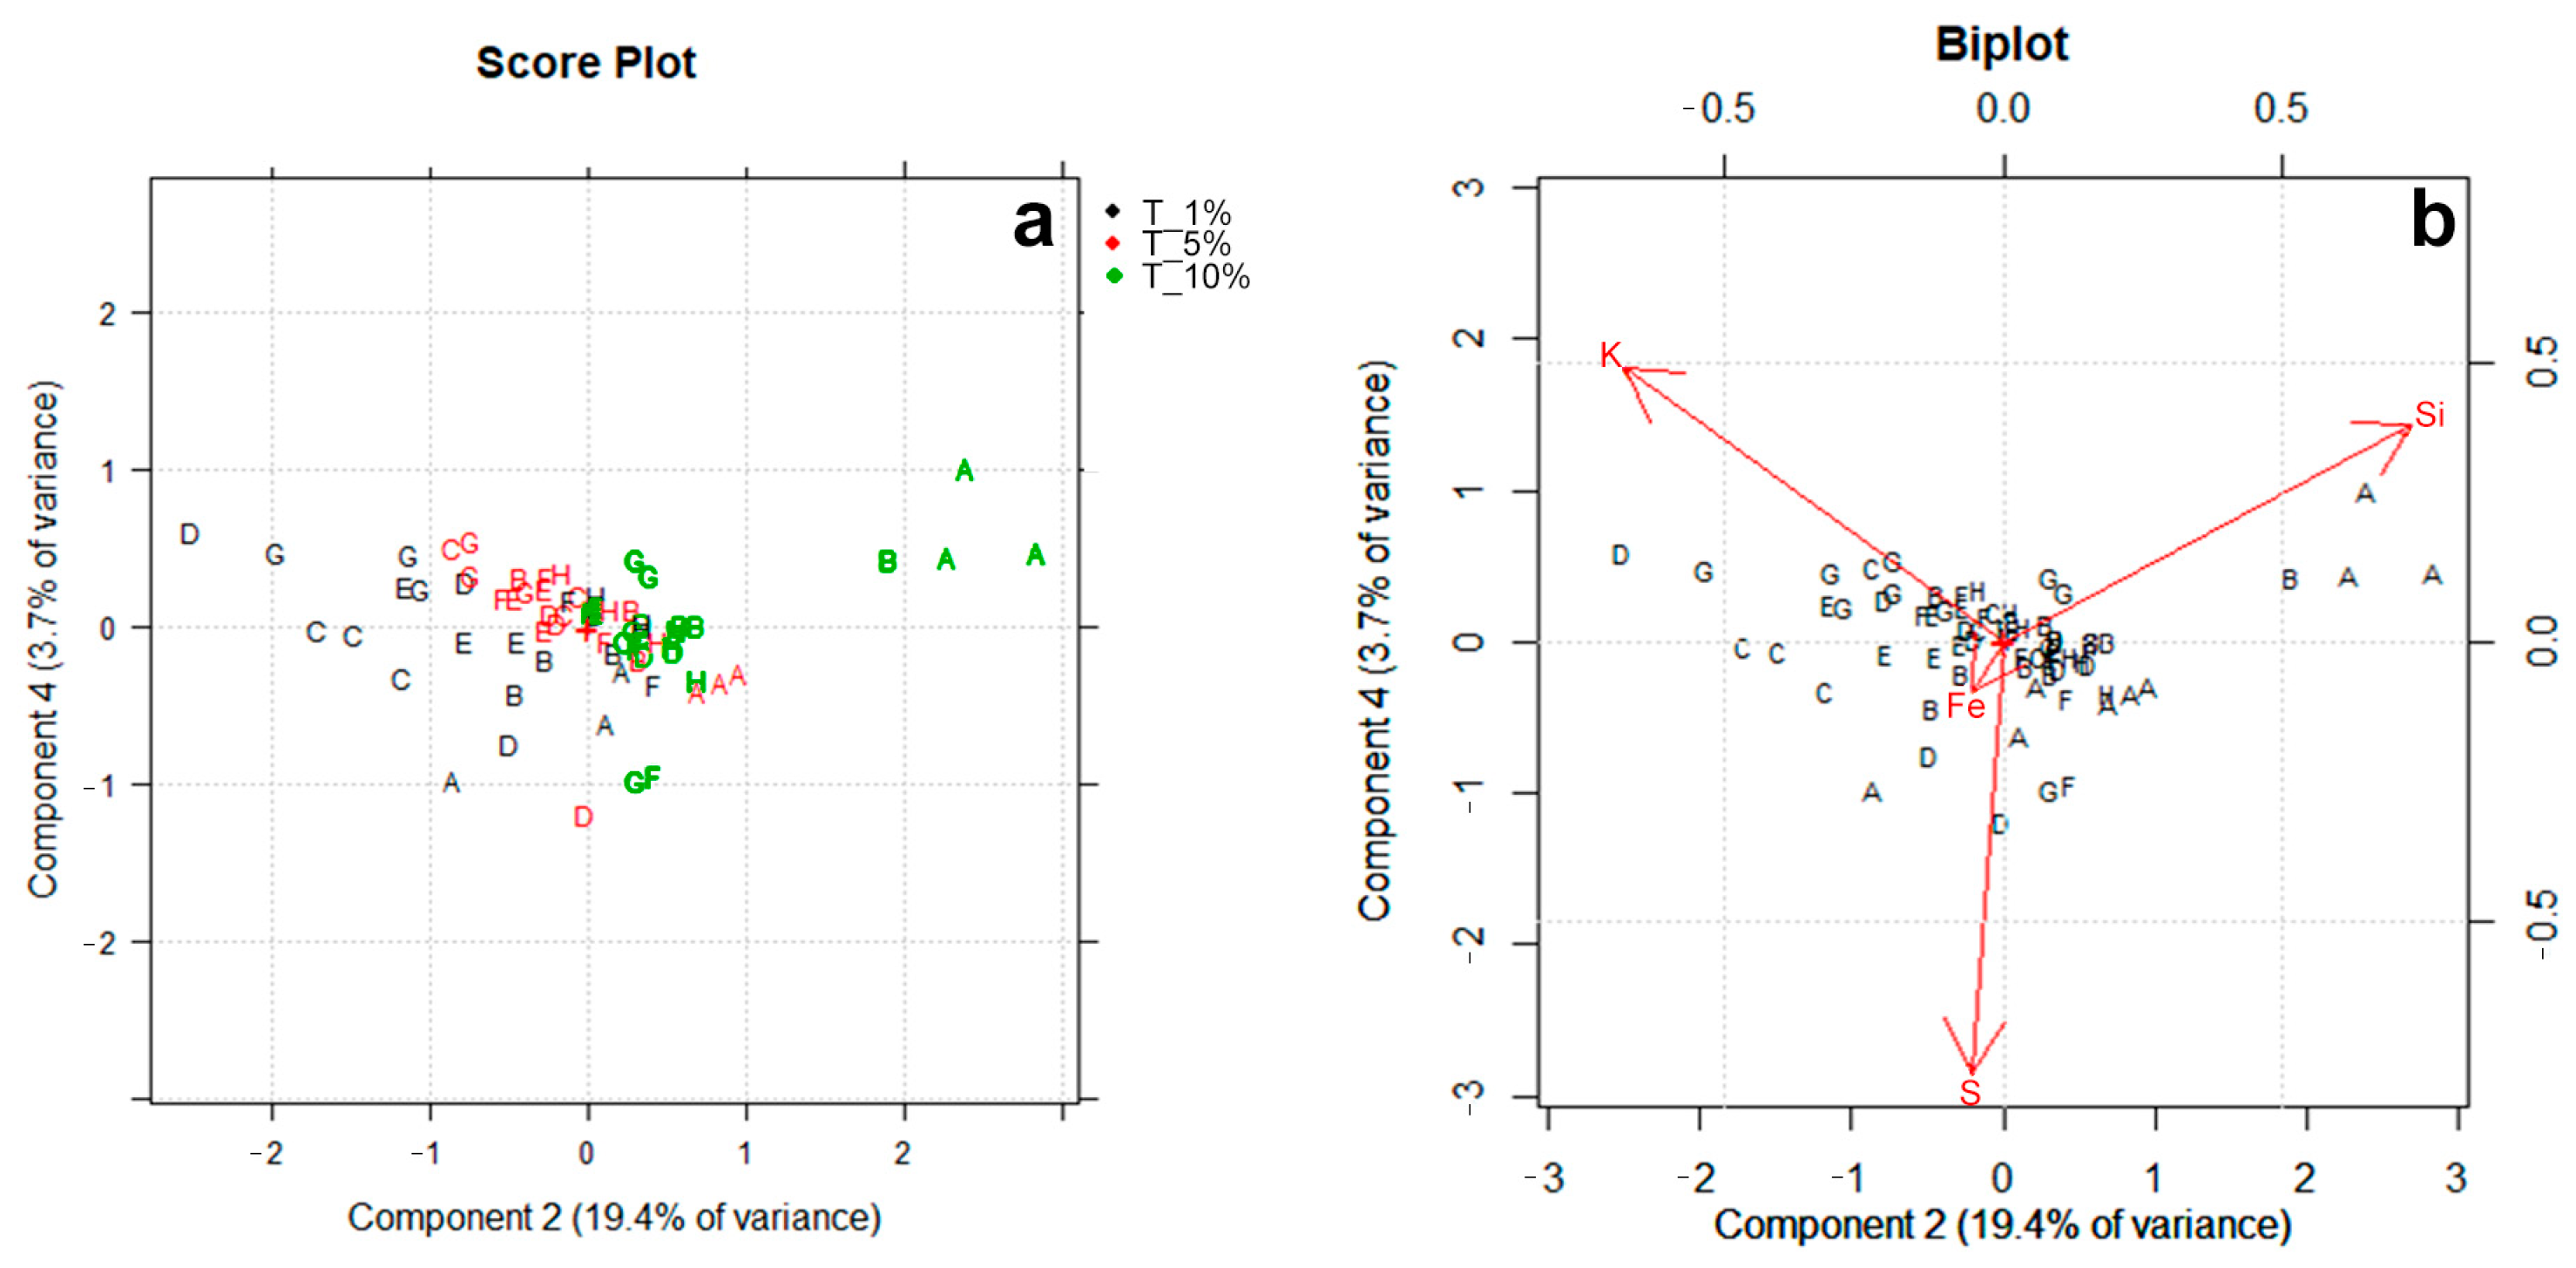
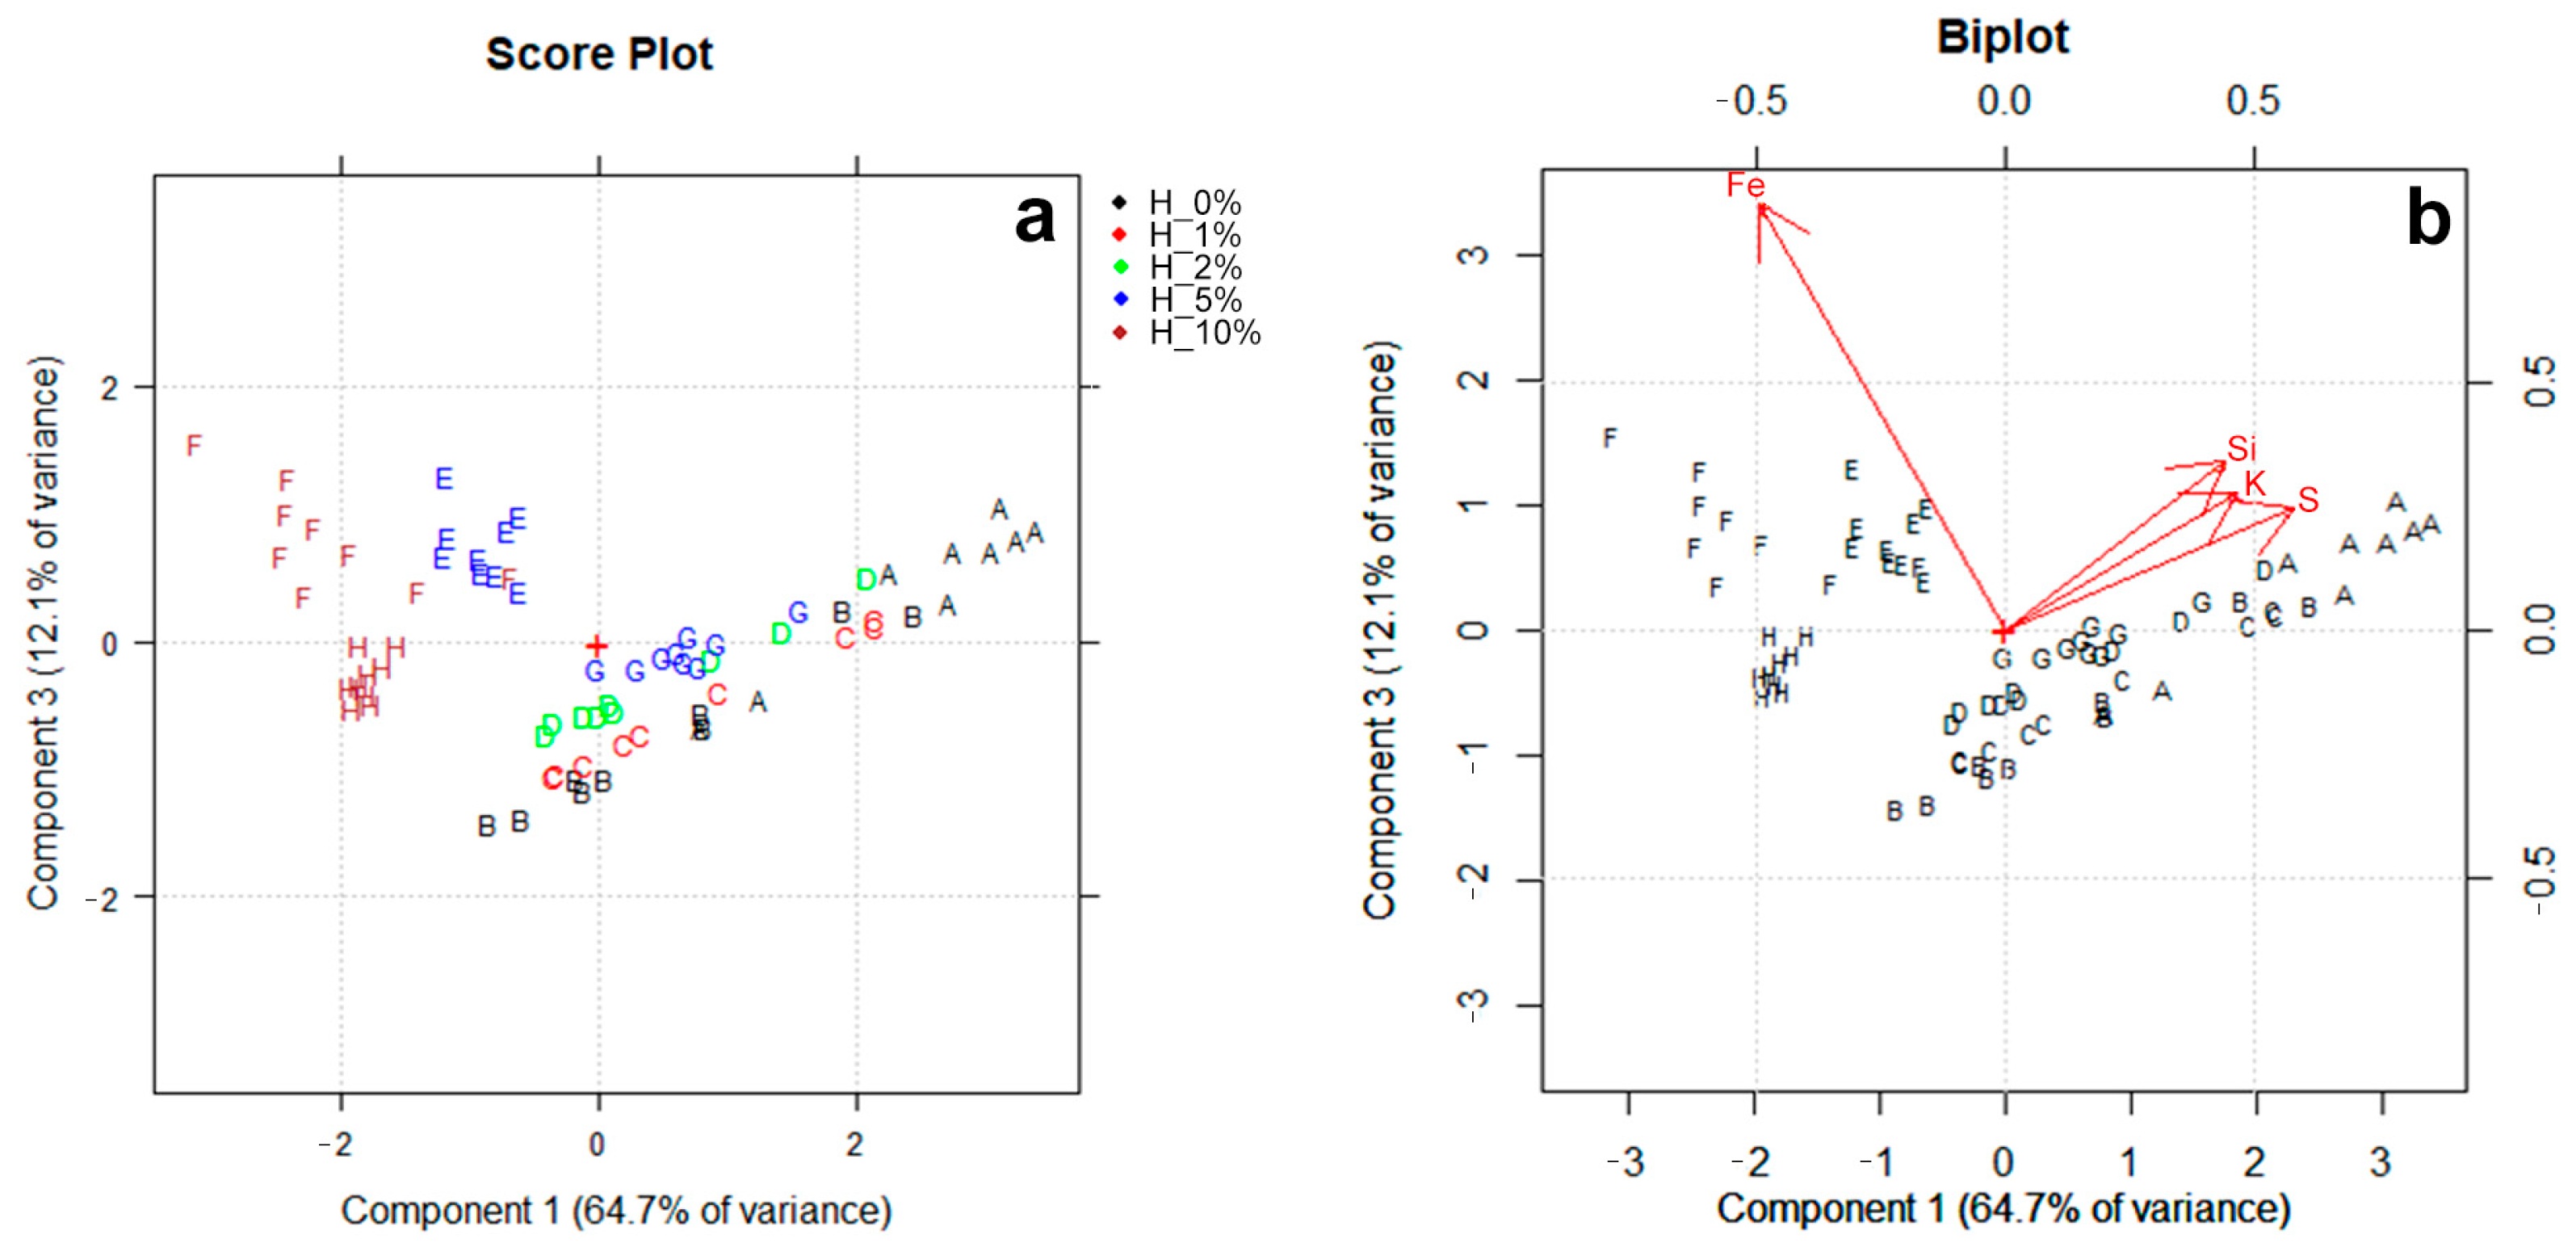
3.4. X-ray Fluorescence Spectroscopy

XRF investigation was aimed at observing the influence of the differently overlapped layers on the net area counts related to four chemical elements, namely Si (Kα = 1.740 keV), S (Kα = 2.309 keV), K (Kα = 3.314 keV), and Fe (Kα = 6.405 keV). These elements were selected because representative of the materials composing the mock-up stratigraphies (i.e., Si: talc; S and K: potassium caseinate; Fe: hematite; and, as an impurity, talc). The normalized values of the net area counts are reported in the Supplementary Materials (Table S1).
As regards Si (Figure 9a), XRF results highlighted a significant variation in the area counts within the mock-up set. In particular, high counts of Si were detected in m.A, where the ground is directly exposed, while its values significantly decreased nearly to the detection limit in m.B, m.C, m.D, m.E, and m.G, as a twofold consequence of the layer application on the ground and of the low atomic weight of silicon [4,66]. The 10% of Fe2O3 concentration in the paint layer (m.F), together with the superimposition of additional protective coats (m.H), then brought the counts of Si and S up to zero in the two mock-ups in exam (Figure 9a,b). Observing the elemental trends in relation to the talc concentration in the K-caseinate binder for each mock-up, moreover, a general increase in the Si-Kα line intensity (Figure 9a) was found and, complementarily, a decrease in the counts of S and K, both ascribed to the K-caseinate (Figure 9b,c): this behavior can be justified by the decrease in the amount of binder as the filler concentration increases in the mixture, and vice versa.
A more accurate picture was obtained by combining XRF spectral results with the PCA analysis. The PC2 versus PC4 scatter score plot (accounting for 23.1% of total variance) (Figure 10a) was chosen for representation in this work because it clearly reveals a separation of the objects on the basis of different talc concentrations in the K-caseinate binder. Positive PC2 score values are related to spectra collected on the areas with 10% of talc (Figure 10a, green objects) and, consequently, characterized by higher Si counts. Negative PC2 values are instead referred to spectra with increasing values of K, collected on the areas with 5% (Figure 10a, red objects) and 1% (Figure 10a, black objects) of talc in K-caseinate. As visible from the biplot in Figure 10b, objects with high Si counts are mainly scattered in the first quadrant, and those with progressively higher values of K are grouped in second and third quadrants.
XRF results related to Fe (Figure 9d) appeared to be strongly affected by the hematite concentration in the paint layer and by the presence of a protective film. In fact, the Fe-Kα line intensity progressively increased from m.C and m.D, respectively, with 1% and 2% of hematite in the paint film, up to m.E and m.F, where the concentration reaches, respectively, 5% and 10%. On the other hand, the presence of ca. 20 µm of protective coat dramatically affected the net area counts of the element: spectra recorded on m.G and m.H show Fe counts almost halved if compared to those collected, respectively, on the mock-ups m.E and m.F.
Exploring the PC1 versus PC3 scatter score plot (Figure 11a), which accounts 76.8% of the total variance, objects with negative PC1 and positive PC3 score values are well grouped in the second quadrant. These objects are characterized by higher Fe counts, as visible in the biplot of Figure 11b, and are related to m.E and m.F. As for the m.G group, the presence of a protective layer likely affected the PC score values: in this case, objects are grouped around the origin of axes, similarly to m.D. As visible in Figure 9d, it is worth noting that the net area counts of Fe in m.G and m.D are, in fact, comparable, although the concentration of Fe2O3 in m.G is much higher than that of m.D. In addition, for the mock-up m.H, the external uncolored varnish brought these objects at a certain distance from the group of m.E and m.F, falling in the third quadrant.
A final consideration concerns the mock-up m.C, characterized by 1% of hematite concentration in the paint layer: the XRF investigation was not able to clearly discriminate it from the non-pigmented mock-ups.

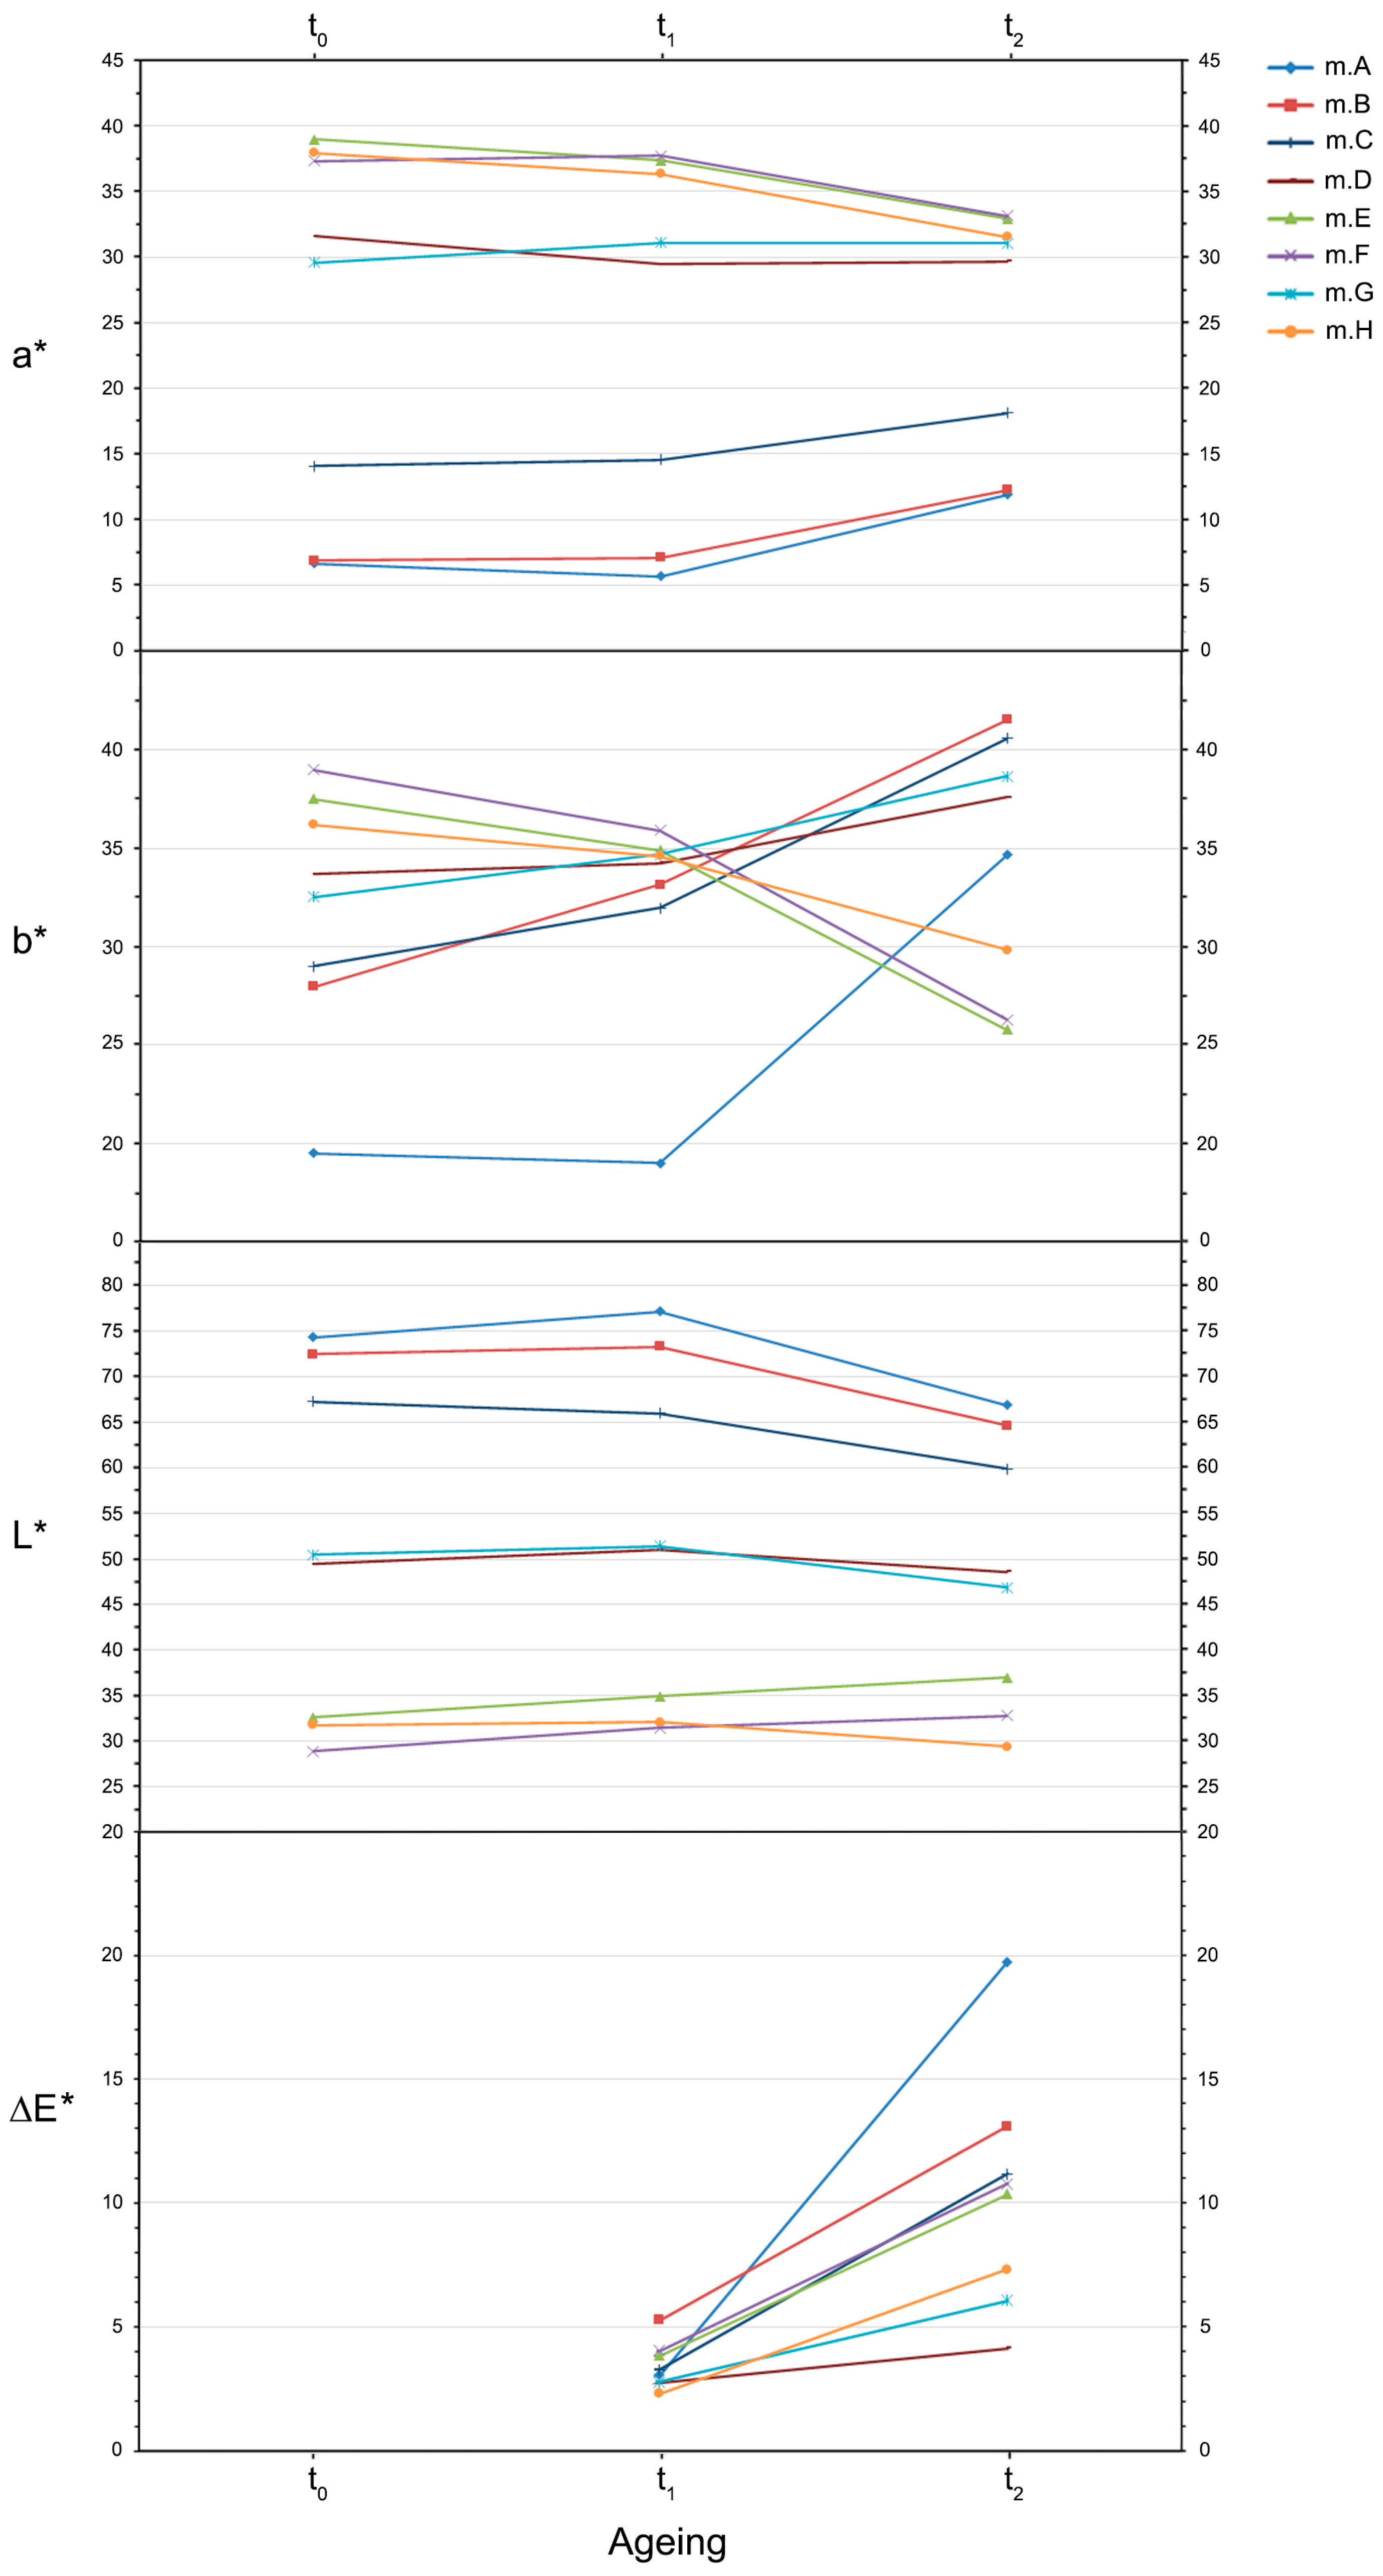
3.5. Artificial Aging

Figure 12 displays the time evolution of L*, a*, b* coordinates and the total color variation ΔE* as a function of the aging time of the layered mock-ups.
The mock-ups generally underwent the twofold effect of darkening and yellowing as a result of the decrease in L* and increase in b*, respectively. This effect was expected by the aging of oil- and colophony-based varnishes [67], representing one of the main conservation problems in paintings [68]. Interestingly, the behavior above described was also observed, in a marked way, in m.A, where neither the paint film nor the protective varnish are present: the wooden support was mostly responsible for the great variation recorded in m.A. In the light of this, we can suppose that the variations observed in the mock-ups with transparent or semi-transparent layers (i.e., m.B, m.C, and mD) partially derive from the underneath wood; likewise, in these stratigraphies the layers likely act as protective against more pronounced darkening and yellowing of the wood. Within the series characterized by negative ΔL* and positive Δb* variations, some mock-ups (namely m.A, m.B, m.C, and m.G) showed an increase in the a* values: these changes indicate a shift towards a brown-orange hue [67].
An opposite trend, instead, was found for those mock-ups (m.E and m.F) where the paint layer is directly exposed to air and its Fe2O3 concentration is high (5% and 10%, respectively): in these conditions, the simultaneous increase in L* and decrease in b* occurred. This effect, known as bleaching [67], cannot be attributed to the hematite pigment, due to its well-established stability under these conditions, but rather to the complex stratigraphic systems, as well.
Particular cases are finally represented by the mock-up m.D, which showed a discoloration behavior towards the yellow-green direction (increase in b* and decrease in a*), and by the mock-up m.H, where a* values increased and b* values decreased over time.
After 25 h of exposure, ΔE*t1–t0 varied between 2.3 and 5.3, with the minimum and maximum variations observed in m.H and m.B, respectively. The total colorimetric variation in m.B can be mainly ascribed to the b* increase, and, after an additional 400 h of aging, the further significant increment in b* and decrease in L* determined a value of ΔE*t2–t1 = 13.1 for this mock-up, with a total ΔE*t2–t0 = 16.6. The greatest total color variation between t1 and t2 aging stages, however, was observed in m.A (ΔE*t2–t1 = 19.7), with L* values varying from 77.2 to 66.9 and b* values from 19.0 to 34.7. As aforementioned, this important variation was attributed to the wood used as support of the stratigraphy. On the other hand, the mock-up m.D, which is the only one of the series that underwent a discoloration towards the yellow-green hue, was characterized by the minimum total color variation (ΔE*t2–t0 = 4.4), followed by m.G (ΔE*t2–t0 = 7.3) and m.H (ΔE*t2–t0 = 9.4). For the other mock-ups, the total variation of color is comprised between ca. 14 and 18.
The light-induced effects on the mock-up surface layers were evaluated during aging by the reflection FT-IR spectroscopy. In Figure 13, spectra collected on m.B and m.F were selected for representation in this work because representative of two different types of layer on the top of their stratigraphy: the pure linseed oil-colophony varnish, on one hand, and the same mixture with hematite pigment dispersed therein, on the other. The frequency shifts over time of the varnish bands, and their assignment, are listed in Table 3.
The infrared reflection study of the mock-ups was conducted on the spectra after the application of KKT. Although necessary for the analysis of organic bands, these transformations created artefacts between 4000 and 3000 cm−1 [69] and around 1000 cm−1, making undetectable the evolution of the varnish spectral behavior in those regions (respectively, related to the v(O–H) band and to the v(C–O) and δC–H bands, produced by colophony). In particular, the Reststrahlen band of talc at around 1000 cm−1, giving rise to the artefact when KKT is applied, is pronounced only in m.B (Figure 13); as shown in Figure 5, in fact, this signal turned out to be absent—or almost—in all the other mock-ups. From Figure 13, we can see that, after 25 h of exposure, the spectral profiles did not undergo any variation compared to those acquired on dried mock-ups. This evidence is true for all the mock-ups, whether the protective varnish or the paint layer is directly exposed to the air. After an additional 400 h of aging, significant qualitative variations were clearly revealed in all the mock-ups: the intensity of C–H bands at around 2900–2800 and 1460 cm−1 displayed a remarkable decrease, whereas the v(C=O) band increased in intensity and slightly broadened in shape. The intensity increase of v(C=O) band, in particular, appeared more pronounced in pure linseed oil-colophony mixture than in the pigmented varnish. Moreover, the bands in the v(C–O) region underwent a broadening effect and, just for the pure mixture, an increment in intensity. The spectral changes observed at t2 witness the photo-induced oxidation effects of oil-based varnishes, as described in Reference [67].

4. Conclusions

In the present work, we assessed strengths and limits of a totally non-invasive approach in the study of different wooden artefact stratigraphies properly prepared by varying specific parameters. Tomographic (OCT) and spectroscopic (reflection FT-IR, Raman, XRF) techniques were employed for this investigation and the collected data were analyzed through both the univariate and multivariate approaches. The non-invasive analysis was supported by microscopic observations of the cross-sections obtained from the mock-ups.
Subsequently, the effects of the progressive artificial solar exposure were non-invasively evaluated from chemical and chromatic points of view. After 425 h of aging, reflection FT-IR spectroscopy revealed spectral changes in band intensity and shape related to specific functional groups composing the surface layers, witnessing the photo-induced oxidation effects of oil-based varnishes. It is worth reporting that, for the first time, this technique was employed to monitor the chemical changes over time of an oil-colophony mixture applied to bulk material. In order to study complex mixtures as varnishes, in fact, the transmission or ATR modes are certainly to be preferred because they are more suitable to investigate band variations in both qualitative and quantitative terms. However, if the integrity of the object needs to be totally preserved, the use of non-invasive reflection techniques is mandatory, with all the drawbacks deriving from its application, such as distortions of band, baseline variations, or impossibility of using conventional databases for substance identification [48]. Meanwhile, colorimetry recorded yellowing and darkening effects of the wood support and varnishes, except for those mock-ups with the highest hematite concentrations at the top layer. Other chromatic effects were also singled out in some of the stratigraphies.
This multi-technique study would represent a significant first step towards the application of non-invasive and portable instrumentation to the stratigraphy of wooden works of art, such as paintings on panel, sculptures, musical instruments, and furniture. When approaching a wood artefact stratigraphy, information on number and thickness of the layers above support can be straightforwardly gathered, except in specific cases (see Table 2), by OCT. If tomographic techniques are not available, some indirect hypotheses could be drawn through the reflection FT-IR analysis of areas of the artwork at different states of preservation, that is to say, exposing different coats to air. The presence of inorganic fillers and pigments dispersed in the coating system can be visually detected in the OCT tomograms, with limitations mainly related to the instrumental properties, while the chemical identification of their nature is provided by FT-IR, Raman, and XRF spectroscopies according to the respective conditions reported in Table 2. Moreover, it is possible to obtain approximative information about the particle concentration by the OCT and XRF data. As for the organic binders, reflection FT-IR turned out to be the most suitable method for their investigation; Raman spectroscopy, in fact, is not able to reveal proteinaceous and oil-based layers with thicknesses of few tens of microns (explored up to about 50 µm). Finally, an indirect assumption on the presence of a size treatment can be made from the transparency of wood to the near-IR light by OCT, and, if the procedure involved the use of marker compounds, XRF allows one to advance further hypotheses.

Supplementary Materials

The following are available online at https://0-www-mdpi-com.brum.beds.ac.uk/2079-6412/11/1/29/s1, Figure S1: representative mock-up, after cutting, with the portion exposed to artificial solar aging highlighted, Table S1: estimate net area counts of Si, S, K, and Fe detected by XRF.

Author Contributions

Conceptualization, C.I. and M.M.; methodology, C.I., M.M., and D.B.; software, M.I., P.T., C.I., G.F., and M.V.; validation, C.I., G.F., P.T., M.I., A.P., M.V., M.L., M.M., and D.B.; investigation, C.I., G.F., P.T., M.I., and M.V.; resources, M.M. and M.L.; data curation, C.I., G.F., P.T., M.I., A.P., and M.V.; writing—original draft preparation, C.I., G.F., and M.M.; writing—review and editing, C.I., G.F., P.T., M.I., A.P., M.V., M.L., M.M., and D.B.; visualization, C.I. and G.F.; supervision, M.M. and D.B. All authors have read and agreed to the published version of the manuscript.

Funding

This research was funded by Fondazione Arvedi/Buschini. The OCT data were obtained within the Access to Research Infrastructures activity in the H2020 Program of the EU (IPERION CH No. 654028) and within research activities of H2020 Program of the EU (IPERION HS No. 871034).

Institutional Review Board Statement

Not applicable.

Informed Consent Statement

Not applicable.

Data Availability Statement

Data is contained within the article or Supplementary Materials.

Acknowledgments

The authors thank Claudio Canevari (Civica Scuola di Liuteria, Milano, Italy) for support generously offered in the preparation of the mock-ups.

Conflicts of Interest

The authors declare no conflict of interest.

References

  1. Nevin, A.; Sawicki, M. Heritage Wood: Investigation and Conservation of Art on Wood; Springer Nature Switzerland AG: Cham, Switzerland, 2019. [Google Scholar]
  2. Monaco, A.L.; Balletti, F.; Pelosi, C. Wood in cultural heritage. Properties and conservation of historical wooden artefacts. Eur. J. Sci. Theol. 2018, 14, 161–171. [Google Scholar]
  3. Echard, J.-P.; Thoury, M.; Berrie, B.H.; Séverin-Fabiani, T.; Vichi, A.; Didier, M.; Réfrégiers, M.; Bertrand, L. Synchrotron DUV luminescence micro-imaging to identify and map historical organic coatings on wood. Analyst 2015, 140, 5344–5353. [Google Scholar] [CrossRef] [PubMed]
  4. Invernizzi, C.; Fiocco, G.; Iwanicka, M.; Kowalska, M.; Targowski, P.; Blümich, B.; Rehorn, C.; Gabrielli, V.; Bersani, D.; Licchelli, M.; et al. Non-invasive mobile technology to study the stratigraphy of ancient Cremonese violins: OCT, NMR-MOUSE, XRF and reflection FT-IR spectroscopy. Microchem. J. 2020, 155, 104754. [Google Scholar] [CrossRef]
  5. Bersani, D.; Lottici, P.P.; Casoli, A.; Ferrari, M.; Lottini, S.; Cauzzi, D. Investigation on painting materials in “Madonna col Bambino e S. Giovannino” by Botticelli. In Lasers in the Conservation of Artworks; Springer Proceedings in Physics; Nimmrichter, J., Kautek, W., Schreiner, M., Eds.; Springer: Berlin/Heidelberg, Germany, 2007; Volume 116, pp. 383–390. [Google Scholar]
  6. Rizzo, A. Progress in the application of ATR-FTIR microscopy to the study of multi-layered cross-sections from works of art. Anal. Bioanal. Chem. 2008, 392, 47–55. [Google Scholar] [CrossRef]
  7. Fiocco, G.; Rovetta, T.; Invernizzi, C.; Albano, M.; Malagodi, M.; Licchelli, M.; Re, A.; Giudice, A.L.; Lanzafame, G.N.; Zanini, F.; et al. A Micro-tomographic insight into the coating systems of historical bowed string instruments. Coatings 2019, 9, 81. [Google Scholar] [CrossRef] [Green Version]
  8. Cennini, C. Il Libro dell’arte, o Trattato della Pittura di Cennino Cennini da Colle di Valdelsa; di Nuovo Pubblicato con Molte Correzioni e coll‛Aggiunta di Più Capitoti Tratti dai Codici Fiorentini, per cura di Gaetano e Carlo Milanesi; Felice Le-Monnier: Florence, Italy, 1859. [Google Scholar]
  9. Fioravanti, L. Compendio de i Secreti Rationali, di m. Leonardo Fiorauanti Bolognese, Medico, & Cirurgico. Diuiso in Cinque Libri. Opera non Meno Diletteuole, che Utile, alla Medicina, & Cirurgia, ad Alchimisti, a Quelle Donne, che si Dilettano di Belletti, & a Molte Altre Arti, & Essercitij. Con la Tauola de Tutti i Capitoli; Tarino, G.D.: Torino, Italy, 1592. [Google Scholar]
  10. Obataya, E. Effects of natural and artificial ageing on the physical and acoustic properties of wood in musical instruments. J. Cult. Herit. 2017, 27, S63–S69. [Google Scholar] [CrossRef] [Green Version]
  11. Ruscelli, G. Secreti di don Alessio piemontese nuouamente stampati. Con una Bellissima Aggiunta de’ Secreti Hauti da un Religioso Pratichissimo et Eccellente et Esperimentati; Vincenti Busdrago: Lucca, Italia, 1557. [Google Scholar]
  12. Lemery, N. Le Nouveau Recueil de Curiositez Rares & Nouvelles des plus Admirables Effets de la Nature & de l’art: Composé de Quantité de Beaux Secrets Galans & Autres dont quel-que uns ont été Tirez du Cabinet de feu Monsieur le Marquis de l’Hôpital. 1/Expérimentez & Composez par le Sieur d’Emery; Vander P.: Paris, France, 1685. [Google Scholar]
  13. Nagyvary, J.; Ehrman, J.M. The composite nature of the antique Italian varnish. Naturwissenschaften 1988, 75, 513–515. [Google Scholar] [CrossRef]
  14. Yamashiki, T.; Matsui, T.; Saitoh, M.; Okajima, K.; Kamide, K.; Sawada, T. Characterisation of cellulose treated by the steam explosion method. Part 1: Influence of cellulose resources on changes in morphology, degree of polymerisation, solubility and solid structure. Brit. Polym. J. 1990, 22, 73–83. [Google Scholar] [CrossRef]
  15. Nakano, T.; Sugiyama, J.; Norimoto, M. Contractive force and transformation of microfibril with aqueous sodium hydroxide solution for wood. Holzforschung 2000, 54, 315–320. [Google Scholar] [CrossRef]
  16. Colombini, M.P.; Lucejko, J.J.; Modugno, F.; Orlandi, M.; Tolppa, E.-L.; Zoia, L. A multi-analytical study of degradation of lignin in archaeological waterlogged wood. Talanta 2009, 80, 61–70. [Google Scholar] [CrossRef]
  17. Weigl, M.; Pöckl, J.; Grabner, M. Selected properties of gas phase ammonia treated wood. Eur. J. Wood Wood Prod. 2009, 67, 103–109. [Google Scholar] [CrossRef]
  18. Čermák, P.; Dejmal, A. The effect of heat and ammonia treatment on colour response of oak wood (Quercus robur) and comparison of some physical and mechanical properties. Maderas-Cienc. Tecnol. 2013, 15, 375–389. [Google Scholar] [CrossRef]
  19. Tamburini, D.; Łucejko, J.-J.; Ribechini, E.; Colombini, M.-P. Snapshots of lignin oxidation and depolymerization in archaeological wood: An EGA-MS study. J. Mass Spectrom. 2015, 50, 1103–1113. [Google Scholar] [CrossRef]
  20. Norgate, E. Miniatura or the Art of Limning; Yale University Press: London, UK, 1997. [Google Scholar]
  21. Brandmair, B.; Greiner, S.-P. Stradivari Varnish: Scientific Analysis of His Finishing Technique on Selected Instruments; Serving Audio: London, UK; Munich, Germany, 2010. [Google Scholar]
  22. Mayerne, T.T.D. Pictoria Sculptoria & Quae Subalternarum Artium, 1620: Le Manuscrit de Turquet de Mayerne; Audin: Lyon, France, 1974. [Google Scholar]
  23. Michelman, J. Preliminary treatment of the wood. In Violin Varnish A Plausible Re-creation of the Varnish Used by the Italian Violin Makers Between the Years 1550 and 1750, A.D.; Michelman, J., Ed.; Joseph Michelman: Cincinnati, OH, USA, 1946. [Google Scholar]
  24. Beal, M. A Study of Richard Symonds: His Italian Notebooks and Their Relevance to Seventeenth Century-Painting Techniques; Garland: New York, NY, USA; London, UK, 1984. [Google Scholar]
  25. Tai, B.H. Stradivari’s varnish a review of scientific findings—Part I. J. Violin Soc. Am. VSA Papers 2007, XXI, 119–144. [Google Scholar]
  26. Bertrand, L.; Robinet, L.; Cohen, S.X.; Sandt, C.; Hô, A.-S.L.; Soulier, B.; Lattuati-Derieux, A.; Echard, J.-P. Identification of the finishing technique of an early eighteenth century musical instrument using FTIR spectromicroscopy. Anal. Bioanal. Chem. 2010, 399, 3025–3032. [Google Scholar] [CrossRef]
  27. Viguerie, L.D.; Pladevall, N.O.; Lotz, H.; Freni, V.; Fauquet, N.; Mestre, M.; Walter, P.; Verdaguer, M. Mapping pigments and binders in 15th century Gothic works of art using a combination of visible and near infrared hyperspectral imaging. Microchem. J. 2020, 155, 104674. [Google Scholar] [CrossRef]
  28. Stoner, J.H.; Rushfield, R. Conservation of Easel Paintings; Routledge: London, UK; New York, NY, USA, 2013. [Google Scholar]
  29. Invernizzi, C.; Daveri, A.; Rovetta, T.; Vagnini, M.; Licchelli, M.; Cacciatori, F.; Malagodi, M. A multi-analytical non-invasive approach to violin materials: The case of Antonio Stradivari “Hellier” (1679). Microchem. J. 2016, 124, 743–750. [Google Scholar] [CrossRef]
  30. Fiocco, G.; Invernizzi, C.; Grassi, S.; Davit, P.; Albano, M.; Rovetta, T.; Stani, C.; Vaccari, L.; Malagodi, M.; Licchelli, M.; et al. Reflection FTIR spectroscopy for the study of historical bowed string instruments: Invasive and non-invasive approaches. Spectrochim. Acta A 2021, 245, 118926. [Google Scholar] [CrossRef]
  31. Monaco, A.L.; Mattei, E.; Pelosi, C.; Santancini, M. The scientific investigation for the study and conservation of the wooden model of S. Maria della Consolazione’s church (Todi, Italy). J. Cult. Herit. 2013, 14, 537–543. [Google Scholar] [CrossRef]
  32. Kuckova, S.; Sandu, I.C.A.; Crhova, M.; Hynek, R.; Fogas, I.; Muralha, V.S.; Sandu, A.V. Complementary cross-section based protocol of investigation of polychrome samples of a 16th century Moravian sculpture by optical, vibrational and mass spectrometric techniques. Microchem. J. 2013, 110, 538–544. [Google Scholar] [CrossRef]
  33. Echard, J.-P.; Bertrand, L. Complementary spectroscopic analyses of varnishes of historical musical instruments. Spectrosc. Eur. 2010, 22, 12–13. [Google Scholar]
  34. Fiocco, G.; Rovetta, T.; Gulmini, M.; Piccirillo, A.; Licchelli, M.; Malagodi, M. Spectroscopic analysis to characterize finishing treatments of ancient bowed string instruments. Appl. Spectrosc. 2017, 71, 2477–2487. [Google Scholar] [CrossRef]
  35. Rovetta, T.; Invernizzi, C.; Fiocco, G.; Albano, M.; Licchelli, M.; Gulmini, M.; Alf, G.; Fabbri, D.; Rombolà, A.; Malagodi, M. The case of Antonio Stradivari 1718 ex-San Lorenzo violin: History, restorations and conservation perspectives. J. Archaeol. Sci. Rep. 2019, 23, 443–450. [Google Scholar] [CrossRef] [Green Version]
  36. Erhardt, D.; Tumosa, C.S.; Mecklenburg, M.F. Long-term chemical and physical processes in oil paint films. Stud. Conserv. 2005, 50, 143–150. [Google Scholar] [CrossRef]
  37. Malecki, V. Les recettes anciennes: Sources bibliographiques originales. In Proceedings of the Journée d’étude: Les Vernis de Violon, Cité de la Musique, Paris, France, 17 June 2006; pp. 4–11. (In French). [Google Scholar]
  38. Tripier-Deveaux, A.M. Traité Théorique et Pratique sur l’Art de Faire les Vernis: Suivi de deux Mémoires, l’un Sur les Dangers qui Menacent les Peintures Vernies d’Extérieurs, l’Autre Sur les Précautions à Prendre Pour Assurer aux Revernissages la Même Durée qu’aux Vernissages Faits sur les Peintures Fraîches; Mathias, L.: Paris, France, 1845. [Google Scholar]
  39. Invernizzi, C.; Daveri, A.; Vagnini, M.; Malagodi, M. Non-invasive identification of organic materials in historical stringed musical instruments by reflection infrared spectroscopy: A methodological approach. Anal. Bioanal. Chem. 2017, 409, 3281–3288. [Google Scholar] [CrossRef]
  40. Doménech-Carbó, M.T. Novel analytical methods for characterising binding media and protective coatings in artworks. Anal. Chim. Acta 2008, 621, 109–139. [Google Scholar] [CrossRef]
  41. Setragno, F.; Zanoni, M.; Antonacci, F.; Sarti, A.; Malagodi, M.; Rovetta, T.; Invernizzi, C. Feature-based analysis of the impact of ground coat and varnish on violin tone qualities. Acta Acust. United Acust. 2017, 103, 80–93. [Google Scholar] [CrossRef]
  42. Bruzzone, R.; Galassi, M.C. Wood species in Italian panel paintings of the fifteenth and sixteenth centuries: Historical investigation and microscopical wood identification. In Studying Old Master Paintings. Technology and Practice; Archetype Publications: London, UK, 2011; Volume 311, pp. 253–259. [Google Scholar]
  43. Fichera, G.V.; Albano, M.; Fiocco, G.; Invernizzi, C.; Licchelli, M.; Malagodi, M.; Rovetta, T. Innovative monitoring plan for the preventive conservation of historical musical instruments. Stud. Conserv. 2018, 63, 351–354. [Google Scholar] [CrossRef]
  44. Iwanicka, M.; Lanterna, G.; Lalli, C.G.; Innocenti, F.; Sylwestrzak, M.; Targowski, P. On the application of Optical Coherence Tomography as a complimentary tool in an analysis of the 13th century Byzantine Bessarion reliquary. Microchem. J. 2016, 125, 75–84. [Google Scholar] [CrossRef]
  45. Iwanicka, M.; Sylwestrzak, M.; Targowski, P. Optical Coherence Tomography (OCT) for examination of artworks. In Advanced Characterization Techniques, Diagnostic Tools and Evaluation Methods in Heritage Science; Bastidas, D.M., Cano, E., Eds.; Springer Nature Switzerland AG: Cham, Switzerland, 2018; pp. 49–59. [Google Scholar]
  46. Targowski, P.; Kowalska, M.; Sylwestrzak, M.; Iwanicka, M. OCT for examination of cultural heritage objects. In Optical Coherence Tomography and Its Non-Medical Applications; Wang, M.R., Ed.; IntechOpen: London, UK; Rijeka, Croatia, 2020; pp. 147–164. [Google Scholar]
  47. Targowski, P.; Iwanicka, M. Optical coherence tomography: Its role in the non-invasive structural examination and conservation of cultural heritage objects—A review. Appl. Phys. A 2011, 106, 265–277. [Google Scholar] [CrossRef] [Green Version]
  48. Invernizzi, C.; Rovetta, T.; Licchelli, M.; Malagodi, M. Mid and near-infrared reflection spectral database of natural organic materials in the cultural heritage field. Int. J. Anal. Chem. 2018, 2018, 7823248. [Google Scholar] [CrossRef] [PubMed]
  49. Cooper, J.; Abdelkader, M.F.; Wise, K. Method and Apparatus for Acquiring Raman Spectra without Background Interferences. U.S. Pantent 8570507, 29 October 2013. Available online: https://patents.google.com/patent/US8570507B1/en (accessed on 28 December 2020).
  50. Cooper, J.B.; Abdelkader, M.; Wise, K.L. Sequentially shifted excitation Raman spectroscopy: Novel algorithm and instrumentation for fluorescence-free Raman spectroscopy in spectral space. Appl. Spectrosc. 2013, 67, 973–984. [Google Scholar] [CrossRef] [PubMed]
  51. Cooper, J.B.; Marshall, S.; Jones, R.; Abdelkader, M.; Wise, K.L. Spatially compressed dual-wavelength excitation Raman spectrometer. Appl. Opt. 2014, 53, 3333. [Google Scholar] [CrossRef]
  52. Mantler, M.; Willis, J.P.; Lachance, G.R.; Vrebos, B.A.R.; Mauser, K.E.; Kawahara, N.; Rousseau, R.M.; Brouwer, P.N. Quantitative analysis. In Handbook of Practical X-ray Fluorescence Analysis, 1st ed.; Beckhoff, B., Kanngießer, B., Langhoff, N., Wedell, R., Wolff, H., Eds.; Springer: Berlin, Germany, 2006; pp. 309–410. [Google Scholar]
  53. Glinsman, L.D. The practical application of air-path X-ray fluorescence spectrometry in the analysis of museum objects. Stud. Conserv. 2005, 50, 3–17. [Google Scholar] [CrossRef]
  54. Bro, R.; Smilde, A.K. Principal component analysis. Anal. Methods 2014, 6, 2812–2831. [Google Scholar] [CrossRef] [Green Version]
  55. Grassi, S.; Fiocco, G.; Invernizzi, C.; Rovetta, T.; Albano, M.; Davit, P.; Gulmini, M.; Stani, C.; Vaccari, L.; Licchelli, M.; et al. Managing complex synchrotron radiation FTIR micro-spectra from historic bowed musical instruments by chemometrics. In Proceedings of the 2019 IMEKO TC-4 International Conference on Metrology for Archaeology and Cultural Heritage, Florence, Italy, 4–6 December 2019; pp. 114–119. [Google Scholar]
  56. Fiocco, G.; Grassi, S.; Invernizzi, C.; Rovetta, T.; Albano, M.; Davit, P.; Gulmini, M.; Stani, C.; Vaccari, L.; Licchelli, M.; et al. Chemometric tools to investigate complex Synchrotron radiation FTIR micro-spectra: Focus on historical bowed musical instruments. Acta IMEKO 2020, in press. [Google Scholar]
  57. CAT (Chemometric Agile Tool). Available online: http://gruppochemiometria.it/index.php/software (accessed on 15 May 2020).
  58. Poggialini, F.; Fiocco, G.; Campanella, B.; Legnaioli, S.; Palleschi, V.; Iwanicka, M.; Targowski, P.; Sylwestrzak, M.; Invernizzi, C.; Rovetta, T.; et al. Stratigraphic analysis of historical wooden samples from ancient bowed string instruments by laser induced breakdown spectroscopy. J. Cult. Herit. 2020, 44, 275–284. [Google Scholar] [CrossRef]
  59. Stuart, B. Infrared Spectroscopy: Fundamentals and Applications; John Wiley & Sons: West Sussex, UK, 2004. [Google Scholar]
  60. Invernizzi, C.; Fichera, G.V.; Licchelli, M.; Malagodi, M. A non-invasive stratigraphic study by reflection FT-IR spectroscopy and UV-induced fluorescence technique: The case of historical violins. Microchem. J. 2018, 138, 273–281. [Google Scholar] [CrossRef]
  61. Farmer, V.C. The infra-red spectra of talc, saponite, and hectorite. Mineral. Mag. J. M. Soc. 1958, 31, 829–845. [Google Scholar] [CrossRef]
  62. Salisbury, J.; Walter, L.S.; Vergo, N. Mid-Infrared (2.1-25 um) Spectra of Minerals, 1st ed.; U.S. Geological Survey: Reston, VA, USA, 1987.
  63. Miliani, C.; Rosi, F.; Daveri, A.; Brunetti, B.G. Reflection infrared spectroscopy for the non-invasive in situ study of artists’ pigments. Appl. Phys. A 2011, 106, 295–307. [Google Scholar] [CrossRef]
  64. Bikiaris, D.; Daniilia, S.; Sotiropoulou, S.; Katsimbiri, O.; Pavlidou, E.; Moutsatsou, A.; Chryssoulakis, Y. Ochre-differentiation through micro-Raman and micro-FTIR spectroscopies: Application on wall paintings at Meteora and Mount Athos, Greece. Spectrochim. Acta A 2000, 56, 3–18. [Google Scholar] [CrossRef]
  65. Košařová, V.; Hradil, D.; Němec, I.; Bezdička, P.; Kanický, V. Microanalysis of clay-based pigments in painted artworks by the means of Raman spectroscopy. J. Raman. Spectrosc. 2013, 44, 1570–1577. [Google Scholar] [CrossRef]
  66. Fiocco, G.; Rovetta, T.; Gulmini, M.; Piccirillo, A.; Canevari, C.; Licchelli, M.; Malagodi, M. Approaches for detecting madder lake in multi-layered coating systems of historical bowed string instruments. Coatings 2018, 8, 171. [Google Scholar] [CrossRef] [Green Version]
  67. Ciofini, D.; Striova, J.; Camaiti, M.; Siano, S. Photo-oxidative kinetics of solvent and oil-based terpenoid varnishes. Polym. Degrad. Stabil. 2016, 123, 47–61. [Google Scholar] [CrossRef] [Green Version]
  68. Colombini, M.; Modugno, F.; Giannarelli, S.; Fuoco, R.; Matteini, M. GC-MS characterization of paint varnishes. Microchem. J. 2000, 67, 385–396. [Google Scholar] [CrossRef]
  69. Daher, C.; Pimenta, V.; Bellot-Gurlet, L. Towards a non-invasive quantitative analysis of the organic components in museum objects varnishes by vibrational spectroscopies: Methodological approach. Talanta 2014, 129, 336–345. [Google Scholar] [CrossRef] [Green Version]
Figure 1. Schematic representation of the mock-ups, with their multi-layered coating systems. * Size treatment: completely penetrated the wood. ** Ground coat: different black point abundances indicate different concentrations of talc in potassium caseinate (respectively, 1%, 5%, 10%). *** Uncolored varnish: top position in m.B, m.G, and m.H (protective coating), intermediate position in m.C, m.D, m.E, and m.F (documented in bowed string musical instrument stratigraphies).
Coatings 11 00029 g001
Figure 2. Optical Coherence Tomography (OCT) analysis of the mock-ups: m.H (a) and m.F (b) in correspondence of the areas with talc concentration of 1%, and m.D (c) in correspondence of the area with talc concentration of 10%. Arrows indicate the stratigraphic layers (V: uncolored varnish, P: paint layer, G: ground coat). In (b), the layers G and V, as well as the lower boundary of P, are not defined for the reasons explained in the text.
Coatings 11 00029 g002
Figure 3. BSE-SEM images of the mock-up m.D (a), with hematite (b) and talc (c) particles at higher magnifications highlighted in red rectangles. Letters refer to the stratigraphic layers (P: paint layer, V: uncolored varnish, G: ground coat, W: wood).
Coatings 11 00029 g003
Figure 4. OCT analysis of the mock-ups: m.C (a), m.D (b), and m.F (c), with the paint layer characterized by increasing concentrations of hematite (respectively, H1%, H2%, H10%, where the letter H stands for hematite), and of the mock-up m.A (df), with the ground coat characterized by increasing concentrations of talc (respectively, T1%, T5%, T10%, where the letter T stands for talc). Arrows indicate the stratigraphic layers (V: uncolored varnish, P: paint layer, G: ground coat). In (c) the layers G and V, as well as the lower boundary of P, are not defined for the reasons explained in the text.
Coatings 11 00029 g004
Figure 5. Representative reflection FT-IR spectra collected on the mock-ups in correspondence of the areas characterized by talc concentration in the ground of 1%. The spectra after (a) and before (b) Kramers-Kronig (KK) transformations are displayed for the study of organic and inorganic compounds, respectively. Marker bands of K-caseinate (asterisk), talc (dotted line and rectangle), and hematite (round) are highlighted.
Coatings 11 00029 g005
Figure 6. Results of the principal component analysis (PCA) performed on the reflection FT-IR spectral dataset in the range 1400–400 cm−1: PC1 versus PC2 scatter score plot (a) and its magnification in correspondence of the region enclosed in the dotted rectangle (b). Letters indicate the mock-ups under investigation; colors highlight different hematite concentrations in the paint layer as reported in the legend (i.e., H_0%, H_1%, H_2%, H_5%, and H_10%, where the letter H stands for hematite).
Coatings 11 00029 g006
Figure 7. Results of the principal component analysis (PCA) performed on the reflection FT-IR spectral dataset in the range 1400–400 cm−1: loading plot of PC1 and PC2.
Coatings 11 00029 g007
Figure 8. Representative Raman spectra collected on the mock-ups in correspondence of the areas characterized by talc concentration in the ground of 1%. Marker bands of hematite (red dotted line) are highlighted.
Coatings 11 00029 g008
Figure 9. Net area count estimation of the peak Kα of Si (a), S (b), K (c), and Fe (d) detected by X-ray Fluorescence (XRF), with the related Standard Deviation of Mean (SDOM). Each bar corresponds to the average of three measurements, normalized to the mean value, calculated on the whole dataset, of the net area counts of the coherent scattering peak (Kα) of Rh. For all the elements investigated, the three bars per mock-up correspond to the areas with different talc concentrations (T1%, T5%, T10%, where the letter T stands for talc), as highlighted in the X-axis labels of graphs (ac). In graph (d), the x-axis labels highlight the different hematite concentrations (H0%, H1%, H2%, H5%, H10%, where the letter H stands for hematite). Numerical values are reported in Table S1.
Coatings 11 00029 g009
Figure 10. Results of the principal component analysis (PCA) performed on the XRF spectral dataset: PC2 versus PC4 scatter score plot (a) and the related biplot (b). Letters in (a,b) indicate the mock-ups under investigation; colors in (a) highlight different talc concentrations in the ground as reported in the legend (i.e., T_1%, T_5%, and T_10%, where the letter T stands for talc).
Coatings 11 00029 g010
Figure 11. Results of the principal component analysis (PCA) performed on the XRF spectral dataset: PC1 versus PC3 scatter score plot (a) and the related biplot (b). Letters in (a,b) indicate the mock-ups under investigation; colors in (a) highlight different hematite concentrations in the paint layer as reported in the legend (i.e., H_0%, H_1%, H_2%, H_5%, H_10%, where the letter H stands for hematite).
Coatings 11 00029 g011
Figure 12. L*, a*, b* coordinates of the mock-ups as a function of the aging time. The calculated values ΔE*t1–t0 and ΔE*t2–t1 are reported in correspondence with the x-axis labels t1 and t2, respectively.
Coatings 11 00029 g012
Figure 13. Representative reflection FT-IR spectra, after KK transformations, collected on the mock-ups m.B (a) and m.F (b) at different aging times: t0 (dried), t1 (25 h), t2 (425 h). Arrows indicate the main change observed and discussed in the text.
Coatings 11 00029 g013
Table 1. Thickness measurements (µm) of the different stratigraphic levels of the mock-ups (n.d. not detected). Approximate values are reported, with total thickness calculated for each coating system.
Stratigraphic
Level
Mock-Up
m.Am.Bm.Cm.Dm.Em.Fm.Gm.H
Size Treatment *n.d.n.d.n.d.n.d.n.d.n.d.n.d.n.d.
Ground coat55555555
Uncolored varnish ***20 **1010101020 **20 **
Paint layer202020202020
Total thickness525353535354545
* Size treatment: completely penetrated the wood. ** The thickness of 20 µm is the result of two varnish applications (10 µm thick each). *** Uncolored varnish: external position in m.B, m.G, and m.H (protective coating), intermediate position between ground coat and paint layer in m.C, m.D, m.E, and m.F.
Table 2. Summary of the potential and limits of different non-invasive techniques applied to the study of the dried mock-ups (t0) investigated in this work.
Analytical TechniquePotentialLimits
OCT
Discrimination of layers above the wood in terms of number and thickness
Non-discrimination of adjacent layers above the wood in the following specific cases: (i) comparable intensity of light scattering at particles dispersed in the layers; (ii) close in time applications of transparent layers characterized by the same refractive index; (iii) layer with very high concentration of particles concealing visibility of a thin transparent undercoat
Indirect assumption about the presence of size layer from the wood transparency to the near-IR light
Non-discrimination of size layer into the wood
Detection of particles
Non-discrimination of individual particles in semi-scattering and scattering layers in the following specific cases: (i) size and average distance among particles lower than the lateral resolution of the instrument; (ii) uniformity of dispersion
Size of dots (speckles) depending on coherence properties of probing light and instrument’s optics rather than the actual size of particles in case of layers scattering light weakly or moderately
Discrimination of different particle concentrations
Apparent scattering properties of given strata may depend on scattering properties of upper layers
Reflection FT-IR spectroscopy
Identification of proteinaceous components in the ground in case of its direct exposition to air
Non-identification of proteinaceous components in the ground in presence of overlying layers with minimum thickness of 20 µm (minimum value for uncolored oil-colophony varnish)
Identification of hematite pigment in case of its high concentration in oil-colophony varnish (at least 5% w/w when paint layer is exposed to air; at least 10% w/w when paint layer is covered by 20 µm of uncolored oil-colophony varnish)
Non-identification of hematite pigment in case of its low concentration in oil-colophony varnish (below 5% w/w when paint layer is exposed to air; below 10% w/w when paint layer is covered by 20 µm of uncolored oil-colophony varnish)
Identification of all the marker bands* of the silicate mineral in the ground in the following specific cases: (i) direct exposition of the ground to the air; (ii) presence of thin overlying uncolored varnish layer (verified up to 20 µm of thickness)
Assumption about the presence of silicate mineral in the ground from the detection of its lower-wavenumber bands when overlying multi-layered varnish coating is present
Non-detection of the marker band at 1015 cm−1 of the silicate mineral in the ground in presence of overlying multi-layered varnish coating
Non-discrimination of different concentrations of silicate mineral in the ground
Raman spectroscopy
Identification of all the marker bands * of the hematite pigment in case of its high concentration in oil-colophony varnish (at least 5% w/w when paint layer is exposed to air; at least 10% w/w when paint layer is covered by 20 µm of uncolored oil-colophony varnish)
Non-detection of the marker band at 608 cm−1 of the hematite pigment in case of its low concentration in oil-colophony varnish (below 5% w/w when paint layer is exposed to air; below 10% w/w when paint layer is covered by 20 µm of uncolored oil-colophony varnish)
Scattering intensity attenuation of hematite bands when paint layer is covered by 20 µm of uncolored oil-colophony varnish
Non-detection of organic components in layers with thicknesses up to ca. 50 µm (not explored beyond this value)
Non-detection of silicate mineral in the ground
XRF spectroscopy
Discrimination of different concentrations of silicate mineral and hematite pigment (concerning hematite, the minimum concentration value to distinguish paint layer from uncolored varnish is 2% w/w)
Non-detection of silicate mineral in the ground in presence of overlying paint layer containing hematite pigment in concentrations equal to or higher than 10% w/w
Scattering intensity attenuation of Fe signal when paint layer is covered by 20 µm of uncolored oil-colophony varnish
Indirect assumption about different amounts of proteinaceous binder in the ground (inversely proportional to the filler concentration)
* Marker bands referred to in the table are those identified in the text.
Table 3. Assignment of the KKT bands of the linseed-oil colophony varnish [67] at different aging times: t0 (dried), t1 (25 h), t2 (425 h). The spectral study was limited to the region not interested by artefacts, and the precise wavenumber values of the KKT band maxima derived from the second-derivative analysis. Abbreviation (sh) corresponds to shoulder bands.
Linseed Oil-Colophony Varnish
Assignment *Contributiont0t1t2
vas(CH3)oil, resin2960 (sh)2960 (sh)2960 (sh)
vas(CH2)oil, resin292729272935
vs(CH3)oil, resin2870 (sh)2870 (sh)2865
vs(CH2)oil, resin285328532850 (sh)
v(C=O)oil174117411735
v(C=O)resin1705-10 (sh)1705-10 (sh)1720 (sh)
δ(CH3/CH2)oil, resin146014601460
δs(CH2)–CH2–CO–O–oil141214121420
δ(CH3)oil, resin138213821382
v(C–O)oil, resin124012401240 (sh)
vas(C–O)
δ(CH), v(C–O)
oil
resin
117511751175
vas(O–CH2–C)
δ(CH), v(C–O)
oil
resin
110011001100
* v: stretching; δ: bending; as: asymmetric; s: symmetric.
Publisher’s Note: MDPI stays neutral with regard to jurisdictional claims in published maps and institutional affiliations.

